integrated surface and mechanical characterization of ...1621/fulltext.pdf · integrated surface...
TRANSCRIPT

Integrated Surface and Mechanical Characterization of
Freestanding Biological and Other Nano-Structures Using Atomic
Force Microscopy
A Dissertation Presented
by
Xin Wang
to
The Department of Mechanical and Industrial Engineering
in partial fulfillment of the requirements
for the degree of
Doctor of Philosophy
in
Mechanical Engineering
Northeastern University
Boston, Massachusetts
March 2013

NORTHEASTERN UNIVERSITY
Graduate School of Engineering
Dissertation Title: Integrated Surface and Mechanical Characterization of Freestanding
Biological and Other Nano-Structures Using Atomic Force Microscopy
Author: Xin Wang
Department: Mechanical and Industrial Engineering
Approved for Dissertation Requirement for the Doctor of Philosophy Degree
Dissertation Advisor: Prof. Kai-tak Wan Date
Dissertation Reader: Prof. Sinan Müftü Date
Dissertation Reader: Prof. April Z. Gu Date
Department Chair: Prof. Jacqueline Isaacs Date
Graduate School Notified of Acceptance:
Director of the Graduate School Date

i
ABSTRACT
This dissertation is focused on surface and mechanical characterization of freestanding
biological and other nano-structures using atomic force microscopy including two parts: cell
mechanics and nano-structure mechanics. The main purpose of this work is to investigate how
the nano- / micro-scale mechanical properties affect macro-scale function.
In cancer cells, efficacy of drug delivery is oftentimes declined due to the thick dendritic
network of oligosaccharide mucin chains on the cell surface. AFM is used to measure the force
needed to pierce the mucin layer to reach the cell surface. A pool of ovarian, pancreatic, lung,
colorectal and breast cancer cells are characterized. The studies offer additional support for the
development of clinical and pharmaceutical approaches to combat mucin over-expression in
tumors during cancer chemotherapy.
Macroscopic adhesion-aggregation and subsequent transportation of microorganisms in
porous medium are closely related to the microscopic deformation and adhesion mechanical
properties. The classical Tabor’s parameter is modified. Multiple bacterial strains are
characterized in terms of aggregates size, aggregation index and transportation kinetics. AFM is
employed to obtain the microscopic coupled adhesion-deformation properties. The strong
correlation between Tabor’s parameter and aggregation-deposition-transportation suggests the
AFM characterization is capable of making reliable predication of macroscopic behavior.
A novel “nano-cheese-cutter” is fabricated on tipless AFM cantilever to measure elastic
modulus and interfacial adhesion of a 1-D freestanding nano-structure. A single electrospun fiber
is attached to the free end of AFM cantilever, while another fiber is similarly prepared on a mica
substrate in an orthogonal direction. An external load is applied to deform the two fibers into

ii
complementary V-shapes. This work is extended to investigate the interfacial adhesion energy
between dissimilar materials.
SWCNT thin film promises a broad range of potential applications in electronic devices
due to unique electrical and mechanical properties. SWCNT thin film is transferred onto micro-
patterned SU-8 strips using wet contact print method, forming a freestanding nano-structure.
AFM with tipless cantilever is used to deform the suspended thin film under mixed bending and
stretching for mechanical and electromechanical characterization. The experiment helps to
construct the base for next generation flexible electronic devices with fundamental understanding
in morphology-property relation.

iii
ACKNOWLEDGEMENTS
This dissertation would not have been possible without the guidance and help of several
individuals who in one way or another contributed and extended their valuable assistance in the
preparation and completion of this study. I would like to give my sincere thanks to all of you.
I would like to express my deepest gratitude to my advisor, Prof. Kai-tak Wan, for his
inspirational guidance, constant patience and great encouragement. His illuminating instruction
and challenging questions lead me to make progress step by step. I am indebted to my committee
members Prof. Sinan Müftü and Prof. April Z. Gu for reading this dissertation and providing
many valuable comments that improved the presentation and contents.
I have had a lot of collaborators during doctoral study. I am deeply grateful to Prof.
Robert B. Campbell and his student Aalok A. Shah in Pharmaceutical Science at Northeastern
University and Massachusetts College of Pharmacy and Health Sciences for cancer cell culture
and mucin inhibition treatment, Ms. Yueyun Li, Dr. Annalisa Onnis-Hayden, Mr. Ce Gao from
Prof. April Z. Gu’s lab in Environmental Engineering at Northeastern University for microbial
macroscopic aggregation-transportation characterization, Prof. Shing-Chung Wong and Mr.
Johnny F. Najem in Mechanical Engineering at University of Akron for electrospun Nylon 6
fiber fabrication, Prof. Yung Joon Jung, Mr. Bo Li and Mr. Sanghyun Hong in Mechanical
Engineering at Northeastern University for suspended SWCNT thin film fabrication and
generously SWCNT forest providing.
I would like to give special thanks to previous the post-doctoral fellow in our lab, Dr.
Zong Zong, who gave me general guidance in performing research, and in particular shared
experimental tips. I also want to express my appreciation to my labmates Mr. Guangxu Li, Ms.

iv
Jiayi Shi, Mr. Michael Robitaille and Mr. David Chan for deep discussion in courses, research
and daily life.
Last, but not least, my deepest appreciation goes to my parents, Hongsheng Wang and
Zengjin Liu for their constant source of love, concern, support and strength all these years.
This work was funded by National Science Foundation (NSF CMMI-0757140) and
Department of Energy’s Environmental Remediation Science Program (DOE-ERSP Grant
#G00003461).

v
TABLE OF CONTENTS
1.1 Problem statements .............................................................................................................. 1
1.1.1 Cell mechanics .......................................................................................................... 1
1.1.2 Surface and mechanical properties of micro- / nano-structure ................................. 3
1.2 Background and literature review ........................................................................................ 6
1.2.1 Experimental tools for surface and mechanical characterization ............................. 6
1.2.2 Atomic force microscopy (AFM) ........................................................................... 14
1.2.3 Solid adhesion model .............................................................................................. 16
1.2.4 Cell mechanics ........................................................................................................ 22
1.2.5 Freestanding nano-structure .................................................................................... 25
1.3 Research objectives ............................................................................................................ 30
1.4 Organization of the dissertation ......................................................................................... 31
2.1 Introduction ........................................................................................................................ 35
2.2 Experiment ......................................................................................................................... 37
2.2.1 Sample preparation ................................................................................................. 37
2.2.2 AFM force measurement ........................................................................................ 38
2.3 Results ................................................................................................................................ 39
2.4 Data analysis and discussion .............................................................................................. 44
2.5 Conclusion ......................................................................................................................... 50
ABSTRACT .............................................................................................................. i
ACKNOWLEDGEMENTS .................................................................................. iii
TABLE OF CONTENTS ....................................................................................... v
LIST OF FIGURES ............................................................................................. viii
LIST OF TABLES ................................................................................................ xv
Chapter 1 Introduction ....................................................................................... 1
Chapter 2 Mechanical Characterization of the Glycoprotein Mucin on
Cancer Cells and its Correlation with Resistance Against Drug Delivery ...... 35

vi
3.1 Introduction ........................................................................................................................ 52
3.2 Methods and materials ....................................................................................................... 54
3.2.1 Sample preparation ................................................................................................. 55
3.2.2 Macroscopic aggregation: optical method .............................................................. 56
3.2.3 Microscopic characterization of single cell: AFM indentation ............................... 58
3.3 Results and analysis ........................................................................................................... 59
3.3.1 Macroscopic measurements of AI ........................................................................... 59
3.3.2 Microscopic: AFM measurements ......................................................................... 60
3.3.3 Tabor’s parameter ................................................................................................... 65
3.4 Discussion .......................................................................................................................... 68
3.5 Conclusion ......................................................................................................................... 70
4.1 Introduction ........................................................................................................................ 72
4.2 Methods and materials ....................................................................................................... 75
4.2.1 Bacterial strains culture........................................................................................... 75
4.2.2 Bacteria characterization and cell surface properties analysis ................................ 77
4.2.3 Flow-through packed bed column test .................................................................... 78
4.2.4 Atomic force microscopy ........................................................................................ 81
4.3 Results and analysis ........................................................................................................... 82
4.3.1 Cell surface properties characteristics .................................................................... 82
4.3.2 DLVO theory .......................................................................................................... 82
4.3.3 Bacterial packed-bed transportation behavior from column test ............................ 88
4.3.4 AFM indentation ..................................................................................................... 95
4.3.5 Tabor’s parameter as a predicator for microbial deposition behavior .................. 103
4.4 Discussion ........................................................................................................................ 104
4.5 Conclusion ....................................................................................................................... 105
5.1 Introduction ...................................................................................................................... 110
5.2 Methods and materials ..................................................................................................... 111
5.2.1 Electrospun nylon 6 fiber fabrication ................................................................... 111
Chapter 3 Correlation of Macroscopic Aggregation Behavior and
Microscopic Adhesion Properties of Bacteria Strains Using a Dimensionless
Tabor’s Parameter ................................................................................................ 52
Chapter 4 Extended Correlation for Single Bacterial Microscopic
Mechanical Properties and Macroscopic Deposition-Transportation Behavior
in Porous Medium Using Dimensionless Tabor’s Parameter ........................... 72
Chapter 5 A Nano-Cheese-Cutter to Directly Measure Interfacial Adhesion
of Freestanding Nano-Fibers ............................................................................. 110
vii
5.2.2 Fixture for nano-cheese-cutter .............................................................................. 112
5.2.3 Nano-cheese-cutter ............................................................................................... 113
5.3 Mechanical model ............................................................................................................ 116
5.3.1 Theoretical model for clamped fiber under central load ....................................... 116
5.3.2 “Pull-off” force and adhesion energy of adhering fibers ...................................... 121
5.4 Results and analysis ......................................................................................................... 122
5.5 Extension study for dissimilar material interaction ......................................................... 130
5.6 Discussion ........................................................................................................................ 143
5.7 Conclusion ....................................................................................................................... 144
6.1 Introduction ...................................................................................................................... 146
6.2 Methods and materials ..................................................................................................... 147
6.2.1 Suspended SWCNT thin film preparation ............................................................ 147
6.2.2 Surface characterization of SWCNT thin film...................................................... 151
6.2.3 Suspended SWCNT thin film mechanical characterization .................................. 151
6.2.4 Electromechanical experiment on suspended SWCNT thin film ......................... 153
6.3 Results and analysis ......................................................................................................... 156
6.3.1 SWCNT film topography ...................................................................................... 156
6.3.2 Mechanical characterization ................................................................................. 157
6.3.3 Electromechanical measurement on suspended SWCNT thin film ...................... 164
6.4 Discussion ........................................................................................................................ 173
6.5 Conclusion ....................................................................................................................... 174
7.1 Significant contributions and conclusions ....................................................................... 176
7.2 Future work ...................................................................................................................... 178
Chapter 6 Mechanical and Electromechanical Characterization of
Suspended SWCNT Thin Film on Patterned Polymer Substrate .................. 146
Chapter 7 Conclusion and Future Work ...................................................... 176
REFERENCES .................................................................................................... 180
VITA ..................................................................................................................... 191

viii
LIST OF FIGURES
Figure 1-1 Mechanics role in cell biology. (a) Normal red blood cell showing flexible and
concave disks shape, (b) Malaria parasites in blood cells increasing cells rigidity and
cytoadherence, (c) Sickle cell changing affected RBCs into a curved sickle [3], (d)
Interplay of physical and biochemical signals in the feedback of matrix stiffness on
contractility and cell signaling [4]. (e) Bacterial biofilm forming on substrate [5]. ..... 3
Figure 1-2 Adhesion between bodies of different size, compared to gravity [6]. .......................... 5
Figure 1-3 Adhesion in MEMS / NEMS. (a) Stiction of micro-structures built on SOI substrate
[9], (b) SEM of adhered RF-MEMS switch to substrate [10], (c) Stiction of micro-
cantilevers to substrate [10], (d) Schematic showing the binding of implanted
biomolecule layer with living tissue in biosensor [11]. ................................................ 5
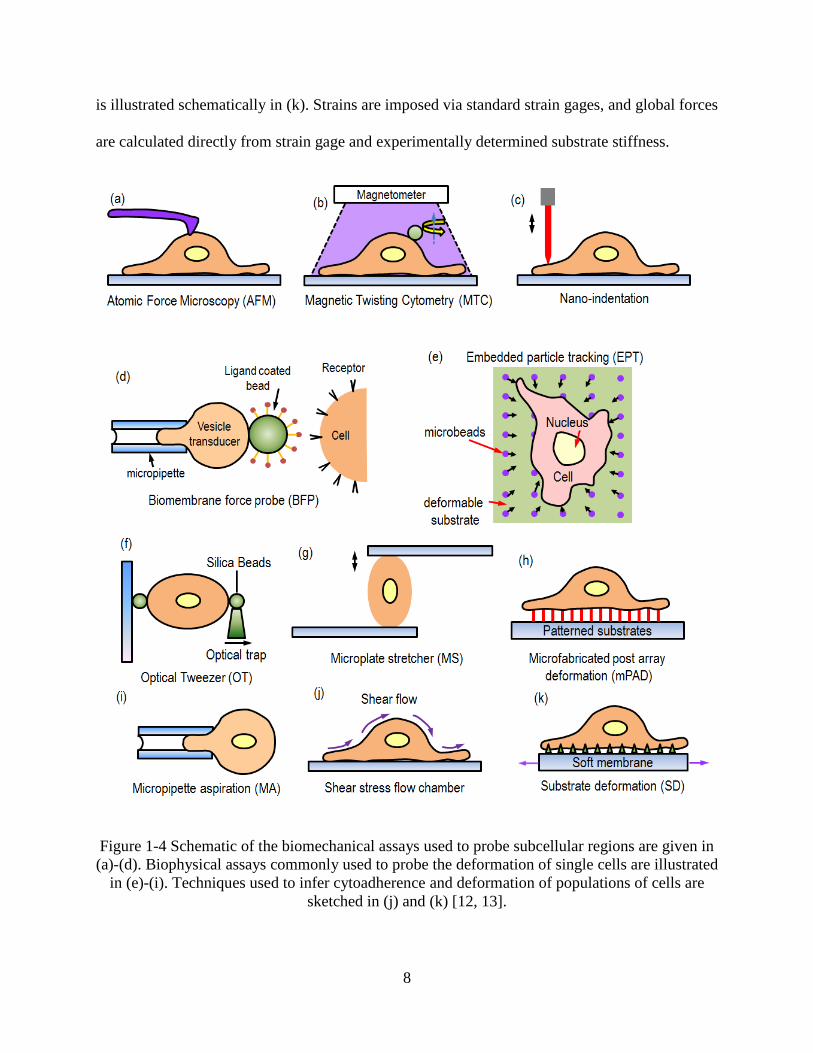
Figure 1-4 Schematic of the biomechanical assays used to probe subcellular regions are given in
(a)-(d). Biophysical assays commonly used to probe the deformation of single cells
are illustrated in (e)-(i). Techniques used to infer cytoadherence and deformation of
populations of cells are sketched in (j) and (k) [12, 13]. .............................................. 8
Figure 1-5 AFM used for nano-structure mechanical characterization. (a) A nanotube deflected
by AFM lateral force mode operation [15]. (b) A double-clamped nano-wire deflected
by AFM in the lateral force mode [16]. (c) AFM image of a SWCNT rope adhered to
the polished alumina ultrafiltration membrane, with a portion bridging a pore of the
membrane [17]. (d) A gold nano-wire stretched by AFM in force microscopy mode
[18]. ............................................................................................................................. 11
Figure 1-6 Nano-indentation used for nano-structure mechanical characterization. (a)
Experimental setup for membrane tensile experiment [20]. (b) SEM images
comparison of undeformed, deformed, and severely deformed Au pillars after nano-
indentation compression with flat punch. Slip lines are clearly present in the
deformed states [22]. ................................................................................................... 12
Figure 1-7 In-situ SEM and TEM mechanical testing. (a) SEM image of an individual MWCNT
mounted between two opposing AFM tips and stretched uniaxially. [23] (b) SEM
image of microstage showing the freestanding aluminum thin film specimen being
attached to the force sensor beam at one end and supporting beams at the other [24] (c)
Schematic of the nano-mechanical characterization device, in which the sample is
attached between the transducer and nano-manipulator probe tips [25]. .................... 13
Figure 1-8 Other methods used to quantify mechanical properties of freestanding nano-structures.
(a) Mechanical deflections of multi-walled carbon nanotubes inside TEM induced by
electrostatic fields [26]. (b) SEM image of nano-scale material testing system (n-MTS)
[27]. ............................................................................................................................. 14
Figure 1-9 Schematic of the AFM combined with an inverted optical microscope. .................... 16

ix
Figure 1-10 Solid adhesion models comparison. (a) Two elastic spheres making contact under
compressive force F, the deformation profile and pressure distribution predicted by (b)
Hertz model, (c) JKR model, (d) DMT model............................................................ 20
Figure 1-11 Equilibrium relation between contact radius and applied force in different adhesion
models. ........................................................................................................................ 21
Figure 1-12 Adhesion maps for solid elastic sphere [35]. ............................................................ 21
Figure 1-13 Applications of freestanding sensitive nano-structures. (a) SEM image of the
suspended graphene beam array used as prostate cancer sensor. Bottom image
showing schematic of immune reaction between PSA capture antibodies and target
protein PSA [77]. (b) A cross-sectional representation of a 60-nm-thick protein
membrane on a porous alumina support used for water filtration [78]. (c) SEM images
of suspended single tungsten nano-wire bridge as hydrogen sensor [79]. .................. 26
Figure 1-14 Schematic of electrospinning fabrication. ................................................................. 28
Figure 2-1 Side view SEM images of cancerous and normal cells [52]. ...................................... 36
Figure 2-2 Schematic of drug delivery through long chain molecular mucin layer to tumor cell.36
Figure 2-3 AFM combined with an inverted optical microscope experimental set-up. (a)
Schematic showing the combination system of AFM and inverted optical microscope
used in the force measurements on two sets of samples (natural and glycosylation
inhibited cancer cell). (b) Real picture of the combination system. (c) Optical
microscopy picture taken when triangular AFM cantilever with sharp tip doing
indentation on single cancer cell. ................................................................................ 39
Figure 2-4 Ten loading curves for each of natural and glycosylation inhibited breast ZR-75-1
cancer cells showing reproducibility. ......................................................................... 41
Figure 2-5 Typical mechanical response of natural and glycosylation inhibited breast ZR-75-1
cancer cells. (a) Loading curve, (b) Unloading curve. ................................................ 42
Figure 2-6 Typical mechanical response of natural and glycosylation inhibited (a) pancreatic
Capan-1, (b) and colorectal Colo-205 cancer cells. .................................................... 43
Figure 2-7 Representative compressive loading curves on natural and glycosylation inhibited
brain U87-MG cancer cells as control. ....................................................................... 44
Figure 2-8 Typical mechanical responses of six natural human mucinous carcinomas. The slope
and vertical axis intercept are used to calculate the equilibrium mucin layer thickness
and density. ................................................................................................................. 47
Figure 2-9 Curve fitting using de Gennes’ steric repulsion model for nature and glycosylation
inhibited ovarian SK-OV3 wide type cancer cells yielding equilibrium thickness of
the mucin layer, l, and the effective number density of mucin molecules on cell
surface, . .................................................................................................................... 48
Figure 2-10 Mechanical properties comparison for six different types of normal and
glycosylation inhibited cancer cells (*p<0.05). (a) Mechanical energy needed for
AFM tip to penetrate mucin layer, (b) Thickness of mucin layer, (c) Number density
of mucin. ..................................................................................................................... 50

x
Figure 3-1 Schematic of macroscopic aggregation index (AI) measurement. .............................. 57
Figure 3-2 (a) Typical fluorescent optical images. Top micrograph shows strain Q (Aeromonas
Punctata) aggregates along with the circular envelop (dashed curve) to define the
equivalent diameter (d ~ 8m). Bottom micrograph shows highly irregular strain H
(Bacillus Cereus) aggregate with d ~ 20m. (b) Aggregation size cumulative
frequency plot to estimate the aggregate nominal diameter of strain A. The equivalent
aggregate diameter is 4.9 ± 2.5 (51% error) m. ........................................................ 60
Figure 3-3 AFM topological scans. (a) Amplitude topological AFM scans of four aerobic strains
K, Q, A and H, showing the cigar shape cells and morphological details. (b) Cross-
section profiles of strain A. (c) 3-D topography AFM image of strain A. ................. 61
Figure 3-4 Typical mechanical response of representative strains measured by AFM indentation.
Loading is shown as dark curve and unloading gray. (a) Strain K. Loading follows
ABCD and unloading DCGH. Presence of CSS leads to repulsive barrier BC. Global
deformation of cell along CD shows full elastic recovery. (b) Strain Q. Penetration
energy barrier, Upen, is defined as the shaded area. An extrapolating tangent is defined
to exclude energy stored in form of elastic deformation during indentation of CSS. (c)
Strain A. The adhesion energy, Uad, is defined as the shaded area. ............................ 64
Figure 3-5 Linear correlation between Tabor’s parameter, , and aggregation index, AI, for the 7
bacteria strains in DI. Once is obtained by AFM, AI can be deduced from the fitted
curve. ........................................................................................................................... 68
Figure 4-1 Riverbank filtration to remove microbes and other contaminants by porous medium of
sand to improve water quality in a sustainable way. Process involves biodegradation,
precipitation, sorption, and dilution. ........................................................................... 75
Figure 4-2 Schematic of standard flow-through packed bed column test. ................................... 79
Figure 4-3 DLVO interaction energy. (a) Calculated DLVO interaction energy between SH1 and
silica sands as a function of separation distance, h, and ionic strength, IS. (b)
Magnified image of the above profile to highlight the secondary energy minimum for
some test conditions. ................................................................................................... 86
Figure 4-4 Representative breakthrough curve of strain Q in 3 mM KCl with 48-hour-growth
showing the deposition and transportation behavior in the flow-through packed sand
column......................................................................................................................... 92
Figure 4-5 Representative breakthrough curves of strain SH2, SH1, Des, Q, A and H in flow-
through packed sand column with ionic concentration of 3 mM................................ 93
Figure 4-6 Representative breakthrough curves of strain Q in packed sand column in electrolyte
with a wide range of ionic concentration (1 mM, 3 mM and 10 mM). ...................... 94
Figure 4-7 Representative breakthrough curves of strain Q using 3 different sampling times in
flow-through packed bed column with silica sand in 3 mM KCl electrolyte. ............ 95
Figure 4-8 Typical AFM force-displacement curve of strain Q in electrolyte solution with ionic
concentation of 3 mM. ................................................................................................ 99

xi
Figure 4-9 Amplitude topological AFM scans of strain Des in ambient air showing long cell
surface substance (CSS) on bacterial surface. ............................................................ 99
Figure 4-10 Curve fitting of loading curve for elastic modulus of strain A in electrolyte solution
with ionic strength of 3 mM based on classical Hertz-Sneddon model [125]. ......... 100
Figure 4-11 Unloading curve of strain SH2 in electrolyte solution with a wide range of ionic
concentations (1 mM, 3 mM and 10 mM) showing adhesion energy increase as ionic
strength rises. ............................................................................................................ 101
Figure 4-12 Mechanical properties changes as a function of ionic concentration (1 mM, 3 mM,
10 mM) in electrolyte for all strains studied (*p<0.05). ............................................ 102
Figure 4-13 Correlation between Tabor’s parameter, based on AFM force measurements and
attachment efficiency, from flow-through saturated packed sand column test. ... 106
Figure 4-14 Schematic of deformed cell and interfacial forces when approaching collector
surface in the porous medium. .................................................................................. 107
Figure 5-1 Scanning electron microscopy (SEM) images of (a) A nano-cheese-cutter at one end
of an AFM cantilever, (b) an overhanging freestanding fiber on mica substrate, (c)
Schematic of the contact between two nano-fibers arranged in a crossed-cylinder
geometry, and (d) In the presence of external tension, the nano-cheese-cutter (top)
deforms into V-shape and the overhanging (bottom) fiber an inverted V-shape. .... 115
Figure 5-2 SEM image of electrospun fiber surface. .................................................................. 115
Figure 5-3 Schematic of a freestanding fiber loaded at the midpoint for several central
displacements ( = 0, 7, 15, 20, 25). ......................................................................... 119
Figure 5-4 Theoretical force-displacement solution. (a) Normalized deformed profiles for fiber
tension = 0, 7, 20, and the stretching limit (dashed curve). Note that the
slope at x = 0 is always zero, but approaches a constant only in the limit when the
profile becomes linear. (b) The constitutive relation (0), and the bending and
stretching limits (dashed lines). Bending dominates at small 0, while stretching
prevails at large 0. (c) Gradient of the constitutive relation as a function of vertical
displacement, n(0). .................................................................................................. 120
Figure 5-5 AFM force measurement. (a) Typical force-displacement measurement showing paths
of loading (ABC) and unloading (CDGHJK). Here d1 = 109 ± 16 nm and 2l1 = 91 ±
4.8 m, and d2 = 580 ± 20 nm and 2l2 = 97 ± 5 m. (b) Force curve along path BC for
several sample fibers and curve fit. Only every other fifth data point is shown for
clarity. ....................................................................................................................... 124
Figure 5-6 (a) Force measurements of the same fiber on AFM cantilever (d1 = 109 ± 16 nm and
2l1 = 91 ± 5 m) adhering to fibers on mica with d2 and l2 indicated. (b) “Pull-off”
force as a function of mica fiber diameter. Circles are data from first fiber on AFM
(c.f. Figure 5-6a) and triangle from second fiber on AFM (c.f. Figure 5-7a). Dashed
curve shows the JKR-DMT transition prediction based on d1 = 109 ± 16 nm and
76 ± 7 mJ.m-2
. ........................................................................................................... 126

xii
Figure 5-7 (a) Loading-unloading cycles performed by fibers with d1 = 140 ± 13 nm and 2l1 =
42.73 ± 0.27 m, and d2 = 241 ± 36 nm and 2l2 = 36.66 ± 0.04 m. (b) “Pull-off”
force as a function of loading cycles. Adhesion energy deduced from F* measured in
the first 5 cycles is 58.8 ± 12.6 mJ.m-2
(dashed line). ......................................... 128
Figure 5-8 Scanning electron microscopy images of (a) SWCNT AFM cutter at free end of a
tipless cantilever, (b) Magnified suspended SWCNT bundle overhanging over two
micro-spheres on tipless AFM cantilever forming freestanding structure, (c)
Electrospun fiber AFM cutter at the free end of a tipless cantilever, (d) A
freestanding SWCNT bundle on mica substrate, (e) No.1 freestanding electrospun
fiber on mica substrate, (f) No. 2 freestanding electrospun fiber on mica substrate, (g)
Inverted optical microscopy image of SWCNT-efiber interaction taken during
SWCNT AFM cutter interacting with freestanding efiber on the mica substrate,
showing two crossed-cylinder geometries interacting in an orthogonal orientation. 135
Figure 5-9 Mechanical characterization of SWCNT bundle. (a) Five AFM force-displacement
measurements between two SWCNT bundles (d1 = 1250 ± 225 nm, 2l1 = 58.8 ± 2.5
m and d2 = 2839 ± 804 nm, 2l2 = 213.5 ± 4.2 m) interaction showing high
reproducibility. (b) Typical force-displacement measurement showing paths of
loading (ABCD) and unloading (DGHIJ). The interfacial adhesion energy between
two SWCNT bundles CNT-CNT 11.9 ± 1.5 mJ.m-2
in JKR-DMT transition regime. (c)
Force curve along path BCD for 5 measurements and curve fitting in log-log plot. 139
Figure 5-10 Typical force-displacement measurement between SWCNT bundle AFM cutter (d1 =
1250 ± 225 nm and 2l1 = 58.8 ± 2.5 m) and No. 1 freestanding electrospun fiber (d2
= 642 ± 178 nm and 2l2 = 180.9 ± 3.7 m) overhanging over two microspheres on
mica substrate. The interfacial adhesion energy of dissimilar material between
SWCNT bundle and electrospun fiber CNT-efiber 20.0 ± 9.2 mJ.m-2
in JKR-DMT
transition regime. ...................................................................................................... 140
Figure 5-11 Typical force-displacement measurement between SWCNT bundle AFM cutter (d1 =
1250 ± 225 nm and 2l1 = 58.8 ± 2.5 m) and No. 2 freestanding electrospun fiber (d2
= 560 ± 94 nm and 2l2 = 164.9 ± 1.9 m) overhanging over two microspheres on mica
substrate. The interfacial adhesion energy of dissimilar material between SWCNT
bundle and electrospun fiber is CNT-efiber 18.3 ± 4.6 mJ.m-2
in JKR-DMT transition
regime. ...................................................................................................................... 141
Figure 5-12 Typical force-displacement measurement between electrospun fiber AFM cutter (d1
= 206 ± 45 nm and 2l1 = 69.7 ± 3.1 m) and SWCNT bundle (d2 = 2839 ± 804 nm and
2l2 = 213.5 ± 4.2 m) overhanging over two microspheres on mica substrate. The
interfacial adhesion energy of dissimilar material between electrospun fiber and
SWCNT bundle is efiber-CNT 32.9 ± 6.9 mJ.m-2
in JKR-DMT transition regime. .. 142
Figure 6-1 Schematic of SWCNT assembly onto Si / SiO2 substrate for mechanical
characterization and electromechanical measurement. ............................................. 149

xiii
Figure 6-2 Schematic of the wet contact print method used to transfer SWCNT thin film from Si
/ SiO2 substrate to micro-patterned polymer SU-8 substrate [243]. ......................... 150
Figure 6-3 Suspended SWCNT thin film for mechanical characterization. (a) SEM image of Line
6_12 sample with gap distance of 6 m. (b) Inverted optical microscopy image of
tipless AFM cantilever compression suspended SWCNT thin film on Line 6_18
polymer substrate with gap distance of 12 m. ........................................................ 153
Figure 6-4 Suspended SWCNT thin film for electromechanical measurement. (a) Inverted optical
microscope image of suspended thin film connecting to Pd contact pad for electron
transportation. (b) Magnified inverted optical microscope image showing suspended
length, 2l, and width, b. (c) SEM image of the suspended SWCNT thin film. ........ 155
Figure 6-5 Tipless AFM cantilever used for electromechanical measurement. SEM image of (a)
Before FIB cutting. The red line indicates cutting position. (b) After FIB cutting. . 156
Figure 6-6 Electromechanical measurement on suspended SWCNT thin film overhanging over
two SU-8 strips. (a) Schematic of electromechanical measurement. (b) Inverted
optical microscope image showing modified tipless AFM cantilever deforming
suspended region. ...................................................................................................... 156
Figure 6-7 AFM scanning of SWCNT film on SU-8 strip for mechanical characterization. (a)
AFM topological scan. (b) Cross-section profile of SWCNT film. .......................... 157
Figure 6-8 Ten AFM force-displacement curves of SWCNT thin film suspended on strips with
gap distance of 3 m showing mechanical measurement reproducibility. ............... 160
Figure 6-9 Representative force-displacement curve of SWCNT thin film suspended on strips
with gap distance of 3 m showing loading curve (ABC) and unloading curve
(CDGH)..................................................................................................................... 161
Figure 6-10 Mechanical behavior comparison of SWCNT thin films suspended on SU-8 strips
with different gaps. ................................................................................................... 162
Figure 6-11 Curve fitting to the V-peel mechanical model to deduce the elastic modulus and the
average thickness of SWCNT thin films suspended on strips with different gaps. .. 163
Figure 6-12 Bar chart of the elastic modulus and the average thin film thickness for SWCNT thin
films suspended on SU-8 strips with three different gaps. ....................................... 164
Figure 6-13 6-min electromechanical measurement on suspended SWCNT thin film with width
of ~10 m. The AFM indentation duration time is 5.04s. (a) SWCNT thin film
electrical conductance, applied force and SWCNT thin film central deflection as a
function of time in 360s. (b) Magnified images from 116s to 122s showing electrical-
mechanical interaction. ............................................................................................. 168
Figure 6-14 6-min electromechanical measurement on suspended SWCNT thin film with width
of ~15 m. The AFM indentation duration time is 10s. (a) SWCNT thin film
electrical conductance, applied force and SWCNT thin film central deflection as a
function of time in 360s. (b) Magnified images from 119s to 125s showing electrical-
mechanical interaction. ............................................................................................. 170

xiv
Figure 6-15 6-min electromechanical measurement on suspended SWCNT thin film with width
of ~5 m. The AFM indentation duration time is 5.04s. (a) SWCNT thin film
electrical conductance, applied force and SWCNT thin film central deflection as a
function of time in 360s. (b) Magnified images from 117s to 121s showing electrical-
mechanical interaction. ............................................................................................. 172
Figure 6-16 Experimental result of electrical current through thin film versus mechanical
deformation for suspended SWCNT thin film with different widths. ...................... 173

xv
LIST OF TABLES
Table 2-1 Mechanical properties comparison of normal and glycosylation inhibited cancer cells.
..................................................................................................................................... 49
Table 3-1 Summary of bacterial materials and surface properties. .............................................. 71
Table 4-1 Cell surface characterization. ....................................................................................... 85
Table 4-2 -potential of sand collector [188]. .............................................................................. 85
Table 4-3 Depth and separation of secondary minimum and energy barrier for the total
interaction energy profiles between strains and silica sands in KCl electrolyte with a
wide range of ionic concentrations. ............................................................................ 87
Table 4-4 Summary of materials and surface properties. ........................................................... 108
Table 5-1 Fiber-fiber interaction mechanical properties summary. ............................................ 129
Table 5-2 AFM cutter and freestanding structure on mica substrate dimension summary. ....... 145
Table 5-3 Dissimilar material interaction mechanical adhesion property summary. ................. 145
Table 6-1 Mechanical characterization of suspended SWCNT thin film summary. .................. 175
Table 6-2 Suspended SWCNT film summary for electromechanical measurements. ................ 175
1
Chapter 1 Introduction
In 1959, American physicist and Nobel Laureate, Richard P. Feynman delivered the
classic lecture, “There is Plenty of Room at the Bottom,” where he described “a technological
vision of extreme miniaturization”. He then challenged scientists to manipulate and control
things on a small scale. In living organisms, the cell is the basic structural and functional unit,
which is often called the building block of the life. Mechanical properties of cells play a critical
role in their ability to withstand mechanical loading while performing their essential
physiological functions including migration, contraction, differentiation, and gene expression. A
profound impact of nano-science and nano-technology is envisioned in human lives and plays a
critical role in every aspect of modern society. Nano-materials, which are materials with basic
structural units, grains, particles, fibers or other constituent components smaller than 100 nm in
at least one dimension, have evoked much attention in scientific research. Freestanding nano-
structure is more suitable and sensitive for exploring the interplay between electronic,
mechanical, thermal and biological properties without the interaction with the substrate. This
dissertation aims to characterize surface and mechanical properties of biological and freestanding
nano-structures using atomic force microscopy. This will allow the investigation of their
fundamental micro- / nano-scale mechanical properties impact on macro-scale function.
1.1 Problem statements
1.1.1 Cell mechanics
Cells of an organism are regularly subjected to a complex of mechanical forces varying in
forms. In mechanotransduction, physical force is applied to cell surface and distorts the
membrane cortex, which activates mechanosensitive ion channels. During this process, cell
2
membrane elasticity and viscoelasticity properties play a central role [1]. Aged cells lose the
ability to rapidly rearrange their cytoskeletons and decrease capability to undergo reversible
large deformations, which is largely due to the increase in cell stiffness [2]. Mechanical
properties can also be related to the health, e.g. normal and sick cells change in different ways
during their physiological functions (activation, adhesion to a substratum, motion, phagocytosis
and etc.). Healthy red blood cells (RBCs) (Figure 1-1a) are highly deformable in order to
transport oxygen to various parts of the body by squeezing their way through narrow capillaries.
But malaria (Figure 1-1b) adversely affects RBCs by raising rigidity and cytoadherence, which
not only causes serious impairment of blood flow but can also cause severe anemia, coma or
even death. Sickle cell anemia (Figure 1-1c) is a hereditary blood disorder that gives rise to
blood circulatory problems caused by an alteration in the molecular structure of hemoglobin. It
changes the shape of affected RBCs into a curved sickle, making it more rigid and more prone to
be stuck in capillaries [3]. Mechanical properties of the environment can also affect living cells’
biofunctions, e.g. undifferentiated embryonic stem cells cultured on variable stiffness substrate
can sense mechanical field of the environment and differentiate into various cells with different
elasticity [4] (Figure 1-1d). Even for bacteria, cell mechanical behavior is recognized as a key
factor of normal cell function. Biofilm (Figure 1-1e) is a complex aggregation of microorganisms
growing on a solid substrate. Biofilms occur in a range of everyday situations, from pipe and
ship fouling to dental caries. Generally, biofilms grow in a three stage process [5]: (1) attachment,
where bacteria float around and then attach to communicate with one another; (2) colonization,
where bacteria grow, divide and lead to the colonization of the surrounding area; (3) growth,
where biofilm grows quickly. Extracellular polymeric substances (EPS) produced by
microorganisms play a key role in biofilm matrix formation by mediating initial microbial

3
attachment to different substrata, protecting against environmental stress and dehydration,
making up the microbial intercellular space of microbial aggregation and finally forming biofilm
matrix structure and architecture. The length, density and stiffness of EPS are important in this
process. Moreover, cell membrane stiffness and cell-substrate / cell-cell adhesion are also critical
for biofilm formation. Therefore, mechanical characterization of single living cell is significant
in understanding cell function.
Figure 1-1 Mechanics role in cell biology. (a) Normal red blood cell showing flexible and
concave disks shape, (b) Malaria parasites in blood cells increasing cells rigidity and
cytoadherence, (c) Sickle cell changing affected RBCs into a curved sickle [3], (d) Interplay of
physical and biochemical signals in the feedback of matrix stiffness on contractility and cell
signaling [4]. (e) Bacterial biofilm forming on substrate [5].
1.1.2 Surface and mechanical properties of micro- / nano-structure
Owing to larger surface area in micro- / nano-structure, forces that influence micro- /
nano scale devices are quite different from those that influence devices with conventional scale.

4
This is because the size of the whole system bears a significant influence on the physical
phenomena. The most challenging issues lie in the fact that the surface-to-volume ratio increases
when the whole system dimensions decrease. Larger-scale systems are influenced by inertia
effects to a much greater extent than smaller-scale systems, while smaller systems are more
influenced by surface effects. When the length of the machine decreases from 1 mm to 1 µm,
the area decreases by a factor of a million and the volume decreases by a factor of a billion.
Figure 1-2 compares the magnitude of gravitation and adhesion forces as a function of size [6].
As a result, surface forces such as adhesion, friction, meniscus forces, viscous drag forces and
surface tension that are proportional to area, become a thousand times larger than the forces
proportional to the volume. Surface forces are major problems limiting both the fabrication and
operation lifetime of many devices, e.g. MEMS / NEMS (Micro / Nano Electromechanical
Systems) [7, 8]. Stiction is a term that has been applied to the unintentional adhesion of
compliant micro-structure when restoring forces are unable to overcome interfacial forces.
Figure 1-3a illustrates micro-structures stiction onto SOI (silicon-on-insulator) substrate, which
is induced by interaction between micro-structure and substrate [9]. Figure 1-3b shows the
adhesion of an RF-MEMS (radio frequency microelectromechanical system) switch to substrate
[10]. Figure 1-3c shows the stiction of micro-cantilevers to the substrate indicating adhesion can
lead to fundamental catastrophic failure and should deserve a great deal of study [10]. Figure
1-3d shows a BioMEMS / BioNEMS biosensor which can sense the binding of external living
tissue with implanted biomolecule layer by monitoring the change in the electrical conductance.
Adhesion between biological molecular layer and the substrate would affect the reliability of the
biosensor [11]. In conclusion, there are urgent needs to fundamentally understand micro- / nano-
structure surface and mechanical properties before wide industrial application.

5
Figure 1-2 Adhesion between bodies of different size, compared to gravity [6].
Figure 1-3 Adhesion in MEMS / NEMS. (a) Stiction of micro-structures built on SOI substrate
[9], (b) SEM of adhered RF-MEMS switch to substrate [10], (c) Stiction of micro-cantilevers to
substrate [10], (d) Schematic showing the binding of implanted biomolecule layer with living
tissue in biosensor [11].

6
1.2 Background and literature review
1.2.1 Experimental tools for surface and mechanical characterization
1.2.1.1 Biomechanical experimental tools
A wide variety of experimental biomechanical methods have been used to extract the
mechanical properties of cells [12, 13]. Figure 1-4, (a)-(d) show four techniques: atomic force
microscopy (AFM), magnetic twisting cytometry (MTC), nano-indentation and biomembrane
force probe (BFP). In these four methods, a portion of the cell surface could be mechanically
probed with forces on the order of 10-12
-10-6
N and displacements less than 1 nm. In AFM, local
deformation is induced on a cell surface through physical contact with a sharp tip at the free end
of a cantilever. MTC entails the attachment of magnetic beads to functionalize surfaces. A
segment of the cell surface is deformed by the twisting moment that arises from external
magnetic field. Nano-indentation is increasingly being used to probe the mechanical response of
biological materials using a small specific tip. In the biomembrane force probe (BFP), a cell or
lipid vesicle is partially aspirated in a micropipette and then serves as the force transducer. As
shown in Figure 1-4d, ligand coated beads are attached to this pressurized capsule and positioned
to interact with a receptor of interest that is adhered to a nearby substrate. Deformation of the
capsule is measured optically, and force maxima are controlled by the surface tension imposed
on this capsule.
Figure 1-4 (e)-(i) shows embedded particle tracking (EPT), optical tweezers (OT),
microplate stretcher (MS), microfabricated post array deformation (mPAD) and micropipette
aspiration (MA). The forces over the range of 10-12
-10-7
N can be induced on the whole cell
while submicrometer displacements are monitored optically. By embedding micro-scale beads

7
within a polymeric substrate, traction forces exerted by adherent cells can be measured at many
points of cell-surface contact. With OT, a laser beam is aimed at a high refractive index to the
dielectric bead attached to the cell. The resulting attractive force between the bead and the laser
beam pulls the bead towards the focal point of the laser trap. Two beads specifically attached to
diametrically opposite ends of a cell could be trapped by two laser beams, thereby inducing
relative displacements between them, and uniaxially stretching the cell to forces of up to several
hundred piconewtons. In the microplate stretcher, force- or displacement-controlled extensional
or shear deformation is induced between two functionalized glass plates to the surfaces on which
a cell is specifically attached. In mPAD, a patterned substrate of microfabricated, flexible
cantilevers is created and a cell is specifically tethered to the surfaces of these micro-posts.
Deflection of these tiny cantilevers due to focal adhesions can be used to calibrate the adhesion
force. In MA, a portion of a cell or the whole cell is aspirated through a micropipette by applying
suction. Geometric changes along with appropriate analysis provide the elastic / viscoelastic
responses of the cell and the adhesion force of cell-cell and cell-substrate.
Figure 1-4 (j) and (k) illustrate shear stress flow chamber and substrate deformation (SD)
with which to characterize mechanical response or mechanical manipulation of entire cell
populations. (j) shows a method from which the cytoadherence mechanical properties of
populations of cells could be extracted by monitoring the shear resistance of cells to fluid flow.
Shear flow experiments involving laminar or turbulent flows are commonly performed using a
cone-and-plate viscometer consisting of a stationary flat plate and a rotating inverted cone. The
mechanics of cell spreading, deformation and migration in response to direct manipulation of
compliant polymeric substrates on which the cells are attached through focal adhesion complexes
8
is illustrated schematically in (k). Strains are imposed via standard strain gages, and global forces
are calculated directly from strain gage and experimentally determined substrate stiffness.
Figure 1-4 Schematic of the biomechanical assays used to probe subcellular regions are given in
(a)-(d). Biophysical assays commonly used to probe the deformation of single cells are illustrated
in (e)-(i). Techniques used to infer cytoadherence and deformation of populations of cells are
sketched in (j) and (k) [12, 13].

9
1.2.1.2 Mechanical characterization methods for freestanding nano-structure
New materials and nano-structures with superior electromechanical properties are
emerging in the development of novel devices. Efficiency in engineering applications of these
materials and nano-structures requires accurate mechanical characterization. This can be done by
development of novel experimental techniques. Property measurements of nano-structures are
extremely challenging because of their miniscule size. The main challenges in the experimental
study of nano-structures include [14]: (1) manufacturing, manipulation and positioning of
specimens with nanometer accuracy; (2) application and measurement of forces in the nano-
Newton level, and (3) measurement of mechanical deformation with nanometer resolution. With
advances in scanning probe and electron microscopies, two distinct types of experimental
techniques, nano-indentation / AFM and in-situ electron microscopy testing, are commonly used
for mechanical characterization on nano-structures.
1) Nano-indentation and AFM
Nano-indentation and AFM make use of commercially available instruments to apply
load and measure deformation simultaneously. AFM is used to bend individual, structurally
isolated silicon carbide (SiC) nanorods and nanotubes that are pinned at one end to molybdenum
disulfide surfaces laterally in Figure 1-5a. From the measured load-deflection, the elastic
modulus, strength and toughness are obtained based on continuum mechanics [15]. It is
straightforward to implement but cannot eliminate the effect of adhesion and friction from
substrate. Figure 1-5b shows random dispersed of gold nanowires around the trench which is
fabricated by FIB (focused-ion-beam) milling and then is clamped by EBID (electron beam
induced deposition) of platinum or other materials. AFM is used to bend the double-clamped
nano-structure laterally [16]. Figure 1-5c shows individual SWCNT rope randomly dispersed on

10
an alumina ultrafiltration membrane with 200 nm pores [17]. AFM is used to apply a load to the
suspended nano-beam for elastic and shear moduli measurements. AFM is also employed to a
tensile testing configuration. One end of the specimen is attached to the AFM tip and the other
end to a substrate. This technique is applied to measure the quantized plastic deformation of gold
nano-wires [18]. Figure 1-5d depicts an AFM cantilever coated with gold making contact with a
gold nano-wire. A piezoelectric positioner moves the nano-wire, which results in cantilever
deflection. During compression or extension cycles, the change in length of the nano-wire is
determined as the difference between piezo motion and cantilever deflection, from which to
deduce nano-wire mechanical properties.
A nano-indenter is an instrument that continuously monitors contact load and position.
Using feedback control and independent sensing of load and displacement, both load and
displacement controlled experiments can be performed. A Hysitron Troboscope nano-indenter in
conjunction with a Veeco Dimension 3100 AFM is used to perform imaging and nano-
indentation tests on 1-D silver nano-wire. The nano-wire is simply dispersed on the substrate and
an array of nano-scale indents are successfully made on the wire by direct indentation [19]. It is
also extended to perform thin film tension shown in Figure 1-6a. A line-load at the center of the
span is applied to suspended membrane. Simultaneously, an interferometer focused on the
bottom side of the membrane records deflection and local deformation [20]. This testing
methodology is recently extended to study fracture toughness of freestanding thin film [21]. The
nano-indenter is also employed in the compression testing of gold micro-pillars shown in Figure
1-6b. Freestanding Au cylinders are created from a bulk single crystal using FIB. Using
displacement-controlled nano-indentation with a flat punch, pillars of various size are loaded in

11
compression and deformed plastically well into the finite deformation regime [22], from which
compressive stress, strain and stiffness of pillars are determined.
Figure 1-5 AFM used for nano-structure mechanical characterization. (a) A nanotube deflected
by AFM lateral force mode operation [15]. (b) A double-clamped nano-wire deflected by AFM
in the lateral force mode [16]. (c) AFM image of a SWCNT rope adhered to the polished alumina
ultrafiltration membrane, with a portion bridging a pore of the membrane [17]. (d) A gold nano-
wire stretched by AFM in force microscopy mode [18].

12
Figure 1-6 Nano-indentation used for nano-structure mechanical characterization. (a)
Experimental setup for membrane tensile experiment [20]. (b) SEM images comparison of
undeformed, deformed, and severely deformed Au pillars after nano-indentation compression
with flat punch. Slip lines are clearly present in the deformed states [22].
2) In-situ scanning (SEM) and transmission electron microscopy (TEM) testing
In-situ SEM and TEM testing allows the usage of high magnification and even real time
failure observation in some instances. Figure 1-7a is tensile testing of multi walled-carbon
nanotubes (MWCNTs) with a “nano-stressing stage” located within SEM [23]. An individual
nanotube is clamped to two AFM tips by electron beam induced deposition (EBID) inside the
SEM chamber. A relatively stiff cantilever, connected to one of the piezo actuators, is used to
deform the sample while the force is calculated based on the deflection of a soft cantilever.
Figure 1-7b shows another new frame with force and displacement measurement capabilities in
both SEM and TEM for in-situ quantitative tensile experimentation on nano-scale specimens
[24]. In this configuration, load is applied by external piezo-actuators and monitored by means of
beam deflection. Stress-strain responses of several nano-scale freestanding aluminum and gold
films subjected to loading and unloading cycles are measured. Figure 1-7c shows an in-situ
nano-tensilometer that enables highly reliable mechanical tensile testing on individual
freestanding micro-/nano-structures within a high resolution SEM. This permits continuous high-
resolution imaging of the specimen during straining [25]. The device is composed of two main

13
parts: a three-plate capacitive transducer that serves as both actuator and force sensor, and a
commercially available nano-manipulator that facilitates transportation and positioning of nano-
scale structures with sub-nanometer precision. Before conducting mechanical test, the ends of the
specimen are attached to the probe tips of the device using ion-beam induced deposition.
Figure 1-7 In-situ SEM and TEM mechanical testing. (a) SEM image of an individual MWCNT
mounted between two opposing AFM tips and stretched uniaxially. [23] (b) SEM image of
microstage showing the freestanding aluminum thin film specimen being attached to the force
sensor beam at one end and supporting beams at the other [24] (c) Schematic of the nano-
mechanical characterization device, in which the sample is attached between the transducer and
nano-manipulator probe tips [25].
3) The other mechanical measurements
Static and dynamic mechanical deflections of cantilevered multi-walled carbon nanotubes
inside TEM are electrically induced by means of electrostatic fields [26]. The nanotubes are
resonantly excited at the fundamental frequency and higher harmonics as revealed by their
deflected contours in Figure 1-8a, which correspond closely to those determined for elastic
cantilever. Figure 1-8b shows MEMS-based nano-scale material testing system (n-MTS) for in-

14
situ AFM / SEM / TEM testing of various nano-structures [27]. The unique feature of this
implemented n-MTS is that it incorporates a capacitive sensor to independently measure applied
load, while continuously observing specimen deformation and failure at high magnifications.
Figure 1-8 Other methods used to quantify mechanical properties of freestanding nano-structures.
(a) Mechanical deflections of multi-walled carbon nanotubes inside TEM induced by
electrostatic fields [26]. (b) SEM image of nano-scale material testing system (n-MTS) [27].
Although there are many devices for micro- / nano-structure mechanical characterization
as stated above, AFM is used as the main tool to measure both biological and freestanding nano-
structure surface and mechanical properties.
1.2.2 Atomic force microscopy (AFM)
In the past decades, numerous electron microscopy techniques have been developed for
studying structures on the micro-/nano-scale, such as transmission electron microscopy (TEM),
scanning electron microscopy (SEM) and reflection electron microscopy (REM). AFM has
several advantages over them. Unlike the electron microscopy that provides a two-dimensional
projection or a two-dimensional image of a sample, AFM provides a three-dimensional surface
profile. In addition, samples viewed by AFM do not require any special treatments (e.g. metal /
carbon coatings) that irreversibly change or damage the samples of interest, and does not

15
typically suffer from charging artifacts in the final image. While electron microscopy needs
vacuum environment for proper operation, most AFM modes work well in ambient air and even
liquid. Along with sub-nanometer resolution imaging, an AFM is capable of mechanical
measurements with high spatial (Å) and force resolution (pN). Moreover, when combined with
electron microscope (EM) or optical microscope (OM), more powerful materials evaluation
strategies are possible to provide both imaging and force measurement.
AFM consists of a cantilever, a piezo scanner, four position-sensitive photodetector, a
laser diode and a feedback control [28]. The basic principle of AFM is to scan a surface with a
sharp tip mounted at the free end of cantilever (Figure 1-9). Cantilever is typically silicon or
silicon nitride with a tip radius of curvature on the order of nanometers. When the tip is brought
into proximity of a sample surface, force between the tip and the sample leads to a deflection of
the cantilever. Typically, the deflection is measured using a laser spot reflected from the top
surface of the cantilever into the quadrants of the photodetector. The interactions cause the
cantilever to deflect, thereby changing the position of the laser on the photodetector. A
topographic image of the sample is obtained by plotting the deflection of the cantilever versus its
position on the sample. AFM can be operated in a variety of imaging modes. There are two main
operation modes: a) Contact mode: the AFM tip is brought into gentle contact with the sample
and then scanned in a raster fashion across the sample surface. b) Tapping mode or Alternating
Current (AC) mode in Agilent 5500 system: a sinusoidal voltage is applied to a piezo element
(Acoustic Alternating Current, AAC) or magnetic coil in the nose assembly or sample plate
(Magnetic Alternating Current, MAC). The piezo or magnetic coil causes the probe tip to
oscillate near its resonant frequency using a piezoelectric actuator, such that it taps gently on the
surface. Moving the oscillating tip until it lightly touches the surface and reduces the oscillation

16
amplitude. Reduction in oscillation amplitude now becomes the feedback control signal, and is
used to measure the surface topography. On transparent sample, force measurements can be
performed using the combination system of AFM sitting on an inverted optical microscope. The
system allows precisely laterally positioning of the AFM tip over the target sample.
Figure 1-9 Schematic of the AFM combined with an inverted optical microscope.
1.2.3 Solid adhesion model
1.2.3.1 Hertz model
Continuum models that predict the contact area for various geometries have a long
history, dating back to the pioneering work of Hertz [29]. Based on the hypotheses, (1) the ratio
of contact radius to spherical equivalent radius, a/R, is small; (2) no friction occurs at the
interface; (3) no tensile stress exists in area of contact (unilateral contact), Hertz model
demonstrates that the radius of the circle of contact a, displacement of the two sphere centers ,

17
and the radial profile y are related to the applied load F, the spherical equivalent radius R, and the
elastic properties E by [30]:
K
FRa 3
3/1
2
22
)(RK
F
R
a
1]1
cos)2(1[ 1222
xx
xxR
ay
Eqn (1-1)
with K the equivalent elastic modulus of two contacting spheres, given by:
)11
(4
31
2
2
2
1
2
1
EEK
Eqn (1-2)
and x = r/a. Ei and iare the elastic modulus and Poisson’s ratio, separately, and subscripts 1 and
2 denote the two spheres. If the contacting bodies are spheres with radii R1 and R2 (Figure 1-10a),
the R in the above equation is the equivalent radius given by R = R1.R2 / (R1+R2). The
deformation profile and “parabolic” pressure distribution are shown in Figure 1-10b. Hertz
relation between the applied force and contact radius is given in Figure 1-11. However,
interfacial force becomes significant at small scales [10]. Adhesion arising from attractive
surface forces is generally significant and must be included in contact mechanics.
1.2.3.2 JKR adhesion model
To incorporate the effect of adhesion in Hertz contact, Johnson, Kendall, and Roberts
[31] formulated the JKR theory of adhesive contact using a balance between potential energy of
external load, stored elastic energy and surface energy. The JKR model considers the adhesion
only inside the contact area. The deformation profile and pressure distribution are shown in
Figure 1-10c. Relation between the applied force and contact radius is given in Figure 1-11. The

18
“pseudo-parabolic” neck forms at the contact circle because of stress singularity. The mechanics
is described by the following set of equations:
))...3(....6...3( 23 RFRRFK
Ra
).2
1(.6 1
2
F
F
R
a
1]1tan))(3
42(1[
..2
212
3
0222
xxa
axx
R
ay
Eqn (1-3)
with 2
1 )...3(....6...3 RFRRFF and 3 2
0 /...12 KRa . is the interfacial
adhesion energy. At zero applied force, the contact area is finite and given by a = 6...R2/K.
“Pull-off” force occurs at F = -1.5...R.
1.2.3.3 DMT adhesion model
The Derjaguin-Muller-Toporov (DMT) model is an alternative model for adhesive
contact which assumes that the contact profile remains the same as in Hertz contact but with
additional attractive interactions outside the area of contact. Similar to JKR adhesion model,
contact radius is nonzero even the applied force is removed. “Pull-off” force to reduce contact
radius to zero is F = -2...R. The deformation profile and pressure distribution are shown in
Figure 1-10d. DMT relation between the applied force and contact radius is given in Figure 1-11.
The mechanics is described by the following set of equations:
)...2(3 RFK
Ra
R
a
2
2
1]1tan)2(1[..2
21222
xxxxR
ay
Eqn (1-4)

19
1.2.3.4 Tabor’s parameter
The stress distribution, “pull-off” force and contact geometry predicted by JKR and DMT
are inconsistent, triggering a long dispute between JKR and DMT. Tabor [32] compared both
theories and pointed out that the main error in the DMT theory is the neglect of the deformation
due to attractive forces around the contact, whereas that JKR theory neglects adhesion force
outside the contact. Tabor proposed that the continuous transition bridging the two theories
governed by a single parameter 3/13
0
2*2 )/( ZER , where Z0 1 nm is the force range of
typical van der Waals interaction, E*
is the effective elastic modulus defined as E*
= 1/{(1-
12)/E1+(1-2
2)/E2}, Ei and vi are the elastic modulus and Poisson’s ratio of two contacting
objects. The DMT theory applies for << 1 (hard solids, small curvature radius and low
adhesion energy), and JKR for >> 1 (soft solids, large radius, high adhesion energy). The two
limiting cases do not depend on the exact form of intersurface potentials. Maugis [33] later
adopted the Dugdule-Barenblatt cohesive zone approximation to model finite range and
magnitude of interfacial forces, and derived the transition from JKR to DMT limits shown in
Figure 1-12. The relation for JKR-DMT transition between the applied force and contact radius
is given in Figure 1-11. is the transition parameter defined as = 1.157 μ. If > 5, JKR applies,
and if DMT is dominant. Values between 0.1 and 5 correspond to the “transition regime”
[34]. Two basic equations for JKR-DMT transition are,
1]1)1
(cos1[3
4)]
1(cos)2(1[
2
122
122
2
m
mm
a
mmm
a
)
1(cos1 12223
mmmaaF
Eqn (1-5)
with F and a the dimensionless parameters of F and a giving by,

20
RFF / and 3/12 )//( KRaa
Eqn (1-6)
the parameter m is the ratio of an outer radius c of cohesive zone to the contact radius a (m=c/a).
Figure 1-10 Solid adhesion models comparison. (a) Two elastic spheres making contact under
compressive force F, the deformation profile and pressure distribution predicted by (b) Hertz
model, (c) JKR model, (d) DMT model.

21
Figure 1-11 Equilibrium relation between contact radius and applied force in different adhesion
models.
Figure 1-12 Adhesion maps for solid elastic sphere [35].

22
1.2.4 Cell mechanics
1.2.4.1 Cancer cell research
Cancer has long been one of leading causes of death. The difference in terms of cell
growth, morphology, cell-cell interaction, organization of the cytoskeleton and interactions with
extracellular matrix [36-38] causes cancer cells to have mechanical properties different from
normal cells. This may potentially serve as a useful biomarker in the early detection of cancer
and for anti-cancer drug efficacy tests [3]. Investigating the mechanical properties of cancer cells
helps to better understand the physical mechanisms responsible for cancer metastasis. With the
recent advances in biomechanics and nanotechnology, it has now become possible to probe
mechanical influences acting on biological structures not only as small as cells but also
molecules. Biophysical tools and techniques such as AFM [39, 40], micropipette aspiration [41],
and the optical tweezers [42, 43] are used to probe the mechanical property of different types of
cells. Cross applies AFM to investigate the mechanical properties of in-vitro cancer cells
obtained from patients [44]. Lekka studies the elasticity of normal (Hu609 and HCV29) and
cancerous (Hu456, T24, and BC3726) human bladder epithelial cells by AFM indentation [45].
Normal cells are found to be an order of magnitude stiffer than cancer cells attributed to
cytoskeleton reorganization. Optical tweezers is also used to investigate the deformability of
non-malignant and malignant human breast epithelial cells, from which malignant cells are found
to stretch about five times more than their non-malignant counterparts [42, 43]. Li finds
malignant (MCF-7) breast cells having significant lower elastic modulus than that of non-
malignant (MCF-10A) counterparts at physiological temperature and their elastic moduli
increase with loading rate [46]. The sub-membrane actin organization directly contributes to
difference in cell elasticity based on confocal and AFM images.

23
Surface properties of cancerous cells are also quite different from those of normal cells.
Mucins, which are heavily glycosylated with complex oligosaccharides, establish a selective
molecular barrier at the epithelial surface and engage in morphogenetic signal transduction [47].
From a mechanical perspective, AFM studies of ocular mucin show individual fibers with a
broad distribution of contour lengths [1]. While most of the fibers are between 200-600 nm long,
the tail of the distribution extended to 1500 nm. Persistence length is also estimated to be about
36 nm based on these images. In another AFM study of ocular mucin, Brayshaw et al.
demonstrates the multimeric nature of mucin by observing in-situ depolymerization on treatment
with DTT (dithiothreitol) [48]. Longer fibers, up to 2 m in length are observed in purified pig
gastric mucin (PGM) [49]. McMaster et al. examines ocular mucin using AFM in tapping mode
under a buffer and observes regular variations in height along the length of the fiber which they
interpret as glycosylated regions of the mucin molecules [50]. Round et al. correlates the
conformations with differing amounts of glycosylation by imaging different fractions obtained
on a CsCl gradient [51]. Iyer et al. uses AFM to detect differences in the surface brush between
normal and cancerous cells and finds the normal cells only have brushes of one length, whereas
cancerous cells have mostly two brush lengths with significant difference in densities [52].
1.2.4.2 Microbial research
In recent years, the interest in microbial adhesion has grown rapidly, since
microorganisms have a strong tendency to adhere to surfaces. Once they adhere, they constitute a
complex, adhering microbial community called biofilm [53]. The importance of these microbial
communities is twofold: (i) the presence of biofilms poses serious problems, for instance on food,
on ship hulls, on old fashion portraits, on historical monuments and in the oral cavity; (ii)
biofilms serve beneficial purposes in natural environment as well as some modulated or

24
engineered biological systems, for example in the process of degradation and removal of
hazardous substances in soil and natural streams, or in a bioreactor or as bioflocculants in
wastewater treatment plants [54].
Various macroscopic approaches have been developed towards the goal of quantifying
the overall properties of microbial cells. Traditional methods used for bacterial study in the areas
of attachment and morphology include cell counting, bacterial labeling, light microscopy
analysis, flow chamber and quantifying cells removed from the surfaces [55]. These methods
tend to be qualitative in nature and are often limited by the resolution of standard optical
microscopy. AFM has emerged in recent years due to its inherent advantages of relatively simple
sample preparation, higher resolution cell imaging in both air and liquid, and precise force
measurements to provide unique insights into the cell attachment-detachment led by long-range
interactions. For surface morphology AFM imaging, there are several reports presenting images
of microbial cells obtained after glutaraldehyde and drying pretreatment [56-58] or by attaching
to polyethylenimine coated substrates [59], porous polymer membranes [60] and gelatin coated
mica surface [61] under natural hydrated conditions. Several studies demonstrate the
combination system of AFM with optical microscopy can provide a more comprehensive view of
cell surfaces [62]. Real-time imaging offers new opportunities to probe dynamic events such as
cell wall remodeling [63] and drug influence [64]. AFM imaging can be extended to biofilm and
extracellular polymer substances (EPS) visualization [65, 66]. AFM is also a powerful tool for
force spectroscopy. Adhesion maps record across the surface of individual spores of
Phanerochaete chrysosporium, revealing localized sticky areas that are correlated with
morphological variations and thought to promote cell-cell interactions [67]. Ahimou uses
functionalized AFM probes with ionizable carboxyl groups to map the electrostatic properties of

25
S. cerevisiae at the nanometer level [68]. Xu measures the elastic modulus of the sheath of the
archeon Methanospirillum hungatei GP1 [69]. Gaboriaud quantifies the nanomechanical
properties of Shewanella putrefaciens and observes the cell surface swells as pH increases [70].
Yao characterizes the turgor pressure of E. hirae and P. aeruginosa [71]. Modifying AFM tip
with specific functional groups provides a way to map chemical groups on cell surfaces and
measure their interactions [72]. AFM is also used as force spectroscopy to measure the
mechanical properties of single biomolecules. Oesterhelt uses AFM to unzip proteins from the
HPI (hexagonally packed intermediate) layer and unfold individual bacteriorhodopsins [73].
Cells are attached to AFM cantilever to measure the attachment / detachment force for cell-cell
and cell-substrate interaction [74, 75].
1.2.5 Freestanding nano-structure
Freestanding structures are ubiquitous in the modern era of nanotechnology, especially in
electronics, nano-materials development, bioengineering, and nano-fiber meshes. In micro- /
nano-electromechanical systems (M/NEMS), beams, bridges, diaphragms, and switches are
indispensable components. Compared to the conventional nano-structures which involve a direct
contact with the substrate, the suspended nano-structure is more suitable and sensitive for
exploring the interplay between electronic, mechanical, thermal and biological properties without
the interaction with the substrate.
With these advantages, freestanding nano-structures have wide applications in sensors,
transducers and memory elements [76]. Figure 1-13a illustrates the overall design of self-
assembled graphene nano-composite cancer sensor coated with prostate specific antigen (PSA)
capture antibody. After encountering the PSA solution, the immune reaction takes place at both

26
sides of the suspended region and the conductance of ultra-sensitive graphene changes with
strong suppression of electrical noise due to the PSA adsorption [77]. Figure 1-13b shows the
cross-linked protein membrane with only 60 nm think performing ultrafast permeation of
drinking water [78]. Figure 1-13c presents a highly sensitive hydrogen sensor based on
suspended and functionalized single tungsten nano-wire [79]. The significant increase of nano-
wire resistance is observed whenever it is exposed to hydrogen molecules and the resistance is
recovered to the original value after hydrogen molecules are purged out.
Figure 1-13 Applications of freestanding sensitive nano-structures. (a) SEM image of the
suspended graphene beam array used as prostate cancer sensor. Bottom image showing
schematic of immune reaction between PSA capture antibodies and target protein PSA [77]. (b)
A cross-sectional representation of a 60-nm-thick protein membrane on a porous alumina support
used for water filtration [78]. (c) SEM images of suspended single tungsten nano-wire bridge as
hydrogen sensor [79].

27
1.2.5.1 Electrospun nano-fiber
Nano-fiber is being explored for a variety of applications and the research on that is
rapidly expanding. It has potential applications in the field of filtration, sensors, military
protective clothing, photovoltaic devices, liquid-crystal display (LCD), ultra-light weight space
craft materials, super-efficient and functional catalysts and variety of biomedical scaffolds [80-
85]. Nano-fibers are fabricated using a variety of fabrication techniques, namely drawing [86],
template synthesis [87], temperature-induced phase separation [88], molecular self-assembly [89]
and electrospinning [90-94]. Among these, electrospinning appears to be a very reasonable
technique to fabricate polymeric nano-fibers from a variety of polymer solutions. This process is
simple, elegant, straightforward, versatile, reproducible, continuous and scalable. It is possible to
fabricate fibers in the diameter range of ~3 nm to 6 m and several meters in length using the
same experimental set-up [95]. The formation of nano-fibers through electrospinning is based on
the uniaxial stretching of a viscoelastic solution. A schematic diagram to interpret
electrospinning of polymer nano-fibers is shown in Figure 1-14. There are basically three
components to fulfill the process: a high voltage supplier, spinneret with a pipette or small
diameter needle, and a collector [83, 96]. In the electrospinning process, a high voltage is applied
to the solution such that at a critical voltage (typically more than 5 kV), the repulsive force
within the charged solution is larger than its surface tension and thus a jet erupts from the tip of
the spinneret. Before reaching the collector, the solution jet evaporates or solidifies, and is
collected as an interconnected web of small fibers. One electrode is placed into the spinning
solution / melt and the other attached to the collector. In most cases, the collector is simply
grounded. The electric field is subjected to the end of the capillary tube that contains the solution
fluid held by its surface tension. A few widely studied parameters include solution viscosity,

28
conductivity, applied voltage, tip-collector distance and humidity. To achieve various fiber
assemblies, stationary collector can be used to collect random nano-fibers and dynamic
collection for aligned nano-fibers.
Figure 1-14 Schematic of electrospinning fabrication.
In recent years, several methods have been proposed for direct mechanical properties
measurements of individual fiber and the bulk properties of matrix. Individual fiber is
characterized in tensile testing apparatus and by gluing to an AFM tip [97, 98]. These methods
can not only produce entire force-extension curves, but also allow the investigation of other
properties such as yield strength. A cantilever vibration test is performed to investigate the
mechanical properties of individual fiber by gluing between two cantilevers and then being
vibrated to find the resonate frequency [99]. Tensile testing is also used to test the bulk
properties of electrospun poly (-caprolactone) (PCL) nano-fiber membrane with random and
aligned alignment [100]. PCL fibers are strained in tension and demonstrated a capacity to
A B

29
reorient in the direction of strain and remain in that orientation even after the strain is removed
[101].
1.2.5.2 Single walled carbon nanotube (SWCNT) film
As a new member of the fullerene family, carbon nanotubes (CNTs) have drawn much
attention since their discovery because of unique properties. Both experimental and theoretical
studies have concluded that CNTs possess superb mechanical and physical properties due to their
strong carbon-carbon covalent bonds and unique atomistic structures. For example, elastic
modulus and strength of individual CNT are on the order of 1.0 TPa and 50 GPa [102]. The
electrical conductivity for SWCNTs is 106 S/cm, which is higher than that of copper [103].
Meanwhile, the room temperature thermal conductivity of SWCNTs is ~3500 W.m-1
.K-1
, which
are well above the bulk graphite conductivity of ~2000 W.m-1
.K-1
[104]. The outstanding
mechanical and physical properties of CNTs have provided the impetus for researchers in
developing high performance macro-structures based upon CNTs. These include CNT arrays,
films, and fibers, which can be handled much more conveniently than the individual CNT.
Furthermore, CNTs in these macro-assemblies are mostly aligned parallel to one another.
Significant efforts have been made to investigate the mechanical and physical properties of these
macro-assembles. It has been found that CNT fibers, comprising axially aligned and highly
packed CNTs, could have much higher modulus and strength than those of commercial carbon
and polymeric fibers [105, 106]. Furthermore, CNT fibers have also shown satisfactory electrical
and thermal conductivities. Considering all their desirable attributes, CNT fibers are anticipated
to have a broad range of potential applications, such as reinforcements for high-performance
composites, biosensors, transmission lines, and microelectrodes [107].

30
SWCNTs can be regarded as rolled up graphene and the slightly curved sp2 carbon-
carbon bonds are very strong. Due to this fact and low defect density, SWCNTs possess very
high elastic modulus, and extremely high breaking strength. The modulus of CNTs has been
measured using a few different experiment methods: TEM [108, 109], AFM bending [15, 110],
AFM pulling [111] and Raman spectroscopy [112]. However, the reported mechanical properties
show large variations due to the different hierarchical structures and post-treatments, like
structures, diameter, fiber twist, liquid densification [107]. Despite many notable property
advantages of individual SWCNT, there are many daunting challenges in scaling it to any
realistic type of system. SWCNT thin film is the system that involves large numbers of
nanotubes in random networks, aligned arrays, or anything in between, and with thickness
between sub-monolayer and a few layers [113]. It also offers excellent mechanical properties due
in part to the intrinsic mechanical properties of the SWCNTs, such as high elastic modulus and
fracture stresses [114-116]. Such features make SWCNT thin films attractive for applications
that require high degrees of mechanical bending, such as flexible or conformable electronic
nano-systems.
1.3 Research objectives
This dissertation is mainly focused on mechanical characterization of both biological and
freestanding nano-structures using atomic force microscopy in two parts: cell mechanics and
nano-structure mechanics. In the first part, two cases are studied: cancer cell, aim to get
mechanical properties of the glycoprotein mucin layer on cancer cells and its correlation with
resistance against drug delivery; bacteria in waste water treatment, with a goal to correlate
microbial macroscopic aggregation-deposition-transportation behavior to microscopic adhesion
mechanical properties using a dimensionless Tabor’s parameter. In the second part, a novel

31
nano-cheese-cutter, with an objective to directly measure the elastic modulus and interfacial
adhesion energy of 1-D freestanding similar / dissimilar nano-structures; and 2-D single walled
carbon nanotube (SWCNT) thin film, with a destination to characterize suspended SWCNT thin
film mechanical and electromechanical properties.
1.4 Organization of the dissertation
This dissertation is organized in seven chapters.
Chapter 1 is an introduction to general experimental tools to characterize biological and
freestanding nano-structure mechanical properties. Basic principle of AFM is demonstrated
because it is the main tool used in this dissertation. Published relevant literature is reviewed in
the fields of cell mechanics and freestanding nano-structure mechanics.
Chapter 2 focuses on mechanical characterization of the glycoprotein mucin on cancer
cells and its correlation with resistance against drug delivery. Efficacy of drug delivery to typical
tumor cells is oftentimes declined due to the thick dendritic network of oligosaccharide mucin
chains that forms mechanical barrier against the invading drug-delivery microcapsules. AFM is
used to directly measure the force needed for AFM tip to pierce the mucin layer to reach the cell
surface, and the data is analyzed based on de Gennes’ steric repulsion theory. Multi-drug
resistant (MDR) ovarian tumor cells shows significantly larger penetration load compared to the
wide type. A pool of pancreatic, lung, colorectal, breast cancer cells are also characterized. The
chemotherapeutic agent, benzyl-α-GalNac, for inhibiting glycosylation is shown to be effective
in reducing the mechanical barrier.
Chapter 3 is the correlation of macroscopic aggregation behavior and microscopic
adhesion properties of bacteria strains using a dimensionless Tabor’s parameter. Macroscopic

32
adhesion-aggregation, floc formation, and subsequent transportation of microorganisms in
porous medium are closely related to the microscopic mechanical properties of individual cell.
The classical Tabor’s parameter in classical colloidal science is modified to correlate the
macroscopic aggregation and microscopic adhesion properties of microorganisms. Seven
bacterial strains relevant to wastewater treatment and bioremediation are characterized in terms
of their macroscopic aggregation index (AI) using an optical method, and their microscopic
coupled adhesion and deformation properties using AFM. Single cells are indented to measure
the range and magnitude of the repulsive-attractive intersurface forces, elastic modulus,
thickness and density of the cellular surface substances (CSS). The strong correlation suggests
that microscopic AFM characterization is capable of making reliable prediction of macroscopic
behavior.
Chapter 4 is the correlation between single bacteria mechanical characterization and
deposition-transportation behavior in porous medium using dimensionless Tabor’s parameter.
The effects of ionic strength of medium and cell culturing time are two great factors to influence
cell biochemical properties, subsequently cell attachment / detachment and transportation
kinetics, which are investigated in this chapter. Column tests are employed to determine the
deposition-transportation kinetics of 6 different strains, which have significant impacts in
polluted sites. AFM is used to quantify mechanical properties of single microbial cell in
electrolyte with a wide range of ionic concentration, to yield the elastic modulus, range and
magnitude of the repulsive-attractive intersurface forces, cellular surface substances (CSS)
thickness and density, cell size and geometry. The change of mechanical properties in different
environment is obtained based on microscopic mechanical characterization. These microscopic
quantities are then integrated into the modified dimensionless Tabor’s parameter to account their

33
adhesion-deformation behavior. A strong correlation is found between the microscopic
mechanical properties and macroscopic deposition-transportation behavior, further suggesting
that AFM is powerful tool to make reliable macro-scale prediction in bacterial field.
Chapter 5 demonstrates a nano-cheese-cutter to directly measure interfacial adhesion of
freestanding nano-fibers. A nano-cheese-cutter is fabricated to directly measure the adhesion
between two freestanding nano-fibers. A single electrospun fiber is attached to the free end of an
AFM cantilever, while a similar fiber is similarly prepared on a mica substrate in an orthogonal
direction. External load is applied to deform the two fibers into complementary V-shapes, and
the force measurement allows the elastic modulus to be determined. At a critical tensile load,
“pull-off” occurs when the adhering fibers spontaneously detach from each other, yielding the
interfacial adhesion energy. Loading-unloading cycles are performed to investigate repeated
adhesion-detachment and surface degradation. The novel AFM cutter is extended to investigate
the interfacial adhesion properties between two dissimilar materials (SWCNT bundle and
electrospun Nylon 6 fiber). The measurements have significant impact in evaluation the
mechanical performance of interfacial toughness between two different materials for enhancing
composite material, where two phases interaction holds the key to integrity.
Chapter 6 focuses on mechanical and electromechanical characterization of suspended
SWCNT thin film on patterned polymer substrate. SWCNT thin film is transferred onto micro-
patterned SU-8 strips using wet contact print method. Tipless AFM cantilever is used to deform
suspended thin film into V-shape under mixed bending and stretching by line-load compression.
Established “V-peel” linear elastic model is adopted to fit the mechanical response for thin film
elastic modulus and average thickness. Furthermore, another AFM tipless cantilever is modified
using focused ion beam (FIB) to deflect suspended SWCNT film reversibly in electromechanical
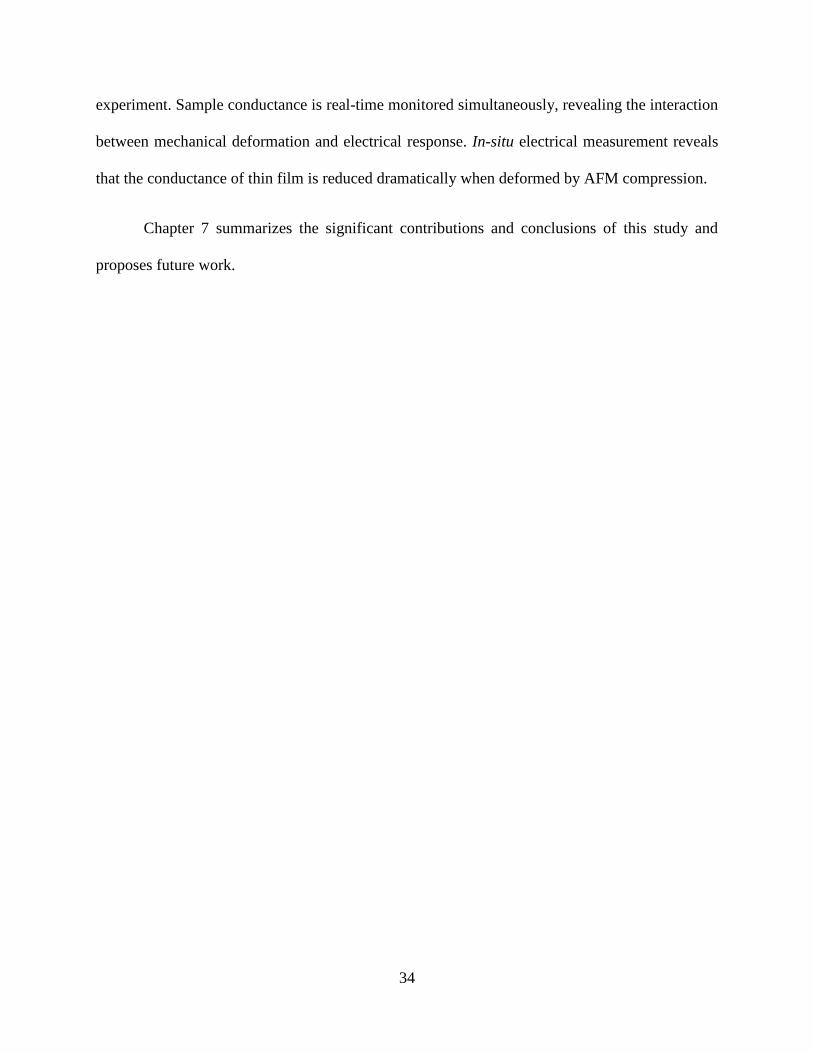
34
experiment. Sample conductance is real-time monitored simultaneously, revealing the interaction
between mechanical deformation and electrical response. In-situ electrical measurement reveals
that the conductance of thin film is reduced dramatically when deformed by AFM compression.
Chapter 7 summarizes the significant contributions and conclusions of this study and
proposes future work.

35
Chapter 2 Mechanical Characterization of the Glycoprotein Mucin on
Cancer Cells and its Correlation with Resistance Against Drug Delivery
2.1 Introduction
Cancer has long been a leading cause of death in the world and is presently responsible
for about 25% of all deaths [117], and an estimate of 15 million new cases per annum by 2020
[118]. Mucins are high molecular weight glycoproteins having oligosaccharides attached to a
protein backbone core by O-glycosidic linkages, and are approximately 50-80% carbohydrates in
terms of total molecular mass [119]. The long chain molecules naturally produced in a wide
range of host tissues including the gastrointestinal tract, lungs, kidneys, ovaries, breast and
pancreas [120]. The molecular brush plays a protective role in epithelial tissues, functioning in
the renewal and differentiation of the epithelium and in the regulation of cell adhesion and cell
function under normal physiological conditions. In cancerous tissues, however, mucin
experiences over-, inappropriate and aberrant expressions (Figure 2-1, reprinted from [52]) that
are directly correlated with prognosis for certain malignancies [47]. Mucin forms barrier against
the cytotoxic drugs from gaining access to the intracellular targets, resulting in inadequate drug
delivery to the host tumor cells (shown in Figure 2-2). Consequently, residual tumor cells survive,
regrow, and possibly develop into resistant cells [121]. One possible treatment is to reduce or
inhibit the formidable O-glycosylation mucin mesh, facilitate drug diffusion, improve
intracellular drug uptake, and enhance cytotoxic drug action [122]. A proper understanding of
the mechanical properties of mucin and rigorous quantification of the subsequent chemo-
mechanical resistance are therefore necessary.

36
Recently, direct force measurements using atomic force microscopy (AFM) indentation
shows significant differences in elasticity of benign versus cancerous human epithelial cells [44,
46, 52]. In this chapter, AFM is used to characterize the mucin layer of a range of natural cancer
cells, glycosylation inhibited cells, and drug resistant cells by measuring the mechanical force
needed to penetrate the mucin and the associated mechanical energy. The measurements are
correlated with the known drug resistance.
Figure 2-1 Side view SEM images of cancerous and normal cells [52].
Figure 2-2 Schematic of drug delivery through long chain molecular mucin layer to tumor cell.

37
2.2 Experiment
2.2.1 Sample preparation
Six types of mucinous human in-vitro adenocarcinoma models were investigated, namely,
pancreatic Capan-1, breast ZR-75-1, colorectal Colo-205, lung Chago-K-1, wide type ovarian
SK-OV3 WT, and multi-drug resistant ovarian SK-OV3 MDR. A known to be non-mucous cell
type, brain U87-MG cells, was set up as negative control. Capan-1 cells were cultured and
maintained in IMDM (Iscove’s modified Dulbecco’s medium from ATCC, Manassas, VA), ZR-
75-1, Colo-205 and Chago-K-1 cells in RPMI-1640 (developed by Moore et. al. at Roswell Park
Memorial Institute), U87-MG cells in EMEM (Eagle’s minimum essential medium) and SK-
OV3 WT, SK-OV3 MDR in DMEM (Dulbecco's modified Eagle's medium), with a culture
media supplemented with 10% FBS (Fetal bovine serum). Samples were grown in humidified 5%
CO2 atmosphere at 37ºC. The chemotherapeutic agent, benzyl-α-GalNac (analog of N-
aceltylgalactosamine) purchased from Sigma-Aldrich (St Louis, MO) was used to inhibit O-
glycosyaltion of mucin and thus reduced the carbohydrate chains associated with the protein
backbone of mucin as shown in Figure 2-3a [123]. Cells were seeded at 104 per mL in 24-well
plates. Following a 24 h incubation period at 37 ºC, samples were exposed to maximum non-
toxic concentrations (MNC) of benzyl-α-GalNac solution prepared in cell culture medium. The
maximum non-toxic concentration of benzyl-α-GalNac which was not toxic to ≥ 95% of the cells
was 0.4 mg/mL, 1.0 mg/mL, 0.05 mg/mL, 0.8 mg/mL, 0.05 mg/mL, 0.05 mg/mL and 0.025
mg/mL for Capan-1, ZR-75-1, Colo-205, U87-MG, Chago-K-1, SK-OV3 WT and SK-OV3
MDR cells, respectively. After 48 h of exposure to benzyl-α-GalNac, the samples were ready for
mechanical characterization. The cells were roughly 10 m in dimension.

38
2.2.2 AFM force measurement
Force measurements were performed using an Agilent 5500 atomic force microscope
(AFM) sitting on an Olympus GX71 inverted optical microscope (Figure 2-3). The system
allowed precisely laterally positioning of the AFM tip over the target cells. There was triangular
silicon nitrate AFM cantilever (Figure 2-3c) with silicon tip used in the experiments (Type VI
MAC Levers, Agilent Technologies, US). The deflection sensitivity was calibrated by repeated
contact mode indentation on a freshly cleaved muscovite mica surface in air with sweep duration
of 1.04 second, and the spring constant was found to be 0.20 ± 0.02 N.m-1
by the Cleveland
method [124]. The tip radius was estimated to be ~10 nm. All measurements were performed at
room temperature 20oC. The loading-unloading process was conducted at roughly 3 m.s
-1 and
was accomplished within 1.04 second. The applied load, F, was measured a function of the
vertical actuation distance of the piezoelectric cell, y, throughout loading-unloading. At least five
measurements were performed on different areas close to the center of each single cell, and at
least 10 cells were characterized for each sample.

39
Figure 2-3 AFM combined with an inverted optical microscope experimental set-up. (a)
Schematic showing the combination system of AFM and inverted optical microscope used in the
force measurements on two sets of samples (natural and glycosylation inhibited cancer cell). (b)
Real picture of the combination system. (c) Optical microscopy picture taken when triangular
AFM cantilever with sharp tip doing indentation on single cancer cell.
2.3 Results
The AFM measured force-displacement curves, F(y), are highly reproducible as shown in
Figure 2-4, which is ten loading curves for each of natural and glycosylation inhibited breast ZR-
75-1 cancer cells. Figure 2-5 shows typical F(y) for natural breast ZR-75-1 cells loading along
path ABCD (a) and unloading along DGHI (b). Starting from A, the AFM tip travels freely in
liquid medium until reaching the top surface of mucin layer at B, and thus AB sets the baseline
for F = 0. Along BC, the tip penetrates the mucin molecular brush showing a monotonic
increasing compressive load to counterbalance the mechanical resistance. The bumpiness is a
direct consequence of the discrete molecular nature of glycosylated mucin. The thicker the mucin
layer, the more likely the anti-cancer drug loaded liposomes are trapped before reaching the cell
surface. At C, the tip reaches the cell surface, and further loading leads to global deformation of
the cell, showing a roughly linear F(y). Area bounded by curve BC and the horizontal axis is

40
taken to be the mechanical energy needed to penetrate the mucin layer indicated as Upen as
shown in the inset graph of Figure 2-5a. Once the desirable indentation depth is reached at D, the
tip is retracted upon unloading along path DGHI. Despite the small loading-unloading hysteresis,
the deformed cell is believed to exercise full elastic recovery. The applied force turns tensile (F <
0) and reaches a maximum at H. Further retraction leads to detachment of mucin or sugar
molecules from the AFM tip surface. The tip finally emerges from the much layer. Area bounded
by curve GHI and the horizontal axis is taken to be the mechanical energy needed to retract from
mucin layer indicated as Uret as shown in the inset graph of Figure 2-5b. It is noted since the
mechanical force throughout the loading-unloading process is in the range of 1-2 nN over 1-2
m the AFM is the most suitable equipment for such measurement. Contrasting the natural
cancer cells, the glycosylated inhibited samples do not possess the characteristic bumpiness in
F(y) prior to the cell deformation, because most sugar side branches on the mucin trunk are
removed and the tip has virtually free access to the cell surface. Figure 2-6 shows the similar
mechanical behavior of natural and glycosylation inhibited pancreatic Capan-1 and colorectal
Colo-205 cancer cells. Other sample cells show similar behavior besides the magnitude of forces
and range. The control brain cells show virtually zero loading-unloading hysteresis and absence
of the bumpiness in F(y), indicating absence of surface mucins. Behavior of brain U87-MG
cancer cell is distinctly different from the other cell types, in that, the loading curves for cells
with and without glycosylation are identical to within statistical errors. The smoothness of F(y)
in Figure 2-7 indicates a lack of an outer mucin layer even in plain cell. Note that it is difficult to
determine when the probe touches the cell surface.

41
AFM Piezo Displacement, y (nm)
-1000 -500 0 500 1000 1500 2000
App
lied
For
ce, F
(nN
)
-0.3
0.0
0.3
0.6
0.9
1.2
1.5
Compression
Tension
Natural cancer cells
Gly. inhibited cells
Breast ZR-75-1 Cancer Cell
Figure 2-4 Ten loading curves for each of natural and glycosylation inhibited breast ZR-75-1
cancer cells showing reproducibility.

42
AFM Piezo Displacement, y (nm)
-1000 -500 0 500 1000 1500
App
lied
For
ce, F
(nN
)
0.0
0.5
1.0
1.5
MucinLayer
Natural
cancer cells
Glycosylationinhibited cells
Loading
A
C
D
Cel
l Sur
face
Compression
Tension
B
y (nm)0 300 600 900 1200
F (
nN)
0.0
0.1
0.2
0.3
0.4
0.5
Upen
Breast Cancer Cell(a)
-1000 -500 0 500 1000 1500-0.5
0.0
0.5
1.0
1.5
AFM Piezo Displacement, y (nm)
App
lied
For
ce, F
(nN
)
Unloading
Cel
l Sur
face
Compression
Tension
Breast Cancer Cell ZR-75-1
y (nm)
0 400 800 1200
F (
nN)
-0.2
-0.1
0.0
UretNatural
cancer cells
Glycosylationinhibited cells
(b)
H
D
I
G
Figure 2-5 Typical mechanical response of natural and glycosylation inhibited breast ZR-75-1
cancer cells. (a) Loading curve, (b) Unloading curve.

43
AFM Piezo Displacement, y (nm)
-1000 -500 0 500 1000
App
lied
For
ce, F
(nN
)
-1
0
1
2
3
4
Cel
l Sur
face
CompressionTension
Natural cancer cells
Glycosylation inhibited cells
MucinLayer
(a)Pancreatic Capan-1
Cancer Cell
AFM Piezo Displacement, y (nm)
-1000 0 1000 2000 3000
App
lied
For
ce, F
(nN
)
-1
0
1
2
3
4
Cel
l Sur
face
Mucin Layer
Gly.Mucin
Gly.Inhibited
CompressionTension
(b)Colorectal Colo-205
Cancer Cell
Figure 2-6 Typical mechanical response of natural and glycosylation inhibited (a) pancreatic
Capan-1, (b) and colorectal Colo-205 cancer cells.

44
AFM Piezo Displacement, y (nm)
-1000 -500 0 500 1000 1500 2000
App
lied
For
ce, F
(nN
)
-1
0
1
2
3
4
Loading
Compression
Tension
Cel
l Sur
face
Natural cancer cell
Glycosylation inhibited cells
Brain Cancer Cell
Figure 2-7 Representative compressive loading curves on natural and glycosylation inhibited
brain U87-MG cancer cells as control.
2.4 Data analysis and discussion
Since the AFM cantilever is compliant, distance traveled by the piezoelectric cell does
not correspond to the actual tip displacement. According to Iyer [52], the separation between the
AFM tip and sample cell surface is given by h = y – y0 + c + d, where y is the relative vertical
piezoelectric displacement with a reference set at –ymax being the maximum cantilever deflection
(e.g. point D in Figure 2-5a), y0 is the depth below the cell surface that is not deformed, c is the
deformation of cell body due to the applied load to be defined, and d = F / k is the linear elastic

45
cantilever deflection. According to the Hertz-Sneddon model [125], the constitutive relation for a
rigid sharp cone with half angle, = 55o, pressing vertically on an elastic half continuum with
elastic modulus, E, and Poisson’s ratio, v = 0.50, is given by 22 ]tan )1( /2[ cvEF
which is justified for a sharp AFM tip and a large cell. Upon intimate contact of the tip with the
cell surface at the maximum load, h = 0 and thus
Fk
FE
vyy
1
2
tan )1( 2/1
2/12
0 Eqn (2-1)
which is the fundamental equation used in the data analysis. For a specific sample, simultaneous
measurement of F and y yields the constants E and y0. Figure 2-8 shows the typical mechanical
resistance as a function of the AFM tip approach distance for all six natural cell types. There are
three interesting facts observed based on mechanical measurements. First, the cell types show
significant difference with the highest resistance of ovarian (MDR) cells roughly two orders of
magnitude higher than that of the weakest of colorectal cells. Second, interesting fact is that the
ovarian-MDR cells possess much larger resistance compared to its ovarian-WT counterpart,
which is expected if indeed the drug resistance directly depends on the mechanical behavior. The
last one is that benzyl-α-GalNac reduces the elastic moduli (Table 2-1) of sample cells by up to
60% for all kinds of cancer cells except ovarian-MDR and brain cancer cell as a side effect, even
though it should affect merely the mucin [122].
Though mucin is better described as a random mesh, the classical de Gennes’ steric
repulsive model [126], which is built for parallel molecular brush is adopted here for a
reasonable estimate of the quantities, namely, equilibrium thickness of the mucin layer, l, and the
effective number density of mucin molecules on cell surface, . The mechanical resistance is
given by

46
2exp 50 2/3
h
RTkF B Eqn (2-2)
with kB the Boltzmann constant, T the absolute temperature, and R the AFM tip radius (~10 nm).
Curve-fits to F(h) in Figure 2-9 thus yield l and . Table 2-1 is mechanical properties
comparison of normal and glycosylation inhibited cancer cells. Figure 2-10 summarizes the
materials parameters obtained. The ovarian-MDR shows the strongest mechanical resistance to
tip penetration, followed by ovarian-WT which is almost halved, then the rest which are virtually
in the same range. The mucin layer is roughly 1 m thick for all cell types. Number density is
more pronounced in the two ovarian cell types compared to the rest. In case of the glycosylation
inhibited samples, effects of mucin are significantly suppressed. It is noted that ovarian-MDR
and ovarian-WT cells have virtually the same measurable mucin thickness and number density,
despite a large penetration force in the former. In the case of glycosylation inhibited samples, the
penetration energy and mucin layer density are significantly suppressed, although the mucin
layer thickness remains intact as expected.
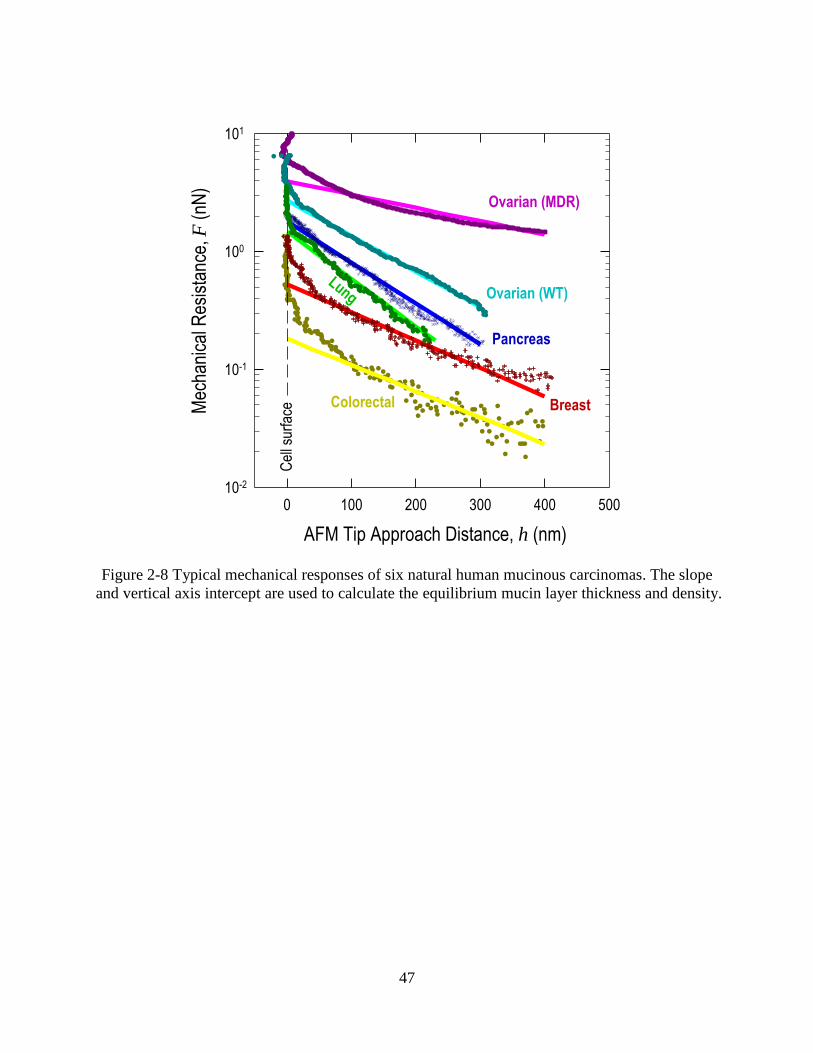
47
0 100 200 300 400 50010-2
10-1
100
101
AFM Tip Approach Distance, h (nm)
Mec
hani
cal R
esis
tanc
e, F
(nN
)Ovarian (MDR)
Ovarian (WT)
Pancreas
Lung
Colorectal Breast
Cel
l sur
face
Figure 2-8 Typical mechanical responses of six natural human mucinous carcinomas. The slope
and vertical axis intercept are used to calculate the equilibrium mucin layer thickness and density.

48
AFM Tip Approach Distance, h (nm)
0 100 200 300
Mec
hani
cal R
esis
tanc
e, F
(nN
)
10-1
100
101
Natural cancer cells
Glycosylationinhibited cells
Muc
in s
urfa
ce
Cel
l sur
face
Ovarian SK-OV3 WT Cancer Cell
Figure 2-9 Curve fitting using de Gennes’ steric repulsion model for nature and glycosylation
inhibited ovarian SK-OV3 wide type cancer cells yielding equilibrium thickness of the mucin
layer, l, and the effective number density of mucin molecules on cell surface, .

49
Table 2-1 Mechanical properties comparison of normal and glycosylation inhibited cancer cells.
Cell type Sample
Elastic
modulus, E
(kPa)
Thickness of
mucin layer, l
(nm)
Density of mucin
layer,
(molecules/m2)
Penetration
energy, Upen
(aJ, 10-18
J)
Retraction
energy,
Uret (aJ, 10-18
J)
Pancreas
(Capan-1)
Natural 7.07 ± 2.62
(37.1%)
862 ± 301
(34.9%)
1159 ± 295
(25.5%)
187.7 ± 11.9
(6.3%)
35.0 ± 18.5
(52.8%)
Gly. inhibited 5.23 ± 1.79
(34.2%)
864 ± 141
(16.3%)
476 ± 134
(28.1%)
70.1 ± 26.6
(37.9%)
30.2 ± 16.1
(53.3%)
Breast
(ZR-75-1)
Natural 5.64 ± 1.01
(17.9%)
1210 ± 368
(30.4%)
588 ± 106
(18.3%)
147.3 ± 33.9
(23.0%)
88.1 ± 30.1
(34.1%)
Gly. inhibited 3.22 ± 1.09
(33.8%)
1183 ± 396
(33.5%)
324 ± 82
(25.3%)
36.6 ± 5.8
(15.8%)
45.7 ± 22.7
(49.7%)
Colorectum
(Colo-205)
Natural 15.9 ± 4.54
(28.6%)
1112 ± 394
(35.4%)
831 ± 44
(5.29%)
90.6 ± 20.9
(23.1%)
342 ± 159
(46.5%)
Gly. inhibited 8.06 ± 2.65
(32.9%)
1153 ± 322
(27.9%)
615 ± 192
(31.2%)
70.6 ± 7.5
(10.6%)
123 ± 42.2
(34.3%)
Lung
(Chago-K-1)
Natural 16.7 ± 5.22
(31.3%)
874 ± 255
(29.2%)
1110 ± 263
(23.7%)
174.5 ± 51.4
(29.5%)
652.2 ± 165.4
(25.4%)
Gly. inhibited 12.5 ± 5.87
(46.9%)
826 ± 266
(32.2%)
765 ± 167
(21.8%)
122.7 ± 19.1
(15.6%)
165.7 ± 58.7
(35.4%)
Ovarian Wide
Type
(SK-OV3 WT)
Natural 13.3 ± 3.52
(26.5%)
884 ± 199
(22.5%)
1670 ± 378
(22.6%)
466.6 ± 74.2
(15.9%)
77.3 ± 5.0
(6.5%)
Gly. inhibited 6.5 ± 1.94
(29.8%)
838 ± 203
(24.2%)
680 ± 190
(27.9%)
95.3 ± 15
(15.7%)
52.9 ± 12.7
(24.0%)
Ovarian Multidrug
Resistant Type
(SK-OV3 MDR)
Natural 11.3 ± 3.21
(28.4%)
1050 ± 350
(33.3%)
1680 ± 295
(17.6%)
818.6 ± 89.2
(10.9%)
116.8 ± 53.0
(45.4%)
Gly. inhibited 11.8 ± 2.67
(22.6%)
864 ± 241
(27.9%)
1380 ± 384
(27.8%)
613.5 ± 74.9
(12.2%)
95.9 ± 57.4
(59.9%)
Brain
(U87-MG)
Natural 7.69 ± 1.63
(21.2%) / / / /
Gly. inhibited 7.36 ± 3.95
(53.7%) / / / /

50
0
250
500
750
1000
Muc
in L
ayer
Thi
ckne
ss
l
(nm
)
0
500
1000
1500
2000
Ovaria
n M
DR
Ovaria
n W
T
Pancr
eas
Lung
Breas
t
Colore
ctum
Muc
in L
ayer
Den
sity
m-2
)
0
1000
2000
3000
Pen
etra
tion
Ene
rgy
Up
en (
10-1
8 J)
*
*
* * * *
* *
* *
* *
Figure 2-10 Mechanical properties comparison for six different types of normal and
glycosylation inhibited cancer cells (*p<0.05). (a) Mechanical energy needed for AFM tip to
penetrate mucin layer, (b) Thickness of mucin layer, (c) Number density of mucin.
2.5 Conclusion
Type-O-glycosylatin is a cellular barrier known to reduce the impact of cancer drug
therapies in-vivo [122]. To simulate drug delivery, an AFM probe characterizes the mechanical
barrier of six human mucinous and multidrug resistant carcinomas. The mechanical

51
measurements show explicitly the presence of mucin and their ability to fend off invading
mechanical probe or drug delivery microcapsules, while their glycosylation inhibited counterpart
exhibit distinctly weaker mechanical resistance. In ovarian cells, there is a direct correlation
between the mechanical resistance and their known natural ability to defend the host cells against
drug delivery. Although mechanical barrier alone is certainly not the only mechanism that
hinders drug transport, it at least contributes quite significantly to ineffective cytotoxic drug
therapy. The studies reported herein offer additional support for the development of clinical and
pharmaceutical approaches to combat mucin over-expression in tumors during cancer
chemotherapy.
52
Chapter 3 Correlation of Macroscopic Aggregation Behavior and
Microscopic Adhesion Properties of Bacteria Strains Using a Dimensionless
Tabor’s Parameter
3.1 Introduction
Microbial adhesion-aggregation-transportation is of great importance to various
environment processes such as in-situ or enhanced subsurface bioremediation [127], filtration
processes for water and wastewater treatments [128, 129] and protection of drinking water
supplies [130]. Metabolic activities of the microorganisms and their phenotypes are
conventionally believed to hold the key to control the contaminants’ fate and mobility, as well as
transformation and degradation, in changing geochemical conditions [131, 132]. Equally
important, but by and large ignored, is the mechanical aspects of bacteria aggregation behavior
when flowing through a subsurface porous medium. There is an urgent need to understand the
fundamental science and mechanics of microbial adhesion-aggregation.
Colloid filtration theory (CFT) is a celebrated model for macro-scale microbial
transportation in saturated porous medium based on advection–dispersion [133-135], and is
widely used to quantify microbial behavior in laboratory and field-scale studies [136-138].
Removal of microbes from the collector (e.g. sand grain) is assumed to be governed by either
equilibrium adsorption or the kinetic rate-controlled bacteria attachment to and detachment from
the aquifer materials [134, 138, 139]. Particle-collector interactions are assumed to be weakly
attractive with a short range. Notwithstanding its success in many perspectives, CFT prediction
often fails to a large extent to match with experimental observations in lab- and field-scales,
especially in particle deposition rates [135, 136, 139-143]. Elimelech et al. shows the necessity
53
of introducing full intersurface potential of the electrostatic double layers developed at the
surfaces of both the particle and collector according to Derjaguin–Landau–Verwey–Overbeek
(DLVO) theory [144-146]. Despite the improvement, the modified model still misses to factor in
other essential features such as the elastic deformation of individual cells associated with
adhesion contact. When microorganisms are influenced by strong surface forces, they inevitably
deform into distorted shapes. Compliant cells with small elastic modulus conform to one another,
making the resulting multi-cell aggregate more streamlined to the flow and thus more resistant to
segregation. Conversely, rigid cells are less likely to aggregate even in the presence of strong
surface forces because of their mechanical resistance to deformation. In addition, the size of a
single cell in comparison to the surface force range also plays a critical role. Cells smaller than
the force range are fully immersed in the cohesive zone and the entire cell will sense the
influence of the substrate, but large cells are only partially influenced by the surface forces. Cell
geometry is another relevant quantity. While a spherical cell gives rise to a circular contact with
a planar substrate, a cigar shape cell leads to a rectangular contact. In the presence of the same
surface force, area of the circular contact is expected to be smaller than the rectangular
counterpart because of geometrical constraints and rigorous solid mechanics calculation [147-
149]. A comprehensive adhesion-detachment mechanics model capable of predicting bacteria
aggregation and transportation must therefore fully account for the combined effects of cell wall
stiffness, deformation mode, magnitude and range of surface forces, and cell size and geometry.
Such model is not available in the literature.
In this chapter, a new dimensionless parameter, , is expected to establish based on the
conventional Tabor’s parameter in classical adhesion and colloidal science [34, 150], to relate
the macroscopic cell aggregation to the microscopic mechanical properties of single cell and
54
inter-particle and particle-collector interfacial adhesion energy. A positive correlation between
the macro- and micro-behavior thus allows one to make reliable prediction of the macroscopic
aggregation based on merely microscopic characterization of single cells that is both time and
cost effective. As a demonstration, we choose seven representative bacterial strains commonly
found in domestic wastewater or polluted sites, which possess a wide range of aggregation
behavior. Macroscopic characterization of these strains is performed by an optical method to
assess their ability to adhere and aggregate. Microscopic mechanical properties are measured by
nano-indentation of single cells using atomic force microscopy (AFM), which yields information
of range and magnitude of repulsive-attractive surface forces, elastic modulus of cell, and
thickness and density of the cell surface substance (CSS) molecules etc.
3.2 Methods and materials
This project is collaborated with Prof. April Z. Gu in Environmental Engineering at
Northeastern University. The results shown in this chapter were partially done by Prof. Gu’s
group, including aggregation index and aggregation diameter measurements for all strains.
Seven vastly different bacteria strains were chosen for this study based on their relevance
to environment and human health, and their natural differences. Some of these strains were
isolates from activated sludge samples obtained from the aeration basin of Clemson Municipal
Wastewater Treatment Plant [151], and others are relevant to subsurface bioremediation and
contaminated sites of interest to United States Department of Energy (DOE). Special features are
listed as follows:
(i) K: Comamonas testosteroni (Gram-negative) is aerobic and is capable of
mineralization of the common pollutant 3-chloroaniline (3-CA) [152].

55
(ii) Q: Aeromonas punctata (Gram-negative) is aerobic and is reported to be
associated with human diseases including gastroenteritis, cellulitis and
diarrheal [153].
(iii) A: Raoultella ornithinolytica (Gram-negative) is aerobic and is found to
be a major cause of histamine fish poisoning [154].
(iv) H: Bacillus cereus (Gram-positive) is aerobic and is a common culprit in
food poisoning, causing both intoxications and infections [155].
(v) SH2: Shewanella putrefaciens CN32 (Gram-negative) is an anaerobic
strain belonging to DMRB (Dissimilatory metal reducing bacteria). It is
capable of reducing various metals and radionuclides including Fe (III)
and Mn (III/IV) abundant in sediment and U (VI), Cr (VI), Co (III), and
Tc (VII) cations in aqueous environment [156].
(vi) SH1: Shewanella Oneidensis MR-1 (Gram-negative) is another anaerobic
DMRB and is capable of reducing a wide range of organic compounds,
metal ions, radionuclides and associated metal / organic contaminants
[157].
(vii) Des: Desulfovibrio vulgaris (Gram-negative) is an anaerobic strain. Its
ability to reduce sulfate, sulfite, thiosulfate and nitrite in anaerobic
subsurface environments puts it to the forefront of biological research
[158].
3.2.1 Sample preparation
The strains used have considerable environmental relevance to bioremediation or water
quality. The four aerobic strains K, Q, A, and H were cultured in 25 g/L Luria–Bertani (LB)
media (Sigma-Aldrich, Inc., St. Louis, MO) in 50 mL tube (Corning, Inc., Corning, NY) at 37°C
placed on shaker of 200 RPM (revolutions per minute) until they reached stationary phase. The
facultative anaerobic strains SH1 and SH2 were grown in Luria-Bertani (LB) medium (25 g/L)
supplemented with a mixture of 10 mM sodium lactate as an electron donor and 10 mM sodium
fumarate (1.6 g/L) as an electron acceptor. Strain Des was grown anaerobically in ATCC
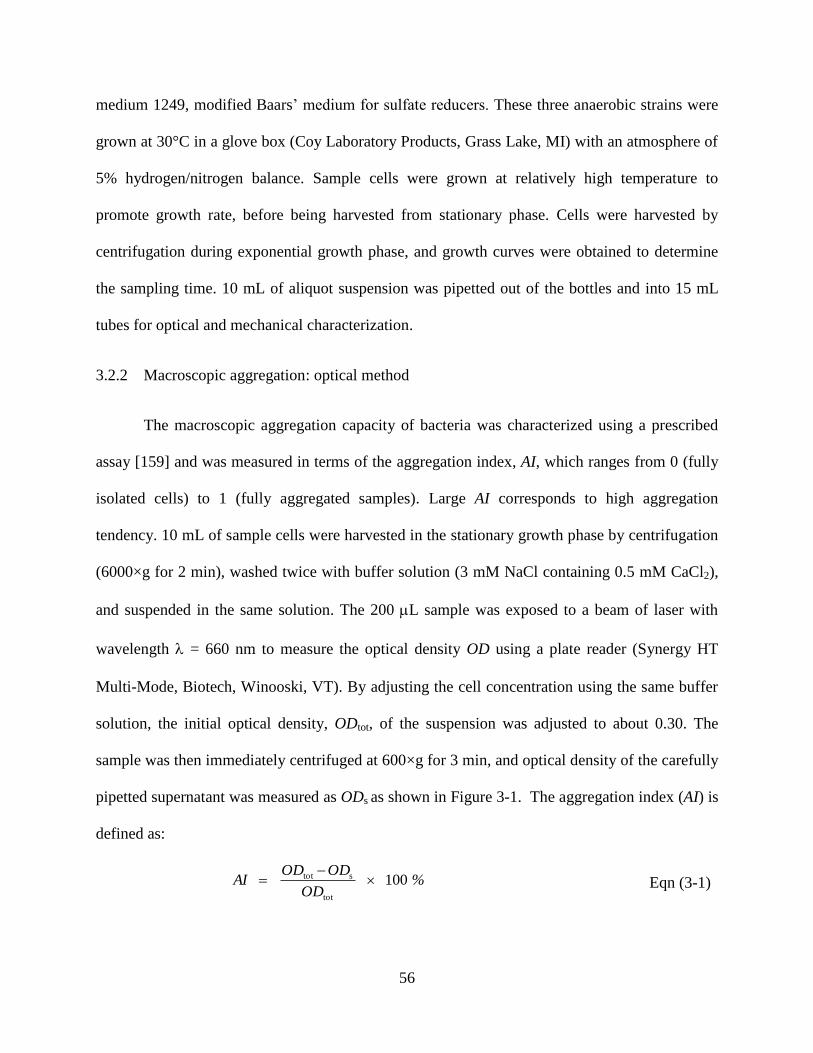
56
medium 1249, modified Baars’ medium for sulfate reducers. These three anaerobic strains were
grown at 30°C in a glove box (Coy Laboratory Products, Grass Lake, MI) with an atmosphere of
5% hydrogen/nitrogen balance. Sample cells were grown at relatively high temperature to
promote growth rate, before being harvested from stationary phase. Cells were harvested by
centrifugation during exponential growth phase, and growth curves were obtained to determine
the sampling time. 10 mL of aliquot suspension was pipetted out of the bottles and into 15 mL
tubes for optical and mechanical characterization.
3.2.2 Macroscopic aggregation: optical method
The macroscopic aggregation capacity of bacteria was characterized using a prescribed
assay [159] and was measured in terms of the aggregation index, AI, which ranges from 0 (fully
isolated cells) to 1 (fully aggregated samples). Large AI corresponds to high aggregation
tendency. 10 mL of sample cells were harvested in the stationary growth phase by centrifugation
(6000×g for 2 min), washed twice with buffer solution (3 mM NaCl containing 0.5 mM CaCl2),
and suspended in the same solution. The 200 L sample was exposed to a beam of laser with
wavelength = 660 nm to measure the optical density OD using a plate reader (Synergy HT
Multi-Mode, Biotech, Winooski, VT). By adjusting the cell concentration using the same buffer
solution, the initial optical density, ODtot, of the suspension was adjusted to about 0.30. The
sample was then immediately centrifuged at 600×g for 3 min, and optical density of the carefully
pipetted supernatant was measured as ODs as shown in Figure 3-1. The aggregation index (AI) is
defined as:
% OD
ODOD AI 100
tot
stot
Eqn (3-1)

57
Should the cells become resistant to aggregation, they remain scattered in colloidal form such
that ODs ODtot and AI 0. Conversely, formation of flocs or multi-cell aggregates facilitates
passage of optical beam and thus raises the optical transmission and AI.
Figure 3-1 Schematic of macroscopic aggregation index (AI) measurement.
To estimate the average dimension of an aggregate, cell suspension was dispersed on a
glass slide, and stained with 1 g/mL 4',6-Diamidino-2-phenylindole (DAPI) for 10 min. The
settling multi-cell aggregates were observed in-situ by fluorescent microscope (Zeiss, Axio
Imager M1-1). At least 20 micrographs were taken at different locations for each sample. Figure
3-2a shows typical multi-cell aggregates of strains Q and H. Based on DAPI signal, the
analytical software AxioVision Rel4.8 was used to map the irregular shape of an aggregate.
Diameter of a circle having the same area as the circumscribing region was taken as the nominal
aggregate dimension. Figure 3-2b shows a cumulative frequency plot of cell aggregates with
diameter smaller than or equal to different nominal aggregate diameters. The equivalent
aggregate diameter was determined as the value at cumulative frequency of 50%. Measurement
was repeated for each strain. Number of single cells in each aggregation was estimated by
dividing the average aggregation area by the mean single cell area. Note that the estimation here
did not consider the 3-D geometry and dimension of the aggregates, though we believe the 2-D

58
correspondence is sufficient for the purpose of evaluating the correlation of aggregation trends
with cellular surface properties.
3.2.3 Microscopic characterization of single cell: AFM indentation
A 10 mL strain suspension in a stationary phase culture was pelleted by centrifugation,
washed in the same volume of nanopore deionized water, pelleted a second time, and promptly
resuspended in 5 mL deionized water. 1 mL of the solution was pipetted onto a gelatin treated
cleaved mica surface (Sigma #G-6144). The sample was then allowed to settle for 20 minutes,
rinsed, and stored in deionized water (DI water), ready for AFM indentation. All the AFM
measurements were done in liquid cell.
There was triangular silicon nitrate AFM cantilever with silicon tip used in the
experiments (Type VI MAC Levers, Agilent Technologies, US). The deflection sensitivity was
calibrated by repeated contact mode indentation on a freshly cleaved muscovite mica surface in
air with sweep duration of 1.04 second, and the spring constant was found to be 0.205 ± 0.015
N.m-1
by the Cleveland method [124]. The unloaded resonant frequency in air was calibrated
using AFM (Agilent 5500) in tapping mode with frequency range suggested by the manufacturer.
The length and width of the cantilever were measured using optical microscope (Olympus,
GX71). Force measurements were repeated on mica surfaces before and after probing the
bacteria samples to ensure no contamination of the silicon AFM tip during experiments. As will
be seen in the next section, the AFM tip displacement was measured in the order of 100 nm and
the maximum applied force was roughly 3-4 nN. Deflection of the compliant AFM cantilever in
the 1-20 nm range was ruled out from AFM piezo displacement for real distance between AFM
tip and bacterial cells before making contact and cell deformation during indentation.

59
A typical cell was first identified by large scan size using low resolution MAC (Magnetic
Alternating Current) mode and then got high resolution image using small scan size. The AFM
tip was repositioned approximately over the cell center, before switching from tapping to contact
mode. Applied load, F, was measured as a function of the vertical displacement of AFM tip, y.
The mechanical response, F(y), was obtained for loading (compression) followed by unloading
(tension) of the tip. At least five loading-unloading cycles were performed at different locations
close to the cell center to ensure repeatability, and at least some 10 typical cells were
characterized in each batch. Measurements during loading were reproducible to a high precision
with AFM applied force, though unloading led to relatively random intermittent jumps (see later
section for explanation).
3.3 Results and analysis
3.3.1 Macroscopic measurements of AI
Figure 3-2a shows two fluorescent microscopy pictures of aggregates of strain Q and
strain H. All the aggregation diameter measurements are repeated n=20 times for each bacterial
strain. Top micrograph shows strain Q aggregate takes on a roughly circular envelop (dashed
curve) with an equivalent diameter d ~ 8 m. Bottom micrograph shows highly irregular strain H
aggregate with d ~ 20 m. Figure 3-2b is the example of mean nominal aggregation size
determination for strain A, which obeys cumulative frequency distribution. The equivalent
aggregate diameter is 4.9 ± 2.5 (51% error) m. Table 3-1 summarizes the aggregation index,
equivalent cell-aggregate diameter, and average number of cells within an aggregate for all
strains. In the measurements, the strains are ranked as SH2 < SH1 < Des < K < Q < A < H in
terms of the equivalent aggregate diameter, d, average number of cells per aggregate, N, and AI.

60
Aggregation Diameter, d (m)
0 4 8 12 16 20
Cum
ulat
ive
Fre
quen
cy (
%)
0
20
40
60
80
100
Strain A: Raoultella ornithinolytica
(a) (b)
Figure 3-2 (a) Typical fluorescent optical images. Top micrograph shows strain Q (Aeromonas
Punctata) aggregates along with the circular envelop (dashed curve) to define the equivalent
diameter (d ~ 8m). Bottom micrograph shows highly irregular strain H (Bacillus Cereus)
aggregate with d ~ 20m. (b) Aggregation size cumulative frequency plot to estimate the
aggregate nominal diameter of strain A. The equivalent aggregate diameter is 4.9 ± 2.5 (51%
error) m.
3.3.2 Microscopic: AFM measurements
Figure 3-3a shows AFM topographical scans of typical representative samples. All strains
possess similar prolate geometry with circular cross-section. The long and short axes are denoted
by b1 and b2 respectively. Figure 3-3b and Figure 3-3c are cross-section profiles and 3-D
topography of strain A.

61
(a)
X (m)
0 2 4 6 8 10 12
Top
ogra
phy
(m
)
-0.2
0.0
0.2
0.4
0.6
0.8
1.0
Profile 1
Profile 1
(b)
Figure 3-3 AFM topological scans. (a) Amplitude topological AFM scans of four aerobic strains
K, Q, A and H, showing the cigar shape cells and morphological details. (b) Cross-section
profiles of strain A. (c) 3-D topography AFM image of strain A.
(c)

62
Figure 3-4 shows representative mechanical responses of three selected strains. Figure
3-4a shows F(y) of strain K. Loading follows path ABCD. As the probe approaches the cell
surface from a distance along AB, no force is recorded until it touches the surface of the
molecular brush of cellular surface substance (CSS) at B. A repulsive force resisting the
penetrating AFM probe is then recorded showing a gradual increase in F, followed by a plateau
region. The distance BC is taken to be the CSS thickness, l. The work done for the tip to
penetrate the CSS, or energy barrier, Upen, is given by the area under BC (c.f. Figure 3-4b), and
the average penetration force is defined as Fpen = Upen / l. Further loading along CD leads to the
elastic global deformation of the cell. The classical Hertz-Sneddon model is used to compute the
cell elastic modulus, which is given by [125]
)(
1
4
32/32/1
2
y
F
RE
AFM
Eqn (3-2)
with R (~10 nm) the radius of curvature of the AFM tip, and ν = 0.50 the Poisson’s ratio for
incompressible polymeric solid. Retraction of the AFM tip leads to unloading path DCGH. Little
or no hysteresis is measured along DC, indicating the elastic recovery of the sample cell. At G,
the cell resumes the undeformed geometry and the AFM is fully unloaded with F = 0. Tensile
force is needed along GH to pull the tip out from the sample. The zigzagging F(y) shows
multiple sudden jumps of the order of 100-200 pN, corresponding to the detachment of
individual or an entangled bundles of CSS (e.g. extracellular polymeric substance EPS) from the
AFM tip. At H, the AFM tip “pulls-off” from the cell surface and the external load drops to zero.
The total work done needed to detach the AFM tip is given by the area enclosed, Uad (c.f. Figure
3-4c). The average penetration force is defined as Fad = Uad / l.
Figure 3-4b shows the mechanical response of strain Q, which is quite different from that
of strain K. Upon loading on the cellular surface substance (CSS), the AFM tip measures an

63
increasing compressive load until it reaches the cell surface. The absence of a force plateau
indicates a continual compaction of the cellular surface substance (e.g. EPS) rather than
penetration. Elastic recovery is again observed for further loading-unloading. Upon tip retraction,
a hysteresis is observed with a smaller repulsive load, and complete detachment occurs further
away from the cellular surface due to adhesion. Figure 3-4c shows behavior of strain A.
Stepwise detachment is also observed.

64
-1
0
1
2
3
4
5
Ons
et o
f glo
bal
defo
rmat
ion
Compression
Tension
(a) K: Comamonas Testosteroni
CSS
AB
C
D
G H
App
lied
For
ce, F
(nN
)
-1
0
1
2
3
4
5
(b) Q: Aeromonas Punctata
Col 3 vs Col 4
Col 1 vs Col 2 Col 1 vs Col 2
AFM Piezo Displacement, y (nm)
-400 -200 0 200 400 600 800 1000-1
0
1
2
3
4
5
(c) A: Raoultella Ornithinolytica
Ons
et o
f glo
bal
defo
rmat
ion
Compression
Tension
Comp.
Tension
Figure 3-4 Typical mechanical response of representative strains measured by AFM indentation.
Loading is shown as dark curve and unloading gray. (a) Strain K. Loading follows ABCD and
unloading DCGH. Presence of CSS leads to repulsive barrier BC. Global deformation of cell
along CD shows full elastic recovery. (b) Strain Q. Penetration energy barrier, Upen, is defined as
the shaded area. An extrapolating tangent is defined to exclude energy stored in form of elastic
deformation during indentation of CSS. (c) Strain A. The adhesion energy, Uad, is defined as the
shaded area.
Upen
Uad

65
To find the cellular surface substance (CSS) molecular brush thickness and density, we
resort to the de Gennes’ steric repulsion model [126, 160]. The CSS is treated as a brush of
polymer chains impregnated on the cell surface, while the AFM tip is taken to be a bare rigid
surface. The total mechanical force acting on the tip as it penetrates the CSS is given by
)2
exp( 50 2/3
AFMl
hlRTkF Bsteric
Eqn (3-3)
with kB the Boltzmann constant, T the absolute temperature, RAFM = 10 nm radius of AFM tip,
the effective number density of brush molecules on cell surface, l the equilibrium thickness of
the CSS layer, and h the distance between the bending probe and the deformed cell surface.
Table 3-1 summarizes the measured parameters for all strains under investigation (Percentage
values in the parentheses are deviation).
3.3.3 Tabor’s parameter
In general, large and compliant cells are expected to be more prone to adhesion and
aggregation, especially when the attractive intersurface force is sufficiently strong and the steric
repulsion as a result of thick CCS is minimized. In quantitative terms, a higher propensity to
aggregation with large AI is expected for large Fad, Uad, b1, and b2, and small Frep, Urep, l and E.
For instance, Table 3-1 shows that strains K and Q are less aggregative (small AI) than A and H,
but the four strains have different elastic moduli. It is ideal to derive a universal dimensionless
parameter to collectively combine these measureable quantities. We attempt to modify the
Tabor’s parameter [32, 150], , in classical adhesion and colloidal science to fit the needs.
When two identical solid elastic spheres of radius Rs come into contact under an external
compressive load, F, in the presence of intersurface forces with adhesion energy, in J.m-2, a
contact circle of radius, c, is formed at the interface. In case of strong but short-range forces

66
between two large and compliant spheres in the Johnson-Kendall-Roberts (JKR) limit, the
spheres deform locally at the circular contact edge known as the “neck”, and a critical tensile
load, F* = – (3/2).Rs. is needed to detach the adhering spheres at “pull-off”. In case of weak
but long-range adhesion between two small and hard spheres in the Derjaguin-Muller-Toporov
(DMT) limit, the local deformation “neck” vanishes and the “pull-off” force becomes F* = –
2.Rs.. Tabor and then Maugis [150] derived a dimensionless Tabor’s parameter,
= (9.Rs.2/
8.E2.Z0
3)1/3
, to encompass geometry (Rs), interfacial properties (), intersurface force range (Z0),
and materials properties of the solid (E and = 0.5). A large >> 1 leads to the JKR limit and a
small << 1 corresponds to the DMT limit and the “pull-off” force is bounded between the
upper and lower limits of 3/2 ≤ –F*/ Rs≤ 2. In physical terms,
governs the size of the “neck”
and the contact area at adhesion interface as well as the deformability due to adhesion. In the
present context, a large facilitates the large and compliant cells to deform and aggregate, to an
extent that the resulting multi-cell aggregates conform to a better hydrodynamic streamlined
geometry to resist liquid flow. It is therefore logically expected that a large leads to large AI
and vice versa. Several limitations of the classical description are noted nonetheless. For
instance, bacteria strains comprise glycoprotein shells instead of being homogeneous solids, and
they always take on cylindrical geometry instead of being spherical. To circumvent the fine
mathematical details to deal with exact geometry and micro-structure, a modified Tabor’s
parameter capturing the essential features of the system is defined as
3/1
22
2
2
AFM
23
2 )1(
2
v
R
U
El
b ad Eqn (3-4)
here the cell is taken to be an ellipsoid with the smallest principal radius to be (b2 / 2), replacing
Rs. The adhesion energy is substituted by the effective adhesion energy Uad divided by the

67
contact area with the AFM tip or RAFM2. Surface force range is taken to be roughly the cellular
surface substance thickness, l, in that, from where the AFM tip first senses the presence of
intersurface forces to AFM tip touching cell surface during loading. The elastic modulus is taken
to be some average of the cell wall and cytoplasm of an ideal homogeneous cell. Figure 3-5
shows a strong correlation between AI and . The linear relation justifies to be a reasonable
parameter to correlate the macro- to micro-scale behavior. Simple curve fit yields
2101 log(%) ccAI Eqn (3-5)
with the numerical constants c1 = 33.03 ± 2.24 and c2 = 37.79 ± 2.65. Should of an arbitrary
strain be determined by AFM measurement, the macroscopic aggregation index can be estimated
by Eqn (3-5). A large Tabor’s parameter corresponds to a high propensity to aggregate.

68
Tabor's Parameter,
10-1 100 101 102
Agg
rega
tion
Inde
x, A
I (%
)
0
20
40
60
80
100
SH2SH1
K
Q A
H
Des R2=0.857
Figure 3-5 Linear correlation between Tabor’s parameter, , and aggregation index, AI, for the 7
bacteria strains in DI. Once is obtained by AFM, AI can be deduced from the fitted curve.
3.4 Discussion
Microscopic characterization of single cells using AFM is attractive in the environmental
engineering community. Conventional macroscopic measurements using optical transmission
and packed columns are both expensive and time consuming for the virtually millions of
different bacterial strains in the contaminated sites around the globe. The AFM indentation thus

69
presents a promising method to make sensible and reliable prediction of the macroscopic
behavior of aggregation-transportation of microbes.
In spite of the fair correlation between the micro- and macro- properties via the modified
Tabor’s parameter, caution should be taken. For instance, the intersurface potential at the cell-
cell and cell-substrate interfaces are loosely defined as the attractive force measured by AFM,
rather than resorting to the well established DLVO theory [161]. Spontaneous build-up of
electrostatic double layers on surface of cell and colloidal particles in the presence of an
electrolyte possesses intrinsic primary and secondary potential energy minima separated by a
repulsive energy barrier. Elimelech [146] showed how such surface potential influences the
favorable and unfavorable deposition of microorganisms on silica collector. In case of a high
energy barrier, the particles are trapped only by the secondary minimum. Depending on the
degree of thermal agitation in terms of kBT, the particle may only stay on the collector surface
temporarily, and deposition becomes unfavorable. By adjusting the ionic strength of the solution,
the energy barrier can be lowered to an extent that the particle can overcome and reach the
primary potential minimum. Since the energy well is deep, the particle with limited thermal
energy is permanently trapped and thus raises the macroscopic deposition rate. Elastic
deformation of the particle or cell therefore relies on the full surface potential, rather than the
simple description portrayed by the new Tabor’s parameter. The above description is also correct
for cell-cell adhesion-aggregation, since the electrostatic double layers are also present on the
cell surface.
As a last remark, the adhesion energy in Eqn (3-4) should strictly represent direct cell-
cell adhesion. But since it is difficult to get the direct adhesion measurement, we take it as the
adhesion between silicon AFM tip and cell surface which is a closely related quantity as = (Si

70
cell)1/2
[161]. By adopting such simple model, the new Tabor’s parameter is useful not only in
aggregation of homogenous bacterial strains, but is also applicable to dissimilar and
heterogeneous strains, as well as collectors such as sand and mica.
3.5 Conclusion
A new dimensionless Tabor’s parameter is derived to account for the combined
microscopic mechanical and adhesion properties of single bacteria strain. It bears a strong
correlation with the macroscopic cell aggregation behavior for seven vastly different strains of
environmental relevance. The work presents an important preliminary step to incorporate
fundamental surface science and solid mechanics into the subject of bacteria adhesion-
aggregation-transportation, improving the conventional empirically driven approach for
predicting microbial attachment and transportation in porous medium.

71
Table 3-1 Summary of bacterial materials and surface properties.
Strain SH2 SH1 Des K Q A H
Species
S.
Putrefaciens
CN32 (Gram-
negative)
S. Oneidensis
MR-1 (Gram-
negative)
Desulfovibrio
Vulgaris
(Gram-
negative)
Comamonas
testosteroni (Gram-
negative)
Aeromonas
punctata (Gram-
negative)
Raoultella
ornithinolytica (Gram-
negative)
Bacillus
cereus (Gram-
positive)
Aggregation index, AI (%)
12 ± 4
(33.3%) 21 ± 4
(19.0%) 29 ±7
(24.0%) 51 ± 2 (3.9%)
60 ± 2 (3.3%)
72 ± 3 (4.2%)
88 ± 12 (13.6%)
Equivalent aggregate
diameter, d (µm) 1.04 ± 0.44
(42.3%) 2.2 ± 1.1
(50%) 3.0 ± 2.2 (73.3%)
4.01 ± 2.6 (64.8%)
4.2 ± 2 (47.6%)
4.9 ± 2.5 (51%)
19 ± 10 (52.6%)
Aggregation number
Estimation, N 2.3 ± 0.6 (26.1%)
6.2 ± 2.1 (33.9%)
8.1 ± 2.7 (33.3%)
11.3 ± 3.5 (30.9%)
13.7 ± 6.2 (45.3%)
14.7 ± 3.8
(25.8%) 183 ± 28.9
(15.8%)
Elastic modulus, E (kPa)
559 ± 72.1 (12.9%)
415 ± 38.2 (9.2%)
380 ± 31.9 (8.4%)
337 ± 69.1
(20.5%) 244 ± 41 (16.8%)
237 ± 42
(17.7%) 105 ± 4 (3.8%)
Adhesion energy, Uad (10
-18J)
4.4 ± 0.5 (11.4%)
41.85 ± 8.1 (19.3%)
111.5 ± 10.1
(9.1%) 43.9 ± 9 (20.5%)
40.4 ± 6 (14.8%)
197.1 ± 11 (5.6%)
300 ± 38.1 (12.7%)
Adhesion force, Fad
(nN) 0.012 ± 0.001
(8.3%) 0.074 ± 0.01
(1.4%) 0.124 ± 0.01
(8.1%) 0.088 ± 0.018
(20.5%) 0.077 ± 0.011
(14.3%) 1.22 ± 0.068
(5.6%) 2.89 ± 0.366
(12.7%)
Penetration energy,
Upen (10-18
J) 209 ± 11.9
(5.7%) 116 ± 10.9
(9.4%) 522 ± 20.9
(4.0%) 249 ± 21.9
(8.8%) 578 ± 124.8
(21.6%) 19.6 ± 2.9 (14.6%)
26.6 ± 5.1 (19.2%)
Penetration force, Fpen (nN)
0.58 ± 0.03 (5.8%)
0.21 ± 0.02 (9.5%)
0.58 ± 0.02 (3.4%)
0.50 ± 0.04 (8.0%)
1.10 ± 0.24 (21.8%)
0.12 ± 0.02 (16.7%)
0.26 ± 0.05 (19.2%)
Thickness of CSS, l (nm)
360 ± 13.3 (3.7%)
568 ± 25 (4.4%)
900.5 ± 29 (3.2%)
500 ± 34 (6.8%)
524 ± 50 (9.5%)
161.5 ± 40 (24.7%)
103.8 ± 22.9 (22.1%)
Density of CSS, (molecules/m
2)
1590 ± 289.4 (18.2%)
2800 ± 128.8 (4.6%)
2670 ± 397.8 (14.9%)
3980 ± 1198 (30.1%)
9700 ± 1299 (13.4%)
9770 ± 2892 (29.6%)
12600 ± 2797.2 (22.2%)
Length, b1 (µm) 0.88 ± 0.12
(13.6%) 1.15 ± 0.41
(35.6%) 1.47± 0.39
(26.5%) 2.06 ± 0.27
(13.1%) 1.28 ± 0.70
(55.0%) 1.58 ± 0.39
(24.6%) 2.16 ± 0.31
(14.3%)
Width, b2 (µm) 0.42 ± 0.07
(16.6%) 0.51 ± 0.07
(13.7%) 0.594 ± 0.1
(16.8%) 0.54 ± 0.15
(27.8%) 0.78 ± 0.15
(19.2%) 0.80 ± 0.09
(11.3%) 0.73 ± 0.06
(8.2%)
Tabor’s parameter, µ ±
±
±
± 0.12
(12.7%) ± 0.11
(9.2%) 11.4 ± 0.41
(3.6%) 39.3 ± 3.3
(8.3%)

72
Chapter 4 Extended Correlation for Single Bacterial Microscopic
Mechanical Properties and Macroscopic Deposition-Transportation Behavior
in Porous Medium Using Dimensionless Tabor’s Parameter
4.1 Introduction
Microbe-mediated contaminant transformation and immobilization is the basis for many
in-situ bioremediation technologies and natural attenuation mechanisms such as those for
remediating radio-nuclides and metals (e.g. uranium, chromium and technetium [133, 146]). The
ability to model and predict the fate and transportation of microorganisms in granular porous
medium is currently lacking and there is an urgent need to establish mechanistic microbial
transportation model that is applicable for: (i) in-situ or enhanced subsurface bioremediation
[162], (ii) engineered (sand filters) and natural (riverbank) filtration for water and wastewater
treatments (Figure 4-1) [163], (iii) pathogen migration in drinking water well supplies [133], (iv)
microbe-mediated pollutant dissipation applicable to natural disaster. Sustainable technologies
such as sand / riverbank filtration hold the most viable way to obtain clean water. However, their
application is hampered due to the lack of a comprehensive understanding of the underlying
physics-chemistry-mechanics that governs microbial adhesion-transportation. Filtration is a
proven process that relies on filtering the microbes and bacteria by soil / sand particles, and its
effectiveness depend on the soil type, temperature, flow rate and ionic strength of the
transportation medium and the bacterial strains. Though adhesion is the primary mechanism for
bacterial filtration, the multi-dimensional nature is poorly understood.
Bacterial adhesion is a complicated process influenced by many factors, such as the
bacterial material properties, the substrate characteristics, and the environmental factors. The

73
ionic strength of electrolyte has great effect on bacterial adhesion and flocs stability in
wasterwater activated sludge system due to the change in magnitude and range of intersurface
forces [164-166]. Under controlled laboratory condition, the initial adhesion of the bacterial cells
onto solid surfaces in aquatic system is generally thought to be similar to that of depositing
colloidal particles. For such cases, classic Derjaguin-Landau-Verwey-Overbeek (DLVO) theory
has been applied to explain the attachment behavior [167-169]. Specifically, DLVO theory states
that the interactions between a colloidal and a collector surface can be expressed as the sum of
attractive van der Waals and repulsive electrostatic double layer interactions. The result is the
surface potential showing a primary and a secondary minima separated by an energy barrier (see
later section in Figure 4-3). The corresponding intersurface forces now comprise a short-range
and a long-range attraction separated by an intermediate repulsion. An increase in ionic strength
reduces the electrostatic double layer repulsive forces and hence increases bacterial retention
possibility.
Culturing time is another great factor to influence cell surface biochemical properties and
subsequently cell migration and transportation behavior in porous medium. When bacteria are
inoculated in a batch culture medium [170], the bacterial population goes through several distinct
growth phases. Once adapted to the medium during lag phase, the cells enter the exponential
growth phase, during which they grow and divide at a maximal rate for the species under the
existing conditions. After the available nutrients are exhausted, due to nutrients depletion and
waste products accumulation, the bacterial culture enters stationary growth phase, and then the
majority of parental cells die during death phase. The protein expression profiles shows that only
10% of the proteins are always expressed at the same level in all phases [171]. For example, it
has been established that the predominant functional groups exposed on the outer membrane of

74
Escherichia coli (E. coli) include amino and carboxyl on proteins as well as phosphate and
carboxyl on both lipopolysaccharide (LPS) and extracellular polymeric substances (EPS)-
associated carbohydrates [172]. The extent of protein coverage [173], EPS coverage [174] and
LPS conformation [175] evolve as a function of growth stage and thus contribute to the chemical
heterogeneity of the bacterial surface. The influence of bacterial growth stage on cell deposition
kinetics has been examined using a mutant of Escherichia coli K12 [176]. The cells in stationary
phase are notably more adhesive than those in mid-exponential phase [177].
In previous chapter, the surprisingly strong correlation between modified dimensionless
Tabor’s parameter, and aggregation index, AI, has already demonstrated [178]. This chapter
further explores and verifies the modified Tabor’s parameter for correlation, quantification and
predication macroscopic microorganism deposition-transportation behavior in porous medium
based on microscopic individual cell mechanical properties for 6 different bacterial strains
including both Gram-positive and Gram-negative cells with a wide range of cell morphology,
dimension, surface characteristics and deposition-transportation propensity. The microscopic
single cell mechanical properties are characterized by the well established AFM techniques, and
the macroscopic attachment efficiency is determined by the standard flow-through packed
column test. There 6 strains are investigated in KCl electrolytes with a range of ionic
concentration (1 mM, 3 mM and 10 mM), rendering different interfacial force. To consider the
culturing time influence on bacterial micro-scale mechanical adhesion properties and macro-
scale transportation kinetics, three different incubation times (exponential growth phase,
stationary growth phase and 48-hour-old growth to investigate starvation effect) are studied on
two distinct strains (Gram-positive: Bacillus cereus and Gram-negative: Aeromonas punctata). A
multi-scale correlation is shown finally.

75
Figure 4-1 Riverbank filtration to remove microbes and other contaminants by porous medium of
sand to improve water quality in a sustainable way. Process involves biodegradation,
precipitation, sorption, and dilution.
4.2 Methods and materials
This project is collaborated with Prof. April Z. Gu in Environmental Engineering at
Northeastern University. The results shown in this chapter were partially done by Prof. Gu’s
group, including bacterial equivalent diameter measurement, all microbial -potential
characterization, and the packed column test with exception of strain A in 1 mM, 3 mM, 10 mM
and strain Q in 1 mM, 10 mM KCl electrolytes. We are also grateful to Dr. Christopher Schadt at
U.S. DOE for providing the Shewanella and Desulfovibrio strains, and Dr. Yanru Yang at East
Bay Municipal Utility District for all the other isolated strains.
4.2.1 Bacterial strains culture
The six bacterial strains to be investigated are:
(i) Shewanella putrefaciens CN32 (SH2): Gram-negative and anaerobic strain.
(ii) Shewanella Oneidensis MR-1 (SH1): Gram-negative and anaerobic strain.
(iii) Desulfovibrio vulgaris (Des): Gram-negative and anaerobic strain.
(iv) Aeromonas punctate (Q): Gram-negative and aerobic strain
(v) Raoultella ornithinolytica (A): Gram-negative and aerobic strain.
(vi) Bacillus cereus (H): Gram-positive and aerobic strain.

76
These strains have considerable environmental relevance to bioremediation or water
quality [151, 179, 180]. SH1 and SH2 were grown anaerobically in Luria-Bertani (LB) medium
(25 g/L) with 10 mM sodium fumarate (1.6 g/L) as electron acceptor and 10 mM sodium lactate
as electron donor. Des was grown anaerobically in ATCC medium 1249, modified Baar’s
medium for sulfate reducers. These three anaerobic strains were grown in a glove box at 30°C
(Coy Laboratory Products, Grass Lake, MI) with an atmosphere of 5% hydrogen/nitrogen
balance. Strain H, A and Q were grown aerobically at 37 °C in 25 g/L Luria-Bertani (LB)
medium (Sigma-Aldrich, Inc., St. Louis, MO).
Three different culturing times were used to investigate bacterial micro-scale adhesion
properties and macro-scale transportation kinetics, namely, exponential growth phase, stationary
growth phase and 48-hour-old growth on two distinct strains (Gram-positive: Bacillus cereus and
Gram-negative: Aeromonas punctata). To determine growth curve, strain Q and H were grown
aerobically at 37 °C in 25 g/L Luria-Bertani (LB) medium (Sigma-Aldrich, Inc., St. Louis, MO)
using the plate reader (Synergy HT Multi-Mode, Biotech, Winooski, VT) and were exposed to a
beam of laser with wavelength = 660 nm to measure the optical density (OD) at 30-minute
intervals during 19-hour successive culture, as an index of increasing cellular number. The
growth rate was calculated based on the measured optical density (OD) as a function of growth
time. Exponential ODexpo was determined at the point where the growth rate was maximum in
exponential phase and the stationary ODstat when growth curve reached plateau. Due to larger
volume cell solution needed for measurements, the 200 mL bacterial population was grown in
500 mL flake at 37 °C in 25 g/L Luria-Bertani (LB) medium. Microbial growth curve was
slightly different using different volume culture container, thus the culture times of exponential
and stationary phase in flask were determined when OD reached the known ODexpo and ODstat. 3

77
mL bacterial culture was moved from the flask and put into 1 cm flow-through cell for UV
absorbance measurement at an interval of 30 min during the whole culturing period. The flask
was mechanically agitated to maintain aerated bacteria in suspension before extraction. The
bacterial population in the culture was estimated by measuring its turbidity with a UV-visible
spectrophotometer (Model UV Mini 1240 Shimadzu, Kyoto, Japan) at wave length = 660 nm.
Final exponential and stationary sampling times used in the tests for strain Q and H were roughly
6 ~ 8 hours and 18 hour. The study of starvation effect on microbial adhesion and transportation
was performed using 48-hour-old culture since inoculation. For the other four strains used in the
experiments, growth curves were obtained using the same method. Sample cells were grown
until reaching the stationary growth phase and then were harvested for use. 100 mL of aliquot
suspension was pipetted out of the flask for packed column test and another 50 mL suspension
for AFM mechanical characterization.
4.2.2 Bacteria characterization and cell surface properties analysis
To determine cell dimension, the cells were stained with 1 g/mL 4',6-Diamidino-2-
phenylindole (DAPI) for 10 min, and then observed using fluorescent microscope (Zeiss, Axio
Imager M1-1) [181]. Single cell lengths and widths were determined with the analytical software
AxioVision Rel4.8 based on measurements of at least 20 cells for each strain. All strains possess
similar prolate geometry with circular cross-section. The diameter of a circle having the same
area as bacterial cigar shape projection was taken as the equivalent cell diameter dp. A Zetasizer
Nano ZS90 (Malvern Instruments, Southborough, MA) was used to measure electrophoretic
mobility of bacterial suspension. Surface potential was approximated by the -potentials, which
was from the electrophoretic mobility using the Smoluchowski approximation [182].

78
4.2.3 Flow-through packed bed column test
Figure 4-2 is the schematic of flow-through packed bed column test. Silica sand
GRANUSIL 4095 (UNIMIN corporation, LeSueur, MN) with nominal diameter of 0.289 mm
was utilized as collector in the column test, which was pre-cleaned with 1 M NaOH for 24 hours,
rinsed with DI water, dried in an oven at 103 °C for 24 hours followed by drying in 550 °C oven
for 1 hour before use. Suspension of bacteria was pumped through a 60 cc sterile syringe (inner
diameter of 2.67 cm) packed with clean silica sand to a height of 10.7 cm [184]. Standard
gravimetric methods were used to determine the silica sand density (2.65 g/cm3) and a column
packing porosity of 0.4. 100 mL of cells were centrifuged at 6000×g for 5 minutes and
resuspended in 100 mL of the electrolytic solution with desirable ionic strength. Prior to each
deposition measurement, the packed column was equilibrated by pumping 20 pore volumes of DI
water, followed by 10 pore volumes of the background electrolyte through the column at
constant flow rate of 5 mL/min (superficial velocity U = 0.015 cm/sec). The background
electrolyte used in this study was KCl electrolyte solution with concentration of 1 mM, 3 mM
and 10 mM. A suspension of bacteria in the same background electrolyte was pumped for 3~4
pore volumes, followed by pumping bacteria-free background electrolyte (about 3 pore volumes)
at the same rate. A constant influent particle concentration, Co, was maintained by including a
miniature magnetic stir bar in the bacteria solution tank and the influent cell concentration at the
column inlet was measured every 1/2 of a pore volume in 3 mL glass vials. The optical density
of bacteria at the column outlet was real-time monitored at = 500 nm in 1 cm flow-through cell
by a UV-visible spectrophotometer (Model UV Mini 1240 Shimadzu, Kyoto, Japan). Because of
possible differences in surface properties between individual strain cultures, packed column tests

79
were generally repeated three times in the background electrolyte solution at each ionic
concentration.
Figure 4-2 Schematic of standard flow-through packed bed column test.
To quantitatively compare the experiments conducted with six different bacterial strains
in electrolytes with three different ionic concentrations, values of the attachment efficiency, α,
were calculated. The attachment efficiency, α, is defined as the ratio of experimental bacteria
(denoted by subscript p)-sand collector (denoted by subscript c) removal efficiency (η) to the
theoretical single sand contact efficiency (ηo), evaluated from solution of the convective-
diffusion equation in the absence of repulsive interaction energies [185] ,
0
Eqn (4-1)

80
It approaches unity when bacterial-sand interactions are fully absent from repulsion and
is much smaller than 1 under conditions of repulsive interactions predominance. The single sand
removal efficiency, η, can be determined from each breakthrough curve as follows [146],
)ln()1(3
2
0C
C
L
dc
Eqn (4-2)
with dc the diameter of the quartz sand (dc = 0.289 mm), ε the bed porosity (ε = 0.4), and L the
packed column length (L = 10.7 cm). The normalized microbial effluent concentration, C/Co, is
obtained from each packed column breakthrough curve by averaging the values measured
between pore volumes of 1.8 ~ 2 (510 < t < 570) [186]. Thus attachment efficiency, α, is
determined based on breakthrough curve. Values of ηo for each strains are determined using the
expression of [146]
053.011.124.0125.0675.1052.0715.0081.03/1
0 22.055.04.2 vdWGRARSvdWPeRS NNNNNANNNA Eqn (4-3)
where
Porosity-dependent parameter:
65
5
2332
)1(2
sA
Eqn (4-4)
Aspect ratio:
c
p
Rd
dN
Eqn (4-5)
Peclet number:
D
UdN c
Pe
Eqn (4-6)
van der Waals number:
Tk
AN
B
vdW
Eqn (4-7)
Attraction number:
Ua
AN
p
A 212
Eqn (4-8)

81
Gravity number:
U
gaN
fpp
G
)(
9
22
Eqn (4-9)
with = (1-ε)1/3
, ε the bed porosity (ε = 0.4), dp the bacterial equivalent diameter (dp ~ 1 m,
exact values shown in Table 4-1), dc the collector diameter (dc = 0.289 mm), U the fluid
superficial velocity (U = 0.015 cm/s), D∞ the bulk diffusion coefficient (described by Stokes-
Einstein equation, D∞ = kB.T / (3.dp)), A the Hamaker constant (A = 6.5×10⁻²¹
J), kB the
Boltzmann constant (kB = 1.38×10⁻²³
m2.kg.s
-2), T fluid absolute temperature (T = 296 K), ap
bacterial equivalent radius (ap = dp/2), p the bacterial medium density (p = 1050 kg/m3), f the
fluid density (f = 1000 kg/m3), the absolute fluid viscosity ( = 1.002 ×10
-3 N.s/m
2), and g the
gravitation acceleration (g = 9.81 N/s2).
4.2.4 Atomic force microscopy
There was triangular silicon nitrate AFM cantilever with silicon tip used in the
experiments (Type V MAC Levers, Agilent Technologies, US). The deflection sensitivity was
calibrated by repeated contact mode indentation on a freshly cleaved muscovite mica surface in
air with sweep duration of 1.04 s, and the spring constant was found to be k = 0.276 ± 0.02 N.m-1
by the Cleveland method [124]. A 50 mL strain suspension in the investigated growth phase was
pelleted by centrifugation, washed in the same volume of background electrolyte solution,
pelleted a second time, and promptly resuspended in 10 mL background electrolyte solution (1
mM, 3 mM or 10 mM KCl). Based on microbial immobilization method [61], 1 mL suspension
of bacteria culture was pipetted onto a gelatin treated cleaved mica disk (Sigma #G-6144) for
AFM indentation. Force measurements were repeated on mica surfaces before and after probing
the bacteria samples to ensure minimal contamination of the silicon AFM tip. A typical cell was

82
identified by large scan size with low resolution using MAC (Magnetic Alternating Current)
mode. The AFM tip was then repositioned over the cell center, before switching from tapping to
contact mode for indentation. Applied load, F, was measured as a function of the vertical
displacement of AFM tip, y. The mechanical response, F(y), was obtained for loading-unloading
(compression-tension) of the tip. At least 10 loading-unloading cycles were performed at
different locations close to the center on each cell and at least 15 cells were characterized in each
batch.
4.3 Results and analysis
4.3.1 Cell surface properties characteristics
Table 4-1 summarizes the distinct surface characteristics of 6 strains. All samples possess
similar prolate geometry with an equivalent diameter ranging from 0.9~1.5 μm. The -potentials
of six strains and sand collector taken from [188] as a function of ionic strength are also
presented in Table 4-1. Both the cell and sand collector are negatively charged and their -
potentials become less negative with increasing ionic strength. Measured -potentials are used
later to calculate DLVO interaction energy profiles for the bacteria-sand system.
4.3.2 DLVO theory
To gain insight into the mechanism responsible for deposition, DLVO theory is used to
calculate the total interaction energy as a bacterial cell approaches to a quartz sand. The total
interaction energy, the sum of attractive van der Waals and repulsive electrostatic double layer
interactions, is calculated by modeling the bacteria-sand system as a sphere-plate interaction.
Bacteria (dp ~ 1 m) are assumed to be uniform spheres which are small compared to sand grains

83
(dc = 0.289 mm). Repulsive electrostatic double layer interaction energies are calculated using
the following equation [189]:
)]}2exp(1ln[)(])exp(1
)exp(1ln[2{
2
220h
h
hdcpcp
pr
EDL
Eqn (4-10)
with ε0 the dielectric permittivity in a vacuum (ε0 = 8.85×10⁻¹²
C.V-1
.m-1
), εr the relative
dielectric permittivity of water (εr = 80.1), dp the bacterial diameter (dp ranging from 0.9 m to
1.5 m as shown in Table 4-1), the inverse Debye length (nm-1
, IS/304.01 ), IS the
ionic strength of the background electrolyte (M), h the separation distance between the bacterium
and the sand surface, p and c the surface potentials of the bacterial cell and sand collector
(Table 4-1and Table 4-2), respectively.
The retarded van der Waals attractive interaction energy is calculated from [190]
1]14
1[12
h
h
dA pH
VDW Eqn (4-11)
with AH the Hamaker constant for bacteria-electrolyte-sand system (AH = 6.5×10⁻²¹
J), and λ the
characteristic wavelength of the dielectric (assumed to be 100 nm).
The total interaction energy is totalEDLVDW The values of -potential used for the
collector (quartz sand) are taken from literature [188] as they are obtained at the same pH and
ionic strengths (Table 4-2). Figure 4-3a shows calculated DLVO interaction energy between
strain SH1 and silica sand collector as a function of separation distance and ionic strength. Figure
4-3b shows a magnified image of a portion of calculated DLVO interaction energy to highlight
the secondary energy minimum for some test conditions. Table 4-3 summarizes the depth of
secondary minimum and energy barrier between the strain and silica sand collector, as well as
the separation for 6 strains under 3 different ionic concentrations. The van der Waals and

84
electrostatic double layer interactions have different dependencies with respect to separation
distance (power-law and exponential, respectively). Bacteria approaching a sand collector would
first experience an attractive force before encountering the significant repulsive energy barrier.
Cells unable to overcome the energy barrier could remain associated with the quartz grain within
the secondary energy minimum unless they had sufficient energy to escape as shown in Figure
4-14. The magnitude of the secondary energy minimum increases with ionic strength rises. For
example, the depth of secondary minimum on strain SH1 ranges from 0.1 kBT at 1 mM to 1.86
kBT at 10 mM, with corresponding separation distances changing from 104.6 to 21 nm (Table
4-3). Because the thermal energy of a bacterium is on the order of 0.5 kBT, the secondary
minimum depths shown in Table 4-3 for ionic strengths at 10 mM should be sufficient to retain
bacterial cells in the packed-bed column. The magnitude of the repulsive energy barrier
decreases as ionic strength rises. Calculation predicts the presence of a substantial repulsive
energy barrier ranges from 478.1 kBT at 1 mM, decreasing due to electrostatic double layer
compression, 385.5 kBT at 3 mM and 185.6 kBT at 10 mM with separation distances changing
from 3.4 nm at 1 mM to 2.0 nm at 3 mM and 1.65 nm at 10 mM KCl.
The depth of the secondary energy minimum as well as the height of the energy barrier
depend on a number of factors, including the surface potentials of both the bacterial cell and the
sand collector (p and c), the range of the electrostatic double layer interaction (inverse Debye
length, ), and the van der waals interactions between the two surfaces (characterized by the
Hamaker constant, AH). A dimensionless parameter that incorporates these factors and
characterizes the interaction energy for unfavorable deposition is formulated as [188]
cpr
HDLVO
AN
0
Eqn (4-12)

85
NDLVO calculated for each ionic strength condition studied is shown in Table 4-3.
The correlations of arrier, 2nd, NDLVO and the bacterial cell attachment efficiency are
not quite good with r2
= 0.18, 0.31 and 0.33. The weak correlations are because DLVO theory
only demonstrates the range and magnitude of interfacial energy between bacteria and silica sand
collector, although that is a significant factor in cell attachment. Cell attachment is a complex
process, which is influent by several factors. For example, soft cells are easy to form streamlined
multi-cell aggregate and more resistant to detach from sand surface. But rigid cells are less likely
to aggregate even in the presence of strong surface forces. In addition, the size of a single cell in
comparison to the surface force range also play a critical role. There is an urgent need one
parameter which can fully account for the combined effects of cell wall stiffness, deformation
mode, magnitude and range of surface forces, and cell size and geometry.
Table 4-1 Cell surface characterization.
Bacteria strain
SH2
Gram-
negative
SH1
Gram-
negative
Des
Gram-
negative
Q
Gram-
negative
A
Gram-
negative
H
Gram-
positive
Bacterial
equivalent
diameter, dp (m)
1.2 ± 0.2 1.6 ± 0.3 0.9 ± 0.1 1.5 ± 0.2 1.5 ± 0.2 1.5 ± 0.2
-
potential
in KCl,
p
(mV)
1mM -30 -18.3 -43.5 -22.8 -39.6 -24.3
3mM -29.9 -18.4 -37.1 -21.5 -33 -21.6
10mM -28.2 -16.9 -25.4 -20.3 -23 -17.5
Table 4-2 -potential of sand collector [188].
KCl electrolyte concentration 1 mM 3 mM 10 mM
-potentialofsand collector in
electrolytec(mV) -38.5 -30.8 -22.2

86
Seperation Distance, h (nm)
0 10 20 30 40
Tot
al In
tera
ctio
n E
nerg
y,
tota
l(k B
T)
-200
0
200
400
600
EDL Repulsion
vdW Attraction
1mM KCl
3mM KCl
10mM KCl
(a)S. oneidensis MR-1
vdW Attraction
EDL Repulsion
Seperation Distance, h (nm)
0 20 40 60 80 100
Tot
al In
tera
ctio
n E
nerg
y,
tota
l(k B
T)
-6
-4
-2
0
2
4
6
EDL Repulsion
vdW Attraction
1mM KCl
3mM KCl
10mM KCl
(b)
S. oneidensis MR-1
Figure 4-3 DLVO interaction energy. (a) Calculated DLVO interaction energy between SH1 and
silica sands as a function of separation distance, h, and ionic strength, IS. (b) Magnified image of
the above profile to highlight the secondary energy minimum for some test conditions.
Energy Barrier
2nd min
1st min

87
Table 4-3 Depth and separation of secondary minimum and energy barrier for the total
interaction energy profiles between strains and silica sands in KCl electrolyte with a wide range
of ionic concentrations.
Strain
KCl electrolyte
concentration
(mM)
Energy Barrier Secondary Minimum NDLVO
total (kB.T) h (nm) total (kB.T) h (nm)
S. Putrefaciens
CN32
(SH2)
1 814.02 1.6 -0.07 111.1 0.83
3 597.22 1.3 -0.27 54.6 1.79
10 142.48 1.7 -1.43 21.1 4.82
S. Odenensis
MR1
(SH1)
1 478.12 3.4 -0.10 104.6 1.35
3 385.53 2.0 -0.40 50.7 2.92
10 185.57 1.7 -1.86 21.1 8.04
Desulfovibrio
vulgaris
(Des)
1 989.81 1.2 -0.05 115.8 0.57
3 594.02 1.2 -0.20 56.3 1.45
10 208.15 1.3 -0.99 23.0 5.35
Aeromonas
punctata
(Q)
1 752.92 2.2 -0.10 108.3 1.09
3 484.64 1.7 -0.37 52.0 2.50
10 191.88 1.7 -1.79 21.2 6.69
Raoultella
ornithinolytica
(A)
1 1410.81 1.3 -0.08 114.6 0.63
3 823.94 1.2 -0.33 55.3 1.63
10 284.87 1.3 -1.60 22.5 5.91
Bacillus cereus
(H)
1 684.04 2.4 -0.10 107.5 1.02
3 484.70 1.7 -0.38 52.0 2.48
10 245.89 1.5 -1.72 21.9 7.76

88
4.3.3 Bacterial packed-bed transportation behavior from column test
Figure 4-4 is representative breakthrough curve for strain Q suspension in 3 mM KCl at
48-hour-old starvation situation, showing the deposition and transportation behavior of microbial
cells in the flow-through packed saturated sand column. In this breakthrough curve, the
microbial efflux concentration (C/C0) is plotted as a function of time needed for bacteria to pass
through the column. Initially, the column is stabilized by 20 pore volumns DI followed by 10
pore volumns cell-free KCl with desirable concentration (1 mM, 3 mM or 10 mM). A suspension
of bacteria in KCl electrolyte is pumped into packed sand column at t = 0 with flow rate of 5
mL/min (point A). After approximately 1 pore volume (~287.6 s), the injected bacteria cells
break through the packed column and are detected at the outlet (point B). As time increasing,
more bacteria cells are monitored at x = L and the microbial efflux concentration dramatically
increases along BC. The stronger the adhesive interaction with sand and the longer the cells
travel along the column, the more likely the bacterial cells are revomed from medium and
retained onto the sand surface, leading the lower microbial efflux concentration measured in the
test. e.g. the value of C/C0 is ~ 0.9 at C indicating 10% of the whole bacterial cells pumping into
column are attaching on the sand surface due to interfacial force. The deposition behavior of
each packed column breakthrough curve is represented by averaging the C/C0 values between
pore volumes of 1.8 ~ 2 (510 s< t< 570 s) as shown in the shadow area of Figure 4-4. When
attachment equilibrium is established between bacterial cells and sand, breakthrough curve
reaches plateau along CD. After approximately 3~4 pore volumes bacterial suspension, the
influx is switched to a bacterial-free KCl solution with the same concentration at point D. The
concentration of bacteria in the effluent increases a little bit along DG and then dereases
dramatically along GH. The slight increase is believed due to weaker cell-cell interaction after

89
influx switching. There is no microbial cells monitored in the efflux at x = L (point H), indicating
the microbial suspension is totally replaced by cell-free KCl solution in the packed column.
Figure 4-5 is representative breakthrough curves conducted with 6 strains in flow-through
packed bed column with silica sand in 3 mM KCl electrolyte under the same flow rate, indicating
diverse microbial deposition-transportation behavior of different strains. The strains are ranked
as Des < SH2 < A < SH1 < Q < H in terms of attachment efficiency based on this figure. It is
noted that the breakthrough curves strain A, Q, H and SH1 exhibit an monotonic increasing
function of time. The possible explanations for the deposition rate decreasing as time on these
three strains inlcude “blocking” impact that deposited bacteria may prevent the further
attachment as the fraction of sand surface covered by cells increases [191], simultaneous
bacterial deposition and release [192], colloid / microbial collisions that knock off weakly
associated cells from the collector surface [193] and etc. Simultaneous cell deposition and
detachment in this case is unlikely to be the major reason, because except for strain Q, no
obvious concentration “tailing” [133], an excessively long tail indicating very slow release, is
observed in the breakthrough curves for other strains. There are many other factors affecting
bacterial deposition, including surface roughness of sand collector, heterogeneity of surface
charge of both sand and cell, and bacterial straining. Straining is the trapping of colloid particles
in the downgradient pore throats that are too small to allow particle to pass [194]. It could play a
significant role when the ratio of bacterial equivalent diameter to the sand collector, dp/dc, is
greater than 0.0017 [195]. The single cell-collector size ratio, dp/dc, for these 6 strains is
determined to be 0.005. Thus, for these strains that tend to form aggregates, physical straining
could play a very important role in their deposition process [196].

90
The macroscopic deposition and transportation behavior in different ionic concentrations
electrolyte is systematically examined in saturated and packed beds of highly cleaned quartz
sand grains. Typical breakthrough curves demonstrating the influence of ionic concentration on
strain Q are present in Figure 4-6. As the ionic concentration of KCl electrolyte increases, the
diffuse double layers are compressed causing a reduction in the repulsive electrostatic double
layer forces and an increase in the bacterial deposition rate. For example, at the lowest ionic
strength examined (1 mM), the normalized initial bacterial cell breakthrough concentration C/C0
(at about pore volume of 1.8~2) shown in Figure 4-6 is 0.59. As the ionic concentration of the
pore fluid increasing, bacterial retention in the column increases and the normalized initial
breakthrough concentration declines, from 0.49 at 3mM to 0.26 at 10 mM.
Transportation kinetics behavior of bacteria with sampling time is also investigated on
strain strain Q (gram-negative) and strain H (gram-positive). Figure 4-7 is the different
transportation behavior of strain Q at exponential phase (6~8 hours), stationary phase (~18 hours)
and 48-hour-old growth stage in electrolyte with ionic concention of 3 mM. As shown, C/C0 is
0.415 at exponential phase, 0.49 at stationary phase and 0.86 at 48-hour-old growth stage. There
is no obvious difference in transportation kinetics for the cells at exponential and stationary
phase, but 48-hour-old growth cells are substantially less adhesive than the other two growth
phases cells, which means starvation leads to a significant increase in cell mobility and decrease
in retention.
Attachment efficiency, is used to quantify each breakthrough curve as a function of
bacterial strain, ionic strength and sampling time shown in Table 4-4. The observed deposition
behavior follows the trend predicted by the DLVO theory. Take an example of strain Q, the
attachment efficiency, , increases from 0.416, to 0.556 and 0.964 as KCl ionic concentration

91
increasing from 1 mM to 3 mM and 10 mM. of cells with 48-hour-old culture ( = 0.146) is
much smaller than that exponential ( = 0.613) and stationary ( = 0.556) growth phases. To
make the concept of attachment efficiency more tangible, distances of bacterial transportation are
estimated based on determined from flow-through packed sand column tests,
)ln()1(3
2
00 C
CdS c
Eqn (4-13)
with S the travel distance estimation for 99% of C0 bacteria retention in the porous medium
(presented in Table 4-4), dc the diameter of the quartz sand (dc = 0.289 mm), the bed porosity
( = 0.4), 0 theoretical single sand contact efficiency, C0 and C are initial and final bacterial
concentrations. The longer the travel distance estimated, the less likely the microbial cells are
attached onto the sand surface due to interaction force.

92
Time, t (s)
0 500 1000 1500 2000
Mic
robi
al E
fflux
Con
cent
ratio
n, C
/C0
0.0
0.2
0.4
0.6
0.8
1.0
Bac
teria
Influ
x
Firs
t Bac
teria
Arr
ive
at x
= L
KC
l Inf
lux
A B
DG
H
C
Figure 4-4 Representative breakthrough curve of strain Q in 3 mM KCl with 48-hour-growth
showing the deposition and transportation behavior in the flow-through packed sand column.

93
Time, t (s)
0 500 1000 1500 2000 2500 3000
Mic
robi
al E
fflux
Con
cent
ratio
n, C
/C0
0.0
0.2
0.4
0.6
0.8
1.0
SH2
SH1
Des
Q
A
H
Figure 4-5 Representative breakthrough curves of strain SH2, SH1, Des, Q, A and H in flow-
through packed sand column with ionic concentration of 3 mM.

94
Time, t (s)
0 500 1000 1500 2000 2500 3000
Mic
robi
al E
fflux
Con
cent
ratio
n, C
/C0
0.0
0.2
0.4
0.6
0.8
Stationary Stage
in 1 mM KCl
Stationary Stage
in 3 mM KCl
Stationary Stage
in 10 mM KCl
Aeromonas Punctata (Q)
Figure 4-6 Representative breakthrough curves of strain Q in packed sand column in electrolyte
with a wide range of ionic concentration (1 mM, 3 mM and 10 mM).

95
Time, t (s)
0 500 1000 1500 2000 2500 3000
Mic
robi
al E
fflux
Con
cent
ratio
n, C
/C0
0.0
0.2
0.4
0.6
0.8
1.0
Exponential Stage
(6~8 hours)
in 3 mM KCl
Stationary Stage
(~18 hours)
in 3 mM KCl
24-hour-old Growth
Stage in 3 mM KCl
Aeromonas Punctata (Q)
Figure 4-7 Representative breakthrough curves of strain Q using 3 different sampling times in
flow-through packed bed column with silica sand in 3 mM KCl electrolyte.
4.3.4 AFM indentation
For the mechanical response studied on each bacterial strain in electrolyte with desirable
ionic concentration, the interaction forces during the approach of a silicon AFM tip to the
bacterium are measured, as well as the adhesive energy needed to totally detach AFM tip from
bacterium surface. Figure 4-8 shows typical AFM force-displacement curve of strain Q in 3 mM
KCl electrolyte solution. When the AFM tip is relatively far away from cell sample, the
interaction force is so weak that the measured force is set to base line for apparent “zero” load
(path AB). Upon further loading, AFM touches cellular surface substance (CSS) at point B and

96
penetrates the whole layer along path BC. The length of BC corresponds to the equilibrium
thickness of CSS. Figure 4-9 is amplitude topological AFM scans of strain Des in ambient air
showing long cell surface substance (CSS) on bacterial surface. It exhibits significantly longer
force range compared to the others five strains. The presence of bacterial CSS causes steric
repulsion between the bacterium and the tip. The forces are quantified using the de Gennes’
repulsive model [126, 160] for interactions between CSS layer and a bare silica AFM tip. The tip
induces global deformation to the cell along path CD, from which cell elastic modulus is
calculated based on classical Hertz-Sneddon model [160]. Figure 4-10 shows curve fitting of
loading curve for elastic modulus of strain A in KCl electrolyte with ionic strength of 3 mM.
After reaching the desirable indentation depth, the AFM tip retracts from cell surface upon
unloading curve and the cell gradually resumes the original shape. The hysteresis between
loading and unloading shown in Figure 4-8 is due to the AFM piezo scanner drawbacks of creep,
hysteresis and non-linearity. When tip is released from cell surface, it travels back along CSS
layer. The applied force becomes tensile along path FG. The observed sawtooth pattern is due to
sudden detachment of CSS from AFM tip. A distribution of adhesion peaks between the AFM tip
and the bacterial CSS layer during separation is observed in all conditions, which mainly reflects
the bacterial surface heterogeneity. The adhesion energy, Uad, the total work needed to fully
detach AFM tip from cell surface or CSC layer, is defined by the shade area in Figure 4-8.
The elastic modulus of cell wall under cell inner tugor pressure, the range and magnitude
of the overall attractive surface forces holding cell and AFM tip together, and CSS length and
density on bacterial surface, can be tested from AFM force measurement. A summary is shown
in Table 4-4.

97
For the same bacterial strain but in different electrolyte environment, the mechanical
properties are changed slightly. The thickness of CSS layer decreases and the density increases
with increasing IS (ionic strength) in electrolyte whereas the total amount of CSS on the bacterial
surface (estimated as l) is nearly constant and not dependent on IS for the same strain at the
stationary growth stage. Bacterial cells are always cultured under the same conditions, and
therefore, the total amount of CSS should not vary as the ionic concentration in electrolyte. But
the values of bacterial adhesion energy are strongly dependent on the IS in electrolyte solution.
Figure 4-11 is unloading curve of strain SH2 in KCl solution with different IS (1 mM, 3 mM and
10 mM). When an AFM tip contacts a bacterial surface, an attractive force that holds the tip at
the bacterial surface, leading adhesion energy needed to fully detach AFM tip from bacterial
surface. This surface force is the combination of both DLVO forces and long-range steric forces
due to the presence of CSS. At low electrolyte concentration, the depth of secondary minimum is
very shallow and two attractive minimums are separated by a large repulsive barrier as well as
large steric repulsion due to random CSS, and therefore, the combined attractive force is very
low. However, at higher electrolyte concentration, the secondary minimum is much deeper and
the repulsive barrier is drastically reduced as well as lower steric repulsion due to compressed
CSS, and therefore, more energy is needed to retract the AFM tip from the interaction with
bacterial surface. In summary, the random brush layer in low electrolyte solution is extended due
to electrostatic repulsion, and therefore, steric repulsion between AFM and bacterium is high.
These properties resulted in low adhesion between CSS and the silicon AFM tip. But in high
electrolyte solutions, a compressed and much denser CSS layer, as well as a less negative
electrophoretic mobility for the bacterium, resulted in higher adhesion forces between the
biopolymers and the AFM tip. Ion in the media affects the behavior of charged CSS layer in

98
ways beyond the description by DLVO theory. Electrostatic interactions affect the conformation
of the CSS layer (length and density) and therefore, affect adhesion. Figure 4-12 is the
mechanical properties changes as a function of ionic concentration in electrolyte for all strains
studied (t > tcritical in t test). Understanding the interplay of electrostatic and steric interactions in
influencing the adhesion of bacteria to sand surface will be critical to control microbial adhesion-
aggregation-transportation. The elastic modulus does not show significant change based on AFM
measurements.
AFM measurements are also done to investigate the sampling time effect on strain Q and
H in 3 mM electrolyte solution, namely, exponential, stationary and 48-hour-old growth stage.
Based on mechanical measurements, there is no obvious difference between exponential and
stationary growth stage cells. But starvation makes cells much stiffer and less adhesive compared
to stationary phase bacteria, and therefore, cells after 48-hour-old growth are prone to keep
undeformed shape and segregate from each other instead of multi-cell aggregates.
The modified dimensionless Tabor’s parameter, , is defined in previous chapter as [178],
3/1
22
2
2
AFM
23
2 )1(
2
v
R
U
El
b ad Eqn (4-14)
with b2 the minor axis of the ellipsoidal cell, the thickness of the cellular surface substances
(CSS), E the cell elastic modulus, Uad the total adhesion energy to detach the AFM tip from
sample cell, RAFM = 10 nm the AFM tip radius, and ν = 0.5 the Poisson’s ratio as in most gels.
The mechanical properties measured by AFM will be combined into Tabor’s parameter to
describe strain microscopic adhesion behavior shown in Table 4-4.
l

99
AFM Piezo Displacement, y (nm)
-1000 -500 0 500 1000 1500
App
lied
For
ce, F
(nN
)
-2
0
2
4
6
8
10
Ons
et o
f glo
bal
defo
rmat
ion
CSS
Aeromonas Punctata(Strain Q)
in 3mM KCl
Loading
Unloading
ABC
D
F G
Figure 4-8 Typical AFM force-displacement curve of strain Q in electrolyte solution with ionic
concentation of 3 mM.
Figure 4-9 Amplitude topological AFM scans of strain Des in ambient air showing long cell
surface substance (CSS) on bacterial surface.
4m

100
AFM Piezo Displacement, y (nm)
-500 -250 0 250 500 750
App
lied
For
ce, F
(nN
)
0
2
4
6
8
AFM
Curve fitting
E = 151 kPa
Raoultella ornithinolytica(Strain A)
in 3mM KCl
Figure 4-10 Curve fitting of loading curve for elastic modulus of strain A in electrolyte solution
with ionic strength of 3 mM based on classical Hertz-Sneddon model [125].

101
AFM Displacement, y (nm)
-300 0 300 600 900 1200
App
lied
For
ce, F
(nN
)
-1.0
-0.5
0.0
0.5
1.0
1.5
2.0
1mM KCL
3mM KCL
10mM KCL
y (nm)
-400 -200 0 200 400 600 800 1000
F (
nN)
-1
0
1
2
3
Unloading CurveSH2
Figure 4-11 Unloading curve of strain SH2 in electrolyte solution with a wide range of ionic
concentations (1 mM, 3 mM and 10 mM) showing adhesion energy increase as ionic strength
rises.

102
Figure 4-12 Mechanical properties changes as a function of ionic concentration (1 mM, 3 mM,
10 mM) in electrolyte for all strains studied (*p<0.05).

103
4.3.5 Tabor’s parameter as a predicator for microbial deposition behavior
In general, large and compliant cells are prone to aggregation and adhesion, especially
when the attractive intersurface force is strong and the steric repulsion as a result of thick CSS is
minimized. In quantitative terms, a higher propensity to aggregation and adhesion is expected for
large Uad, b2, and small l and E. It is ideal to derive a universal dimensionless parameter to
collectively combine these measureable quantities. We modified the Tabor’s parameter [32, 150],
, in classical adhesion and colloidal science to fit the needs. Detailed descriptions of the
assumptions made and computation methods for deriving Tabor’s value is shown in Chapter 3
[178].
Based on the classic adhesion and colloidal science, it is anticipated that large μ
facilitates the compliant cells to adhere. It is therefore logically expected that a larger μ leads to
higher deposition rate in porous medium. As shown in Figure 4-13, the Tabor’s parameter
describing microbial microscopic adhesion properties based on AFM measurements, which
encompasses cell dimension, cell elasticity, range and magnitude of cell-surface forces, and CSS
layer thickness and density, correlates very well with the attachment efficiency, ,
experimentally determined from flow-through packed sand column, for all the bacterial strains
studied cultured with different sampling time in electrolyte solution with a wide range of ionic
concentration (r2
= 0.822). Simple curve fit yields
2101 log cc Eqn (4-15)
with the numerical constants c1 = 0.708 and c2 = -0.223. In spite of the limitation of the AFM test
to fully simulate the cell-sand interaction, the strong correlation observed for a variety of
bacterial strains indicated that the Tabor’s parameter is a promising parameter to correlate the

104
micro-scale cell mechanical properties and cell-surface adhesive interaction quantities to macro-
scale cell deposition and transportation behavior in porous medium.
4.4 Discussion
Microscopic characterization of single cells using AFM is attractive in the environment
engineering community. Although DLVO theory is widely used to introduce full interaction at
the surfaces between bacteria and collector, it only determines the range and magnitude of
interfacial energy, which is a significant factor in cell attachment onto collector surface but not
the only one. Figure 4-14 shows the adhesion-detachment mechanism of a cylindrical shell
(simulated as bacteria) with a rigid substrate in presence of a typical DLVO surface potential.
DLVO theory states that the interactions between a colloidal and a collector surface can be
expressed as the sum of attractive van der Waals and electrostatic double layer interactions.
When a bacterium approaches a rigid surface, the 2o long range attraction will be felt, and if the
intermediate repulsion is sufficient large, it will remain stable at the potential minimum.
However, in the presence of a highly concentrated electrolyte, the repulsive barrier is drastically
reduced and the bacteria can jump into the primary energy minimum. Increase ionic strength will
decrease energy barrier. So the cell will be much easier to jump into 1o min, in which it will
experience large attraction force [197]. There will be lots of factors influencing the whole
attachment-detachment process, such as cell wall stiffness, cell size and geometry, the range and
magnitude of interfacial energy between cell and collector and the thickness of CSS layer.
Therefore, a comprehensive understanding the mechanism of cell adhesion-detachment needs to
fully account for all the combined effects, just like the modified dimensionless Tabor’s
parameter demonstrated in this chapter.

105
4.5 Conclusion
The new dimensionless Tabor’s parameter is extended to correlation the adhesion
mechanical properties of single bacteria to microbial deposition-transportation kinetics properties.
It bears a strong correlation with macroscopic cell attachment efficiency for six vastly different
strains cultured with different sampling time in electrolyte solution with a wide range of ionic
strength. This work presents an important extension step to incorporate fundamental surface
science and solid mechanics into the subject of microbial adhesion-aggregation-transportation,
improving the conventional empirically driven approach for predicting microbial attachment and
transportation in porous medium.
Cell attachment and detachment in porous medium is a complex mechanical process
which requires knowledge of fluid behavior as well as system / cell material properties and
aqueous environment. A simplified model of a single cell resting on a flat surface can be
demonstrated in Figure 4-14. Both the horizontal forces (shear and friction) and vertical forces
(adhesion, gravity and buoyancy) jointly play a decisive role in cell attachment onto rigid
substrate, or rolling, sliding, even lifting from colloid sand. Although the strong correlations of
Tabor’s parameter are shown to cell aggregation in last chapter and deposition-transportation
kinetics in this chapter, it is further expected to vary as a function of liquid flow, diffusion-
convection, aspect ratio of cell to collector and a number of relevant parameters related to the
cell structure and aqueous environment.

106
Tabor's Parameter,
100 101 102
Atta
chm
ent E
ffici
ency
,
0.0
0.2
0.4
0.6
0.8
1.0Des: Desulfovibrio vulgarisSH1: S. oneidensis MR-1SH2: S. putrefaciens CN32H: Bacillus cereusA: Raoultella ornithinolyticaQ: Aeromonas punctataGrowth stage
R2 = 0.822
= 0.708 log10- 0.223
Figure 4-13 Correlation between Tabor’s parameter, based on AFM force measurements and
attachment efficiency, from flow-through saturated packed sand column test.

107
Figure 4-14 Schematic of deformed cell and interfacial forces when approaching collector
surface in the porous medium.

108
Table 4-4 Summary of materials and surface properties.
Strain
Growth
phase/
Electrolyte
concentration
Elastic
modulus,
E (kPa)
Thickness of
CSS,
l (nm)
Density of
CSS,
(molecules/
m2)
Adhesion
energy,
Uad (10-18
J)
Penetration
energy,
Upen (10-18
J)
Tabor’s
parameter, µ
Attachment
efficiency,
Travel
distance
estimation,
S (m)
SH2
S. Putrefaciens
CN32
(Gram-
negative)
Stationary
1mM ± 245
(44.1%)
± 46
(18.9%)
2350 ± 433
(18.4%)
75 ± 26
(33.8%)
157 ± 51
(32.5%)
1.8 ± 0.5
(27.8%)
0.128 ± 0.05
(39.1%)
2.81 ± 0.79
(28.1%)
Stationary
3mM
±
± 43
(23.4%)
2750 ± 670
(24.4%)
127 ± 20
(22.8%)
112 ± 40
(35.7%)
3.7 ± 0.2
(5.4%)
0.181 ± 0.052
(28.7%)
1.99 ± 0.44
(22.3%)
Stationary
10mM
±
± 30
(27.0%)
3840 ± 339
(8.8%)
179 ± 48
(26.8%)
126 ± 71.2
(56.5%)
7.6 ± 0.7
(9.2%)
0.251 ± 0.10
(39.8%)
1.43 ± 0.41
(28.5%)
SH1
S. Oneidensis
MR-1
(Gram-
negative)
Stationary
1mM
±
± 46
(16.4%)
5860 ± 1800
(30.7%)
287 ± 70
(24.4%)
96 ± 23.9
(24.9%)
7.0 ± 1.2
(17.1%)
0.325 ± 0.02
(6.2%)
1.11 ± 0.06
(5.8%)
Stationary
3mM ± 30.9
(12.4%)
± 55
(22.6%)
5970 ± 1230
(20.6%)
536 ± 29
(5.4%)
125 ± 56
(44.8%)
12.3 ± 4.1
(33.3%)
0.450 ± 0.044
(9.8%)
0.80 ±0.07
(8.9%)
Stationary
10mM
±
± 57
(35.8%)
7800 ± 980
(12.6%)
617 ± 89
(14.4%)
64 ± 21
(32.8%)
23.4 ± 4.1
(17.5%)
0.859 ± 0.036
(41.9%)
0.42 ± 0.02
(4.0%)
Des
Desulfovibrio
Vulgaris
(Gram-
negative)
Stationary
1mM ± 78.2
(50.8%)
± 106
(14.7%)
3300 ± 677
(20.5%)
219 ± 69
(31.5%)
165 ± 15.2
(9.2%)
3.3 ± 0.8
(24.2%)
0.086 ± 0.011
(12.8%)
3.86 ± 0.44
(11.3%)
Stationary
3mM
±
± 92
(17.9%)
3390 ± 1460
(43.1%)
110 ± 68
(61.8%)
191 ± 15.4
(8.1%)
3.9 ± 0.3
(7.7%)
0.106 ± 0.047
(44.3%)
3.13 ± 0.96
(30.7%)
Stationary
10mM
±
± 185
(19.3%)
3120 ± 328
(10.5%)
442 ± 162
(36.7%)
127 ± 11.4
(9.0%)
4.2 ± 0.1
(23.8%)
0.179 ± 0.004
(2.2%)
1.85 ± 0.04
(2.2%)
Q
Aeromonas
punctata
(Gram-
negative)
Stationary
1mM
±
± 83
(26.7%)
16200 ± 2505
(15.5%)
245 ± 81
(33.1%)
149 ± 63
(42.3%)
7.9 ± 1.9
(24.1%)
0.416 ± 0.048
(11.5%)
0.87 ± 0.09
(10.3%)
Stationary
3mM
±
± 52
(19.6%)
17000 ± 1740
(10.2%)
281 ± 72
(25.6%)
306 ± 193
(63.1%)
15 ± 4.6
(30.7%)
0.556 ± 0.103
(18.5%)
0.65 ± 0.10
(15.6%)
Stationary
10mM
±
± 47
(19.4%)
19020 ± 1576
(8.3%)
456 ± 37
(8.1%)
597 ± 182
(30.5%)
29.8 ± 6.8
(22.8%)
0.964 ± 0.05
(5.2%)
0.37 ± 0.02
(4.9%)
Exponential
3mM
±
± 32.8
(40.3%)
9860 ± 1965
(19.9%)
53 ± 24
(45.8%)
347 ± 145
(41.8%)
22.6 ± 2.7
(11.9%)
0.613 ± 0.155
(25.3%)
0.59 ± 0.12
(20.2%)
Starvation
3mM
±
± 78
(31.8%)
7450 ± 1810
(24.3%)
268.6 ± 56
(20.8%)
297 ± 102
(34.3%)
6.8 ± 1.1
(16.2%)
0.146 ± 0.017
(11.6%)
2.46 ± 0.25
(10.4%)
A Stationary ± ± 68 4000 ± 1920 199 ± 57 1703 ± 1124 7.4 ± 0.5 0.315 ± 0.05 1.15 ± 0.16

109
Raoultella
ornithinolytica
(Gram-
negative)
1mM (20.1%) (48%) (28.6%) (66.0%) (6.8%) (15.9%) (13.7%)
Stationary
3mM
±
± 101
(34.4%)
4520 ± 2010
(44.5%)
211 ± 105
(49.8%)
1747 ± 362
(20.7%)
8.8 ± 0.8
(9.1%)
0.354 ± 0.09
(25.4%)
1.02 ± 0.21
(20.3%)
Stationary
10mM ± 49.1
(36.9%)
± 48
(15.1%)
5230 ± 1400
(26.8%)
319 ± 131
(41.1%)
1246 ± 462
(37.1%)
11.7 ± 1.3
(11.1%)
0.688 ± 0.045
(6.5%)
0.52 ± 0.03
(6.1%)
H
Bacillus
cereus
(Gram-
positive)
Stationary
1mM
±
± 45
(32.6%)
9000 ± 3024
(33.6%)
318 ± 85
(26.7%)
347 ± 111
(32.0%)
15.1 ± 5.1
(33.8%)
0.897 ± 0.092
(10.3%)
0.41 ± 0.04
(9.3%)
Stationary
3mM ± 88
(41.7%)
± 45
(43.7%)
12100 ± 7489
(61.9%)
964 ± 213
(22.1%)
370 ± 109
(29.5%)
54.2 ± 20.0
(36.9%)
0.924 ± 0.132
(14.3%)
0.39 ± 0.05
(12.5%)
Stationary
10mM ± 49.8
(55.1%)
± 46
(39.8%)
11800 ± 1100
(9.3%)
576 ± 344
(59.7%)
440 ± 107
(24.3%)
60.3 ± 16.3
(27.0%)
1.0 ± 0.001
(1%)
0.36 ± 0.001
(0.1%)
Exponential
3mM
±
± 86
(44.8%)
5070 ± 2312
(45.6%)
267 ± 140
(52.5%)
462 ± 176
(38.1%)
13.9 ± 1.9
(13.7%)
0.705 ± 0.035
(5.0%)
0.51 ± 0.02
(4.8%)
Starvation
3mM ± 127
(23.3%)
± 29
(15.3%)
4570 ± 747
(16.3%)
135 ± 52
(38.5%)
428 ± 95
(22.2%)
4.2 ± 0.3
(7.1%)
0.409 ± 0.012
(2.9%)
0.88 ± 0.03
(2.9%)

110
Chapter 5 A Nano-Cheese-Cutter to Directly Measure Interfacial Adhesion
of Freestanding Nano-Fibers
5.1 Introduction
Freestanding structures are ubiquitous in the modern era of nano-technology, especially
in electronics, nano-materials development, bioengineering, and nano-fiber meshes. In micro-
and nano-electromechanical systems (M/NEMS), beams, bridges, diaphragms, and switches are
indispensable components. Performance and reliability of the micro-devices depends critically
on the adhesion or stiction of these freestanding components in the presence of intersurface
forces, electrical field, and environment such as moisture [198, 199]. Nano-fibers produced by
electrospinning [200, 201] are used in protective clothing [202], orthopedic prosthesis [203],
biomedical scaffolds [204], and drug delivery [205]. Extensive theoretical modeling and
experimental techniques are developed in the literature to characterize nano-structures such as
graphene [206], nano-fibers [207], carbon nano-tubes [208, 209], gecko’s setae [210], and DNA
chain [211]. But direct measurement of fiber-fiber adhesion to a high resolution is unavailable in
the literature. The need for a viable method is even more pronounced in characterizing the
mechanical integrity of a fiber mesh in terms of the stiffness and adhesion of individual fiber
[212, 213]. The indispensable interfacial properties of fiber-fiber adhesion is by and large
ignored in the literature, though it is obvious that without which the mesh cannot stay intact
mechanically upon external loads [214].
Carbon fiber reinforced plastics (CFRPs) are lightweight and have excellent mechanical
strength. They are widely used in applications including aerospace, automotive parts and
sporting goods [215]. Due to excellent mechanical properties [23, 108], electrical behavior [216]

111
and thermal conductivities [217], carbon nanotubes (CNTs) are good candidate to be used as
reinforcements in polymer matrix composites [218]. It is widely accepted that the mechanical
properties of carbon fiber composites are highly dependent on the interfacial toughness between
fibers and matrix [219, 220]. The composites interfaces between different constituents in
composites often separate by cracking for their poor toughness [221]. An appropriately
engineered interaction can significantly improve the strength, toughness and environmental
stability of the composites and transfer the stress efficiently from matrix to carbon fibers [222].
In this chapter, a novel nano-cheese-cutter is reported to characterize freestanding nano-
fibers for their elastic modulus and inter-fiber adhesion with nN and nm resolutions. The method
can be readily adapted for other aforementioned 1-D structures. The celebrated surface force
apparatus [161] measures the intersurface forces between two atomically smooth surfaces in
crossed-cylinder configuration. Here we adopt a similar geometry for freestanding fibers, and
will experimentally investigate the behavior of electrospun fibers as a demonstration. A
theoretical model will be derived from the first principles to extract materials parameters from
experiments. Finally, this novel method will be used to critically examine the adhesive force
between two dissimilar materials of SWCNT bundles and electrospun Nylon 6 fiber.
5.2 Methods and materials
5.2.1 Electrospun nylon 6 fiber fabrication
Electrospun nano-fibers were fabricated as follows. Nylon 6 pellets (Sigma Aldrich CAS
25038-54-4) with density 1.084 g.mL-1
were dissolved in 88% formic acid (EMD Corporation
CAS 64-18-6). The solution was diluted to 25% in weight and magnetically stirred overnight. A
syringe pump generated a pressure to maintain a sessile drop at the tip of a 0.559 mm Gauge 21

112
stainless steel needle. The 25 mm long needle was attached to a 5 mL syringe filled with the
aforementioned solution. Electrospinning was then performed with solution feed rate (FR) at 2.0
L.min-1
and applied voltage at V = 20 kV at ambient temperature and relative humidity of 50%.
The nano-fibers produced were collected by a 150 mm rotational disk collector at a take-up
velocity (TUV) of 14.2 m.s-1
. Nano-fibers of desirable diameter range and crystal alignment can
be adjusted by varying FR, V and TUV simultaneously or separately.
5.2.2 Fixture for nano-cheese-cutter
A flat tipless AFM cantilever (Applied NanoStructure, Inc.) was chosen to support the
sample fiber because of its high precision in force and displacement measurement. The
deflection sensitivity was calibrated by repeated contact mode indentation on a freshly cleaved
muscovite mica surface in air with sweep duration of 1.04 second, and the spring constant was
found to be 0.152 ± 0.02 N.m-1
by the Cleveland method [124]. Using a high resolution micro-
manipulator (AutoMate Scientific) combined with a stereomicroscope (Olympus, BX51), two
identical glass microspheres with a diameter of 30~50 m (Potters Industries) were attached to
the free end of an AFM cantilever using epoxy (AeroMarine TM 400) with a designated
separation of 50~120 m (Figure 5-1a). The epoxy was then cured after 2 hours at 90oC. A
complementary pair of microspheres was similarly attached to the surface of an atomically
smooth mica sheet (Figure 5-1b). Before any fibers were attached to the spheres, the baseline of
zero applied load, F = 0, was established. The cantilever was precisely positioned such that the
midpoint of the spheres separation on AFM was immediately above that of the other two spheres
on mica in an orthogonal orientation. An AFM (Agilent 5500) then measured forces as the
cantilever being slowly driven vertically downwards through a displacement of y while F(y) was

113
recorded simultaneously. The intersurface forces between the spheres and mica surface were
measured consistently and repeatedly in nano-Newton range. All force measurements hereafter
had such baseline taken into considerations.
5.2.3 Nano-cheese-cutter
A freestanding electrospun fiber was picked up by micro-capillary needles (Tritech
Research) using the micro-manipulator. Both ends of a taut fiber were glued by epoxy to the two
microspheres on AFM cantilever, forming a nano-cheese-cutter, now aligned with the cantilever
axis (denoted by subscript 1) as shown in Figure 5-1a. Another similar fiber was similarly
attached onto the microspheres on mica (denoted by subscript 2) as shown in Figure 5-1b. Figure
5-2 is SEM image of electrospun fiber surface. The fiber diameter, di, and the fiber length, 2li,
were freely chosen, and were measured post-mortem by scanning electron microscope (SEM,
Carl Zeiss AG Supra 25). The fibers were made as taut as possible, but sagging remained
inevitable which will show up in subsequent measurements (see later section). Orthogonal
crossed-cylinder geometry was adopted here. The cheese-cutter was then driven vertically
downwards to interact with the other fiber (Figure 5-1c-d). Raw AFM force-displacement F(y)
data was converted to force-distance F(w0) curve by correcting cantilever deflection from piezo
displacement for real distance between two nano-fibers. Both quasi-static and loading-unloading
cycles were performed. Throughout the loading process, the rigid epoxy did not show any
yielding or slippage at the fiber-microsphere, cantilever-microsphere, and mica-microsphere
junctions.

114

115
Figure 5-1 Scanning electron microscopy (SEM) images of (a) A nano-cheese-cutter at one end
of an AFM cantilever, (b) an overhanging freestanding fiber on mica substrate, (c) Schematic of
the contact between two nano-fibers arranged in a crossed-cylinder geometry, and (d) In the
presence of external tension, the nano-cheese-cutter (top) deforms into V-shape and the
overhanging (bottom) fiber an inverted V-shape.
Figure 5-2 SEM image of electrospun fiber surface.
(c) (d)
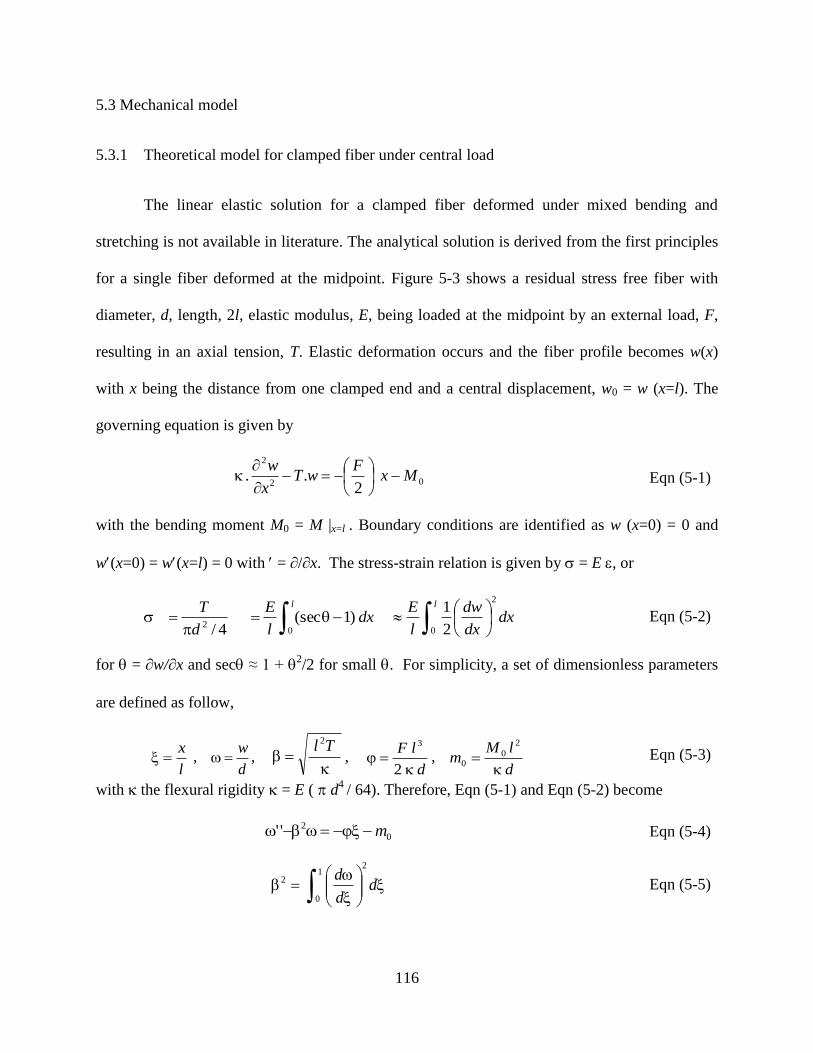
116
5.3 Mechanical model
5.3.1 Theoretical model for clamped fiber under central load
The linear elastic solution for a clamped fiber deformed under mixed bending and
stretching is not available in literature. The analytical solution is derived from the first principles
for a single fiber deformed at the midpoint. Figure 5-3 shows a residual stress free fiber with
diameter, d, length, 2l, elastic modulus, E, being loaded at the midpoint by an external load, F,
resulting in an axial tension, T. Elastic deformation occurs and the fiber profile becomes w(x)
with x being the distance from one clamped end and a central displacement, w0 = w (x=l). The
governing equation is given by
02
2
2. . Mx
FwT
x
w
Eqn (5-1)
with the bending moment M0 = M |x=l . Boundary conditions are identified as w (x=0) = 0 and
w(x=0) = w(x=l) = 0 with = ∂/∂x. The stress-strain relation is given by = E , or
ll
dxdx
dw
l
Edx
l
E
d
T
0
2
0 2 2
1 )1(sec
4/ Eqn (5-2)
for = ∂w/∂x and sec ≈ 1 + 2/2 for small . For simplicity, a set of dimensionless parameters
are defined as follow,
l
x ,
d
w ,
2Tl,
d
lF
2
3
,
d
lMm
2
00
Eqn (5-3)
with the flexural rigidity = E ( d4
/ 64). Therefore, Eqn (5-1) and Eqn (5-2) become
0
2'' m Eqn (5-4)
1
0
2
2 dd
d Eqn (5-5)

117
respectively, with (=0) = 0 and (=0) = (=1) = 0 with = ∂/∂. An analytical solution to
Eqn (5-4) is found to be
1)cosh(
sinh
1cosh)sinh(
3 Eqn (5-6)
with a central deflection 0 = (=1) becomes
)1(
)2(2
)sinh3cosh2(16
)1(3
27
0e
e
e
e Eqn (5-7)
Substitute Eqn (5-6) into Eqn (5-5). Yields
)sinh3cosh2(16
)1(
27
e
e Eqn (5-8)
The exact solution is found,
)1(
)2(2
2
3
3
0e
elFw
Eqn (5-9)
)sinh3cosh2(16
)1(
2 27
3
e
e
l
dF Eqn (5-10)
The exact constitutive relation, (0) or F(w0), can be found by treating as a varying
parameter as both ()/F()and 0(0)/w0() are functions of . It can be shown that (0)n,
where n is the gradient given by )(log/)(log 0n . The exact expressions for n(0) or n()
can be obtained by MATHEMATICA,
/2)sinh()cosh93(2
/2)3cosh()26(/2))cosh(4(-6
))sinh(-51)33sinh-(-19cosh
))cosh(23(212021-
/2)sech(
)(log
)(log
2
22
2
22
0
n
Eqn (5-11)

118
Thick and stiff fibers possess a large with minimal axial stretching. Therefore, 0
and bending is dominant. In such limit, equations Eqn (5-6) - Eqn (5-8) reduce to
322
32
and 0 12 Eqn (5-12)
or, 0, with n = 1. The deformed profile and linear constitutive relation match with the
classical elastic solution [177, 223]. On the other hand, thin and flexible fibers possess minimal ,
and stretching dominates. In the limit, Eqn (5-6) - Eqn (5-8) reduce to
0 and
3
0 8 Eqn (5-13)
or, 0)3, with n = 3. The fiber is a classic V-shape with straight overhanging arms. Such
solution is not available in classical linear elasticity literature. Note that equations Eqn (5-12)
and Eqn (5-13) are equivalent to Eqn (5-6)-Eqn (5-8). Behavior of fibers with intermediate
diameter and stiffness and an intermediate thus lie between the two limits. The bending-
stretching transition occurs at roughly 0 ~ 1 or w0 ~ d. Figure 5-4a shows the changing
deformed profile as the applied load increases with . A V-shape is expected in the stretching
limit. Note that w(x) is a smooth curve with zero gradients at clamped ends and midpoint when
load is small, but becomes a V-shape with straight arms at large loads. Figure 5-4b shows the
constitutive relation, (0). Initial loading is always governed by bending when 0 < 1. As
external load increases, deformation gradually switches to stretching dominant. The intersection
point of these two limiting region is )66,2/6( . Figure 5-4c shows the gradient of (0) as a
function of vertical displacement and the bending and stretching limits of 1 and 3 respectively.

119
Figure 5-3 Schematic of a freestanding fiber loaded at the midpoint for several central
displacements ( = 0, 7, 15, 20, 25).

120
Figure 5-4 Theoretical force-displacement solution. (a) Normalized deformed profiles for fiber
tension = 0, 7, 20, and the stretching limit (dashed curve). Note that the slope at x = 0
is always zero, but approaches a constant only in the limit when the profile becomes linear. (b)
The constitutive relation (0), and the bending and stretching limits (dashed lines). Bending
dominates at small 0, while stretching prevails at large 0. (c) Gradient of the constitutive
relation as a function of vertical displacement, n(0).

121
In the limit of large (w0/d) > 3, stretching dominates the thin and flexible fiber and Eqn
(5-9)-Eqn (5-10) reduce to3
0
32 )4/( wlEdF . Since vertical forces acting on each fiber are of
the same magnitude but opposite direction, F1 = – F2,
3
0
3
3/2
2
2
3/2
1
1 4
wd
l
d
lEF
Eqn (5-14)
with the total vertical displacement of the AFM cantilever, w0 w01+ w02. A log-log plot of
[F / (d22/4)] versus (w0 / l2) thus yields a slope of 3, and E is deduced from the intercept with F-
axis. For small (w0/d) < 1, bending dominates the thick and stiff fiber and Eqn (5-9)-Eqn (5-10)
become
0
1
4
3
3
3
4
1
3
1
8
3w
d
l
d
lEF
Eqn (5-15)
with F w0, matching the classical equation for rod bending [223]. For intermediate 1 < (w0 / d)
< 3, the fiber deforms by mixed bending-stretching and F (w0)n with 1 < n < 3.
5.3.2 “Pull-off” force and adhesion energy of adhering fibers
“Pull-off” or spontaneous detachment of the two adhering fibers is similar to that of the
surface force apparatus [161]. The critical phenomenon is approximated by adhesion of two
crossed-cylinders with diameter, d1 and d2, and interfacial adhesion energy, . Maugis [150]
shows that the tensile load required for “pull-off” is given by
).2/.(.* dF Eqn (5-16)
where d = (d1-1
+ d2-1
)-1
is effective fiber diameter. The parameter is bounded by 3/2 < < 2,
where the upper bound ( = 2) is the Derjaguin-Muller-Toporov (DMT) limit for small but hard
spheres in the presence of weak but long-range intersurface attraction, and the lower bound ( =
3/2) is the Johnson-Kendall-Roberts (JKR) limit for large but soft spheres in the presence of

122
strong but short-range adhesion. The intermediate behavior between the JKR to DMT limits is
governed by the transition parameter
3/2
2
3/1
3
0
2
)1(2157.1
E
Z
R Eqn (5-17)
with Z0 1 nm the force range of typical van der Waals interactions, R = d/2 the effective fiber
radius, E the elastic modulus and v = 0.47 Poisson’s ratio of the cylinders [207]. If > 5, the
JKR model applies, and if the DMT model is dominant. Values between 0.1 and 5
correspond to the “transition regime” between JKR and DMT [34].
Maugis-Dugdale model [34] is a reasonable method for estimating the value of the
contact radius as a function of load, but is cumbersome to compare with experimental data such
as AFM measurements. A simpler general equation that approximates Maugis’ solution
extremely closely is deduced [224, 225] as shown in the following equation,
)1.04.4
1.04.4(
4
1
4
74.1
4.1
Eqn (5-18)
R
F
*
Eqn (5-19)
where ranges monotonically from 1.5 (for the JKR limit) to 2 (for the DMT limit), depending
on transition parameter, . The finial value for “transition regime” between JKR and DMT is
determined through iterations Eqn (5-18) and Eqn (5-19) combined with Eqn (5-17) using the
known “pull-off” force, F*, and elastic modus measured from AFM loading curve.
5.4 Results and analysis
Figure 5-5 shows loading (ABC) and unloading (CDGHJK) trajectories. Along AB, the
fibers are either too far apart to be interacting or one sagging fiber simply hung on the other fiber

123
with its negligible weight. No long range intersurface force is measured along AB. At B, the
fibers are in adhesion contact and both become taut. Further compression along BC stretches the
cheese-cutter into an inverted V-shape and the lower fiber into a complementary V-shape. The
theoretical constitutive relation is given. Since (w0/d) > 3, the fiber appears thin and flexible, and
elastic stretching is the dominant deformation mode. The interaction between two fibers is shown
in Eqn (5-14), where w0 w01+ w02 is now the total central displacement of the two fibers.
The relation 3
0 wF yields a linear dependence of log [F/(d22/4)] upon log [w0/l2 ] with slope of
3. Figure 5-5 shows the force data along BC in a log-log plot against the expected cubic relation
of F(w0). The elastic modulus is found to be E = 14.70 ± 0.75 GPa. The designated maximum
vertical displacement, (y)max, is reached at C. Unloading curve along CD does not retrace BC
partially due to AFM piezo scanner drawbacks such as non-linearity, creep and hysteresis.

124
AFM Piezo Displacement, y (nm)
-2000 0 2000 4000 6000 8000
App
lied
For
ce, F
(nN
)
-20
-10
0
10
Normalized Nano-Fiber Deflection, (w0)2
/ l2
0.015 0.02 0.03 0.04 0.050.010
Str
ess,
F /
(
d2
2/4
)
10-5
10-4
10-3
Loading
Unloading
"Pull-off" at F*
Fib
er-F
iber
C
onta
ct
B D G A J K
C
H
Path BCslope = 3
(a)
(b)
Fibers out of contact
Figure 5-5 AFM force measurement. (a) Typical force-displacement measurement showing paths
of loading (ABC) and unloading (CDGHJK). Here d1 = 109 ± 16 nm and 2l1 = 91 ± 4.8 m, and
d2 = 580 ± 20 nm and 2l2 = 97 ± 5 m. (b) Force curve along path BC for several sample fibers
and curve fit. Only every other fifth data point is shown for clarity.

125
Plastic deformation is ruled out because subsequent loading-unloading cycles are
reversible (c.f. Figure 5-6). Along DG, the external load virtually vanishes (F 0), indicating
either one or both fibers are sagging. At G, the fibers become taut again and the applied load
turns tensile (F < 0). The fibers deforms along GH into a mirror image to CD, with the cheese-
cutter now in a V-shape (Figure 5-1d). The two force curves of CD and GH coincide if one F is
reversed in sign, and yields the same elastic modulus. At H, an instability of “pull-off” occurs
when the fibers spontaneously detach from each other at a critical tensile “pull-off” force, F*.
The external load then vanishes at J, and no further inter-fiber interaction is observed along JK
and beyond. Force measurements are repeated using the same cheese-cutter but several fibers on
the mica substrate with ranges of d2 and 2l2 as shown in Figure 5-6a. Without loss of generality,
all force curves, F(y), are artificially shifted to coincide at “pull-off” in order to compare F*. The
cheese-cutter is believed to be sagging, since all F(y) show similar characteristics (c.f. DG in
Figure 5-5). The larger the pull-off force, the stronger the adhesion and thus higher the adhesion
energy, . For the interacting fibers in the present study, 0.127 to 0.185 and JKR-DMT
transition based on Maugis-Dugdale solution [34] is assumed in data analysis. The interfacial
adhesion energy is found to be 75.72 ± 7.28 mJ.m-2
. Figure 5-6b shows F* as a function of d2
fitted to the theoretical model. Adhesion is fairly independent of the fiber diameter for Nylon 6,
contrasting other fibers that show an increasing adhesion for smaller diameters [226-228]. Table
5-1 is the summary for fiber-fiber interaction mechanical properties.

126
Fiber Diameter d2 (nm)
0 100 200 300 400 500 600
"Pul
l-off"
For
ce, F
* (
nN)
0
10
20
AFM Piezo Displacement, y(nm)
-4000 -2000 0 2000 4000 6000 8000 10000
App
lied
For
ce, F
(nN
)
-20
-10
0
10
20
117.1, 97
148.8, 144
53.9, 358
73.1, 299
97.4, 580
Pull-Off
2l2(m), d
2(nm)
(a)
(b)
Figure 5-6 (a) Force measurements of the same fiber on AFM cantilever (d1 = 109 ± 16 nm and
2l1 = 91 ± 5 m) adhering to fibers on mica with d2 and l2 indicated. (b) “Pull-off” force as a
function of mica fiber diameter. Circles are data from first fiber on AFM (c.f. Figure 5-6a) and
triangle from second fiber on AFM (c.f. Figure 5-7a). Dashed curve shows the JKR-DMT
transition prediction based on d1 = 109 ± 16 nm and 76 ± 7 mJ.m-2
.
To ensure consistency, another nano-cheese-cutter is prepared on yet another AFM
cantilever. Figure 5-7a shows the loading-unloading cycles in the same two fibers. Both fibers
appear to be initially taut and throughout loading, because the F = 0 section between unloading
and “pull-off” is clearly absent (c.f. path DG in Figure 5-5). Contrasting the first cheese-cutter,

127
the initial compressive load gives rise to a linear rather than cubic F(w0). Here the maximum
central displacement of each fiber is roughly its diameter, (w0)max ~ d, fiber bending, rather than
stretching, is the dominant deformation mode. The interaction between two fibers is shown is
Eqn (5-15).
The elastic modulus matches with the value found in the first cheese-cutter. The first 5
loading-unloading cycles show virtually identical force measurement F(y), indicating
reversibility of elastic deformation and even adhesion-detachment. Subsequent 5 cycles show
progressive deviation with increased sagging length and wiggles in F(y), presumably due to
plastic yielding, surface roughening, degradation and wear at the small fiber-fiber contact after
multiple detachments. Figure 5-7b shows F* as a function of loading-unloading cycles,
suggesting a fairly constant adhesion energy.

128
Number of Loading Cycles
1 2 3 4 5 6 7 8 9 10
"Pul
l-off"
For
ce, F
* (
nN)
10
15
20
AFM Piezo Displacement, y (nm)
0 2000 4000 6000
App
lied
For
ce, F
(nN
)
-20
-10
0
10Pull-Off Pull-off
First 5 Cycles
Subsequent5 Cycles
(a)
(b)
Figure 5-7 (a) Loading-unloading cycles performed by fibers with d1 = 140 ± 13 nm and 2l1 =
42.73 ± 0.27 m, and d2 = 241 ± 36 nm and 2l2 = 36.66 ± 0.04 m. (b) “Pull-off” force as a
function of loading cycles. Adhesion energy deduced from F* measured in the first 5 cycles is
58.8 ± 12.6 mJ.m-2
(dashed line).

129
Table 5-1 Fiber-fiber interaction mechanical properties summary.
Nano-chess-
cutter
diameter,
d1 (nm)
Nano-chess-
cutter
length,
2l1 (m)
Free-
standing
fiber
diameter,
d2 (nm)
Free-
standing
fiber length,
2l2 (m)
“Pull-off”
force,
F* (nN)
Transition
parameter,
Interfacial
adhesion
energy,
(mJ.m-2
)
“Pull-off”
force
parameter,
Tabor’s
parameter,
108.9 ± 16.4 91.14 ± 4.8
97.4 ± 12.2 117.1 ± 1.1 11.9 ± 4.2 0.14 ± 0.03 77.3 ± 28.5 1.90 ± 0.03 0.12 ± 0.03
144.16 ± 23 148.8 ± 1.2 13.0 ± 1.9 0.14 ± 0.01 70.4 ± 10.5 1.90 ± 0.01 0.12 ± 0.01
357.6 ± 43.6 53.9 ± 3.3 16.4 ± 1.4 0.15 ± 0.01 66.2 ± 5.7 1.89 ± 0.01 0.13 ± 0.01
299.2 ± 11.6 73.1 ± 1.87 19.2 ± 4.6 0.17 ± 0.03 81.6 ± 20.7 1.88 ± 0.02 0.14 ± 0.02
579.8 ± 34.2 97.4 ± 2.1 22.4 ± 0.3 0.18 ± 0.01 83.2 ± 1.1 1.87 ± 0.01 0.15 ± 0.01
140 ± 13 42.73 ± 0.27 241 ± 36 36.66 ± 0.04 15.5 ± 3.2 0.14 ±0.02 58.8 ± 12.6 1.90 ± 0.02 0.12 ± 0.02

130
5.5 Extension study for dissimilar material interaction
This section is to use the novel AFM nano-cheese-cutter for critical examination of the
adhesive force between two dissimilar materials with nN and nm resolutions. The interaction
between single walled carbon nanotube (SWCNT) bundles and electrospun Nylon 6 fiber is
demonstrated here. First, AFM nano-cheese-cutter is used to characterize freestanding SWCNT
bundle for their elastic modulus and SWCNT bundle-bundle adhesion. Then, this SWCNT AFM
cutter is utilized to get interfacial force between SWCNT bundle and electrospun fiber (efiber)
overhanging over two microspheres on mica substrate. To ensure the consistency of
measurements, efiber AFM cutter is adopted to get efiber-SWCNT bundle adhesion interaction
with freestanding SWCNT bundle suspending on mica surface. Finally, the relation of SWCNT-
efiber, efiber and SWCNT is checked using the combining law of interfacial adhesion energy.
Figure 5-8a is SWCNT AFM cutter (denoted by subscript 1). Figure 5-8b is the high
magnified SEM image of freestanding SWCNT bundle on the free end of AFM tipless cantilever.
Macroscopically, the SWCNTs are aligned and compact, yet this is not strictly true at the nano-
scale, evident from the wavy nanostructure seen in the SEM image. The loose network nano-
structure is periodically rippled and also interconnected with an average inter-bundle spacing of
d ≈ 15-20 nm and individual SWCNT diameter of 0.5-5 nm. The variations in the nanotube
curvature that contribute to the quenched disorder is quite typical of the dense nanostructures
associated with as-grown vertically aligned carbon nanotube forests and has its origins in the
confined and spatial-temporally non-uniform catalytic growth of the individual nanotubes [229].
SWCNT bundle is attached onto the microspheres on mica (denoted by subscript 2) as shown in
Figure 5-8d. To investigate dissimilar material interaction between SWCNT bundle and efiber,
efiber AFM cutter on tipless AFM cantilever and two freestanding efiber with different fiber

131
diameter and length on muscovite mica substrate are also fabricated (Figure 5-8c, e, f). The
diameter, di, and the length, 2li, are freely chosen and measured post-mortem by scanning
electron microscope (SEM, Carl Zeiss AG Supra 25) at accelerating voltage of 0.8-1.5 kV. SEM
imaging is repeated before and after AFM measurements to ensure no damage on freestanding
structures during the whole force experiments. Table 5-2 is a summary of freestanding structures
on both AFM tipless cantilever and mica substrate. Closed-loop AFM mode is adopted for the
whole measurements in this section. In an open-loop scanner, AFM takes an instruction for
moving and positioning the tip to a given position by using a formula to convert those
coordinates into voltages that are expected to accurate the scanner to the desired coordinate. But
inherent material properties of the piezo ceramics such as hysteresis, creep, and aging may cause
the piezo to drift. Closed-loop scanners use sensors to correct the intended versus the actual
position of the tip in real time, so that the tip is exactly where it is expected to be at any time,
especially over a large scan area.

132

133

134

135
Figure 5-8 Scanning electron microscopy images of (a) SWCNT AFM cutter at free end of a
tipless cantilever, (b) Magnified suspended SWCNT bundle overhanging over two micro-spheres
on tipless AFM cantilever forming freestanding structure, (c) Electrospun fiber AFM cutter at
the free end of a tipless cantilever, (d) A freestanding SWCNT bundle on mica substrate, (e)
No.1 freestanding electrospun fiber on mica substrate, (f) No. 2 freestanding electrospun fiber on
mica substrate, (g) Inverted optical microscopy image of SWCNT-efiber interaction taken during
SWCNT AFM cutter interacting with freestanding efiber on the mica substrate, showing two
crossed-cylinder geometries interacting in an orthogonal orientation.
Figure 5-9a shows five representative force-displacement curve, F(y), between two
SWCNT bundles. The loading-unloading cycles show virtually identical force measurement F(y),
indicating reversibility of elastic deformation and even adhesion-detachment. Figure 5-9b shows
loading (ABCD) and unloading (DGHIJ) trajectories. Along AB, the SWCNT bundle are too far
away to be interacting with the other SWCNT bundle, so the measured force is set to baseline for
apparent “zero” load. No long range interfacial force is measured. At B, the SWCNT bundles are

136
in adhesion contact and become taut. Further compression along BCD stretches the upper
SWCNT bundle into an inverted V-shape and the lower one into a complementary V-shape. The
relation of applied force, F, and fiber deflection, w0, in bending region (w0 < d and d-1
=d1-1
+d2-1
)
is plotted in log-log scale as shown in Figure 5-9c, giving a linear rather than cubic relation and
indicating bending, rather than stretching, is the dominant deformation mode. For two interacting
SWCNT bundles [230],
0
1
4
2
3
2
4
1
3
1
8
3w
d
l
d
lEF
Eqn (5-20)
The elastic modulus is found to be E = 0.402 ± 0.009 GPa. The elastic modulus of
individual SWCNT is measured to be of the order of 1 TPa [17], which means the result shown
in this chapter is much lower than the published results. The main reason of this is elastic
modulus measured in this section is for SWCNT bundle instead of individual SWCNT rope.
Based on SEM image in Figure 5-8b, the SWCNTs in the bundle are loose and not aligned well
at nano-scale. It forms periodically wavy rippled structure with inter-bundle spacing of 15~20
nm. The elastic modulus measured here is specific for this loose rippled SWCNT bundle. The
designated maximum vertical displacement, (y0)max, is reached at D in Figure 5-9b. Upon
unloading along DGHIJ, the cantilever retraces BCD with little or no hysteresis. The closed-loop
AFM reduces piezo scanner drawbacks of hysteresis and non-linearity dramatically and
effectively. At G, the applied load turned tensile (F < 0). At H, instability of “pull-off” occurs
when the upper SWCNT bundle spontaneously detaches from the lower one at a critical tensile
“pull-off” force, F*. The external load then vanished at I, and no further SWCNT bundle-bundle
interaction is observed along IJ and beyond. After several iterations, final results are found to be
transition parameter 1.125 ± 0.093, Tabor’s parameter 0.972 ± 0.081 and interfacial

137
adhesion CNT-CNT 11.85 ± 1.517 mJ.m-2
shown in Table 5-3. The interaction is in the range of
JKR-DMT transition.
Figure 5-10 is a typical interfacial force measurement between SWCNT bundle AFM
cutter (d1 = 1250 ± 225 nm and 2l1 = 58.8 ± 2.5 m) and freestanding electrospun fiber (d2 = 642
± 178 nm and 2l2 = 180.9 ± 3.677 m) overhanging over two microspheres on mica substrate.
The interfacial adhesion energy of dissimilar material between SWCNT bundle and electrospun
fiber CNT-efiber 20.005 ± 9.210 mJ.m-2
. The transition parameter is 0.114 ± 0.032 indicating
SWCNT-efiber interaction is in JKR-DMT transition regime. Figure 5-11 is a typical interaction
between the same SWCNT bundle AFM cutter (d1 = 1250 ± 225 nm and 2l1 = 58.8 ± 2.5 m) but
with another freestanding electrospun fiber (d2 = 560 ± 94 nm and 2l2 = 164.9 ± 1.9 m). The
dissimilar material interfacial adhesion energy is CNT-efiber 18.3 ± 4.6 mJ.m-2
. The transition
parameter is 0.104 ± 0.017 indicating SWCNT-efiber interaction is in JKR-DMT transition
regime. Then the dissimilar materials interaction is also investigated in the opposite way that
efiber AFM cutter is used to measure the interfacial force with SWCNT bundle freestanding on
the mica substrate. Figure 5-12 is a representative force-displacement measurement between
efiber AFM cutter (d1 = 206 ± 45 nm and 2l1 = 69.7 ± 3.1 m) and suspended SWCNT bundle
(d2 = 2839 ± 804 nm and 2l2 = 213.5 ± 4.2 m) on mica substrate. The interfacial adhesion
energy of dissimilar material between electrospun fiber and SWCNT bundle is calculated as
efiber-CNT 32.9 ± 6.9 mJ.m-2
. The transition parameter is 0.122 ± 0.016 indicating efiber-
SWCNT bundle interaction is in JKR-DMT transition regime.

138
AFM Piezo Displacement, y (nm)
-6000 -4000 -2000 0 2000 4000
App
lied
For
ce, F
(nN
)
-50
0
50
100
150
200
Pull-Off
Loading
Unloading
SWCNT-SWCNT Interaction
(a)
AFM Piezo Displacement, y (nm)
-6000 -4000 -2000 0 2000 4000
App
lied
For
ce, F
(nN
)
-50
0
50
100
150
200
Pull-Off, F*
Loading
Unloading
B
D
C
SWCNT-SWCNT Interaction
A
G
H
I J
(b)

139
Fiber Deflection, w0 (nm)
101 102 103 104
App
lied
For
ce, F
(nN
)
10-1
100
101
102
Path BCDslope=1
(c)
Figure 5-9 Mechanical characterization of SWCNT bundle. (a) Five AFM force-displacement
measurements between two SWCNT bundles (d1 = 1250 ± 225 nm, 2l1 = 58.8 ± 2.5 m and d2 =
2839 ± 804 nm, 2l2 = 213.5 ± 4.2 m) interaction showing high reproducibility. (b) Typical
force-displacement measurement showing paths of loading (ABCD) and unloading (DGHIJ).
The interfacial adhesion energy between two SWCNT bundles CNT-CNT 11.9 ± 1.5 mJ.m-2
in
JKR-DMT transition regime. (c) Force curve along path BCD for 5 measurements and curve
fitting in log-log plot.

140
AFM Piezo Displacement, y (m)
-20 -15 -10 -5 0 5 10 15
App
lied
For
ce, F
(nN
)
-60
-30
0
30
60
90
120
150
SWCNT-No.1 electrospun fiber Interaction
Figure 5-10 Typical force-displacement measurement between SWCNT bundle AFM cutter (d1 =
1250 ± 225 nm and 2l1 = 58.8 ± 2.5 m) and No. 1 freestanding electrospun fiber (d2 = 642 ± 178
nm and 2l2 = 180.9 ± 3.7 m) overhanging over two microspheres on mica substrate. The
interfacial adhesion energy of dissimilar material between SWCNT bundle and electrospun fiber
CNT-efiber 20.0 ± 9.2 mJ.m-2
in JKR-DMT transition regime.

141
AFM Piezo Displacement, y (m)
-10 -5 0 5 10 15
App
lied
For
ce, F
(nN
)
-40
-20
0
20
40
60
80
100
SWCNT-No.2 electrospun fiber Interaction
Figure 5-11 Typical force-displacement measurement between SWCNT bundle AFM cutter (d1 =
1250 ± 225 nm and 2l1 = 58.8 ± 2.5 m) and No. 2 freestanding electrospun fiber (d2 = 560 ± 94
nm and 2l2 = 164.9 ± 1.9 m) overhanging over two microspheres on mica substrate. The
interfacial adhesion energy of dissimilar material between SWCNT bundle and electrospun fiber
is CNT-efiber 18.3 ± 4.6 mJ.m-2
in JKR-DMT transition regime.

142
AFM Piezo Displacement, y (m)
-10 0 10 20
App
lied
For
ce, F
(nN
)
-80
-40
0
40
80
120
Electrospun fiber-SWCNTInteraction
Figure 5-12 Typical force-displacement measurement between electrospun fiber AFM cutter (d1
= 206 ± 45 nm and 2l1 = 69.7 ± 3.1 m) and SWCNT bundle (d2 = 2839 ± 804 nm and 2l2 =
213.5 ± 4.2 m) overhanging over two microspheres on mica substrate. The interfacial adhesion
energy of dissimilar material between electrospun fiber and SWCNT bundle is efiber-CNT 32.9 ±
6.9 mJ.m-2
in JKR-DMT transition regime.
On a molecular level the interfacial adhesion energy, , between two cylinders of radii R1
and R2 crossed at 90o can be modeled approximately with long range interactions using a
Hamarker constant AH [161]:
0
21
6D
RRAH Eqn (5-21)
with D0 = 0.165 nm the nominal value used for cut off separation and AH the Hamaker constant
defined as AH = 2
C 1 2, where 1 and 2 are the number of atoms per unit volume in two
cylindrical bodies and C the coefficient in the atom-atom pair potential. Combining relation,
which is frequently used for obtaining approximate values for unknown Hamarker constants in

143
terms of known ones, shows (AH)132 is the Hamarker constant for media 1 and 2 interacting
across medium 3,
232131132 )()()( HHH AAA Eqn (5-22)
Here, “1” denotes SWCNT, “2” for efiber and “3” for air. Based on Eqn (5-21) and Eqn (5-22),
we theoretically get interfacial adhesion energy between SWCNT bundle and electrospun fiber in
air should be
2mJ.m9.15.26
efiberefiberCNTCNTefiberSWCNT Eqn (5-23)
with efiber-efiber = 58.8 ± 12.6 mJ.m-2
based on experiment in [230]. The average SWCNT-efiber =
23.7 ± 8.0 mJ.m-2
from experimental study, which is a little lower than the theoretical prediction
but still in the same statistical range.
5.6 Discussion
We have demonstrated a fixture for direct adhesion measurement of two freestanding
polymer nano-fibers at right angle using a nano-cheese-cutter. The technique offers a number of
unique features: (i) Contrasting the point load in conventional AFM probes and nano-indenters,
the present geometry allows a line load to be applied to a sample; (ii) Both elastic modulus and
adhesion strength can be measured in a single setup; (iii) The two interacting fibers can be made
similar or dissimilar, e.g. different chemistry, with / without coating, and hollow / solid fibers etc;
and (iii) experiments can be conducted in a desirable aqueous environment at elevated
temperature.
Despite the remarkable similarity in the crossed-cylinder geometry, the nano-cheese-
cutter is quite different from the surface force apparatus (SFA) [161]. In SFA, atomically smooth
mica flakes are attached to the surface of two large glass cylinders. Upon a compressive load, an

144
adhesion contact circle is produced where the stress within is governed by the Hertz contact
theory. Elastic modulus can be measured but is essentially confined to the compression mode.
The adhesion energy is deduced from the measured critical “pull-off” force. The relatively large
contact area usually leads to the Johnson-Kendall-Roberts (JKR) type of adhesion mechanics. In
contrary, in a nano-cheese-cutter, radii of the two cylindrical fibers are much smaller. Local
deformation at the contact circle is too small to be characterized, but the global stretching of the
fiber along its length can be accurately measured and the elastic modulus of tension deduced.
The very small contact circle here makes the intersurface force range appears large, and thus the
JKR-DMT transition type of adhesion is applicable. The nano-cheese-cutter provides a unique
way to gauge mechanical integrity of individual fiber and fiber mesh.
5.7 Conclusion
A nano-cheese-cutter is designed and fabricated to directly measure the elastic modulus
of electrospun nano-fibers and adhesion energy of fiber-fiber interface. The technique is also
capable of investigating fatigue and repeated adhesion-detachment. The measurements have
significant impact in the mechanical performance of fiber mesh where fiber-fiber adhesion holds
the key to integrity, as well as performance of micro- / nano-devices with movable bridges and
cantilevers. This novel tool is extended to measure SWCNT bundle elastic modulus, interfacial
adhesion energy of freestanding SWCNT, and that between SWCNT bundle and electrospun
fiber in the extended study. The final result agrees with combining law of interfacial adhesion
energy quite well. The measurements have significant impact in evaluation the mechanical
performance of interfacial toughness between two different materials for enhancing composite
material, where interaction holds the key to integrity.
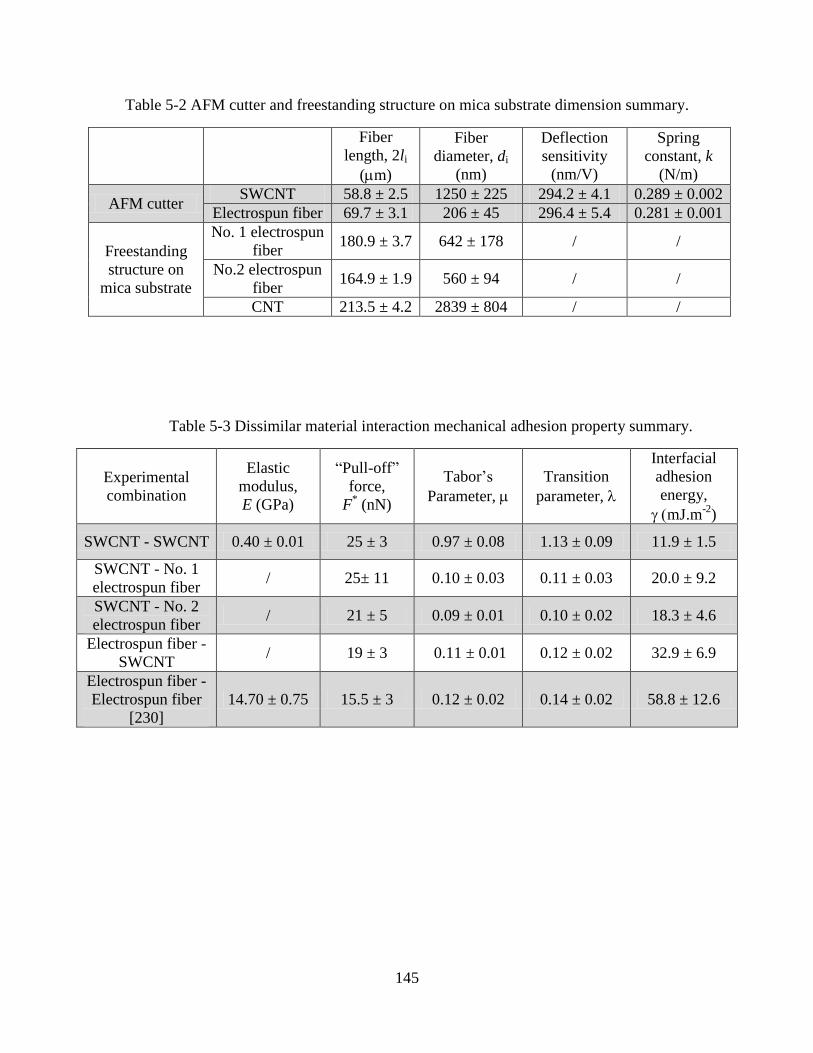
145
Table 5-2 AFM cutter and freestanding structure on mica substrate dimension summary.
Fiber
length, 2li
(m)
Fiber
diameter, di
(nm)
Deflection
sensitivity
(nm/V)
Spring
constant, k
(N/m)
AFM cutter SWCNT 58.8 ± 2.5 1250 ± 225 294.2 ± 4.1 0.289 ± 0.002
Electrospun fiber 69.7 ± 3.1 206 ± 45 296.4 ± 5.4 0.281 ± 0.001
Freestanding
structure on
mica substrate
No. 1 electrospun
fiber 180.9 ± 3.7 642 ± 178 / /
No.2 electrospun
fiber 164.9 ± 1.9 560 ± 94 / /
CNT 213.5 ± 4.2 2839 ± 804 / /
Table 5-3 Dissimilar material interaction mechanical adhesion property summary.
Experimental
combination
Elastic
modulus,
E (GPa)
“Pull-off”
force,
F* (nN)
Tabor’s
Parameter,
Transition
parameter,
Interfacial
adhesion
energy,
mJ.m-2
)
SWCNT - SWCNT 0.40 ± 0.01 25 ± 3 0.97 ± 0.08 1.13 ± 0.09 11.9 ± 1.5
SWCNT - No. 1
electrospun fiber / 25± 11 0.10 ± 0.03 0.11 ± 0.03 20.0 ± 9.2
SWCNT - No. 2
electrospun fiber / 21 ± 5 0.09 ± 0.01 0.10 ± 0.02 18.3 ± 4.6
Electrospun fiber -
SWCNT / 19 ± 3 0.11 ± 0.01 0.12 ± 0.02 32.9 ± 6.9
Electrospun fiber -
Electrospun fiber
[230]
14.70 ± 0.75 15.5 ± 3 0.12 ± 0.02 0.14 ± 0.02 58.8 ± 12.6

146
Chapter 6 Mechanical and Electromechanical Characterization of
Suspended SWCNT Thin Film on Patterned Polymer Substrate
6.1 Introduction
Single-walled carbon nanotubes (SWCNTs) are a well-known class of material due to
exceptional electrical, mechanical, optical, chemical and thermal properties associated with
unique quasi 1-D structure, atomically mono-layered surface and extended curved -bonding
configuration [231-233]. But there are two important challenges in scaling individual SWCNT to
any realistic type of system: (1) The inability to draw significant current output from single
SWCNT devices, and (2) The lack of practical methods to yield good device-to-device
reproducibility in properties [113]. So the much attention has been paid to SWCNT thin films as
an emerging class of materials for nanotechnology [234]. This kind of system involves large
numbers of nanotubes in random networks, aligned arrays, or anything in between, and with
thicknesses between sub-monolayer and a few layers in nano-scale. Recently wafer-scale
synthesis of these thin films, either by SWCNT growth or by assembly [234-237], has emerged
as the driving force for several applications including mechanically flexible and stretchable
electrodes, high mobility transistors, a suite of robust sensors and 2-D carbon networks in
mechanically reinforced composites [113, 238]. The effects of mechanical deformation on the
electrical response are the basic mechanism of SWCNT thin film in sensing and actuating, giving
the practical potential in many electrical nano-devices. Therefore, mechanical and
electromechanical properties of SWCNT thin film are the key in tailoring this nano-structure
wide applications.

147
An appreciable body of theoretical literatures exists on the topic that how bond stretching
and twisting in nanotubes affect the electrical properties [239-241], but only a few experimental
works, especially on the thin film level, have been published so far. In this chapter, SWCNT thin
films are transferred to a patterned polymer SU-8 substrate using a wet contact print method. The
mechanical properties are characterized for elastic modulus and thin film average thickness. The
electrical-mechanical interaction is investigated by in-situ electrical monitoring during AFM
tipless cantilever compression. This report helps to construct the fundamental understanding of
the relationship between mechanical deformation and electrical response geared towards next
generation flexible electronic nano-devices.
6.2 Methods and materials
This project is collaborated with Prof. Yung Joon Jung in Mechanical Engineering at
Northeastern University. The suspended SWCNT film samples for both mechanical and
electromechanical measurements were fabricated by Prof. Jung’s lab.
6.2.1 Suspended SWCNT thin film preparation
Template guided fluidic assembly was used to disperse SWCNTs onto suitably micro-
patterned and chemically heterogeneous 3-D substrates [242]. Briefly, the SiO2 / Si chip was
used as a substrate. In order to improve the contact between the SWCNT / DI water (0.23 wt%,
Brewer Science, Inc.) and substrate, the SiO2 surface was treated by plasma using the mixture of
SF6 (20 SCCM) (standard cubic centimeters per minute), O2 (20 SCCM), and Ar (5 SCCM) for
5s. For the sample to be mechanical characterized, a photoresist film (S1805) was spin coated on
Si / SiO2 substrate and patterned into the desired grooved structures using optical lithography.
The patterned substrate was then vertically submerged into the SWCNT / DI water and gradually

148
lifted up from the solution with a constant pulling speed of 0.1 mm/min. The SWCNT selectively
assembled on the exposed SiO2 regions forming arrays of SWCNT thin films with the desired
width and space. Finally, the photoresist was stripped off using acetone and isopropanol rinsing.
For the sample used for the electromechanical measurements, the bare substrate after plasma
treatment was directly submerged into SWCNT / DI water and lifted up at 0.05 mm/min, such
that a uniform thin film was formed on SiO2 surface. Afterwards, a thick photoresist layer
(S1818) was spin coated on the film surface and lithographically patterned into micro-lines,
followed by oxygen plasma etching (16 SCCM with power of 64 W) for 4 minutes, so the
exposed part of the film was etched away. Finally, the photoresist was stripped off using acetone
and isopropanol. Figure 6-1 shows the schematic of SWCNT assembly onto Si / SiO2 substrate
for mechanical characterization and electromechanical measurement.
SU-8 (2007), a well-known epoxy resin-based negative photoresist, was used to fabricate
the patterned polymer substrate. Before spin coating, the glass coverslip (Ted Pella, Inc.) was
cleaned thoroughly by fresh acetone and isopropanol. A SU-8 protective layer was first spin
coated on substrate with speed of 6000 RPM (revolutions per minute) for 1 min. SU-8 film was
baked at 65oC for 1 min and then 95
oC for 2 min known as soft bake. The film was then exposed
to UV light without any mask for 60 s. UV light initiated cross-linking by activating the photo-
initiators present in the SU-8 photoresist. After exposure, the patterns were again baked at 65oC
for 1 min and 95oC for 2 min known as post exposure bake (PEB). On the top of the protective
layer, another SU-8 layer (the patterning layer) was then coated following the same procedure
except for the exposure process in which a mask and an optical filter were applied onto the top of
substrate. The filter was used to straighten the light path such that a sharp trench of SU-8 was

149
obtained. The depth of each SU-8 strip was ~ 6 µm which can be considered as rigid substrate in
the following mechanical tests.
Figure 6-1 Schematic of SWCNT assembly onto Si / SiO2 substrate for mechanical
characterization and electromechanical measurement.

150
Figure 6-2 shows schematic of the wet contact print method used to transfer SWCNT thin
films from Si / SiO2 to micro-patterned SU-8 substrates. SWCNTs were assembled into aligned
structures (blue) on a Si substrate (yellow) with a SiO2 sacrificial layer on the top (pink). A SU-8
micro-pattern (green) on glass coverslip fabricated using optical lithography was brought in
contact with the SWCNT / SiO2 / Si substrate at a right angle with respect to the SWCNT thin
film. The combined substrate was turned upside down and a diluted HF acid solution (16%) was
dropped gently on the top. The SiO2 was etched away and the SWCNT architectures were
released onto the receiver substrate (SU-8). Finally the donor Si substrate was removed and the
solution was removed by attaching a piece of paper on the edge in ambient conditions. The detail
of fabrication process can be found in [243].
Figure 6-2 Schematic of the wet contact print method used to transfer SWCNT thin film from Si
/ SiO2 substrate to micro-patterned polymer SU-8 substrate [243].

151
6.2.2 Surface characterization of SWCNT thin film
Thin film topography was obtained by contact mode scanning using a regular AFM
cantilever (CONTV-A, Bruker, Inc.) with the scanning direction perpendicular to the thin film
axis. Scanning velocity was set at 1 line/second with resolution of 512 lines/frame. The width, b,
and the length, 2l, of all the suspended SWCNT thin films used in the data analysis were
measured post-mortem by scanning electron microscope (SEM, Carl Zeiss AG Supra 25) at 0.8-
1.5 kV.
6.2.3 Suspended SWCNT thin film mechanical characterization
Three different micro-patterned SU-8 substrates were prepared for suspended SWCNT
thin film mechanical characterization, namely, Line 6_9, Line 6_12 and Line 6_18. The first
number, p (m), represented the width of SU-8 strip and the second number, q (m), indicated
the distance between the centers of two nearby strips. The difference between p and q indicated
the gap distance of the trench on the substrate, so that the gap distances of SU-8 substrates were
3 m, 6 m and 12 m. Due to optical lithography used for SU-8 strips fabrication, the cross-
section of individual strip was a bow shape. Subsequently, the SWCNT thin films only rest upon
the top region of the curved surface, and hence were not fully in contact with the whole surface.
This caused the thin film suspending length, l, to be slightly larger than strip gap distance, (q-p).
Figure 6-3a is the SEM image of Line 6_12 sample for mechanical characterization. A flat tipless
silicon (Si) AFM cantilever coated with Al (NSC12 / tipless / AIBS, MikroMasch, Inc.) was
chosen to deform SWCNT suspending region. The deflection sensitivity was calibrated by
repeated contact mode indentation on a clean SU-8 substrate in air with sweep duration of 1.04
second, and the spring constant was found to be k = 11.9 ± 0.04 N.m-1
by the Cleveland method

152
[124]. Force measurements were performed using the combination system of an Agilent 5500
atomic force microscope (AFM) sitting on an Olympus GX71 inverted optical microscope. After
a desirable SWCNT suspended region was located by observing from inverted optical
microscope, the AFM tipless cantilever was precisely positioned such that the cantilever edge
was immediately above the centerline of suspended region. The thin film was pushed towards the
bottom of the trench and retracted back. The width of AFM tipless cantilever (11.5 ± 0.01 m,
listed in Figure 6-3b) was much larger than the width of suspended SWCNT film (~ 4.5 m in
Table 6-1), such that a uniform line-load was applied across the whole width. All measurements
were performed at room temperature with relative humidity of ~25%. Seven different suspended
SWCNT thin films were characterized and at least 10 measurements were performed on each.
After the quasi-static force-displacement measurement, 10 loading-unloading cycles were done
on each sample to characterize the viscoelasticity properties with a frequency of ~0.96 Hz. All
loading-unloading curves were done within in 1.04 seconds. The applied load needed to balance
the whole system, F, was measured as a function of the vertical actuation distance of the
piezoelectric cell, y. The positions chosen for mechanical characterization were approximately
the middle of individual SWCNT thin films on the strips in case of any edge or looseness effect
on the force measurements.

153
Figure 6-3 Suspended SWCNT thin film for mechanical characterization. (a) SEM image of Line
6_12 sample with gap distance of 6 m. (b) Inverted optical microscopy image of tipless AFM
cantilever compression suspended SWCNT thin film on Line 6_18 polymer substrate with gap
distance of 12 m.
6.2.4 Electromechanical experiment on suspended SWCNT thin film
Two widths of suspended SWCNT thin films on SU-8 polymer substrate were prepared
for electromechanical measurements, namely, ~5 m and ~10 m. The samples were deposited
using Palladium (Pd, 50 nm) to form good electrical contact pad with SWCNT film. The
suspended film was protected by a Si mask from any contaminant during deposition. Conductive
liquid silver paint (Ted Pella, Inc.) was used as adhesive to connect Cu wires to the contact pad.
The connection points were chosen so they were far enough away from the suspended region in
case of any collisions during AFM indentation. Figure 6-4a is an inverted optical microscopy
image of the sample used in electromechanical measurements, showing suspended SWCNT thin
film bridging over SU-8 trenches and connecting to a Pd contact pad for electron transportation.
Figure 6-4b is the magnified inverted optical microscope image showing suspended length, 2l,
and width, b. Figure 6-4c is SEM image of a suspended SWCNT thin film. Thin film between
two contact pads were carefully checked under the stereomicroscope (Olympus, BX51) before

154
experiments. If more than one SWCNT thin films were found to connect in parallel between two
contact pads, a micro-capillary needle (Tritech Research, Inc.) controlled by high resolution
micro-manipulator (AutoMate Scientific, Inc.) was used to break the thin films along the trench
edge, in order that only one thin film was connected for each sample. Electrical measurements
were carried out in ambient air at room temperature using Keithley 2400 SourceMeter
(Keithley Instruments Inc.). The SWCNT thin film was a high resistance sample (R > 1 k
shown in Table 6-2), so a two-terminal sensing circuit (accurate as four-terminal in this situation)
was used in all the conductivity measurements. The loading-unloading cycle ran for a certain
duration time and the conductance of the SWCNT thin film was simultaneously recorded as a
function of time. Conductance was monitored in 6 minutes and indentations were performed at
each end of the first 5 minutes. At least 11 measurements were characterized on each sample and
current-voltage (I-U) characterization was measured every 3 cycles to ensure no film damage
during the contact with AFM tipless cantilever. The external voltages applied through wire
bonding, U, were 0.1 V and 1 V for ~10 m and ~5m width SWCNT samples. Different
duration times for AFM indentation (5.04 s and 10 s) were used to investigate the
electromechanical hysteresis response.
Due to both geometry and stiffness requirements, commercial AFM tipless cantilever
(TL-NCL, NanoAndMore USA Inc.) was modified using a Focused Ion Beam (FIB) (JEOL JIB-
4500, JEOL USA, Inc.) to chop off the triangle head. The minor width of the modified AFM
tipless cantilever with trapezoid cross-section was 16.7 ± 0.5 m, which was wide enough to
give uniform compression across the whole film. Figure 6-5 shows the SEM images of a silicon
tipless AFM cantilever before and after FIB modification. The original material of tipless
cantilever was highly doped N-type Si with resistivity of 0.01-0.02 .cm. To avoid any thin film

155
charge dissipation during compression, a 140 nm thick SiO2 layer was created by oxidizing in air
at temperature of 1000 °C for 5.5 hours. Figure 6-6a shows a schematic of electromechanical
measurement on suspended SWCNT thin film overhanging over SU-8 strips. Figure 6-6b is an
inverted optical microscope image showing modified tipless AFM cantilever deforming a
SWCNT thin film suspended region.
Figure 6-4 Suspended SWCNT thin film for electromechanical measurement. (a) Inverted optical
microscope image of suspended thin film connecting to Pd contact pad for electron
transportation. (b) Magnified inverted optical microscope image showing suspended length, 2l,
and width, b. (c) SEM image of the suspended SWCNT thin film.

156
Figure 6-5 Tipless AFM cantilever used for electromechanical measurement. SEM image of (a)
Before FIB cutting. The red line indicates cutting position. (b) After FIB cutting.
Figure 6-6 Electromechanical measurement on suspended SWCNT thin film overhanging over
two SU-8 strips. (a) Schematic of electromechanical measurement. (b) Inverted optical
microscope image showing modified tipless AFM cantilever deforming suspended region.
6.3 Results and analysis
6.3.1 SWCNT film topography
Figure 6-7 shows an AFM topographical scan and cross-section profile of a thin film
unsuspended region. This is the sample that is used in the mechanical characterization. The
whole film is not perfectly flat and there are large bumps / deviations on either side of the film.

157
Due to template guided fluidic assembly method used to disperse SWCNTs onto micro-patterned
3-D substrates, the trench corners supply a better confined region which has more surface area
and thus higher capillary force to hold the wetting solution, leading to a thicker film. The film
thickness is range from 7.4 nm in the center to 39.5 nm on the edge, indicating this thin film
involves a few layers of nanotubes assembled in the system.
Figure 6-7 AFM scanning of SWCNT film on SU-8 strip for mechanical characterization. (a)
AFM topological scan. (b) Cross-section profile of SWCNT film.
For the electromechanical test, the thickness of the SWCNT film is h = 45.7 ± 0.7 nm
(shown in Table 6-2) based on AFM scanning which is thicker than the sample for mechanical
characterization due to a slower pulling velocity of the Si / SiO2 substrate from the SWCNT / DI
water during the SWCNTs assembly. This is because slower pulling speed improves the contact
between the substrate and SWCNT/DI water and thus promotes SWCNTs assembly.
6.3.2 Mechanical characterization
Figure 6-8 shows ten loading-unloading force-displacement curves of SWCNT thin films
suspended on Line 6_12 SU-8 substrate. The measured force curves, F(y), are highly

158
reproducible and any viscoelastic properties are ruled out because sequent cyclic loading-
unloading coincide quite well. Figure 6-9 is a representative force-displacement curve of a
SWCNT thin film suspended on Line 6_9 substrate. In the loading curve along AB, there is no
interfacial force between the tipless AFM cantilever and the suspended thin film, so the
measured force is set to as a baseline for the apparent “zero” load. Upon further loading, the
tipless AFM cantilever comes into contacts with the centerline of the thin film at point B and
pushes the film towards the trench bottom along BC. Once the desirable indentation depth is
reached, the cantilever retracts from the thin film and gives the unloading curve along CDGH.
The applied force returns to tension along DGH, which is needed to counterbalance the adhesion
force between the cantilever and thin film. The cantilever fully detaches from the thin film at H.
Figure 6-10 is the mechanical response comparison of SWCNT thin films suspended on SU-8
strips with different gaps. The established V-peel model [171] is used to fit the SWCNT thin film
mechanical response for elastic modulus, E, and average thickness, h.
Generally speaking, an external line load, F, is applied at the centerline of a strip with
width, b, length, 2l, thickness, h, elastic modulus, E and Poission’s ratio, , which is adhered to a
substrate. The film is elastically deformed into a V-shape under a mixed bending and stretching.
The film profile is denoted by w(x) with a central deflection, w0. For simplicity, a set of useful
dimensionless parameters are defined as follows:
Dbh
Fl
D
Nl
h
w
h
w
l
x
2,)(,,,
32/10
0 Eqn (6-1)
The parameter is defined to be the ratio of membrane stress to film rigidity such that ≈0 for
pure bending and →∞ for pure stretching. The final analytical solution is

159
sinh
)1(coshsinh
2
30
Eqn (6-2)
)sinh3cosh2(6
)cosh1(7
Eqn (6-3)
Raw AFM force-displacement (F vs. y) is converted to the relation between applied force
and thin film deflection at the centerline (F vs. w0) by correcting for cantilever deflection from
the piezo displacement. Two apparent dominant regions are shown in the log-log plot of F vs. w0.
The stretching dominance with relation of 3
0 wF yields a linear dependence of log [F] upon log
[w0] with slope of 3 and bending deformation mode gives rise to a linear F (w0). The elastic
modulus, E, and thin film average thickness, h, are deduced from the intercepts of two linear
regions with F-axis. Figure 6-11 shows the curve fitting result of the normalized mechanical
response of suspended SWCNT thin films on SU-8 strips with a wide range of gaps (3 m, 6 m
and 12 m) to the V-peel adhesion model, showing that the AFM experimental measurements fit
the theoretical adhesion model quite well. The elastic modulus and thin film thickness are shown
in Table 6-1. The elastic modulus (E = 32.9 ± 3.6 GPa) and thin film thickness (h = 31.4 ± 3.3
nm) are almost the same in the statistical range for SWCNT thin films suspended on SU-8 strips
with different gaps. This is true because the elastic modulus is a material parameter indicating
sample stiffness, which should be independent of the gap dimension on the substrate. Due to a
non-flat cross-section of the thin film shown in Figure 6-7, the thickness calculated based on the
V-peel adhesion model only represents the average thickness. Figure 6-12 is bar chart of elastic
modulus, E, and average thickness, h, for suspended SWCNT thin films on SU-8 strips with
three different gaps.

160
Figure 6-8 Ten AFM force-displacement curves of SWCNT thin film suspended on strips with
gap distance of 3 m showing mechanical measurement reproducibility.

161
AFM Piezo Displacement, y (nm)
-400 -200 0 200 400 600 800
App
lied
For
ce, F
(nN
)
-800
-400
0
400
800
1200
Line 6_9 SuspendedThin Film
Loading
UnloadingS
WC
NT
Film
AB
C
G
H
D
Compression
Tension
Figure 6-9 Representative force-displacement curve of SWCNT thin film suspended on strips
with gap distance of 3 m showing loading curve (ABC) and unloading curve (CDGH).

162
AFM Piezo Displacement, y (nm)
-500 -250 0 250 500 750
App
lied
For
ce, F
(nN
)
-1000
-500
0
500
1000
1500
Rigid Substrate
Line 6_9
(Gap 3 m)
Line 6_12
(Gap 6 m)
Line 6_18
(Gap 12 m)
Figure 6-10 Mechanical behavior comparison of SWCNT thin films suspended on SU-8 strips
with different gaps.

163
Figure 6-11 Curve fitting to the V-peel mechanical model to deduce the elastic modulus and the
average thickness of SWCNT thin films suspended on strips with different gaps.

164
SWCNT Film Type
Line 6_9 Line 6_12 Line 6_18
Ela
stic
Mod
ulus
, E
(G
Pa)
0
10
20
30
40
50
Film
Thi
ckne
ss, h
(nm
)
0
10
20
30
40
50
60
Figure 6-12 Bar chart of the elastic modulus and the average thin film thickness for SWCNT thin
films suspended on SU-8 strips with three different gaps.
6.3.3 Electromechanical measurement on suspended SWCNT thin film
Figure 6-13 is 6-min electromechanical result on a suspended ~10 m-width thin film
with an AFM duration time of 5.04 s. Figure 6-13a is the SWCNT thin film electrical
conductance, applied force and SWCNT thin film central deflection as a function of time in 360
s. Figure 6-13b is the magnified images from 116 s to 122 s showing the electrical-mechanical
interaction. The conductance of the thin film decreases every time when the modified AFM
cantilever pushes the thin film downward into the trench, but totally recovers after the cantilever
retracts back. The deformed SWCNT thin film resumes to its original shape after the AFM
cantilever fully detaches. The repeated pushing-retracting action causes oscillations in the sample
conductance, interaction force, and thin film central deflection with equal periodicity.

165
Importantly, both the mechanical deformation and electrical conductance of the thin film are
highly reversible. The full reversal of these characteristics upon cantilever retraction has
important implications: (1) Reversibility in the electrical property indicates that the contact
between Pd contact pad and thin film are not affected during the whole electromechanical
measurement. The observed change in sample conductance is entirely due to the mechanical
deformation of the SWCNT caused by the cantilever compression. (2) Reversibility in both the
mechanical and electrical properties indicates that the suspended region of the film does not get
any obvious damage when contact with cantilever. (3) van der Waals interaction between thin
film and substrate is strong enough to anchor thin film on the strips and prevent it from any
stretching or sliding during the attachment and detachment. (4) Reversibility proves the
durability, stability and reliability of SWCNT thin film in both mechanical and electrical
responses, which is an important property in the applications in flexible electronic nano-devices.
Figure 6-14 is 6-min electromechanical result on suspended ~10 m-width thin film with an
AFM indentation duration time of 10 s. Figure 6-14b is the magnified image from 119 s to 125 s
showing electrical-mechanical interaction. Compared to Figure 6-13, there is no electrical and
mechanical hysteresis observed even though the AFM duration time increases one time (from
5.04 s to 10 s). Figure 6-15 is 6-min electromechanical result on suspended ~5 m wide thin film
with duration time of 5.04 s, which shows the same tendency that the SWCNT thin film
conductance decreases as the modified AFM cantilever compresses the film. The basic line of
conductance as a function of time slightly increases is due to thin film self-heating problem
during electron transport. Figure 6-16 is experimental result of electrical conductance change
versus mechanical deformation for SWCNT thin films with different width. The basic
calculation is shown following:

166
The film conductivity is G = I / U = .A/l
∆I = │I1-I0│=│U.(G1 - G0)│= │U.(.A/L1 - .A/ L0)│= │(L1- L0)/ L1. L0│.U..A
Assume thin film deformation is small, so L1 ≈L0. The final relation between ∆I and ∆l is
∆I =∆L /L02. U..A
The slope of ∆I vs. ∆l curve is slope = U..A/L02
Theoretical result
18.0m 489.2
μm 7.458
μm 3.5
μm 7.10
nm 7.45
nm 7.45
volt10
volt1
)(
)(
)/(..
)/(..
Slope
Slope2
2
100
2
50
5
10
5
10
2
5055
2
1001010
5
10
L
L
A
A
U
U
LAU
LAU
Experimental result: Slope10/Slope5 = 0.62/3.58 = 0.17
Slope10 = 0.66 nA/nm→3.2 S.m-1
Slope5 = 3.58 nA/nm→3.1 S.m-1
with G the thin film conductance, I the current inside thin film, U the external voltage applied
through wire bonding, L the length of the thin film, L and I the changes in length and current
due to cantilever compression, A the cross-sectional area of the thin film and the electrical
conductivity. The subscripts of “5” and “10” indicates the suspended SWCNT thin film with
width of ~ 5 m and ~ 10 m, respectively. Subscripts of “0” and “1” represent thin film original
status before the cantilever compression and the status when the thin film gets the max central
deflection due to AFM cantilever indentation.

167
Con
duct
ance
, G (
S)
318.0
318.2
318.4
318.6
For
ce, F
(
N)
-10
0
10
20
30
Time, t (s)
0 60 120 180 240 300 360
Def
orm
atio
n, d
(nm
)
-300
0
300
600
(a)
duration time = 5.04 s
width b = 10.7 m

168
Con
duct
ance
, G (
S)
318.2
318.3
318.4
318.5
For
ce, F
(
N)
-10
0
10
20
30
Time, t (s)
116 117 118 119 120 121 122
Def
orm
atio
n, d
(nm
)
-300
0
300
600
(b) duration time = 5.04 s
width b = 10.7 m
Figure 6-13 6-min electromechanical measurement on suspended SWCNT thin film with width
of ~10 m. The AFM indentation duration time is 5.04s. (a) SWCNT thin film electrical
conductance, applied force and SWCNT thin film central deflection as a function of time in 360s.
(b) Magnified images from 116s to 122s showing electrical-mechanical interaction.

169
Con
duct
ance
, G (
S)
318.4
318.6
318.8
319.0
319.2
For
ce, F
(
N)
-10
0
10
20
30
Time, t (s)
0 60 120 180 240 300 360
Def
orm
atio
n, d
(nm
)
-300
0
300
600
900
(a)
duration time = 10 s
width b = 10.7 m

170
Con
duct
ance
, G (
S)
318.6
318.7
318.8
318.9
For
ce, F
(
N)
-10
0
10
20
30
Time, t (s)
119 120 121 122 123 124 125
Def
orm
atio
n, d
(nm
)
-300
0
300
600
duration time = 10 s
width b = 10.7 m
(b)
Figure 6-14 6-min electromechanical measurement on suspended SWCNT thin film with width
of ~15 m. The AFM indentation duration time is 10s. (a) SWCNT thin film electrical
conductance, applied force and SWCNT thin film central deflection as a function of time in 360s.
(b) Magnified images from 119s to 125s showing electrical-mechanical interaction.

171
Con
duct
ance
, G (
S)
21.32
21.34
21.36
21.38
For
ce, F
(
N)
-10
0
10
20
30
Time, t (s)
0 60 120 180 240 300 360
Def
orm
atio
n, d
(nm
)
-600
-300
0
300
(a) duration time = 5.04s
width b = 5.3 m

172
Con
duct
ance
, G (
S)
21.32
21.34
21.36
21.38
For
ce, F
(
N)
-10
0
10
20
Time, t (s)
117 118 119 120 121
Def
orm
atio
n, d
(nm
)
-600
-300
0
300
(b) duration time = 5.04s
width b = 5.3 m
Figure 6-15 6-min electromechanical measurement on suspended SWCNT thin film with width
of ~5 m. The AFM indentation duration time is 5.04s. (a) SWCNT thin film electrical
conductance, applied force and SWCNT thin film central deflection as a function of time in 360s.
(b) Magnified images from 117s to 121s showing electrical-mechanical interaction.

173
l (nm)
0 5 10 15 20 25 30
I
(nA
)
0
5
10
15
20
25
30
b= 5.306 m
R2
=0.9699
Slope2=3.58
=3.155 MS/m
b= 10.713 m
R2
=0.9869
Slope1=0.662
=3.236 MS/m
Theoretical ratio:
Slope1/Slope2=0.178
Experimental ratio
Slope1/Slope2=0.185
Figure 6-16 Experimental result of electrical current through thin film versus mechanical
deformation for suspended SWCNT thin film with different widths.
6.4 Discussion
Mechanical and electromechanical properties of SWCNT thin film is successfully
characterized using tipless AFM cantilever compression. Established “V-peel” linear elastic
model is adopted to fit the mechanical response for elastic modulus and average thickness. The
elastic modulus of thin film is ~30 GPa, which is the among the highest values reported for
random aligned SWCNT network. This is due to the extra energy absorption required for the
hollow structures of carbon nanotubes compared to the most materials. The thin film thickness is
range from 7.4 nm in the center to 39.5 nm on the edge and the average film thickness is ~30 nm.

174
In-situ electrical response is monitored under AFM tipless cantilever manipulation, revealing the
electro-mechanical properties. The experiments here help to construct the basis for the next
generation of flexible electronics with a fundamental understanding in morphology-property (i.e.
mechanical/electrical properties) relationship. The ultimate goal is to build hierarchical SWCNTs
in flexible electronics in highly organized and well-controlled manner.
The proposed method of SWCNT thin film mechanical and electromechanical properties
measurements possesses several major advantages over the other methods: (i) both mechanical
and electromechanical properties can be measured in a single setup; (ii) the measurement is not
confined to SWCNT thin film, it can also be used to characterize individual SWCNT or SWCNT
bundle or graphene; (iii) the method is applicable to any rigid or flexible substrates, such as
PDMS, though the governing equation will have to be modified accordingly to account for
substrate deformation; (iv) a new “all in one” experimental set-up can be achieved based on the
current set-up in order to measure SWCNT film electrical/thermal properties simultaneously
during AFM indentation. Pre-stress or pre-strain can also be applied to SWCNT thin films in
order to see the mechanical-electrical-thermal interaction.
6.5 Conclusion
In conclusion, a simple and convenient method is reported to characterize SWCNT thin
film mechanical and electromechanical properties, which is essential in designing SWCNT thin
film based electronic devices and in gauging their reliability. Our preliminary results will help to
understand the basis relationship between morphology and property for next generation flexible
devices. It also reveal potential application of SWCNT thin film in building robust sensing and
actuation system.

175
Table 6-1 Mechanical characterization of suspended SWCNT thin film summary.
Suspended
SWCNT thin
film
Sample Dimensions Properties Based on AFM
Measurement
p (m) q (m) 2l (m) b (m) E (GPa) h (nm)
Line 6_9 6.1 ± 0.2 9.5 ± 0.1 4.6 ± 0.3 4.6 ± 0.2 31.5 ± 5.6 29.2 ± 4.3
Line 6_12 6.5 ± 0.3 12.7 ± 0.3 7.8 ± 0.9 4.5 ± 0.3 32.8 ± 3.2 32.1 ± 2.5
Line 6_18 7.4 ± 1.0 18.7 ± 1.4 13.4 ± 0.23 4.3 ± 0.4 34.3 ± 2.1 32.9 ± 3.1
Table 6-2 Suspended SWCNT film summary for electromechanical measurements.
Suspende
d film
width, b
(m)
Suspended
film
length, 2l
(m)
Suspended
film
thickness, h
(nm)
Film length
for electron
transport,
L (m)
Voltage,
U (volt)
Resistance,
R (k)
Conductivity,
(MS/m)
5.3 ± 0.8 18.8 ± 0.1 45.7 ± 0.6 458.7 ± 0.9 1 3.2 ± 0.1 3.1
10.7 ± 0.7 21.2 ± 0.2 45.7 ± 0.6 489.2 ± 1.2 0.1 46.6 ± 0.2 3.2

176
Chapter 7 Conclusion and Future Work
7.1 Significant contributions and conclusions
This dissertation is focused on integrated surface and mechanical characterization of
freestanding biological and other nano-structures using atomic force microscopy. Two cases are
studied in the part of cell mechanics, the first of which is cancer cells, to get the mechanical
properties of the glycoprotein mucin layer over-expressed by cancer cells and its correlation with
resistance against drug delivery. Secondly, multi bacteria strains associated with waste water
treatment are investigated to correlate the microbial macroscopic aggregation-deposition-
transportation behavior to microscopic adhesion properties using the dimensionless Tabor’s
parameter. For the nano-structure mechanics study, a novel nano-cheese-cutter is fabricated to
directly measure the elastic modulus and interfacial adhesion energy of 1-D freestanding similar
/ dissimilar nano-structures. The goal of 2-D single walled carbon nanotube (SWCNT) thin films
study is to characterize suspended SWCNT film mechanical and electromechanical properties.
In the cancer cell study, the AFM probe characterizes the mechanical barrier of six
human mucinous and multidrug resistant carcinomas. Mechanical measurements show explicitly
the presence of mucin and their ability to fend off invading mechanical probes or drug delivery
microcapsules, while their glycosylation inhibited counterpart exhibit distinctly weaker
mechanical resistance. In ovarian cells, there is a direct correlation between the mechanical
resistance and their known natural ability to defend host cells against drug delivery. Although
mechanical barrier alone is certainly not the only mechanism that hinders drug transport, it
contributes quite significantly to the ineffectiveness of cytotoxic drug therapy. The studies

177
reported herein offer additional support for the development of clinical and pharmaceutical
approaches to combat mucin over-expression in tumors during cancer chemotherapy.
In the microorganism mechanics project, a dimensionless Tabor’s parameter is developed
to correlate the bacterial microscopic adhesion mechanical properties and microbial aggregation-
deposition-transportation behavior. It bears a strong correlation for vastly different strains
cultured with different time in both DI and electrolyte solution with wide range of ionic strength.
This work presents an important step to incorporate the fundamental surface science and solid
mechanics into the subject of microbial adhesion-aggregation-transportation, potentially
improving the conventional empirically driven approach for predicting microbial attachment and
transportation in porous medium.
A nano-cheese-cutter is designed and fabricated to directly measure the elastic modulus
of electrospun nano-fibers and adhesion energy of fiber-fiber interface. The technique offers a
number of unique features: (i) Contrasting the point load in conventional AFM probes and nano-
indenters, the present geometry allows a line load to be applied to a sample; (ii) Both elastic
modulus and adhesion strength can be measured in a single setup; (iii) The two interacting fibers
can be made similar or dissimilar, e.g. different chemistry, with/without coating, and hollow /
solid fibers etc; and (iv) Experiments can be conducted in a desirable aqueous environment at
elevated temperature. The technique is also capable of investigating fatigue and repeated
adhesion-detachment. The measurements have a significant impact in the mechanical
performance of fiber mesh where inter-fiber adhesion holds the key to the mesh integrity, as well
as performance of micro- / nano-devices with movable bridges and cantilevers. This novel device
is extended to study interfacial adhesion energy between two dissimilar materials.

178
Tipless AFM cantilevers is successfully used to characterize SWCNT thin film
mechanical properties and the “V-peel” linear elastic model is adopted to fit the mechanical
response for elastic modulus and average thin film thickness. Another modified AFM tipless
cantilever is used to deflect suspended SWCNT films on a polymer trench reversibly in the
electromechanical experiments. The current through SWCNT thin film is real-time monitored.
The mechanical response and electrical conductance change reveal the interaction between
mechanical deformation and electrical response. The final results could have a great impact on
many applications such as next-generation mechanically flexible and stretchable thin-film
electrodes.
7.2 Future work
A number of promising future research directions could be proposed based on this
dissertation:
1) In the mechanical characterization of cancer cells with and without mucin glycosylation
project, six kinds of natural and glycosylated cancer cells are characterized using an AFM.
Future work will focus on the endocytosis of drug loaded liposome to lipid membranes of cancer
cells.
2) For the microbial adhesion-aggregation-transportation research, a strong correlation
between Tabor’s parameter and cell aggregation-deposition-transportation behavior is shown.
But cell attachment and detachment in a porous medium is a complex mechanical process which
requires knowledge of fluid behavior as well as system / cell material properties and aqueous
environment. Tabor’s parameter is expected to vary as a function of liquid flow, diffusion-

179
convection, aspect ratio of cell to collector and a number of relevant parameters related to the
cell structure and aqueous environment.
3) A nano-cheese-cutter is fabricated using the combination system of optical microscopy
and micromanipulator, and utilized for the studies of the efiber-efiber, SWCNT-SWCNT and
efiber-SWCNT interfacial adhesion properties. SEM combined with the nano-manipulator is an
optimal tool in the future to decreases the freestanding nano-fiber diameter, which makes it
possible to attach a single SWCNT onto the free end of a tipless cantilever. This “sharpest”
nano-knife in the world could potentially be used to investigate the interaction between nano-
materials and single human cells for understanding the potential health and environment effects.
4) We have already got the basic idea about SWCNT thin film mechanical and
electromechanical properties. A new “all in one” experimental set-up is expected to be built
which can measure CNT film electrical / thermal properties simultaneously during AFM
indentation. Pre-stress or pre-strain can be applied to SWCNT thin films in order to see the
mechanical-electrical-thermal interaction. AFM peeling experiments are proposed to be designed
by attaching SWCNT films onto AFM cantilevers and peeling them off from PDMS or SU-8
substrates for the interfacial fracture characterization in SWCNT flexible electronics device.

180
REFERENCES
1. Wang, N., Tytell, J.D., and Ingber, D.E., Mechanotransduction at a distance: mechanically coupling the
extracellular matrix with the nucleus. Nature Reviews Molecular Cell Biology, 2009. 10(1): p. 75-82.
2. Starodubtseva, M.N., Mechanical properties of cells and ageing. Ageing Research Reviews, 2011. 10(1): p.
16-25.
3. Guerroudj, M., de Longueville, J.C., Rooze, M., Hinsenkamp, M., Feipel, V., and Schuind, F.,
Biomechanical properties of triceps brachii tendon after in vitro simulation of different posterior surgical
approaches. Journal of Shoulder and Elbow Surgery, 2007. 16(6): p. 849-853.
4. Mcdowellboyer, L.M., Hunt, J.R., and Sitar, N., Particle-Transport through Porous-Media - Reply. Water
Resources Research, 1987. 23(8): p. 1699-1699.
5. Dunne, W.M., Bacterial adhesion: Seen any good biofilms lately? Clinical Microbiology Reviews, 2002.
15(2): p. 155-166.
6. Kendall, K., Kendall, M., Rehfeldt, F., and SpringerLink (Online service), Adhesion of Cells, Viruses and
Proteins. 2011, Springer: Dordrecht.
7. Maboudian, R., Surface processes in MEMS technology. Surface Science Reports, 1998. 30(6-8): p. 209-
270.
8. Maboudian, R., Ashurst, W.R., and Carraro, C., Self-assembled monolayers as anti-stiction coatings for
MEMS: characteristics and recent developments. Sensors and Actuators a-Physical, 2000. 82(1-3): p. 219-
223.
9. Raccurt, O., Tardif, F., d'Avitaya, F.A., and Vareine, T., Influence of liquid surface tension on stiction of
SOI MEMS. Journal of Micromechanics and Microengineering, 2004. 14(7): p. 1083-1090.
10. Zhao, Y.P., Wang, L.S., and Yu, T.X., Mechanics of adhesion in MEMS - a review. Journal of Adhesion
Science and Technology, 2003. 17(4): p. 519-546.
11. Bhushan, B., Nanotribology and nanomechanics in nano/biotechnology. Philosophical Transactions of the
Royal Society a-Mathematical Physical and Engineering Sciences, 2008. 366(1870): p. 1499-1537.
12. Suresh, S., Biomechanics and biophysics of cancer cells. Acta Materialia, 2007. 55(12): p. 3989-4014.
13. Van Vliet, K.J., Bao, G., and Suresh, S., The biomechanics toolbox: experimental approaches for living
cells and biomolecules. Acta Materialia, 2003. 51(19): p. 5881-5905.
14. Zhu, Y., Ke, C., and Espinosa, H.D., Experimental techniques for the mechanical characterization of one-
dimensional nanostructures. Experimental Mechanics, 2007. 47(1): p. 7-24.
15. Wong, E.W., Sheehan, P.E., and Lieber, C.M., Nanobeam mechanics: Elasticity, strength, and toughness of
nanorods and nanotubes. Science, 1997. 277(5334): p. 1971-1975.
16. Wu, B., Heidelberg, A., and Boland, J.J., Mechanical properties of ultrahigh-strength gold nanowires.
Nature Materials, 2005. 4(7): p. 525-529.
17. Salvetat, J.P., Briggs, G.A.D., Bonard, J.M., Bacsa, R.R., Kulik, A.J., Stockli, T., Burnham, N.A., and
Forro, L., Elastic and shear moduli of single-walled carbon nanotube ropes. Physical Review Letters, 1999.
82(5): p. 944-947.
18. Marszalek, P.E., Greenleaf, W.J., Li, H.B., Oberhauser, A.F., and Fernandez, J.M., Atomic force
microscopy captures quantized plastic deformation in gold nanowires. Proceedings of the National
Academy of Sciences of the United States of America, 2000. 97(12): p. 6282-6286.
19. Li, X.D., Gao, H.S., Murphy, C.J., and Caswell, K.K., Nanoindentation of silver nanowires. Nano Letters,
2003. 3(11): p. 1495-1498.
20. Espinosa, H.D., Prorok, B.C., and Fischer, M., A methodology for determining mechanical properties of
freestanding thin films and MEMS materials. Journal of the Mechanics and Physics of Solids, 2003. 51(1):
p. 47-67.
21. Espinosa, H.D. and Peng, B., A new methodology to investigate fracture toughness of freestanding MEMS
and advanced materials in thin film form. Journal of Microelectromechanical Systems, 2005. 14(1): p. 153-
159.
22. Greer, J.R., Oliver, W.C., and Nix, W.D., Size dependence of mechanical properties of gold at the micron
scale in the absence of strain gradients. Acta Materialia, 2005. 53(6): p. 1821-1830.
23. Yu, M.F., Lourie, O., Dyer, M.J., Moloni, K., Kelly, T.F., and Ruoff, R.S., Strength and breaking
mechanism of multiwalled carbon nanotubes under tensile load. Science, 2000. 287(5453): p. 637-640.

181
24. Haque, M.A. and Saif, M.T.A., Deformation mechanisms in free-standing nanoscale thin films: A
quantitative in situ transmission electron microscope study. Proceedings of the National Academy of
Sciences of the United States of America, 2004. 101(17): p. 6335-6340.
25. Kaul, P.B., Singh, U., and Prakash, V., In situ Characterization of Nanomechanical Behavior of Free-
standing Nanostructures. Experimental Mechanics, 2009. 49(2): p. 191-205.
26. Poncharal, P., Wang, Z.L., Ugarte, D., and de Heer, W.A., Electrostatic deflections and electromechanical
resonances of carbon nanotubes. Science, 1999. 283(5407): p. 1513-1516.
27. Espinosa, H.D., Zhu, Y., and Moldovan, N., Design and operation of a MEMS-based material testing
system for nanomechanical characterization. Journal of Microelectromechanical Systems, 2007. 16(5): p.
1219-1231.
28. Gaboriaud, F. and Dufrene, Y.F., Atomic force microscopy of microbial cells: Application to
nanomechanical properties, surface forces and molecular recognition forces. Colloids and Surfaces B-
Biointerfaces, 2007. 54(1): p. 10-19.
29. Hertz, H., Miscellaneous Papers. 1896, trans. English, London: Macmillian.
30. Maugis, D., Contact, adhesion, and rupture of elastic solids. Springer series in solid-state sciences,. 2000,
Berlin ; New York: Springer.
31. Johnson, K.L., Kendall, K., and Roberts, A.D., Surface energy and the contact of elastic solids.
Proceedings of the Royal Society of London A, 1971. 324: p. 301-313.
32. Tabor, D., Surface forces and surface interactions. Journal of Colloid and Interface Science, 1977. 58(1): p.
2-13.
33. Maugis, D., Adhesion of spheres: The JKR-DMT transition using a dugdale model. Journal of Colloid and
Interface Science, 1992. 150(1): p. 243-269.
34. Maugis, D., The JKR-DMT transition using a Dugdale model. Journal of Colloid and Interface Science,
1992. 150: p. 243-269.
35. Johnson, K.L. and Greenwood, J.A., An Adhesion Map for the Contact of Elastic Spheres Journal of
Colloid and Interface Science, 1997. 192(2): p. 326-333.
36. Han, J.D. and Rubin, C.S., Regulation of cytoskeleton organization and paxillin dephosphorylation by
cAMP - Studies on murine Y1 adrenal cells. Journal of Biological Chemistry, 1996. 271(46): p. 29211-
29215.
37. Yang, I.H., Co, C.C., and Ho, C.C., Alteration of human neuroblastoma cell morphology and neurite
extension with micropatterns. Biomaterials, 2005. 26(33): p. 6599-6609.
38. Berdyyeva, T., Woodworth, C.D., and Sokolov, I., Visualization of cytoskeletal elements by the atomic
force microscope. Ultramicroscopy, 2005. 102(3): p. 189-198.
39. Lekka, M., Laidler, P., Ignacak, J., Labedz, M., Lekki, J., Struszczyk, H., Stachura, Z., and Hrynkiewicz,
A.Z., The effect of chitosan on stiffness and glycolytic activity of human bladder cells. Biochimica Et
Biophysica Acta-Molecular Cell Research, 2001. 1540(2): p. 127-136.
40. Park, S., Koch, D., Cardenas, R., Kas, J., and Shih, C.K., Cell motility and local viscoelasticity of
fibroblasts. Biophysical Journal, 2005. 89(6): p. 4330-4342.
41. Ward, K.A., Li, W.I., Zimmer, S., and Davis, T., Viscoelastic Properties of Transformed-Cells - Role in
Tumor-Cell Progression and Metastasis Formation. Biorheology, 1991. 28(3-4): p. 301-313.
42. Guck, J., Schinkinger, S., Lincoln, B., Wottawah, F., Ebert, S., Romeyke, M., Lenz, D., Erickson, H.M.,
Ananthakrishnan, R., Mitchell, D., Kas, J., Ulvick, S., and Bilby, C., Optical deformability as an inherent
cell marker for testing malignant transformation and metastatic competence. Biophysical Journal, 2005.
88(5): p. 3689-3698.
43. Lincoln, B., Erickson, H.M., Schinkinger, S., Wottawah, F., Mitchell, D., Ulvick, S., Bilby, C., and Guck,
J., Deformability-based flow cytometry. Cytometry Part A, 2004. 59A(2): p. 203-209.
44. Cross, S.E., Jin, Y.S., Rao, J., and Gimzewski, J.K., Nanomechanical analysis of cells from cancer patients.
Nature Nanotechnology, 2007. 2(12): p. 780-783.
45. Lekka, M., Laidler, P., Gil, D., Lekki, J., Stachura, Z., and Hrynkiewicz, A.Z., Elasticity of normal and
cancerous human bladder cells studied by scanning force microscopy. European Biophysics Journal with
Biophysics Letters, 1999. 28(4): p. 312-316.
46. Li, Q.S., Lee, G.Y.H., Ong, C.N., and Lim, C.T., AFM indentation study of breast cancer cells.
Biochemical and Biophysical Research Communications, 2008. 374(4): p. 609-613.
47. Hollingsworth, M.A. and Swanson, B.J., Mucins in cancer: Protection and control of the cell surface.
Nature Reviews Cancer, 2004. 4(1): p. 45-60.
182
48. Brayshaw, D.J., Berry, M., and McMaster, T.J., Reducing a polymer to its subunits as an aid to molecular
mapping. Nanotechnology, 2004. 15(11): p. 1391-1396.
49. Deacon, M.P., McGurk, S., Roberts, C.J., Williams, P.M., Tendler, S.J.B., Davies, M.C., Davis, S.S., and
Harding, S.E., Atomic force microscopy of gastric mucin and chitosan mucoadhesive systems. Biochemical
Journal, 2000. 348: p. 557-563.
50. McMaster, T.J., Berry, M., Corfield, A.P., and Miles, M.J., Atomic force microscopy of the submolecular
architecture of hydrated ocular mucins. Biophysical Journal, 1999. 77(1): p. 533-541.
51. Round, A.N., Berry, M., McMaster, T.J., Corfield, A.P., and Miles, M.J., Glycopolymer charge density
determines conformation in human ocular mucin gene products: an atomic force microscope study. Journal
of Structural Biology, 2004. 145(3): p. 246-253.
52. Iyer, S., Gaikwad, R.M., Subba-Rao, V., Woodworth, C.D., and Sokolov, I., Atomic force microscopy
detects differences in the surface brush of normal and cancerous cells. Nature Nanotechnology, 2009. 4(6):
p. 389-393.
53. Bos, R., van der Mei, H.C., and Busscher, H.J., Physico-chemistry of initial microbial adhesive interactions
- its mechanisms and methods for study. Fems Microbiology Reviews, 1999. 23(2): p. 179-230.
54. Bucolo, M., Carnazza, T., Fortuna, L., Frasca, M., Guglielmino, S., Marletta, G., and Satriano, C., Self-
organization and emergent models in bacterial adhesion on engineered polymer surfaces. 2004 Ieee
International Symposium on Circuits and Systems, Vol 3, Proceedings, 2004: p. 689-692.
55. Oh, Y.J., Lee, N.R., Jo, W., Jung, W.K., and Lim, J.S., Effects of substrates on biofilm formation observed
by atomic force microscopy. Ultramicroscopy, 2009. 109(8): p. 874-880.
56. Bolshakova, A.V., Kiselyova, O.I., Filonov, A.S., Frolova, O.Y., Lyubchenko, Y.L., and Yaminsky, I.V.,
Comparative studies of bacteria with an atomic force microscopy operating in different modes.
Ultramicroscopy, 2001. 86(1-2): p. 121-128.
57. Lister, T.E. and Pinhero, P.J., In vivo atomic force microscopy of surface proteins on Deinococcus
radiodurans. Langmuir, 2001. 17(9): p. 2624-2628.
58. Mendez-Vilas, A., Gallardo, A.M., Perez-Giraldo, C., Gonzalez-Martin, M.L., and Nuevo, M.J., Surface
morphological characterization of yeast cells by scanning force microscopy. Surface and Interface Analysis,
2001. 31(11): p. 1027-1030.
59. Crawford, S.A., Higgins, M.J., Mulvaney, P., and Wetherbee, R., Nanostructure of the diatom frustule as
revealed by atomic force and scanning electron microscopy. Journal of Phycology, 2001. 37(4): p. 543-554.
60. Ahimou, F.O., Touhami, A., and Dufrene, Y.F., Real-time imaging of the surface topography of living
yeast cells by atomic force microscopy. Yeast, 2003. 20(1): p. 25-30.
61. Doktycz, M.J., Sullivan, C.J., Hoyt, P.R., Pelletier, D.A., Wu, S., and Allison, D.P., AFM imaging of
bacteria in liquid media immobilized on gelatin coated mica surfaces. Ultramicroscopy, 2003. 97(1-4): p.
209-216.
62. Plomp, M., McCaffery, J.M., Cheong, I., Huang, X., Bettegowda, C., Kinzler, K.W., Zhou, S.B.,
Vogelstein, B., and Malkin, A.J., Spore coat architecture of Clostridium novyi NT SporeS. Journal of
Bacteriology, 2007. 189(17): p. 6457-6468.
63. Plomp, M., Leighton, T.J., Wheeler, K.E., Hill, H.D., and Malkin, A.J., In vitro high-resolution structural
dynamics of single germinating bacterial spores. Proceedings of the National Academy of Sciences of the
United States of America, 2007. 104(23): p. 9644-9649.
64. Alsteens, D., Verbelen, C., Dague, E., Raze, D., Baulard, A.R., and Dufrene, Y.F., Organization of the
mycobacterial cell wall: a nanoscale view. Pflugers Archiv-European Journal of Physiology, 2008. 456(1):
p. 117-125.
65. Kolari, M., Schmidt, U., Kuismanen, E., and Salkinoja-Salonen, M.S., Firm but slippery attachment of
Deinococcus geothermalis. Journal of Bacteriology, 2002. 184(9): p. 2473-2480.
66. Ivanova, E.P., Pham, D.K., Wright, J.P., and Nicolau, D.V., Detection of coccoid forms of Sulfitobacter
mediterraneus using atomic force microscopy. Fems Microbiology Letters, 2002. 214(2): p. 177-181.
67. Dufrene, Y.F., Application of atomic force microscopy to microbial surfaces: from reconstituted cell
surface layers to living cells. Micron, 2001. 32(2): p. 153-165.
68. Ahimou, F., Denis, F.A., Touhami, A., and Dufrene, Y.F., Probing microbial cell surface charges by
atomic force microscopy. Langmuir, 2002. 18(25): p. 9937-9941.
69. Xu, W., Mulhern, P.J., Blackford, B.L., Jericho, M.H., Firtel, M., and Beveridge, T.J., Modeling and
measuring the elastic properties of an archaeal surface, the sheath of Methanospirillum hungatei, and the
implication for methane production. Journal of Bacteriology, 1996. 178(11): p. 3106-3112.
183
70. Gaboriaud, F., Bailet, S., Dague, E., and Jorand, F., Surface structure and nanomechanical properties of
Shewanella putrefaciens bacteria at two pH values (4 and 10) determined by atomic force microscopy.
Journal of Bacteriology, 2005. 187(11): p. 3864-3868.
71. Yao, X., Walter, J., Burke, S., Stewart, S., Jericho, M.H., Pink, D., Hunter, R., and Beveridge, T.J., Atomic
force microscopy and theoretical considerations of surface properties and turgor pressures of bacteria.
Colloids and Surfaces B-Biointerfaces, 2002. 23(2-3): p. 213-230.
72. Dague, E., Alsteens, D., Latge, J.P., Verbelen, C., Raze, D., Baulard, A.R., and Dufrene, Y.F., Chemical
force microscopy of single live cells. Nano Letters, 2007. 7(10): p. 3026-3030.
73. Oesterhelt, F., Oesterhelt, D., Pfeiffer, M., Engel, A., Gaub, H.E., and Muller, D.J., Unfolding pathways of
individual bacteriorhodopsins. Science, 2000. 288(5463): p. 143-146.
74. Bowen, W.R., Lovitt, R.W., and Wright, C.J., Atomic force microscopy study of the adhesion of
Saccharomyces cerevisiae. Journal of Colloid and Interface Science, 2001. 237(1): p. 54-61.
75. Bowen, W.R., Fenton, A.S., Lovitt, R.W., and Wright, C.J., The measurement of Bacillus mycoides spore
adhesion using atomic force microscopy, simple counting methods, and a spinning disk technique.
Biotechnology and Bioengineering, 2002. 79(2): p. 170-179.
76. Zou, Z.W., Kai, J.H., and Ahn, C.H., Electrical characterization of suspended gold nanowire bridges with
functionalized self-assembled monolayers using a top-down fabrication method. Journal of
Micromechanics and Microengineering, 2009. 19(5).
77. Zhang, B., Li, Q., and Cui, T.H., Ultra-sensitive suspended graphene nanocomposite cancer sensors with
strong suppression of electrical noise. Biosensors & Bioelectronics, 2012. 31(1): p. 105-109.
78. Peng, X.S., Jin, J., Nakamura, Y., Ohno, T., and Ichinose, I., Ultrafast permeation of water through
protein-based membranes. Nature Nanotechnology, 2009. 4(6): p. 353-357.
79. Choi, J. and Kim, J., Highly sensitive hydrogen sensor based on suspended, functionalized single tungsten
nanowire bridge. Sensors and Actuators B-Chemical, 2009. 136(1): p. 92-98.
80. Burger, C., Hsiao, B.S., and Chu, B., Nanofibrous materials and their applications. Annual Review of
Materials Research, 2006. 36: p. 333-368.
81. Chew, S.Y., Wen, Y., Dzenis, Y., and Leong, K.W., The role of electrospinning in the emerging field of
nanomedicine. Current Pharmaceutical Design, 2006. 12(36): p. 4751-4770.
82. Chiu, J.B., Luu, Y.K., Fang, D.F., Hsiao, B.S., Chu, B., and Hadjiargyrou, M., Electrospun Nanofibrous
Scaffolds for Biomedical Applications. Journal of Biomedical Nanotechnology, 2005. 1(2): p. 115-132.
83. Huang, Z.M., Zhang, Y.Z., Kotaki, M., and Ramakrishna, S., A review on polymer nanofibers by
electrospinning and their applications in nanocomposites. Composites Science and Technology, 2003.
63(15): p. 2223-2253.
84. Kumbar, S.G., Nair, L.S., Bhattacharyya, S., and Laurencin, C.T., Polymeric nanofibers as novel carriers
for the delivery of therapeutic molecules. Journal of Nanoscience and Nanotechnology, 2006. 6(9-10): p.
2591-2607.
85. Liao, S., Li, B.J., Ma, Z.W., Wei, H., Chan, C., and Ramakrishna, S., Biomimetic electrospun nanofibers
for tissue regeneration. Biomedical Materials, 2006. 1(3): p. R45-R53.
86. Nain, A.S., Wong, J.C., Amon, C., and Sitti, M., Drawing suspended polymer micro-/nanofibers using
glass micropipettes. Applied Physics Letters, 2006. 89(18): p. 183105.
87. Tao, S.L. and Desai, T.A., Aligned arrays of biodegradable poly(epsilon-caprolactone) nanowires and
nanofibers by template synthesis. Nano Letters, 2007. 7(6): p. 1463-1468.
88. Liu, X.H., Smith, L., Wei, G.B., Won, Y.J., and Ma, P.X., Surface Engineering of Nano-Fibrous Poly(L-
Lactic Acid) Scaffolds via Self-Assembly Technique for Bone Tissue Engineering. Journal of Biomedical
Nanotechnology, 2005. 1(1): p. 54-60.
89. Paramonov, S.E., Jun, H.W., and Hartgerink, J.D., Self-assembly of peptide-amphiphile nanofibers: The
roles of hydrogen bonding and amphiphilic packing. Journal of the American Chemical Society, 2006.
128(22): p. 7291-7298.
90. Hohman, M.M., Shin, M., Rutledge, G., and Brenner, M.P., Electrospinning and electrically forced jets. I.
Stability theory. Physics of Fluids, 2001. 13(8): p. 2201-2220.
91. Hohman, M.M., Shin, M., Rutledge, G., and Brenner, M.P., Electrospinning and electrically forced jets. II.
Applications. Physics of Fluids, 2001. 13(8): p. 2221-2236.
92. Reneker, D.H., Yarin, A.L., Fong, H., and Koombhongse, S., Bending instability of electrically charged
liquid jets of polymer solutions in electrospinning. Journal of Applied Physics, 2000. 87(9): p. 4531-4547.
93. Yarin, A.L., Koombhongse, S., and Reneker, D.H., Taylor cone and jetting from liquid droplets in
electrospinning of nanofibers. Journal of Applied Physics, 2001. 90(9): p. 4836-4846.

184
94. Yarin, A.L., Koombhongse, S., and Reneker, D.H., Bending instability in electrospinning of nanofibers.
Journal of Applied Physics, 2001. 89(5): p. 3018-3026.
95. Kumbar, S.G., James, R., Nukavarapu, S.P., and Laurencin, C.T., Electrospun nanofiber scaffolds:
engineering soft tissues. Biomedical Materials, 2008. 3(3): p. 034002.
96. Teo, W.E. and Ramakrishna, S., A review on electrospinning design and nanofibre assemblies.
Nanotechnology, 2006. 17(14): p. 89-106.
97. Tan, E.P.S., Ng, S.Y., and Lim, C.T., Tensile testing of a single ultrafine polymeric fiber. Biomaterials,
2005. 26(13): p. 1453-1456.
98. Tan, E.P.S., Goh, C.N., Sow, C.H., and Lim, C.T., Tensile test of a single nanofiber using an atomic force
microscope tip. Applied Physics Letters, 2005. 86(7): p. 073115-073117.
99. Yuya, P.A., Wen, Y.K., Turner, J.A., Dzenis, Y.A., and Li, Z., Determination of Young's modulus of
individual electrospun nanofibers by microcantilever vibration method. Applied Physics Letters, 2007.
90(11): p. 111909-111911.
100. Ayres, C., Bowlin, G.L., Henderson, S.C., Taylor, L., Shultz, J., Alexander, J., Telemeco, T.A., and
Simpson, D.G., Modulation of anisotropy in electrospun tissue-engineering scaffolds: Analysis of fiber
alignment by the fast Fourier transform. Biomaterials, 2006. 27(32): p. 5524-5534.
101. Johnson, J., Ghosh, A., and Lannutti, J., Microstructure-property relationships in a tissue-engineering
scaffold. Journal of Applied Polymer Science, 2007. 104(5): p. 2919-2927.
102. Xu, S.H., Keeffe, M., Yang, Y., Chen, C., Yu, M., Lapeyre, G.J., Rotenberg, E., Denlinger, J., and Yates,
J.T., Photoelectron diffraction imaging for C2H2 and C2H4 chemisorbed on Si(100) reveals a new bonding
configuration. Physical Review Letters, 2000. 84(5): p. 939-942.
103. Collins, P.G. and Avouris, P., Nanotubes for electronics. Scientific American, 2000. 283(6): p. 62-69.
104. Balandin, A.A., Thermal properties of graphene and nanostructured carbon materials. Nature Materials,
2011. 10(8): p. 569-581.
105. Zhang, X.F., Li, Q.W., Holesinger, T.G., Arendt, P.N., Huang, J.Y., Kirven, P.D., Clapp, T.G., DePaula,
R.F., Liao, X.Z., Zhao, Y.H., Zheng, L.X., Peterson, D.E., and Zhu, Y.T., Ultrastrong, stiff, and lightweight
carbon-nanotube fibers. Advanced Materials, 2007. 19(23): p. 4198-4201.
106. Koziol, K., Vilatela, J., Moisala, A., Motta, M., Cunniff, P., Sennett, M., and Windle, A., High-
performance carbon nanotube fiber. Science, 2007. 318(5858): p. 1892-1895.
107. Lu, W.B., Zu, M., Byun, J.H., Kim, B.S., and Chou, T.W., State of the Art of Carbon Nanotube Fibers:
Opportunities and Challenges. Advanced Materials, 2012. 24(14): p. 1805-1833.
108. Treacy, M.M.J., Ebbesen, T.W., and Gibson, J.M., Exceptionally high Young's modulus observed for
individual carbon nanotubes. Nature, 1996. 381(6584): p. 678-680.
109. Krishnan, A., Dujardin, E., Ebbesen, T.W., Yianilos, P.N., and Treacy, M.M.J., Young's modulus of single-
walled nanotubes. Physical Review B, 1998. 58(20): p. 14013-14019.
110. Cuenot, S., Fretigny, C., Demoustier-Champagne, S., and Nysten, B., Measurement of elastic modulus of
nanotubes by resonant contact atomic force microscopy. Journal of Applied Physics, 2003. 93(9): p. 5650-
5655.
111. Yu, M.F., Files, B.S., Arepalli, S., and Ruoff, R.S., Tensile loading of ropes of single wall carbon
nanotubes and their mechanical properties. Physical Review Letters, 2000. 84(24): p. 5552-5555.
112. Lourie, O. and Wagner, H.D., Evaluation of Young's modulus of carbon nanotubes by micro-Raman
spectroscopy. Journal of Materials Research, 1998. 13(9): p. 2418-2422.
113. Cao, Q. and Rogers, J.A., Ultrathin Films of Single-Walled Carbon Nanotubes for Electronics and Sensors:
A Review of Fundamental and Applied Aspects. Advanced Materials, 2009. 21(1): p. 29-53.
114. Khang, D.Y., Xiao, J.L., Kocabas, C., MacLaren, S., Banks, T., Jiang, H.Q., Huang, Y.Y.G., and Rogers,
J.A., Molecular scale buckling mechanics on individual aligned single-wall carbon nanotubes on
elastomeric substrates. Nano Letters, 2008. 8(1): p. 124-130.
115. Yakobson, B.I. and Avouris, P., Mechanical properties of carbon nanotubes. Carbon Nanotubes, 2001. 80:
p. 287-327.
116. Falvo, M.R., Clary, G.J., Taylor, R.M., Chi, V., Brooks, F.P., Washburn, S., and Superfine, R., Bending
and buckling of carbon nanotubes under large strain. Nature, 1997. 389(6651): p. 582-584.
117. Jemal, A., Murray, T., Ward, E., Samuels, A., Tiwari, R.C., Ghafoor, A., Feuer, E.J., and Thun, M.J.,
Cancer statistics, 2005. Ca-a Cancer Journal for Clinicians, 2005. 55(1): p. 10-30.
118. Lee, G.Y.H. and Lim, C.T., Biomechanics approaches to studying human diseases. Trends in
Biotechnology, 2007. 25(3): p. 111-118.

185
119. Yonezawa, S., Nakamura, A., Horinouchi, M., Sato, E., The expression of several types of mucin is related
to the biological behavior of pancreatic neoplasms. Journal of Hepato-Biliary-Pancreatic Surgery, 2002.
9(3): p. 328-341.
120. Ho, J.J.L. and Kim, Y.S., Serological Pancreatic Tumor-Markers and the Muc1 Apomucin. Pancreas, 1994.
9(6): p. 674-691.
121. Jang, S.H., Wientjes, M.G., Lu, D., and Au, J.L.S., Drug delivery and transport to solid tumors.
Pharmaceutical Research, 2003. 20(9): p. 1337-1350.
122. Kalra, A.V. and Campbell, R.B., Mucin overexpression limits the effectiveness of 5-FU by reducing
intracellular drug uptake and antineoplastic drug effects in pancreatic tumours. European Journal of
Cancer, 2009. 45(1): p. 164-173.
123. Brown, J.R., Crawford, B.E., and Esko, J.D., Glycan antagonists and inhibitors: A fount for drug discovery.
Critical Reviews in Biochemistry and Molecular Biology, 2007. 42(6): p. 481-515.
124. Cleveland, J.P., Manne, S., Bocek, D., and Hansma, P.K., A nondestructive method for determining the
spring constant of cantilevers for scanning force microscopy. Review of Scientific Instruments, 1993. 64(2):
p. 403-405.
125. Sneddon, I.N., The relation between load and penetration in the axisymmetric boussinesq problem for a
punch of arbitrary profile. International Journal of Engineering Science, 1965. 3(1): p. 47-57.
126. Gennes, P.G.d., Polymers at an interface; a simplified view. Advances in Colloid and Interface Science,
1987. 27: p. 189-209.
127. Steffan, R.J., Sperry, K.L., Walsh, M.T., Vainberg, S., and Condee, C.W., Field-scale evaluation of in situ
bioaugmentation for remediation of chlorinated solvents in groundwater. Environmental Science &
Technology, 1999. 33(16): p. 2771-2781.
128. Tufenkji, N., Ryan, J.N., and Elimelech, M., The promise of bank filtration. Environmental Science &
Technology, 2002. 36(21): p. 422a-428a.
129. Tobiason, J.E. and Omelia, C.R., Physicochemical Aspects of Particle Removal in Depth Filtration. Journal
American Water Works Association, 1988. 80(12): p. 54-64.
130. Ferguson, C., Husman, A.M.D., Altavilla, N., Deere, D., and Ashbolt, N., Fate and transport of surface
water pathogens in watersheds. Critical Reviews in Environmental Science and Technology, 2003. 33(3): p.
299-361.
131. Banfield, J.F., Wilkins, M.J., VerBerkmoes, N.C., Williams, K.H., Callister, S.J., Mouser, P.J., Elifantz, H.,
N'Guessan, A.L., Thomas, B.C., Nicora, C.D., Shah, M.B., Abraham, P., Lipton, M.S., Lovley, D.R.,
Hettich, R.L., and Long, P.E., Proteogenomic Monitoring of Geobacter Physiology during Stimulated
Uranium Bioremediation. Applied and Environmental Microbiology, 2009. 75(20): p. 6591-6599.
132. Pang, L. and Šimůnek, J., Evaluation of bacteria-facilitated cadmium transport in gravel columns using the
HYDRUS colloid-facilitated solute transport model. Water Resour. Res, 2006. 42: p. W12S10.
133. Tufenkji, N., Modeling microbial transport in porous media: Traditional approaches and recent
developments. Advances in Water Resources, 2007. 30(6-7): p. 1455-1469.
134. Yates, M.V., Yates, S.R., and Gerba, C.P., Modeling microbial fate in the subsurface environment Critical
Reviews in Environmental Science and Technology, 1988. 17(4): p. 307-344.
135. Schijven, J. and Majid, H., Removal of Viruses by Soil Passage: Overview of Modeling, Processes, and
Parameters. Critical Reviews in Environmental Science and Technology, 2000. 30(1): p. 49-127.
136. Ryan, J. and Elimelech, M., Colloid mobilization and transport in groundwater. Colloids and Surfaces A:
Physicochemical and Engineering Aspects, 1996. 107: p. 1-56.
137. Harvey, R. and Garabedian, S.P., Use of colloid filtration theory in modeling movement of bacteria through
a contaminated sandy aquifer. Environmental Science & Technology, 1991. 25(1): p. 178-185.
138. Schijven, J.F., Medema, G., Vogelaar, A.J., and Hassanizadeh, S.M., Removal of microorganisms by deep
well injection. Journal of Contaminant Hydrology, 2000. 44(3-4): p. 301-327.
139. Elimelech, M., Gregory, J., Jia, X., and Williams, R., Particle deposition and aggregation: measurement,
modelling, and simulation. 1995, Oxford, England: Butterworth-Heinemann.
140. Schijven, J., Hoogenboezem, W., Hassanizadeh, S.M., and Peters, J.H., Modeling removal of
bacteriophages MS2 and PRD1 by dune recharge at Castricum, Netherlands. Water Resources Research,
1999. 35(4): p. 1101-1111.
141. DeBorde, D.C., Woessnerb, W.W., Kileyb, Q.T., and Ball, P., Rapid transport of viruses in a floodplain
aquifer Water Research, 1999. 33(10): p. 2229-2238

186
142. Bales, R.C., Li, S., Yeh, T.-C.J., Lenczewski, M.E., and Gerba, C.P., Bacteriophage and microsphere
transport in saturated porous media: Forced-gradient experiment at Borden, Ontario. Water Resources
Research, 1997. 33(4): p. 639-648.
143. Bales, R.C., S.L., K., Maguire, M., Yahya, M.T., Gerba, C.P., and Harvey, R.W., Virus and Bacteria
Transport in a Sandy Aquifer, Cape Cod, MA. . Ground Water, 1995. 33(4): p. 653-661.
144. Tufenkji, N. and Elimelech, M., Response to comment on "Correlation equation for predicting single-
collector efficiency in physicochemical filtration in saturated porous media". Environmental Science &
Technology, 2005. 39(14): p. 5496-5497.
145. Tufenkji, N. and Elimelech, M., Correlation equation for predicting single-collector efficiency in
physicochemical filtration in saturated porous media. Environmental Science & Technology, 2004. 38(2):
p. 529-536.
146. Tufenkji, N. and Elimelech, M., Deviation from the classical colloid filtration theory in the presence of
repulsive DLVO interactions. Langmuir, 2004. 20(25): p. 10818-10828.
147. Shi, J., Müftü, S., and Wan, K.-T., Adhesion of an Elastic Convex Shell onto a Rigid Plate Journal of
Adhesion, 2011. 87: p. 579–594
148. Shi, J., Robitaille, M., Müftü, S., and Wan, K.-T., Deformation of a Convex Hydrogel Shell by Parallel
Plate and Central Compression. Experimental Mechanics, 2012. 52(5): p. 539.
149. Majidi, C. and Wan, K.-T., Adhesion between Thin Cylindrical Shells with Parallel Axes. Journal of
Applied Mechanics, 2010. 77(5): p. 041013.
150. Maugis, D., Contact, Adhesion and Rupture of Elastic Solids. 2000, New York: Springer.
151. Yang, Y., Chen, F., and Liu, X., A Redefinition of the Role of Microorganisms in Bioaggregation in
Activated Sludge. Proceedings of the Water Environment Federation, 2007. 2007(18): p. 1422-1428.
152. Boon, N., Goris, J., De Vos, P., Verstraete, W., and Top, E.M., Bioaugmentation of activated sludge by an
indigenous 3-chloroaniline-degrading Comamonas testosteroni strain, I2gfp. Applied and Environmental
Microbiology, 2000. 66(7): p. 2906-2913.
153. Holmberg, S.D. and Farmer, J.J., Aeromonas-Hydrophila and Plesiomonas-Shigelloides as Causes of
Intestinal Infections. Reviews of Infectious Diseases, 1984. 6(5): p. 633-639.
154. Kanki, M., Yoda, T., Tsukamoto, T., and Shibata, T., Klebsiella pneumoniae produces no histamine:
Raoultella planticola and Raoultella ornithinolytica strains are histamine producers. Applied and
Environmental Microbiology, 2002. 68(7): p. 3462-3466.
155. Liu, Y.L., Elsholz, B., Enfors, S.O., and Gabig-Ciminska, M., Confirmative electric DNA array-based test
for food poisoning Bacillus cereus. Journal of Microbiological Methods, 2007. 70(1): p. 55-64.
156. Liu, C.X., Gorby, Y.A., Zachara, J.M., Fredrickson, J.K., and Brown, C.F., Reduction kinetics of Fe(III),
Co(III), U(VI) Cr(VI) and Tc(VII) in cultures of dissimilatory metal-reducing bacteria. Biotechnology and
Bioengineering, 2002. 80(6): p. 637-649.
157. Kolker, E., Picone, A.F., Galperin, M.Y., Romine, M.F., Higdon, R., Makarova, K.S., Kolker, N.,
Anderson, G.A., Qiu, X.Y., Auberry, K.J., Babnigg, G., Beliaev, A.S., Edlefsen, P., Elias, D.A., Gorby,
Y.A., Holzman, T., Klappenbach, J.A., Konstantinidis, K.T., Land, M.L., Lipton, M.S., McCue, L.A.,
Monroe, M., Pasa-Tolic, L., Pinchuk, G., Purvine, S., Serres, M.H., Tsapin, S., Zakrajsek, B.A., Zhou, J.H.,
Larimer, F.W., Lawrence, C.E., Riley, M., Collart, F.R., Yates, J.R., Smith, R.D., Giometti, C.S., Nealson,
K.H., Fredrickson, J.K., and Tiedje, J.M., Global profiling of Shewanella oneidensis MR-1: Expression of
hypothetical genes and improved functional annotations. Proceedings of the National Academy of Sciences
of the United States of America, 2005. 102(6): p. 2099-2104.
158. Huisingh, J., McNeill, J.J., and Matrone, G., Sulfate Reduction by a Desulfovibrio Species Isolated from
Sheep Rumen. Applied Microbiology, 1974. 28(3): p. 489-497.
159. Malik, A. and Kakii, K., Intergeneric coaggregations among Oligotropha carboxidovorans and
Acinetobacter species present in activated sludge. Fems Microbiology Letters, 2003. 224(1): p. 23-28.
160. Wang, X., Shah, A., Campbell, R.B., and Wan, K.-T., Glycoprotein mucin molecular brush on cancer cell
surface acting as mechanical barrier against drug delivery. Applied Physics Letters, 2010. 97: p. 263703.
161. Israelachvili, J.N., Intermolecular and surface forces. 3rd ed. 2011, Burlington, Mass.: Academic Press.
162. Steffan, R.J., Sperry, K.L., Walsh, M.T., Vainberg, S., and Condee, C.W., Field-scale evaluation of in situ
bioaugmentation for remediation of chlorinated solvents in groundwater. Environmental Science &
Technology, 1999. 33: p. 2771-2781.
163. Tufenkji, N., Ryan, J., and Elimelech, M., The promise of bank filtration. Environmental Science &
Technology, 2002 36(21): p. 422A-428A.

187
164. Zita, A. and Hermansson, M., Effects of Ionic-Strength on Bacterial Adhesion and Stability of Flocs in a
Waste-Water Activated-Sludge System. Applied and Environmental Microbiology, 1994. 60(9): p. 3041-
3048.
165. Otto, K., Elwing, H., and Hermansson, M., Effect of ionic strength on initial interactions of Escherichia
coli with surfaces, studied on-line by a novel quartz crystal microbalance technique. Journal of
Bacteriology, 1999. 181(17): p. 5210-5218.
166. Mills, A.L., Herman, J.S., Hornberger, G.M., and Dejesus, T.H., Effect of Solution Ionic-Strength and Iron
Coatings on Mineral Grains on the Sorption of Bacterial-Cells to Quartz Sand. Applied and Environmental
Microbiology, 1994. 60(9): p. 3300-3306.
167. Vigeant, M.A.S., Ford, R.M., Wagner, M., and Tamm, L.K., Reversible and irreversible adhesion of motile
Escherichia coli cells analyzed by total internal reflection aqueous fluorescence microscopy. Applied and
Environmental Microbiology, 2002. 68(6): p. 2794-2801.
168. Smets, B.F., Grasso, D., Engwall, M.A., and Machinist, B.J., Surface physicochemical properties of
Pseudomonas fluorescens and impact on adhesion and transport through porous media. Colloids and
Surfaces B-Biointerfaces, 1999. 14(1-4): p. 121-139.
169. Poortinga, A.T., Bos, R., Norde, W., and Busscher, H.J., Electric double layer interactions in bacterial
adhesion to surfaces. Surface Science Reports, 2002. 47(1): p. 3-32.
170. Bacun-Druzina, V., Butorac, A., Mrvcic, J., Dragicevic, T.L., and Stehlik-Tomas, V., Bacterial Stationary-
Phase Evolution. Food Technology and Biotechnology, 2011. 49(1): p. 13-23.
171. Wan, K.T., Fracture mechanics of a V-peel adhesion test - Transition from a bending plate to a stretching
membrane. Journal of Adhesion, 1999. 70(3-4): p. 197-207.
172. Bruckner, C.G., Bahulikar, R., Rahalkar, M., Schink, B., and Kroth, P.G., Bacteria Associated with Benthic
Diatoms from Lake Constance: Phylogeny and Influences on Diatom Growth and Secretion of
Extracellular Polymeric Substances. Applied and environmental microbiology, 2008. 74(24): p. 7740-7749.
173. Neidhardt, F.C. and Curtiss, R., Escherichia coli and Salmonella : cellular and molecular biology. 2nd ed.
1996, Washington, D.C.: ASM Press.
174. Bonet, R., Simonpujol, M.D., and Congregado, F., Effects of Nutrients on Exopolysaccharide Production
and Surface-Properties of Aeromonas-Salmonicida. Applied and Environmental Microbiology, 1993. 59(8):
p. 2437-2441.
175. Ivanov, A.Y. and Fomchenkov, V.M., Dependence of Surfactant Damage to Escherichia-Coli-Cells on
Culture-Growth Phase. Microbiology, 1989. 58(6): p. 785-791.
176. Walker, S.L., Redman, J.A., and Elimelech, M., Influence of growth phase on bacterial deposition:
Interaction mechanisms in packed-bed column and radial stagnation point flow systems. Environmental
Science & Technology, 2005. 39(17): p. 6405-6411.
177. Timoshenko, S. and Woinowsky-Krieger, S., Theory of plates and shells. 2d ed. Engineering societies
monographs. 1959, New York,: McGraw-Hill.
178. Wang, X., Li, Y.Y., Onnis-Hayden, A., Gao, C., Gu, A.Z., and Wan, K.-T., Correlation of macroscopic
aggregation behavior and microscopic adhesion properties of bacteria strains using a dimensionless
Tabor’s parameter. Journal of Colloid and Interface Science, 2012. 374: p. 70-76.
179. Chandler, D.P., Kukhtin, A., Mokhiber, R., Knickerbocker, C., Ogles, D., Rudy, G., Golova, J., Long, P.,
and Peacock, A., Monitoring microbial community structure and dynamics during in situ U (VI)
bioremediation with a field-portable microarray analysis system. Environmental science & technology,
2010. 44(14): p. 5516-5522.
180. Xu, M., Wu, W.M., Wu, L., He, Z., Van Nostrand, J.D., Deng, Y., Luo, J., Carley, J., Ginder-Vogel, M.,
and Gentry, T.J., Responses of microbial community functional structures to pilot-scale uranium in situ
bioremediation. The ISME Journal, 2010. 4(8): p. 1060-1070.
181. Psenner, R., Determination of size and morphology of aquatic bacteria by automated image analysis.
Handbook of methods in aquatic microbiology. Lewis Publishers, Boca Raton, Florida, 1993: p. 339-346.
182. Evans, D.F. and Wennerström, H., The colloidal domain : where physics, chemistry, biology, and
technology meet. 2nd ed. Advances in interfacial engineering series. 1999, New York: Wiley-VCH.
183. van Loosdrecht, M., Lyklema, J., Norde, W., Schraa, G., and Zehnder, A., The role of bacterial cell wall
hydrophobicity in adhesion. Applied and Environmental Microbiology, 1987. 53(8): p. 1893–1897.
184. Bolster, C., Haznedaroglu, B., and Walker, S., Diversity in Cell Properties and Transport Behavior among
12 Different Environmental Escherichia coli Isolates. Journal of Environmental Quality, 2009. 38: p. 465-
472.

188
185. Tufenkji, N., Redman, J.A., and Elimelech, M., Interpreting deposition patterns of microbial particles in
laboratory-scale column experiments. Environmental Science & Technology, 2003. 37(3): p. 616-623.
186. Tufenkji, N. and Elimelech, M., Breakdown of colloid filtration theory: Role of the secondary energy
minimum and surface charge heterogeneities. Langmuir, 2005. 21(3): p. 841-852.
187. Vogler, E.A., Structure and reactivity of water at biomaterial surfaces. Advances in Colloid and Interface
Science, 1998. 74(1-3): p. 69-117.
188. Redman, J.A., Walker, S.L., and Elimelech, M., Bacterial adhesion and transport in porous media: Role of
the secondary energy minimum. Environmental Science & Technology, 2004. 38(6): p. 1777-1785.
189. Hogg, R., Healy, T.W., and Fuerstenau, D.W., Mutual coagulation of colloidal dispersions. Transactions of
the Faraday Society, 1966. 62: p. 1638-1651.
190. Elimelech, M. and Omelia, C.R., Effect of Particle-Size on Collision Efficiency in the Deposition of
Brownian Particles with Electrostatic Energy Barriers. Langmuir, 1990. 6(6): p. 1153-1163.
191. Camesano, T.A., Unice, K.M., and Logan, B.E., Blocking and ripening of colloids in porous media and
their implications for bacterial transport. Colloids and Surfaces A: Physicochemical and engineering
aspects, 1999. 160(3): p. 291-307.
192. Meinders, J., Noordmans, J., and Busscher, H., Simultaneous monitoring of the adsorption and desorption
of colloidal particles during deposition in a parallel plate flow chamber. Journal of colloid and interface
science, 1992. 152(1): p. 265-280.
193. Haznedaroglu, B., Kim, H., Bradford, S., and Walker, S., Relative transport behavior of Escherichia coli
O157: H7 and Salmonella enterica serovar pullorum in packed bed column systems: Influence of solution
chemistry and cell concentration. Environmental science & technology, 2009. 43(6): p. 1838-1844.
194. Mcdowellboyer, L.M., Hunt, J.R., and Sitar, N., Particle-Transport through Porous-Media. Water
Resources Research, 1986. 22(13): p. 1901-1921.
195. Bradford, S.A., Yates, S.R., Bettahar, M., and Simunek, J., Physical factors affecting the transport and fate
of colloids in saturated porous media. Water Resources Research, 2002. 38(12): p. 1327.
196. Sakthivadivel, R., Theory and mechanism of filtration of non-colloidal fines through a porous medium.
1967, University of California, Berkeley.
197. Shi, J., Muftu, S., Gu, A., and Wan, K.T., Adhesion of a cylindrical glycoprotein shell in the presence of
DLVO surface potential (Submitted). 2012.
198. Duan, G. and Wan, K.-T., ‘Pull-in’ of a pre-stressed thin film by an electrostatic potential: A 1-D
rectangular bridge and a 2-D circular diaphragm. International Journal of Mechanical Science, 2010. 52 p.
1158-1166.
199. Bhushan, B., Adhesion and stiction: Mechanisms, measurement techniques, and methods for reduction.
Journal of Vacuum Science and Technology B, 2003. 21(6): p. 2262-2296.
200. Dzenis, Y., Spinning continuous fibers for nanotechnology. Science, 2004. 304: p. 1917-1919.
201. Reneker, D.H., Yarin, A.L., Zussman, E., and Xu, H., Electrospinning of nanofibers from polymer
solutions and melts. Advances in Applied Mechanics, 2007. 41 p. 43-195.
202. Sundarrajan, S. and Ramakrishna, S., Fabrication of nanocomposite membranes from nanofibers and
nanoparticles for protection against chemical warfare stimulants. Journal of Materials Science, 2007.
42(20): p. 8400-8407.
203. Meechaisue, C., Wutticharoenmongkol, P., Waraput, R., Huangjing, T., Ketbumrung, N., Pavasant, P., and
Supaphol, P., Preparation of electrospun silk fibroin fiber mats as bone scaffolds: a preliminary study.
Biomedical Materials, 2007. 2(3): p. 181-188.
204. Gibson, C.T., Johnson, D.J., Anderson, C., Abell, C., and Rayment, T., Method to determine the spring
constant of atomic force microscope cantilevers. Review of Scientific Instruments, 2004. 75(2): p. 565-567.
205. Jing, Z., Xu, X.Y., Chen, X.S., Liang, Q.Z., Bian, X.C., Yang, L.X., and Jing, X.B., Biodegradable
electrospun fibers for drug delivery. Journal of Controlled Release, 2003. 92(3): p. 227-231.
206. Zong, Z., Chen, C.-L., Dokmeci, M.R., and Wan, K.-T., Direct measurement of graphene adhesion on
silicon surface by intercalation of nano-particles. Journal of Applied Physics, 2010. 107: p. 026104.
207. Shi, Q., Wan, K.-T., Wong, S.C., Chen, P., and Blackledge, T.A., Do Electrospun Polymer Fibers Stick?
Langmuir, 2010. 26 (17): p. 14188–14193.
208. Whittaker, J.D., Minot, E.D., Tanenbaum, D.M., McEuen, P.L., and Davis, R.C., Measurement of the
Adhesion Force between Carbon Nanotubes and a Silicon Dioxide Substrate. Nano Letters, 2006. 6(5): p.
953-957.
209. Tang, T., Jogota, A., and Hui, C.-Y., Adhesion between single-walled carbon nanotubes. Journal of
Applied Physics, 2005. 97(7): p. 074304
189
210. Vajpayee, S., Jagota, A., and Hui, C.-Y., Adhesion of a Fibrillar Interface on Wet and Rough Surfaces.
Journal of Adhesion, 2010 86(1): p. 39 - 61.
211. Manohar, S., Mantz, A., Bancroft, K., Hui, C.-Y., Jagota, A., and Vezenov, D., Peeling single-stranded
DNA from graphite surface to determine oligonucleotide binding energy by force spectroscopy. Nano
Letters, 2008. 8(12): p. 4365-4372.
212. Chen, R., Huang, C., Ke, Q.F., He, C.L., Wang, H.S., and Mo, X.M., Preparation and characterization of
coaxial electrospun thermoplastic polyurethane/collagen compound nanofibers for tissue engineering
applications. Colloids and Surfaces B Biointerfaces, 2010. 79(2): p. 315-325.
213. Peng, P., Chen, Y.Z., Gao, Y.F., Yu, J., and Guo, Z.X., Phase Morphology and Mechanical Properties of
the Electrospun Polyoxymethylene/Polyurethane Blend Fiber Mats. Journal of Polymer Science Part B-
Polymer Physics, 2009. 47(19): p. 1853-1859.
214. Almecija, D., Blond, D., Sader, J.E., Coleman, J.N., and Boland, J.J., Mechanical properties of individual
electrospun polymer-nanotube composite nanofibers. Carbon, 2009. 47(9): p. 2253-2258.
215. Kamae, T. and Drzal, L.T., Carbon fiber/epoxy composite property enhancement through incorporation of
carbon nanotubes at the fiber-matrix interphase - Part I: The development of carbon nanotube coated
carbon fibers and the evaluation of their adhesion. Composites Part a-Applied Science and Manufacturing,
2012. 43(9): p. 1569-1577.
216. Ebbesen, T.W., Lezec, H.J., Hiura, H., Bennett, J.W., Ghaemi, H.F., and Thio, T., Electrical conductivity of
individual carbon nanotubes. Nature, 1996. 382(6586): p. 54-56.
217. Ruoff, R.S. and Lorents, D.C., Mechanical and Thermal-Properties of Carbon Nanotubes. Carbon, 1995.
33(7): p. 925-930.
218. Thostenson, E.T., Ren, Z.F., and Chou, T.W., Advances in the science and technology of carbon nanotubes
and their composites: a review. Composites Science and Technology, 2001. 61(13): p. 1899-1912.
219. Gao, S.L., Mader, E., and Zhandarov, S.F., Carbon fibers and composites with epoxy resins: Topography,
fractography and interphases. Carbon, 2004. 42(3): p. 515-529.
220. Varelidis, P.C., McCullough, R.L., and Papaspyrides, C.D., The effect on the mechanical properties of
carbon/epoxy composites of polyamide coatings on the fibers. Composites Science and Technology, 1999.
59(12): p. 1813-1823.
221. Wu, L.Z., Yu, H.J., Guo, L.C., He, Q.L., and Du, S.Y., Investigation of Stress Intensity Factors for an
Interface Crack in Multi-Interface Materials Using an Interaction Integral Method. Journal of Applied
Mechanics-Transactions of the Asme, 2011. 78(6): p. 061007.
222. Montes-Moran, M.A. and Young, R.J., Raman spectroscopy study of high-modulus carbon fibres: effect of
plasma-treatment on the interfacial properties of single-fibre-epoxy composites - Part II: Characterisation
of the fibre-matrix interface. Carbon, 2002. 40(6): p. 857-875.
223. Landau, L.D. and Lifshits, E.M., Theory of elasticity. 1959.
224. Carpick, R.W., Ogletree, D.F., and Salmeron, M., A general equation for fitting contact area and friction vs
load measurements. Journal of Colloid and Interface Science, 1999. 211(2): p. 395-400.
225. Grierson, D.S., Flater, E.E., and Carpick, R.W., Accounting for the JKR-DMT transition in adhesion and
friction measurements with atomic force microscopy. Journal of Adhesion Science and Technology, 2005.
19(3-5): p. 291-311.
226. Arinstein, A., Burman, M., Gendelman, O., and Zussman, E., The effect of super molecular structure on
polymer nanofiber mechanical properties. Nature Nanotechnology, 2007. 2: p. 59-62.
227. Veld, P.J.i.t., Hütter, M., and Rutledge, G.C., Temperature-Dependent Thermal and Elastic Properties of
the Interlamellar Phase of Semicrystalline Polyethylene by Molecular Simulation. Macromolecules, 2006.
39 (1): p. 439–447.
228. Wong, S.C., Baji, A., and Leng, S., Effect of fiber diameter on tensile properties of electrospun poly(-
caprolactone). Polymer, 2008. 49(21): p. 4713-4722.
229. Hahm, M.G., Wang, H.L., Jung, H.Y., Hong, S., Lee, S.G., Kim, S.R., Upmanyu, M., and Jung, Y.J.,
Bundling dynamics regulates the active mechanics and transport in carbon nanotube networks and their
nanocomposites. Nanoscale, 2012. 4(11): p. 3584-3590.
230. Wang, X., Najem, J.F., Wong, S.C., and Wan, K.T., A nano-cheese-cutter to directly measure interfacial
adhesion of freestanding nano-fibers. Journal of Applied Physics, 2012. 111(2): p. 024315.
231. Avouris, P., Molecular electronics with carbon nanotubes. Accounts of Chemical Research, 2002. 35(12):
p. 1026-1034.
232. Ouyang, M., Huang, J.L., and Lieber, C.M., Fundamental electronic properties and applications of single-
walled carbon nanotubes. Accounts of Chemical Research, 2002. 35(12): p. 1018-1025.

190
233. Yamamoto, T., Watanabe, K., and Hernandez, E.R., Mechanical properties, thermal stability and heat
transport in carbon nanotubes. Carbon Nanotubes, 2008. 111: p. 165-194.
234. Cao, Y., Liu, S., Shen, Q., Yan, K., Li, P.J., Xu, J., Yu, D.P., Steigerwald, M.L., Nuckolls, C., Liu, Z.F.,
and Guo, X.F., High-Performance Photoresponsive Organic Nanotransistors with Single-Layer Graphenes
as Two-Dimensional Electrodes. Advanced Functional Materials, 2009. 19(17): p. 2743-2748.
235. Zhang, M., Fang, S.L., Zakhidov, A.A., Lee, S.B., Aliev, A.E., Williams, C.D., Atkinson, K.R., and
Baughman, R.H., Strong, transparent, multifunctional, carbon nanotube sheets. Science, 2005. 309(5738):
p. 1215-1219.
236. LeMieux, M.C., Roberts, M., Barman, S., Jin, Y.W., Kim, J.M., and Bao, Z.N., Self-sorted, aligned
nanotube networks for thin-film transistors. Science, 2008. 321(5885): p. 101-104.
237. Wu, Z.C., Chen, Z.H., Du, X., Logan, J.M., Sippel, J., Nikolou, M., Kamaras, K., Reynolds, J.R., Tanner,
D.B., Hebard, A.F., and Rinzler, A.G., Transparent, conductive carbon nanotube films. Science, 2004.
305(5688): p. 1273-1276.
238. Behabtu, N., Green, M.J., and Pasquali, M., Carbon nanotube-based neat fibers. Nano Today, 2008. 3(5-6):
p. 24-34.
239. Cao, J., Wang, Q., and Dai, H.J., Electromechanical properties of metallic, quasimetallic, and
semiconducting carbon nanotubes under stretching. Physical Review Letters, 2003. 90(15).
240. Svizhenko, A., Mehrez, H., Anantram, M.P., and Maiti, A., Sensing mechanical deformation in carbon
nanotubes by electrical response: a computational study. Nanosensing: Materials and Devices, 2004. 5593:
p. 416-428.
241. Minot, E.D., Yaish, Y., Sazonova, V., Park, J.Y., Brink, M., and McEuen, P.L., Tuning carbon nanotube
band gaps with strain. Physical Review Letters, 2003. 90(15).
242. Jaber-Ansari, L., Hahm, M.G., Somu, S., Sanz, Y.E., Busnaina, A., and Jung, Y.J., Mechanism of Very
Large Scale Assembly of SWNTs in Template Guided Fluidic Assembly Process. Journal of the American
Chemical Society, 2009. 131(2): p. 804-808.
243. Li, B., Hahm, M.G., Kim, Y.L., Jung, H.Y., Kar, S., and Jung, Y.J., Highly Organized Two- and Three-
Dimensional Single-Walled Carbon Nanotube-Polymer Hybrid Architectures. Acs Nano, 2011. 5(6): p.
4826-4834.

191
VITA
Xin Wang was born on August 26th
1983 in Tianjin, P. R. China. She attended Tianjin
University and received bachelor degree in Engineering Mechanics in July 2006 and master
degree in Solid Mechanics in July 2008. During the period, she got scholarship awards every
academic year and earned admission to graduate school exempt from entrance examination in the
senior of undergraduate. She joined Prof. Kai-tak Wan’s group as a doctoral student at
Northeastern University in Boston, Massachusetts, USA in September, 2008. She is a student
member of Material Research Society (MRS) and American Physical Society (APS). She
received her Ph.D in Mechanical Engineering from Northeastern University in May 2013.