integrated response for conflict-affected populations
TRANSCRIPT

Page 1 of 114
Samaritan’s Purse International Relief Integrated Response for Conflict-Affected Populations (InterCAPII)
AID-OFDA-G-17-00106
Baseline Report for;
Water Sanitation and Hygiene, Food Security and Livelihoods, and Nutrition
Date of Submission: November 29, 2017
Project Length: September 1, 2017 – August 31, 2018
Headquarters Contact David Philips Regional Director, Northeast Africa Samaritan’s Purse 801 Bamboo Rd. Boone, NC 29607 Phone: +1-828-278-1251 Email: [email protected]
Field Contact Mark Bennett Country Director Juba Town Road Hai Cinema, Juba Central Equatoria, South Sudan Phone: +211 925 288449 Email: [email protected]

Page 2 of 114
Table of Contents
Acknowledgements ....................................................................................................................................... 6
List of Acronyms ............................................................................................................................................ 7
Executive Summary ....................................................................................................................................... 9
Chapter 1 – Water, Sanitation, and Hygiene .............................................................................................. 11
1. Summary of Findings ........................................................................................................................... 11
2. Background and Context ..................................................................................................................... 12
3. Methodology ....................................................................................................................................... 13
3.1 Objectives of WASH Endline ............................................................................................................. 13
3.2 Survey Methodologies ...................................................................................................................... 13
3.2.1 Sample Frame ............................................................................................................................ 13
3.2.2 Sample Size ................................................................................................................................ 14
3.2.3 Sampling Methodology .............................................................................................................. 14
3.2.4 Data Collection and Tools .......................................................................................................... 15
3.3 Data Quality ...................................................................................................................................... 15
3.4 Data Entry and Analysis .................................................................................................................... 15
3.5 Limitations ......................................................................................................................................... 16
4. Results ................................................................................................................................................. 17
4.1 Demographics ................................................................................................................................... 17
4.2 Water ................................................................................................................................................ 18
4.3 Sanitation .......................................................................................................................................... 22
4.4 Hygiene ............................................................................................................................................. 23
4.5 Waste Disposal .................................................................................................................................. 25
4.6 Indicator Table .................................................................................................................................. 26
5. Discussion ............................................................................................................................................ 28
6. Recommendations .............................................................................................................................. 30
Chapter 2 – Food, Security and Livelihoods ................................................................................................ 31
1. Summary of Findings ........................................................................................................................... 31
2. Background and Context ..................................................................................................................... 33
2.1 Pariang .............................................................................................................................................. 33
2.2 Mayendit ........................................................................................................................................... 33

Page 3 of 114
2.3 Northern Bar el Ghazal- NBeG (Akuem, Abiemnhom and Mayom) ................................................. 34
3. Methodology ....................................................................................................................................... 36
3.1 Objectives of the FSL Baseline .......................................................................................................... 36
3.2 Survey Methodologies ...................................................................................................................... 36
3.2.1 Sample Frame and Sample Size: Pariang ................................................................................... 37
3.2.2 Sample Frame and Sample Size: Mayendit ................................................................................ 37
3.2.2.1 Northern Bar el Ghazal- NBeG (Akuem, Abiemnhom and Mayom)- NBeG ............................ 38
3.2.3 Sampling Methodologies ........................................................................................................... 38
3.2.4 Data Collection and Tools .......................................................................................................... 39
3.3. Data Quality ..................................................................................................................................... 39
3.4 Data Entry and Analysis .................................................................................................................... 39
3.5 Limitations ......................................................................................................................................... 39
4.1 Demographics ................................................................................................................................... 40
4.2 Food Consumption ............................................................................................................................ 41
4.3 Agricultural Production ..................................................................................................................... 46
4.12 Fishing ................................................................................................................................................. 53
4.4 FSL Indicator Table ............................................................................................................................ 54
5. Discussion ............................................................................................................................................ 55
5.1 Pariang .............................................................................................................................................. 55
5.2 Mayendit ........................................................................................................................................... 55
6. Recommendations .............................................................................................................................. 57
Chapter 3 - Nutrition ................................................................................................................................... 59
1. Summary of Findings ........................................................................................................................... 59
2. Background and Context ..................................................................................................................... 60
2.1 Pariang .............................................................................................................................................. 60
2.2 Mayendit ........................................................................................................................................... 60
3. Methodology ....................................................................................................................................... 62
3.1 Objectives of the Nutrition End line.................................................................................................. 62
3.2 Survey Methodologies .................................................................................................................. 62
3.2.1 Sample Frame and Sample Size: ................................................................................................ 62
3.2.2 Sampling Methodology .............................................................................................................. 63
3.2.3 Data Collection and Tools .......................................................................................................... 63

Page 4 of 114
3.3 Data Quality ...................................................................................................................................... 63
3.4 Data Entry and Analysis .................................................................................................................... 63
3.5 Limitations ......................................................................................................................................... 64
4. Results ................................................................................................................................................. 65
4.1 Demographics ................................................................................................................................... 65
4.2 Infant and Young Children Feeding practices ................................................................................... 65
4.3 Anthropometric Results .................................................................................................................... 69
4.4 Nutrition Indicator Table ................................................................................................................... 70
5. Discussion ............................................................................................................................................ 72
5.1 Pariang .............................................................................................................................................. 72
6. Recommendations .............................................................................................................................. 73
Chapter 4 Conclusion .................................................................................................................................. 74
Appendices .................................................................................................................................................. 75
Appendix A: Water, Sanitation and Hygiene.......................................................................................... 75
Appendix B: Food Security and Livelihoods ............................................................................................ 85
B.1 Pariang Sample Frame FSL ............................................................................................................ 85
B.2 Mayendit Sample Frame FSL ......................................................................................................... 87
B.3 FSL Survey Questionnaire ............................................................................................................. 88
Appendix C: Nutrition ............................................................................................................................. 94
C.1 Pariang Sample Frame - Nutrition ................................................................................................ 94
A.2 Anthropometric data –SMART Survey, Pariang, May 2017 ............................................................. 95
A.3 Household Questionnaire ................................................................................................................ 96
A.4 Focused Group Discussion Question Guide ................................................................................. 101
Appendices ............................................................................................................................................ 105

Page 5 of 114
Figure 1: Sampling Target Summary ........................................................................................................... 14
Figure 2: Respondents by Demographic Status………………………………………………………………………………………17
Figure 3: Primary Water Sources…………………………………………………………………………………………………………...19
Figure 4: Water Collection Time…………………………………………………………………………………………………………….20
Figure 5: Water Treatment…………………………………………………………………………………………………………………….21
Figure 6: Improved Sanitation Facility……………………………………………………………………………………………………22
Figure 7: Diarrhea Prevention………………………………………………………………………………………………………………..23
Figure 8: Critical Handwashing Times ......................................................................................................... 25
Figure 9: Indicator Table………………………………………………………………………………………………………………………..26
Figure 10: Pariang Demographics ............................................................................................................... 40
Figure 11: Mayendit Demographics ............................................................................................................ 40
Figure 12: Produce Usage Mayendit ........................................................................................................... 41
Figure 13: FCS Categories ............................................................................................................................ 42
FIgure 14: Food Consumption Scores - Pariang………………………………………………………………………………………43
Figure 15: Food Consumption Scores – Mayendit ...................................................................................... 43
Figure 16: MAHFP………………………………………………………………………………………………………………………………….45
Figure 17: Staple Crops………………………………………………………………………………………………………………………….47
Figure 18: Vegetables Planted……………………………………………………………………………………………………………….49
Figure 19: Food Stocks ................................................................................................................................ 51
Figure 20: Food Security and Livelihoods Indicators………………………………………………………………………………54
Figure 21: Gender of Children ..................................................................................................................... 65
Figure 22: Exclusive Breastfeeding…………………………………………………………………………………………………………66
Figure 23: Timely Initiation of Breastfeeding………………………………………………………………………………………….66
Figure 24: Minimum Meal Frequency…………………………………………………………………………………………………….67
Figure 25: Consumption of Iron-Rich or Iron-Fortified Foods…………………………………………………………………68
Figure 26: LLITN Usage………………………………………………………………………………………………………………….……….69
Figure 27: Sources of IYCF Messages…………………………………………………………………………………………….……….69
Figure 28: Nutrition Indicators .................................................................................................................... 70
Figure 1: Sampling Target Summary

Page 6 of 114
Acknowledgements
Samaritan’s Purse (SP) would like to thank our colleagues at the Office of U.S. Foreign Disaster Assistance (OFDA), and particularly those involved in the Water, Sanitation and Hygiene (WASH), Food Security and Livelihoods (FSL), and Nutrition programs in Abiemnhom, Mayom, Mayendit, Pariang, Aweil East and
Aweil North counties for making these assessments possible. Samaritan’s Purse is also greatly indebted to the community leaders and members that actively participated in the numerous survey exercises, as their views were invaluable in the compilation of this report. Special thanks go to SP staff, especially the organizers of the activities, the Monitoring and Evaluation (M&E) Officers, and the survey enumerators, who went to extreme lengths to collect this valuable information under some of the toughest conditions.

Page 7 of 114
List of Acronyms BSFP: Blanket Supplementary Feeding Program DEFF: Design Effect EBF: Exclusive Breastfeeding FAO: Food and Agriculture Organization FCS: Food Consumption Score FGD: Focus Group Discussion FSL: Food Security and Livelihoods GAM: Global Acute Malnutrition GFD: General Food Distribution HC: Host Community HHs: Households HHC: Health and Hygiene Committee IDP: Internally Displaced Persons IHQ: International Headquarters IPC: Integrated Food Security Phase Classification IYCF: Infant and Young Child Feeding KAP: Knowledge, Attitude and Practice KIIs: Key Informant Interviews LLITN: Long-lasting Insecticide Treated Net LM: Leader Mother M&E: Monitoring and Evaluation MAD: Minimum Acceptable Diet MAHFP: Months of Adequate Household Food Provisioning MAM: Moderate Acute Malnutrition MDD: Minimum Dietary Diversity MMF: Minimum Meal Frequency MUAC: Mid-Upper Arm Circumference NFI: Non-Food Item NW: Neighbor Women
ODF Open Defecation (OD) OFDA: Office of U.S. Foreign Disaster Assistance OTP: Outpatient Therapeutic Program PLW: Pregnant and Lactating Women PPS: Probability Proportional to Size PSU: Primary Sampling Unit SAM: Severe Acute Malnutrition SP: Samaritan’s Purse International Relief SI: Sampling Interval SRS: Simple Random Sampling SPLA: Sudanese People’s Liberation Army TBA: Traditional Birth Attendant TSFP: Targeted Supplementary Feeding Program U5: Children under five USAID: United States Agency for International Development VIP: Ventilated Improved Pit Latrine

Page 8 of 114
WASH: Water, Sanitation and Hygiene WFP: World Food Programme WFH: Weight-for-height WHO: World Health Organization WMC: Water Management Committee

Page 9 of 114
Executive Summary
Samaritan’s Purse International Relief (SP) has been working in South Sudan for over two decades, serving the most vulnerable populations in emergency and conflict settings. In response to the outbreak of violence stemming from the December 2013 and, most recently, July 2016 crises, SP has conducted interventions in Water, Sanitation and Hygiene (WASH) in Abiemnhom and Mayom, Mayendit, and Pariang counties; and Food Security and Livelihoods (FSL) and nutrition programs in Pariang, Mayendit, Aweil East and Aweil North counties (Akuem). As of September 1, 2017, through funding provided by OFDA, SP will continue activities, and has commenced new activities, related to WASH, agriculture and food security, as well as nutrition education, in these areas. Water, Sanitation and Hygiene (WASH) Between the months of June and August 2017, a WASH assessment was conducted in Abiemnhom and, Mayom, Mayendit, and Pariang counties. Multistage cluster sampling was employed, with 600 or more households (HHs) being sampled in each location. The WASH assessments aimed to evaluate progress against baseline information that was collected for indicators in July 2016 for a previous OFDA-funded WASH program, and, therefore, data collected for this baseline also serves as endline data for the previous project. Although there is evidence that counties show improvements in water access with an average of 81.3% total HHs surveyed collecting water from an improved water source; hygiene waste disposal and sanitation continue to be issues. Of the total HHs surveyed in the three counties, only an average of 32.7% reported using an improved sanitation facility. Populations have become increasingly aware of health and hygiene practices, partly due to health promotion activities, but do not have the necessary means to implement what they know. For instance, of the total HHs surveyed in the 3 counties, 69.8 % could identify at least two ways to prevent diarrhea. Also, open defecation remains a huge problem as many families do not have access to sanitation facilities. An average of 64.3% of the total HHs surveyed practiced open defecation. It is recommended that Water, Sanitation and Hygiene interventions continue to be a high priority in the counties, especially programing focusing on improving access to sanitation facilities and providing key messaging for behavioral change. Food Security and Livelihoods (FSL) During September and October 2017, FSL baseline surveys for InterCAP II were conducted in the counties of Abiemnhom and Mayom, Aweil East and Aweil North (Akeum), Pariang and Mayendit. Two-stage cluster sampling methodology was employed in this study, with 500 households (HHs) being sampled in Pariang and 270 HHs in Mayendit. The FSL baseline surveys aimed to establish a comparison base for interventions relating to food self-sufficiency in growing staple and vegetable crops. The data collected for this baseline also serves as endline data for the previous OFDA project for the two counties of Mayendit and Pariang. Findings suggest that food security is still a major problem, with a majority of families having less than two weeks’ supply of food in stock, and many considered severely food insecure. On average, in Mayendit, HHs did not have sufficient food supplies for up to five months a year. On average in the four counties,

Page 10 of 114
for the FCS; 57.3% of HHs were food secure, 23.8 % were borderline, and 19% were severely food insecure. According to the surveys in all the four counties, HHs cultivated an average of 2.6 feddans for all crops (both staple and vegetable). Although farmers are growing varieties of vegetables, there is need to increase the quantity of food produced at the HH level to sustain them through the lean seasons, and to improve nutritional diversity. It is recommended that farmers diversify staple crop production to include leguminous crops such as sweet potatoes, cassava, pumpkins and the like, to cover the gaps during the lean season. Further, the fishing industry is of immense potential and is yet to be fully exploited in all the four counties. These recommendations would not only improve food security, but also increase dietary diversity, which is vital for growth and development, especially for the children.
Nutrition During September and October 2017, a nutrition-focused Knowledge, Attitude and Practice (KAP) survey was conducted in Pariang County. A KAP survey is also currently ongoing in Mayendit, which could not be completed by the reporting time due to inaccessibility. The data collected for will serve as baseline in Mayendit and also serve as end line data for a previous OFDA project in Pariang County. The purpose of the KAP survey was to collect information to determine Infant and Young Child Feeding Practices (IYCF) particularly relating to infants between the ages of 0-6 months, and 6-23 months. A cross-sectional study employing a two-stage cluster sampling technique following CARE’S KAP1 guide and the World Health Organization’s (WHO) IYCF guidelines2, was used. The nutrition KAP surveys aimed to establish a comparison base for IYCF messaging and practices, and the management of Severe Acute Malnutrition (SAM) interventions. A SMART survey conducted in May 2017 by a nutrition partner (CARE) found high SAM and Global Acute Malnutrition (GAM) rates in Pariang, which are a cause for concern. There is a need to vary and improve the diet of children, as Minimum Dietary Diversity (MDD) was also found to be low. Therefore, there is a considerable need to rehabilitate acutely malnourished children and strengthen behavior change programming to address IYCF practices that can help prevent acute malnutrition. As such, it is recommended that immediate emergency programs such as the Blanket Supplementary Feeding Program (BSFP), Targeted Supplementary Feeding Program (TSFP) and Outpatient Therapeutic Programs (OTP) be scaled up to address the pressing problem of malnutrition and high SAM rates in Pariang. Because of sub-standard Infant and young child feeding (IYCF) practices; IYCF programs should be expanded to more payams in the future so that more mothers/caregivers are reached with IYCF messages. At the start of each chapter is a summary of findings captured from these assessments.
1 Infant and Young Child Feeding Practices: Collecting and Using Data: A Step-by-Step Guide. Cooperative for Assistance and Relief Everywhere, CARE (2010). 2 Indicators for assessing infant and young child feeding practices part 3: Country profiles, WHO (2010).

Page 11 of 114
Chapter 1 – Water, Sanitation, and Hygiene
1. Summary of Findings
Improved water source: Percentages of HHs collecting water from an improved water source: Pariang, 77%; Abiemnhom and Mayom, 96%; and Mayendit, 71%. These included mainly tap stands, hand pumps, and rainwater collection. Time to collect water: Percentages of HHs with an average 30 minute or less round-trip time to collect water: Pariang, 49%; Abiemnhom and Mayom, 64%; and Mayendit, 69%. Liters per person per day: Percentages of HHs with an average number of liters of water per person per day that meets the Sphere guidelines (15 L/person/day): Pariang, 24%; Abiemnhom and Mayom, 20%; and Mayendit, 6.4%. The average water transport volume available for each HH was 64 L; 49 % stated not having enough containers to either store or carry water. Safe water treatment: Percentages of HHs who used a water treatment to make their drinking water safe: Pariang, 35%; Abiemnhom and Mayom, 7%; and in Mayendit 48% of HHs treated their water but only 19% of HHs used a treatment that makes their water safe. The most common safe methods mentioned were boiling and chlorination. Improved sanitation facility: Percentages of HHs using an improved sanitation facility: Pariang, 22%, Abiemnhom and Mayom, 40%, and Mayendit, 36%. Open defecation: Percentages of HHs practicing open defecation: Pariang, 70%, Abiemnhom and Mayom, 61%, and Mayendit, 62%. The percentage of HHs with no evidence of feces in the living area were: Pariang, 55%, Abiemnhom and Mayom, 21%, and Mayendit, 43%. Diarrhea prevention: Percentages of respondents who could identify at least two ways to prevent diarrhea: Pariang 73%, Abiemnhom and Mayom, 61%, and Mayendit, 75%. Hand washing practices: Percentages of respondents who could identify three of the five critical times for handwashing results: Pariang 52%, Abiemnhom and Mayom, 61%, and Mayendit 73%.

Page 12 of 114
2. Background and Context South Sudan has experienced civil war for decades. Many people were forced to flee their homes during the 2013 outbreak of violence between government and opposition forces. Low economic output and insecurity has continued since, with the July 2016 fighting in and around Juba worsening the situation. Samaritan’s Purse has been operating WASH programs in Ruweng State3 (formerly known as Unity State) for the last six years, and, more recently, in Southern Leich State. Despite continued investment, water and sanitation conditions in Ruweng and Southern Liech States continue to be problematic. Access to resources is minimal and the lack of permanent water and sanitation infrastructure continues to negatively impact host communities, internally displaced persons (IDPs) and returnees. With an unstable political and military situation, as well as conflicts shaped by ethnicity, people have been at risk of needing to flee their homes. Abiemnhom and Mayom, bordering counties in the western part of Ruweng State, are prone to insecurity, with both Dinka and Nuer populations in the area. Water and sanitation conditions are worsened by insecurity, as the availability of hygiene products like soap and toothpaste can become a challenge when families are forced to move away from their homes, and when communities are dispersed, water sources are left unmanaged. Internally displaced persons also struggle to produce their own food, due to the lack of farmland to cultivate. The effects of insecurity negatively impact both IDPs and the host community (HC), since the presence of IDPs burdens existing resources. Cattle raiding is also common in the various counties; deficits in livestock rearing have an impact on livelihoods as they are a large source of income. There are several seasonal rivers in all counties, and these are used as sources of drinking water and livelihoods, particularly during the rainy season. Pariang and Mayendit have high water tables, where swamps and stagnant water are frequent; swamps, stagnant water, and seasonal rivers can make access difficult during the rainy season, with some areas being cut off entirely. In response to WASH needs in Abiemnhom and Mayom, Mayendit, and Pariang, SP has focused on rehabilitating water points, solarizing boreholes, health and hygiene promotion, and solid waste disposal. Project activities were specifically designed to include rehabilitation of broken hand pumps, water-quality testing, treatment of water sources where appropriate, establishment of water-management committees (WMCs), and training of hand-pump mechanics for repair and maintenance of rehabilitated water points. Gender-sensitive sanitation infrastructure was incorporated along with the construction of emergency latrines in public areas and market places, construction of gender-sensitive bathing shelters and gender-segregated emergency latrines (where appropriate). The hygiene promotion activities carried out included distribution of non-food items (NFIs), establishment of health and hygiene committees (HHCs), hygiene campaigns, and the construction of handwashing stations. Environmental health activities included: solid waste management trainings, community-led debris clean-ups, construction of refuse pits, and the installation of water drainage systems at existing and rehabilitated water points. While implementing the program, the South Sudan WASH Cluster supported the program by providing WASH NFI items such as hygiene kits, soaps, latrine slabs, digging tools, and tarpaulin. The project also constructed shared household latrines in areas where feces were present in the living areas.
3 As of 2016, the original eight states in South Sudan were divided into 28 new states. Ruweng State includes the counties of Pariang, Abiemnhom and Mayom. Southern Leich State includes Mayendit County.

Page 13 of 114
3. Methodology This section outlines the steps taken to conduct the baseline assessments for WASH in Abiemnhom, Mayom, Mayendit, and Pariang. This includes the overall aims and objectives of the assessments, sample
frames, survey methodologies, and data collection, entry, and analysis. In Pariang, 600 HHs sampled from seven payams. Of these, 85% were female and 15% were male respondents. In Abiemnhom and Mayom, 600 HHs sampled from 13 payams (85% female and 15% male respondents). In Mayendit, A total of 780 HHs sampled from 11 payams (85% female and 15% male respondents).
3.1 Objectives of WASH Endline The assessments were undertaken to determine WASH conditions in the counties of Abiemnhom, Mayom, Pariang and Mayendit, and to evaluate progress and change since the start of WASH interventions funded by OFDA in July 2014. The end line assessment also serves as a baseline for the InterCAPII project that commenced on September 1, 2017, also funded by OFDA in the same operation areas.
3.2 Survey Methodologies Both quantitative and qualitative methodologies were employed through household surveys, Key Informant Interviews (KIIs), and Focus Group Discussions (FGD). Due to the various geographical locations, accessibility, and logistical arrangements required, the assessment was conducted in three separate locations, which are outlined below. Survey 1: Abiemnhom and Mayom (combined) Survey 2: Pariang Survey 3: Mayendit 3.2.1 Sample Frame For each of the three surveys, all payams4 within the counties were included in the sample frame to ensure that the sample size would be large enough for the data to be representative at the county level5. A total of 13 payams were included in the sample frame for the Abiemnhom (4) and Mayom (9) survey, nine payams for Pariang, and 11 payams for Mayendit. Population data for Abiemnhom, Mayom, and Pariang was taken from the 2008 Census and projected for the 2017 population data, as this was the best data available at the time. Clusters were determined at the boma6 level. All sample frames in each of the respective locations are included as Appendices.
4 A payam is a geographic and administrative subdivision of a county, which contains smaller administrative divisions called bomas. 5 Abiemnhom and Mayom is the exception and not representative at the county level, as they are combined. 6 A boma is a smaller geographic and administrative subdivision of a payam; bomas contain villages, which are the smallest unit.

Page 14 of 114
3.2.2 Sample Size For all WASH baseline surveys, in all three locations, sample sizes were determined as follows:
Where: n = Sample size (576) z = Confidence limit = 95% (1.96) P = Expected proportion of a given variable (0.5) d = Margin of error at + or - 0.05 DEFF = Design Effect A design effect of 1.5 was used in all counties (Pariang, Abiemnhom and Mayom, and Mayendit) and a total sample size of 576 was rounded up to a minimum of 600 HHs for each location. 3.2.3 Sampling Methodology A multistage cluster sampling method was employed in this study. The first stage involved random selection of villages7 or bomas8, using a Probability Proportional to Size (PPS) approach. In Abiemnhom and Mayom, 20 bomas were considered as clusters; the sample size of 600 was distributed equally between the 20 selected clusters and, therefore, 30 household questionnaires were administered per cluster9. In Pariang, the same approach was used, where 19 bomas were considered as clusters and the sample size of 600 was distributed equally between them. In Mayendit, 30 villages were selected and distributed equally between Southern Mayendit and Northern Mayendit. In Mayendit South, bomas from 11 payams were considered as clusters, 15 villages and 26 households were selected from each of the 15 bomas, and questionnaires were administered. The same procedure was replicated in Mayendit North. The sample size of 600 was distributed equally between the 30 selected clusters, and approximately 26 household questionnaires were administered per cluster.
Figure 1: Sampling Target Summary
No County No of payams
Sample Unit
Sample Size
Cluster No No of household surveys per cluster
1 Abiemnhom and Mayom
16 payams (4 + 12)
Boma 600 20 30
2 Pariang 9 payams Boma 600 19 30
3 Mayendit 11 payams Village 780 30 26
In the second stage, households were selected randomly within clusters using simple random sampling. Households were the basic sampling unit in each cluster. At the village and boma level, the community
7 Villages will were used as clusters in Mayendit, as population data was available at this level. 8 Bomas will were used in the assessments conducted in Pariang and Abiemnhom and Mayom as population data was only available at this level. 9 One of the clusters selected for Mayom proved to be inaccessible at the time of the survey, and since no other payams were available, an extra Abiemnhom boma was selected.
𝑛 = 𝐷𝐸𝐹𝐹 ∗ 𝑍2 𝑃(1 − 𝑃)
𝑑2 = 1.5 ∗
1.962 0.5 (1 − 0.5)
0.052 = 576.24

Page 15 of 114
leaders helped in household listing and identification. Once listing was done, households were selected using random numbers until all cluster households were covered. When the team entered each community, they identified the community leader (Chief, Executive Director, or Administrator) and asked permission to conduct the survey. The survey team then proceeded to the center of the community and selected a random number from a bag to identify the first house. Each enumerator headed in a different direction. Following the random selection of the initial HH, all subsequent HHs were chosen based on the sampling interval (SI). For example, if the random number selected was two and the SI was three, then each enumerator going in different directions would start at the second house on their route and survey every third house after, until their quota was completed. If the HH refused, they were still to maintain the SI and survey the next house three houses down. One adult member of the HH, knowledgeable of the HH’s day-to-day activities related to WASH, was interviewed. This continued until all clusters were completed in the respective locations. Enumerators were not asked to do a specific number of extra surveys, but they completed extra surveys when they had available time. Over the 10 days of data collection, enumerators did anywhere from one to three extra surveys. This resulted in an additional 15 surveys, meaning 615 surveys were collected in total. Appendix A.1 shows the breakdown of surveys collected, by payam. 3.2.4 Data Collection and Tools The surveys in each location had similar sample sizes and the same methodology; therefore, data analysis was conducted as if the stratified sampling method had been used, so that comparisons could be made between them. Data was collected in the form of paper HH questionnaires, and notes taken at FGDs were completed by the M&E Officer in Akuem, Abiemnhom and Mayom. Mobile Data Collection (MDC) was used to collect data in the HHs. Apple iPads fitted out with iFormBuilder were used by enumerators. Data collection was done by trained local enumerators over a period of 9-10 days, and supervised closely by SP field staff. Qualitative data was collected from Focus Group Discussions (FGDs) with Water Management Committee (WMC) and Health and Hygiene Committee (HHC) members. Two FGDs were conducted with WMC members, three with HHC members, and one with Chiefs. A total of five FGDs involving 34 people (16 males and 18 females) were conducted. In Southern and Northern Mayendit, no FGD was carried out with WASH committee members due to insecurity and multiple evacuations. Due to limited time, the team was not able to carry out any FGDs, as planned but currently planned when the security situation improves.
3.3 Data Quality Enumerators were trained during two days on how to use the tools and how to identify households for interviewing. Data collected was initially verified, saved as “raw” and reviewed by a supervisor, then uploaded to the Cloud. Feedback was given to enumerators before beginning data collection the next day. Excel data entry sheets had data restrictions to reduce errors. Random spot checks were made on entered data, which was then cleaned, ensuring consistency before completing analysis.
3.4 Data Entry and Analysis iFormBuilder automatically produced an MS Excel spreadsheet. All data was then cleaned and analyzed in MS Excel by an M&E officer.

Page 16 of 114
3.5 Limitations The communities of Pariang, Abiemnhom, and Mayom counties are spread over far distances. Roads are extremely limited and enumerators often travel long distances on foot. These surveys took place during the rainy season, making transport away from the main roads very difficult. Insecurity was also an issue in some areas, making some payams inaccessible at the time of the assessment. The survey was carried out during planting time and most women of the required age group could not be found at their homes, since they had gone to farm. Where payams were not accessible, reserved clusters were visited instead. In Mayendit, certain study areas were inaccessible due to flooding and insecurity, and populations and SP staff had relocated to safe areas or higher grounds. This resulted in some areas being left out of the study entirely; therefore, results may be biased towards the only areas that were accessible and thus frequently surveyed. Additionally, with the creation of new states in South Sudan, the borders of counties and payams are also in flux. The population information from 2008 is becoming more difficult to use due to these changes currently. In Abiemnhom and Mayom, clusters had to be merged and adjusted in some cases because of the difficulty in local understanding of the rigid and defining system being used. Bomas are more fluid, meaning these administrative units (bomas) had to be fluid in cluster delineation. In water supply, the study did not cover issues around borehole functionality, or solid waste disposal. WASH-related diseases such as scabies and eye infections that are critically important, especially in relation to child health, were left out. For the assessment in all locations, the sample sizes of the surveys were significantly larger than the baseline assessments that had been conducted in July 2014 and February 2015. This was particularly true for the baseline assessment conducted in Abiemnhom and Mayom, which had included 61 and 120 respondents, respectively10 11. The sample size for the endline was increased to be more representative, using the cluster methodology; however, comparing data and determining the extent of change that had occurred proved challenging. For FGDs, only preliminary findings have been used to support quantitative data, in the form of quotes from FGD members and other overarching themes drawn from the discussions. Also, the FGDs were limited to the community members trained by SP; this could triangulate whether the trained community members transferred knowledge to the other members of the community.
10 AID-OFDA-G-14-00086 Samaritan’s Purse URCAP Baseline Report. Sep 2, 2014. 11 AID-OFDA-G-14-00086 Mayom Baseline Report, February, 2015.

Page 17 of 114
4. Results
4.1 Demographics In Pariang, 615 HHs were sampled from seven payams though 660 HHs were visited; 85% (n=520) of the respondents were female and 15% (n=140) were male. Females were targeted as respondents because they usually know the HH members and are directly responsible for family water collection, sanitation, and hygiene. Of the interviewed respondents, 96.6% (n=594) were host community, 3.2% (n=20) were returnees, and 0.2% (n=1) were IDPs and the rest being nomads. A total of 70% (n=429) of HHs interviewed were hosting IDPs. Almost all (99%) HHs interviewed had at least one vulnerable person who was either an under five (U5) child, a disabled person, a pregnant/lactating woman, or an elderly person over 60 years of age. The average HH size was eight. In Abiemnhom and Mayom, 623 HHs were sampled from 13 payams. Of the respondents, 89% (n=554) were female and 11% (n=69) were male; 80.4% (n=501) were host community, 8.7% (n=54) returnees, and 11% (n=66) IDPs and the rest being nomads. A total of 38% (n=235) of HHs indicated they were hosting IDPs. Almost all (99%) HHs surveyed included at least one vulnerable member. The average HH size was eight. In Mayendit, 780 HHs were sampled from 11 Payams (four in South Mayendit, seven in North Mayendit). A total of 88% (n=688) were female, 12% (n=12) were male; 63% (n=482) were hosts, 19% (n=143) were returnees, 15% (n=118) were nomads, and 3% (n=25) were IDPs. The sampled HHs reported having the following vulnerable members: 100% (n=780) children <5 years, 80% (n=623) adults >60 years, 69% (n=538) PLW, and 25% (n=196) disabled people. The average HH size in Mayendit was twelve.
Figure 2: Respondents by Demographic Status
0
20
40
60
80
100
120
Host Returnee Nomad IDP Refugee
Per
cen
tage
of
resp
on
den
ts
Status
Status of respondent
Pariang Abiemnhom/ Mayom Mayendit

Page 18 of 114
4.2 Water Number and percentage of households collecting all water for drinking, cooking and hygiene from improved water sources An improved drinking water source is one that is adequately protected from outside contamination, particularly fecal matter12. This includes tap stands/water yards, protected shallow wells (without hand pumps), hand pumps, and rain water collection. In Pariang, the survey revealed that 90% of the HHs were collecting water from improved sources. The main improved sources reported were tap stands 49.5%, (n=304), hand pumps 40.2%, (n=247) and protected shallow wells 0.5%, (n=3). The unimproved sources used were hafirs13 6.4%, n=71) and unprotected shallow wells 1.8% (n=11). The results indicate an increase from the baseline figure of 77%. This increase could be attributed to the rehabilitation of broken boreholes in the communities and also to the fact that HHs have gained knowledge of the importance of using safe water sources. A woman in an HHC FGD said, “Clean water keeps us away from skin diseases and diarrhea”. In Abiemnhom and Mayom, 96% (n=467) of HHs used an improved water source as their main source of drinking water. At baseline in July 2016, 79% of HHs in Abiemnhom and Mayom reported using an improved water source as their main water source, which suggests a significant increase. Main water sources for HHs may change between dry and rainy seasons. In this assessment, the most common type of water source was hand pumps [91% (n=571)], followed by rivers or streams (5%). In Mayendit, 71% (n=554) of HHs were found to use an improved water source as their main source of water. An assessment from a previous SP OFDA funded project in Mayendit in 2016 reported only 51% (n=308) of HHs using an improved source as their main source of drinking water, so this is a significant increase. In this survey, 67% (n= 528) named hand pumps as their most common water source, while 4% (n=29) listed rain water collection. Twenty-five percent (n=192) of the respondents cited unsafe water sources, including 14% (n=113) rivers or streams, 7% (n=51) swamps/ stagnant water and 3% (n=27) haffirs.
12 WHO/UNICEF JMP http://www.wssinfo.org/definitions-methods/watsan-categories/ 13 HafirA hafir is large pond

Page 19 of 114
Figure 3: Primary Water Sources14
Percentage of households with a 30 minute or less average round trip time to collect water Round trip water collection time is the amount of time it takes for the person collecting water to travel from their home to the water point, collect the water, and return home. According to the survey, 49% of the respondents in Pariang used an average of thirty minutes or less for a round trip to collect water. The figure 49% is less than the 2014 baseline figure of 61%, which indicates a reduction in the number of people taking 30 minutes or less for a round trip to collect water. The reduction could be due to the unconfirmed reports of an influx of returnees, mainly from Juba and Yei. Information from the FGDs, indicated that there were frequent borehole breakdowns, which led to HHs having to travel long distances to other locations with functional boreholes. And secondly, it was mentioned that the functional water points available are fewer compared to the population. In Abiemnhom and Mayom, 64% (n=386) of respondents reported round trip water collection times of less than 30 minutes. At the 2016 baseline, a slightly lower percentage of HHs (52%) in Abiemnhom and Mayom reported less than 30 minutes spent collecting water. In Mayendit, 69% (n=296) of the respondents indicated that they spent 30 minutes or less to go to their primary water source, collect water, and return. At the 2016 baseline, a lower percentage (50%) of HHs reported less than 30 minutes to collect water.
14 Bottled water, unprotected shallow wells, and others were not included in Figure 1.
0
10
20
30
40
50
60
70
80
90
100
Tap Stand Handpump Protected shallowwell
Rain Water
Improved Primary Sources
Pariang Abiemnhom/ Mayom Mayendit

Page 20 of 114
Figure 4: Water Collection Time
Percentage of households with an average number of liters of water per person per day that meets the Sphere guidelines for water quantity (15 l/person/day) In Pariang, 24% (n= 147) of the HHs had 15 or more liters of water per person per day, which is the required threshold according to sphere guideline. Sphere standards. The average water per person per day was 12 liters. The results show a reduction in the average amount of water per person per day and the number of HHs who had 15 or more liters, compared with the baseline. This reduction could be due to a shortage of water collection and storage containers, and a long waiting time at water points, as reported by 49% and 20% of the respondents, respectively. In FGDs, the participants mentioned that due to the long distances to the water points, HHs washed clothes there instead of collecting water to wash at home. In Pariang, FGD participants noted the struggle to get enough water. Continually, people said, “The water is not enough”, or “the water does not satisfy us”, or “water is not enough for my family.”
In Abiemnhom and Mayom, 20% (n=164) of HHs got 15 liters or more per person per day. In Mayendit, 48% (n=289) of HHs were found to have an average of 15 liters or more of water per person per day. The HH average was 6.3 liters per person per day. For HHs whose primary water was from an improved source, the average collection was about 17 liters per person per day. At baseline, only an average of eight liters per person per day was collected.
Percentage of households using a water treatment method which makes their drinking water safe Drinking water must be kept safe throughout the entire process from water point to consumption. Water can easily become contaminated between the water point and the home, even if the water from the source was clean. Proper water treatment addresses potential issues and ensures that the water collected will not be contaminated. Proper and safe treatment methods include boiling, chlorine, and Pur15.
15 Pur is an aluminum based treatment.
0
10
20
30
40
50
60
70
80
<30mins >30mins
Per
cen
tage
Time to collect water
Water Collection Time
Pariang Abiemnhom/ Mayom Mayendit
Page 21 of 114
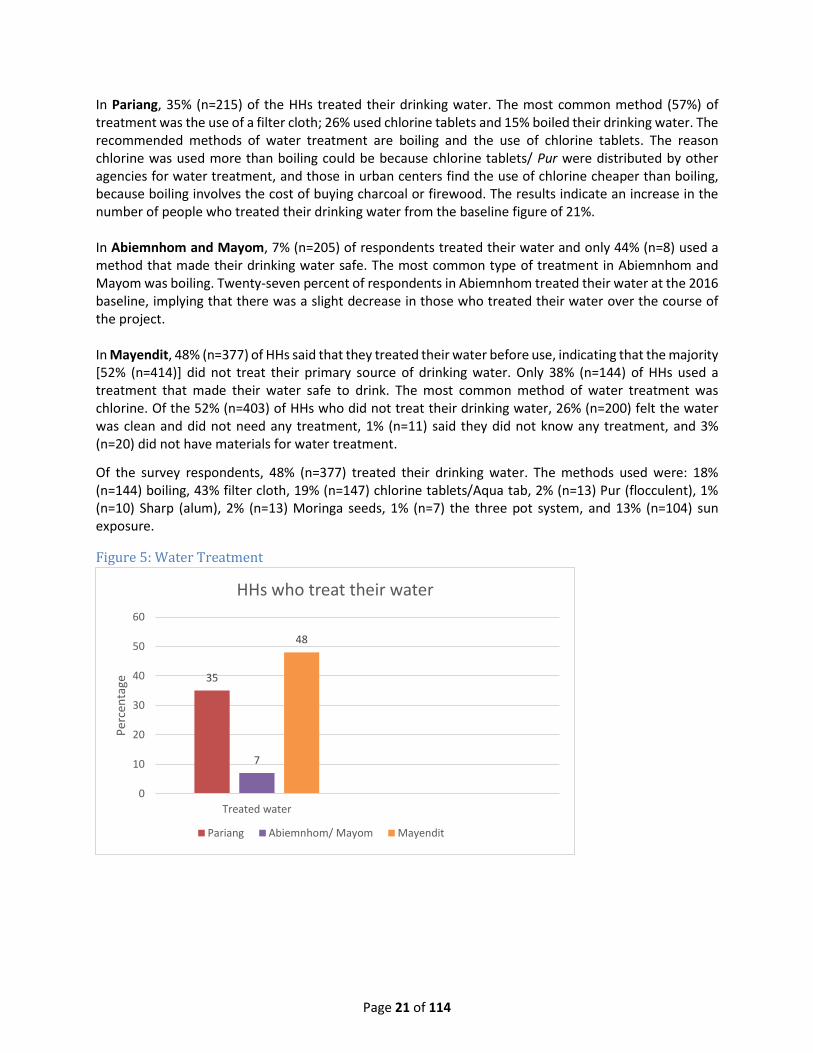
In Pariang, 35% (n=215) of the HHs treated their drinking water. The most common method (57%) of treatment was the use of a filter cloth; 26% used chlorine tablets and 15% boiled their drinking water. The recommended methods of water treatment are boiling and the use of chlorine tablets. The reason chlorine was used more than boiling could be because chlorine tablets/ Pur were distributed by other agencies for water treatment, and those in urban centers find the use of chlorine cheaper than boiling, because boiling involves the cost of buying charcoal or firewood. The results indicate an increase in the number of people who treated their drinking water from the baseline figure of 21%. In Abiemnhom and Mayom, 7% (n=205) of respondents treated their water and only 44% (n=8) used a method that made their drinking water safe. The most common type of treatment in Abiemnhom and Mayom was boiling. Twenty-seven percent of respondents in Abiemnhom treated their water at the 2016 baseline, implying that there was a slight decrease in those who treated their water over the course of the project. In Mayendit, 48% (n=377) of HHs said that they treated their water before use, indicating that the majority [52% (n=414)] did not treat their primary source of drinking water. Only 38% (n=144) of HHs used a treatment that made their water safe to drink. The most common method of water treatment was chlorine. Of the 52% (n=403) of HHs who did not treat their drinking water, 26% (n=200) felt the water was clean and did not need any treatment, 1% (n=11) said they did not know any treatment, and 3% (n=20) did not have materials for water treatment.
Of the survey respondents, 48% (n=377) treated their drinking water. The methods used were: 18% (n=144) boiling, 43% filter cloth, 19% (n=147) chlorine tablets/Aqua tab, 2% (n=13) Pur (flocculent), 1% (n=10) Sharp (alum), 2% (n=13) Moringa seeds, 1% (n=7) the three pot system, and 13% (n=104) sun exposure.
Figure 5: Water Treatment
35
7
48
0
10
20
30
40
50
60
Treated water
Per
cen
tage
HHs who treat their water
Pariang Abiemnhom/ Mayom Mayendit

Page 22 of 114
4.3 Sanitation Percentage of households using an improved sanitation facility An improved sanitation facility includes pit latrines with slabs and ventilated improved pit latrines (VIP). In Pariang, 22% (n=135) of the HHs were using improved sanitation facilities (an advancement over the
3% (n=18) reported at baseline), compared to 40% (n=94) in Abiemnhom and Mayom Counties and 36% (n=280) in Mayendit. Across all counties, community members seemed to understand the importance of latrines, but there was still a lack of resources and community ownership.
Figure 6: Improved Sanitation Facility
Percentage of households who practice open defecation The practice of open defecation puts communities at a high risk of fecal-oral diseases. In Pariang, 70% (n=429) of the HHs practiced open defecation (OD). Meanwhile 8% (n=51) of the respondents dug and covered. The results indicate a reduction in the percentage of HHs practicing OD in Pariang from the baseline value of 89%; this could due to the health and hygiene campaigns carried out and an increased use of the constructed HH shared latrines. Of the respondents, 45% of the HHs had evidence of fecal matter within their homesteads; this increased from the baseline figure of 32%, and could be a result of latrines being used only by adults, and children’s feces not being properly disposed of. The households understood the dangers of OD, as a woman from an FGD said that OD was bad because “It brings flies home and going to the bush exposes someone to snakes”. However, cultural beliefs still prevent some HHs from using latrines, as reported during an FGD, “A house cannot be built for feces.” In Abiemnhom and Mayom, 61% (n=531) of HHs practiced OD. At the 2016 baseline, 69% (n=415) of respondents reported defecating openly in Abiemnhom and Mayom. In Mayendit, 62% (n=485) of the respondents practiced OD. This was a reduction from the 2016 baseline, when the figure was 81%, and from the even higher 97% at the beginning of the OFDA project in 2014. A total of 17% (n=130) of respondents confirmed that they practiced the dig and cover method. In the other counties, 43% (n=332)
0
5
10
15
20
25
30
35
40
45
Improved Sanitation
Improved Sanitation Facility
Pariang Abiemnhom/ Mayom Mayendit

Page 23 of 114
of HHs showed no evidence of feces within 20m of the living area (meaning that 57% of HHs had fecal matter found in the compound). This was also an improvement over the 2014 baseline where only 10% of HHs showed no evidence of feces.
4.4 Hygiene Percentage of respondents who can identify at least two ways to prevent diarrhea One of the objectives of the health and hygiene trainings and sensitizations was diarrhea prevention. The correct answers that were recorded for this survey were: wash hands, use soap, use a toilet facility to defecate, drink clean treated water, prepare food hygienically, and cover water storage containers. Respondents were required to give answers on their own without the enumerator reading the answers. In Pariang, 73% (n=448) of respondents could identify at least two methods to prevent diarrhea. On average, respondents identified between one and three ways to prevent diarrhea. The most common response was washing hands (57%), followed by covering water storage containers (47%); drinking clean, treated water and preparing food hygienically were both mentioned by 45%, and using a toilet facility was listed by 12%. The results showed an increment from the baseline figure of 42%, which could be attributed to health and hygiene messages received from HHC members and hygiene campaigns. Other factors might have contributed, such as health education sessions in health facilities or outpatient therapeutic programs (OTPs). In Abiemnhom and Mayom, 82% (n=519) of respondents could identify at least two diarrhea prevention methods; a slight increase from the 2016 endline of 79% (n=467). In Mayendit, 75% (n=587) had knowledge of at least two ways of preventing diarrhea. The following methods were the most frequently mentioned: 74% (n=575) wash hands, 67%, (n=525) prepare food hygienically and 61% (n=479) cover water storage containers. However, 12% (n=93) of respondents knew none or at least one method of preventing diarrhea.
Figure 7: Diarrhea Prevention
25%
57%
47% 45%
12%
45%
0%
10%
20%
30%
40%
50%
60%
Use Soap Wash hands Cover waterstorage
container
Prepare foodhygienically
Use toiletfacility todefecate
Drink clean,treated water
% o
f R
esp
on
den
ts
Methods
Diarrhea prevention

Page 24 of 114
Percentage of respondents who can identify three of the five critical times for handwashing The five critical handwashing times are: after defecation, after cleaning a baby’s bottom, before food preparation, before eating, and before feeding children. The respondent was expected to provide these answers voluntarily without any prompting. In Pariang, more than half of the respondents (52%, n=321) were able to correctly identify at least three of the five critical handwashing times. Most of the respondents were able to identify between two and three critical times for hand washing. The most common answer was before food preparation (64%), followed by before eating (62%), then before feeding children (42%) and, lastly, after defecation (35%). Of the respondents, 76% used water only for washing, 44% used soap and 26% used ash. Forty-eight percent of the responding HHs had a child who suffered from diarrhea in the two weeks prior to the date of the assessment in Pariang. In Abiemnhom and Mayom, 61% (n=354) of respondents could name three of the five critical handwashing times, unassisted. The most common were before eating [82% (n=502)] and before preparing food [73% (n=463)], followed by after defecation [64% (n=402)]. In Mayendit, 73% (n=568) of respondents could correctly identify three of the five critical handwashing times; an increase from 52% at the July 2016 baseline. The most common response was before eating [78% (n=608)], with 77% (n=604) before food preparation and 73% (n=571) after defecation.
7366
77 78
60
0
10
20
30
40
50
60
70
80
90
100
0
10
20
30
40
50
60
70
80
90
100
After defecation After cleaningbabies' bottoms
Before foodpreparation
Before eating Before feedingchildren
Per
cen
tage
of
tota
l res
po
nd
ents
Per
cen
tage
of
tota
l res
po
nd
ents
Mayendit Critical Hand Washing Times

Page 25 of 114
Figure 2: Critical Handwashing Times
4.5 Waste Disposal Solid waste disposal is important for proper sanitation in and around the household. For this project, SP built refuse pits for solid waste in areas of the community and promoted their proper use. In the FGDs, most participants understood the importance of keeping their compounds clean and removing trash. Most of the information on waste disposal was collected from FGDs with HHCs and WMCs. Waste management in Pariang was done at both the household and community levels. At the household level, waste was managed through burning or burying. Some HHC members reported using rubbish pits in their homes. At the community level, borehole cleaning and burying of dead animals were the main activities carried out. One woman in an FGD said “when bones are not disposed, they can injure children who are playing”. Some communities had fenced public rubbish pits dug by SP; however, during the assessment, it was observed that they were not in use, because the pits were filled with water. In Mayendit, HHCs indicated that they had continued to carry out monthly hygiene campaigns at the market and at the boreholes, and weekly house-to-house sensitizations on solid waste management. Monthly, they mobilized shopkeepers to do clean-up and dispose of garbage appropriately.
35% 34%
64%
42%
62%
0%
10%
20%
30%
40%
50%
60%
70%
After defecation After cleaningbabies´ bottoms
Before foodpreparation
Before feedingchildren
Before eating
% o
f R
esp
on
den
ts
Times
Critical Handwashing times Pariang
7366
77 78
60
0
10
20
30
40
50
60
70
80
90
100
0
10
20
30
40
50
60
70
80
90
100
After defecation After cleaningbabies' bottoms
Before foodpreparation
Before eating Before feedingchildren
Per
cen
tage
of
tota
l res
po
nd
ents
Per
cen
tage
of
tota
l res
po
nd
ents
Mayendit Critical Handwashing Times

Page 26 of 114
4.6 Indicator Table Figure 9: Indicator Table
Water Access
Indicator County Baseline (July - September 2016)16
Endline Evaluation (July - September 2017)
Target
Number17 and percentage of HHs18 collecting all water for drinking, cooking and hygiene from improved water sources
Pariang 77% 90% (6,300 of 7,000) 85%
Abiemnhom 79% 96% (12,480 of 13,000)
Mayom
Mayendit 51% 71% (9,940 of 14,000)
Percentage of HHs with a 30 minute or less average round trip time to collect water
Pariang 61% 49% N/A
Abiemnhom 52% 64%
Mayom
Mayendit 50% 69%
Average number of liters of water per person per day
Pariang 16.48 L 11.8 N/A
Abiemnhom 25.23 L 8.5L
>15L
Mayom
Mayendit 16.23 L 6.3 L
Percentage of HHs using a water treatment which makes their drinking water safe
Pariang 12% 35% N/A
Abiemnhom 27% 44%
Mayom
Mayendit 19% 48%
Sanitation
Indicator County Baseline (July - September 2016)
Endline Evaluation (July - September 2017)
Target
Percentage of HHs using an improved sanitation facility
Pariang 3% 22% N/A
Abiemnhom 10% 40%
Mayom
Mayendit 10% 36%
Pariang 89% 70%(2,121 of 3,030) <50%
16 Baseline results taken from AID-OFDA-G-14-00086 Samaritan’s Purse URCAP Baseline Report, 2016. 17 The baseline total number of HHs collecting all water for drinking, cooking and hygiene from improved water sources is 34,000 in all the three counties 18 The minimum SPHERE standards in WASH counts number of people per water source- which is 500 people; the numbers are derived from number of water points improvised under this award

Page 27 of 114
Number and percentage of HHs practicing open defecation
Abiemnhom 69% 61%(1,830 of 3,000)
Mayom
Mayendit 81% 62%(3,385 of 5,460)
Percentage of HHs with no evidence of feces in the living area (no open defecation)
Pariang 68% 55% N/A
Abiemnhom 50% 21%
Mayom
Mayendit 24% 43%
Hygiene
Indicator County Baseline (July - September 2016)19
Endline Evaluation (July - September 2017)
Target
Percentage of respondents who can identify at least two ways to prevent diarrhea
Pariang 42% 73% N/A
Abiemnhom 79% 82%
Mayom
Mayendit 86% 75%
Percentage of respondents who can identify 3 of the 5 critical times for handwashing
Pariang 25% 52% 60%
Abiemnhom 58% 61%
Mayom
Mayendit 52% 73%
19 Baseline results taken from AID-OFDA-G-14-00086 Samaritan’s Purse URCAP Baseline Report. Sep 2, 2014 and AID-OFDA-G-14-00086 Mayom Baseline Report, February 2015.

Page 28 of 114
5. Discussion Water Supply Most of the water access indicators showed improvement compared to the baseline. This especially in regard to access to quality improved water sources for healthy living. The number of people with access to improved water sources increased. However, the average number of liters of water per person per day (12) decreased in Pariang compared to the baseline (16 liters), and was below the recommended minimum required liters (15), according to Sphere standards. Further, there was still a big gap in water supply, with frequent borehole breakdowns due to a large population being served by a few boreholes. There were also reports in the FGDs of boreholes producing water with a bad smell. “You need to pump the borehole for five to ten minutes before water comes and the water is brownish, smelling like fresh fish,” one man mentioned during an FGD. Due to limited access to improved water sources, HHs tend to collect only drinking water from improved sources and to use other sources for domestic purposes like washing and bathing. However, HHs composed of vulnerable members such as elderly people will drink water from unimproved sources like hafirs, or stagnant water, since they are unable to move long distances. It is very common for water to pool and collect to form seasonal rivers and ponds, known locally as hafirs. Overall, the level of water use per person per day is still very low. In Mayendit, it is 6.3 liters per person per day. This is less than half of the Sphere guideline of at least 15 liters per person per day. Mayendit has large HH sizes with almost all having at least one child under five. Reduced water utilization at the HH level exposes community members to waterborne diseases such as diarrhea, scabies, and trachoma. Increasing the quantity of water used in the HHs is expected to reduce these infections. There is still a big gap in water supply, especially in Mayendit, where only 36% of HHs are collecting their water from improved water sources. Most of the respondents still used unsafe water sources like swamps/stagnant water, hafirs, unprotected shallow wells, rivers, or streams as their primary source of drinking water, ,since some of the boreholes were broken during the time of the survey. The assessment was also carried out during rainy season, when some of the areas were flooded and many HHs could not be accessed. According to previous FGDs, HHs sometimes utilize these unclean sources for drinking when they live far from an improved source, even if that improved source would be their main source during the dry season.
Sanitation Sanitation indicators have slightly improved from the time the baseline was conducted. The number of people using latrines increased significantly from baseline (3% to 22% at the endline). The HHs practicing open defecation also reduced from 89% to 70%. However, these figures are not good indicators of a healthy community given that the area is prone to flooding, especially during the rainy season, which could result in the spread of diseases like cholera and diarrhea. The FGDs showed that community members understood the importance of using latrines but still practiced open defecation. Those who received slabs and had latrines built testified to some of the benefits: “Flies and bad smell have reduced in my home,” but some refused to construct latrines because of their cultural beliefs. “They can’t build a house for feces,” said some FGD members. Some HHs that received latrine slabs were unable to construct latrines because of the rainy season, as latrines normally tend to collapse when dug during rainy season

Page 29 of 114
due to flooding. Most of the community members had knowledge of the dangers of OD but could not practice the measures to cap it, and some still had negative attitudes towards latrine construction. In Abiemnhom and Mayom, the percentage of HHs practicing OD was 61%, on average, with the actual breakdown being much higher in Mayom at 93% than in Abiemnhom at 29.9%. This could be explained by a lack of facilities in Mayom and poor sanitation practices in the area. Similarly, sanitation remains a big challenge in Mayendit. Open defecation is rampant and only 36% of HHs visited during this study had no evidence of feces in their living area. Previous FGDs indicated that the latrines constructed were few and most of them had collapsed due to the rains. They attributed the collapse of these latrines to soil conditions in Mayendit – black cotton (clay) soil - which expands and is unstable during rainy seasons. Respondents said there was a need for drum-linings, which had not been provided (providing drum linings is a challenge and expensive as there is no road network into Mayendit, and therefore everything is flown in by plane). They stated that locally available construction materials in southern Mayendit are inadequate, making it very difficult to construct latrines.
Community members are still in the process of adopting the use of latrines, and there seems to be knowledge about the harms of OD. However, the translation of knowledge into practice appears to not have occurred at a substantial level across all counties.
Hygiene On average, some basic hygiene knowledge seems to be understood across all counties. In Mayendit, 62% of the respondents indicated having received or attended a hygiene promotion campaign within their localities. Still in Mayendit, 75% of HHs knew at least two ways to prevent diarrhea. It was also observed that 73% of the respondents identified at least three of the most critical times for handwashing, which is crucial for preventing waterborne diseases. Respondents indicated that they washed their hands with water, soap, ash and sand. Soap is important for maintaining hygiene, but was noted to be unavailable. Among the respondents, 44%produced soap within one minute when requested to by the enumerators during the interviews and 12% said soap was unavailable in the local market.
In Abiemnhom and Mayom, 61% knew at least three of five critical handwashing times. In Pariang, hygiene at both household and community levels had improved through the knowledge gained from hygiene campaigns and HHC activities. The number of individuals who were able to identify a least two methods of diarrhea prevention increased from 42% to 73%. Also, the number of individuals who could identify at least three of the five critical handwashing times increased from 25% at baseline to 52% at the endline. Health and Hygiene Committee members mentioned during FGDs that borehole was a major component of hygiene activity carried out in the community. However, on observation, the boreholes were grimy, indicating that while they had the knowledge, they were not putting it into practice. Despite individuals being able to identify the methods of diarrhea prevention, there was still a high prevalence of diarrhea (28% among under five year olds in the surveyed HHs), which was to be expected with only 42% of respondents washing their hands before feeding children. In conclusion, most households had gained knowledge of how to ensure proper personal and household hygiene but were not putting the knowledge into practice.

Page 30 of 114
6. Recommendations Installation of water yards using solar power, though relatively more expensive, is a more sustainable source of water provision and can serve many more people durably and simultaneously, compared to hand pumps. Most of the boreholes repaired had a high breakdown rate due to a high volume of users by Sphere Standards, most notably in Pariang. There should be community contribution to borehole rehabilitation in the future. The community should provide poles while SP provides barbed wire for fencing boreholes. In this way, the community will have ownership of the boreholes and will ensure that the fences are not destroyed or removed by some individuals for firewood or other purposes. This will also reduce the mindset of dependency on external relief agencies. The construction of HH shared latrines improved access to, and usage of, latrines, thus reducing ODF, although it still remains very high. Water, sanitation and hygiene programming should continue in the future to ensure a reduction in the number of HHs practicing ODF. The Community Led Total Sanitation (CLTS) approach should be explored in future programming in counties like Pariang, Mayendit, Abiemnhom and Mayom and feasibility studies should be conducted on CLTS applicability. We should also explore building technical capacity within the government offices and structures to provide best advice to communities when approached. Most of the WASH activities are best implemented during the dry season, according to participants; it is therefore recommended that in the future, activities such as latrine construction should be carried out during the dry season, to have more successful results. It is also important to assess the cultural practices, systems and beliefs, leadership structures, and other existing drivers of change within the various ethnic groups present within a community, and work with community leaders and village elders. Involving community leaders can help to identify any opportunities or issues specific to that cultural setting that could be drawn on to facilitate or trigger behavior change. New boreholes should be considered based on population size. The number of boreholes could be increased in payams with larger populations. There is a great need for increasing the number of hand pumps, especially in Mayendit. These should be in strategic locations that provide sufficient coverage, and in areas with low salt levels. Water treatment at the HH level, using varied methods, should be emphasized, especially in areas without a nearby improved water source (e.g. increased chlorination/aqua tabs coverage or provision of filters). This is because the increasing use of surface water, especially during the rainy seasons, leads to shunning the use of salty boreholes in some villages. There is also need to collaborate with some other partners to investigate the source of the smell and recommend appropriate treatment solutions. Functionality tests should be conducted on boreholes to really ensure that the pumps are not sitting on depleted or clogged boreholes. A further focus on progressing forward from knowledge to proper attitudes and practices is recommended. Hygiene and sanitation promotion should be further supported with resources that allow for stable latrine construction. Cultural practices such as meetings and dramas should be utilized to promote ownership and correct attitudes.

Page 31 of 114
Chapter 2 – Food, Security and Livelihoods
1. Summary of Findings Food consumed from produce: Of those who planted staple crops or vegetables in the last planting season, nearly all HHs sampled (Pariang 99%, Akuem 83%, Mayendit 97%, Abiemnhom and Mayom 35%) confirmed that they consumed food they had produced. Food Consumption Score (FCS): Findings in Pariang were: 91% of respondents were found to be food
secure, 7% were borderline, and 2% were severely food insecure. In Mayendit, findings showed that only
41% of HHs were food secure, 40% were borderline, and 16% were severely food insecure. In Akuem, 47% of respondents were found to be food secure, 29% were borderline, and 24% were severely food insecure. In Abiemnhom and Mayom 50% of HHs were food secure, 15% were borderline, and 34% were severely food insecure. Months of Adequate Household Food Provisioning (MAHFP): In Pariang, the average MAHFP was 10.4 months and 48% of respondents had a score of 10 or lower, meaning they could not obtain enough food to meet their needs for at least two months out of the year. In Mayendit, the average MAHFP was 7.3 months and 50% of respondents had a score of seven or lower, meaning that they were not getting enough food to meet their needs for at least five months out of the last year. In Akuem, the average MAHFP was 10 months. For two months a year, they employed coping strategies to survive. In Abiemnom 22% (n=127) of the surveyed HHs were considered food secure, 25% (n=142) borderline, and 45% (n=262) food insecure. In Mayom, 59% (n=79) were food secure, 24% (n=42) borderline, and 36% (n=146) food insecure.
Staple crops planted: In the last planting season, staple crops were planted by 96% of HHs in Pariang and 97% in Mayendit, the most common crops grown being sorghum and maize. In Akuem, 95.1 % of the HHs planted staple crops in the last planting season. The most commonly planted staple crop was sorghum (93%), followed by sesame (45%) and maize (30%). In Abiemnom, sorghum [94% (n=384)], maize [90% (n=312)] and groundnuts [70% (n=289)] were the three main staple crops grown, while in Mayom they were sorghum [77 %( n=206)], maize [90% (n=243)], and ground nuts [70% (n=188)]. Vegetable crops planted: Vegetable crops were planted by 86% of HHs in Pariang, 91.1% in Akuem 93% in Mayendit, and 87% in Abiemnhom and Mayom. Okra, tomatoes, and amaranth were the most common crops. Feddans20 cultivated: In Pariang, HHs cultivated an average of 4.4 feddans for all crops (both staple and vegetable). An average of 3.5 feddans were used for staple crops, and 0.9 for vegetables. In Mayendit,
HHs cultivated an average of 1.5 feddans for staple crops, and 1.2 feddans for vegetables. In Akuem, HHs cultivated an average of 2 feddans for all crops (both staple and vegetable). Staple crops used an average of 3.5 feddans, and vegetables used 0.9 feddans. In Abiemnhom and Mayom, 2.4 feddans were cultivated for both staple and vegetable crops.
20 A Feddan is an Arabic term used for a unit of area. 1 feddan is equivalent to approximately 1 acre.

Page 32 of 114
Food stocks: Thirty-two percent of HHs in Pariang and 24% in Mayendit indicated having food available to last them from one to less than two weeks. Only 17% in Pariang, and no HHs in Mayendit, had food stocks that would last six months or more, from food they produced themselves. A majority [64% (n=173)] of the respondents’ food stocks could only sustain them for less than four months. In Akuem, 37.10 % of HHs had food stocks for a period of two to four months and 5.9 % had food stocks for six or more months. In Abiemnhom and Mayom, 34% had food stocks for 1-<2 weeks (n=140), and 39% fell between 2 weeks -< 1 month (n=104).
Fishing: Respondents were asked if they practiced fishing. Among the people who were interviewed in Abiemnhom, Mayom and Mayendit; 27% (n=157), 19% (n=56) and 40% (n=107) said they practiced fishing, respectively.

Page 33 of 114
2. Background and Context
2.1 Pariang
Samaritan’s Purse has been conducting Food Security and Livelihoods (FSL) programs in the nine payams21 of Pariang County since September 2015. Pariang County is largely home to Dinka ethnic groups, in addition to refugees and IDPs. Like counties all over South Sudan, Pariang has suffered due to the consistent state of insecurity over the past five years. Pariang County is located in the new Ruweng State of the former Unity State. The county borders Panyikang County to the east, Rubkona County to the south, Mayom County to the south west, and South Kordofan to the north (Sudan). It is divided into nine administrative payams, namely: Pariang, Nyiel, Jamjang, Biu, Gumriak, Wunkur, Yida, Aliny, and Panyang. The predominant livelihood system in Pariang is agro-pastoralism, focused on both cattle keeping and food crop farming; in addition, fishing forms an important part of livelihoods in in Jau area and in Lake Noah in Biu.
Food security in Pariang is mainly affected by the limited development of the agriculture sector, which has been significantly constrained by many factors including conflict, climate stresses (prolonged dry spells and flooding), a lack of inputs and technical knowledge, and poor infrastructure. Pariang County has suffered the effects of the country´s civil war; even though fighting has not taken place in the county in recent years, the constant threat of war can cause families to move against their will and abandon farming. The lack of peace and security makes it even more difficult for rural communities to get what they need, because supply chains and local markets are not reliable, rains vary from year to year, and the food situation is constantly changing.
A recent report by Integrated Food Security Phase Classifications (IPC) indicated that Central Equatorial, which is the net producer of over half of the country’s cereals, has been impacted by recent violence and may have lost half of all harvests; a situation that will most likely result in a record high national cereal deficit in 2018. Food security in South Sudan has further deteriorated due to armed conflict, economic crisis, and below average harvests that were exhausted well before the next lean season.22 Food security and nutrition are correlated; increased food insecurity increases strain on the nutritional status of children.
The FSL project was designed to improve conditions among IDPs and host communities in targeted areas, through increased and diversified food production and livelihoods opportunities. This is accomplished by distributing vegetable and staple crop seeds, and providing training for farmers on agronomic practices, through the establishment of demonstration gardens.
2.2 Mayendit Mayendit is one of the counties in the current Southern Liech State (formerly Unity State). Mayendit is comprised of 13 payams, eight in Northern Mayendit and five in Southern Mayendit. The region is characterized by black cotton soil, receives sufficient annual rainfall, and is prone to flooding during the long rainy season23. Flooding is caused by the Nile river tributary and slower infiltration, due to the nature of the soil and the land being flat. Lower regions remain swampy throughout the year. Communities keep
21 A payam is a geographic and administrative subdivision of a county, which contains smaller administrative divisions called bomas. 22 IPC Report South Sudan May, Projection June –July 2017 23 Long rainy season: July – October

Page 34 of 114
livestock, fish in the swamps, and grow crops. The common staple crops are sorghum and maize, and, traditionally, they have grown pumpkins and beans. The county has faced multiple challenges, all related to the civil conflicts since 2013. There have been armed conflicts and traditional cattle rustling have occurred in neighboring counties: Pariang, Leer, Koch, and Mayom leading to forced migration. These have aggravated the local economy, leaving prevailing conditions of malnutrition and food insecurity. There are many youth who are unemployed due to lack of opportunities. Armed conflicts in May 2015, and again in July 2016, damaged the local economy, and the free flow of common goods has been hampered. In recent months, conflict in the region, coupled with flooding, has led to massive movement and displacement of the Mayendit population, especially in the north. Flooding around Dablual and Mirnyal displaced many people, forcing HHs to settle on higher ground, and thus separating them from their ancestral land. Conflict in Koch, Leer, and Dok has moved over 10,000 people to Southern Mayendit as IDPs seeking refuge. All of this has food security implications for the residents of Mayendit. In 2016 and 2017, the entire community of Mayendit was affected by flooding; prolonged waterlogging destroyed flowering crops, turning the leaves yellow and rotting the roots (as there are no air spaces in the saturated soil). Flooding also did not permit second weeding, especially in the areas of Dablual, Pabuong, Malkuer, and Mirnyal. Most HHs continue to rely on food assistance.
2.3 Northern Bar el Ghazal- NBeG (Akuem, Abiemnhom and Mayom)
The food security situation in South Sudan is worrying, and especially alarming in Northern Bahr el Ghazal.
Continued economic crisis including hyperinflation, depreciation of the South Sudanese pound (SSP),
soaring food prices, a high cereal crop deficit, prevailing insecurity, and droughts in part of the country,
have contributed to this high level of food insecurity (FSNMS-Round 19, March 2017).
Due to its proximity to the border with Sudan and conflict affected states, the humanitarian situation in
NBeG has continued to be precarious, hosting thousands of internally displaced persons (IDPs) from
neighboring counties. The movement of IDPs has particularly impacted the deteriorating food security
situation. Food insecurity is particularly heightened during the lean season when rains block road access,
impede mobility, and hinder economic activities.
According to the World Food Programme (WFP) September 2017 monthly market price monitoring, the
year-on-year inflation rate in South Sudan reached a devastating 165% in August 2017, following a
persistent rise in the prices of food. Additionally, although the basic food commodities are available, prices
are too high for the purchasing power of poor HHs experiencing emergency (IPC Phase 4) acute food
insecurity.24 The continued rise in the cost of living remains a major challenge for poor, market-dependent
HHs, with IDPs disproportionately affected. In addition, climatic shocks have led to unprecedented floods
following heavy rains, resulting in large swathes of standing crops – sorghum, groundnut, sesame and
vegetables- inundated with water, and significant crop losses.
24 WFP Situation Report # 193 – Aweil Market Assessment, September 2017

Page 35 of 114
Focus group discussions (FGDs) conducted by SP in August 2017 revealed that farmers in NBeG faced
several constraints to crop production, including inadequate knowledge, alternating flooding and
prolonged droughts, limited access to agricultural inputs (such as productive seeds and tools), and
outbreaks of crop pests and diseases.
Considering the deteriorating food security situation, the devastating inflation resulting in exorbitant
prices of food and other commodities, and the current constraints on agricultural production, SP scaled
up its FSL operations in Aweil North and Aweil East Counties of NBeG, funded by OFDA.

Page 36 of 114
3. Methodology This section outlines the steps taken to conduct the baseline assessment for FSL in Mayendit,Pariang, Abiemnhom and Mayom, and Aweil (Akuem) counties. This includes the overall aims and objectives of the assessment, sample frames, survey methodologies, and data collection, entry, and analysis. The assessment was conducted in September and October 2017. Pariang: 501 HHs were surveyed, with 13% being male and 87% being female respondents. Internally displaced persons (IDPs) made up 31% of respondents. Eighty-two percent of the HHs were female headed and 18% were male headed. Mayendit: 270 HHs were surveyed, with 12% male and 88% female respondents. They were distributed as follows: 63% internally displaced persons (IDPs) and 37% host community members. Akuem: 407 HHs were surveyed; 61.9% were female and 38.1% male respondents. Among the visited HHs, IDPs made up 2%. Most of the respondents were residents. Of the HHs visited, 82.1% were headed by males. In Abiemnhom and Mayom, 890 HHs were surveyed, with 47% male and 53% female respondents. Internally displaced persons made up 63%, and host community members the other 37%.
3.1 Objectives of the FSL Baseline The specific indicators to be determined were as follows: - Number and percentage of households consuming food that was produced through an agricultural
intervention - Projected increase in number of months of food self-sufficiency due to distributed seed
systems/agricultural inputs for beneficiary households Additional indicators of interest around HH food access and availability were also collected, to provide further information.
1. Food Consumption Score (FCS) 2. Months of Adequate Household Food Provisioning (MAHFP) 3. Household coping strategies
3.2 Survey Methodologies Samaritan’s Purse is currently implementing FSL activities in Abiemnhom, Mayom and Aweil (Akuem) in Northern Bar el Ghazel state and Mayendit County; FSL programing in Pariang was phased out. It is in these implementing counties where the InterCAPII baseline assessments were carried out. A quantitative methodology was employed using HH surveys. Qualitative information was also gathered from FGDs in Pariang. The focus of the quantitative HH survey was to determine HH food security, consumption, and food self-sufficiency. The main purpose of the qualitative portion was to supplement and support quantitative data, while capturing feedback and requests relevant to past and future programming. The FSL baseline surveys were conducted separately in the counties of Mayendit and Pariang due to the different geographical locations, accessibility, security, and logistics of the counties.

Page 37 of 114
3.2.1 Sample Frame and Sample Size: Pariang Six of the nine payams in Pariang were included in the sample frame25. The sample size was determined as follows: n= sample size Z = Z statistics for selected level of confidence (for 95%; Z=1.96) P= prevalence/estimate for the key food security indicator, taken as 50% d = margin of error (+/- 5%) DEFF= 1.25 due to a largely homogeneous agricultural setting. The calculated sample of 480 was rounded up to 500 individuals to be interviewed. 3.2.2 Sample Frame and Sample Size: Mayendit Mayendit consists of 13 payams (eight payams in Northern Mayendit and five payams in Southern Mayendit) which formed the basis of the sampling frame. Within these payams, village population lists with estimated sizes were the sampling unit for selecting clusters through PPS. A total of 30 clusters were chosen for this survey. The sample size for this study was determined26 as follows:
n= sample size Z = Z statistics for selected level of confidence (for 95%; Z=1.96) P= prevalence/estimate for the key food security indicator27, taken as 15% d = margin of error (+/-5%) DEFF =2 This study provided for a design effect28 of two for employing cluster sampling. A calculated sample of 512 was raised to 540. This allowed for 30 clusters (15 in Northern Mayendit and 15 in Southern Mayendit) to be selected, with at least 15 respondents per cluster. Data was not collected in Northern Mayendit due to insecurity.
25 Biu payam is remote and inaccessible during most of the rainy season, during which this assessment occurred. Gumriak payam was also excluded due to inaccessibility because of rains. 26 Lwanga S.K and Lemeshow S (1991). Sample Size Determination in Health Studies: A Practical Manual. Geneva: World Health Organization; Naing, L (2006) Medical Statistics: Practical issues in calculating sample size in prevalence studies. 27 Stunting prevalence = 14.6% (11.8 – 18.0 95% C.I.); Source: SP SMART Survey May, 2016: WHO acceptable level <20% (h/age <-2 z-scores). 28 Cochran WG (1977). Sampling Techniques, 3rd edition. New York: John Wiley & Sons; Daniel WW (1999). Biostatistics: A Foundation for Analysis in the Health Sciences. 7th edition. New York: John Wiley & Sons.
𝑛 = 𝐷𝐸𝐹𝐹 ∗ 𝑍2 𝑃(1 − 𝑃)
𝑑2 = 2 ∗
1.962 0.15 (1 − 0.15)
0.052 = 512
𝑛 = 𝐷𝐸𝐹𝐹 ∗ 𝑍2 𝑃(1 − 𝑃)
𝑑2 = (1.25) ∗
1.962 ∗ 0.5 (1 − 0.5)
0.052 = 480

Page 38 of 114
3.2.2.1 Northern Bar el Ghazal- NBeG (Akuem, Abiemnhom and Mayom)- NBeG Thirty villages were randomly selected from the two main administrative units (payams), Malual West of
Aweil North and Madhol Payam of Aweil East. Villages here cross different bomas and have a population
of at least 150 households.
The sample size for this study was determined29 as follows:
n= sample size,
Z = Z statistics for selected level of confidence (for 95%; Z=1.96),
P= prevalence of key indicator (not available) taken for a 5% desired change (0.5)
d = margin of error (5%).
A calculated sample of 384.16 was raised to 390. This allowed for 30 clusters to be selected with 13 primary respondents per cluster.
3.2.3 Sampling Methodologies Two-stage cluster sampling methodology was employed in this study. This was because there was no exhaustive population list available. For Pariang, estimated population data served as a sample frame from which clusters were selected. The first stage involved selecting clusters from a list of bomas30 through PPS. Bomas were the primary sampling units (PSU) and were considered as clusters. The PPS approach ensured that each HH in Pariang, whether from a larger or smaller boma, had an equal probability of being selected. The number of clusters for this assessment was 20, to ensure the lowest possible design effect. A list of back-up clusters was randomly selected, using the same tool, to be employed when selected clusters were inaccessible or insecure. For Mayendit, estimated population data served as a sample frame from which clusters were selected. The first stage involved selecting clusters from a list of villages through PPS. Villages served as the PSU and were considered as clusters. The PPS approach ensured that each HH, whether from a larger or a smaller village, had an equal probability of being selected (refer to Appendix B2 - Mayendit Sample Frame FSL). A total of 30 clusters were chosen for this survey. In the second stage, HHs were selected randomly within clusters using simple random sampling (SRS). Households were the basic sampling units in each cluster. In Pariang, 25 within a cluster were randomly selected and for Mayendit 18 were selected. When the team entered each community, they identified the community leader (Chief, Executive Director, or Administrator) and asked permission to conduct the survey. The survey team then proceeded to the center of the community and selected a random number from a bag to identify the first house. Each enumerator headed in a different direction. Following the random selection of the initial HH, all HHs to follow were chosen based on the sampling interval (SI). For example, if the random number selected was two and the SI was three, then each enumerator (going in
29 Lwanga S.K and Lemeshow S (1991). Sample Size Determination in Health Studies: A practicalPractical Manual. Geneva: World Health Organization; Naing, L (2006) Medical Statistics: Practical issues in calculating sample size in prevalence studies. 30 A boma is a smaller geographic and administrative subdivision of a payam. Bomas contain villages, which are the smallest dividing unit.
𝑛 =𝑍2 𝑃(1 − 𝑃)
𝑑2 =
1.962 0.5 (1 − 0.5)
0.052 = 384.16

Page 39 of 114
different directions) would start at the second house on their route and survey every third house after, until their quota was complete. If the household refused, they would maintain the SI and conduct the survey three houses down. One adult member of the household, who had knowledge of the household’s day-to-day activities related to FSL, was interviewed. This continued until all clusters were completed in the respective locations. 3.2.4 Data Collection and Tools Data was collected electronically (MDC) from HH questionnaires in Akuem, Agok, Mayendit and Pariang. In Akuem Abiemnhom and Mayom, paper based surveys were conducted. Mobile data collection (MDC) was implemented using iPads equipped with iFormBuilder (iForm). Due to the limited number of devices, these were provided only to supervisors31. Data collection was conducted by trained local enumerators for a period of 7-10 days, and supervised closely by SP field staff. Supervisors had previous experience with the FSL questionnaire, and iPads equipped with iForm.
3.3. Data Quality Previously experienced enumerators were selected and trained on how to use the tools and how to identify HHs and/or farmers for interviewing. Enumerators were closely supervised during data collection, which was checked for consistency and verified daily prior to data entry. Feedback was provided to enumerators before data collection began the following day. Excel data entry sheets had data restrictions to reduce the chance of errors. Random spot checks were made on data that was entered and then the data was cleaned, ensuring consistency before analysis was completed.
3.4 Data Entry and Analysis iFormBuilder automatically produced an MS Excel spreadsheet. All data was then cleaned and analyzed in MS Excel by an M&E officer.
3.5 Limitations This surveys took place in September and October 2017, which is near the end of the rainy season. Therefore, the survey was conducted in August 2017 when the rainy season was at its peak, making many locations inaccessible. Three payams were not included in the frame because they were inaccessible. Some bomas in specific payams were not included, either, as they were inaccessible due to either insecurity or flooded access routes; thus, the assessment was limited to only a few areas. The HH members best suited to provide information about the HH´s food security situation were women. However, they were hardly ever found at home since it was farming season; therefore, fewer surveys than planned were conducted in some areas. In cases where clusters were not accessible, reserved clusters were used. In Mayendit, due to flooding, insecurity, and sparsity in settlements, many people had moved to slightly higher areas, some of which became very difficult to reach. Additionally, there was insecurity that caused evacuations. All these resulted in some areas being left out of the study entirely (specifically, Northern Mayendit). Therefore, results may be biased towards the only accessible areas, which were frequently surveyed (mostly areas in Southern Mayendit). In Mayendit, Abiemnhom and Mayom, only a quantitative survey was employed to collect this data, in order to avoid survey response fatigue caused by engaging more groups from these areas in assessments during a period when most organizations were carrying out assessments on the same population. During endline, FGDs and KIIs will be performed, in addition to household surveys.
31 Piloting of iPads for data collection was only carried out in Pariang due to the limited number of devices.

Page 40 of 114
4.0 Results
4.1 Demographics In Pariang, a total of 501 HHs were surveyed. Eighty-seven percent (n=437) of the respondents were female and 13% (n=64) were male. In 82% (n=410) of cases the HHs were female headed and in 18% (n=91) they were male headed. The average HH size was 10 members (four members from five to less than 15 years old, three members 15 years or older, two members less than five years old). Sixty-nine percent (n=348) of the respondents were from the host community and 31% I(n=153) were IDPs.
Figure 10: Pariang Demographics
In Mayendit (Southern Mayendit), 270 HHs were surveyed for this study. Eighty-eight percent (n=237) of the respondents were female, and 12 % (n=33) were male. At the time of the survey, 63% (n=171) indicated that they were IDPs and 37% (n=99) stated that they were host community members. The average HH size was nine, with most consisting of at least four adults (over the age of 15), three children (between the ages of 5-15 years) and at least two children under the age of five. Where IDPs were present, there were cases where 15 adults and seven to nine children were eating from the same pot. Figure 11: Mayendit Demographics
18%
82%
Gender of HH Head
Male Female
69%
31%
HH Displacement status
Host IDP
12%
88%
Male Female
63%
37%
IDP Host Community member

Page 41 of 114
In Akuem there were 410 respondents, 61% (n=251) were female and 39% (n=155) were males. Of the interviewee HH heads, 59% (n=35) were male-headed HHs, while 41% were female-headed HHs. The average household size was eight (minimum of one, maximum of 20). In Abiemnhom and Mayom, 890 HHs were surveyed, with 47% male and 53% female respondents. Sixty-three percent were internally displaced persons (IDPs) and 37% were host community members.
4.2 Food Consumption Number and percentage of households consuming food that was produced through an agricultural intervention In Pariang, among those who planted staple crops or vegetables in the last planting season, 99%, (n=472)
confirmed that they consumed the food they had produced. In Mayendit, 97% (n=263) of those who planted staple crops or vegetables in the last planting season said that they consumed some of the food they had produced. Although most people consume what they grow, there are still those who sell, trade, or store some portions of what they produce. Figure 32: Produce Usage Mayendit
In Akuem, most produced food (83.2%) is consumed at the HH level, 18.1% is stored for future use and
as seed, and 15.4% is sold. There is also sharing in 14% and some exchanging in 15% of the harvest.
97
11
46
11
0102030405060708090100
0102030405060708090
100
HH consume own food Give/share food withneighbors
Store seeds for futureharvests
Sell food for cash
Per
cen
tage
of
tota
l res
po
nd
ents
per
cen
tage
of
tota
l res
po
nd
ents
Usage of crop harvest
Use of Harvest Average
Responses
Proportional
piling
Consume 83.2 57%
Share with neighbor/relatives 14 10%
Store seed 18.1 12%
Sell 15.4 11%
Exchange 15 10%
83.2%
14.0% 18.1% 15.4% 15.0%
0.0%10.0%20.0%30.0%40.0%50.0%60.0%70.0%80.0%90.0%
Res
po
nse
s
Uses of Crop Harvest

Page 42 of 114
In in Abiemnhom and Mayom, those who consumed the staple crops and vegetables they planted were 35% and 34%, respectively.
Food Consumption Score (FCS) The FCS is a World Food Programme (WFP) recognized indicator used to determine levels of food security. The score is calculated by evaluating how many days in the past week respondents have eaten from 12 various food groups32. These groups are weighted based on nutritional value, and totaled for an overall score. This tool is useful in determining how much of the population is moderately and severely food insecure. The results of this survey show that in Pariang, 91% (n=456) of respondents were food secure or had an acceptable FCS, 7% (n=36) were moderately food insecure or borderline, and 2% (n=8) were severely food insecure or had a poor FCS. The results indicate an increase in the number of food secure HHs compared to the baseline. In Mayendit, only 23% (n=62) were considered food secure, 37% (n=101) were borderline, and 41% (n=110) were severely food insecure. The boundaries used to determine these categories are listed below. Figure 43: FCS Categories
FCS Borders Meaning
Acceptable 35 and above Food secure
Borderline 21.5-35 Moderately food insecure
Poor 0-21 Severely food insecure
32 WFP, VAM (2008)
35
11
24 24
6
34
16
27
16
8
0
5
10
15
20
25
30
35
40
HHs consume ownfood
Give/share foodwith neighbors
Store seeds forfuture harvests
Sell food for cash Exchange
% u
sage
of
agri
cult
ura
l pro
du
ce
Axis Title
Uses of Crop Harvest- Abiemnhom and Mayom
Abiemnhom Mayom

Page 43 of 114
Figure 14: Food Consumption Scores - Pariang
Figure 155: Food Consumption Scores – Mayendit
In Akuem, results indicated that 96 (24%) of the households were severely food insecure (had a poor FCS), 118 (29%) were moderately food insecure (borderline) and 193 (47%) were food secure (had an acceptable FCS).
7% 11%5%
91% 86%94%
0%
10%
20%
30%
40%
50%
60%
70%
80%
90%
100%
Total Population IDPs Host Community
Food Consumption Score- Pariang
Poor Borderline Acceptable
41% 46%
29%
37% 28% 57%
23%25%
18%
0%
20%
40%
60%
80%
100%
Total Population IDP Host Community
Food Consumption Score - MayenditPoor Borderline Acceptable

Page 44 of 114
Abiemnhom and Mayom: the baseline results showed that in Abiemnhom, 22% (n=127) of the surveyed HHs were food secure, 25% (n=142) were borderline, and 45% (n=262) were considered food insecure. In Mayom, 59% (n=79) were food secure, 24% (n=42) were borderline and 36% (n=146) werefood insecure.
Months of Adequate Household Food Provisioning (MAHFP) Months of Adequate Household Food Provisioning (MAHFP) refers to how many months in the year respondents can acquire enough food to meet their needs. The score is based on how many months in the past year respondents were able to meet their needs. Therefore, a score of 10 means the respondents were able to meet their needs 10 out of the past 12 months. This indicator is vulnerable to recall bias, but enumerators are trained to list events and times throughout the past 12 months to help respondents recall one full year. In Pariang, most of the HHs (45%, n= 224) had a MAHFP score of 11 months (n=197), which was followed by 10 months (33%, n=165). The average MAHFP was 10.4 months. The most common months in which respondents were not able to meet their needs were July 2017 and August 2017. Forty-eight percent of the HHs had an MAHFP of 10 months or less, meaning that these HHs had at least two or more months of no food or inadequate food.
24%
29%
47%
0%
20%
40%
60%
80%
100%
Total Population
Food Consumption Score
Acceptable
Borderline
Poor
45%36%
25%
24%
22%
59%
0%
20%
40%
60%
80%
100%
Total Population Abiemnhom Total Population Mayom
Food Consumption Score
Poor Borderline Acceptable

Page 45 of 114
In Mayendit, 62% (n=297) of respondents scored between seven to nine months. The average MAHFP was 10.7, meaning that respondents were able to meet their needs 10 out of the past 12 months. The most common period in which respondents were not able to meet their needs was between January and March 2017.
The average MAHFP for Abiemnhom and Mayom was 9.5 months, while in Akuem it was 10 months . This is slightly above a minimum level of nine months a year. In both Aweil North and East and over 90% (n=338) households interviewed indicated they would not have enough food from any source (such as market/purchase, own production, exchange or borrowing) to meet their family´s needs between October and March and they employ coping strategies to survive. Notably, their current stock produced from own production would take on average only 4 months.
Figure 16: MAHFP
7%
45%
33%
11%
4%0%
0%
5%
10%
15%
20%
25%
30%
35%
40%
45%
50%
12 months 11 months 10 months 9 months 8 months 7 or less months
Per
cen
tage
of
tota
l rep
on
den
ts
MAHFP Scores - Pariang
44%
13%
28%
10%5%
1%0%
10%
20%
30%
40%
50%
60%
70%
80%
90%
100%
0%
10%
20%
30%
40%
50%
60%
70%
80%
90%
100%
12 months 11 months 10 months 9 months 8 months 7 months andbelow
Per
cen
tage
of
tota
l res
po
nd
ents
Per
cen
tage
of
tota
l res
po
nd
ents
MAHFP Scores - Mayendit

Page 46 of 114
4.3 Agricultural Production Staple Crops In Pariang, 96% (n=479%) of the respondents planted staple crops in the last planting season. The main staple crops grown were sorghum (91%, n=436) and maize (77%, n=368). Fewer HHs planted groundnuts and sesame, at only 12% and 11%, respectively. The main source of seeds reported was seed savings from the previous season (80%, n=384); 8% (n=39) sourced their seeds from friends or relatives, and 6% (n=30) received seeds from an aid agency or NGO. More than half (53%, n=252) of respondents grew two types of staple crops and 18% (n=85) grew at least three or more types.
In Mayendit, 97% (n=473) of respondents indicated that they had planted staple crops during the last planting season, which started around April, May, and June. Harvest happened in the months of August, September and October 2017. Of the 473 respondents, 96% (n=259) planted maize, and 74% (n=200) planted sorghum. Other crops mentioned included groundnuts, millet, sesame, cassava, and sweet potatoes. In Akuem, a majority [95.1% (n=387)] of respondents planted staple crops in the last planting season. Most [46% (n=179)] of those who planted staple crops had saved seeds from the previous harvest, 134 (34%) bought seeds from the market, 15% (n=58) borrowed from their neighbors or family members, and 4% (n=14) got seeds from an aid agency (NGO). The most common staple crop planted by respondents [93% (n=377)] was sorghum, followed by sesame [45% (n=184)].
58.7%
3.9%
15.5%
1.7% 2.6%
17.7%
0.0%
10.0%
20.0%
30.0%
40.0%
50.0%
60.0%
70.0%
% o
f R
esp
on
den
ts
Number of Months
MAHFP Abiemnhom
18.2%19.7% 19.2%
5.4%
12.8%
23.6%
0.0%
5.0%
10.0%
15.0%
20.0%
25.0%
% o
f R
esp
on
dn
ets
Number of months
MAHFP Mayom

Page 47 of 114
Figure 17: Staple Crops
91%
77%
12% 11%3% 0% 0%
0%
10%
20%
30%
40%
50%
60%
70%
80%
90%
100%
Sorghum Maize Groundnuts Sesame Millet Sweetpotato
Cassava
% o
f R
esp
on
den
ts
Staple crops grown
Staple Crops Grown- Pariang
74
96
71
5 3
0
10
20
30
40
50
60
70
80
90
100
0
10
20
30
40
50
60
70
80
90
100
Sorghum Maize Ground nuts Sesame Millet Sweet potatoes
per
cen
tage
of
tota
l res
po
nd
ents
per
cen
tage
of
tota
l res
po
nd
ents
Staple Crops Grown-Mayendit

Page 48 of 114
Vegetables Of the respondents in Pariang, 86% (n=429) planted vegetable seeds during the last planting season. The main vegetables planted were okra (93%), pumpkin (67%) and tomatoes 66%. The main source of seeds was aid agencies or NGOs 62%; 23% planted seeds from their own savings and 8% received seeds from friends or relatives. Of the total respondents, 45% grew four or more types of vegetables and more than half 55% grew less than four types of vegetables.
Vegetables were planted by 93% (n=449) of respondents in Mayendit during the last planting season. Most of the planting took place around April, May, and June. The respondents indicated that vegetables would be ready for harvest around July, August, and September 2017. Of the respondents, 90% (n=242) got the seeds from an NGO or other aid agency, 3% (n=8) received them as a gift from neighbors of relatives, and 1 % (n=2) saved seeds from the previous season. In Akuem, 91.1% (n=374) planted vegetables; 40.3% (n=151) had their own supply of vegetable seeds, 32.3% (n=121) bought seeds at the market, 15.7% (n=59) obtained seeds from neighbors or family
93%
30%
9%
45%
9% 9%
24%
0%
10%
20%
30%
40%
50%
60%
70%
80%
90%
100%
Sorghum Maize Millet Sesame Cassava Potato Groundnut
Staple Crops Grown- Akuem
94
76
8
73
9
35
70
3
77
90
13
3 08
70
23
0
10
20
30
40
50
60
70
80
90
100
0
10
20
30
40
50
60
70
80
90
100
Sorghum Maize Millet Sesame Cassava Sweet potato Groundnuts Others
% t
ype
of
stab
le c
rop
s gr
ow
n
% t
ype
of
stab
le c
rop
s gr
ow
n
Vegetables grown Abiemnhom and Mayom
Abiemnhom Mayom

Page 49 of 114
members, and 11.7% (n=44) received seeds from an aid agency. Most of the respondents [98% (n=368)] had planted okra, followed by tomatoes [28% (n=105)]. No one had planted carrots.
Figure 18: Vegetables Planted
93%
17%
42%
67% 66%
35%29%
53%
40%29%
0%10%20%30%40%50%60%70%80%90%
100%
% o
f R
esp
on
den
ts
Vegetables
Vegetables grown- Pariang
52
75 77
4146
69
52
16
38
6962
0
10
20
30
40
50
60
70
80
90
% o
f re
spo
nd
ents
Type of vegetable planted
Vegetables planted Mayendit
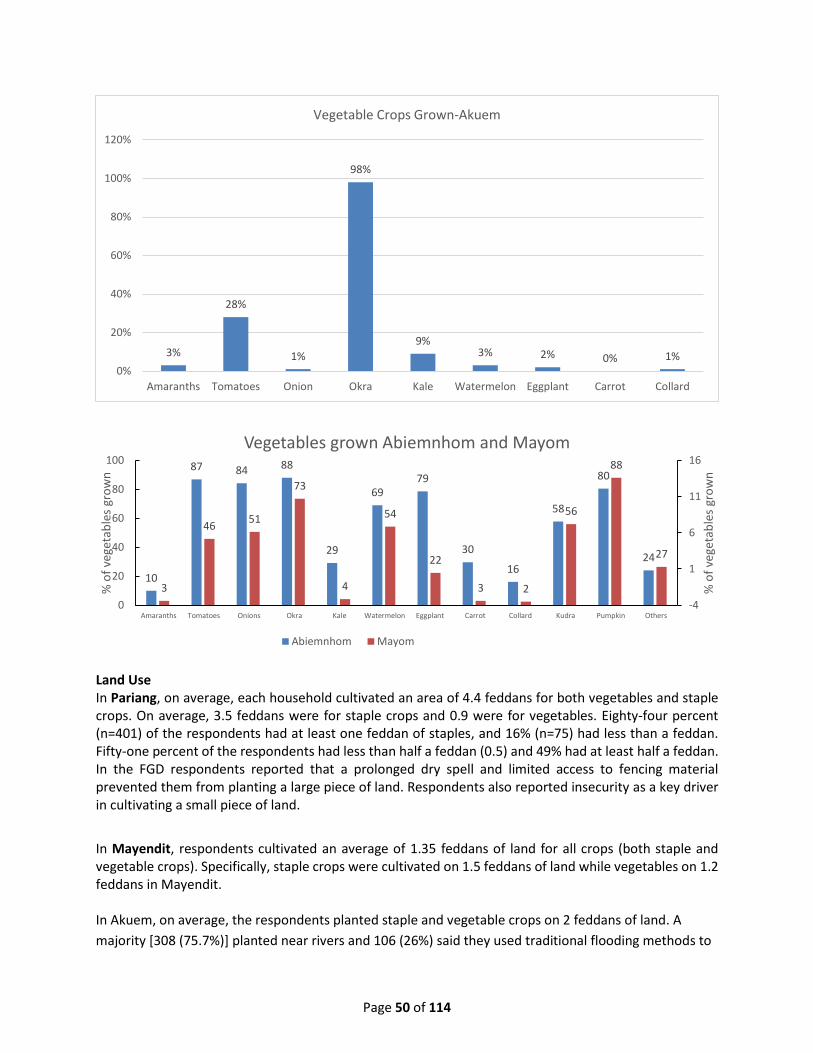
Page 50 of 114
Land Use In Pariang, on average, each household cultivated an area of 4.4 feddans for both vegetables and staple crops. On average, 3.5 feddans were for staple crops and 0.9 were for vegetables. Eighty-four percent (n=401) of the respondents had at least one feddan of staples, and 16% (n=75) had less than a feddan. Fifty-one percent of the respondents had less than half a feddan (0.5) and 49% had at least half a feddan. In the FGD respondents reported that a prolonged dry spell and limited access to fencing material prevented them from planting a large piece of land. Respondents also reported insecurity as a key driver in cultivating a small piece of land.
In Mayendit, respondents cultivated an average of 1.35 feddans of land for all crops (both staple and vegetable crops). Specifically, staple crops were cultivated on 1.5 feddans of land while vegetables on 1.2 feddans in Mayendit. In Akuem, on average, the respondents planted staple and vegetable crops on 2 feddans of land. A
majority [308 (75.7%)] planted near rivers and 106 (26%) said they used traditional flooding methods to
3%
28%
1%
98%
9%3% 2% 0% 1%
0%
20%
40%
60%
80%
100%
120%
Amaranths Tomatoes Onion Okra Kale Watermelon Eggplant Carrot Collard
Vegetable Crops Grown-Akuem
10
87 84 88
29
6979
30
16
58
80
24
3
4651
73
4
54
22
3 2
56
88
27
-4
1
6
11
16
0
20
40
60
80
100
Amaranths Tomatoes Onions Okra Kale Watermelon Eggplant Carrot Collard Kudra Pumpkin Others
% o
f ve
geta
ble
s gr
ow
n
% o
f ve
geta
ble
s gr
ow
n
Vegetables grown Abiemnhom and Mayom
Abiemnhom Mayom

Page 51 of 114
irrigate their farms. On average, farmers cultivated staple crops and vegetables on 2.9 feddans of land in
Abiemnhom and 1.9 feddans in Mayom.
Food Stocks Respondents were asked how long their current stocks of food produced from their own harvest would last them. In Pariang, 32% (n=162) of the respondents said their food stocks would last for the next two to less than four months (2- <4 months), 24% (n=122) claimed food stocks would last for four to less than six months (4- <6 months) and 17% (n=86) reported that food would last for more than six months. In Mayendit, 50% (n=134) had food stocks to last between two weeks to less than one month, followed by 14% (n=39) having food stocks to last between one to less than two to four months. In Akuem, a majority [37.1% (n=150)] indicated that their own produce would last between two and four months. In Agok (Abiemnhom and Mayom), 34% (n=140) of respondents who planted and preserved their harvest from the previous planting season said it would sustain them for 1-<2 weeks and 39% (n=104) stated that their stocks would last 2 weeks -< 1 month.
Figure 196: Food Stocks
0%
5%
14%
6%
32%
24%
17%
0% 5% 10% 15% 20% 25% 30% 35%
less than 1 week
1-<2 weeks
2 weeks- < 1 month
1 month- < 2 months
2- < 4 months
4 months- < 6 motnhs
6 months or more
% of Respondents
Du
rati
on
in M
on
ths/
wee
ks
Time food stocks will last- Pariang

Page 52 of 114
50%
14%
35%
0% 10% 20% 30% 40% 50% 60%
less than 2 months
2-4 months
more than 4 months
% of respondents
Du
rati
on
Food Stocks Mayendit
10
34
29
3
1
17
3
9
22
39
26
12
1
1
0 5 10 15 20 25 30 35 40 45
less than 1 week
1-<2 weeks
2 weeks- < 1 month
1 month- < 2 months
2- < 4 months
4 months- < 6 motnhs
6 months or more
% length of food harvest
len
gth
of
curr
ent
har
vest
Food Stocks Agok
Mayom Abiemnhom
2.20%
5.40%
9.90%
25.00%
37.10%
14.40%
5.90%
0.00% 5.00% 10.00% 15.00% 20.00% 25.00% 30.00% 35.00% 40.00%
Less than 1 week
1-< 2 weeks
2 weeks - < 1 month
1 month - < 2 months
2 < 4 months
4 months - < 6 months
6 months or more
% of respondents
Time food stocks will last- Akuem

Page 53 of 114
Projected increase in the number of months of food self-sufficiency due to distributed seed systems/agricultural inputs for beneficiary households By evaluating the duration of food stocks and the time between planting and harvesting, a lean period can be determined. If a HH waits two months between planting and harvesting, but only has one month of food stocks, they will struggle to find food for one month out of the two. In Pariang, the MAHFP was used to determine the months of food sufficiency. From the survey results, the average MAHFP score was 10.4 months. This figure did not change significantly from the baseline score of 10.3 months. However the average number of month’s food stocks will last increased from 2-4 weeks at baseline to 2-4 months at end line. During FGDs, respondents reported that they grew three varieties of sorghum, of which two are short maturing varieties planted in June and harvested in August, and one is a long maturing variety planted in August and harvested in January.
In Akuem, the average MAHFP was 10 months and while in both Abiemnhom and Mayom the MAHFP was 9.5 months.
4.12 Fishing
In Mayendit, 40% (n=107) of the respondents practiced fishing. Thirty-eight percent (102) used spearing, 33% (n=90) used a hook and line, and 9% (n=25) used net casting. Of the fish caught, 30% (n=82) was consumed at the household level, 29% (n=77) was sold for cash, 22% was dried for storage and 19% (n=50) was given/shared with neighbors.
In Akuem, 53% (n=194) of the respondents practiced fishing. The high season for fishing goes from October through January. The most common fishing method is net casting. Mudfish and tilapia are the most common fish harvested. Most respondents [74% (n=182)] said they threw fingerlings back in the water when they caught them.

Page 54 of 114
4.4 FSL Indicator Table Figure 20: Food Security and Livelihoods Indicators
Objective: To improve food security and livelihoods among IDPs and communities in targeted areas through
increased and diversified food production and livelihood opportunities
Sub Sector Indicator Baseline Target Data Source Mayendit Pariang Mayendit Pariang
1.1. Improving Agricultural Production/Food Security
1.1.1: Projected increase in number of months of food self-sufficiency due to distributed seed systems/agricultural inputs for beneficiary households
7 months33 2 – 4 week food stocks34
10 months35 2 - 4 week food stocks
10 months36 2 month food stocks37
11 months38 3 month39 food stocks
Baseline/ Endline Survey
1.1.2: Number of people benefiting from seed systems/agricultural input activities, disaggregated by sex.
3,550 (M=639, F=2911)
1,310 (M=165, F=1,145)
2,025 (M=5, F=1,511)
1,050 (M= 420, F= 630)
Monthly/ quarterly reports
1.2: Pests and Pesticides
1.2.1: Number of people trained in pest control practices, disaggregated by sex
1,883 (M=299, F=1,584)
1,068 (M=177, F=891)
2,025 (M=5, F=1,511)
1,050 (M= 420, F= 630)
Monthly/ quarterly reports
1.2.2: Number of people trained by USAID/OFDA partners practicing appropriate crop protection procedures, disaggregated by sex
1,883 (M=299, F=1,584)
1,068 (M=177, F=891)
2,025 (M=514, F=1,511)
1,590 (M=477, F=1,113)
Endline Survey
33 This is taken from MAHFP, where, on average, HHs had food for 7 months of the year. 34 From results HHs have an average of 2-4 weeks of food stocks. 35 This is taken from the MAHFP where on average HHs had food for 10 months of the year. 36 This is assuming that food self-sufficiency due to distributed seeds increases to 10 months of the year 37 Projected increase to food stocks from distributed seed systems/agricultural inputs. 38 This is assuming that food self-sufficiency due to distributed seeds increases to 11 months of the year. 39 Projected increase in food stocks from distributed seed systems/agricultural inputs.

Page 55 of 114
5. Discussion
5.1 Pariang The food security situation in Pariang has slightly improved after the provision of vegetable seeds and
staple crop seeds, which is reflected in the fact that 91% of the households having acceptable food
consumption scores. However, food insecurity is still a problem as 28% of the respondents showed severe
hunger on the household hunger scale, and 10% of the HHs reported one meal aday for adults. Households
with severe hunger could be these without assets like livestock to provide meat and milk during the lean
season, when food stocks are lower. Most of the HHs planted staple crops; however, they were faced with
challenges such as crop pests and diseases, a prolonged dry spell, and insecurity, as reported by FGD
participants.
Farmers acquired knowledge of some agronomic practices such as row planting, crop spacing, and the
preparation and application of compost manure. The focus group discussions revealed that farmers
applied the knowledge they gained from the training, as they were able to reveal some of the benefits of
the agronomic practices they implemented in their gardens and the challenges they faced. The advantages
of row planting mentioned in all FGDs were “easy to weed crops” and “easy to intercrop”; however, FGD
participants mentioned the disadvantages of row planting as being “it takes a lot of time to plant a piece
of land” and crops are easily “attacked by pests”. The method of ash application did not help farmers in
controlling crop pests. This could be because the ash was not applied at the right time. “I applied ash when
I saw the insects on the leaves of the okra,” one of the FGD participants reported.
The project addressed the seed gaps, especially vegetable seeds, and improved the farmers´ knowledge
of key agronomic practices. Farmers are harvesting vegetables and reaping benefits through diversified
household diets and income earned through the sale of vegetables. This money is used to meet other
household needs such as soap and salt, as reported by one FGD participant, ¨I earned 500 SSP from the
sale of okra I planted and I used the money for buying soap and salt”. Farmers still have a big problem
with pest management and therefore need more training on this subject.
5.2 Mayendit More than half the population of Mayendit is still food insecure, according to the FCS, where 41% are considered either borderline or poor, while only 23% of the HHs have acceptable FCSs. One reason for this is that food sources are unsustainable and can change anytime, often for the worse. This is mainly attributed to the insecurity beginning in 2013, which has not allowed the population to settle and undertake active farm cultivation and livestock rearing; even though they are predominantly agro-pastoralists, vast areas of land lie bare and uncultivated. Samaritan’s Purse – in partnership with WFP - provides food assistance in three locations in Mayendit: Thaker, Dablual, and Mayendit Center. The populations in these areas have come to rely heavily on food distributions as a main source of food. However, due to rationing, the General Food Distributions (GFDs) have been less frequent in the past months. There is, therefore, a need to advocate for more frequent
Page 56 of 114
food distributions, to avoid delays and gaps that would lead to borrowing and loaning of food, resulting in inadequate HH food provisioning. From the findings, it is apparent that preference is given to maize and sorghum as staple crops, and to groundnuts, tomatoes, onion, and okra as vegetables. The communities are familiar with growing these varieties, but are often not growing enough. The results indicated a remarkable improvement in vegetable planting in early 2017. Samaritan´s Purse was involved in the distribution of vegetable seeds of different varieties, which had not been available in the local market prior to this. There is, however, still a need for further staple crop and vegetable diversification to improve nutrition and diet. Very little land is used in Mayendit for crop and vegetable production. Households generally cultivate around their huts. There is a need for more sensitization on the importance of putting more land to use in crop and vegetable production. Generally in Mayendit, food stocks do not last beyond three months. Most of the food is consumed within the first month after receiving it or harvesting. This is mainly attributed to sharing with neighbors and larger HH sizes; most respondents reported hosting at least one visitor (an IDP). As much as diversification is important, scaling up the cultivation of these specific staple crops and vegetables would ease food availability at the HH level as well as in the market. Some HHs indicated selling their produce. If increased farm harvests are sold in exchange for fish or particular vegetables, then there is likely to be an improvement in dietary food diversification at the HH level.
5.3 Northern Bar el Ghazal (Akuem, Abiemnhom and Mayom) The food consumption score within the acceptable range was 47%, which may not paint a picture of food security. The almost fifty percent could be attributed to seasonality factors, as the survey was conducted during the harvest period. Respondents indicated that food from their own production would be consumed withinonly two to four months, and, on average, planted only two feddans. These figures indicate that the post-harvest period between November and January will find most families with inadequate food storage from the current harvest. This is long before they get to the lean period when they start cultivating and planting, between April and June next year, then start to wait for the harvest.
As with the rest of the counties surveyed, the Household Dietary Diversity Survey (HDDS) indicated that most of the households consumed sorghum- a cereal with inadequate tubers; both animal and plant protein is minimal. There were no eggs and very little oil and milk for those who might need it most – children under five years, whose growth and development depend on vital foods like these.. Further, most of the HHs visited had no cows, goats or chickens.
On average, the community has 10 Months of Adequate Household Food Provisioning (MAHFP), slightly above the minimum of 9 months. This could be attributed to the rotational, open and operational market in the region, which allows the flow of different commodities in the market. However, since there are many IDPs in Aweil, in many cases without land to cultivate and minimally engaged in economic activities, there is still a need to ensure secure livelihoods and food availability for these groups.
It also emerged that despite knowing different fishing methods, many households did not practice fishing. Meanwhile, in the HHs that practiced fishing, women were observed to be partners in fishing activities. They were involved in meal preparation, and the processing and sale of fish in the market and along rivers. There is a need to encourage the fishing industry in Aweil, as the fishing season picks up during the lean season. This would also bridge the hunger-gap and encourage market activities.

Page 57 of 114
6. Recommendations Pariang
The supervision of farmers’ groups should be improved in future food security programming. Most of
the farmers’ group did not receive enough support from the field monitors and their participation in the
group was very low. This was evident in the fact that demonstration crops were not well managed by
group members, and beneficiaries´ ownership of the demonstration gardens was not created.
In future food security programming, cooking demonstrations should be incorporated, so that HHs are
able utilize the vegetables they produce. Households reported that they were familiar with most of the
vegetables but were unable to cook them for their families; however, they could always sell them in the
market.
Vegetable farming is mostly during the rainy season while staple crop done during the dry season. It is
therefore recommended that farmers be encouraged to practice dry season farming, especially along
the rivers, in order to utilize the water for irrigation. This will boost HH food security and also provide
income to HHs when vegetables are sold in the local markets.
Mayendit
In Southern Mayendit, community members have learned basic agronomy practices through mentorship
programs between lead and follow farmers. The community has observed land preparation and
management exercises but there is still a need for strengthening follow-ups and sensitization to the
community so that more will take up the practice.
Most HHs in Northern Mayendit were displaced and crops destroyed by flooding just when staple crops
started to flower, to produce seeds. It would be important to encourage staple crop cultivation on
higher ground and encourage planting during the dry season, using irrigation technologies. Additionally,
it is recommended that the community be supported to build and maintain bigger dykes to reduce the
effect of flooding on crops during the rainy season.
Besides sorghum and maize, there are other crops such as sesame, groundnuts, and sweet potatoes
which would do well in this environment. There is a need to undertake deliberate awareness efforts for
crop production diversification in Mayendit so that the community does not depend on seasonality, in
which there is a lengthy lean period.
For the future, livestock-based cultivation should be integrated, as the Mayendit community is largely
composed of agro-pastoralists. Field assessments showed that vegetable crops planted in almost all of
the areas showed symptoms of nitrogen deficiency, with the exception of those planted in areas
previously used for cattle. To mitigate this, integrating the use of manure as fertilizer into programming,
along with trainings through practical demonstrations on progressive farmer plots, should be given due
emphasis. Furthermore, demonstrations of ox-ploughs could help HHs cultivate more land.

Page 58 of 114
Further, vegetable farming is mostly during the rainy season. It is therefore recommended that farmers be encouraged to practice dry season farming, especially those located along the rivers where they can use the water for irrigation. This will boost HH food security and also provide income to HHs when vegetables are sold in the local markets. Also, Farmer Field Schools and Village Savings and Loan Associations should be explored and incorporated in future food security and livelihood programming. Northern Bar el Ghazal
Generally, in both Akuem and Abiemnhom and Mayom, scaling-up cultivation of more staple crops in more acreages/feddans to increase food production, is key. There is also a need to diversify staple crop production to include leguminous crops such as sweet potatoes, cassava, pumpkins and the like, to cover the gaps during the lean season. The fishing industry is of immense potential and is yet to be fully exploited. These would not only improve food security, but also increase dietary diversity, which is vital, especially for the children.

Page 59 of 114
Chapter 3 - Nutrition
1. Summary of Findings Pariang: Of the 473 children surveyed, 141 were under six months (48% males and 52% females), and 332 were at least between six and 23 months (49% males and 51% females). Exclusive breastfeeding (EBF): Of those children under six months, 76% were exclusively breastfed (among exclusively breastfed children, 54% were male and 46% female). Five percent of children under six months were not breastfed while the 19% were breastfed on formula or other foods. Timely initiation of breastfeeding: In Pariang, 74% of children under six months were breastfed within one hour after birth. Among those breastfed within one hour, 51% were males and 49% females. Twenty-four percent were breastfed after “one hour.” Minimum meal frequency (MMF): Of children between six and 23 months, 57% met the required Minimum Meal Frequency. (Among children meeting MMF, 49.7% were male and 50.3% female).
Minimum Dietary Diversity (MDD): Of children ages six to less than 24 months in Pariang, only 3.5% consumed at least four or more of the seven food groups the previous day. Among those that met this condition, 30% were males and 70% females. Minimum acceptable diet (MAD): Of children ages six to less than 24 months in Pariang, 3% met the minimum acceptable diet. (Among these, 38% were female and 62% were male). Iron-rich foods or iron-fortified foods: Among the children six months to less than 24 months, 15% consumed iron-rich or iron-fortified foods. Of these, half were females. Slept under long-lasting insecticide treated net (LLITN): In Pariang, 80% of the children under 24 months slept under long lasting insecticide treated nets. The same percentage of children under six months slept under LLITNs. SAM and GAM Rates: In Pariang, the GAM rate was 24.2%, with the SAM rate being 6.1%, using weight-for-height (WFH) z-scores. Severe underweight and underweight: From the SMART survey, the prevalence of severe underweight and underweight among children under the age of 5 years was 6.1% and 24.4%, respectively, using weight-for-age (WA) z-scores
Severe stunting and stunting: The prevalence of severe stunting and stunting among children under five years was 2.8% and 13.5%, respectively, using height-for-age (HA) z-scores.

Page 60 of 114
2. Background and Context
2.1 Pariang Pariang County is located within the new Ruweng State. The county borders Panyikang County to the east, Rubkoma County to the south, Mayom County to the southwest, and South Kordofan to the north. It is divided into nine administrative payams, namely: Pariang, Nyiel, Jamjang, Biu, Gumriak, Wunkur, Yida, Alliny, and Panyang. The predominant livelihood system in Pariang is agro-pastoralism, with the main focus on cattle keeping and food crop farming; in addition, fishing forms an important part of livelihoods in the Jau area and in Lake Noah.
Pariang County has suffered the effects of a country at war. Even though fighting has not taken place in the county in recent years, the presence of soldiers and the constant threat of war can cause families to move against their will. It is difficult for children to thrive in this challenging environment because the stress of displacement and insecurity affects breastfeeding and complementary feeding. The lack of peace and security makes it even more difficult for rural communities to get what they need, because supply chains and local markets are not reliable, rains vary from year to year, and the food situation is constantly changing. A recent report by Integrated Food Security Phase Classifications (IPC) indicated that Central Equatorial, which is the net producer of over half of the country’s cereals, has been impacted by recent violence and may have lost half of all harvests;, a situation that will most likely result in a record high national cereal deficit in 2018. Food security in South Sudan has further deteriorated due to armed conflict, economic crisis, and below average harvests that were exhausted well before the current lean season40. Food security and nutrition are correlated; increased food insecurity increases strain on the nutritional status of children. A SMART survey conducted by CARE International in Pariang County in May 2017 revealed a SAM rate of 6.1%, and a GAM rate of 24.2%, for U5s. The GAM rate was measured through weight-for-height. Additionally, the SMART survey showed that 24.5% of U5 children were underweight and 13.5% of children U5 were stunted41. Samaritan’s Purse implemented OFDA-funded nutrition programming in Pariang in 2014-2015 and 2015-2016, and has been involved with IYCF, OTP, TSFP, and BSFP programming for refugees in Pariang County. Despite current and past programs, many needs remain, especially for families living far from markets or roadways. Additionally, many HHs are headed by women, as many men are absent due to war or the search for employment. Because women are traditionally responsible for the well-being of children, women’s heavy household and childcare workloads negatively affects their EBF ability and their ability to provide the proper frequency, diversity, and attention needed to ensure proper complementary feeding, especially within larger families.
2.2 Mayendit Mayendit has experienced ongoing conflict since 2013. Additionally, the habitual cattle stealing, armed conflict, and occupation of Southern Mayendit by gunmen in 2015 deeply aggravated livelihoods, affecting food security and nutrition status, especially for children U5. Between May and August 2015, community members fled their homes and NGOs suspended their projects for a period of four months, during which
40 IPC Report South Sudan May, Projection June –July 2017 41CARE, May 2017, SMART nutritional anthropometric survey

Page 61 of 114
many people lived in swamps, were cut off from services, and experienced a critical deterioration in their health and nutritional status. In the swamps, they gathered water lilies and survived on fish. During this time, malnutrition rates spiked. Even so, SP continued its emergency relief efforts (food, NFIs) to communities in the swamp and islands in Rubchar, Kwaniang, and Dablual. SP resumed its operations in Southern Mayendit in September 2017, after staff were evacuated three times between January and September. Unfortunately, it was not convenient to complete a nutritional assessment. This is because our sampling procedure, which is also usually advised by the nutrition cluster, aims to cover at least 20 villages. We have since rescheduled the baseline- a nutrition KAP survey in Mayendit which actually commenced in the week of November 20, 2017 in the relatively calmer Southern Mayendit. We will proceed and complete the assessment in Northern Mayendit as well if security permits, and will subsequently include the data in the first semi-annual OFDA report. Samaritan’s Purse implemented FSL and Nutrition programs (BSFP, TSFP and IYCF) in Southern Mayendit in 2015 and 2016, and has now scaled up to Northern Mayendit in 2017. Samaritan’s Purse through the OFDA InterCAP project funding implements an IYCF nutrition program in Mayendit following the Care Group model (targeted to all women of reproductive age), which aims to improve IYCF practices among pregnant women and mothers of children under two. Samaritan´s Purse implements TSFP and GFD supported by WFP, targeting PLW and children U5.

Page 62 of 114
3. Methodology This section outlines the steps taken to conduct the nutrition endline assessment in Pariang County. This includes the overall aims and objectives of the assessment, sample frames, survey methodologies, and data collection, entry, and analysis. The assessment was conducted in August 2017. The assessment evaluates progress against baseline information that was collected for indicators in July 2016 for a previous OFDA-funded nutrition program, and, therefore, data collected for this baseline also serves as end line data for the previous nutrition project in Mayendit. However, in Pariang where OFDA funding has phased out for nutrition programing, this is an end line assessment.
3.1 Objectives of the Nutrition End line The specific indicators were as follows:
1. Number and percentage of infants 0-<6 months of age who are exclusively breastfed 2. Number and percentage of children 6-<24 months of age who receive foods daily from four or
more groups (to achieve minimum dietary diversity) 3. % of children 0-<24 months who slept under a Long Lasting Insecticidal Treated Net (LLITN) the
previous night 4. % of children 6-<24 months of age who received an iron-rich food or iron-fortified food in the last
24 hours. 5. % of breastfed and non-breastfed children 6-<24 months of age who receive solid, semi-solid or
soft foods the minimum number of times or more. Minimum Meal Frequency (MMF) 6. % of children 6-<24 months who receive a Minimum Acceptable Diet (MAD) 7. % of children born in the last six months who were put to the breast within one hour of birth
3.2 Survey Methodologies The assessment examined the practices of mothers regarding IYCF. Mothers and caregivers of children between 0-23 months who were willing to participate were included in the study. Both qualitative and quantitative information was collected for this assessment. Focus Group Discussions involved lead mothers (LMs) and Community Nutrition Volunteers (CNVs) over 14 years of age.
3.2.1 Sample Frame and Sample Size: The survey was conducted in three payams: Yida, Aliiny, and Jamjang. The sample frame only included bomas that were accessible from the three payams during the time of the assessment. Accessibility of bomas was mainly affected by broken community access roads, due to the onset of heavy rains, and insecurity in some of the bomas, especially in Jamjang and Aliny payams. (See Annex A.1 for sample frame). Sample size for children between 0-23 months was calculated on the basis of key IYCF parameters entered into an excel sample size calculator (power 20%, precision 5%, confidence level 95%, design effect 1.0, estimated prevalence at 5%) developed by Brad Woodruff and Jay Ross.
The sample size was calculated at 376, which was the largest number among available indicators in the embedded excel sheet, corresponding to exclusive breastfeeding under six months42. It was then rounded up to a sample size of 400 HH although, in the end, 414 HHs (421 mothers/caregivers) were sampled.
42 CARE SMART Nutrition Survey – Pariang County (May 2016)

Page 63 of 114
Prevalence of exclusive breastfeeding was expected to improve by five percentage points over the duration of the project.
3.2.2 Sampling Methodology The survey was a cross sectional study with two-stage cluster sampling. The sampling frame consisted of the accessible population of the three payams (Aliiny, Yida and Jamjang). Bomas were used as the sampling unit (cluster) and were randomly selected from the sampling frame based on probability proportional to size (PPS). Primary respondents were mothers/caretakers of children under two years (0-23 months) of age. The first stage involved selecting accessible clusters (bomas) from the three payams to be included in the survey. All the accessible bomas of these payams were sampled using PPS. The second stage was household selection through systematic random sampling. Enumerators travelled to the center of the boma, and then used the selected sampling interval (SI). This number was used to select the first house, and then subsequent houses are selected by the SI. If the household did not include members matching the assessment criteria, enumerators would continue to follow the SI and move on to the next household.
3.2.3 Data Collection and Tools Mobile Data Collection (MDC) was used to collect data in the households. Apple iPads fitted out with iFormBuilder were used by enumerators. All questionnaires were written in English although the interviews were conducted in the Dinka language, as the respondents were not conversant in English. During training, question translation was mastered to ensure consistency among the enumerators. A questionnaire pretest was applied to ascertain that the enumerators had understood the questionnaires’ content, and also to correct any errors evidenced. Data collected using iFormBuilder was uploaded to the server at the end of each day.
Data collection occurred over a period of six to nine days. Six enumerators were recruited and trained for the exercise. Two days of training were given to previously experienced enumerators, focusing on data collection procedures, interviewing skills, and fundamental nutrition concepts and vocabulary. Review and translation of the questionnaire formed the main part of the training, as well as significant emphasis on the proper use of a calendar of events, skip patterns, effective probes, etc., to ensure the correctness of the data collected. Qualitative data was collected from FGDs across the four payams, involving LMs and CNVs.
3.3 Data Quality Previously experienced enumerators were selected and trained on how to use the tools and how to determine age using an events calendar, for those who did not know their child’s birthday. Enumerators were closely supervised during data collection, checked for consistency and verified daily prior to data entry. Feedback was given to enumerators before data collection began the following day. Random spot checks were made on entered data and then the data was cleaned, to ensure consistency before analysis was done.
3.4 Data Entry and Analysis iFormBuilder automatically produced an MS Excel spreadsheet. All data was then cleaned and analyzed in MS Excel by an M&E officer.

Page 64 of 114
3.5 Limitations The assessment was conducted during farming (land clearance and planting) season, when most of the
mothers were on their farms, which made it difficult to get the planned number of HHs in some bomas.
Most of the bomas in Aliny payam were inaccessible, principally because of insecurity and poor roads. The
only accessible Aliny boma was Alilang, and there were reports that some of the inhabitants of bomas
with insecurity had settled in Alilang. Data collection was not carried out in Awoch boma due to heavy
rains prior to the day of the assessment, which made the boma inaccessible. The questionnaires for Awoch
were then administered in other bomas which were accessible within the payam.
The ipad was unable to display the question of a child aged 6-23 months having received any formula,
animal milk, powdered milk, yogurt or sour milk the previous day, when the child´s age was 23 months
and some weeks. High wage demands by enumerators interrupted the assessment schedule. This problem
came up when one of the agencies in the area conducting a similar assessment paid double the SP wage
rates.
The iForm was unable to recognize any child with age of 23 months and 5 or more weeks resulting into
part of the questionnaire showing that age group and incomplete data was collected from such
respondents. The problem was that for every child who was at least of 23 months old, the questions of
whether a child was breastfed and if the child had eaten any solid, semi-solid or soft food/liquids did not
appear for that child in the iForm, a technicality that has been resolved for future surveys.

Page 65 of 114
4. Results
4.1 Demographics In Pariang, a total of 469 children under 24 months of age were sampled. Of these children, 141 were under six months, and 332 were between six months and 23 months. There were 49% (n=67) males and 52% (n=73) females under six months old43. Of children between six and 23 months of age, 48% (n=160) were males and 51% (n=169) were females44. The average age of the surveyed children was 12 months. To determine the age of the children, the enumerators asked for a birth certificate or other document identifying the date of birth. If such a document was not available, an events calendar was used to determine the age of the child, in months, as accurately as possible. Figure 217: Gender of Children
4.2 Infant and Young Children Feeding practices Exclusive Breastfeeding Exclusive breastfeeding (EBF) is defined as the child receiving no food, drink, or liquid other than breastmilk, with the exception of oral rehydration solution, vitamin or mineral drops/syrups, or medicines45. In Pariang, out of the children under six months, 76% (n=106) were being exclusively breastfed46. Focus Group Discussions revealed that children were exclusively breastfed up to the age of three to six months, depending on how long a mother had enough milk for her child.
43 The total number of children less than six months was 100. Gender data is missing for one child. 44 The total number of children six to less than 24 months of age was 400. Gender data was missing for 3 children. 45 WHO. http://www.who.int/elena/titles/exclusive_breastfeeding/en/ 46 Gender data was missing for one of the children. Therefore percentages of males/females were calculated with 140 as the denominator instead of 141.
14% 16%30%34% 36%
70%
0%
20%
40%
60%
80%
Male Female Total
Gender and Age Groups
0-5 months Less than 24 months

Page 66 of 114
Figure 22: Exclusive Breastfeeding
Timely initiation of breastfeeding In Pariang, 74% (n=105) of the mothers/caretakers reported that they breastfed their children immediately after birth, 25% (n=35) were breastfed after one hour or more, and 1 child was never breastfed.
Figure 23: Timely Initiation of Breastfeeding
Minimum Meal Frequency The World Health Organization recommends that breastfed children consume solid, semi-solid, or soft foods at least twice a day between the ages of six to eight months, and at least three times a day between the ages of nine to 23 months. For children six to 23 months who are not breastfed, the recommendation is four times daily47. All of the children meeting these requirements are included in the total numbers that follow.
47 IYCF CARE, IYCF Practices- collecting and using data
41%
6%1%
35%
14%
4%
76%
19%
5%
0%
10%
20%
30%
40%
50%
60%
70%
80%
Exclusive breastfeeding Mixedfeeding(Breastmilk andother milks or liquids)
Not breastfed
% o
f ch
ildre
n u
nd
er 6
mo
nth
s
Breastfeeding
Exclusive breastfeeding
Male
Female
Total
74%
25%
1%0%
20%
40%
60%
80%
Immediately > 1 hour Never
% o
f ch
ildre
n <
6 m
on
ths
Time after birth when child was put to the breast
Early Initiation of Breast
Feeding

Page 67 of 114
Of children ages six to 23 months in Pariang, 57% (n=163) met the requirements for minimum meal frequency (MMF). Males and females were relatively similar in meeting MMF requirements, with 28% (n=81) of males and 41% (n=82) of females achieving the standard48.
Figure 24: Minimum Meal Frequency
Minimum Dietary Diversity (MDD) Minimum dietary diversity (MDD) is determined by the number of different food groups children ages six to 23 months have eaten in the previous day. Seven different food groups are considered: grains, legumes, dairy, flesh foods (meat), eggs, vitamin A- rich fruits and vegetables, and other fruits and vegetables. If children have eaten from four or more of the different food groups, they meet the standards for MDD. Among children six to 23 months old, 3.5% (n=10) had consumed four or more different food groups the previous day. This low percentage was due to the unavailability of some food groups in the community, as revealed in the FGDs. More than half of the children six to 23 months old [51% (n=147)] consumed two food groups; 31% (n=89) and 14% (n=41) consumed a single food group and three food groups, respectively. The most consumed and available food group was grains with 75% (n=249), followed by dairy 68% (n=227), flesh foods 12% (n=39), legumes 5% (n=16), eggs 1% (n=2), vitamin A-rich fruits and vegetables 1% (n=4), and other fruits and vegetables 1% (n=3). Minimum Acceptable Diet Minimum acceptable diet (MAD) is met if breastfed children six to 24 months old meet the standards for both MDD and MMF. For non-breastfed children, they must have received two milk feedings. MMF is then calculated based on six food groups instead of seven, to eliminate the double counting of the milk. Children meeting the standards for both MDD and MMF are included in the total. Of children ages six to 23 months in Pariang, 3% (n=8) met the requirements for a minimum acceptable diet. The MAD was low because few children consumed diverse food, despite more than half (57%) of the
48 42 respondents with ages of 23 and some weeks were not recognized by inform, so it skipped the question on the number of times a child was breastfed the previous day, and gender data is missing for 3 children. The denominator is 287.
28%
19%
29%24%
57%
43%
0%
10%
20%
30%
40%
50%
60%
Meet MMF Do not meet MMF
% o
f ch
ildre
n 6
-<2
4 m
on
ths
MMF
Minimum Meal Frequency
Male
Female
Total

Page 68 of 114
children consuming the required MMF49. This low percentage was due to the unavailability of some food groups in the community, as revealed in the FGDs.
Consumption of iron-rich or iron-fortified foods Iron is an important micronutrient because its deficiency adversely affects the cognitive performance, behavior and physical growth of infants, preschool, and school-aged children. Iron deficiency can affect immune status and morbidity from infections, as well as the use of energy sources by muscles and thus physical capacity and work performance for all age groups. For this indicator, consumption of iron refers to those children who consumed flesh food, fish, or leafy green vegetables. Some examples of iron-fortified foods might be Plumpy’Nut or Plumpy’Sup.
In Pariang, of the children ages six to less than 24 months surveyed, 15% consumed iron rich food the previous day. The survey revealed that the percentage that consumed iron rich food was the same for both male and female children.
Figure 25: Consumption of Iron-rich or Iron -fortified foods
Children who slept under a Long Lasting Insecticidal Net the previous night50 This question was posed to caregivers of children under 24 months old in Pariang. Of those children, 80% slept under a long lasting insecticide treated net (LLITN); approximately the same percentage of males and females slept under an LLITN.
49 Calculation of MAD was done without data for children receiving non breastmilk, because data was missing. There were no children 6-less than 24 months who were not breastfed. 50 LLITN data for children six to less than 24 months of age was not included.
8%
40%
8%
45%
15%
85%
0%
20%
40%
60%
80%
100%
Consumed Not Consumed% o
f ch
ildre
n 6
-<2
4 m
on
ths
Iron-rich foods
Consumption of Iron-rich foods
Male
Female
Total

Page 69 of 114
Figure 26: LLITN Usage
Mothers who received IYCF messages in the past year The survey revealed that 88.2% of the mothers surveyed received IYCF messages in the previous year. More than half (51%) of the mothers reported that they had received IYCF messages from friends or family members. Thirty-five percent and 20% received them from health facilities and CNVs/LMs, respectively.
Figure 27: Sources of IYCF messages
4.3 Anthropometric Results A SMART survey carried out by CARE in May 2017 was the source of anthropometric data for this endline assessment51. The report revealed GAM prevalence at 24.2%, using WFH z-scores. The 24.2% GAM prevalence are considered very high by WHO standards, surpassing the 15% emergency threshold52. Severe acute malnutrition (SAM) was at 6.1% using WFH z-scores which is also extremely high. Also, 24.5% of children surveyed were underweight and 13.5% were stunted. Children 6-59 months old were surveyed (see Appendix C).
51 CARE, May 2017, SMART nutritional anthropometric survey. 52 WHO, 2003, “The Management of Nutrition in Major Emergencies.”
26%
54%
80%
6% 14% 20%
0%
20%
40%
60%
80%
100%
0-5 6 to 23 Total
% o
f ch
ildre
n L
ess
than
24
m
on
ths
Usage of LLITN
Usage of LLITN
Yes
No
35%
8%
51%
0%
20%
6%
0% 10% 20% 30% 40% 50% 60%
Health Facility
Samaritan's Purse IYCF staff/activities
Family/Friend
Radio/TV
Community Volunteer/ Lead mothers
Community Leader
% of mothers/care takersSou
rce
of
IYC
F M
essa
ges
Source of IYCF messages

Page 70 of 114
4.4 Nutrition Indicator Table Figure 8: Nutrition Indicators
Objective: To reduce nutrition-related morbidity and mortality through the promotion of IYCF practices, and
behavior change services.
Sub-Sector Indicator Results Targets Data Source
2.1: Infant and Young Child Feeding and Behavior Change
Baseline 2016
Endline/ Baseline2017(current)
2016 2017
2.1.1: Percentage of infants 0-<6 months of age who are exclusively breastfed
89% 76% 95% 95%53 IYCF Survey
2.1.2: Number and percentage of children 6-<24 months of age who receive foods daily from 4 or more groups (to achieve minimum dietary diversity)
2% 3.50% 10% 10% IYCF Survey
2.1.3: Number of people receiving behavior change interventions by sex and age
0 LM =(50 females)54 Neighbors=(2272)55 Females: 1757 Males: 515
900 900 Monthly reports
2.1.4: Percentage of children aged 6-59 months with Severe Acute Malnutrition (weight-for-height <-3 z-scores, nutritional edema, or MUAC<11.5 cm)
4.2% 56 [2.6 - 6.7 95% C.I]
6.1%57 (4.5-8.2 95% C.I)
<1.5% <1.5% CARE SMART Survey
2.1.5: Percentage of children aged 6-59 months with Global Acute Malnutrition (WFH <-2 Z score
19.5% [15.2 - 24.7 95% C.I]
24.2% (20.2-28.7 95% C.I)
<15% <15% CARE SMART Survey
53 These are approximations of increase but based on prevalence rates used to determine the sample size. 54 This is the number of Lead mothers trained by the project to form mother support groups. 55 This is the number of people who received IYCF messages through the mother support groups facilitated by lead mothers 56 Anthropometric results taken from CARE SMART Survey Pariang County, May 2016 57 Anthropometric results taken from CARE SMART Survey Pariang County, May 2017

Page 71 of 114
and/or MUAC <12.5cm and/or nutritional edema) 2.1.6: Percentage of children aged 6-59 months who are underweight (weight-for-age <-2 z-scores)
17.3% [13.2 - 22.3 95% C.I.]
24.5% (20.2-29.3 95% C.I)
<10% <10% CARE & SP SMART Surveys
2.1.7: Percentage of children aged 6-59 months who are stunted (height-for-age <-2 z-scores)
12.4% [8.5 - 17.8 95% C.I.]
13.5% (10.3 - 17.6 95% C.I)
<30% <30% CARE & SP SMART Surveys
2.1.8: Percentage of children 0-<24 months who slept under a Long Lasting Insecticidal Net the previous night
64%58 80%59 64% 64%60 IYCF Survey
2.1.9: Number of Long Lasting Insecticidal Nets distributed
0 N/A N/A N/A Monthly reports
2.2: Management of Severe Acute Malnutrition
2.2.1: Number of health care providers and volunteers trained in the prevention and management of SAM, disaggregated by sex and age*
0 Males=6 Females=54 Total=60
30 30 Monthly reports
2.2.2: Number of sites established/rehabilitated for inpatient and outpatient care
0 6 6 6 Monthly Reports
2.2.3: Number of people treated for SAM, disaggregated by sex and age*
0 Males=97 Females =120 Total=217
385 385 Monthly Reports
2.2.4: Rates of admission, default, death, cure, relapse, nonresponse-transfer, and length of stay.
0 0 Cure: >75% Default:<15% Non response: <10% Death rate: <3%
Cure: >75% Default:<15% Non response: <10% Deasth rate: <3%
Monthly Reports
58 Only for children between 0-<6 months available in Pariang 59 LLITNs were distributed by CARE in health facility to pregnant women, and figure is for children under six months based on the baseline figure 60 No change expected as this is not an activity that will be happening in Pariang

Page 72 of 114
5. Discussion
5.1 Pariang The survey results indicated a 13% reduction in the percentage of children under six months who were
exclusively breastfed, compared to the 2016 baseline. Focus group discussions revealed that mothers
attributed reduced duration of exclusive breastfeeding to the perception that they did not have sufficient
milk for their children, especially with the depletion of food stocks, increased prices of food items, and
the accompanying stress and deprivation from pronounced food insecurity. One of the CNVs said, “I will
breastfeed my child up to four months because I don't have enough breastmilk for my child, though I
wished to breastfeed him up to six months.” Early initiation of breastfeeding increased by 1.5%, which is
insignificant at a 95% confidence level.
Most of the children surveyed (97%) had a very low MDD, due to a lack of diverse food types available in
the communities. The most common food consumed in Pariang was walwal61 and akob62. Most of the
households surveyed were from the rural areas with limited access to markets where they might find
other food groups. The MDD is expected to worsen during the dry season when the animals will be driven
to distant areas in search of water and pastures, and children will have limited access to dairy and be
entirely fed on grains and wild fruits. The percentage of children who met the required MDD increased by
1.5% compared to the 2016 baseline. Likewise, the MMF and MAD increased by 12% and 2%, respectively,
from 2016 baseline figures. The percentage of children consuming iron-rich foods increased by 3% at a
95% confidence level. The low score of consumption of iron-rich foods was mainly due to the cultural
beliefs of pastoral communities, who keep animals as assets/wealth and for marriage purposes, rather
than for consumption; nonetheless meat is the main and most available source of iron in the communities.
Compared to the SMART survey conducted by CARE in May 2017, the acute malnutrition rate in Pariang has increased; the results indicate that GAM rates are at a critical level according to WHO standards. Global acute malnutrition rates were reported at 24.2% (20.2-28.7 95% C.I) and SAM rates at 6.1% (4.5-8.2 95% C.I). There was high morbidity mainly caused by cough, diarrhea and fever, with 63% of the children surveyed having experienced at least one sickness in the past two weeks.63 There were poor health-seeking behaviors among the mothers, where mothers did not seek early treatment for their sick children: 57% of the children who suffered illnesses were not taken to a health facility.64 High food insecurity caused by poor harvests and the interrupted flow of goods from Juba due to poor roads and insecurity along the highways, along with poor IYCF practices, are possible causes of malnutrition in the area. One LM reported the cause of malnutrition to be the carelessness of mothers/caregivers “Some mothers leave their children at home without preparing food and go to garden or market.”
The project did not distribute mosquito nets, but educated mothers on the importance of using LLITNs. These are distributed in health facilities supported by CARE, to pregnant women who attend Antenatal Care (ANC). The number of children under six months using LLITNs was 80%, a 15% increase from baseline figures. The survey showed that 80% of children under 24 months were using LLITNs.
61 Walwal is a local food made from a mixture of grains (sorghum or maize) and milk 62 Akob is a local food made from maize or sorghum which are transformed to a crystal-like shape and consumed with any dish. 63 CARE SMART Survey May 2017 64 CARE SMART Survey May 2017

Page 73 of 114
6. Recommendations Pariang Malnutrition rates have increased compared to the baseline. Therefore, it is recommended that immediate emergency programs such as the Blanket Supplementary Feeding Program (BSFP), Targeted Supplementary Feeding Program (TSFP), Outpatient Therapeutic Programs (OTP) and Stabilization Centers (SC) coverage be scaled up to address the pressing problem of malnutrition and high SAM rates in Pariang. Because of substandard IYCF practices, IYCF Infant and young child feeding programs should be expanded in the future so that more mothers/caregivers may be reached with IYCF messages, not just targeting a few payams in the county. The community outreach approach is an effective approach because most of the mothers/caregivers do not have access to health facilities.
Integrating nutrition activities with food security activities, such as distributing vegetable seeds to mothers with malnourished children and giving them basic training on agronomic practices, will help alleviate malnutrition in children under five since qualitative interviews showed that lack of access to the right quantity and diversity of foods was a notable cause of poor feeding practices for children.

Page 74 of 114
Chapter 4 Conclusion The findings from the baseline survey unveiled the achievements of the project being increase in the percentage of children 6 to less than 24 months who consume at least for four food groups. It also showed the lessons learned for future programing in the same area. Additionally, the percentage of children 0 to 23 months who slept under a Long Lasting Insecticidal Net the previous night has increased to 80% from 64% in the baseline. The political and economic situation of South Sudan and, in particular, Pariang, changed from the time the project started to the time the project ended. The findings indicate that malnutrition increased with SAM and GAM rates becoming extremely high over the span of the project. Rehabilitation of children with SAM and MAM is critical and is the most acute need since SAM, especially, carries high mortality risks with it for children under five. This is alarming and calls for continuity of programing and urgent multi-sectoral responses from more nutrition and other sectoral partners like WASH, health and FSL in the county. The increase has been mainly attributed to poor IYCF practices by mothers/caregivers and to the high food insecurity caused by low harvests, limited access to markets and high market prices for food items which became more pronounced from the previous year. When mothers/caregivers are able to practice the IYCF messages they receive from various sources, diversify the crops they grow (especially vegetables), and increase the production of their farm lands instead of relying on food aid, malnutrition will reduce in Pariang.

Page 75 of 114
Appendices
Appendix A: Water, Sanitation and Hygiene A.1 Sample Frame
Payam Boma Planned Actual
NYIEL
Nyokrial 30 19
Akotweng
Kong
Yar
Aloch 30 35
Kumagon 30 30
Nyiel
Jamjang
Arush 30 26
Mankuo 30 48
Awuoch
Jamjang 30 30
Chonganok
Alel
Labany
Pakuzuom
Biu
Bal
Akot
Lele
Aliap
Tur
Burdeng
Miac
Biu
Gumriak
Alual
Akok 30 30
Panpeth
Ngabule
Nyokjak
Gumriak
Alel
Panyang
Biem 30 27
Wungok
Tajiel
Jou
Thiejonga
Panyang 30 44
Nyanaluel
Wunkur
Jokabar
Liing
Pathiai
Wunkur
Yida Nyarweng 30 25
Panthur

Page 76 of 114
Biem 30 30
Wungok
Yida 60 69
Pakuem
Jou East
Panrieng
Abuon 30 30
Waukok 30 38
Wunliit 30 48
Managuer 30 24
Guengalath 30 22
Aliiny
Athony 30 19
Rushuk
Bongki
Alilang 30 21
Kajago
Dar-kuach
Gokawel
Wunkur
Total 600 615
Key
Randomly selected and data collection done
Inaccessible either due to heavy rains or insecurity
Not Randomly selected

Page 77 of 114
Payam Boma Village planned actual
Dablual Dablual Buor 26 26
Pulbar Pulbar 26 26
Buor Nhialnhiar 26 26
Jaguar Chuok Jaguar 26 26
Madol 1 Dhorgapni Dhorgapni 26 26
Cotchar Pulnor 26 26
Zorgapni Rotngech 26 26
Chotchar Halle1 26 26
Chotchar Halle2 26 26
Banjien Banjien 26 26
Cotchar Padeah 26 26
Titway Kuerhok 26 26
Madol2 Gak Lingier 26 26
Laong Kuertut 26 26
Gezere Gezere 26 26
Malkuer Chotlual Kechbol 26 26
Yat Kechkan 26 26
Yat Pipiline 26 26
Mirnyal Kak Buot 26 26
Thorlek Nyang 26 26
Rierie Rierie 26 26
Pabuong Zzorthier Wangkhan 26 26
Rubkuai Boul Rubkuai 26 26
Thaker Thaker Chidar 26 26
Gaprik Kuok 26 26
Kuok Pantot 26 26
Tharjiathbor Lian Tharjiathbor 26 26
Tutnyang Gear Gear 26 26
Thoryiel Thoryiel 26 26
Dhorjak Tuoy 26 26
780
key
randomly selected villages

Page 78 of 114
A.2 Household Questionnaire
OFDA WaSH Questionaire Survey ID#:
GEOGRAPHIC LOCATION
State: County: Cluster No:
Payam: Boma: Village:
PERSONNEL AND TIMING OF SURVEY
Date of interview: Season
(circle
current
season):
Dry Season 1
Interviewer: Rainy Season 2
Supervisor:
INTRODUCTION AND CONSENT
GREETINGS/INTRODUCTION: Good morning, my name is
________________________________ and I work for Samaritan’s Purse. We are conducting a
survey and we would like you to participate. We want to ask you some questions about you and your
household. SP project teams will take into consideration the results of the surveys for the design,
planning and implementation of our activities in this area.
(INSTRUCTIONS: The primary respondent should be the wife or mother in the household. If this
respondent is not present or does not exist in this household, any adult (15 years and above), who can
provide information on the household should be interviewed.)
CONSENT: This interview will take 15-20 minutes. I will not record your name and your answers will
remain confidential. Do you agree to participate? YES / NO
CIRCLE THE RESPONDENTS ANSWER: 1
QUESTIONS RESPONSES Go to
Section 1. Demographic
1.01 Sex of respondent (Observe do
not ask question)
Male 1
Female 2
1.02 What is the residence status of
the head of household?
Host 1 1.03
Returnee 2
Nomad 3 1.04
IDP 4
Refugee 5
1.03 Are you currently hosting any
people who are not usually
members of this household and
who share resources, such as
food and water, with you? This
could include friends or
extended family
Yes 1
No 0
1.04 How many people live in this
household (by age group),
including yourself?
Male Female
1.4.1. Adults > 60 years
1.4.2 Adults 16 - 60 years

Page 79 of 114
1.4.3. Children 5 - 15
years
1.4.4. Children < 5 years
1.4.5. total ( members)
1.05 Are there any pregnant or
lactating women in your
household
Yes 1
If yes how many
No 0
1.06 Are there any persons with a
disability living in this household
Yes 1
If yes how many
No 0
QUESTIONS RESPONSES Go to
Section 2: Water
2.01 What is the primary (main)
source of drinking water for the
household? (Select only one
response)
tap-stand/ water yard 1
Protected shallow well 2
Hafir 3
Swamp/ Stagnant water 4
Water trucking 5
Hand pump 6
Unprotect shallow well 7
River or stream 8
Rain water collection 9
Bottled water 10
Other, ( Specify) 11
2.02 In the last 7 days, did you use
any other source(s) of drinking
water apart from the one
mentioned above?
Yes 1 2.03
No 0 2.04
I don’t know 888
2.03 What other source(s) of
drinking water did you use?
Select all that apply but don’t
read the choices to the
respondent. Do not select same
source as mentioned in Qu 2.01
2.3.1 Tap-stand/ water yard 1
2.3.2 Protected shallow well 2
2.3.3 Hafir 3
2.3.4 Swamp/ Stagnant water 4
2.3.5 Water trucking 5
2.3.6 Hand pump 6
2.3.7 Unprotect shallow well 7
2.3.8 River or stream 8
2.3.9 Rain water collection 9
2.3.10 Bottled water 10
2.3.11 Other, ( Specify) 11
2.04 In the last 7 days, did you use a
different source for drinking
water than water for washing
or cooking?
Yes 1
No 0
I don’t know 888

Page 80 of 114
2.05 Do you collect water for your
household?
Yes 1 2.06
No 0 2.07
2.06 If yes, did you ever feel unsafe
when collecting water?
Yes 1
No 0
refused to answer 777
2.07 How long does it take to go to
your primary water source,
collect water, and come back to
the household (in minutes)?
Primary
source
(minutes):
0-15 minutes 1
15-30 minutes 2
>30 minutes 3
2.08 How many containers do you
have to collect water for
drinking, cooking and personal
hygiene?
Number of Containers:
( ask to see the containers to verify)
2.09 How much drinking, cooking,
and personal hygiene water did
you collect yesterday? (Ask
to see all of their water collection
containers)
Container Size (L) # Times
Filled/Da
y
Total
(L)
(size *
times
of day)
1
2
3
4
5
Total (Liters)
Litres per day per person Total (Liters)/ Total number of
household members ( Qu 1.04)
if <15
2.10
2.10 If 15L per person or lower:
Based on the information you
gave me, it seems like the water
consumption of your household
is low. What do you think is the
main reason? (Select only one
but don’t read the choices to
the respondent)
There is not enough water at water
source
1
We don’t have enough containers to
either store or carry water
2
The water is not good (taste, smell,
quality)
3
The water source is too far 4
The waiting time is too long 5
We don’t feel safe going to the water
point
6
We feel we have enough water 7
Other, ( Specify) 8
Dont know 888
2.11 Do you or someone else in the
household treat your primary
(main) source of drinking
water?
Yes 1 2.12
No 0 2.13
2.12 If yes, what method(s) do you
use?
Select all that apply but don’t
Yes No 3.01
2.12.1 Boiling 1 0
2.12.2 Filter Cloth 1 0

Page 81 of 114
read the choices to the
respondent
2.12.3 Other type of filter 1 0
2.12.4 Chlorine tablets/
Aqua tabs
1 0
2.12.5 Pur (flocculent) 1 0
2.12.6 Sharp ( alum) 1 0
2.12.7 Moringa seeds 1 0
2.12.8 Three pot system 1 0
2.12.9 Sun exposure 1 0
2.12.10 Other (please
specify)
1 0
2.13 If no, why don’t you treat the
water?
There is no need as I feel the water I
collect is clean and does not need to
be treated
1
I dont have materials for water
purification/treatment
2
I don't know any treatment methods 3
I don't have the time 4
Other, ( Specify) 5
Dont know 888
QUESTIONS RESPONSES Go to
Section 3: Sanitation
3.01 Does your household have
access to a functional latrine?
Yes 1
No 0 3.06
3.02 What type of latrine does your
Household have access to?
(Only choose one. If HH has
access to more than one,
choose the closest).
Household latrine 1 3.03
Communal Latrine 2 3.04
Institutional latrine 3
3.03 Do you share the latrine with
other Households? If so how
many households share the
latrine?
No 0
Yes 1
If yes, Number of
Households
3.04 Do you use the latrine? Refuse to answer 777 3.07
Yes 1
No 0
3.05 If not, What is the main reason
why you don’t use a latrine?
refused to answer 777
Too far 1
Too Dirty 2
Lack of privacy 3
It is not safe 4
I prefere other options 5
Other specify 6
3.06 Yes 1
No 0
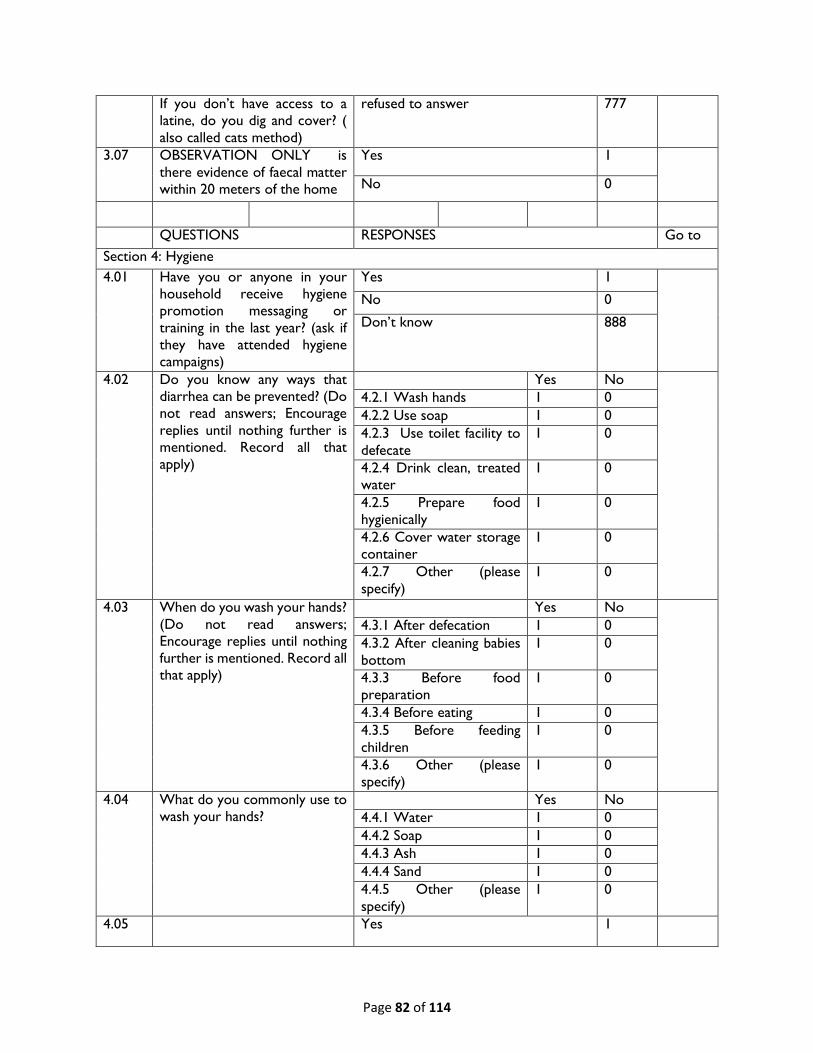
Page 82 of 114
If you don’t have access to a
latine, do you dig and cover? (
also called cats method)
refused to answer 777
3.07 OBSERVATION ONLY is
there evidence of faecal matter
within 20 meters of the home
Yes 1
No 0
QUESTIONS RESPONSES Go to
Section 4: Hygiene
4.01 Have you or anyone in your
household receive hygiene
promotion messaging or
training in the last year? (ask if
they have attended hygiene
campaigns)
Yes 1
No 0
Don’t know 888
4.02 Do you know any ways that
diarrhea can be prevented? (Do
not read answers; Encourage
replies until nothing further is
mentioned. Record all that
apply)
Yes No
4.2.1 Wash hands 1 0
4.2.2 Use soap 1 0
4.2.3 Use toilet facility to
defecate
1 0
4.2.4 Drink clean, treated
water
1 0
4.2.5 Prepare food
hygienically
1 0
4.2.6 Cover water storage
container
1 0
4.2.7 Other (please
specify)
1 0
4.03 When do you wash your hands?
(Do not read answers;
Encourage replies until nothing
further is mentioned. Record all
that apply)
Yes No
4.3.1 After defecation 1 0
4.3.2 After cleaning babies
bottom
1 0
4.3.3 Before food
preparation
1 0
4.3.4 Before eating 1 0
4.3.5 Before feeding
children
1 0
4.3.6 Other (please
specify)
1 0
4.04 What do you commonly use to
wash your hands?
Yes No
4.4.1 Water 1 0
4.4.2 Soap 1 0
4.4.3 Ash 1 0
4.4.4 Sand 1 0
4.4.5 Other (please
specify)
1 0
4.05 Yes 1

Page 83 of 114
Do you have soap in your
household? (Ask to see soap
and only select yes if the
respondent can show the soap
within 1 min)
No 0
4.06 If no, why don’t you have soap? Yes No
4.6.1 It is unavailable at the
local market
1 0
4.6.2 We cannot afford it 1 0
4.6.3 We prefer a
substitute
1 0
4.6.4 We ran out of soap 1 0
4.6.5 We are waiting for
the next distribution
1 0
4.6.6 Soap is not necessary 1 0
4.6.7 The market is too far 1 0
4.6.8 Other (please
specify)
1 0
4.07 Did any child less than 5 years
of age in the household have
diarrhea in the past two weeks?
(Diarrhea: 3 or more liquid
stools in 24 hours)
No 0 END
Yes 1
If Yes, how many children?
FINAL REMARKS: Thank you for having taken the time to answer these questions, again, your answers
will remain confidential. I can assure you that this will be helpful for us and taken into account in our
activities for this area.
A.2 Focus Group Discussion Question Guide

Page 84 of 114
Hello! My name is _________________. I will speak with you on behalf of Samaritan’s Purse. Today’s discussion
will be about your experiences, thoughts and knowledge with regards to water, sanitation and hygiene (WASH). The
organization is always aiming to improve services to your community as well as enhance the community’s knowledge
on water, sanitation and hygiene to ensure health and protection against avoidable sicknesses. In order to do that,
they would like to know about what you have learned and now apply to practices concerning WASH.
Consent: The discussion will take 60-90 mins. I will not record your names and your answers will remain
confidential. The information that is collected may also be shared with other agencies but will remain anonymous.
Do you agree to participate? Yes/ No?
Get everyone’s permission before starting
_______ males ______ females
Date: ___________________
Payam: __________________Boma:____________________Village:___________________
Facilitator:________________
Note Taker:_______________
Note: Do not read text in parenthesis ( ) out loud but use as prompts to further encourage sharing of information.
Outcome 1: Water Supply/Infrastructure and Water Quality [To be conducted with WMC]
Opening Question: Tell me about water in the community.
(Where are people getting water in your community? What are the waters sources available? What is the
quality and distance to these sources?)
1. How does having a safe and clean water source impact water usage practices and health?
2. Who in the household is responsible for collecting water? (Men, women, girls, boys?)
3. What factors prevent people from collecting clean water, even when it is available?
4. Under what conditions do community members find it necessary to collect surface water?
5. What is the impact of collecting surface water on you and your family?
Outcome 2: Sanitation Infrastructure [To be conducted with WMC and HHC]
Opening Question: Tell me about the latrines in your community.
1. What does the community think about open defecation?
2. Is there any link between open defecation and health?
3. Who in the community has access to a latrine? (men, women, girls, boys)
4. What are the barriers that prevent people from using a latrine?
5. What are the things that encourage people to use a latrine?
6. Does the community build latrines themselves? If not, what prevents them from building latrines?
Outcome 3: Hygiene Promotion [To be conducted with HHC)
Opening question: What hygiene practices are carried out in this community?
1. What is the impact of both good and bad hygiene practices in your household?
2. Has there been any change in hygiene practices such as hand washing, bathing, in the last year? If
yes, what are these changes?
3. What are the barriers that prevent people from practicing good hygiene? (e.g. no soap, don’t
know how, nowhere to bath etc.)
4. What are the things that encourage the community to practice good hygiene?
Outcome 4: Waste Management/Environmental Health [To be conducted with WMC and
HHC]
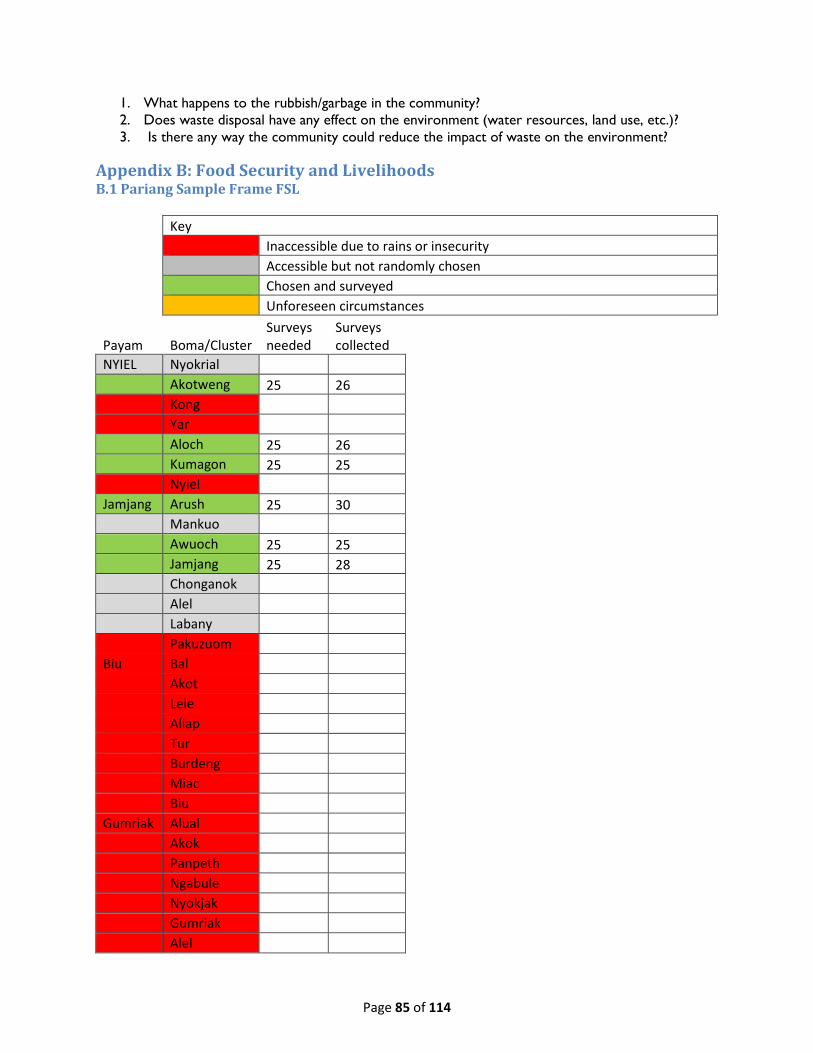
Page 85 of 114
1. What happens to the rubbish/garbage in the community?
2. Does waste disposal have any effect on the environment (water resources, land use, etc.)?
3. Is there any way the community could reduce the impact of waste on the environment?
Appendix B: Food Security and Livelihoods B.1 Pariang Sample Frame FSL
Key
Inaccessible due to rains or insecurity
Accessible but not randomly chosen
Chosen and surveyed
Unforeseen circumstances
Payam Boma/Cluster Surveys needed
Surveys collected
NYIEL Nyokrial
Akotweng 25 26
Kong
Yar
Aloch 25 26
Kumagon 25 25
Nyiel
Jamjang Arush 25 30
Mankuo
Awuoch 25 25
Jamjang 25 28
Chonganok
Alel
Labany
Pakuzuom
Biu Bal
Akot
Lele
Aliap
Tur
Burdeng
Miac
Biu
Gumriak Alual
Akok
Panpeth
Ngabule
Nyokjak
Gumriak
Alel

Page 86 of 114
Panyang Biem Wungok Tajiel 25 24 Jou Thiejonga Panyang 25 27 Nyanaluel Wunkur Jokabar Liing Pathiai 25 25 Wunkur Yida Nyarweng 25 26 Panthur Biem 25 40 Wungok 25 26 Yida Pakuem Jou East 25 26 Panrieng Abuon 2 Waukok 25 27 Wunliit 25 26 Managuer 25 35 Guengalath 25 27 Aliiny Athony 25 25 Rushuk
Bongki 25 21
*Many people had moved to other locations to farm.
Alilang 25 26 Kaiago Dar-kuach Gokawel Wunkur
Total 500 543

Page 87 of 114
B.2 Mayendit Sample Frame FSL
Cluster Selected No of clusters Village Population
1 1 Dhorchak 284
2 Thoukouk 186
2 3 Loang 95
4 Panthiang 118
5 Goul 88
6 Koat 66
7 Nyamuon 76
3 to 4 8 Hele 697
9 Padeah 230
5 10 Rotngech 266
11 Chotchar 187
12 Dhorkewni 152
6 13 Pulnor 267
14 Banejiek 359
7 15 Dhorgapni 129
16 Nyaljor 220
8 17 Kechkan 299
18 Pipeline 283
9 19 Dhorgoak 225
20 Nyaziaw 150
21 Yat 264
10 22 Kechbol 385
23 Thokpan Yat 73
11 24 Banejiek 324
12 25 Dongol 292
26 Kuiyrial 224
27 Wangkhan 149
13 28 Gezere 156
29 Nyakey 122
30 Wangkhan 149
31 Kulony 96
14 32 Kuerhok 146
33 Dhorkan 179
34 Malekni 200
15 35 Kuluot 420
16 36 Lingier 195

Page 88 of 114
B.3 FSL Survey Questionnaire
OFDA FSL Endline Questionnaire
Survey ID#:
GEOGRAPHIC LOCATION
State: County: Cluster No:
Payam: Boma: Village:
PERSONNEL AND TIMING OF SURVEY
Date of interview: Season (circle current season):
Dry Season 1
Interviewer: Short Rains 2
Supervisor: Long Rains 3
INTRODUCTION AND CONSENT
GREETINGS/INTRODUCTION: Good morning, my name is ________________________________ and I work for Samaritan’s Purse (SP). We are conducting a survey and we would like you to participate. We want to ask you some questions about you and your household. SP project teams will take into consideration the results of the surveys to determine what has been accomplished in the area. INSTRUCTIONS: The respondent should be the primary farmer or the head of the household. If this respondent is not present, any adult (15 years and above), who can provide information on the household can be interviewed.
CONSENT: This interview will take 15-20 minutes. I will not record your name and your answers will remain confidential. The data that is collected may also be shared with other agencies but will remain anonymous. Do you agree to participate? YES / NO
CIRCLE THE RESPONDENTS ANSWER: 1
Qu # QUESTIONS RESPONSES Go to
Section 1. Demographic
1.01 Sex of respondent (Observe do not ask question)
Male 1
Female 2
1.02 Are you the household head?
Yes 1 1.04
No 0 1.03
1.03 If no, is the household head male or female?
Male 1
Female 2
1.04 How many people live in this household (by age group), including yourself?
1.4.1. Adults: (16 years or older)
1.4.2. Children 5 - 15 years
1.4.3. Children less than 5 years
1.05 Are you internally displaced because of the current crisis?
Yes - IDP 1
No -Host Community Member 2

Page 89 of 114
Qu # QUESTIONS RESPONSES Go to
Section 2: Food Consumption
2.01 On average, how many meals did household members 5 years and above in your household eat each day during the last seven days?
0 meals 0
1 meal 1
2 meals 2
3 meals 3
4 or more meals 4
2.02 On average, how many meals did the children under the age of 5 years in your household eat each day during the last seven days?
0 meals 0
1 meal 1
2 meals 2
3 meals 3
4 or more meals 4
2.03 Thinking about the past 7 days, what was your main source of food for the household? (Select one answer)
Food aid ( GFD) 1
Purchased food ( Market) 2
Borrowed food 3
Exchanged labor for food 4
Produced own food 5
Hunting/fishing/gathering 6
Gift from friend/family 7
Does not know 888
2.04 Level of food Consumption. Food Type:
During the past 7 days, how many days did you eat the following foods? (Enter 0-7)
What was the main source of food in the last 7 days? (identify each row according to the key below)
2.4.1 Sorghum
2.4.2 Maize
2.4.3 Cassava
2.4.4 Other cereals and tubers (root crops, potatoes, millet, rice, bread, wheat.)
2.4.5 Pulses (groundnuts, legumes, beans, lentils, peas, sesame)
2.4.6 Vegetables, including indigenous vegetables and leaves
2.4.7 Fruits
2.4.8 Meat and Poultry, including bush meat

Page 90 of 114
2.4.9 Eggs
2.4.10 Fish
2.4.11 Milk, cheese, yogurt
2.4.12 Sugar, honey, sweets
2.4.13 Oil, fats
2.4.14 Condiments, Tea, coffee, salt
1 = Food Aid ( GFD) 2 = Purchased food ( market) 3 = Borrowed Food 4 = Work for food /Exchanged labor 5 = Produce own food 6 = Hunting/ Fishing/ Gathering 7 = Gift from friend/ family 888 = Does not know
2.05 Consumption Coping Strategy: In the past 7 days, were there times when you did not have enough food or money to buy food? Yes or No? If Yes, indicate the number of days out of 7 below
Behavior Yes No Frequency ( no. of days 0 -7)
2.5.1 Rely on less preferred and less expensive foods?
1 0
2.5.2 Borrow food, or rely on help from a friend or relative?
1 0
2.5.3 Purchase food on credit? 1 0
2.5.4 Gather wild food, hunt, or harvest immature crops?
1 0
2.5.5 Consume seed stock held for next season?
1 0
2.5.6 Send household members to eat elsewhere?
1 0
2.5.7 Send household members to beg?
1 0
2.5.8 Limit portion size at mealtimes?
1 0
2.5.9 Restrict consumption by adults in order for small children to eat?
1 0
2.5.10 Feed working members of HH at the expense of non-working members?
1 0
2.5.11 Reduce number of meals eaten in a day?
1 0
2.5.12 Skip entire days without eating?
1 0
2.06 Were there months, in the past 12 months, in which you did not have enough food to meet your family’s needs?
Yes 1
No 0 3.01

Page 91 of 114
2.07 If yes, which months in the past year are when you did not have enough food to meet your family’s needs? This included any kind of food from any source, (own production, purchase, exchange, food aid, and borrowing). (Do not read options but select all that are mentioned. Use a seasonal calendar to help respondent remember the different months and probe to make sure they have thought about the entire 12 months)
Yes No
2.7.1 July 2016 1 0
2.7.2 June 2016 1 0
2.7.3 May 2016 1 0
2.7.4 April 2016 1 0
2.7.5 March 2016 1 0
2.7.6 February 2016 1 0
2.7.7 January 2016 1 0
2.7.8 December 2015 1 0
2.7.9 November 2015 1 0
2.7.10 October 2015 1 0
2.7.11 September 2015 1 0
2.7.12 August2015 1 0
Qu # QUESTIONS RESPONSES Go to
Section 3: Agricultural Production
3.01 Did you plant any staple crops during the last planting season?
Yes 1
No 0 3.05
3.02 In which month did you plant your staple crops?
Month:
3.03 In which month will you harvest your staple crops?
Month:
3.04 Which of these staple crops did you plant ?(Select that apply)
Yes No
3.4.1 Sorghum 1 0
3.4.2 Maize 1 0
3.4.3 Millet 1 0
3.4.4 Sesame 1 0
3.4.5 Cassava 1 0
3.4.6 Sweet Potatoes 1 0
3.4.7 Groundnuts 1 0
3.4.8 Other, ( specify) 1 0
3.05 Did you plant any vegetable seeds during the last planting season?
Yes 1
No 0 3.09
3.06 In which month did you plant your vegetable seeds?
Month:
3.07 In which month will you harvest your vegetables?
Month:

Page 92 of 114
3.08 Which of these vegetable seeds did you plant? (Select that apply)
Yes No
3.8.1 Amaranths 1 0
3.8.2 Tomatoes 1 0
3.8.3 Onions 1 0
3.8.4 Okra 1 0
3.8.5 Kale 1 0
3.8.6 Watermelon 1 0
3.8.7 Egg plant 1 0
3.8.8 Carrots 1 0
3.8.9 Collard 1 0
3.8.10 Other, ( specify): 1 0
3.09 How many feddans of land did you cultivate with the staple crops and vegetable seeds? ( if they don’t know get them to describe the area to get an estimate)
3.9.1. Feddans of land for staple crops:
3.9.2. Feddans of land for vegetables:
3.9.3. Total Feddans of land ( staple crops + vegetables)
3.10 What do you do with the food that you produce yourself (select all that apply)?
Yes No
3.10.1 Household consume own food produced
1 0
3.10.2 Give/ share food with neighbors
1 0
3.10.3 Store seeds for future harvests
1 0
3.10.4 Sell food for cash 1 0
3.10.5 Exchange 1 0
3.10.6 Other, ( specify): 1 0
3.11 Briefly describe the proportional piling of what you have selected in the question above. ( roughly what % of your food would go to each) this should add up to 100%
_________________%__________________________
_________________%__________________________
_________________%__________________________
Total : 100%
3.12 Do you use any preservation methods for food that you produce?
Yes 1 3.13
No 0 3.14
Does not know 888
3.13 What preservation methods do you use? (select all that apply)
Yes No
3.13.1 Fry 1 0
3.13.2 Dry 1 0

Page 93 of 114
3.13.3 Salt 1 0
3.13.4 Other, ( specify): 1 0
3.14 How long will your current stock of food produced from your own harvest last? (select one answer)
less than 1 week 1 END
1-< 2 weeks 2
2 weeks - < 1 month 3
1 month - < 2 months 4
2 - < 4 months 5
4 months - < 6 months 6
6 months or more 7
FINAL REMARKS: Thank you for having taken the time to answer these questions, again, your answers will remain confidential. I can assure you that this will be helpful for us and taken into account in our activities for this area.

Page 94 of 114
Appendix C: Nutrition C.1 Pariang Sample Frame - Nutrition
Payam Boma
Planned
HHs
Surveyed
HHs Mothers Children
Jamjang
Arush 54 47 47 49
Mankuo 54 48 51 61
Awuoch 27
Jamjang 54 56 57 70
Chonganok
Alel
Labany 27 22 22 22
Adiye 27 26 28 28
Pakuzuom
Yida
Nyarweng 27 22 22 26
Panthur 27 52 52 54
Biem 27 24 24 26
Wungok
Yida 27 63 64 73
Pakuem
Jou East
Aliny
Athony
Rushuk
Bongki
Alilang 54 54 54 64
Kajago
Dar-kuach
Gokawel
Wunkur
405 414 421 473
Key
Randomly Selected Not Randomly Selected Inaccessible either due to heavy rain or insecurity Affected by unforeseen rain
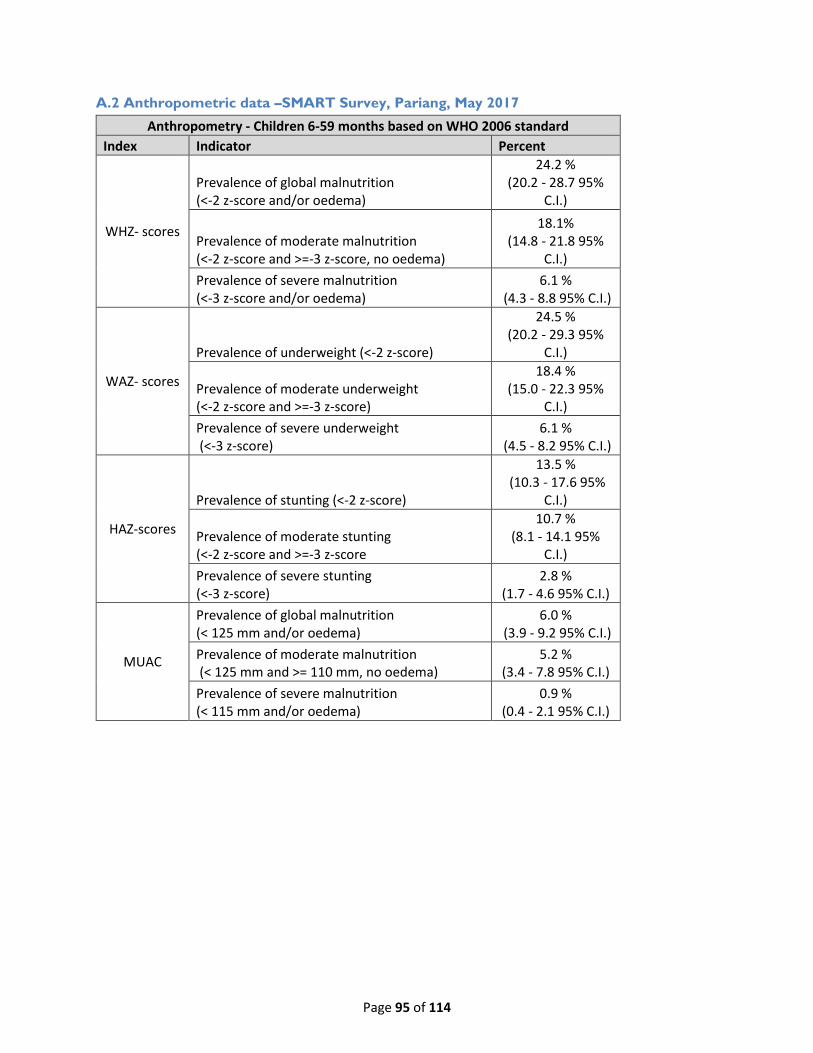
Page 95 of 114
A.2 Anthropometric data –SMART Survey, Pariang, May 2017
Anthropometry - Children 6-59 months based on WHO 2006 standard
Index Indicator Percent
WHZ- scores
Prevalence of global malnutrition (<-2 z-score and/or oedema)
24.2 % (20.2 - 28.7 95%
C.I.)
Prevalence of moderate malnutrition (<-2 z-score and >=-3 z-score, no oedema)
18.1% (14.8 - 21.8 95%
C.I.)
Prevalence of severe malnutrition (<-3 z-score and/or oedema)
6.1 % (4.3 - 8.8 95% C.I.)
WAZ- scores
Prevalence of underweight (<-2 z-score)
24.5 % (20.2 - 29.3 95%
C.I.)
Prevalence of moderate underweight (<-2 z-score and >=-3 z-score)
18.4 % (15.0 - 22.3 95%
C.I.)
Prevalence of severe underweight (<-3 z-score)
6.1 % (4.5 - 8.2 95% C.I.)
HAZ-scores
Prevalence of stunting (<-2 z-score)
13.5 % (10.3 - 17.6 95%
C.I.)
Prevalence of moderate stunting (<-2 z-score and >=-3 z-score
10.7 % (8.1 - 14.1 95%
C.I.)
Prevalence of severe stunting (<-3 z-score)
2.8 % (1.7 - 4.6 95% C.I.)
MUAC
Prevalence of global malnutrition (< 125 mm and/or oedema)
6.0 % (3.9 - 9.2 95% C.I.)
Prevalence of moderate malnutrition (< 125 mm and >= 110 mm, no oedema)
5.2 % (3.4 - 7.8 95% C.I.)
Prevalence of severe malnutrition (< 115 mm and/or oedema)
0.9 % (0.4 - 2.1 95% C.I.)

Page 96 of 114
A.3 Household Questionnaire
OFDA IYCF KAP End line Questionnaire
Survey ID#:
GEOGRAPHIC LOCATION
State: County: Cluster No:
Payam: Boma: Village:
PERSONNEL AND TIMING OF SURVEY
Date of interview: Season (circle
current
season):
Dry Season 1
Interviewer: Rainy Season 2
Supervisor:
INTRODUCTION AND CONSENT
GREETINGS/INTRODUCTION: Good morning, my name is
________________________________ and I work for Samaritan’s Purse. I am conducting a
survey and I would appreciate your participation. I would like to ask you about the health of your
children under the age of 2 years old. Samaritans Purse will take into consideration the results of the
survey for the design, planning and implementation of their activities in this area. I will need to
complete a survey for each and every one of your children who lives in the same household. You will
not be asked to take a survey for children who are not yours.
INSTRUCTIONS: The respondent should be mother or care giver of the children. If the mother/
caregiver is not present enquire when she will be able and return at a more convenient time. Then
proceed to the next household.
CONSENT: This interview will take 15-20 minutes. I will not record your name but i will record
your childrens names but all your answers will remain confidential. The data that is collected may also
be shared with other agencies but will remain anonymous. Do you agree to
participate? YES / NO
SUMMARY TABLE
INSTRUCTIONS FOR ENUMERATORS: Please complete the summary table below to ensure
that you are completing the correct questionnaire and collecting the ALL relevant information for
each child in the household depending on their age.
Age category of
Children
No of
Children
Questionnaire
1
Questionnaire 2 Anthropometri
c
Measurements
Children 0-5.99
months
N/A
Children 6 – 23.99
months
N/A
Children 24 – 59.99
Months
N/A N/A
Total Children in HH

Page 97 of 114
QUESTIONNAIRE 1: Children of 0 – 5.99 months
Household No: Child Survey No:
INSTRUCTIONS: The following questions should only asked if there is a child in the household
who is 0-5.99 months
CIRCLE THE RESPONDENTS ANSWER: 1
QUESTIONS RESPONSES Go to
What is the name of your
youngest child?(Refer to
this child throughout the
questionnaire when you
are prompted with
NAME)
1.01 Gender of Child Male 1
Female 2
1.02 What is the date of Birth
and/or age of NAME (in
months)? Ask to see the
birth certificate to verify.
If no birth certificate
present verify the age of
the child using an events
calendar.
Date of birth ( DD/MM/YY)
and/ or Age in Months
1.03 What was NAME fed in
the previous day? (don’t
read the answers but
circle all that mentioned)
Yes No
1.3.1 Breast Milk 1 0
1.3.2 Plain Water 1 0
1.3.3 Infant Formula 1 0
1.3.4 Juice or Juice drinks 1 0
1.3.5 Clear broth/ Soup 1 0
1.3.6 Thin Porridge 1 0
1.3.7 Yoghurt 1 0
1.3.8 Any other liquids Please list
below:
1 0
1.3.9 Other, ( Specify) 1 0
1.04 How long after birth of
NAME did you breastfeed
them for the first time?
Never 0
less than 1 hour 1
More than one hr but less than 24 hrs 2
More than one day / days 3

Page 98 of 114
1.05 Did NAME sleep under a
mosquito net (LLITN) last
night?
Yes 1
No 0
FINAL REMARKS: Thank you for having taken the time to answer these questions, again, your
answers will remain confidential. I can assure you that this will be helpful for us and taken into
account in our activities for this area.
QUESTIONNAIRE 2: Children of 6 – 23.99months
Household No: Child Survey No:
INSTRUCTIONS: The following questions should only asked if there is a child in the household
who is 6-23.99 months
CIRCLE THE RESPONDENTS ANSWER: 1
QUESTIONS RESPONSES Go to
What is the name of your
child?(Refer to this child
throughout the
questionnaire when you
are prompted with
NAME)
2.01 Gender of Child Male 1
Female 2
2.02 What is the date of Birth
and/or age of NAME (in
months)? Ask to see the
birth certificate to verify.
If no birth certificate
present verify the age of
the child using an events
calendar.
Date of birth ( DD/MM/YY)
and/ or Age in Months
2.03 How many times was
NAME breastfed
yesterday during the day
or night?
One or more times 1 2.05
Not fed breastmilk 0
2.04 How many times did
NAME receive any
formula, animal milk,
powder milk, yogurt or
sour milk yesterday?
Number of times:

Page 99 of 114
2.05 How many times did
NAME eat solid, semi-
solid or soft foods other
than liquid yesterday
during the day?
Number of times:
2.06 I would like to ask you
about the liquids or foods
NAME had yesterday
during the day or at night.
Did NAME drink/eat: (
Read through the list and
circle all that apply)
Yes No
2.6.1 porridge, bread, rice,
noodles, or other foods made
from grains
1 0
2.6.2 pumpkin, carrots, squash, or
sweet potatoes that are yellow or
orange inside
1 0
2.6.3 white potatoes, white yams,
manioc, cassava, or any other
foods made from roots
1 0
2.6.4 any dark green leafy
vegetables
1 0
2.6.5 ripe mangoes, ripe papayas,
bananas (or other local vitamin A-
rich foods)
1 0
2.6.6 any other fruits or
vegetables
1 0
2.6.7 liver, kidney, heart, or other
organ meats
1 0
2.6.8 any meat,e.g beef, pork,
lamb, goat, chicken, or duck
1 0
2.6.9 Eggs 1 0
2.6.10 fresh or dried fish, shellfish,
or seafood
1 0
2.6.11 any foods made from beans,
peas, lentils, nuts or seeds
1 0
2.6.12 cheese, yogurt, or other
milk products
1 0
2.6.13 any oil, fats, or butter, or
foods made with any of these
1 0
2.6.14 any sugary foods such as
chocolates, sweets, cakes, or
biscuits
1 0
2.6.15 condiments for flavor, such
as chilies, spices, herbs, or fish
powder
1 0
2.6.16 grubs, snails, or insects 1 0
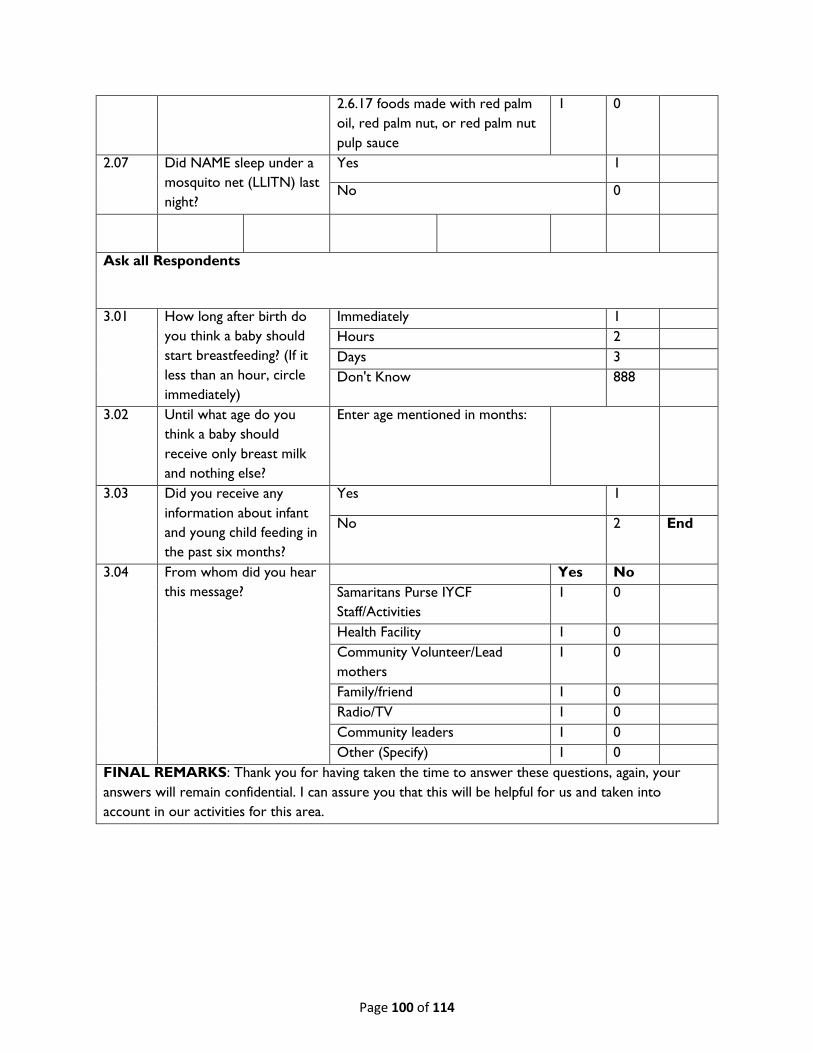
Page 100 of 114
2.6.17 foods made with red palm
oil, red palm nut, or red palm nut
pulp sauce
1 0
2.07 Did NAME sleep under a
mosquito net (LLITN) last
night?
Yes 1
No 0
Ask all Respondents
3.01 How long after birth do
you think a baby should
start breastfeeding? (If it
less than an hour, circle
immediately)
Immediately 1
Hours 2
Days 3
Don't Know 888
3.02 Until what age do you
think a baby should
receive only breast milk
and nothing else?
Enter age mentioned in months:
3.03 Did you receive any
information about infant
and young child feeding in
the past six months?
Yes 1
No 2 End
3.04 From whom did you hear
this message?
Yes No
Samaritans Purse IYCF
Staff/Activities
1 0
Health Facility 1 0
Community Volunteer/Lead
mothers
1 0
Family/friend 1 0
Radio/TV 1 0
Community leaders 1 0
Other (Specify) 1 0
FINAL REMARKS: Thank you for having taken the time to answer these questions, again, your
answers will remain confidential. I can assure you that this will be helpful for us and taken into
account in our activities for this area.

Page 101 of 114
A.4 Focused Group Discussion Question Guide
Hello! My name is _________________. I will speak with you on behalf of Samaritan’s Purse. Today’s
discussion will be about your experiences, thoughts and knowledge about Nutrition. Samaritan’s Purse is
responsible for nutrition services in Jamjang, Yida, and Aliiny. The organization is always aiming to improve
services to your community as well as enhance the community’s knowledge of nutrition to ensure health
and protection against avoidable sicknesses. In order to do that, they would like to know about what you
have learned and now apply to practices concerning nutrition.
Consent: The discussion will take 60-90 mins. I will not record your names and your answers will remain
confidential. The information that is collected may also be shared with other agencies but will remain
anonymous. Do you agree to participate? Yes/ No?
Get everyone’s permission before starting
_______ males ______ females
Date: ___________________
Payam: __________________Boma:____________________Village:___________________
Facilitator:________________
Note Taker:_______________
Note: Do not read text in parenthesis ( ) out loud but use as prompts to further encourage sharing of
information as required.
General
4. What do you think causes illness in your community for children under five? For mothers?
5. What do you think causes malnutrition in your community for children under five? For mothers?
6. What do you think should be done at the community level to address this malnutrition problem
among mothers and the children?
Breastfeeding
1. What type of food is mainly given to babies for the first time immediately after birth and what
are the reasons for giving the mentioned food?
2. What are the common feeding practices of children under six months in the community?
3. Is that what you prefer or want to feed your children under 6? (If different than the question
above (#2), why are they different?)
4. What do mothers in your community say about exclusive breastfeeding children under six
months old?
5. What do you worry about as a mother for your children and community with regards to
nutrition?
6. How have your child feeding/breastfeeding practices changed in the last year?
7. What foods do you think mothers should eat during pregnancy?

Page 102 of 114
8. What do you think are the consequences of not eating properly while pregnant?
Diet of children
1. What are the common feeding practices of children over six months in the community?
2. How do mothers in the community prefer to feed children from 6-23 months of age? 23 months
to five years?
3. What are the barriers that prevent mothers from feeding a child over six months in ways that
they would like?
4. What types of food are available in your community? Describe the main food groups (starches
protein, etc)?
A.1 Sample Frame Mayendi FSL
Payam Boma Village Planned Actaual
Madol 1 Chotchar Hele 1 18 18
Madol 1 Chotchar Hele 2 18 18
Madol 1 Dhorgapni Dhorgapni 18 18
Madol 1 Chotchar Banejiek 18 18
Madol 1 Chotchar Kulony 18 18
Madol 2 Bielthang Pipeline 18 18
Madol 2 Dhorthier Malekni 18 18
Madol 2 Loang Lingier 18 18
Madol1 Chotchar Rotngech 18 18
Malkuer Chotlual Kechkan 18 18
Malkuer Yhat Nyaziaw 18 18
Malkuer Thorzier Kechbol 18 18
Malkuer Thuokpanyat Thokpan Yat
18 18
Malkuer Gezere Gezere 18 18
Pabuong Zorthier Dhorkewni 18 18
Randomly selected Villages
Payam Boma Village Planned Actaual
Madol 1
Chotchar Hele 1 18 18
Chotchar Hele 2 18 18
Dhorgapni Dhorgapni 18 18
Chotchar Banejiek 18 18
Chotchar Kulony 18 18
Chotchar Rotngech 18 18

Page 103 of 114
Madol 2
Bielthang Pipeline 18 18
Dhorthier Malekni 18 18
Loang Lingier 18 18
Malkuer
Chotlual Kechkan 18 18
Yhat Nyaziaw 18 18
Thorzier Kechbol 18 18
Thuokpanyat Thokpan Yat
18 18
Gezere Gezere 18 18
Pabuong Zorthier Dhorkewni 18 18
270
Key
Randomly selected Villages
Akuem FSL Sampling
State County Payam Boma
Mid2016 Population Projection
Households
No
rthern
Bah
r El Gh
azal
Aweil North Malual West
Mabior Nyang
2,308 385
Majak Baai
7,396 1,233
Makuei
5,415 903
Manyiel Akok
3,586 598
Aweil East Madhol
Ajiep
2,453 409
Amarjal
2,102 350
Amoth Akok
2,932 489
Dokul
4,087 681
Mabok Tong
7,375 1,229
Majok Dut
2,107 351
Majok Yinthiow
10,555 1,759
Makuac-Kiir
4,460 743

Page 104 of 114
Malualdit
2,893 482
Marol Akot
7,806 1,301
Pagai
5,625 937
Rumrol
3,943 657
Thonnyon
4,935 823
War-baai\ War Baai
4,693 782
Aweil West
Gomjuer East
Aguat
4,218 703
Wet-wil\ Wedwil
9,052 1,509
War Kou(inves. GIS)
1,579 263
Aweil Centre Nyalath Majok-Rok
1,699
283
Udhaba
3,551 592
TOTAL
104,768 17,461
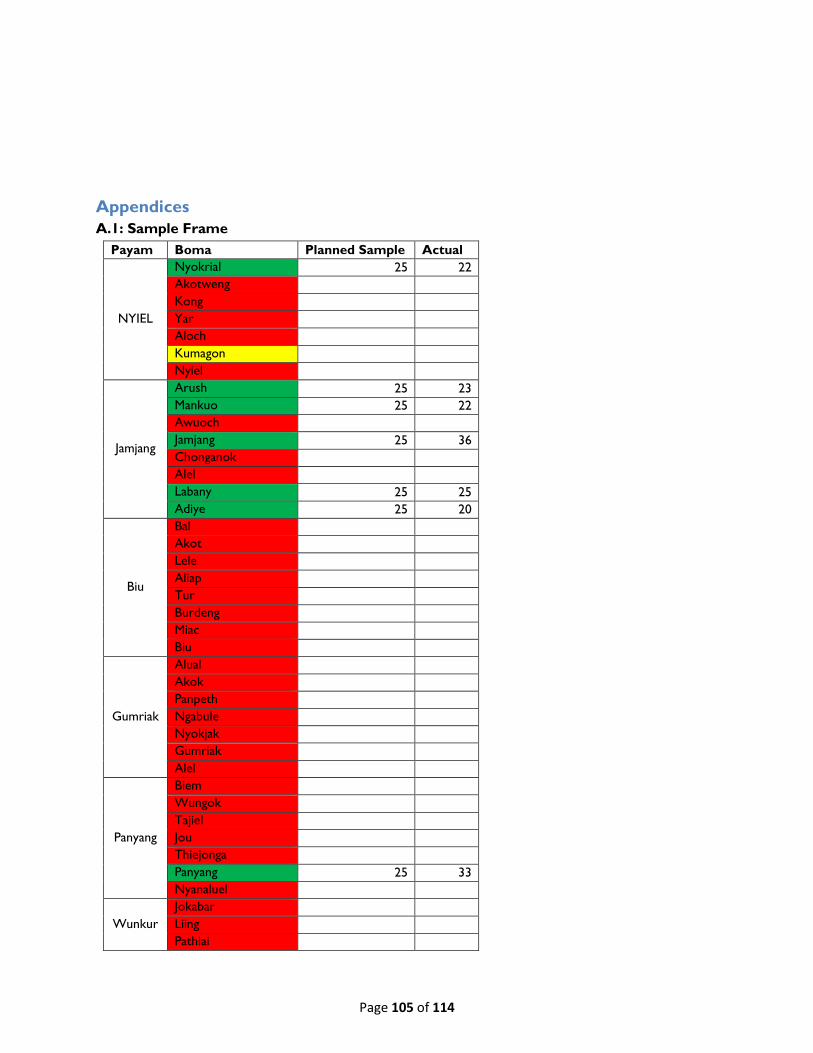
Page 105 of 114
Appendices
A.1: Sample Frame
Payam Boma Planned Sample Actual
NYIEL
Nyokrial 25 22
Akotweng
Kong
Yar
Aloch
Kumagon
Nyiel
Jamjang
Arush 25 23
Mankuo 25 22
Awuoch
Jamjang 25 36
Chonganok
Alel
Labany 25 25
Adiye 25 20
Biu
Bal
Akot
Lele
Aliap
Tur
Burdeng
Miac
Biu
Gumriak
Alual
Akok
Panpeth
Ngabule
Nyokjak
Gumriak
Alel
Panyang
Biem
Wungok
Tajiel
Jou
Thiejonga
Panyang 25 33
Nyanaluel
Wunkur
Jokabar
Liing
Pathiai

Page 106 of 114
Wunkur
Yida
Nyarweng 25 22
Panthur 25 22
Biem 25 22
Wungok
Yida 50 56
Pakuem
Jou East 25 25
Panrieng
Abuon 25 31
Waukok 50 30
Wunliit 25 37
Managuer 25 20
Guengalath 25 20
Aliiny
Athony
Rushuk
Bongki
Alilang 25 35
Kajago
Dar-kuach
Gokawel
Wunkur
Total 500 501
Key
Randomly selected and data collection done
Inaccessible either due to heavy rains or insecurity
Not Randomly selectec

Page 107 of 114
A.2 Household Questionnaire
InterCAP FSL Endline Assessment
Survey ID#:
GEOGRAPHIC LOCATION
State: County: Cluster No:
Payam: Boma: Village:
PERSONNEL AND TIMING OF SURVEY
Date of interview: Season (circle
current
season):
Dry Season 1
Interviewer: Short Rains 2
Supervisor: Long Rains 3
INTRODUCTION AND CONSENT
GREETINGS/INTRODUCTION: Good morning, my name is ________________________________ and I
work for Samaritan’s Purse. We are conducting a survey and we would like you to participate. We want to ask
you some questions about you and your household. SP project teams will take into consideration the results of
the surveys to determine what has been accomplished in the area.
INSTRUCTIONS: The respondent should be the primary farmer or the head of the household. If this respondent
is not present, any adult (15 years and above), who can provide information on the household can be interviewed.
CONSENT: This interview will take 20 -30 minutes. I will not record your name and your answers will remain
confidential. The data that is collected may also be shared with other agencies but will remain anonymous. Do
you agree to participate? YES / NO
CIRCLE THE RESPONDENTS ANSWER: 1
Qu # QUESTIONS RESPONSES Go to
Section 1. Demographic
1.01 Sex of respondent (Observe do
not ask question)
Male 1
Female 2
1.02 Are you the household head? Yes 1 1.04
No 0 1.03
1.03 If no is the household head male
or female?
Male 1
Female 2

Page 108 of 114
1.04 How many people live in this
household (by age group),
including yourself?
1.4.1. Adults: (16 years or
older)
1.4.2. Children 5 - 15 years
1.4.3. Children less than 5
years
1.05 Are you internally displaced
because of the current crisis?
Yes - IDP 1
No -Host Community Member 2
Qu # QUESTIONS RESPONSES Go to
Section 2: Food Consumption
2.01 On average, how many meals did
household members 5 years and
above in your household eat each
day during the last seven days?
0 meals 0
1 meal 1
2 meals 2
3 meals 3
4 or more meals 4
2.02 On average, how many meals did
the children under the age of 5
years in your household eat each
day during the last seven days?
0 meals 0
1 meal 1
2 meals 2
3 meals 3
4 or more meals 4
2.03 Level of food Consumption. Food
Type:
During the past 7 days, how
many days did you eat the
following foods? (Enter 0-7)
What was the main
source of food in
the last 7 days?
(identify each row
according to the
key below)
2.3.1 Sorghum
2.3.2 Maize
2.3.3 Cassava
2.3.4 Other cereals and tubers (root
crops, potatoes, millet, rice,
bread, wheat.)
2.3.5 Pulses (groundnuts, legumes,
beans, lentils, peas, sesame)
2.3.6 Vegetables, including indigenous
vegetables and leaves
2.3.7 Fruits
2.3.8 Meat and Poultry, including bush
meat
2.3.9 Eggs
2.3.10 Fish

Page 109 of 114
2.3.11 Milk, cheese, yogurt
2.3.12 Sugar, honey, sweets
2.3.13 Oil, fats
2.3.14 Condiments, Tea, coffee, salt
1 = Food Aid ( GFD) 2 = Purchased food ( market) 3 =
Borrowed Food
4 = Work for food /Exchanged labor 5 = Produce own food 6 =
Hunting/ Fishing/ Gathering
7 = Gift from friend/ family 888 = Does not know
2.04 Consumption Coping Strategy:
In the past 7 days, were there times when you did not have enough food or money to
buy food? Yes or No? If Yes Indicate the number of days out of 7 below
Behaviour Yes No Frequency ( no. of
days 0 -7)
2.4.1 Eating less preferred foods 1 0
2.4.2 Borrowing food/money from
friends and relatives
1 0
2.4.3 Limiting portions at mealtime 1 0
2.4.4 Limiting adult intake 1 0
2.4.5 Reducing the number of meals
per day
1 0
2.05 In the past [4 weeks/30 days], was
there ever no food to eat of any
kind in your house because of
lack of resources to get food?
Yes 1
No 0 2.06
2.5.1 How often did this happen in the
past [4 weeks/30 days]?
Rarely (1-2 times) 1
Sometimes (3-10 times) 2
Often (more than 10 times) 3
2.06 In the past [4 weeks/30 days], did
you or any household member go
to sleep at night hungry because
there was not enough food?
Yes 1
No 0 2.07
2.6.1 How often did this happen in the
past [4 weeks/30 days]?
Rarely (1-2 times) 1
Sometimes (3-10 times) 2
Often (more than 10 times) 3
2.07 In the past [4 weeks/30 days], did
you or any household member go
a whole day and night without
eating anything at all because
there was not enough food?
Yes 1
No 0 2.08
2.7.1 How often did this happen in the
past [4 weeks/30 days]?
Rarely (1-2 times) 1
Sometimes (3-10 times) 2
Often (more than 10 times) 3

Page 110 of 114
2.08 Were there months, in the past
12 months, in which you did not
have enough food to meet your
family’s needs?
Yes 1
No 0 3.01
2.09 If yes, which months in the past
year are when you did not have
enough food to meet your
family’s needs? This included any
kind of food from any source, (
own production, purchase,
exhange, food aid, borrowing).
(Do not read but options but
select all that mentioned. Use a
seasonal calender to help
respondent remember the
different months and probe to
make sure they have thought
about the entire 12 months)
Yes No
2.9.1 August 2017 1 0
2.9.2 July 2017 1 0
2.9.3 June 2017 1 0
2.9.4 May 2017 1 0
2.9.5 April 2017 1 0
2.9.6 March 2017 1 0
2.9.7 February 2017 1 0
2.9.8 January 2017 1 0
2.9.9 December 2016 1 0
2.9.10 November 2016 1 0
2.9.11 October 2016 1 0
2.9.12 September 2016 1 0
Qu # QUESTIONS RESPONSES Go to
Section 3: Agricultural Production
3.01 Did you plant any staple crops
during the last planting season?
Yes 1
No 0 3.06
3.02 If yes, what was the source of the
seeds?
Own supply (saved from the previous
year's crop)
1
NGO or other aid 2
Market 3
Gift from neighbor or family member 4
3.03 In which month did you plant
your staple crops?
Month:
3.04 In which month will you harvest
your staple crops?
Month:
3.05 Which of these staple crops did
you plant ?(Select that apply)
Yes No
3.5.1 Sorgum (Rap) 1 0
3.5.2 Maize (Aniyoul) 1 0
3.5.3 Millet (Awou) 1 0
3.5.4 Sesame (Simsim) 1 0
3.5.5 Cassava (Bahfarrah) 1 0
3.5.6 Sweet Potatoes
(bombay)
1 0
3.5.7 Ground Nuts
(bulgwuak)
1 0
3.5.8 Other, ( specify) 1 0
3.06 No seeds saved from the previous year 1

Page 111 of 114
If no, why did you not plant?
(select one option only)
Unable to buy seeds 2
Unable to work/dig in the field 3
I did not want/need to plant 4
Other (please specify): 5
3.07 Did you plant any vegetable seeds
during the last planting season?
Yes 1
No 0 3.12
3.08 If yes, what was the source of the
seeds?
Own supply (saved from the previous
year)
1
NGO or other aid 2
Market 3
Gift from neighbor or family member 4
3.09 In which month did you plant
your vegetable seeds?
Month:
3.10 In which month will you harvest
your vegetables?
Month:
3.11 Which of these vegetable seeds
did you plant? (Select that apply)
Yes No
3.11.1 Amaranths (nyandyan) 1 0
3.11.2 Tomatoes 1 0
3.11.3 Onions (bahsal) 1 0
3.11.4 Okra (bamia/adorop) 1 0
3.11.5 kale (sakuma) 1 0
3.11.6 Watermelon (buhk-
tiir)
1 0
3.11.7 Egg plant (ahswot) 1 0
3.11.8 Carrots (jezer) 1 0
3.11.9 Collard (jiir jiir) 1 0
3.11.10 Kudra 1 0
3.11.11 Pumpkin 1 0
3.11.12 Other, ( specify): 1 0
3.12 If no, why did you not plant?
(Select only one)
No seeds saved from the previous year 1
Unable to buy seeds 2
Unable to work/dig in the field 3
I did not want/need to plant 4
Other (please specify) 5
3.13 How many fedans of land did you
cultivate with the staple crops
and vegetable seeds? ( if they
don’t know get them to describe
the area to get an estimate)
3.13.1. Fedans of Land for
staple crops:
3.13.2. Fedans of land for
vegetables:
3.13.3. Total Fedans of land (
staple crops + vegetables)
3.14 Is there a water source available
for irriating nearby to where you
have planted?
Yes 1
No 0
3.15 Traditionally flooding garden 1

Page 112 of 114
If yes, what main kind of irrigation
method do you use? (select only
one option)
Watering cans 2
Advanced methods (treadle pump, etc) 3
Other (please specify) 4
3.16 What will you do with the food
that you produce yourself (select
all that apply)
Yes No
3.16.1 Household consume
own food produced
1 0
3.16.2 Give/ share food with
neighbours
1 0
3.16.3 Store seeds for future
harvests
1 0
3.16.4 Sell food for cash 1 0
3.16.5 Exchange 1 0
3.16.6 Other, ( specify): 1 0
3.17 Briefly describe the proportional
pilling of what you have selected
in the question above. ( roughly
what % of your food would go to
each) this should add up to 100%
_________________%___________________
_______
_________________%___________________
_______
_________________%___________________
_______
_________________%___________________
_______
Total : 100%
3.18 (Only ask if responded YES to
3.16.4) what 3 main food crops
do you sell in the market to get
income?
3.19 (Only ask if responded YES to
3.16.3) what methods do you use
to store seeds? (select all that
apply)
Yes No
3.19.1 Sacks 1 0
3.19.2 Clay jars/ pots 1 0
3.19.3 Underground 1 0
3.19.4 Raised tukul 1 0
3.19.5 Other, ( specify): 1 0
3.20 Do you use any preservation
methods for food that you
produce?
Yes 1
No 0 3.18
Does not know 888
3.21 What Preservation methods do
you use?: (select all that apply)
Yes No
3.21.1 Fry 1 0
3.21.2 Dry 1 0
3.21.3 Salt 1 0

Page 113 of 114
3.21.4 Other, ( specify): 1 0
3.22 How long will your current stock
of food produced from your own
harvest last? (select one answer)
less than 1 week 1
1-< 2 weeks 2
2 weeks - < 1 month 3
1 month - < 2 months 4
2 - < 4 months 5
4 months - < 6 months 6
6 months or more 7
3.23 How long does it take (walking)
one way to reach the nearest
market?
0-15mins 1 END
15-30mins 2
30min -1hr 3
More than 1hr 4
FINAL REMARKS: Thank you for having taken the time to answer these questions, again, your answers will
remain confidential. I can assure you that this will be helpful for us and taken into account in our activities for this
area.
A3: Focus Group Discussion Question Guide
Hello! My name is _________________. I will speak with you on behalf of Samaritan’s Purse. Today’s discussion
will be about your experiences, thoughts and knowledge and practice on Food Security and Livelihoods (FSL) in your
area. Samaritan’s Purse is already operational in your community and your thoughts and opinions are important for
helping the organization understand what has been successful so far and to help inform future interventions and
decisions.
In order to do that, they would like to know about what you have learned and now apply concerning FSL.
Consent: The discussion will take 60-90 mins. I will not record your names and your answers will remain
confidential. The information that is collected may also be shared with other agencies but will remain anonymous.
Do you agree to participate? Yes/ No?
(Get everyone’s permission before starting)
_______ males ______ females
(Participants: People who have received a vegetable seed kit. Progressive or lead farmers and other beneficiaries of the
project should participate.)
Date: ___________________
County __________Payam
Note Taker:_______________
Note: Do not read items in parenthesis () but use as prompts where necessary.
:__________________Boma:__________________Village:_______________
Facilitator:________________

Page 114 of 114
Outcome 1 Improving Agricultural Production/Food Security
1. Can you describe your experience planting new crops or vegetables in the last year?
2. What do you do with the food that you produce?
3. How much of what you have grown did you and your household eat? (Most of the food, some of
the food, etc.)
4. What are some of the limitations that keep you from growing food that you need/want?
5. What are some of the sustainable farming techniques that you know?
6. Which of those planting techniques do you practice?
7. How will your farming practices be different next year?
8. Were you able to keep seeds from this harvest?
9. What is your opinion of the/ planting techniques you (or your neighbors) have been taught? Will
you adopt them moving forward? Why or why not?
10. If you had the opportunity to learn a new farming technique, what would it be? Why?
11. Who in the community is usually responsible for planting?
12. Who is responsible for harvesting? (men, women, children?)