integrated report 2016 - argos integrado 2016... · cementos argos integrated report ... 5 letter...
TRANSCRIPT

INFO
RM
E D
E A
CC
ION
ISTA
S 2
016
CEM
ENTO
S A
RG
OS INTEGRATED REPORT
2016

WHERE DO WE OPERATE?102-4 102-2 We operate in 15 countries and territoriesThroughout three regions: Colombia, the United States and the Caribbean and Central America
United States Region4 Cement plants
305 Concrete plants
3 Grinding facilities
20 Ports / terminals
Central America and the Caribbean Region1 Cement plant
14 Concrete plants
6 Grinding facilities
11 Ports / terminals
Colombia Region7 Cement plants
60 Concrete plants
1 Port
destinations36We export to
New York
Pennsylvania
Maryland
VirginiaNorth Carolina
South CarolinaGeorgia
Florida
Alabama
Mississippi
Honduras
Panama
Colombia
Venezuela
French Guiana
Haiti Dominican Republic
Puerto Rico
Saint ThomasSaint MartinAntiguaDominica
Suriname
Arkansas
Texas
West Virginia
Cementos Argos S.A. operates in Venezuela through its subsidiary company Corporación de Cemento Andino C.A., which is currently involved in a legal process regarding the expropriation by the Venezuelan government of its plant located in the state of Trujillo (Venezuela). The compensation that Cementos Argos S.A. or its subsidiary Compañía de Cemento Andino C.A. would receive is subject to the judicial decisions of the competent bodies of the Bolivarian Republic of Venezuela. Argos maintains the claim for its investment in that country.

Financial results*
Installed capacity
RELEVANT FIGURES
24 182016 2016
Revenues Trillions of COP
Dispatched cement volumeMillons of tons
Cement Concrete
Dispatched concrete volumeMillions of cubic meters
EBITDA Trillions of COP
12Cement plants
94Dispatch centers
+375Concrete plants
32Ports / terminals
+2,700Mixer trucks (40 compressed natural gas powered mixer)
9Grinding facilities
5Ships 1 permanently leased
+14% -2.4%+4% -2.3%
+36%
+57%
+7.7%
+8.7%
2015
2015
2015
2015
7.9
14.311.5
1.52
2014
2014
2014
2014
5.8
12.611.1
0.97
2016
2016
2016
2016
8.5
1411.3
1.65
1,276Rail cars
*Throughout this report, all percentages are based on financial numbers that can be found in the consolidated financial results (page 94)
Millions of tons
Millions of cubic meters
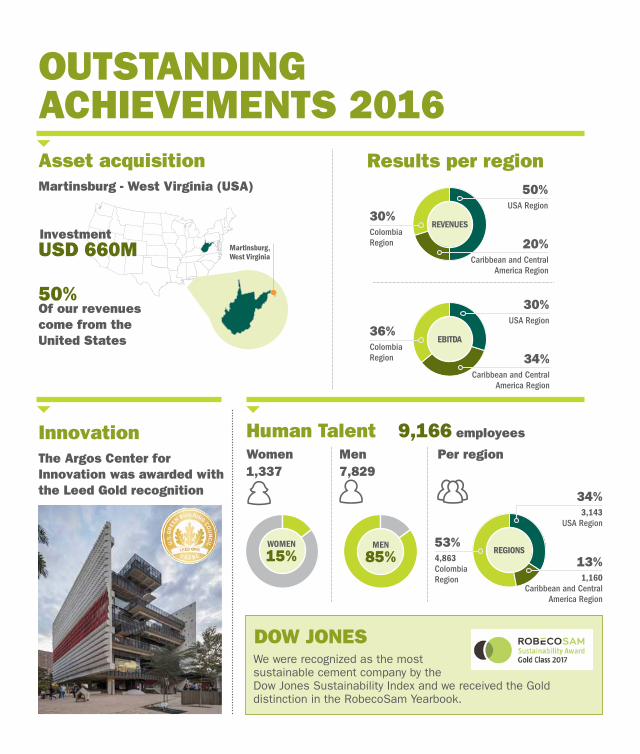
Asset acquisitionMartinsburg - West Virginia (USA)
InnovationThe Argos Center for Innovation was awarded with the Leed Gold recognition
Human Talent
Results per region
OUTSTANDING ACHIEVEMENTS 2016
Martinsburg, West Virginia
WOMEN
15% REGIONS53%4,863 Colombia Region
34%3,143
USA Region
13%1,160
Caribbean and Central America Region
9,166 employees
Women 1,337
Men 7,829
Per region
Of our revenues come from the United States
USD 660M
50%
InvestmentREVENUES
EBITDA
30%Colombia Region
36%Colombia Region
50%USA Region
30%USA Region
20%Caribbean and Central
America Region
34%Caribbean and Central
America Region
DOW JONES We were recognized as the most sustainable cement company by the Dow Jones Sustainability Index and we received the Gold distinction in the RobecoSam Yearbook.
MEN
85%
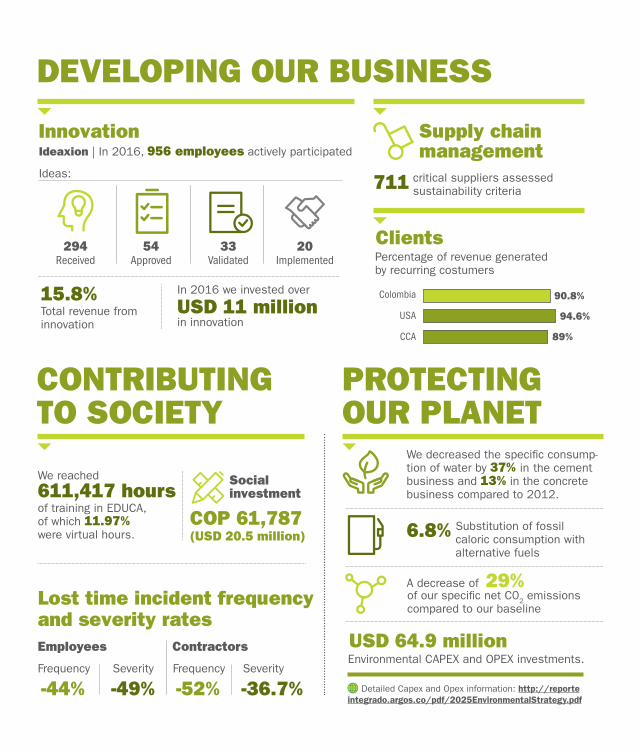
DEVELOPING OUR BUSINESS
CONTRIBUTING TO SOCIETY
PROTECTING OUR PLANET
Innovation Supply chain management
Clients
critical suppliers assessed sustainability criteria
Percentage of revenue generated by recurring costumers
Substitution of fossil caloric consumption with alternative fuels
We decreased the specific consump-tion of water by 37% in the cement business and 13% in the concrete business compared to 2012.
of our specific net C02 emissions compared to our baseline
A decrease of
Environmental CAPEX and OPEX investments.
711
6.8%
-52%-44% -36.7%-49%
29%
USD 64.9 million
15.8%USD 11 million
611,417 hours
Total revenue from innovation in innovation
of training in EDUCA, of which 11.97% were virtual hours.
In 2016 we invested over
We reached
FrequencyFrequency SeveritySeverity
Lost time incident frequency and severity rates
Social investment
Employees Contractors
COP 61,787 (USD 20.5 million)
94.6%
89%
90.8%Colombia
USA
CCA
Ideaxion | In 2016, 956 employees actively participated
Ideas:
294Received
54Approved
33Validated
20Implemented
Detailed Capex and Opex information: http://reporte integrado.argos.co/pdf/2025EnvironmentalStrategy.pdf

INTEGRATED REPORT2016

01 02Our Purpose Developing our Business
26 How We Create Value28 Value Added Statement32 BEST34 Strategic Risk Management36 Sustainability Strategy38 Materiality Analysis40 Sustainable Development Goals-SDGs42 Our Stakeholders44 Corporate Governance50 Ethics and Compliance
5 Letter from our Chairman6 About the Report8 Management Report
56 Profitability and Capital Structure58 Expansion and Consolidation 60 Customer Relationship Management62 Supplier Development
and Management64 Innovation
TAB
LE O
F C
ON
TEN
TS
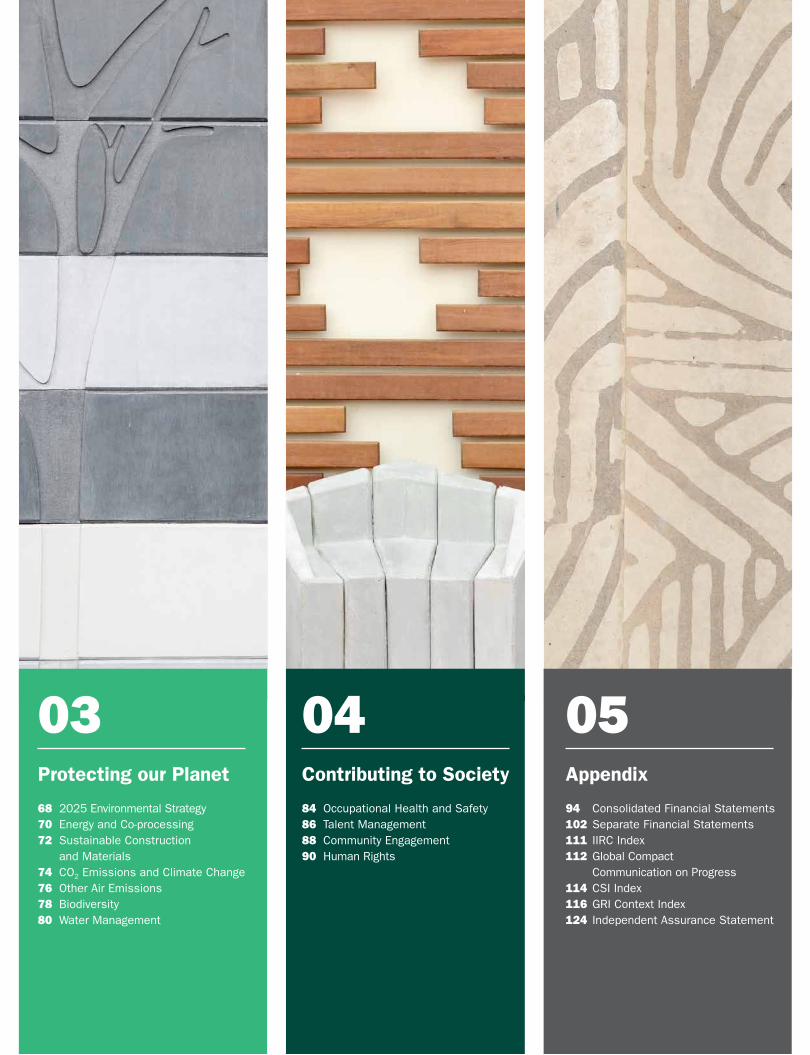
03 04 05Protecting our Planet Contributing to Society Appendix
68 2025 Environmental Strategy70 Energy and Co-processing72 Sustainable Construction and Materials74 CO2 Emissions and Climate Change76 Other Air Emissions78 Biodiversity80 Water Management
84 Occupational Health and Safety86 Talent Management88 Community Engagement90 Human Rights
94 Consolidated Financial Statements102 Separate Financial Statements111 IIRC Index112 Global Compact
Communication on Progress114 CSI Index116 GRI Context Index124 Independent Assurance Statement
Art work made with colored concrete
Dear Stakeholders:
2016 was a period of important changes for Cementos Argos, one of the strategic businesses of Grupo Empresarial Argos. The successful change of its leadership, the reinforcement and consolidation of its diversification strategy, the realization of several projects and its unique human talent, all enabled the company to obtain positive results and remain one of the leading cement companies in the American continent, in the midst of a challenging and changing environment.
The recent acquisition of the cement plant in Martinsburg, West Virginia, along with eight terminals, is proof of this. These assets have an enormous potential to generate value and have allowed Cementos Argos to broaden its operation from nine to thirteen states and to increase its installed capacity in the United States by 29%.
The company’s progress and competitiveness are a result of the strategic coherence of Grupo Argos, in which the long-term value generation for its shareholders is leveraged on its integrity and transparency as axes and inspiring principles of its management.
Furthermore, a strong commitment towards innovation and sustainability as elements for develop-ment has enabled Cementos Argos to reach important achievements, such as being recognized as the most sustainable cement company around the world according to the Dow Jones Sustainability Index. This event transcends all results and ratifies the organization’s efforts to have increasingly responsible operations, which guarantees the company’s sustainability over time.
We foresee a positive 2017, even though the worldwide economy is expected to be challenging and will demand a continuous search for profitable growth in the long-term. We are convinced that Cementos Argos has a solid basis to continue pursuing its growth and that through the responsi-ble application of the BEST (Building Efficiency and Sustainability for Tomorrow) Program we will accelerate it. Additionally, we believe that the company has the capacity to continue capturing the unlimited possibilities that appear in the different markets of the various countries and territories in which it is present. Argos is more than just cement and ready-mix; it is a company that reaffirms its purpose of transforming lives and always finding new and better ways to generate value for all its stakeholders.
We work to build the sustainable future that we dream of. We reafirm our company’s commitment to respect and promote human rights, the principles of the Global Compact and the International Labour Organization. We want to thank all our employees, our management and especially you, our shareholders, for your confidence and support.
JORGE MARIO VELÁSQUEZ Chairman

102-50 102-32 This is Cementos Argos’ 5th Integrated Report. It provides insight into our company’s economic, social and environmental performance for the reporting period from January 1st to December 31st 2016. It has been formally reviewed and approved by our CEO and senior members of the Exec-utive Committee.
Throughout the report, we disclose our business lines by region, clearly stating our sustainability strategy and the management of strategic and emerging risks. Each chapter also includes information on future challenges and goals, as we seek to operationalize our medium- and long-term business strategy.
The prioritization of the aspects included in this report is the result of a thor-ough and comprehensive materiality assessment developed in 2015, which is further explained in the Materiality chapter. Our stakeholders were consulted in this prioritization process and we aim to address their needs, interests, and aspirations in this report.
Likewise, this report seeks to highlight the interconnected nature of our mate-rial aspects and how the appropriate management of each affects the overall performance of the organization. Every reported aspect includes information regarding governance, management approach, and goals, and although they are grouped according to economic, social, and environmental dimensions, there are clear connectors and guiding principles for all of them.
In order to improve our reporting practices and the reading experience for our stakeholders, we have made this report as concise as possible, by presenting the information stakeholders value most without undermining the integrity and comprehensiveness of the exercise. Additionally, our consistency in the use of reporting frameworks allows the reader to compare our data with that of other companies and also to previously reported years.
In order to maintain comparability with the figures published in past reports, they are expressed in pesos and USA dollars at a representative market exchange rate of COP $3,000.74. GRI Standard indicators are identified in the report with the following symbol: CODE. Value chain boundaries of each topic are also identified below the respective title when applicable.
Sustainable Development Goals alignment with our sustainability strategy can be found on page 40 and in each chapter with the UN SDGs logo.
The detailed table of the elements of the Integrated Report framework that are included in this Report can be reviewed on page 111.
The online version of this report can be viewed at: http://reporteintegrado.argos.co/?lang=en
ABOUT THE REPORT
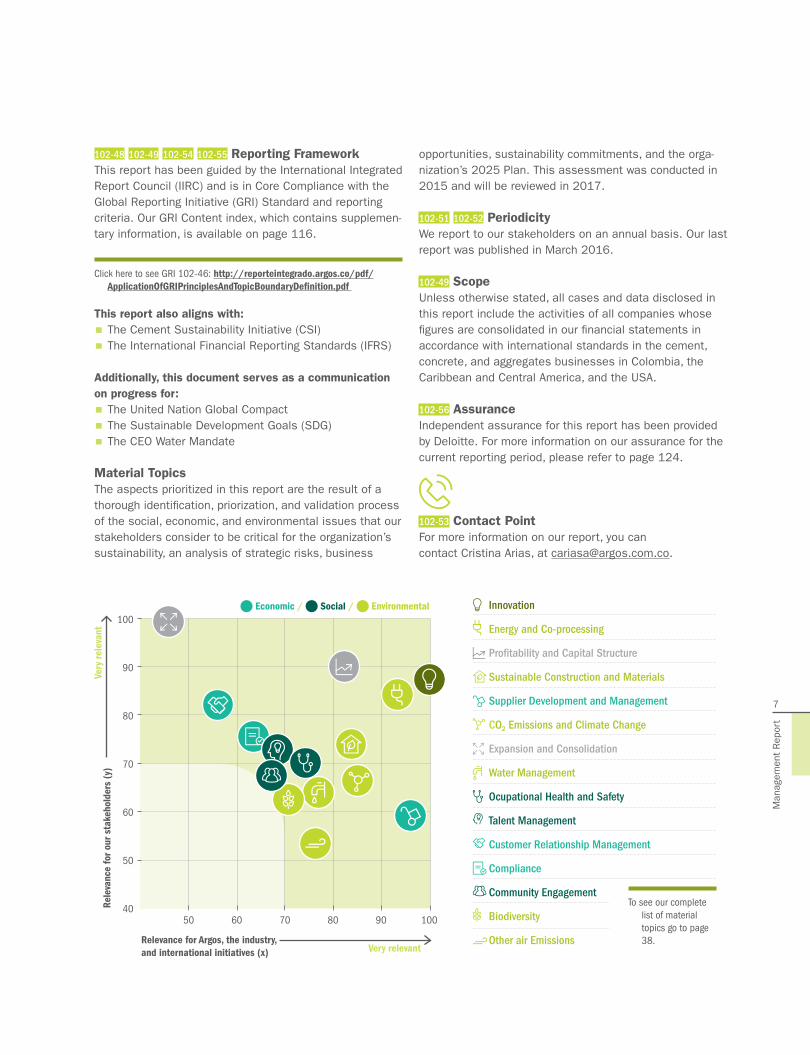
ABOUT THE REPORT102-48 102-49 102-54 102-55 Reporting FrameworkThis report has been guided by the International Integrated Report Council (IIRC) and is in Core Compliance with the Global Reporting Initiative (GRI) Standard and reporting criteria. Our GRI Content index, which contains supplemen-tary information, is available on page 116.
Click here to see GRI 102-46: http://reporteintegrado.argos.co/pdf/ApplicationOfGRIPrinciplesAndTopicBoundaryDefinition.pdf
This report also aligns with:
· The Cement Sustainability Initiative (CSI)
· The International Financial Reporting Standards (IFRS)
Additionally, this document serves as a communication on progress for:
· The United Nation Global Compact
· The Sustainable Development Goals (SDG)
· The CEO Water Mandate
Material TopicsThe aspects prioritized in this report are the result of a thorough identification, priorization, and validation process of the social, economic, and environmental issues that our stakeholders consider to be critical for the organization’s sustainability, an analysis of strategic risks, business
opportunities, sustainability commitments, and the orga-nization’s 2025 Plan. This assessment was conducted in 2015 and will be reviewed in 2017.
102-51 102-52 PeriodicityWe report to our stakeholders on an annual basis. Our last report was published in March 2016.
102-49 ScopeUnless otherwise stated, all cases and data disclosed in this report include the activities of all companies whose figures are consolidated in our financial statements in accordance with international standards in the cement, concrete, and aggregates businesses in Colombia, the Caribbean and Central America, and the USA.
102-56 AssuranceIndependent assurance for this report has been provided by Deloitte. For more information on our assurance for the current reporting period, please refer to page 124.
102-53 Contact PointFor more information on our report, you can contact Cristina Arias, at [email protected].
Innovation
Energy and Co-processing
Profitability and Capital Structure
Sustainable Construction and Materials
Supplier Development and Management
CO2 Emissions and Climate Change
Expansion and Consolidation
Water Management
Ocupational Health and Safety
Talent Management
Customer Relationship Management
Compliance
Community Engagement
Biodiversity
Other air Emissions
100
90
80
70
60
50
4050 70 9060 80 100
Relevance for Argos, the industry, and international initiatives (x)
Rele
vanc
e fo
r our
sta
keho
lder
s (y
)Ve
ry re
leva
nt
Very relevant
Economic / Social / Environmental
To see our complete list of material topics go to page 38.
7
Man
agem
ent
Rep
ort

Dear Stakeholders,
2016 was a year characterized by the achievement of important goals that recognize the commitment of Argos to grow in a balanced and sustainable way, looking forward to offset the environmental impact of our operations and generating, at the same time, positive externalities in all communities and regions we are present. Being recognized by the Dow Jones Sustainability Index as the most sustainable cement producer in the world, inspires us to continue working towards the sustainability of the company, industry and society.
The year that just ended was a period of consolidation of the strategic initiatives that will boost the growth of the company in the near future, and will allow us to be prepared, even more, to face the challenges of a defiant market. During 2016 we highlighted the beginning of the operational excellence program that we called BEST which means, Building Efficiency and Sustainability for Tomorrow.
At the same time, we increased our presence in the cement business in the United States, strengthened the operations in the Caribbean and the Central America Region, achieved international standards of industrial safety and occupational health, and obtained more revenues from innovation, one of our strategic pillars.
The acquisition of a cement plant in the United States, the world’s largest economy, expecting to continue its recovery path and driven by infrastructure investment, will have a positive impact in our 2017 results. Additonally, the outstanding performance of the operations in Honduras and Panama, and the expected start of the 4th generation infrastructure program in Colombia, anticipate excellent prospects.
MANAGEMENT REPORT
Juan Esteban Calle CEO
INTE
GR
ATED
REP
OR
T 2016
8
BUILDING EFFICIENCY AND SUSTAINABILITY FOR TOMORROW
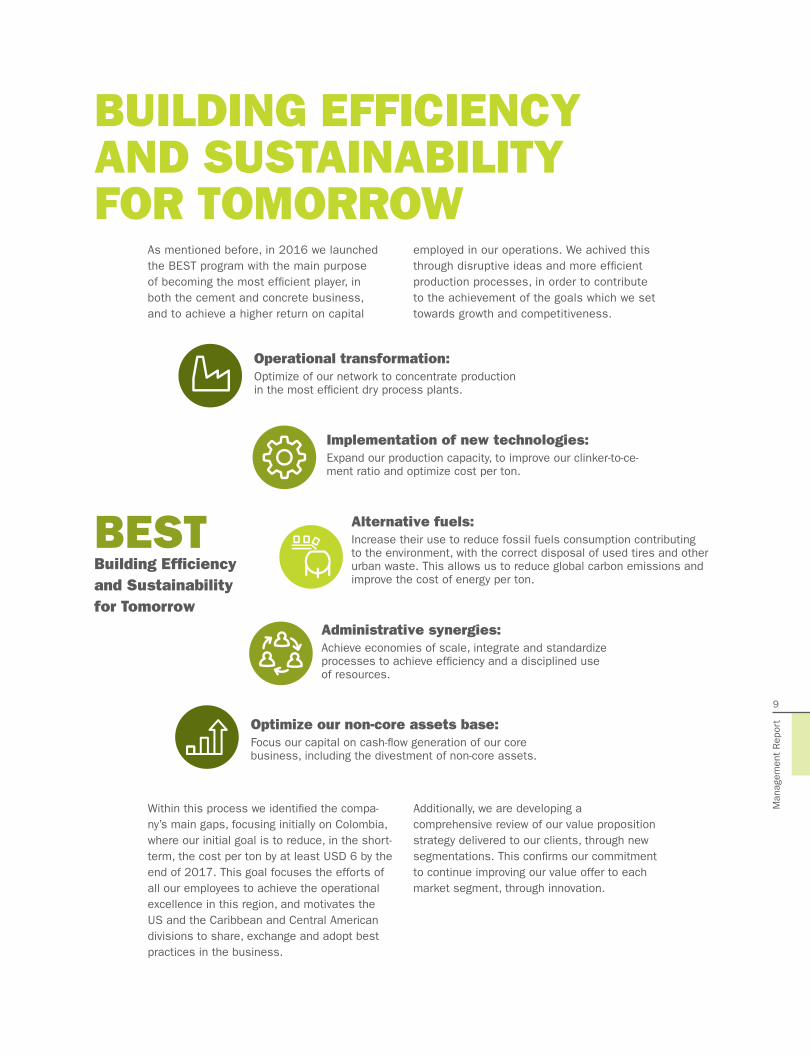
As mentioned before, in 2016 we launched the BEST program with the main purpose of becoming the most efficient player, in both the cement and concrete business, and to achieve a higher return on capital
employed in our operations. We achived this through disruptive ideas and more efficient production processes, in order to contribute to the achievement of the goals which we set towards growth and competitiveness.
Within this process we identified the compa-ny’s main gaps, focusing initially on Colombia, where our initial goal is to reduce, in the short-term, the cost per ton by at least USD 6 by the end of 2017. This goal focuses the efforts of all our employees to achieve the operational excellence in this region, and motivates the US and the Caribbean and Central American divisions to share, exchange and adopt best practices in the business.
Additionally, we are developing a comprehensive review of our value proposition strategy delivered to our clients, through new segmentations. This confirms our commitment to continue improving our value offer to each market segment, through innovation.
Operational transformation: Optimize of our network to concentrate production in the most efficient dry process plants.
Implementation of new technologies: Expand our production capacity, to improve our clinker-to-ce-ment ratio and optimize cost per ton.
Administrative synergies: Achieve economies of scale, integrate and standardize processes to achieve efficiency and a disciplined use of resources.
Optimize our non-core assets base: Focus our capital on cash-flow generation of our core business, including the divestment of non-core assets.
Alternative fuels: Increase their use to reduce fossil fuels consumption contributing to the environment, with the correct disposal of used tires and other urban waste. This allows us to reduce global carbon emissions and improve the cost of energy per ton.
BEST Building Efficiency and Sustainability for Tomorrow
9
Man
agem
ent
Rep
ort

EXPANSION AND CONSOLIDATIONAs part of our profitable growth strategy, we highlight the acquisition of a cement plant in Martinsburg, West Virginia, and 8 logistical ter-minals, which allowed us to increase our cement installed capacity by 29%, reaching 10 million metric tons per year. With this acquisition, Argos expands its presence in the US, from operating in 9 to 13 states, bringing our influence area to around 116 million people and complements the existing operations with mayor operative, technological and logistical strengths. We expect to obtain synergies of around USD 8 million per year in the US.
The transaction, closed in December of 2016, had a total investment of USD 660 million, and it was financed initially with a bridge loan, which will be paid primarily with funds from a divest-ment plan of non-strategic and non-core assets. This plan began its execution in 2016 and as of January it had reached USD 296 million, coherent with the announced strategy to finance the acquisition in Martinsburg and allowed us to improve the return on the capital employed in our operations. Argos will complete the payment of this bridge loan before the end of 2017.
Martinsburg, West Virginia
Martinsburg Plant, USA Region
INTE
GR
ATED
REP
OR
T 2016
10

San Lorenzo Plant, Honduras, Caribbean and Central America Region
The mentioned divestment plan, began with the sale of 20% of the minority stake of Argos Panama. In the same way, the company sold shares of Bancolombia for around USD 140 million and real estate assets close to USD 30 million in Panama and Colombia. Also, Argos is still working in the divestment of energetic assets in Colombia and real estate assets in all regions, valued at around USD 40 million.
We have the discipline, experience and finan-cial flexibility not only to execute strategic ac-quisitions, but to integrate them to our logistic network. In the same way, we have a know-how that allows us to grow organically in a sus-tainable way. Considering this, we restarted operations our grinding facility in San Lorenzo, Honduras, which has an annual production capacity of 300,000 tons and will allow us to supply the market in the south of the country.
Also, and considering our BEST program, we decided to postpone the expansion process in Sogamoso, Colombia and instead, imple-ment new innovative technologies in all our operation network, which will allow us to add
capacity in the different consumption centers all over the country, with a lower investment per ton, optimizing the capital employed and the cash flow.
In conclusion, in 2016 we strengthened our expansion strategy and consolidated Argos’s presence in the Americas. We continue benefiting through the best practices of our operations, diversity and experience of our human talent in all the regions where Argos is present.
WE RESTARTED THE GRINDING FACILITY IN SAN LORENZO, HONDURAS, WHICH WILL HELP US SERVE MORE EFFICIENTLY THE COUNTRY’S SOUTHERN MARKET.
11
Man
agem
ent
Rep
ort
OPERATIONAL RESULTS
PROFITABILITY AND CAPITAL STRUCTURE
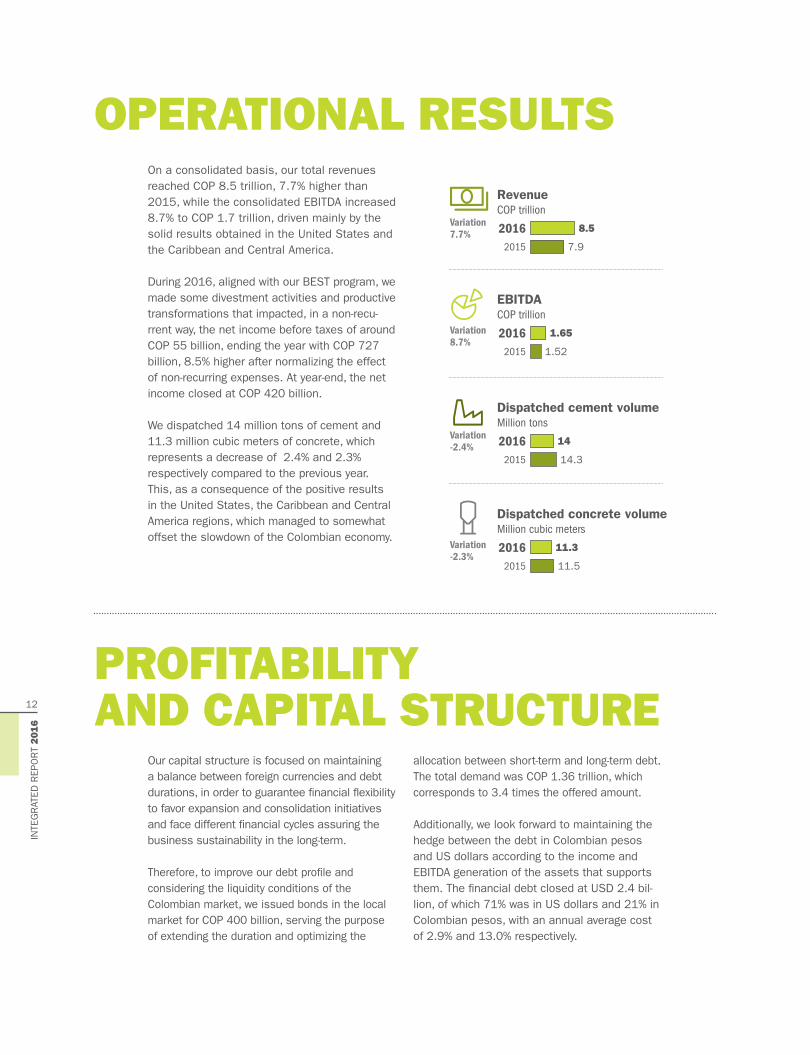
On a consolidated basis, our total revenues reached COP 8.5 trillion, 7.7% higher than 2015, while the consolidated EBITDA increased 8.7% to COP 1.7 trillion, driven mainly by the solid results obtained in the United States and the Caribbean and Central America.
During 2016, aligned with our BEST program, we made some divestment activities and productive transformations that impacted, in a non-recu-rrent way, the net income before taxes of around COP 55 billion, ending the year with COP 727 billion, 8.5% higher after normalizing the effect of non-recurring expenses. At year-end, the net income closed at COP 420 billion.
We dispatched 14 million tons of cement and 11.3 million cubic meters of concrete, which represents a decrease of 2.4% and 2.3% respectively compared to the previous year. This, as a consequence of the positive results in the United States, the Caribbean and Central America regions, which managed to somewhat offset the slowdown of the Colombian economy.
Our capital structure is focused on maintaining a balance between foreign currencies and debt durations, in order to guarantee financial flexibility to favor expansion and consolidation initiatives and face different financial cycles assuring the business sustainability in the long-term.
Therefore, to improve our debt profile and considering the liquidity conditions of the Colombian market, we issued bonds in the local market for COP 400 billion, serving the purpose of extending the duration and optimizing the
allocation between short-term and long-term debt. The total demand was COP 1.36 trillion, which corresponds to 3.4 times the offered amount.
Additionally, we look forward to maintaining the hedge between the debt in Colombian pesos and US dollars according to the income and EBITDA generation of the assets that supports them. The financial debt closed at USD 2.4 bil-lion, of which 71% was in US dollars and 21% in Colombian pesos, with an annual average cost of 2.9% and 13.0% respectively.
RevenueCOP trillion
Dispatched cement volumeMillion tons
Variation 7.7%
Variation -2.4%
Variation 8.7%
Variation -2.3%
EBITDACOP trillion
Dispatched concrete volumeMillion cubic meters
2016
2016
2016
2016
2015
2015
2015
2015
8.5
14
1.65
11.3
7.9
14.3
1.52
11.5
INTE
GR
ATED
REP
OR
T 2016
12
1.500
Price COP
PointsCOLCAP
Jan-16 Feb-16 Mar-16 Abr-16 May-16 Jun-16 Jul-16 Aug-16 Sep-16 Oct-16 Nov-16 Dec-16
1.400
1.300
1.200
1.100
1.000
900
800
12.000
11.500
11.000
10.500
10.000
9.500
9.000
8.500
8.000
17% COLCAP22% CEMARGOS 17% PFCEMARGOS
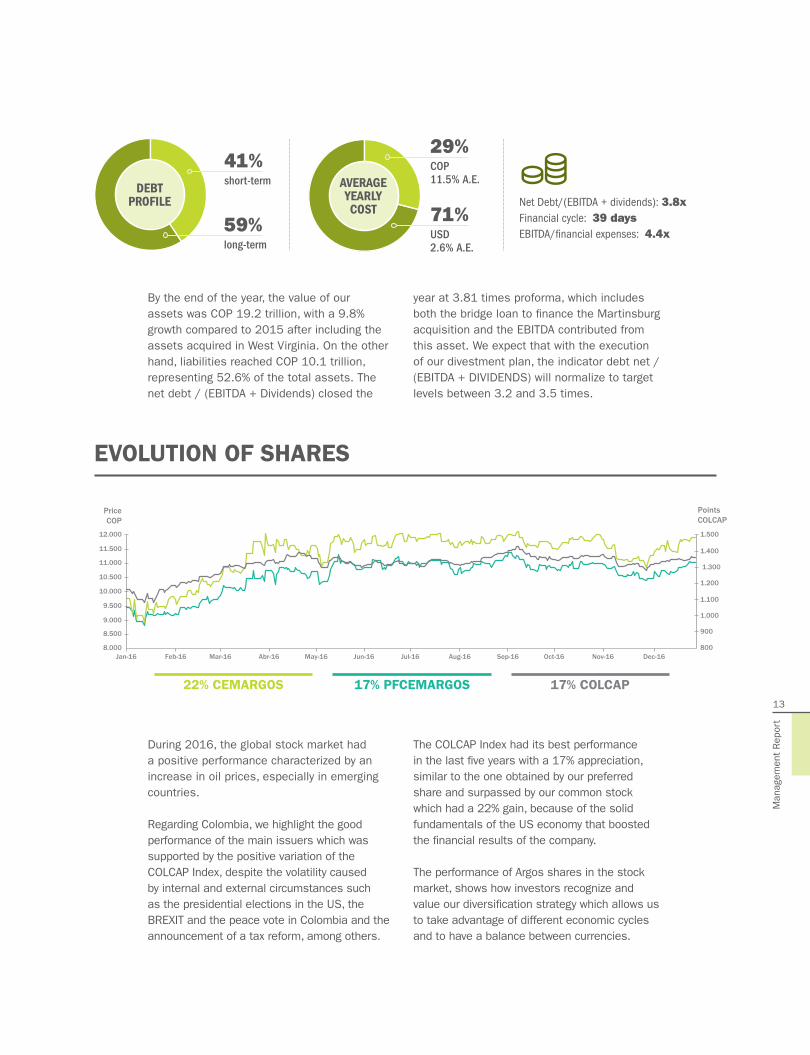
By the end of the year, the value of our assets was COP 19.2 trillion, with a 9.8% growth compared to 2015 after including the assets acquired in West Virginia. On the other hand, liabilities reached COP 10.1 trillion, representing 52.6% of the total assets. The net debt / (EBITDA + Dividends) closed the
year at 3.81 times proforma, which includes both the bridge loan to finance the Martinsburg acquisition and the EBITDA contributed from this asset. We expect that with the execution of our divestment plan, the indicator debt net / (EBITDA + DIVIDENDS) will normalize to target levels between 3.2 and 3.5 times.
During 2016, the global stock market had a positive performance characterized by an increase in oil prices, especially in emerging countries.
Regarding Colombia, we highlight the good performance of the main issuers which was supported by the positive variation of the COLCAP Index, despite the volatility caused by internal and external circumstances such as the presidential elections in the US, the BREXIT and the peace vote in Colombia and the announcement of a tax reform, among others.
The COLCAP Index had its best performance in the last five years with a 17% appreciation, similar to the one obtained by our preferred share and surpassed by our common stock which had a 22% gain, because of the solid fundamentals of the US economy that boosted the financial results of the company.
The performance of Argos shares in the stock market, shows how investors recognize and value our diversification strategy which allows us to take advantage of different economic cycles and to have a balance between currencies.
EVOLUTION OF SHARES
DEBT PROFILE
41%short-term
59%long-term
AVERAGE YEARLY COST
29%COP 11.5% A.E.
71%USD 2.6% A.E.
Net Debt/(EBITDA + dividends): 3.8xFinancial cycle: 39 daysEBITDA/financial expenses: 4.4x
13
Man
agem
ent
Rep
ort

BUSINESS PERFORMANCE BY REGION
USA REGION
The US economy continued its recovery path strengthened by the increase of consumer confi-dence as consequence of a strong labor market with minimum unemployment rates, under 5%, and an improvement in family incomes, which leveraged housing starts and building permits to historical levels since 2008. The need for investment in infrastructure by 2025, which according to the American Society of Civil Engi-neers (ASCE), is around USD 3.3 billion, gives us positive prospects for the future results of the company and the industry.
Our dispatched volumes of cement in the US grew 18.5% to 4 million tons, boosted by the good performance of the markets where we have presence with an average growth of around 7.9%, mainly in Georgia, Florida and the Caroli-nas, where the recovery of the residential sector favored a two-digit growth. In the same way, concrete dispatches grew 2.9%, to 7.6 million cubic meters placing us as the leaders of the ready-mix business in the country, despite the adverse weather conditions and the impact of oil prices in the economy of Texas.
According to the Portland Cement Associa-tion (PCA), in 2017, cement dispatches in the states where we operate, are expected to grow around 3%. Between 2018 and 2021, an
average increase of 3.95% is expected, driven mainly by the commencement of the execution of infrastructure plan, which will be supported by a higher public expense expected to grow average rates of around 4.8% during the men-tioned period of time.
The US region reached USD 1.39 billion reve-nues, 11.6% more than 2015 and an historical EBITDA of USD 191 million, 63.8% more than in 2015, with a margin that for the first time since the crisis, reached a double-digit, closing at 13%.
These results are consequence not only of the operational leverage, but also of the excellent commercial strategy that allowed us to increase market share in the states where we operate and reach price improvement. Our performance in this country is characterized by a constant focus in operational efficiency, which is supported by an optimal logistic network formed by 4 cement plants, more than 300 concrete plants, 2 grinding facilities, 20 ports and logistic terminals, around 1,300 rail cars and approximately 1,800 mixer trucks, which allows us to attend the market in an opportune way.
The most recent acquisition in Martinsburg for USD 660 million, placed us as the major Co-lombian Investor in the United States, by joining the acquisitions of companies such as Ready
RevenueUSD million
Dispatched cement volumeMillon of tons
EBITDAUSD million
Dispatched concrete volumeMillion of cubic meters
2016 2016
2016 2016
2015 2015
2015 2015
1.388 4
181 7.6
1.244 3.4
110 7.4
New York
Pennsylvania
Maryland
West Virginia
Virginia
North Carolina
South Carolina
Georgia
Florida
Alabama
Mississippi
Arkansas
Texas
Variation 11.6%
Variation 18.5%
Variation 63.8%
Variation 2.9%
102-4 102-6
INTE
GR
ATED
REP
OR
T 2016
14

Mix Concrete Company, Southern Star Concrete and the assets to Lafarge and Vulcan Materials, all made between 2005 and 2014, for a total investment that exceeds USD 2.8 billion.
This plant in West Virginia and its terminals, strengthens, even more, our presence in the US market, while adding new synergies to our logistical network in order to continue adding value to our stakeholders.
Regarding the achievements of the US Region, we highlight improvements in efficiency and sustainability reaching a 14.2% substitution in alternative fuels; the launching of three new value-added products; the operation of the cement and concrete business under one company: Argos USA; the SAP roll-out and the Energy Star certification given to our cement plant in Newberry, reassuring our commit-ment with energetic excellence. In the same way, we emphasize the participation of Argos in projects such as: The North Tower of the Methodist Hospital in Houston, the Falcons Stadium in Atlanta, the administrative offices of Coca-Cola in Atlanta and the supply of blue concrete to the attraction: “Finding Nemo” in Disney, Orlando.
Also, from an operational point of view, in 2016 we invested USD 23.3 million in projects such
as: acquisition of 125 mixer trucks, the installa-tion of a new calcinator in Harleyville, that allows us to use natural gas and give us flexibility to face the variation of fuel prices, and a project to use alternative fuels in Newberry to reduce about 30% of fossil fuels usage in 2017 and reach substitution levels of the other cement plants in the country.
In the same way, the US Region made important improvements in our industrial security and occupational health system, which led us to reach significant reductions in our severity and frequency rates, 77.7% and 89% respectively compared to 2016 goals. Frequency and severity indexes closed at 0.4 and 9.18.
Also, the addition of around 200 employees from the Martinsburg operations, to the 3,143 that accompanied us before the acquisition. We are truly convinced that the cultural diversi-ty and the know-how of this team will add value to our company.
Argos has delivered 60,000 cubic yards of ready-mix to one of the biggest building sites in Houston, the North Tower of the Methodist Hospital.
AS OF TODAY, THE US REGION GENERATED 50% OF OUR REVENUES AND 30% OF OUR EBITDA.
Martinsburg Plant, US Region
15
Man
agem
ent
Rep
ort

COLOMBIA REGION
After more than a decade of continuous growth in Colombia, our sector presented a typical deceleration of a cyclical market. This is highly correlated with the performance of the economy that faced a challenging year due to the lower incomes from oil prices and some circumstantial factors, such as the transportation strike, the El Niño weather phenomenon, and the devaluation of the currency, lea-ding to an increase of inflation, which closed at 5.8% and interest rates. The Colombian GPD reached 2%, a stand out in the region and the construction GDP grew 4.1% while the unemployment rate ended at 8.7%, which is slightly above compared to 2015. These fundamentals and the delays in the beginning of the 4G projects, explain the 5.5% decrease in cement dispatches in the national market compared to 2015, closing at 12.1 million tons in 2016.
Infrastructure construction went through a transition period which directly affects, and still does, the demand for materials until the initiation of the most intensive cement phase of the 4th generation concession projects, as well as the multiple private investment programs and the urban development plans.
These circumstances not only impacted dispatches of bulk cement in the market, with a decrease of 7.1%, but also our results, taking into account our leadership in the Colombian market, specifically in the industrial segment, which was the one most affected.
As a result, our dispatched volumes of cement and ready-mix closed at 5.1 million tons and 3.2 million cubic meters, which are 19% and 13% less respectively compared to 2015, resulting in COP 2.6 trillion in revenues, 12.8% lower than the previous year, while the EBITDA closed COP 667.6 billion, with a margin of 25.7%.
The challenging competitive environment, exacerbated by the increase of cement imports, was driven by the global surplus of cement installed capacity and the historical low international freights. Therefore, it is mandatory to accelerate our BEST efficiency program in order to become leaders in competitiveness and offer the best value proposition for the market.
As part of the initial results of this process, we would like to highlight the cessation of our cement plants in Sabanagrande and San Gil, and our ready-mix plant in Mamonal, Cartagena, with estimated savings in fixed costs of COP 30 billion per year. Furthermore, we continue the evaluation of all our assets looking forward to optimize the operations and concentrate production in the most efficient plants.
Also, we are working on the development of new efficient technologies, which will help us add one million tons of installed capacity between 2017 and 2018, lowering our clinker-to-cement ratio. These investments are less intensive in Capex per ton and will be distributed among the plants to further improve our value proposition and time-to-market.
In 2016 we advanced in the implementation of the co-processing of used tires as an alternative fuel in one of our kilns in the Rioclaro plant, Antioquia, with a substitution that closed at 6% at the end of the year, and between September and December reached around 11%. This translates into immediate savings for our operation, as well as the adequate contribution to the disposal of residues in the country. In 2017 our goal is to co-process more than one million tons of used tires. Also, in Cartagena, we started a co-processing project to reassure our commitment with the environment.
RevenueCOP trillion
EBITDACOP billion
2016
2016
2015
2015
2.6
670
3
880
Variation -12.8%
Variation -24%
Dispatched cement volumeMillion tons
Dispatched concrete volumeMillion cubic meters
2016
2016
2015
2015
5.1
3.2
6.2
3.7
Variation -19%
Variation -13%
We were the suppliers for the first bridge in Latam made with ultra-high performance concrete.
CLOSE TO 20% OF THIS REGION’S REVENUES CAME FROM INNOVATION. Pedestrian bridge, Universidad Eafit,
Medellin, Colombia
INTE
GR
ATED
REP
OR
T 2016
16

Generating value to our clients continues to be our major objective; because of this, we work constantly to strengthen the value proposition in each of the market segments. In the industrial business, we re-potencialized the concrete portal, through which 12% of the weekly concrete orders were received since its commencement in November. Also, we expanded our industrial portfolio, as we launched innovative products such as micro-cement, road-binder, ultra-high performance concrete and specialized concrete products. This will give us competitive advantages in the sector with the most growth forecasted.
In the retail business, where closeness is a differentiating factor, we generated better proximity with the hardware stores and the master builders through the Liga Argos Futsal, Argos Football Tournament for master builders, among other activities. Likewise, with the Construyá Program, Argos allowed bank entities the disbursement of around COP 15,172 million to be used in house renovations for low income families, benefitting more than 68,000 people.
Throughout the year, we served 7,857 clients, reaching 735 municipalities with a fleet of 691 mixer trucks and 42 distribution centers around the country. Also, we remained one of the most renown brands among cement producers in Colombia, through the consolidation of the commercial model and the support of a recognized value-added proposition. Argos reached a customer satisfaction level of 88.9% and a Top of Mind of 56 points among the general public.
The focus on innovation continues providing positive results in areas such as the generation of 20% of the total revenues, tax benefits and the recognition of Argos by Colciencias as one of the most highly innovative companies in the country, which supports our Research and Development management.
Social dialogue, respect and trust are fundamental pillars that have helped us strengthen our relationship with our employees. We celebrated the 10th anniversary of our first collective agreement. Today, we ratify our commitment to the safety of all our employees with the improvement of the frequency and severity indexes in 55.9% and 3.93% respectively compared to our 2016 goal.
We believe that our value proposition, cultural pillars, track record, efficiency focus and promise for innovation and sustainability, will allow us to reap benefits in the Colombian market, which has positive prospects due to the important role infrastructure will have in the coming years.
Rioclaro plant, Colombia Region
At the end of 2016, we had signed contracts to supply
75%cement supply contracted share of the total awarded functional units of the first wave.40 functional units of the 4G program
17
Man
agem
ent
Rep
ort

CARIBBEAN AND CENTRAL AMERICA REGION
The diverse fundamentals from this region support the stability and growth opportunities, where through our highly profitable operations we adapt our value proposition according to each market’s needs.
The divestment of a 20% stake in Argos Panama to Grupo Provivienda is consistent with our strategy of partnering with local minority shareholders in this region. Those partners provide value through market knowledge and local networking.
Cement and ready-mix concrete dispatches reached 5 million metric tons, 4.7% higher than in 2015 and 425,000 cubic meters, respectively, driven by the positive performance in Honduras and our trading unit. Revenues closed at USD 551 millon and EBITDA at USD 207 millon, resulting in a margIn of 37.6%, the best margin among all regions.
Durable ready-mix in the Cinta Costera, Panama
RevenueUSD Million
EBITDAUSD Million
2016
2016
2015
2015
551
207
540
167
Haiti
Dominican Republic
Puerto Rico
Saint Thomas
Saint Martin
Antigua
Dominica
Curaçao
Variation 2.1%
Variation 24%
Dispatched cement volumeMillion tons
Dispatched concrete volumeMillion cubic meters
2016
2016
2015
2015
5
425
4.7
426
Variation 4.7%
Variation -0.1%
Honduras
Panama
Venezuela
Suriname
French Guiana
INTE
GR
ATED
REP
OR
T 2016
18

In Honduras, fiscal discipline and an overall improvement in the macroeconomic environment allowed the central government to design an ambitious infrastructure program through public-private partnerships, focused on improving the energetic supply and roads across the country, which have been designed for concrete construction. These factors support our positive outlook for this market and increase our growth opportunities in it.
As evidence of our confidence, and to continue supporting the Honduran development we restarted our grinding facility in San Lorenzo and inaugurated a distribution center in the northern part of the country. Likewise, we highlight the unification of our Argos Brand in October and our participation in important construction works such as the Civic Center and the road “Carretera del Sur”.
In Panama, the increased fiscal income re-ceived from the Canal expansion will boost the infrastructure and housing plans in a country characterized by its high employment levels. This fiscal income will be distributed through-out the country bringing more development to other regions outside Panama City.
In the other countries, we obtained positive results in spite of the adverse weather conditions. Similarly, the positive performance of our trading operation allowed us to continue
Employee at Comayagua Plant, Caribbean and Central America Region
consolidating a supply network that reached 36 destinations supplied from 20 origins. In French Guiana, we launched the Argos Brand and participated in the Ariane 6 Space Platform project and developed the road binding technology that we will replicate in all of our operations throughout our different geographies.
The implementation of our BEST program in this region resulted by a higher reliability factor by 20 basis points for the kiln in Honduras, a reduction of the clinker-to-cement factor of 150 basis points and an optimization of our best-in-class maintenance expenses in the region, which is translated into higher efficiencies and savings in the production processes.
In the region, as in every other operation, we continue advancing in our commitment for best practices in terms of Safety and Occupa-tional Health with our program I Promise. As a result, the frequency and severity indexes improved 12.6% and 47.5%, respectively, in regards to 2015.
DESTINATIONS FROM 20 SOURCES, THANKS TO OUR CONSOLIDATED TRADING AND SUPPLY NETWORK
IN THIS REGION WE SERVED
3619
Man
agem
ent
Rep
ort
EMPLOYEES AND OPERATIONS THAT SEEK SOCIAL DEVELOPMENT
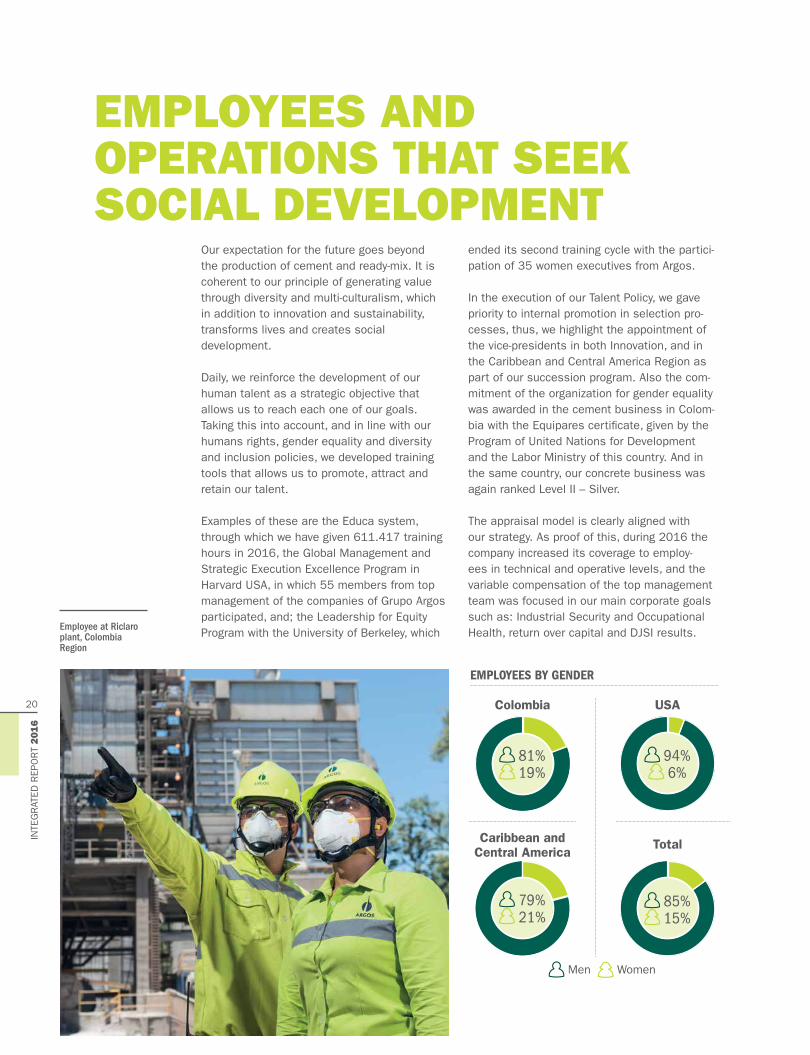
Our expectation for the future goes beyond the production of cement and ready-mix. It is coherent to our principle of generating value through diversity and multi-culturalism, which in addition to innovation and sustainability, transforms lives and creates social development.
Daily, we reinforce the development of our human talent as a strategic objective that allows us to reach each one of our goals. Taking this into account, and in line with our humans rights, gender equality and diversity and inclusion policies, we developed training tools that allows us to promote, attract and retain our talent.
Examples of these are the Educa system, through which we have given 611.417 training hours in 2016, the Global Management and Strategic Execution Excellence Program in Harvard USA, in which 55 members from top management of the companies of Grupo Argos participated, and; the Leadership for Equity Program with the University of Berkeley, which
ended its second training cycle with the partici-pation of 35 women executives from Argos.
In the execution of our Talent Policy, we gave priority to internal promotion in selection pro-cesses, thus, we highlight the appointment of the vice-presidents in both Innovation, and in the Caribbean and Central America Region as part of our succession program. Also the com-mitment of the organization for gender equality was awarded in the cement business in Colom-bia with the Equipares certificate, given by the Program of United Nations for Development and the Labor Ministry of this country. And in the same country, our concrete business was again ranked Level II – Silver.
The appraisal model is clearly aligned with our strategy. As proof of this, during 2016 the company increased its coverage to employ-ees in technical and operative levels, and the variable compensation of the top management team was focused in our main corporate goals such as: Industrial Security and Occupational Health, return over capital and DJSI results.Employee at Riclaro
plant, Colombia Region
Colombia USA
Caribbean and Central America
Men Women
Total
81% 19%
94% 6%
79% 21%
85% 15%
EMPLOYEES BY GENDER
INTE
GR
ATED
REP
OR
T 2016
20

ACHIEVEMENTS AND RECOGNITIONS
Among other achievements during the year, we highlight the LEED Certification received by the Argos Innovation Center in the BD+C category (Building Design+Construction), making it, the first project in Latin America to receive 64 points in this category by the US Green Building Council.
Also, and for the fourth consecutive year, Argos was included in the Sustainability Yearbook of RobecoSAM, and for the first time we received the Gold Class distinction thanks to the best practices and the results obtained in the Dow Jones 2016. Likewise, the company was included in the emerging market category as a member of the FTSE4good, which is not only used by inves-tors for decision making, but also is one of the three more important sustainable stock indexes in the global market.
Additionally, the company received the IR recogni-tion, granted by the Bolsa de Valores de Colom-bia (Colombia Stock Market) due to the best practices regarding relations with investors and the clearness and transparency of information provided to the market and shareholders.
At the end of the year, the Corporate Reputation Business Monitor, Merco, in Colombia, ranked Argos as the fourth Colombian company with the best reputation due to its economic and financial results, quality of its value proposition, internal
reputation, ethical and corporate responsibility, international dimension and innovation. The Shared Service Center started operations in No-vember, looking forward to standardize processes and create synergies. It will allow us to achieve savings of around USD 3.5 million per year.
Cementos Argos is a company that recognizes the need to transform and reinvent itself constantly to face the challenges of a dynamic market. In this sense, we obtained 15.8% of our consolidated revenues from innovation and had 33 new validated ideas in 2016 through Ideaxion, our innovation program.
We also want to that as proof of, our commit-ment to share the best practices and actions with all our stakeholders, in 2016 we made the first recognition event in our supply chain.
Argos Center for Innovation, Medellin, Colombia
In 2016
956 employees actively participated in our innovation management platform
IDEAXION
294Received ideas
54Approved
33Validated
20Implemented
21
Man
agem
ent
Rep
ort

TO CONCLUDEThe geographic diversification of our operations is one of our main strengths, which adds to a balanced, flexible and efficient capital struc-ture, and a clear strategy, which will allow us to continue growing in the long-term adding value to our stakeholders.
Thanks to the high performance of the human talent of Argos, we will continue to consolidate our privileged network in the US, accompany the infrastructure transformation of Colombia and continue capturing growth opportunities in the Caribbean and Central America.
We have good prospects for 2017, a year in which our main objective will be to position ourselves as a highly efficient player, in all the
markets where we are present, through the implementation of each pillar of BEST. This will allow us, not only to face the challenges of the industry, but also to reach our expansion and consolidation goals in the Americas.
Thus, we will continue to seek new growth opportunities to add value for the shareholders, customers, communities, employees, suppliers and other stakeholders.
Thank you for joining us through this path, which we will continue to follow with strong and concrete steps to bring Green Light of progress and development to all countries and territo-ries where we operate!Employees at
Harleyville, US Region
INTE
GR
ATED
REP
OR
T 2016
22

LEGAL AFFAIRSWith regards to the legal affairs, we report that in 2016, there were no important operations affecting partners or managers.
The detail of the operations carried out with associates are shown in notes No. 37 and 41 of the separate and consolidated financial statements and reports, respectively The special report referred to in Article 29 of Law 222, 1995 is on the USB adjoint in with this report. The summary of the operations referred to in the third numeral of Article 446 of the Code of Commerce can be read in the brochure, and the detail of each of these operations can also be found on the USB or on the web page for investors www.argos.co/ir. It is important to highlight that this document was part of the information that was available to shareholders during the period provided by law for the right of inspection.
The company has strictly complied with the rules governing intellectual property and copyright, for which it has designed and observed the policies and the necessary controls to ensure compliance and the support of these applications are kept.
Also, the company has strictly complied with the personal data protection law. Likewise, we put on record that Argos did not interfere with the free circulation of the invoices issued by vendors or suppliers.
The effectiveness of the established controls in the company and the existing systems have been verified and satisfactorily evaluated for the purpose of the disclosure and control of the financial information, finding that they function properly.
In 2016, we continued with the implementation of the changes made to the Anti-Money Laundering and Combating the Financing of Terrorism Self-Control and Management System (AML/CFT SCMS), contained in the manual approved by the Board of Directors, and binding to Cementos Argos and its subsidiary companies.
As part of this implementation, employees and suppliers were trained. The effectiveness of the associated controls in the different processes also validated.
In 2016, we complied with reporting to the Co-lombian Financial Information and Analysis Unit (or UIAF, its Spanish acronym) for the companies required to do so, as well as the compliance officer’s reports to the Board of Directors.
The judicial and administrative processes, and in general, the whole juridical situation of the company, resulting from the above mentioned processes, have developed normally without adverse judgement with significant impact.
Events post-2016: Continuing with the non-strategic asset disin-vestment plan, we continued with the process of divesting most of our Bancolombia shares package, reducing our participation from 4% in 2016 to 0.54% at the end of January 2017.
Cementos Argos, through its subsidiary Wetvan Overseas Ltd., acquired all of the shares of the company Essroc San Juan Inc., which operates a business of clinker and cement production in Puerto Rico. The transaction was made for an amount of around USD 8 million and the seller was Essroc Cement Corp.
23
Man
agem
ent
Rep
ort


01Our Purpose
This chapter refers to our Intellectual Capital
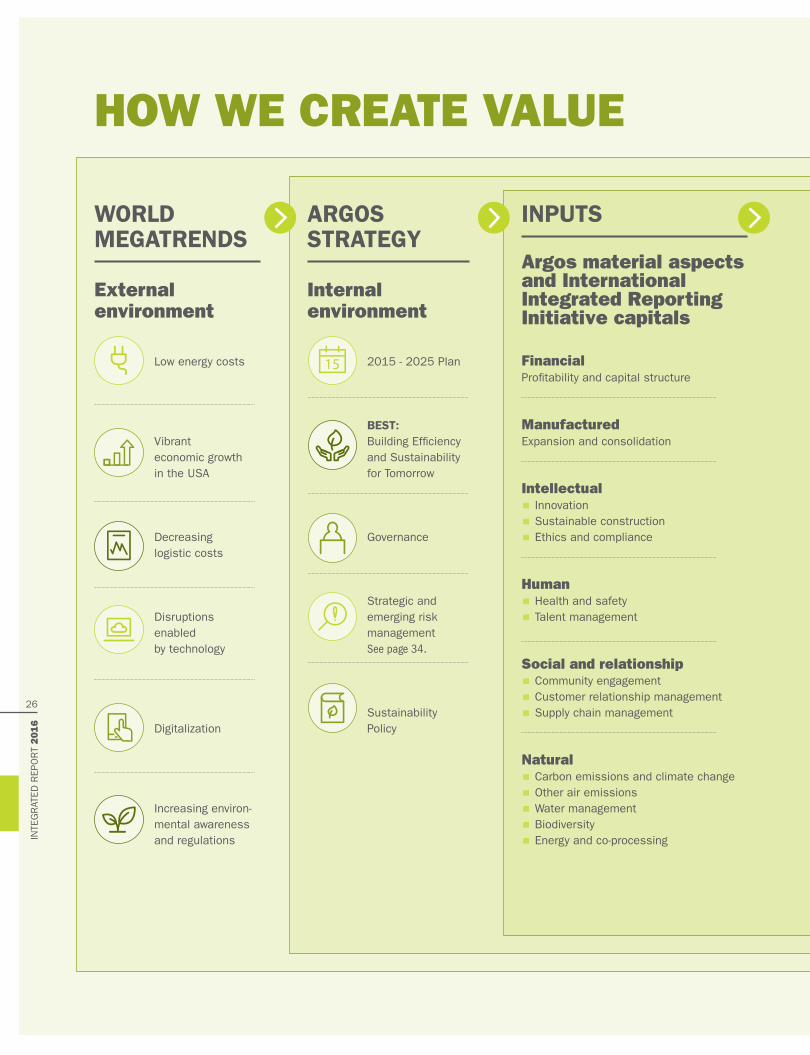
HOW WE CREATE VALUE
WORLD MEGATRENDS
External environment
Low energy costs
Vibrant economic growth in the USA
Decreasing logistic costs
Disruptions enabled by technology
Digitalization
Increasing environ-mental awareness and regulations
ARGOS STRATEGY
Internal environment
2015 - 2025 Plan
BEST: Building Efficiency and Sustainability for Tomorrow
Governance
Strategic and emerging risk management See page 34.
Sustainability Policy
INPUTS
Argos material aspects and International Integrated Reporting Initiative capitals
Financial Profitability and capital structure
Manufactured Expansion and consolidation
Intellectual · Innovation
· Sustainable construction
· Ethics and compliance
Human · Health and safety
· Talent management
Social and relationship · Community engagement
· Customer relationship management
· Supply chain management
Natural · Carbon emissions and climate change
· Other air emissions
· Water management
· Biodiversity
· Energy and co-processingINTE
GR
ATED
REP
OR
T 2016
26
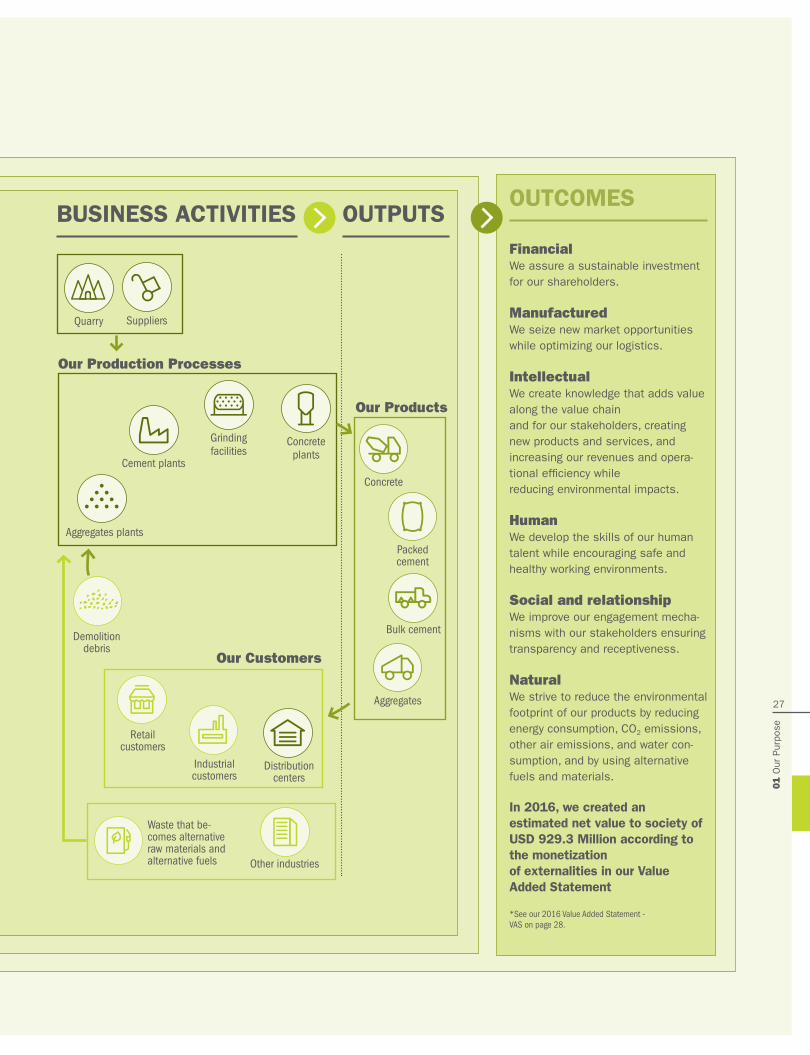
BUSINESS ACTIVITIES OUTPUTSOUTCOMES
Financial We assure a sustainable investment for our shareholders.
Manufactured We seize new market opportunities while optimizing our logistics.
Intellectual We create knowledge that adds value along the value chain and for our stakeholders, creating new products and services, and increasing our revenues and opera-tional efficiency while reducing environmental impacts.
HumanWe develop the skills of our human talent while encouraging safe and healthy working environments.
Social and relationshipWe improve our engagement mecha-nisms with our stakeholders ensuring transparency and receptiveness.
NaturalWe strive to reduce the environmental footprint of our products by reducing energy consumption, CO2 emissions, other air emissions, and water con-sumption, and by using alternative fuels and materials.
In 2016, we created an estimated net value to society of USD 929.3 Million according to the monetization of externalities in our Value Added Statement
*See our 2016 Value Added Statement - VAS on page 28.
Quarry
Cement plants
Concrete plants
Grinding facilities
Concrete
Bulk cement
Aggregates
Distribution centers
Retail customers
Demolition debris
Waste that be-comes alternative raw materials and alternative fuels Other industries
Industrial customers
Packed cement
Aggregates plants
Suppliers
Our Production Processes
Our Products
Our Customers
27
01 O
ur P
urpo
se
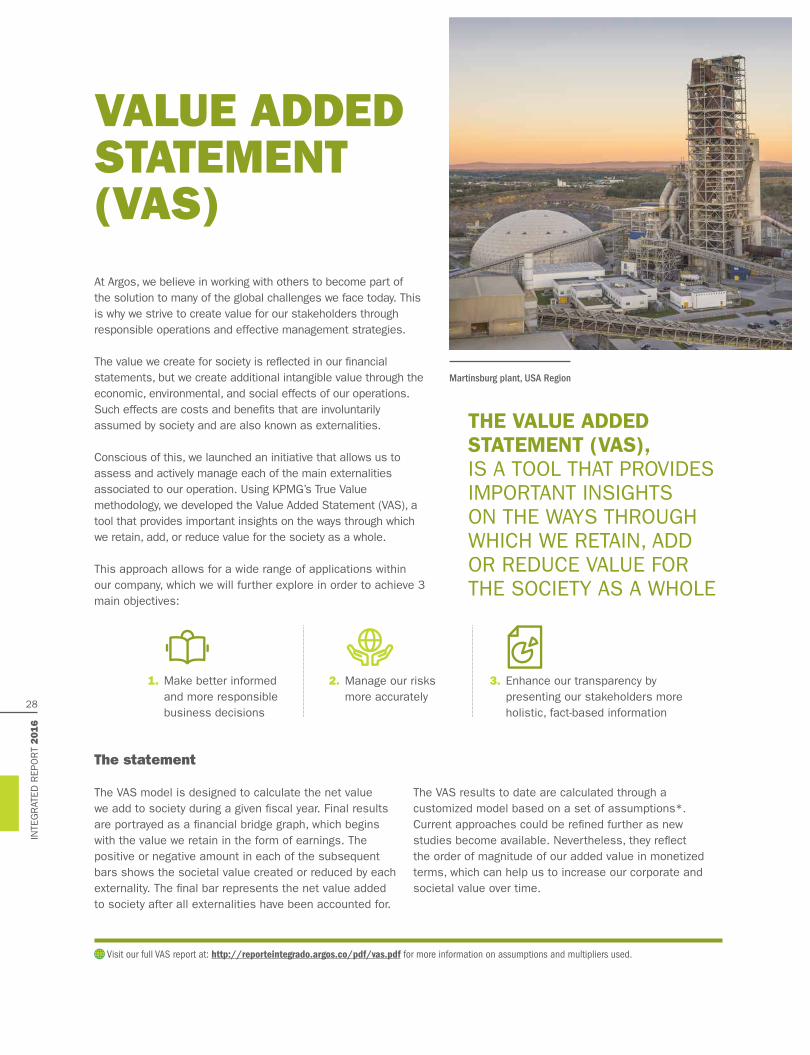
At Argos, we believe in working with others to become part of the solution to many of the global challenges we face today. This is why we strive to create value for our stakeholders through responsible operations and effective management strategies.
The value we create for society is reflected in our financial statements, but we create additional intangible value through the economic, environmental, and social effects of our operations. Such effects are costs and benefits that are involuntarily assumed by society and are also known as externalities.
Conscious of this, we launched an initiative that allows us to assess and actively manage each of the main externalities associated to our operation. Using KPMG’s True Value methodology, we developed the Value Added Statement (VAS), a tool that provides important insights on the ways through which we retain, add, or reduce value for the society as a whole.
This approach allows for a wide range of applications within our company, which we will further explore in order to achieve 3 main objectives:
1. Make better informed and more responsible business decisions
2. Manage our risks more accurately
3. Enhance our transparency by presenting our stakeholders more holistic, fact-based information
VALUE ADDED STATEMENT (VAS)
Visit our full VAS report at: http://reporteintegrado.argos.co/pdf/vas.pdf for more information on assumptions and multipliers used.
Martinsburg plant, USA Region
The statement
The VAS model is designed to calculate the net value we add to society during a given fiscal year. Final results are portrayed as a financial bridge graph, which begins with the value we retain in the form of earnings. The positive or negative amount in each of the subsequent bars shows the societal value created or reduced by each externality. The final bar represents the net value added to society after all externalities have been accounted for.
The VAS results to date are calculated through a customized model based on a set of assumptions*. Current approaches could be refined further as new studies become available. Nevertheless, they reflect the order of magnitude of our added value in monetized terms, which can help us to increase our corporate and societal value over time.
THE VALUE ADDED STATEMENT (VAS), IS A TOOL THAT PROVIDES IMPORTANT INSIGHTS ON THE WAYS THROUGH WHICH WE RETAIN, ADD OR REDUCE VALUE FOR THE SOCIETY AS A WHOLE
INTE
GR
ATED
REP
OR
T 2016
28

METHODOLOGYDuring 2016 we went through the following steps:
Defining the scope: Company-wide identification
of positive and negative externalities and
boundaries
Building the model:Data collection and monetiza-
tion based on research of most accurate multipliers
available to date
Gathering insights: Analysis and public disclo-
sure of key findings and planning of next
steps
Interests and dividendsImpacts on the economy related to interest and dividend payments to financial institutions and investors.
Community investment Impacts of projects on housing, community, and educational infra-structure, scholarships and others.
Alternative materials and fuelsImpacts of replacing raw materials and fuels with alternative ones, which results in avoided CO2 emissions.
TaxesImpacts on the economy associated with tax payments to the governments of the countries in which we operate.
Salaries and benefitsImpacts on the economy deriving from the remuneration of employees.
Talent developmentImpacts deriving from human capital development enhanced by training programs.
Health and safetyImpacts on workers and communities associated with occupational incidents (injuries & fatalities) and illnesses.
GHG emissionsClimate change impact through GHG emissions (Scope 1 & 2).
Air emissionsAir pollution impacts associated with Cementos Argos’ emissions of NOx, SOx and particulate matter.
Water consumptionImpacts on water scarcity caused by our water con-sumption.
BiodiversityImpacts on biodiversity via extraction operations and facilities as well as offsets and rehabilitation programs
Economic*
Social
Environmental
EXTERNALITIES
*The data used for calculating both Retained Benefit and Economic Externalities includes our recently acquired Martinsburg plant in West Virginia, USA, in line with our financial statements. Societal value created by economic externalities was corrected to reflect potential economic inefficiencies, i.e. corruption-related activities in the economy. For more information visit our full VAS report at http://reporteintegrado.argos.co/pdf/vas.pdf
29
01 O
ur P
urpo
se
Tale
nt
deve
lopm
ent
Air e
mis
sion
s
Taxe
s
Occu
patio
nal
heal
th a
nd
safe
ty
Biod
ivers
ity
Sala
ries
and
bene
fits
Com
mun
ity
inve
stm
ent
Wat
er
cons
umpt
ion
Inte
rest
s an
d di
vide
nds
GHG
emis
sion
s
Alte
rnat
ive
mat
eria
ls
and
fuel
s
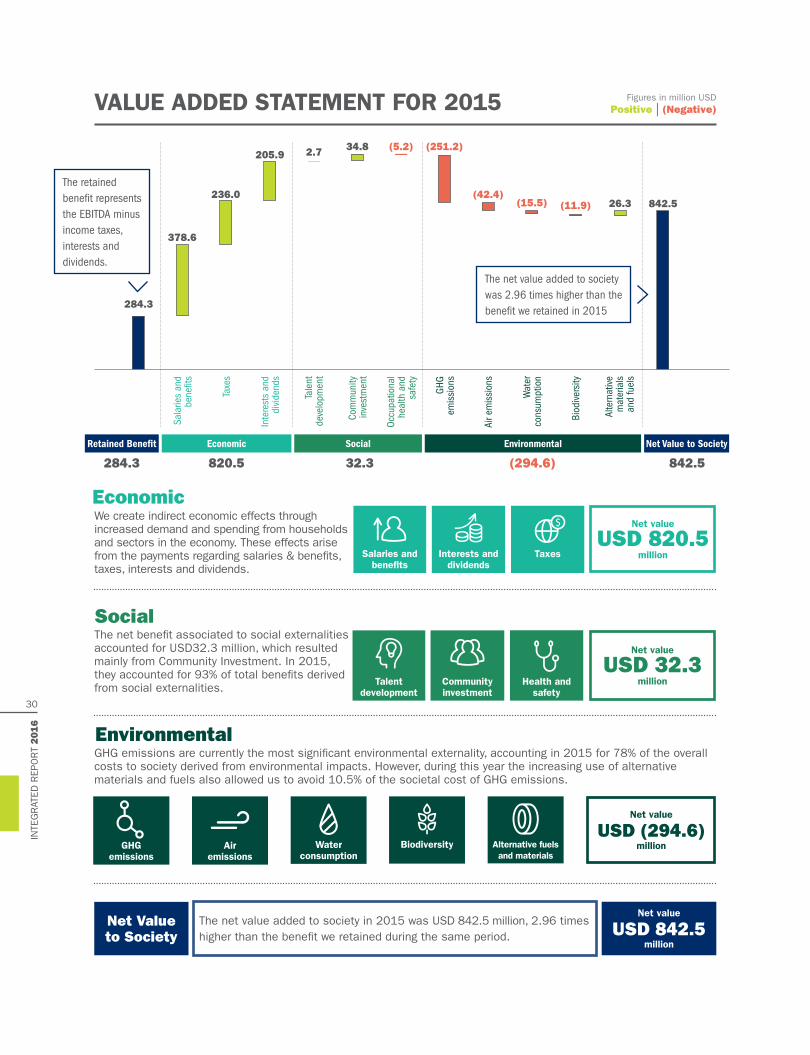
284.3
378.6
236.0
205.9 2.7 34.8 (5.2) (251.2)
(42.4)(15.5) (11.9) 842.526.3
VALUE ADDED STATEMENT FOR 2015
The net value added to society in 2015 was USD 842.5 million, 2.96 times higher than the benefit we retained during the same period.
Positive | (Negative)Figures in million USD
EconomicRetained Benefit Net Value to SocietySocial Environmental
The net value added to society was 2.96 times higher than the benefit we retained in 2015
The retained benefit represents the EBITDA minus income taxes, interests and dividends.
820.5284.3 842.532.3 (294.6)
Salaries and benefits
Talent development
Interests and dividends
Community investment
Taxes
Health and safety
Net value
USD 820.5 million
Net value
USD (294.6)million
Net value
USD 842.5million
Net value
USD 32.3 million
We create indirect economic effects through increased demand and spending from households and sectors in the economy. These effects arise from the payments regarding salaries & benefits, taxes, interests and dividends.
GHG emissions are currently the most significant environmental externality, accounting in 2015 for 78% of the overall costs to society derived from environmental impacts. However, during this year the increasing use of alternative materials and fuels also allowed us to avoid 10.5% of the societal cost of GHG emissions.
The net benefit associated to social externalities accounted for USD32.3 million, which resulted mainly from Community Investment. In 2015, they accounted for 93% of total benefits derived from social externalities.
Net Value to Society
Water consumption
Air emissions
Biodiversity Alternative fuels and materials
GHG emissions
Economic
Social
Environmental
INTE
GR
ATED
REP
OR
T 2016
30
Tale
nt
deve
lopm
ent
Air e
mis
sion
s
Taxe
s
Occu
patio
nal
heal
th a
nd
safe
ty
Biod
ivers
ity
Sala
ries
and
bene
fits
Com
mun
ity
inve
stm
ent
Wat
er
cons
umpt
ion
Inte
rest
s an
d di
vide
nds
GHG
emis
sion
s
Alte
rnat
ive
mat
eria
ls
and
fuel
s
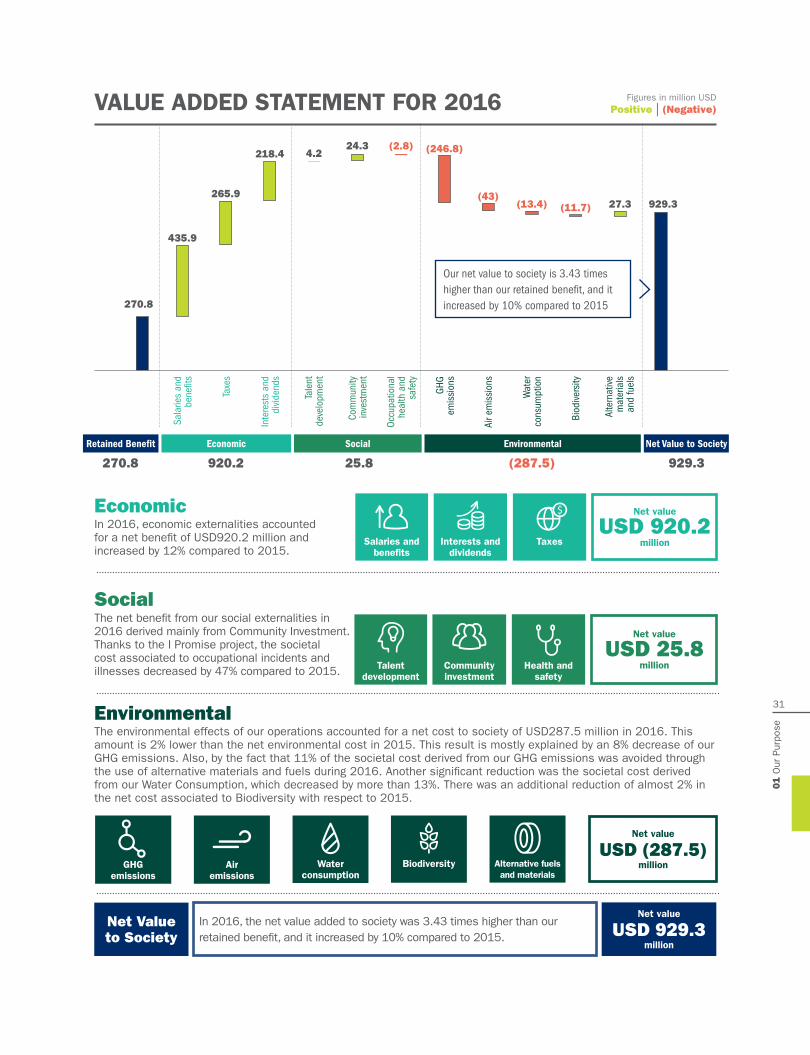
270.8
435.9
265.9
218.4 4.224.3 (2.8) (246.8)
(43)(13.4) (11.7) 929.327.3
VALUE ADDED STATEMENT FOR 2016
In 2016, the net value added to society was 3.43 times higher than our retained benefit, and it increased by 10% compared to 2015.
Positive | (Negative)Figures in million USD
EconomicRetained Benefit Net Value to SocietySocial Environmental
Our net value to society is 3.43 times higher than our retained benefit, and it increased by 10% compared to 2015
920.2270.8 25.8 929.3(287.5)
Salaries and benefits
Talent development
Interests and dividends
Community investment
Taxes
Health and safety
Net value
USD 920.2 million
Net value
USD (287.5)million
Net value
USD 929.3million
Net value
USD 25.8 million
In 2016, economic externalities accounted for a net benefit of USD920.2 million and increased by 12% compared to 2015.
The environmental effects of our operations accounted for a net cost to society of USD287.5 million in 2016. This amount is 2% lower than the net environmental cost in 2015. This result is mostly explained by an 8% decrease of our GHG emissions. Also, by the fact that 11% of the societal cost derived from our GHG emissions was avoided through the use of alternative materials and fuels during 2016. Another significant reduction was the societal cost derived from our Water Consumption, which decreased by more than 13%. There was an additional reduction of almost 2% in the net cost associated to Biodiversity with respect to 2015.
The net benefit from our social externalities in 2016 derived mainly from Community Investment. Thanks to the I Promise project, the societal cost associated to occupational incidents and illnesses decreased by 47% compared to 2015.
Net Value to Society
Water consumption
Air emissions
Biodiversity Alternative fuels and materials
GHG emissions
Economic
Social
Environmental31
01 O
ur P
urpo
se

BUILDING EFFICIENCY AND SUSTAINABILITY FOR TOMORROW: BEST
OUR MANAGEMENT APPROACH
What is BEST? Added value to the company
Launched in 2016, BEST is an efficiency accelerator initiative that seeks to achieve organizational excel-lence and competi-tiveness.
The main purpose of BEST is to generate a positive impact on our productivity and cost reduction throughout our operations. It seeks to continuously make our busi-ness model more efficient with a clear focus on return on capital employed.
BEST is a key element in our strategy that will allow us to increase competi-tiveness in the long run in order to keep generating value for all our stakeholders.
Added value to society
Governance BEST has a governance structure led by our CEO and our Executive Committee.
Leading teams Support teams
Suppliers Argos Clients SocietyVALUE CHAIN BOUNDARIES
Leading Committee Articulation Committee Project Teams Change Management
Steering Committee BEST Manager
Team Leaders Consultants
Team Leaders Project Management Office
BEST Manager Sponsors
Consultants
Project Teams
1 2 3 4
5
BEST
Operational trans-formation
Administrative synergies
Optimization of non-operational
assets
Implementation of new and lean
technologies
Alternative fu-els use
Cost reduction
Productivity Operations
INTE
GR
ATED
REP
OR
T 2016
32

2016 PERFORMANCE
Operational transformation Optimize of our network to concentrate production in the most efficient dry process plants.
Implementation of new and lean technologies Expand our production capacity, to improve our clinker-to-cement ratio and optimize cost per ton.
Administrative synergies Achieve economies of scale, integrate and standardize processes to achieve efficiency and a disciplined use of resources.
Optimization of non operational assets Focus our capital on cash-flow generation of our core business, including the divestment of non-core assets.
Alternative fuels use Increase their use to reduce fossil fuels consumption contribut-ing to the environment, with the correct disposal of used tires and other urban waste. This allows us to reduce global carbon emissions and improve the cost of energy per ton.
“OUR GOAL IS TO BECOME CHAMPIONS OF EFFICENCY, WHICH IS THE ONLY WAY TO REMAIN SUSTAINABLE OVER TIME”JUAN ESTEBAN CALLE | CEO
Rioclaro plant, Colombia Region
Co-processing at Comayagua plant, Honduras, Caribbean and Central America Region
Through implementation of BEST, we aim to reduce the cost per ton by about six dollars in 2017.
33
01 O
ur P
urpo
se

Environmental Policy
Carbon Disclosure Project
Cement Sustainability Initiative
Global Compact
STRATEGIC AND EMERGING RISK MANAGEMENT
OUR MANAGEMENT APPROACH
We create value by facilitating a control and prevention environment through the Integrated Risk Management System (IRMS), which establishes a methodological framework that manages events that can affect the achievement of the company’s objectives.
1. Decrease of market share or profitability due to inefficiency in the supply chain
2. Loss of licenses or mining titles3. OH&S impacts on employees,
assets, and facilities4. Impacts on the environment5. Changes in regulations and standards6. Information security7. Effects on reputation8. Penalties and effects on reputation resulting from
investigations for competition laws9. Interaction with communities in the operations’
influence areas
10. Market risks (competition, imports, new incoming products, substitutes, and prices)
11. Country Political Risk12. Risks associated to variables
and financial management (liquidity, market, credit and exchange rate)
13. Impacts on operations by natural events14. Fraud, corruption and money laundering
and terrorism financing15. Risks associated to the supply, reliability
and variability of energy costs16. Talent, knowledge, and human rights risks when
not aligned to our business goals and needs
We evaluate impacts that our activities may have on society and the environment, encour-aging responsible behavior that contributes to sustainable stakeholder development.
Added value to the company Added value to society
Governance
Suppliers Argos Clients SocietyVALUE CHAIN BOUNDARIES
Initiatives, commitments, and policies
Board of Directors
CEO and Executive Committee
Process Owners
Facility Leaders
Internal audit managemet
Project Managers
Risk Mentors
Vice-presidents
STRA
TEG
IC R
ISKS
OHS Policy
Risk Management, Anti-fraud and Sustainability Policies
Risk-based Management Models
CEO Water Mandate
Corporate risk management
Audit, Risk and Finance Committee
102-15
INTE
GR
ATED
REP
OR
T 2016
34

Strategic risksA-R11 A-R12 A strategic risk to our company is any significant event with a potential negative impact on our strategic objectives.
Through the Integrated Risk Management System (IRMS), we per-form risk identification from a strategic perspective, which means management of risks to processes, projects, and facilities in all our operations, as well as to corporate governance, sustainability, and the continuity of operations. This focus allows us to align relevant aspects such as environmental management, communities, safety, regulations, and financial aspects, among others, with a global man-agement focus that supports the successful execution of our strategy.
Emerging risks A-RI1 A-RI2 An emerging risk is an event whose nature and conse-quences are not fully known. They are considered to happen at large-scale and arise from global trends. In this sense, we analyze and monitor them in order to be prepared and reduce the potential impacts on our business.
We have identified 14 emerging risks related to the top global trends, including climate change, innovation, demographic changes, technology, macroeconomic indicators, and new governments and their policies. We have defined their possible impacts and related opportunities for the company, and we have also created action plans that can help us prevent or mitigate them.
A-RI1 A-RI2 See full list of strategic and emerging risks: http://reporteintegrado.argos.co/our-purpose/strategic-and-emerging-risks/?lang=en
2017 GOALS · We will consolidate the strategic risk maps for Colombia, CCA, and USA.
· We will reach 65% for the intermediate stage of the maturity model proposed by our international insurance company, Sura.
· We will consolidate the risk-based management models.
· We will consolidate the emerging risks.
2016 GOAL TRACKING
We achieved a 90% completion for the basic stage of the risk management maturity model.
We worked on risk-based management models.
We developed strategic risk maps by country for the CCA and USA regions.
2016 PERFORMANCE
· Consolidation of risk-based management models for communities, mining titles, human rights, nature events, and climate change.
· Quantification of strategic risk scenarios.
· Support to the OHS management system, in the
definition and implementation of the methodology for the occupational and health risks analysis.
· Risk analysis for our main facilities including, causes, key controls, and action plans.
Employee at Roberta plant, USA Region
102-30
35
01 O
ur P
urpo
se

SUSTAINABILITY STRATEGY
EmployeesPromote the development and wellbe-ing of our employees in a global struc-ture of innovation, teamwork, respect, and environmental awareness.
Suppliers and contractorsFoster hamonious and eq-uitable relations that honor responsible labor, social, and environmental practices.
CustomersBe the best business partner to our customers by providing quality prod-ucts and services in a responsible value chain.
ShareholdersBe transparent in the management of informa-tion and seek the greatest generation of value.
AuthoritiesComply with the law and maintain good relations with different governing bodies.
CommunitiesPromote neighborly rela-tions with the communities of influence and support social development.
EnvironmentDevelop productive activi-ties in a responsible way, decreasing or offsetting the environmental impacts.
Value propositions
At Argos, sustainability is a fundamental part of our busi-ness vision. It is one of our eight strategic priorities. This approach ensures durability over time and a competitive position in a market that is becoming more dynamic, pro-ducing not only products and services that truly add value for our stakeholders and society, but also establishing a proper manner of behaving and conducting our operations in all the regions where we are present.
Sustainability Policy
102-40 102-43 We seek the sustainability of our operations through balance between revenue generation, social de-velopment, and the reduction of environmental impacts. This is possible through positive relationships with our stakeholders, our principles of good governance, and the Global Compact.
Sustainability Policy Materiality Analysis
Sustainability Strategy
RisksStrategic Priorities Opportunities Endorsements and Commitments
INTE
GR
ATED
REP
OR
T 2016
36

102-19 102-20 Our Board of Directors, as our highest governing body, has a Sustainability and Corporate Governance Committee, which oversees the implementation of the Sustainability Strategy, monitors and evaluates the organization’s performance and addresses critical and strategic developments related to sustainability issues.
The Sustainability Vice Presidency is responsible for executing the Sustainability Strategy and assuring that the Board’s guidelines on sustainability are applied throughout the organization. Additionally, our governance structure includes regional Sustainability Liaisons who are responsible for connecting corpo-rate strategies and decisions with local operations.
Quarry rehabilitation at Sogamoso plant, Colombia Region
Our Sustainability Policy reflects our commitment to na-tional and international initiatives, which include voluntary frameworks on human rights, natural resource manage-ment, and transparency.
In order to keep our sustainability strategy relevant and adequate in a changing environment, this year we will update our stakeholder prioritization, materiality analysis and Sustainability Policy.
We believe that the continuity of our business is great-ly dependent on how efficient we can be in the use of natural, financial, intellectual, social, manufactured, and human capital. Therefore, we have made our Sustainabil-ity Strategy operational by creating the BEST (Building Ef-ficiency and Sustainability for Tomorrow) Initiative, which seeks to optimize resource consumption and maximize benefits for the organization. For more information about BEST, see page 32.
Board of Directors
Corporate Sustainability Management
Regional Sus-tainability
Management
CEO and Executive Committee
102-19 102-20 Governance
102-12
102-13 To see the full list of our memberships and associations go to: http://reporteintegrado.argos.co/pdf/SustainabilityStrategy.pdf
37
01 O
ur P
urpo
se

MATERIALITY ANALYSIS 102-46 An important component of our Sustainability Strategy is the Materiality Analysis through which we identify, prioritize, and validate material topics for our organization. When we determined our material topics, social, economic and environmental impacts were taken into consideration, as well as the boundaries, positive or negative impacts, of each one of them. The level of relevance of each topic for stakeholders, as well as their associated impacts, were taken into consideration in order to
determine which topics were the most important to our organization.
Our materiality assessment, which is performed biannually, takes into consideration the opinions and interests of our stakeholders, as well as the principles and guidelines set by our Sustainability Policy, emerging and current risks and opportunities, our strategic priorities, and our commitment to national and international initiatives. The process is as follows:
IdentificationWe research national and internation-al trends and review good practices and innovative approaches. Also, we conduct a detailed peer review, map our risks and opportunities, and finally come up with a list of potential material topics.
This first step is carried out based on research of publicly available information and consultations with our stakeholders.
PrioritizationIn the prioritization phase we con-trast the company’s strategic priori-ties and commitment to national and international frameworks with the perceptions of key stakeholders, with whom we hold a series of workshops and meetings.
ValidationIn this phase, the results of the iden-tification and prioritization phases are consolidated and taken to the Executive Committee for approval.
OUR MATERIALITY ANALYSIS, TAKES INTO CONSIDERATION THE OPINIONS AND INTERESTS OF OUR STAKEHOLDERS AS WELL AS THE PRINCIPLES AND GUIDELINES SET BY OUR SUSTAINABILITY POLICY, EMERGING AND CURRENT RISKS AND OPPORTUNITIES, AMONG OTHER INPUTS.
Employees at Roberta plant, USA Region
INTE
GR
ATED
REP
OR
T 2016
38

100
90
80
70
60
50
40
30
20
10
010 5030 70 9020 6040 80 100
Relevance for Argos, the industry, and international initiatives (x)
Rele
vanc
e fo
r our
sta
keho
lder
s (y
)Ve
ry re
leva
nt
Very relevant
Economic / Social / Environmental
Innovation
Energy and Co-processing
Profitability and Capital Structure
Sustainable Construction and Materials
Supplier Development and Management
CO2 Emissions and Climate Change
Expansion and Consolidation
Water Management
Ocupational Health and Safety
Talent Management
Customer Relationship Management
Compliance
Community Engagement
Biodiversity
Other Air Emissions
Material topics
Operation Models Standardization
Human Rights
Antitrust
Fight Against Fraud, Corruption, Money Launde-ring and Terrorism Financing
Waste Management
Economic Impact
Product Safety and Quality
Political Contributions
Other relevant topics
102-47
39
01 O
ur P
urpo
se

SUSTAINABLE DEVELOPMENT GOALS - SDGs
As part of our commitment to the world’s leading sustainability initia-tives, this year we began incorporat-ing the SDGs into our sustainability strategy. Through a participative pro-cess in which more than 40 employ-ees from all of our regions participat-ed, we identified and prioritized the SDGs that we will be addressing as a company in upcoming years.
We firmly believe that our organization can contribute to the achievement of the goals of Decent Work and Economic Growth; Industry, Innovation and Infrastructure; Sustainable Cities and Communities and Climate Action. On the other hand, we have found that these four SDGs, are perfectly aligned with our current sustainabil-ity strategy, which reinforces the
commitment to contributing to society by building dreams that transform the lives of people.
We are aware of the interdependence and the importance of all 17 SDGs, and we are sure that by focusing on the four prioritized SDGs we will be able to create an indirect impact on all SDGs.
In 2017, we will continue to align the SDGs with our strategy and focus on specific goals for each of the four SDGs to which we are committing. Fur-thermore, we will set a specific target for each goal and determine the KPIs that will allow us to measure our prog-ress. We will develop action plans for the short, medium and long term that will allow us to meet the targets set.
Argos Center for Innovation, Medellin, Colombia
INTE
GR
ATED
REP
OR
T 2016
40
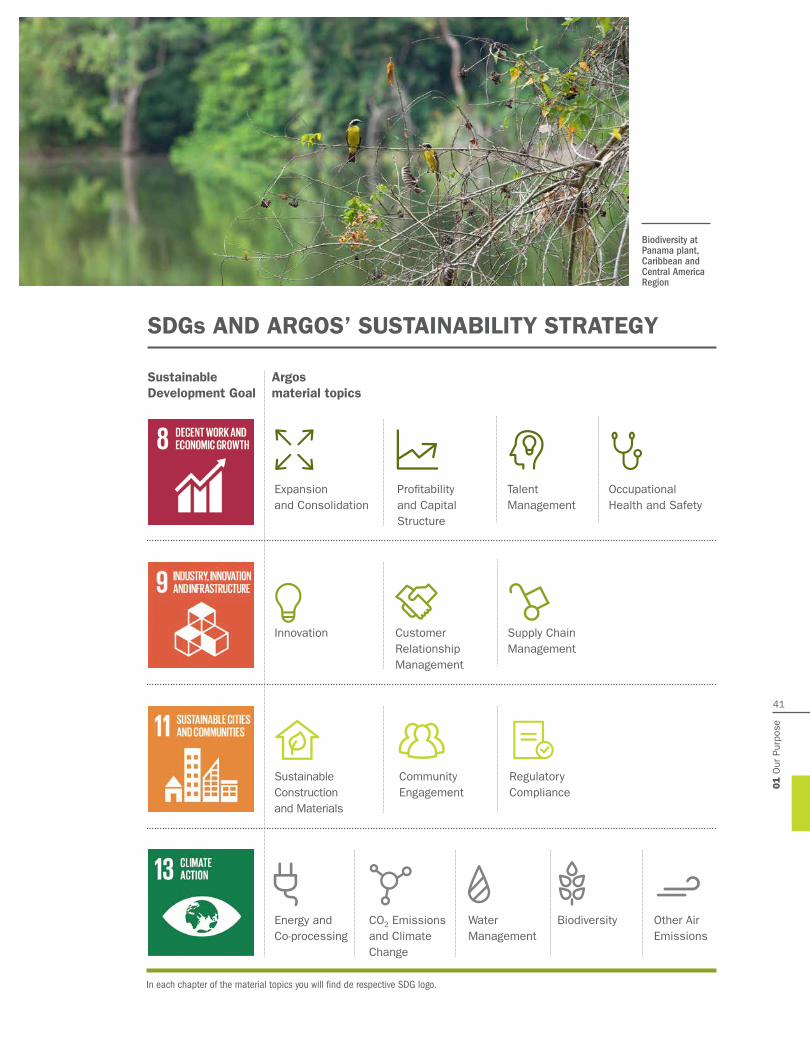
Biodiversity at Panama plant, Caribbean and Central America Region
SDGs AND ARGOS’ SUSTAINABILITY STRATEGY
Energy and Co-processing
Expansion and Consolidation
Talent Management
Profitability and Capital Structure
Occupational Health and Safety
Innovation
Sustainable Construction and Materials
Customer Relationship Management
Community Engagement
Supply Chain Management
Regulatory Compliance
BiodiversityWater Management
Other Air Emissions
CO2 Emissions and Climate Change
Argos material topics
Sustainable Development Goal
In each chapter of the material topics you will find de respective SDG logo.
41
01 O
ur P
urpo
se
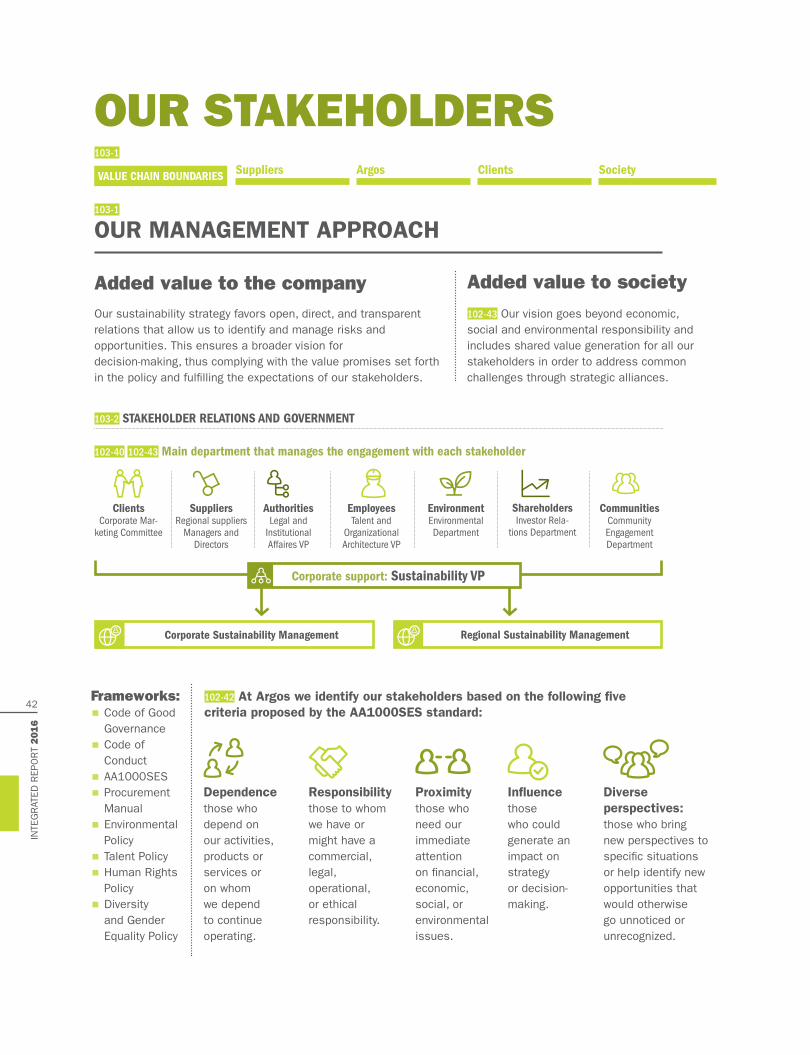
OUR STAKEHOLDERS
OUR MANAGEMENT APPROACH
Added value to the company Our sustainability strategy favors open, direct, and transparent relations that allow us to identify and manage risks and opportunities. This ensures a broader vision for decision-making, thus complying with the value promises set forth in the policy and fulfilling the expectations of our stakeholders.
102-42 At Argos we identify our stakeholders based on the following five criteria proposed by the AA1000SES standard:
102-43 Our vision goes beyond economic, social and environmental responsibility and includes shared value generation for all our stakeholders in order to address common challenges through strategic alliances.
Frameworks: · Code of Good Governance
· Code of Conduct
· AA1000SES
· Procurement Manual
· Environmental Policy
· Talent Policy
· Human Rights Policy
· Diversity and Gender Equality Policy
Added value to society
103-2 STAKEHOLDER RELATIONS AND GOVERNMENT
Dependencethose who depend on our activities, products or services or on whom we depend to continue operating.
Responsibilitythose to whom we have or might have a commercial, legal, operational, or ethical responsibility.
Proximitythose who need our immediate attention on financial, economic, social, or environmental issues.
Influencethose who could generate an impact on strategy or decision-making.
Diverse perspectives:those who bring new perspectives to specific situations or help identify new opportunities that would otherwise go unnoticed or unrecognized.
102-40 102-43 Main department that manages the engagement with each stakeholder
ClientsCorporate Mar-
keting Committee
EnvironmentEnvironmental Department
SuppliersRegional suppliers
Managers and Directors
ShareholdersInvestor Rela-
tions Department
AuthoritiesLegal and
Institutional Affaires VP
EmployeesTalent and
Organizational Architecture VP
CommunitiesCommunity Engagement Department
Corporate support: Sustainability VP
103-1
103-1
Suppliers Argos Clients SocietyVALUE CHAIN BOUNDARIES
Corporate Sustainability Management Regional Sustainability Management
INTE
GR
ATED
REP
OR
T 2016
42
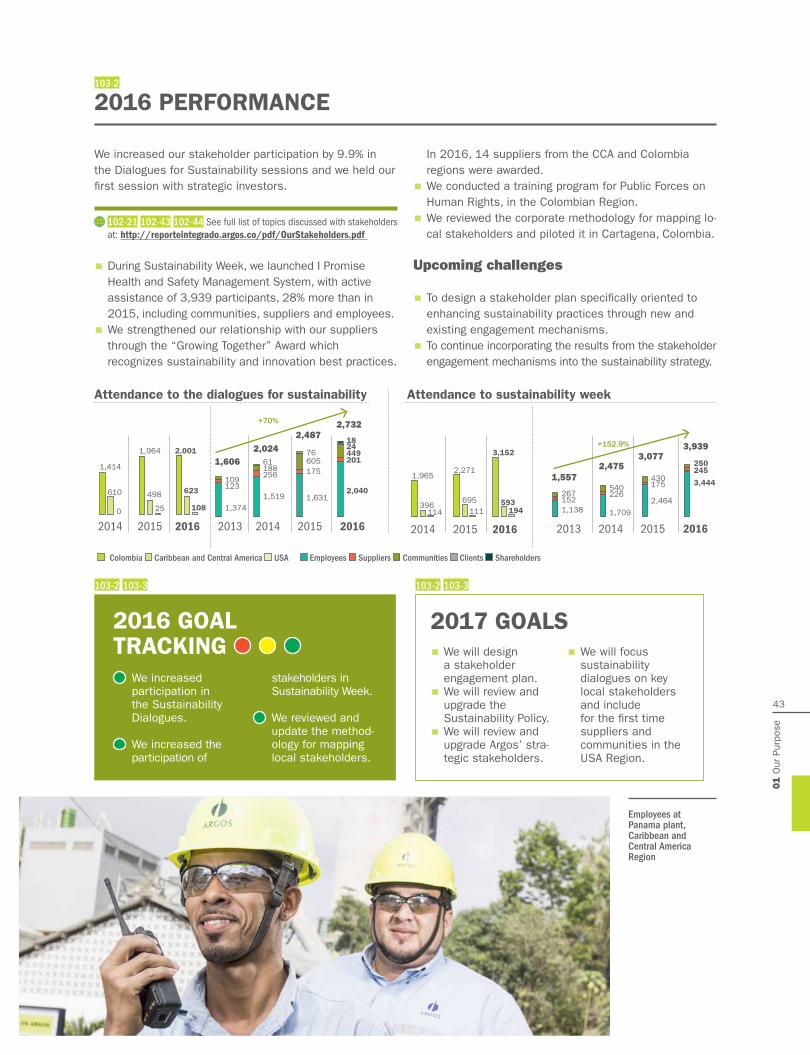
2017 GOALS · We will design a stakeholder engagement plan.
· We will review and upgrade the Sustainability Policy.
· We will review and upgrade Argos’ stra-tegic stakeholders.
· We will focus sustainability dialogues on key local stakeholders and include for the first time suppliers and communities in the USA Region.
2016 GOAL TRACKING
We increased participation in the Sustainability Dialogues.
We increased the participation of
stakeholders in Sustainability Week.
We reviewed and update the method-ology for mapping local stakeholders.
2016 PERFORMANCE
We increased our stakeholder participation by 9.9% in the Dialogues for Sustainability sessions and we held our first session with strategic investors.
102-21 102-43 102-44 See full list of topics discussed with stakeholders at: http://reporteintegrado.argos.co/pdf/OurStakeholders.pdf
· During Sustainability Week, we launched I Promise Health and Safety Management System, with active assistance of 3,939 participants, 28% more than in 2015, including communities, suppliers and employees.
· We strengthened our relationship with our suppliers through the “Growing Together” Award which recognizes sustainability and innovation best practices.
In 2016, 14 suppliers from the CCA and Colombia regions were awarded.
· We conducted a training program for Public Forces on Human Rights, in the Colombian Region.
· We reviewed the corporate methodology for mapping lo-cal stakeholders and piloted it in Cartagena, Colombia.
Upcoming challenges
· To design a stakeholder plan specifically oriented to enhancing sustainability practices through new and existing engagement mechanisms.
· To continue incorporating the results from the stakeholder engagement mechanisms into the sustainability strategy.
103-2
103-2 103-3 103-2 103-3
Colombia Caribbean and Central America USA Employees Suppliers Communities Clients Shareholders
Employees at Panama plant, Caribbean and Central America Region
20162016 20152015 20142014
3,1522,001
2,271
1,964
1,9651,414
593623
695498
396
610
194108
2016
3,444
245250
11125
20142013
1,5191,374
256123
188109
61
2015
2,464
175430
1140
2015
1,631
17560576
20142013
1,7091,138
226152
540
+152.9%
+70%
267
Attendance to the dialogues for sustainability Attendance to sustainability week
2016
2,040
2014492418
3,939
2,7322,487
2,0241,606 3,077
2,4751,557
43
01 O
ur P
urpo
se

CORPORATE GOVERNANCE
OUR MANAGEMENT APPROACH
Added value to the company Our corporate governance ensures accountability at every level through an efficient decision-making process that is transparent to all stakeholders, preventing potential conflicts and providing mechanisms for their resolution.
Our corporate governance practices guarantee that our interactions with all our stakeholders take place in accordance with the highest standards of integrity, transparency, respect, and equality.
Added value to society
Upcoming challenges
To maintain the Colombian Stock Exchange IR Seal and the Colombian Financial Superintendence Known and Recurring Issuer certification.
Suppliers Argos Clients SocietyVALUE CHAIN BOUNDARIES
102-26 Initiatives, commitments, and policies
New York Exchange (NYSE)
Latin American Companies Circle
Organization for Economics Cooperation and Development (OECD)
Code of Good Governance
Code of Business Conduct
Sustainability Policy
Human Rights Policy
Global Compact
Executive Committee at Panama
INTE
GR
ATED
REP
OR
T 2016
44

102-18 102-19 102-20 102-22 Governance Structure
BOARD OF DIRECTORS
GENERAL SHAREHOLDER MEETING
EXECUTIVE COMMITTEE
PRESIDENCYChairmanJORGE MARIO VELÁSQUEZ
· Audit, Finance, and Risks Committee 3 members
· Appointments and Remunerations Committee 2 members
· Sustainability and Corporate Governance Committee 2 members
JUAN ESTEBAN CALLE CEOCommittees: · Finance and Digital Transformation · Governance and Procurement · Energy · Talent · Marketing · Innovation
MARÍA ISABEL ECHEVERRI Sustainability VPCommittees: · Energy · Talent
CAMILO RESTREPO CCA Regional division VP
ERIC FLESCH US Regional Division VP
TOMÁS RESTREPO COL Regional Division VPCommittees: · Finance and Digital
Transformation · Governance and Procurement · Energy · Talent · Marketing · Innovation
JUAN LUIS MÚNERA Legal and Corporate Affairs VPCommittees: · Governance and Procurement · Marketing
JORGE IGNACIO ACEVEDO Talent and Organizational Structure VPCommittees: · Governance and Procurement · Talent
CARLOS HORACIO YUSTY Finance VPCommittees: · Finance and Digital Transformation · Energy · Innovation
LUCAS MORENO Innovation VPCommittees: · Energy · Talent · Innovation
VICTOR LIZARRALDE Technical Matters VPCommittees: · Energy · Innovation
CEOJUAN ESTEBAN CALLE
· Investor Relations Manager
· Audit Manager
· Risk Manager
In 2016, we implemented the changes we had introduced in our Code of Good Governance in 2015. We continued with the construction of policies that complement those amendments in order to guarantee compliance with the highest industry standards in the corporate governance field. Some of the measures that were implemented were:
In recognition of our high transparency, compliance, and corporate gover-nance stan-dards, we were awarded the Co-lombian Stock Exchange’s IR Seal for the second year in a row, and we were certified by the Colombian Financial Super-intendence as a Known and Recurring Issuer for the third year in a row.
The General Shareholder Meeting is the highest corporate body constituted by shareholders in the company. The ordinary meeting must be held once a year and as many extraordi-nary meetings should be held as required for adequate fulfillment of all the duties as-signed to it by the Corporate Bylaws and the Code of Good Governance.
· A minimum deadline of 30 calendar days to call regular meetings of the General Assembly of Shareholders and 15 calendar days for extraordinary meetings.
· Creation of mechanisms that allow shareholders to propose agenda items.
· New rules for the Company’s securities negotiation by directors, senior management, and employees.
· Update of the Board and its committees’ duties.
· Consolidation of the supporting committees of the Executive Committee.
Learn more about the compensation plan of the Executive Committee: http://reporteintegrado.argos.co/pdf/CorporateGovernance.pdf
45
01 O
ur P
urpo
se

BOARD OF DIRECTORS
102-23 102-27 Seven non-executive members compose our Board of Directors. They all have skills and experience related to economic, environmental, and/or social issues, and none of the members are shareholders of a major supplier or customer.
The minimum required attendance for Board of Directors sessions is 90 percent, and the average during 2016 was 92.38%.
1JORGE MARIO VELÁSQUEZ ARISTIZÁBAL
Grupo Argos S. A. | CEOPatrimonial | Non ExecutiveMember since March 2016
2CAMILO JOSÉ ABELLO VIVES
Grupo Argos S. A. | VP. Corporate AffairsPatrimonial | Non ExecutiveMember since 2012 (reelected in 2014)
3CECILIA RODRÍGUEZ GONZÁLEZ RUBIO
Corporación Bioparque | CEOIndependent | Non ExecutiveMember since 2012 (reelected in 2014)
Board Committee
Appointments and Remunerations
Sustainability and Corporate Governance
Sustainability and Corporate Governance
Number of memberships to other Boards of Directors
· Cementos Argos S.A.
· Grupo de Inversiones Suramericana S.A.
· Celsia S.A.
· Compas S.A.
· Odinsa S.A.
· Cementos Argos S.A.
· Compas S.A.
· Pactia S.A.S.
· Cementos Argos S.A.
· Bioparque Proyectos S.A.S.
· Fundación Botánica y Zoológica de Barranquilla.
Sustainability skills
Yes Yes Yes
Attended board meetings
14/15* 14/15 14/15
Ability, experience, and expertise Diversity
DIRECTOR
Inde
pend
ence
Expe
rienc
e on
oth
er b
oard
s
Risk
s
Inte
rnal
con
trol
Corp
orat
e fin
ance
Com
mer
cial
issu
es
Indu
stry
Cris
is m
anag
emen
t
Lega
l iss
ues
Expe
rienc
e in
ESG
issu
es
Gove
rnan
ce/P
ublic
Pol
icy
Inte
rnat
iona
l
Plac
e of
orig
in
Gend
er
Jorge Mario Velásquez X X X X X X X X Colombia M
Camilo José Abello Vives X X X X X X X X Colombia M
Cecilia Rodríguez González X X X X X X X Colombia F
Claudia Betancourt Azcárate X X X X X X X X X Colombia F
León E. Teicher Grauman X X X X X X X X X X X Colombia M
Esteban Piedrahíta Uribe X X X X X X X X X X Colombia M
Carlos Gustavo Arrieta Padilla X X X X X X X Colombia M
BOARD OF DIRECTORS SKILL MATRIX
All Directors have skills allowing them to perform properly. These include the following: analytical and mana-gerial skills, a strategic view of the business, objectivity, and the ability to assess top managerial situations. In addition, they are able to understand and question financial infor-mation and business proposals and work in a global context.
*CEO averageNote: None of the Executive Directors is a shareholder of a relevant vendor / customer of the company.
NOTE: According to the previous analysis made by the Appointments and Compensation Committee of the Board, there are no gaps between the profiles of current members and those enshrined in the Code of Good Governance.
INTE
GR
ATED
REP
OR
T 2016
46
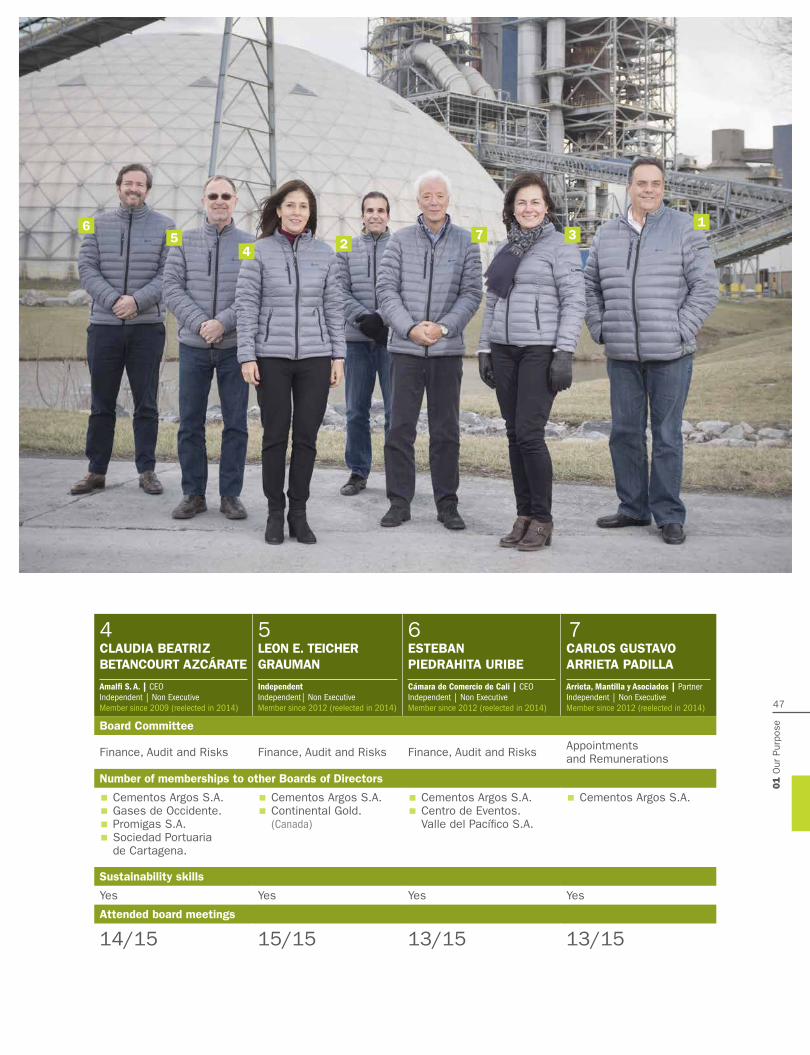
4
CLAUDIA BEATRIZ BETANCOURT AZCÁRATE
Amalfi S. A. | CEOIndependent | Non ExecutiveMember since 2009 (reelected in 2014)
5LEON E. TEICHER GRAUMAN
IndependentIndependent| Non ExecutiveMember since 2012 (reelected in 2014)
6
ESTEBAN PIEDRAHITA URIBE
Cámara de Comercio de Cali | CEOIndependent | Non ExecutiveMember since 2012 (reelected in 2014)
7CARLOS GUSTAVO ARRIETA PADILLA
Arrieta, Mantilla y Asociados | PartnerIndependent | Non ExecutiveMember since 2012 (reelected in 2014)
Board Committee
Finance, Audit and Risks Finance, Audit and Risks Finance, Audit and Risks Appointments and Remunerations
Number of memberships to other Boards of Directors
· Cementos Argos S.A.
· Gases de Occidente.
· Promigas S.A.
· Sociedad Portuaria de Cartagena.
· Cementos Argos S.A.
· Continental Gold. (Canada)
· Cementos Argos S.A.
· Centro de Eventos. Valle del Pacífico S.A.
· Cementos Argos S.A.
Sustainability skills
Yes Yes Yes Yes
Attended board meetings
14/15 15/15 13/15 13/15
625
43
17
47
01 O
ur P
urpo
se

102-35 102-36 102-37 Compensation The General Assembly of Shareholders determines the Board of Directors’ compensation, taking into account its structure, duties and responsibilities, as well as the personal and professional qualities of its members and the time they dedicate to their activity.
One of the new duties, of the General Assembly is the approval of the Boards’ Remuneration and Succession Policy. The Board started the drafting of this policy during 2016 and it is expected to
be approved by the General Assembly in an upcoming meeting.
Fixed compensation for 2014-2017 term: COP $4,500,000monthly for members of the Board of Directors.
Variable compensation for the 2014-2017 term: In addition to the above, COP 6,000,000 monthly for being part of the Board of Directors committees (does not apply to members of Grupo Argos).
102-25 Prevention and management of conflicts of interests Our Code of Business Conduct establishes clear guidelines for the prevention and management of conflict of interest. Our employees and directors are encouraged to restrain from engaging, directly or indirectly, for their on benefit or that of a third party. In situations that compete against Argos’ interests and that could affect the freedom and independence of their decisions.
Likewise, the Board of Directors is required to disclose conflicts of interest with the company through their letters of acceptance to their positions, and they, as well as all collaborators, must also disclose any potential conflict of interest on an annual basis. Furthermore, the Audit, Finance, and Risk Committee is in charge of reporting to the Board of Directors on any conflict of interest that it may be aware of.
For more detailed information please refer to: https://www.argos.co/ir/en/corporate-governance/codes For more information please refer to: https://www.argos.co/ir/en/corporate-governance/codes
102-24 Nomination and election The General Assembly of shareholders is the body responsible for electing or removing Board of Directors members and the statutory auditor; it is made up of an odd number of members large enough to ensure the proper performance of its duties, and it has no substitute members. The process to nominate and elect the Board of Directors follows the rules of the Bylaws, the Code of Good Governance, and the applicable law. First, candidates are proposed by the shareholders. Then the Appointments and Remuneration Committee reviews Candidates’ profiles to ensure fulfillment of the minimum requirements. The voting process (by slate) is held during the General Assembly every three years. Nevertheless,
directors may be freely reelected and removed by the General Assembly even before their term is over. Some of the new practices included in our Code of Good Governance are:
· Retirement of the company’s president at the age of 62.
· Establishment of a maximum age of 72 to serve on the Board of Directors.
· Classification of members of the Board of Directors as executives, independent, and patrimonial.
· For more detailed information, see the Code of Good Governance, Bylaws.
102-27 TrainingBoard of Directors are expected to undergo specific training sessions through which they are kept up to date on the Company and its subsidiaries, the business they conduct, and the risks associated to their activities. In 2016, the Board received training on sustainability issues including COP 21, the USA political outlook, business strategy, Value Added Special Products (VASP), CO2 emissions, taxes, and different social aspects.
102-28 EvaluationSince December 2015, annual evaluations are alternated yearly between external assessments and self assessments. In 2016, we began with the self evaluation process, which is intended to gather results in the first semester of 2017. The results and main findings of the 2016 self evaluation process are disclosed in the Corporate Governance Report.
See: https://www.argos.co/ir/en/corporate-governance/report-on-corporate-governance
INTE
GR
ATED
REP
OR
T 2016
48

102-22 Board committeesThere are three board committees that address spe-cific strategic issues in order to support the Board’s responsibilities. The members of each committee are appointed based upon the skills and abilities of its members. Some of the responsibilities of the Board of Directors and its support committees are:
· To promote a culture of control and risk manage-ment for the entire organization.
· To monitor issues of regulatory compliance, fraud, corruption, money laundering, and the financing
of terrorism, as well as the management of our Transparency Hotline.
· To define and advise on the adoption of diffe-rent compensation and remuneration programs, as well as assess the effectiveness of such programs.
· To review the Sustainability and Corporate Go-vernance practices implemented by the Com-pany and ensure that employees and directors’ behaviors are aligned with the Code of Business Conduct and other internal and legal regulations.
102-31 102-33 102-34 Process to communicate sustainability issues to the Board
102-30 102-29 AUDIT, FINANCE, AND RISK Responsibilities: To define the roles and responsibilities regarding internal control, risk management and evaluation, with clearly established reporting lines. It also assesses accounting procedures, management of relations with the Statutory Auditor and supervises the effectiveness of the internal control architecture and the Integrated Risk Management System (IRMS). Members: Claudia Betancourt, Esteban Piedrahita, and Leon TeicherNumber of meetings: 4Key decisions made:
· Redefining of the materiality concept for financial reporting
· Approval of the 2015 financial statements for presentation to the General Assembly
· Approval of the internal audit annual plan and its follow up
· Approval of the Corporate Risk Policy
· Strategic risks review and update
· Gap analysis on financial controls
102-32 APPOINTMENTS AND REMUNERATION Responsibilities: To determine the policies and standards for recruitment, compensation, and talent development for members of the Board of Directors and top management.Members: Carlos Gustavo Arrieta and Jorge Mario VelásquezNumber of meetings: 3Key decisions made:
· Appoitment of Innovation and CCA VPs
· Follow up on the 2016 CEO transition
· Succession policies for top managers
102-32 SUSTAINABILITY AND CORPORATE GOVERNANCEResponsibilities: To advise on the adoption, follow-up, and improvement of sustainability and corporate governance practices used within the companyMembers: Camilo Abello and Cecilia RodriguezNumber of meetings: 2Key decisions made:
· Analysis of Grupo Argos and its subsidiaries’ Relationships Policy
· Follow up on the Country Code implementation plan
· Analysis of proposals to be presented for approval by the General Assembly
· Self evaluation process of the Board’s performance
· Analysis of DJSI results
For more detailed information please refer to: https://www.argos.co/ir/en/corporate-governance/codes | https://www.argos.co/ir/en/ corporate-governance/by-laws
The main sustainability topics discussed by the Board in 2016 were:
· COP 21 and its relevance to the organization
· Analysis of the DJSI results
· Strategic risks follow up
· Health and safety KPIs follow up
These are communicated through the agenda submitted, ahead of time which is developed during the meeting, followed by presen-tations on each topic to encourage discussion and generate an informed decision by the members. In the event of an urgent situa-tion, a phone and/or emails are used to discuss the issue and make the required decisions.
49
01 O
ur P
urpo
se
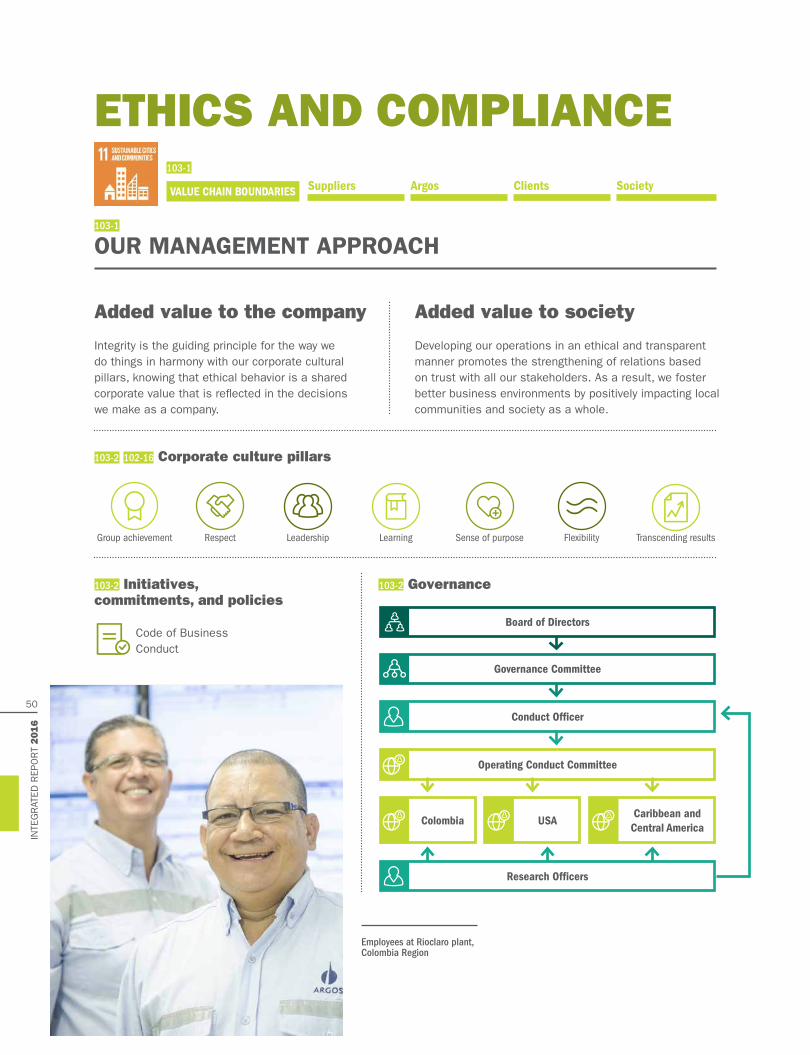
ETHICS AND COMPLIANCE
OUR MANAGEMENT APPROACH
Integrity is the guiding principle for the way we do things in harmony with our corporate cultural pillars, knowing that ethical behavior is a shared corporate value that is reflected in the decisions we make as a company.
Developing our operations in an ethical and transparent manner promotes the strengthening of relations based on trust with all our stakeholders. As a result, we foster better business environments by positively impacting local communities and society as a whole.
Added value to the company
103-2 102-16 Corporate culture pillars
Added value to society
Group achievement Respect Leadership Learning Sense of purpose Flexibility Transcending results
103-1
103-1
Suppliers Argos Clients SocietyVALUE CHAIN BOUNDARIES
103-2 Initiatives, commitments, and policies
Code of Business Conduct
103-2 Governance
Board of Directors
Governance Committee
Conduct Officer
Research Officers
Operating Conduct Committee
Colombia USACaribbean and Central America
Employees at Rioclaro plant, Colombia Region
INTE
GR
ATED
REP
OR
T 2016
50

2016 PERFORMANCE
REGULATORY COMPLIANCE
· We continued designing and structuring our Global Compliance Program, which provides the policies, guidelines, and protocols that will allow us to more efficiently manage risks associated to fraud, corruption, money laundering and financing of terrorism, as well as noncompliance with applicable antitrust legislation.
· We implemented compliance controls in some of our key operative processes, such as third party relations-hips, procurement, charitable donations, and political contributions.
· We conducted 222 training sessions on antitrust matters in all of our operations.
In 2016, we fully complied with environmental laws and laws related to the supply and use of products and services.
Our Competition Policy defines standards and guidelines for employees in relation to competitors and the market. In general, our compliance and transparency standards exceed minimum legal requirements.
206-1 Due to Colombia cement market conditions, we report on some current investigations with no final decision for Argos:
· The Colombian Superintendence of Industry and Commerce initiated an investigation on August 21, 2013, regarding five Colombian cement companies, including Argos, for alleged commission of restrictive business practices. Consequently, it also initiated an investigation regarding four of our employees. The evidentiary stage of these proceedings concluded in December 2014. We are addressing the matter with the certainty that we have always fully complied with
the law, and we are confident that Colombian authorities will ultimately recognize this. In May 2016, a request for information issued by the Superintendence of Industry and Commerce was properly answered. The legal action is pending.
· In December 2008, the Superintendence of Industry and Commerce imposed a financial penalty on Argos and two other Colombian cement companies in the amount of COP 923 million each, for alleged restrictive business practices. In the same action, the legal representative of the three companies was fined in the amount of COP 138 million. This ruling was appealed for reversal by Argos and subsequently confirmed by the Superintendence in January 2010. Argos filed a lawsuit against that ruling before the Colombian administrative jurisdiction, and in a decision issued December 3, 2012, the Administrative Court of Cundinamarca ruled that both decisions were invalid, thereby exonerating the company and the legal representative of all fines. The Superintendence of Industry and Commerce decided to appeal, and the final decision is currently pending before the State Council.
Employees from different positions have cross-functional roles and belong to different committees to ensure a transparent and ethical environment under the coordination of the Conduct Officer. Five of the nine Vice Presidents belong to the Governance Committee, which supports the Executive Committee.
The Operating Conduct Committee receives organizational reports and represents all regional areas with members who serve as research officers on different categories, such as labor relations, fraud, corruption, money laundering and financing of terrorism, communities, and conflicts of interest. The actions of these officers are transversal to the entire organization and are coordinated by the Conduct Officer, who is a high-level executive.
We are part of the Central Committee of Conduct that Grupo Argos leads and in which strategies, experiences, and good practices are aligned between the enterprises of the group.
We are signatories of the UN Anti-corruption Call to Action, an appeal from business to governments to address corruption and foster systems of good governance.
103-2
51
01 O
ur P
urpo
se

TRANSPARENCY HOTLINE
Our Transparency Hotline is a communication channel for many of our stakeholders. It allows for anonymous reporting and identifies behaviors that
contradict our Good Governance Policy and Code of Business Conduct, as well as all other company Policies and any other internal or external norms.
Transparency Hotline operation
Employee at Honduras offices, Caribbean and Central America Region
1. Reception of calls or emails by an external call center
Email: [email protected]
Colombia: 018000522021
USA: +1(888)5676629
Panama: 011008001571011*
Dominican Republic: 18001485009*
Honduras: 8002799378*
*Landline phone
2. The call center sends the case to the Research Officers according to a previous classification.
3. The Operating Conduct Committee, led by the Conduct Officer, reviews the cases.
4. The Governance and Procurement Commit-tee reviews the most relevant cases.
5. Cases are resolved and responded to, and corrective actions are taken.
103-3 102-17
INTE
GR
ATED
REP
OR
T 2016
52

2016 - 2018 GOALS
We will implement a large-scale com-pliance program.
We will expand the coverage of the training to other stakeholders outside of Colombia, including suppli-ers for CCA and USA regions.
We will structure a training and dissemination plan of the Code of Business Conduct, ensuring that the message reaches all regions and is translated to all the required languag-es.
We will audit our Transparency Hotline to improve the effectiveness of feed-back and complaint submissions.
103-2 Upcoming challenges
· To implement of the Global Compliance program in all the regions in which we operate.
· To implement the training and communications plan for compliance matters in all regions.
· To consolidate the Transparency Hotline as the official channel to receive reports related to violations of our Code of Business Conduct in the CCA and USA regions.
· To assess operations in terms of compliance risks (fraud and corruption) in the CCA Region.
· To provide trainings on the organization’s policies against fraud, corruption, asset & money laundering and financing of terrorism.
IN 2016 WE PROVIDED TRAINING ON TRANSPARENCY ISSUES TO 3,640 EMPLOYEES AND SUPPLIERS.
The totality of cases and hotline stats can be found in the Corporate Governance Compliance Report at: http://www.argos.co/ir/en/corporate-governance/report-on-corporate-governance
2016
Communities Quantity
Impacts on the environment 13
Impacts on mobility 4
Impacts on water 0
Impacts on air 0
Noise impacts 1
Impacts due to vibrations (Peace, rest, and tranquility) 4
Visual impacts 2
Damage/impacts on private property 20
Unfulfilled commitments 5
Road safety 12
Total communications received 61
Tracking of communications received in 2015 that were still open 28
Total communications addressed 89
Total communications closed 76
COMMUNICATIONS CLOSED WITH ADMINISTRATIVE OR LEGAL ACTIONS
1
2016
Labor Practices QuantityDisrespect, damage to working environment 42
Possible human rights violations, harassment 3
Possible human rights violations, respect to working / personal time balance 0
Possible human rights violations, discrimination 4
Possible human rights violations, freedom of association and collective bargaining 5
Possible human rights violations, fair compensation according to law 0
Total communications received 54
Tracking of communications received in 2015 that were still open 21
Total communications addressed 75
Total communications closed 48
COMMUNICATIONS CLOSED WITH ADMINISTRATIVE OR LEGAL ACTIONS 3
2016
Corruption QuantityGiving / receiving illegal payments 16
Undeclared conflict of interest 9
Purchasing manipulation, tenders 5
Bribery, Foreign Corruption Practices Act -FCPA 1
Total communications received in 2016 31
Tracking of communications received in 2015 that were still open 14
Total communications addressed during 2016 45
Total communications closed in 2016 27
COMMUNICATIONS CLOSED WITH ADMINISTRATIVE OR LEGAL ACTIONS 3
205-2 103-2
53
01 O
ur P
urpo
se


02Developing our Business
This chapter refers to our Financial, Manufactured, and Intellectual Capital.

PROFITABILITY AND CAPITAL STRUCTURE
OUR MANAGEMENT APPROACH
We manage capital (ordinary and preferential equity shares, short and long-term financial obligations, and ordinary bonds) with a long-term perspective, seeking to maintain a balanced, efficient and flexible capital structure to safely accompany and support the growth process of the organization and ensure its long-term sustainability.
We contribute to the growth and development of Colombia’s capital market and help to attract foreign investments that generate sustainable positive growth for all our stakeholders. The value to society derived from our economic externalities for 2016 was estimated at USD 920.2 million in our Value Added Statement - VAS. See page 28 for further details.
Added value to the company Added value to society
103-2 Initiatives, commitments, and policies
Financial Policies We seek to ensure a solid financial structure and maintain the Company’s exposure to market, liquidity, and credit risks at accept-able levels, according to the nature of operations and the defined policies as well as the exposure limits and defined attributions.
103-2 Governance
For detailed information on our financial statements see: http://reporteintegrado.argos.co/pdf/FinancialStatements.pdf
103-1
103-1
Suppliers Argos Clients SocietyVALUE CHAIN BOUNDARIES
Board of Directors
Corporate Finance Managers
and Directors
Regional Finance Managers and Directors
(USA, CCA, and Colombia)
Audit Committee
CEO and Executive Committee
Harleyville plant, USA Region
INTE
GR
ATED
REP
OR
T 2016
56

2016 PERFORMANCE
Short-term debt profile management
· Refinancing of USD 100 million from short-term debt to long-term debt. The loan has a maturity of three years.
Debt issue
· In 2016, we issued bonds for a total value of COP 400,000 million. The proceeds are to be used to pay short-term debt and improve the duration of the debt. The average duration of the debt improved from 3.9 to 4.7 years, at a minimum carry cost.
Enhancement of working capital follow-up
· Greater efforts have been made to instill a monitoring and follow-up culture in the regions.
· Implementation of supply chain finance programs in Colombia and Panama with suppliers.
that improve the cash requirements of our vendors, maintaining our cash cycle.
Martinsburg bridge loan facility
· Use of a bridge loan facility to finance the cement assets in West Virginia, USA (Martinsburg plant). The company will repay this facility with divestments of non-core assets.
· To maintain our high standards for financial excellence, contributing to efficiency and sustainability, under the umbrella of the BEST initiative framework.
See more information about BEST on page 16
DEBT PRO-FILE
41%Long-term
59%Short-term
CURRENCY DISTRIBUTION OF DEBT AND AVER-
AGE COST
29%COP 11.9% EAR
71%USD 2.81% EAR
1,500
COPprice
COLCAPpoints
Jan-16 Feb-16 Mar-16 Apr-16 May-16 Jun-16 Jul16 Aug-16 Sep-16 Oct-16 Nov-16 Dec-16
1,400
1,300
1,200
1,100
1,000
900
800
12,000
11,500
11,000
10,500
10,000
9,500
9,000
8,500
8,000
A-RE1 A-RE2 A-RE3 A-RE4 Net Debt/(EBITDA + dividends): 3.81xOptimization of financial cycle: 39.04 daysEBITDA: COP 1,652 billionEBITDA Margin: 19.40%
17% COLCAP 22% CEMARGOS 17% PFCEMARGOS
103-3
103-2
Compressed natural gas powered mixer in Houston, USA Region
SHARES PERFORMANCE
57
02 D
evel
opin
g ou
r B
usin
ess

103-2 A-X1 Initiatives, commitments, and policies
Our expansion principles are:
Defined interconnected geographical area
Strong fundamentals (positive demographics, housing deficit, and infrastructure needs)
Synergy creation and value generation
Maintenance of financial flexibility
Sector focused
Economies with different market cycles
EXPANSION AND CONSOLIDATION
OUR MANAGEMENT APPROACH
By following a disciplined expansion and consolidation strategy, we ensure value creation and profitable growth within a defined and interconnected region with positive fundamentals.
We are successfully adapting our operational model to all our acquired assets while respecting local cultures. We are also successfully increasing manufacturing efficiency and competitiveness with sustainability and innovation as our main guidelines. We support the sharing of best practices and learning from our new operations.
Added value to the company
Added value to society
103-2 Governance
103-2 Upcoming challenges
· To find assets that meet our minimum return level and adhere to our principles.
· To ensure that the Argos model is successfully adapted to local operations.
103-1
Board of Directors
CEO and Executive Committee
San Lorenzo grinding facility, Honduras, Caribbean and Central America Region
103-1
Suppliers Argos Clients SocietyVALUE CHAIN BOUNDARIES
INTE
GR
ATED
REP
OR
T 2016
58

Martinsburg plant, USA Region
2017 GOALS · We will successfully integrate our new operation.
· We will complete the divest-ment plan to reduce our leve-rage to pre-acquisition levels by selling non-strategic real estate assets and energy self generation plants.
2016 PERFORMANCE
102-10 A-X2 A-X3 Martinsburg acquisition: We acquired the Martinsburg plant in the USA Mid-Atlantic re-gion for USD 660 million. The assets include a estate-of-the-art cement plant in Martinsburg commissioned in 2009, with eight cement terminals, four of them with water access. With this acquisition, we will add 2.2 million tons to our cement capacity with a plant that complements our existing footprint:
Panama minority sale:
8 Terminals
Nearly 200 new employees
2.2 million tons of cement capacity
Potential market in the USA: around 158 million people
Transaction value USD 660 million
stake of the Panamanian operation for
We sold a
USD 126 million
20%
103-2
103-2 103-3
59
02 D
evel
opin
g ou
r B
usin
ess

CUSTOMER RELATIONSHIP MANAGEMENT
OUR MANAGEMENT APPROACH
A close relationship with our clients allows us to understand their needs and deliver compelling value propositions. Being preferred by our customers is the key metric of success and a source of long-term sustainability.
We contribute to the progress of society by offering high-quality products and services to our customers through a responsible value chain.
Added value to the company Added value to society
2016 PERFORMANCE
103-2 Upcoming challenges
· To manage new competitive dynamics in the industry.
· To actively participate in 4th Generation Infrastructure Projects in Colombia.
· To standardize the customer satisfaction metric among regions.
· To focus our efforts and resources on the tailor-made customer experience we want to provide.
· To continue working in order to become an increasingly customer-centric organization.
103-2 Initiatives, commitments, and policies
Argos Commercial Model (Go to Market Approach)
· The creation of the infrastructure business unit allowed the company to consolidate its segment leadership through a team that is exclusively dedi-cated to this purpose.
· Support for the “Construyá” Financing Scheme, which seeks to provide access to construction ma-terials for low-income families.
· The implementation of the Blueprint tool in Hondu-ras allowed us to track different KPIs across the customer experience.
· Development of a new product portfolio for concrete based on Value Added and Specialty Products.
103-1
103-2
103-2 Governance
Board of Directors
CEO and Executive Committee
Costumer, Honduras, Caribbean and Central America Region
103-1
Suppliers Argos Clients SocietyVALUE CHAIN BOUNDARIES
Business Units
Regional Marketing Directors
Customer Relationship
Teams
INTE
GR
ATED
REP
OR
T 2016
60

Countries where the survey is conducted
2017 GOALS · We will launch the Argos Brand in the USA states of West Virginia, Maryland and New York, setting up marketing function in the USA.
· We will go foward with deployment of a customer relationship management tool in the other regions.
· We will revisit the metrics we use for customer satisfaction in order to guarantee they continue reflecting our competitiveness and progress.
2016 GOAL TRACKING We strengthened brand posi-tioning in all segments and territories.
We continued and expanded the loyalty program for custom-ers in the Caribbean Region.
We established a contact center and customer service line for the Caribbean Region.
We explored new channels for Colombian retail customers.
We strengthened our value proposition and the customer information platform for the Colombian 4th Generation Infra-structure Projects.
We increased the number of proposals and initiatives for digital maketing projects.
We implemented the Custom-ers Journey Map tool.
2013 2014 2015 2016
Colombia Region 89% 93% 91% 90.8%
CCA Region 82% 89%
USA Region 90% 95% 94.6%
A-RCI1 PERCENTAGE OF REVENUE GENERATED BY RETAINED CUSTOMERS
102-44 102-43 CUSTOMER SATISFACTION
USAGoal: 82.5%
ColombiaGoal: 82.5%
2016
2016
2016
2016
2016
2016
2016
2015
2014
2015
2015
2015
2015
2015
2014
2014
2014
2014
2014
2015
2014
Caribbean and Central AmericaPanama Goal 82.5%
Honduras Goal 76%
Dominican Republic Goal 82.5%
Suriname Goal 82.5%
Haiti Goal 76%
88.9%
84%
83.5%
85.2%
84.3%
84.4%
86.7%
70.8%
85.4%
84.7%
76.7%
84.3%
88.0%
87.5%
69.4%
78.5%
79.3%
86.1%
88.3%
83.2%
58.7%
See our consolidated satisfaction index: http://reporteintegrado.argos.co/pdf/CustomerSatisfaction.pdf
103-2 103-3
103-2 103-3
Costumers, Honduras, Caribbean and Central America Region
61
02 D
evel
opin
g ou
r B
usin
ess

SUPPLIER DEVELOPMENT AND MANAGEMENT
OUR MANAGEMENT APPROACH
We contribute to the development of suppliers that help us achieve our business objectives while reducing associated risk, ensuring transparency, and building capacity throughout the supply chain.
We help to increase our suppliers’ competitiveness, generating more employment, developing their skills, and supporting community development through long-term business relationships and our capacity-building programs.
Added value to the company Added value to society
103-2 Initiatives, commitments, and policies
Argos Goods and Services Procurement Manual
Global Compact
Argos Human Rights Policy
Argos OH&S Policy
Argos Suppliers’ Sustainability Index
Sustainable Development Goals (SDG)
Sustainability Policy
103-1
Board of Directors
Regional Supply Chain Managers and Directors
Regional Procurement Managers or Directors
CEO and Corporate Governance and Contract Committee
103-2 Governance
103-1
Suppliers Argos Clients SocietyVALUE CHAIN BOUNDARIES
Supplier Recognition Program in Colombia
INTE
GR
ATED
REP
OR
T 2016
62

2017/2018 GOALS · We will develop a Corporate Sustainable Procurement Policy.
· We will implement the second version of the Suppliers Recognition Program.
· We will increase the percentage of suppliers trained on sustainability issues.
· We will increase the percentage of suppliers that undergo a screening process before negotiation phase.
· We will increase in 50% the coverage of supplier’s Sustainability Assessment.
2016 GOAL TRACKING We implemented the sustainability index with adjustments based on experience and results obtained during 2014 and 2015 pilots.
We provided our suppliers with online tools to assess and suggest sustainability improvement plans.
We increased the training coverage for our suppliers on Corporate Governance good practices, Code of Business Conduct, Anti-corruption and
Anti-bribery Policy, planning and risk assessment, and relationship with communities, as well as the measurement of impacts caused on them.
We implemented the Supplier Recognition Program in Colombia.
We continued to implement sustainability best practices derived from initiatives such as the Global Compact and the Cement Sustainability Initiative (CSI).
Colombia CCA USAUSD
millionCOP billion
USD million
COP billion
USD million
COP billion
Value of total products and services purchased 668 2.0 222 0.66 964 2.8
Value of products and services purchased locally 616 1.8 155 0.46 905 2.7
Colombia CCA USAPercentage of products and services purchased locally 92% 69.9% 94%
Number of total suppliers 3,867 1,897 6,824
Number of local suppliers 3,645 1,448 6,796
Percentage of local suppliers 94% 76% 99.6%
Number of critical suppliers assessed in sustainability criteria 471 231 9
204-1 NUMBER OF SUPPLIERS AND SUPPLIER SPEND
102-9 Learn more about the development and management of our supply chain here: http://reporteintegrado.argos.co/pdf/SupplyChainManagement.pdf
103-2 103-3 103-2 103-3
Supplier Recognition Program in Colombia
2016 PERFORMANCE
· We started the implementation of a standard platform to assess and audit our suppliers on sustainability and OH&S topics in all regions.
· We increased the coverage of the capacity-building program to 70 more suppliers in the Colombia Region, during the last three years.
· We redesigned and applied the Supplier Sustainability Index to 62 suppliers in all our regions.
· We implemented 89 OH&S audits for contractors within the framework of the I Promise management system in Colombia.
Upcoming challenges
· To implement standarized capacity-building programs, tailored-made for all regions.
· To increase coverage of supplier sustainability assessments and audits for all regions.
103-2
WE LAUNCHED A SUPPLIER RECOGNITION PROGRAM IN COLOMBIA BASED ON THEIR PERFORMANCE ON SUSTAINABILITY AND INNOVATION. 14 OF THEM WERE RECOGNIZED FOR THEIR EXCELLENT PERFORMANCE.
63
02 D
evel
opin
g ou
r B
usin
ess

INNOVATION
OUR MANAGEMENT APPROACH
Innovation is how the company maintains its competitive advantage and strengthens the value perceived by customers, shareholders, and employees. Through a long-term commitment to a structure and culture of innovation, we seek to develop leading products and services that satisfy changing and emerging customer needs. Also, innovation as a strategic priority for Argos merges with our core activities and enables processes to achieve industry cost leadership, new business models and more sustainable value proposition.
Our innovation program develops products, services, and processes that focus on unmet needs in the market, the well-being of our customers, the use of natural resources, and the strengthening of our supply chain and of the communities in which we produce and sell our products.
Added value to the company Added value to society
2016 PERFORMANCE
· We achieved 6% alternative fuel heat consump-tion substitution with used tires on line 2 of the Rioclaro plant in Colombia. The substitution on this line reached historic levels of nearly 11% between September and December.
· We increased the use of alternative raw materials.
· We launched the Emerging Business Opportunities (EBO) Program.
· We carried out five innovation challenges in our ce-ment plants in several countries, including over 400 employees and resulting in more than 200 ideas with associated savings of over USD 4 million.
· Development of four new products: Advanced Concrete, Microcement, Roadbinder and Masonary Cement.
Find some examples of Argos’ innovation initiatives here: http://reporteintegrado.argos.co/pdf/Innovation.pdf
Upcoming challenges · To advance R&D milestones in the use of Supplementary Cementitous Materials (SCMs) to further reduce CO2 footprint and production costs.
· To focus in the Ideaxion model in order to strengthen our innovation culture and the quality of the ideas from all employees.
103-1
103-2103-2 Initiatives, commitments, and policies
Sustainability, Environmental and Energy Policies.
Strategy-driven targets to achieve innovation outcomes.
R&D Technology Roadmaps.
R&D partnerships with domestic nation-al and international academic institu-tions and government entities.
103-2 Governance
Innovation Committee
Regional Directors / Mentors
Chief Innovation Officer (CINO)
Innovation Manager, Alternative Resources Manager, R&D Manager, New Business Manager
103-1
Suppliers Argos Clients SocietyVALUE CHAIN BOUNDARIES
INTE
GR
ATED
REP
OR
T 2016
64

2018 - 2025 GOALS · We will increase our revenues attri-buted to innovation products and services, new channels/businesses, or new business models to 20%.
· We will achieve a 18% of heat generation from the use of alternative fuels.
· We will be able to use 7% of alternative materials in the production of cement and 3% in the production of concrete.
· We will fully develop and embed innovation culture throughout Argos’ geographical footprint.
2016 - 2017 GOAL TRACKING
We moved foward on the commencement of Caltek, Argos’ new business that will commence limestone production at its own indus-trial facility in Colombia.
Commercial operations in Colombia Region of four new products: Advanced Concrete, Microcement, Roadbinder and Masonary Cement.
We made progress on Greco’s concrete recycling operations in Colombia.
We began the use of alter-native fuel in the Newberry, USA and in the Cartagena, Colombia plants.
We moved foward on the implementation of the EBO model.
COP million
USD million
Innovation as a percentage
of revenueTOTAL REVENUE FROM INNOVATION
Colombia 518.3 169.8 20.0%
Caribbean and Central America 139.3 45.6 8.3%
USA 690.9 226.2 16.3%
TOTAL 1,348.6 441.7 15.8%
COP USD
Use of supplementary cementing materials 5,606,813,207 1,836,397
Admixture optimization 924,640,501 302,847
Production process efficiency 4,529,267,589 1,483,469
Organizational excellence 180,534,405 59,130
Use of alternative fuels 492,000,000 161,145
TOTAL 11,733,255,702 3,842,988
A-IN3 AMOUNT AND % OF INCOME FROM INNOVATION BY REGIONAL
A-IN2 NUMBER OF INNOVATIVE IDEAS
A-IN4 AMOUNT OF SAVINGS DERIVED FROM THE IMPLEMENTATION OF INNOVATION INITIATIVES.
Received
Validated
Approved
Implemented
2016
2016
2016
2016
2014
2014
2014
2014
2015
2015
2015
2015
2013
2013
2013
2013
294
33
54
20
411
33
61
19
112
25
38
9
146
19
58
31
A-IN1 TOTAL AMOUNT OF INNOVATION INVESTMENT
In 2016 we invested over
11 million dollars in innovation.
Exchange rate: 3,053.16 COP/USD
A-IN3 For further deatails on innovation KPIS go to: http://reporteintegrado.argos.co/pdf/Innovation.pdf
103-2 103-3 103-2 103-3
Employee at Roberta plant, USA Region
65
02 D
evel
opin
g ou
r B
usin
ess


03Protecting our Planet
This chapter refers to our Natural and Intellectual Capital

2025 ENVIRONMENTAL STRATEGYCLIMATE CHANGE
Substitute
Have
Reduce
Rehabilitate
18%
100%
-35%
70%
7%
3%
of conventional fossil fuels for alternative fuels
Of active quarries with rehabilitation plans in place
kg CO2 per ton of cementitious product
of disturbed areas in active quarries
Biodiversity managementWe will identify facilities located in high biodiversity areas
102-11 Our environmental actions promote eco-efficiency, manage biodiversity, reduce effects on climate change, promote initiatives related to sustainable construction, and establish an organizational culture that promotes responsi-ble use of natural resources as a function of the quality of life of our stakeholders and in compliance with our Environ-mental Policy.
of used materials in cement for alternative materials
of used materials in concrete for alternative materials
BIODIVERSITY
As of 2016, we can say with great confidance that our environmental management goes beyond identify-ing and monitoring environmental impacts, and that it is evolving well towards their prevention, mitigation, correction, and offset.
INTE
GR
ATED
REP
OR
T 2016
68
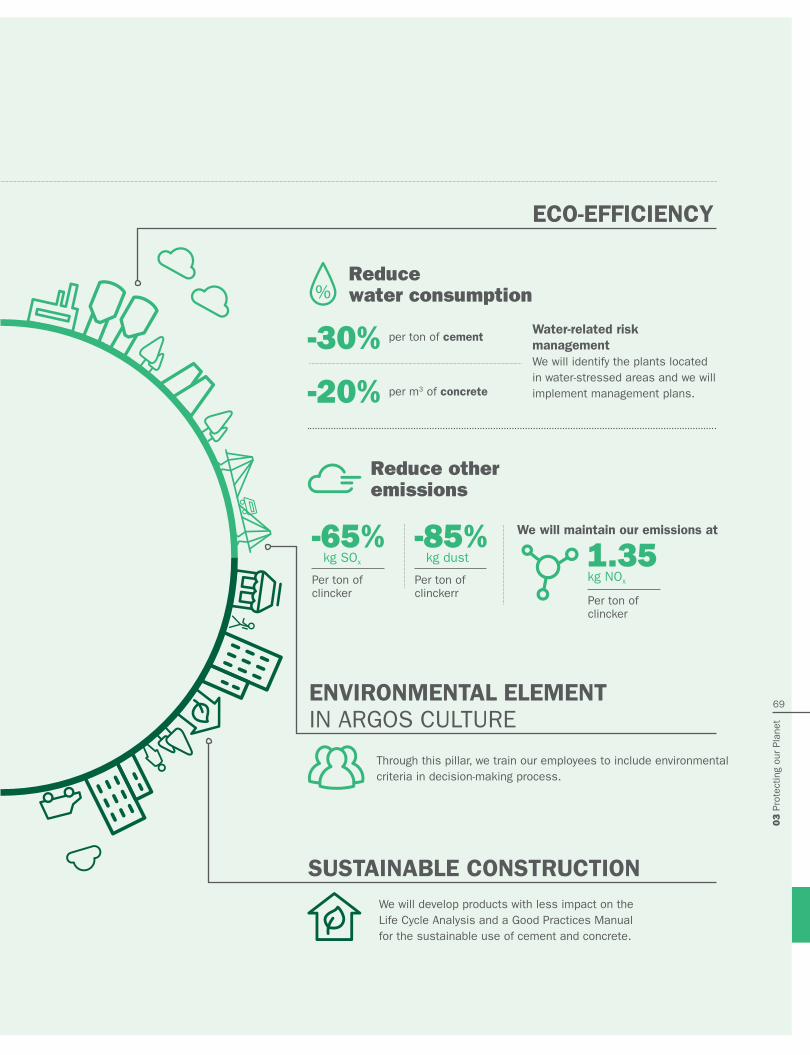
Reduce water consumption
Reduce other emissions
We will maintain our emissions at
-30%
-65%kg SOx 1.35
kg NOx
-85%kg dust
Per ton of clincker
Per ton of clincker
Per ton of clinckerr
-20%
per ton of cement
We will develop products with less impact on the Life Cycle Analysis and a Good Practices Manual for the sustainable use of cement and concrete.
Through this pillar, we train our employees to include environmental criteria in decision-making process.
per m3 of concrete
Water-related risk managementWe will identify the plants located in water-stressed areas and we will implement management plans.
ECO-EFFICIENCY
SUSTAINABLE CONSTRUCTION
ENVIRONMENTAL ELEMENTIN ARGOS CULTURE
69
03 P
rote
ctin
g ou
r Pl
anet
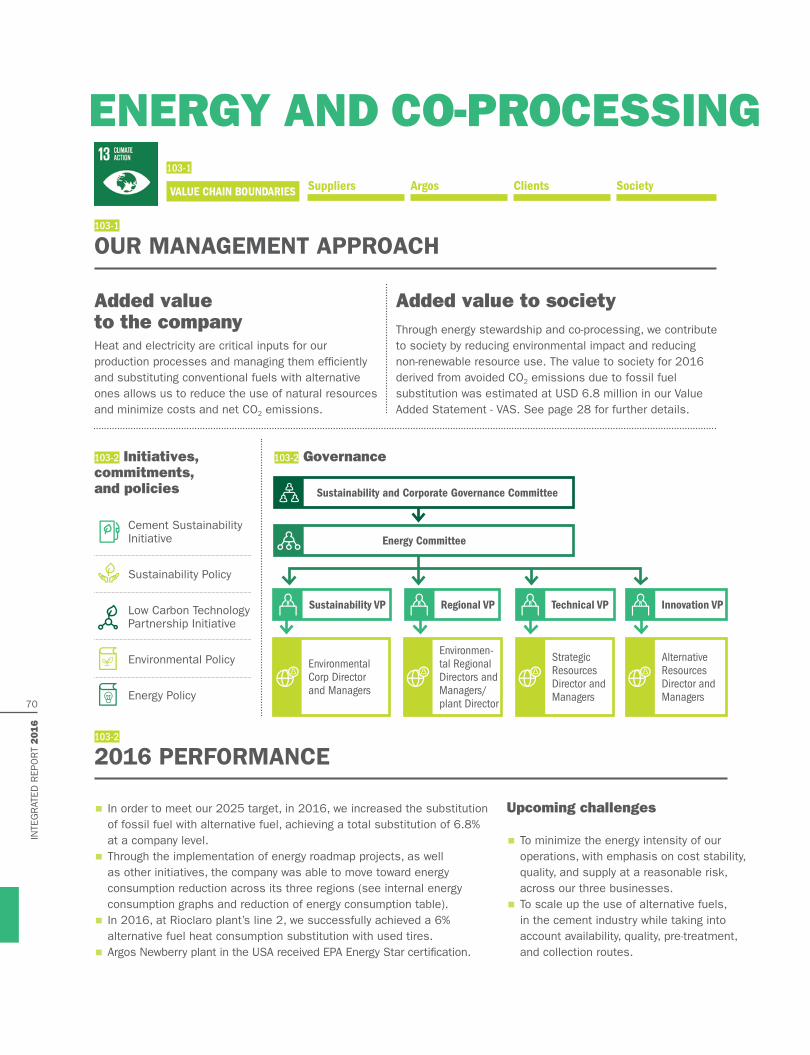
ENERGY AND CO-PROCESSING
OUR MANAGEMENT APPROACH
Heat and electricity are critical inputs for our production processes and managing them efficiently and substituting conventional fuels with alternative ones allows us to reduce the use of natural resources and minimize costs and net CO2 emissions.
Through energy stewardship and co-processing, we contribute to society by reducing environmental impact and reducing non-renewable resource use. The value to society for 2016 derived from avoided CO2 emissions due to fossil fuel substitution was estimated at USD 6.8 million in our Value Added Statement - VAS. See page 28 for further details.
Added value to the company
Added value to society
2016 PERFORMANCE
103-2 Initiatives, commitments, and policies
Cement Sustainability Initiative
Sustainability Policy
Low Carbon Technology Partnership Initiative
Environmental Policy
Energy Policy
103-1
103-2
103-2 Governance
Sustainability and Corporate Governance Committee
Environmental Corp Director and Managers
Environmen-tal Regional Directors and Managers/plant Director
Strategic Resources Director and Managers
Alternative Resources Director and Managers
Energy Committee
Sustainability VP Technical VP Regional VP Innovation VP
· In order to meet our 2025 target, in 2016, we increased the substitution of fossil fuel with alternative fuel, achieving a total substitution of 6.8% at a company level.
· Through the implementation of energy roadmap projects, as well as other initiatives, the company was able to move toward energy consumption reduction across its three regions (see internal energy consumption graphs and reduction of energy consumption table).
· In 2016, at Rioclaro plant’s line 2, we successfully achieved a 6% alternative fuel heat consumption substitution with used tires.
· Argos Newberry plant in the USA received EPA Energy Star certification.
Upcoming challenges
· To minimize the energy intensity of our operations, with emphasis on cost stability, quality, and supply at a reasonable risk, across our three businesses.
· To scale up the use of alternative fuels, in the cement industry while taking into account availability, quality, pre-treatment, and collection routes.
103-1
Suppliers Argos Clients SocietyVALUE CHAIN BOUNDARIES
INTE
GR
ATED
REP
OR
T 2016
70
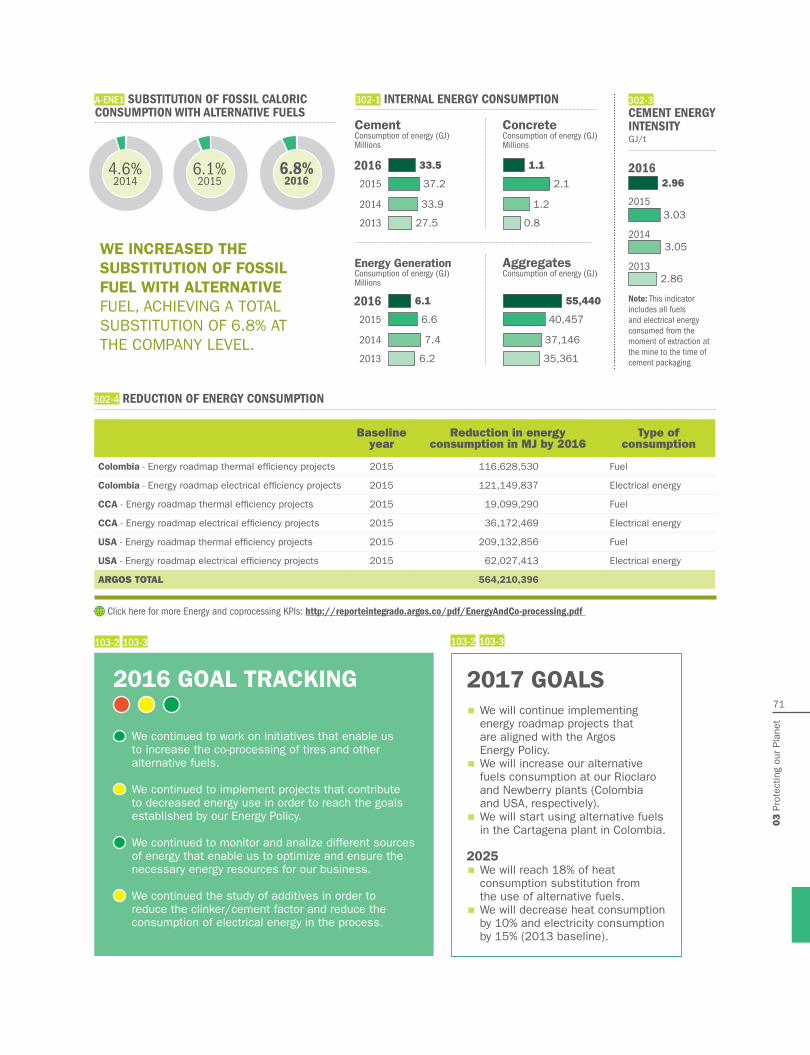
2016 GOAL TRACKING
We continued to work on initiatives that enable us to increase the co-processing of tires and other alternative fuels.
We continued to implement projects that contribute to decreased energy use in order to reach the goals established by our Energy Policy.
We continued to monitor and analize different sources of energy that enable us to optimize and ensure the necessary energy resources for our business.
We continued the study of additives in order to reduce the clinker/cement factor and reduce the consumption of electrical energy in the process.
2.96
3.03
3.05
2.86
302-4 REDUCTION OF ENERGY CONSUMPTION
302-3 CEMENT ENERGY INTENSITYGJ/t
Baseline year
Reduction in energy consumption in MJ by 2016
Type of consumption
Colombia - Energy roadmap thermal efficiency projects 2015 116,628,530 Fuel
Colombia - Energy roadmap electrical efficiency projects 2015 121,149,837 Electrical energy
CCA - Energy roadmap thermal efficiency projects 2015 19,099,290 Fuel
CCA - Energy roadmap electrical efficiency projects 2015 36,172,469 Electrical energy
USA - Energy roadmap thermal efficiency projects 2015 209,132,856 Fuel
USA - Energy roadmap electrical efficiency projects 2015 62,027,413 Electrical energy
ARGOS TOTAL 564,210,396
Note: This indicator includes all fuels and electrical energy consumed from the moment of extraction at the mine to the time of cement packaging
2016
2015
2014
2013
Click here for more Energy and coprocessing KPIs: http://reporteintegrado.argos.co/pdf/EnergyAndCo-processing.pdf
103-2 103-3 103-2 103-3
CementConsumption of energy (GJ) Millions
Energy GenerationConsumption of energy (GJ) Millions
ConcreteConsumption of energy (GJ) Millions
AggregatesConsumption of energy (GJ)
2016
2016
2014
2014
2015
2015
2013
2013
33.5
6.1
1.1
55,440
37.2
6.6
2.1
40,457
33.9
7.4
1.2
37,146
27.5
6.2
0.8
35,361
302-1 INTERNAL ENERGY CONSUMPTIONA-ENE1 SUBSTITUTION OF FOSSIL CALORIC CONSUMPTION WITH ALTERNATIVE FUELS
6.1%2015
4.6%2014
6.8%2016
WE INCREASED THE SUBSTITUTION OF FOSSIL FUEL WITH ALTERNATIVE FUEL, ACHIEVING A TOTAL SUBSTITUTION OF 6.8% AT THE COMPANY LEVEL.
2017 GOALS · We will continue implementing energy roadmap projects that are aligned with the Argos Energy Policy.
· We will increase our alternative fuels consumption at our Rioclaro and Newberry plants (Colombia and USA, respectively).
· We will start using alternative fuels in the Cartagena plant in Colombia.
2025 · We will reach 18% of heat consumption substitution from the use of alternative fuels.
· We will decrease heat consumption by 10% and electricity consumption by 15% (2013 baseline).
71
03 P
rote
ctin
g ou
r Pl
anet

SUSTAINABLE CONSTRUCTION AND MATERIALS
OUR MANAGEMENT APPROACH
Sustainable construction constitutes a business opportunity. To satisfy the growing market demand for sustainable products, we will increase the relevance of products with sustainable characteristics in our portfolio and guide our clients to sustainable building materials, including ours, for their projects.
We strategically manage our raw materials needs to reduce reliance on non-renewable raw materials and focus on optimizing our supply chain and mining operations.
Products with increased sustainable performance in our portfolio will allow us to build a more sustainable infrastructure and urbanization. The value to society for 2016 derived from avoided CO2 emissions due to use of alternative raw materials was estimated to be USD 20.5 million in our Value Added Statement - VAS. See page 28 for further details.
Added value to the company Added value to society
103-1
Panama administrative office, Caribbean and Central America Region103-2 Initiatives, commitments, and policies
Cement Sustainability Initiative
Sustainability Policy
Low Carbon Technology Partnership Initiative
U.S. Green Building Council
Panama Green Building Council
National Ready Mixed Concrete Association - EPD
Environmental Policy
American Institute of Architects
103-1
Suppliers Argos Clients SocietyVALUE CHAIN BOUNDARIES
INTE
GR
ATED
REP
OR
T 2016
72

2016 PERFORMANCE
2017 GOALS · We will screen our current portfolio according to the sustainable characteristics defined for the three regions.
· We will communicate the sustainable characteristics of our products to our clients.
· We will train the technical advisors for the sales team of our company on how we contribute to sustainability projects with our products.
2025: · We will achieve 7% of alternative material use in the cement business.
· We will achieve 3% of alternative material use in the concrete business.
· We will obtain USD 400 MM in revenues from our portfolio with sustainable features.
2016 GOAL TRACKING
We defined our strategy and specific goals for sustainable con-struction to be achieved by 2025.
We continued to generate a pos-itive impact on society, and on our customers, by strengthening our portfolio.
· The sustainable construction strategy and goals were set.
· Argos Center for Innovation received the LEED© GOLD certification in the category BD+C (Building Design and Construction) by the USGBC becoming one of five certified laboratories in Latin America.
· In 2016 we reached an alternative materials substitution rate (according to our Environmental Policy) of 6.5% and 2.3% in our cement and concrete operations, respectively. There was a slight decrease in this number due to challenges related to supply of alternative materials.
Upcoming challenges
· To highlight sustainable characteristics of our products, services, and solutions in our current portfolio and challenge new developments to contribute to the following world needs: climate action, wellbeing, resource efficiency, sustainable cities.
· To train key personnel to guide our clients in the selection of our sustainable building materials for their projects.
· To communicate the sustainable advantages of our cement and concrete products.
· To promote sustainability as a key lever for product innovation using life cycle assessment.
· To support training processes for clients and other stakeholders to actively increase the relevance of sustainable construction in the regions where we operate.
CSI ALTERNATIVE RAW MATERIALS RATE
Cement2016
2014
2015
10.5%
10.3%
9.2%
103-2
103-2 103-3 103-2 103-3
103-2 Governance
Sustainability and Corporate Governance Committee
Environmental Corp Director and Managers
Environmental Regional Directors and Managers/plant Managers and Sales Team
R&D Director and Managers/Alternative Resources Director and Managers
Sustainability VP Regional VP Innovation VP
Click here for more sustainable construction and materials KPIs: http://reporteintegrado.argos.co/pdf/Sustainable ConstructionAndMaterials.pdf
73
03 P
rote
ctin
g ou
r Pl
anet

Carbon Disclosure Project
Carbon Cure
Environmental Policy
Cement Sustainability Initiative
Sustainability Policy
Low Carbon Technology Partnership Initiative
CO2 EMISSIONS AND CLIMATE CHANGE
OUR MANAGEMENT APPROACH
Our climate strategy allows us to reduce climate change-related risks while generating new business opportunities through innovation in processes, products and solutions. It also increases operational efficiency and reduces costs.
Through our engagement with tackling climate change, we contribute to the global challenge of reducing CO2 emissions and mitigating associated impacts on society. The cost to society for 2016 derived from CO2 emissions decreased 1.8% compared to 2015 according to our Value Added Statement - VAS. See page 28 for further details.
Added value to the company
Added value to society
2016 PERFORMANCE
· We developed of the Carbon Footprint BI Model for the automatic calculation of scope 1 and scope 2 emissions in our cement operations in the Colombia Region, in accordance with the methodology of the CSI CO2 Protocol.
· We formulated CO2 emission reduction plans for the Colombia, and Caribbean and Central America regions. The plans include annual targets, projects, and initiatives to develop in order to achieve the corporate 2025 CO2 reduction goal.
103-2
103-1
103-2 Initiatives, commitments, and policies
103-2 Governance
Sustainability and Corporate Governance Committee
Environmental corp director and managers
Environmental regional directors and managers/ plant director
Sustainability VP Regional VP
Hydroelectric power station, Francisco Morazán, Honduras, Caribbean and Central America Region
103-1
Suppliers Argos Clients SocietyVALUE CHAIN BOUNDARIES
INTE
GR
ATED
REP
OR
T 2016
74

2017 GOALS · We will formulate the scope 1 emissions reduction plan for USA cement operations.
· We will implement the methodology established by the CSI in the recently published “Cement Sector Scope 3 GHG Accounting and Reporting Guidance”.
2025: · We will reduce CO2 emissions per ton 35% of cementitious products by 2025 (Baseline 2006).
2016 GOAL TRACKING
We developed specific plans for operations that enabled us to make further progress toward the established goal of decreasing CO2 emissions by 35% by 2025.
We conducted an external audit of our inventory of CO2 emissions to confirm the transparency of the report and emissions management.
A-EC1 SPECIFIC NET CO2 EMISSIONS (kg CO2/t CEMENTITIOUS PRODUCTS)
2016
2014
2015
2013
600
601
589
613
Environmental Policy indicator
305-1 305-2 DIRECT AND INDIRECT EMISSIONS
Cement
Aggregates
Concrete
Generation of energy
TOTAL EMISSIONS
2016
2016
2016
2016
2016
2016
2016
2016
2014
2014
2014
2014
2014
2014
2014
2014
2015
2015
2015
2015
2015
2015
2015
2015
2013
2013
2013
2013
2013
2013
2013
2013
6.6
2.5
68
505
7.5
320
1.4
20
7.1
1.5
147
568
8.2
315
0.97
19
6.5
1.4
72
642
8.0
634
0.55
22
5.6
1.5
50
550
7.2
971
0.73
18
Direct millions of tons of CO2
Direct thousands of tons of CO2
Direct thousands of tons of CO2
Direct thousands of tons of CO2
Millions of tons of CO2
Indirect thousands of tons of CO2
Indirect thousands of tons of CO2
Indirect thousands of tons of CO2
103-2 103-3 103-2 103-3
· We participated in the construction of the Road Map of the Cement Industry in Latin America, which is being developed under the leadership of FICEM (Inter-American Cement Federation).
· We established an agreement with CarbonCure Technologies to use captured CO2 to improve the resistance of some of our concrete mixes and contribute to the reduction of CO2 emissions. We were the first company in the USA to be able to offer our customers a product with CO2 capturing and incorporating properties.
· We approved the use of Internal Carbon Pricing to assess project feasibility.
· We ensured compliance and transparency of the information reported by having an external audit performed by PwC for scope 1 and 2 CO2 emissions.
· The slight reduction in specific net CO2 emissions across our operations was driven by increasing the use of alternative fuels, specific heat consumption improvement and the implementation of energy road map initiatives (see Energy and Coprocessing section).
Upcoming challenges
· To start the implementation of CO2 reduction plans for cement operations in the Colombia, and Caribbean and Central America regions while boosting expected results for the company.
SPECIFIC NET CO2 EMISSIONS IN 2016 WERE 600 kg CO2 PER TON OF CEMENTITIOUS PRODUCTS, WHICH CORRESPONDS TO A DECREASE OF 29% COMPARED TO OUR BASELINE.
Click here for more CO2 emissions and climate change KPIs and information: http://reporteintegrado.argos.co/pdf/CO2EmissionsAndClimateChange.pdf
75
03 P
rote
ctin
g ou
r Pl
anet

OTHER AIR EMISSIONS
OUR MANAGEMENT APPROACH
By monitoring and controlling the main emissions derived from our combustion and kiln process, we are able to comply with local regulations in the countries where we operate while contributing to our process efficiency through effective operational control.
We are committed to reducing our specific SOx, NOX and dust emissions beyond regulation compliance and through mitigation actions in order to reduce impacts derived from our operations.
Added value to the company Added value to society
103-1
103-2 Initiatives, commitments, and policies
Cement Sustainability Initiative
Environmental Policy
Sustainability Policy
103-2 Governance
Sustainability and Corporate Governance Committee
Environmental Corp Director and Managers
Environmental Regional Directors and Managers/plant Director
Sustainability VP Regional VP
Harleyville plant, USA Region
103-1
Suppliers Argos Clients SocietyVALUE CHAIN BOUNDARIES
INTE
GR
ATED
REP
OR
T 2016
76

2017 GOALS · We will implement identified NOx reduction initiatives across the Colombia region.
· We will meet CISWI and NESHAP regulation across the USA region.
· We will prepare for the implementation of the CSI Guidance for Reducing and Controlling Emissions of
Mercury Compounds in the Cement Industry.
2025: · We will reduce dust emissions by 85%*.
· We will reduce SOx emissions by 65%*.
· We will stabilize NOx emissions at 1.35kg/t clinker.
* Baseline year is 2012.
2016 GOAL TRACKING
We achieved stability of the installed Continuous Emission Monitoring System (CEMs) in order to meet the industry operational control standards.
We continued to move forward by measuring other minor pollutants in our operations.
A-OE1 SPECIFIC EMISSIONS 305-7 ABSOLUTE EMISSIONS
CementCement
2016 20162016
2016
2016
2016
2014 20142014
2014
2014
2014
2015 20152015
2015
2015
2015
2013 2013
2013
2013
2013
2013
1,723 11,8540.23
1.58
0.08
1,716
2,474 11,3000.31
1.4
0.17
1,703
1,730 12,9510.22
1.67
0.22
2,074
3,337 11,010
0.38
1.59
0.55
3,984
Emissions of atmospheric pollutants | TonsEmissions of atmospheric pollutants kg/ton clinker
SOx NOxSOx
NOx
Dust
Dust
Concrete
142
145
152
130
Dust
Emissions of atmospheric pollutants| Tons
Generation of energy
2016 2016
2014 2014
2015 2015
2013 2013
2,587 28462
2,540 34379
2,496 77441
1,171 106,754
Emissions of atmospheric pollutants | Tons
SOx NOx Dust
103-2 103-3 103-2 103-3
2016 PERFORMANCE
· In 2016, a total USD 32.5 million was invested in other emissions reduction initiatives across our different plants.
· We reduced dust emissions by 88% (compared to baseline) through installation of high-efficient bag filter systems and bag filter maintenance.
· We reduced SOx emissions by 74% (compared to baseline) through plant process initiatives.
Upcoming challenges
· To identify and implement mitigation actions to reduce NOx emissions.
· To move forward with the actions that the cement industry needs to implement and comply the requirements established by the Minamata Convention on Mercury.
103-2
Click here for more KPIs of Other emissions: http://reporteintegrado.argos.co/pdf/OtherAirEmissions.pdf
77
03 P
rote
ctin
g ou
r Pl
anet

BIODIVERSITY
OUR MANAGEMENT APPROACH
By properly mitigating the impacts that our operations generate on ecosystems and biodiversity, we ensure the supply of goods and services required for our production processes, while being a good neighbor to communities and other stakeholders around us.
Through our biodiversity management strategy, we contribute to maintaining the supply of the ecosystem goods and services needed for the wellbeing of our communities and other stakeholders. The cost to society for 2016 derived from impacts on biodiversity decreased 1.7% compared to 2015 according to our Value Added Statement - VAS. See page 28 for further details.
Added value to the company
Added value to society
2016 PERFORMANCE
· We implemented IBAT (Integrated Biodiversity Assessment Tool) to assess biodiversity-related risks in our facilities.
· We developed guidelines for the development of Biodiversity Management Plans (BMPs).
· In our Central America and Caribbean Region the percentage of quarries with closure plans in place remains the same as 2015 as technical information required for the closure plans is being developed.
· In our USA Region, there was a slight increase in rehabilitated areas in comparison with 2015 due to efforts undertaken at the Newberry quarry.
· In Colombia Region we invested USD 731,310 in biodiversity offset and rehabilitation projects.
· We strengthened our strategic alliances in the three regions: · USA: We funded conservation projects led
by the Audubon Society and the Lubee Bat Conservancy with USD 13,000.
· CCA: With the support of the Smithsonian Institute, we developed a BMP for the preservation of a high biodiversity area in Panama.
· Colombia: We engaged in a public-private partnership with Parques Nacionales Naturales (PNN) and the Wildlife Conservation Society (WCS) with the aim of protecting the Saldaña River Basin; we also engaged in the initiative to protect the Andean bear in alliance with Grupo Argos, PNN, WCS, and Corporación Autonóma del Valle del
103-1
103-2103-2 Initiatives, commitments, and policies
Cement Sustainability Initiative
Wildlife Conservation Society
World Heritage Centre
Audubon Society
Parques Nacionales Naturales de Colombia
Sustainability Policy
Environmental Policy
103-2 Governance
Sustainability and Corporate Governance Committee
Environmental Corp Director and Managers
Environmen-tal Regional Directors and Managers/plant Director
Sustainability VP Regional VP
103-1
Suppliers Argos Clients SocietyVALUE CHAIN BOUNDARIES
INTE
GR
ATED
REP
OR
T 2016
78

Active quarries Closure plan %
Colombia 29 24 83%
USA 3 3 100%
Caribbean and Central America 8 4 50%
ARGOS TOTAL 40 31 78%
Disturbed area (ha)
Rehabilitated area (ha) %
Colombia 180.74 156.53 86.6%
USA 82.2 33.5 40.8%
Caribbean and Central America 19.96 19.39 97.1%
ARGOS TOTAL 282.90 209.42 74%
A-BI1 NUMBER AND PERCENTAGE OF ACTIVE QUARRIES WITH CLOSURE PLANS IN PLACE
A-BI2 NUMBER AND PERCENTAGE OF DISTURBED AREAS REHA-BILITATED AT ACTIVE QUARRIES
2017 GOALS · We will develop a rehabilitation plan for the Haiti quarry.
· We will continue with the soil rehabilitation project with the UdeA University in Colombia.
· We will prioritize our facilities to develop BMPs based on IBAT results.
· We will develop a BMP for the
preservation of a high biodiversity area in the Magdalena Medio region in Colombia.
2025: · We will have closure plans in place for 100% of active quarries.
· We will have 70% of disturbed areas in active quarries rehabilitated.
2016 GOAL TRACKING
We defined and applied the Argos Guidelines for the Formulation of Bio-diversity Manage-ment Plans in all three regions.
We began the sec-ond phase of the soil rehabilitation project with the UdeA University in Colombia.
We continued to participate in the CSI Biodiversity Working Group.
We continued with the implementa-tion of rehabili-tation plans in Colombia.
We developed a Biodiversity Management Plan (BMP) for the pres-ervation of a high biodiversity area in Panama based on the results of the Smithsonian Institute study.
2015 2016
TOTAL ARGOS*
Active 335 328
Nº 34 31
% 10.1 9.5
304-1 NUMBER OF FACILITIES WITH HIGH BIODIVERSITY VALUE
304-4 IUCN RED LIST SPE-CIES AND NATIONAL CON-SERVATION LISTS SPECIES WITH HABITATS IN AREAS AFFECTED BY OPERATIONS
In critical danger
In danger
Vulnerable
Nearly threatened
Minor concern
5
9
24
5
19
103-2 103-3
103-2 103-3
*84% are located in the Colombia region.
Cauca (CVC) and we funded the construction of infrastructure to ensure the protection of biodiversity in Isla Salamanca National Natural Park.
· We maintained Wildlife Habitat Council (WHC) certification for 10 more plants in the USA Region.
· We are industry leaders in biodiversity management, as the DJSI has recognized three years ina a row.
Upcoming challenges
· To define the methodology to measure Net Positive Impact (NPI) in biodiversity for our operations and move forward with its implementation.
Forest Reserve, Panama, Caribbean and Central America Region
Click here for more Biodiversity KPIs: http://reporteintegrado.argos.co/pdf/Biodiversity.pdf
79
03 P
rote
ctin
g ou
r Pl
anet

WATER MANAGEMENT
OUR MANAGEMENT APPROACH
Proper water stewardship means taking care of a resource that does not belong to us and is needed for the daily life of neighboring communities and our operations. By carefully taking care of this resource, we ensure long-term business viability and availability for stakeholders near our operations.
Through our water management strategy, we contribute to preserving the quantity, quality, and availability of this valuable resource for the ecosystem as well as neighboring communities. The cost to society for 2016 derived from water consumption decreased by 13.5% compared to 2015 according to our Value Added Statement - VAS. See page 28 for further details.
Added value to the company Added value to society
2016 PERFORMANCE
· We continued using the Global Water Tool to assess the global water risk level of our operations and expanded the analysis to our critical suppliers.
· We selected and implemented the Water Risk Filter to assess the local water risk level of our operations.
· We joined the Suizagua III Project, a partnership that will allow us to expand the measurement and management of the water footprint of some of our facilities and critical suppliers.
· We formulated Water Consumption Measurement and Reduction Plans for the cement and concrete businesses in our three regions.
· For the CCA Region, we enhanced the reliability of water monitoring through the installation of measurement devices
103-1
103-2
103-2 Initiatives, commitments, and policies
Cement Sustainability Initiative
CEO Water Mandate
Sustainability Policy
Environmental Policy
103-2 Governance
Sustainability and Corporate Governance Committee
Environmental Corp Director and Managers
Environmental Regional Directors and Managers/plant Director
Sustainability VP Regional VP
Natural reserve, Rioclaro, Colombia
103-1
Suppliers Argos Clients SocietyVALUE CHAIN BOUNDARIES
INTE
GR
ATED
REP
OR
T 2016
80
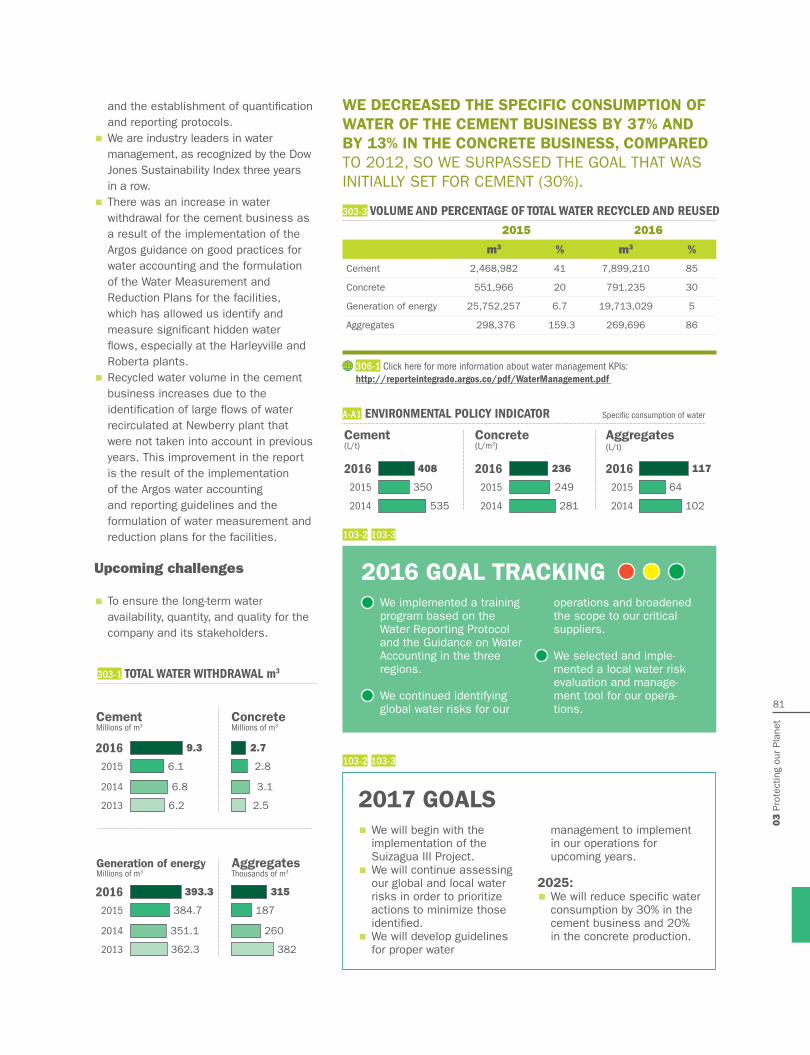
A-A1 ENVIRONMENTAL POLICY INDICATOR
2016 2016 20162015
2014
2015
2014
2015
2014
408 236 117
350
535
249
281
64
102
Specific consumption of water
Cement(L/t)
Concrete(L/m3)
Aggregates(L/t)
2017 GOALS · We will begin with the implementation of the Suizagua III Project.
· We will continue assessing our global and local water risks in order to prioritize actions to minimize those identified.
· We will develop guidelines for proper water
management to implement in our operations for upcoming years.
2025: · We will reduce specific water consumption by 30% in the cement business and 20% in the concrete production.
2016 GOAL TRACKING We implemented a training program based on the Water Reporting Protocol and the Guidance on Water Accounting in the three regions.
We continued identifying global water risks for our
operations and broadened the scope to our critical suppliers.
We selected and imple-mented a local water risk evaluation and manage-ment tool for our opera-tions.
CementMillions of m3
Generation of energyMillions of m3
ConcreteMillions of m3
AggregatesThousands of m3
2016
2016
2014
2014
2015
2015
2013
2013
9.3
393.3
2.7
315
6.1
384.7
2.8
187
6.8
351.1
3.1
260
6.2
362.3
2.5
382
303-1 TOTAL WATER WITHDRAWAL m3
2015 2016
m3 % m3 %
Cement 2,468,982 41 7,899,210 85
Concrete 551,966 20 791,235 30
Generation of energy 25,752,257 6.7 19,713,029 5
Aggregates 298,376 159.3 269,696 86
303-3 VOLUME AND PERCENTAGE OF TOTAL WATER RECYCLED AND REUSED
103-2 103-3
103-2 103-3
and the establishment of quantification and reporting protocols.
· We are industry leaders in water management, as recognized by the Dow Jones Sustainability Index three years in a row.
· There was an increase in water withdrawal for the cement business as a result of the implementation of the Argos guidance on good practices for water accounting and the formulation of the Water Measurement and Reduction Plans for the facilities, which has allowed us identify and measure significant hidden water flows, especially at the Harleyville and Roberta plants.
· Recycled water volume in the cement business increases due to the identification of large flows of water recirculated at Newberry plant that were not taken into account in previous years. This improvement in the report is the result of the implementation of the Argos water accounting and reporting guidelines and the formulation of water measurement and reduction plans for the facilities.
Upcoming challenges
· To ensure the long-term water availability, quantity, and quality for the company and its stakeholders.
WE DECREASED THE SPECIFIC CONSUMPTION OF WATER OF THE CEMENT BUSINESS BY 37% AND BY 13% IN THE CONCRETE BUSINESS, COMPARED TO 2012, SO WE SURPASSED THE GOAL THAT WAS INITIALLY SET FOR CEMENT (30%).
306-1 Click here for more information about water management KPIs: http://reporteintegrado.argos.co/pdf/WaterManagement.pdf
81
03 P
rote
ctin
g ou
r Pl
anet

Photo by Koncretus

04Contributing to society
This chapter includes elements of Argos’ Human and Social-Relationships Capital
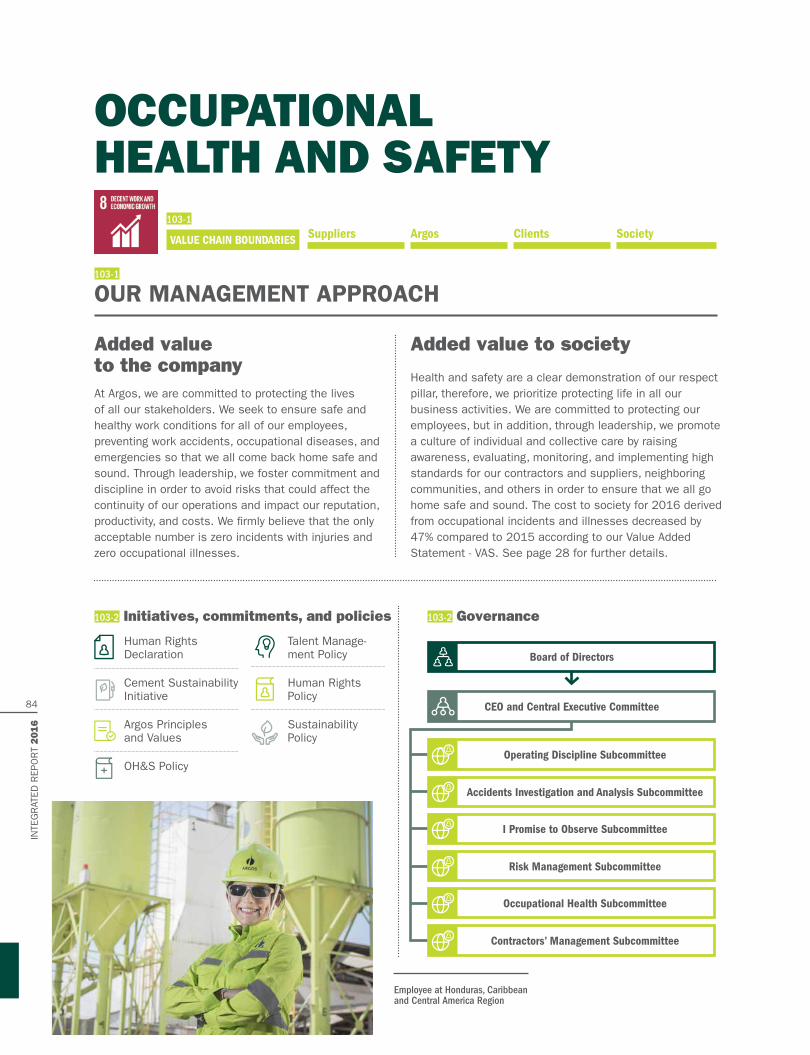
Human Rights Declaration
Cement Sustainability Initiative
Argos Principles and Values
OH&S Policy
Talent Manage-ment Policy
Human Rights Policy
Sustainability Policy
OCCUPATIONAL HEALTH AND SAFETY
OUR MANAGEMENT APPROACH
At Argos, we are committed to protecting the lives of all our stakeholders. We seek to ensure safe and healthy work conditions for all of our employees, preventing work accidents, occupational diseases, and emergencies so that we all come back home safe and sound. Through leadership, we foster commitment and discipline in order to avoid risks that could affect the continuity of our operations and impact our reputation, productivity, and costs. We firmly believe that the only acceptable number is zero incidents with injuries and zero occupational illnesses.
Health and safety are a clear demonstration of our respect pillar, therefore, we prioritize protecting life in all our business activities. We are committed to protecting our employees, but in addition, through leadership, we promote a culture of individual and collective care by raising awareness, evaluating, monitoring, and implementing high standards for our contractors and suppliers, neighboring communities, and others in order to ensure that we all go home safe and sound. The cost to society for 2016 derived from occupational incidents and illnesses decreased by 47% compared to 2015 according to our Value Added Statement - VAS. See page 28 for further details.
Added value to the company
Added value to society
Employee at Honduras, Caribbean and Central America Region
103-1
103-2 Initiatives, commitments, and policies
103-1Suppliers Argos Clients SocietyVALUE CHAIN BOUNDARIES
103-2 Governance
Board of Directors
CEO and Central Executive Committee
Operating Discipline Subcommittee
I Promise to Observe Subcommittee
Occupational Health Subcommittee
Accidents Investigation and Analysis Subcommittee
Risk Management Subcommittee
Contractors’ Management Subcommittee
INTE
GR
ATED
REP
OR
T 2016
84

2016 PERFORMANCE
· The I Promise Project aims to integrate health and safety management systems with a strong governance structure. It impacts the safety culture of our company and has contributed significantly to a decrease in incidents. Also, it has spread to our value chain, specifically the contractors, suppliers, and communities that are close to our operations.
· 403-1 One hundred percent of our employees in the three regions are currently represented by different OH&S Committees, in which we deal with issues such as the identification of risks that might generate injuries or diseases in the company’s activities and facilities.
· Reinforcement of the OH&S management system to continously improve performance, launched
during Sustainability Week with an attendance of 3,939 people.
· 103-2 Implementation of AMATIA, a user-friendly, digital platform that allows us to document incidents in real time, as well as check frequency and severity rates and observations by operation, business, and country. We are currently investigating 100 percent of lost time incidents, and serious unsafe behaviors in order to learn from our mistakes and prevent risks. We develop action plans that are continuously monitored for fulfillment.
· We developed education activities on road safety during the Sustainability Dialogues, which 2,732 people attended.
· Strengthening of the OH&S structure: All employees involved in the health and safety issues.
Upcoming challenges · To improve the operational risk field assessment based on these elements: Train people to identify risk Train people to eliminate or
control risks Implement effective KPI
follow-up strategies.
· To implement life-saving and critical tasks procedures.
2017 GOALS · We will continue strengthening the governance structure and the health and safety management system.
· We will continue closing performance gaps in occupational health and safety in our operations.
· We will continue reducing the number of incidents and unsafe behaviors seeking to become a an example in the safety and health sector.
· We are convinced that the only acceptable figure is ZERO; we will have zero incidents, zero occupational illnesses and zero fatalities in 2017.
2016 GOAL TRACKING We strengthened the governance structure for OH&S
We closed performance gaps in the occupational health and safety opera-tions.
We set up Amatia, the in-formation platform tool.
We progressively reduced the number of incidents, seeking to become a benchmark in the safety and health sector.
We developed a unified management system to track OH&S results in the long run.
103-2 103-3
103-2
103-2 103-3
A-SI1 EMPLOYEES AND CONTRACTORS LOST TIME INCIDENT FREQUENCY AND SEVERITY RATES
Colombia Caribbean and
Central America USA Argos Corporate Total
2016
2016
2015
2015
SeverityFrequency
Goal
s 20
16
Goal
s 20
16
Goal
s 20
17
Goal
s 20
17
Cont
ract
ors
Cont
ract
ors
Empl
oyee
s
Empl
oyee
s
9.215.7
42.4
12.927.1
6.446.82
41.77
9.0318.97
012.512.8
912.6
08.5
9.5
6.38.82
01.221.14
3.61.17
01.15
0.87
2.880.92
2.061.5
2.11
1.382.36
2.551.2
1.66
1.31.8
1312
09
0.710.8
03.6
1.82.2
0.41.5
1.4
4216
9.212.9
27
97.4953.45
36.1832.791.71
1.450
1.67
20.2118.38
019.96
2.192.50
1.732.83
0.8 12,63
BOTH OUR FREQUENCY AND SEVERITY RATES SAW MAJOR REDUCTIONS DURING 2016. FOR OUR EMPLOYEES, THE FREQUENCY RATE DECREASED BY 44% AND FOR OUR CONTRACTORS IT DECREASED BY 52.1%. THE SEVERITY RATE DECREASED IN 49% FOR EMPLOYEES AND 36.7% FOR CONTRACTORS.
Click here to see more OH&S KPIs: http://reporteintegrado.argos.co/pdf/OccupationalHealthAndSafety.pdf
85
04 C
ontr
ibut
ing
to S
ocie
ty

TALENT MANAGEMENT
OUR MANAGEMENT APPROACH
Talent management is a key element for achieving sustainable results. It allows us to attract, develop, and retain employees to leverage organizational goals.
Because we are committed to the development of the best talent, we offer the best conditions for our employees. Our safe and healthy work sites enable innovation and creativity as a basis for growth.
We promote our human capital development from a comprehensive perspective, allowing us to contribute to the progress of society via sustainable development and based on our talent strategy. This dynamic results in more engaged employees who are mindful of their environment and possess the skills and abilities required to successfully meet their professional and personal objectives while being good citizens.
The value to society for 2016 derived from human capital development increased by 56% compared to 2015 according to our Value Added Statement - VAS. See page 28 for further details.
Added value to the company
Added value to society
103-1
103-2 Initiatives, commitments, and policies
Sustainability Policy
UN Global Compact and Business for Peace
UN Commitment to Ending Violence Against Women
Women’s Empowerment Principles of the Global Compact
Argos principles and values
Argos Policies: Talent Management, Diversity and Inclusion, Gender Equality, Human Rights, OH&S
103-2 Governance
Click here to read more about Argos Policies: https://www.argos.co/ir/en/corporate-governance/policies
Appointments and Compensation Committee
Talent Managers and Directors
Regional Talent Managers and Directors
Talent Committee
103-1
Suppliers Argos Clients SocietyVALUE CHAIN BOUNDARIES
Employees at Rioclaro plant, Colombia Region
INTE
GR
ATED
REP
OR
T 2016
86
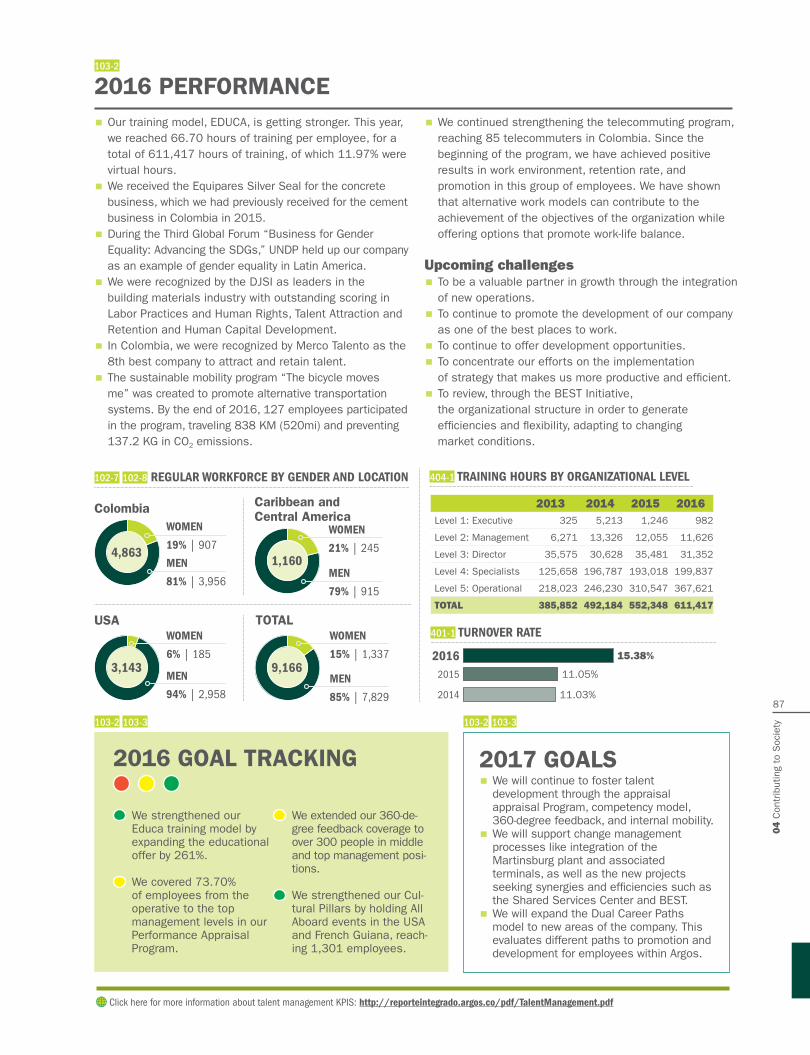
2017 GOALS · We will continue to foster talent development through the appraisal appraisal Program, competency model, 360-degree feedback, and internal mobility.
· We will support change management processes like integration of the Martinsburg plant and associated terminals, as well as the new projects seeking synergies and efficiencies such as the Shared Services Center and BEST.
· We will expand the Dual Career Paths model to new areas of the company. This evaluates different paths to promotion and development for employees within Argos.
2016 GOAL TRACKING
We strengthened our Educa training model by expanding the educational offer by 261%.
We covered 73.70% of employees from the operative to the top management levels in our Performance Appraisal Program.
We extended our 360-de-gree feedback coverage to over 300 people in middle and top management posi-tions.
We strengthened our Cul-tural Pillars by holding All Aboard events in the USA and French Guiana, reach-ing 1,301 employees.
103-2 103-3 103-2 103-3
103-2
2016 PERFORMANCE
401-1 TURNOVER RATE
102-7 102-8 REGULAR WORKFORCE BY GENDER AND LOCATION 404-1 TRAINING HOURS BY ORGANIZATIONAL LEVEL
2016
2014
2015
15.38%
11.05%
11.03%
2013 2014 2015 2016Level 1: Executive 325 5,213 1,246 982
Level 2: Management 6,271 13,326 12,055 11,626
Level 3: Director 35,575 30,628 35,481 31,352
Level 4: Specialists 125,658 196,787 193,018 199,837
Level 5: Operational 218,023 246,230 310,547 367,621
TOTAL 385,852 492,184 552,348 611,417
Colombia Caribbean and Central America
USA TOTAL
4,8631,160
3,143
MEN
81% | 3,956
MEN
94% | 2,958
MEN
79% | 915
MEN
85% | 7,829
WOMEN
19% | 907
WOMEN
6% | 185
WOMEN
21% | 245
WOMEN
15% | 1,3379,166
· Our training model, EDUCA, is getting stronger. This year, we reached 66.70 hours of training per employee, for a total of 611,417 hours of training, of which 11.97% were virtual hours.
· We received the Equipares Silver Seal for the concrete business, which we had previously received for the cement business in Colombia in 2015.
· During the Third Global Forum “Business for Gender Equality: Advancing the SDGs,” UNDP held up our company as an example of gender equality in Latin America.
· We were recognized by the DJSI as leaders in the building materials industry with outstanding scoring in Labor Practices and Human Rights, Talent Attraction and Retention and Human Capital Development.
· In Colombia, we were recognized by Merco Talento as the 8th best company to attract and retain talent.
· The sustainable mobility program “The bicycle moves me” was created to promote alternative transportation systems. By the end of 2016, 127 employees participated in the program, traveling 838 KM (520mi) and preventing 137.2 KG in CO2 emissions.
· We continued strengthening the telecommuting program, reaching 85 telecommuters in Colombia. Since the beginning of the program, we have achieved positive results in work environment, retention rate, and promotion in this group of employees. We have shown that alternative work models can contribute to the achievement of the objectives of the organization while offering options that promote work-life balance.
Upcoming challenges · To be a valuable partner in growth through the integration of new operations.
· To continue to promote the development of our company as one of the best places to work.
· To continue to offer development opportunities.
· To concentrate our efforts on the implementation of strategy that makes us more productive and efficient.
· To review, through the BEST Initiative, the organizational structure in order to generate efficiencies and flexibility, adapting to changing market conditions.
Click here for more information about talent management KPIS: http://reporteintegrado.argos.co/pdf/TalentManagement.pdf
87
04 C
ontr
ibut
ing
to S
ocie
ty

COMMUNITY ENGAGEMENT
OUR MANAGEMENT APPROACH
Our community engagement not only enables Argos to obtain a license to operate; it also provides a legitimacy framework while contributing to reducing, mitigating, preventing, and compensating community-related risks.
As corporate citizens and members of local communities, we are committed to being a good neighbor by taking responsibility for our impacts and contributing to local development through the design or participation in projects that seek to improve the living conditions of the places where we operate. At Argos we work in order to build dreams that generate development and transform lives. The value to society derived from our community investment projects on infrastructure, low-income housing and education for 2016 was estimated at USD 24.3 million in our Value Added Statement - VAS. See page 28 for further details.
Added value to the company
Added value to society
2016 PERFORMANCE
103-1
103-2
103-2 Initiatives, commitments, and policies
Cement Sustainability Initiative
Human Rights Declaration
UN Global Compact and business for Peace
Human Rights Policy
AA 1000 Standard
· We continued improving engagement with our stakeholders through a manual that seeks to reduce subjectivity in the identification, scoring, and management of stakeholders under three variables: dependence, influence, and perception.
· We designed and launched the corporate volun-teer program, focusing on local specificities invol-ving all the employees in order to improve their personal and professional competences while addressing social challenges.
Read more about Argos’ volunteer program: http://reporte integrado.argos.co/pdf/CorporateVolunteeringProgram.pdf
· For the Colombia Region, we established relations with the renewed government bodies that should allow us to strengthen alliances and establish public-private partnerships to create more shared value.
· For the USA Region we prioritized operations in terms of neighboring community presence in order to generate more efficient engagement plans and concentrate efforts on the most relevant operations.
· For the Caribbean and Central America Region, we started the implementation of the community complaints system, which became another mechanism to be closer to our communities and respond more effectively to their expectations or inquiries.
103-1
Suppliers Argos Clients SocietyVALUE CHAIN BOUNDARIES
Sustainability and Corporate Governance Committee
Corporate Community Engagement Director
Regional Sustainability Managers and Directors
VP Sustainability
103-2 Governance
INTE
GR
ATED
REP
OR
T 2016
88

2017 GOALS · We will structure the initiatives in order to have better mechanisms to measure the performance and effect of the programs on society ensuring transparency and better implementation.
· We will structure a baseline for our volunteers program that will allow us to grow and generate greater effects on communities.
2025 · We will establish a formal committee to address continuous dialogue on an open basis for all operations with neighboring communities.
2016 GOAL TRACKING We standardized the community management processes in each country where we operate in accordance with operational structures.
We enhanced management processes in the USA Region with actions that bolstered our relationships with the community and mitigated our risks and impacts.
We implemented a socio-economic footprint index to measure our impact on the communities with whom we have direct or indirect relationships.
We strengthened our public and private partnerships.
We standardized our methodology to process complaints in our three regions.
A-COM1 SOCIAL INVESTMENT
103-2 103-3 103-2 103-3
Education/quality
23,748beneficiaries
COP 3,297 million USD 1.1 million
Sponsorships
16,556 beneficiaries
COP 9,397 million USD 3.1 million
Social capital
27,938 beneficiaries
COP 3,665 million USD 1.2 million
Housing
189,789 beneficiaries
COP 23,066 million USD 7.6 million
Education/infrastructure
13,029 beneficiaries
COP 5,286 million USD 1.7 million
Production projects
5,038 beneficiaries
COP 966 million USD 0.3 million
Social and cultural strengthening
51,075 beneficiaries
COP 2,857 million USD 0.9 million
Others
26,848 beneficiaries
COP 3,438 million USD 1.1 million
Community infrastructure
22,974 beneficiaries
COP 9,810 million USD 3.2 million
Total
376,995 beneficiaries
COP 61,787 million USD 20.5 million
2016Regional investment
COPmillion
USDmillion
Colombia 56,056 18.7 Caribbean and Central America 5,496 1.8
USA 234 0.07
Total 61,787 20.6
Social Investment Activities
3%Donations
43%Community investments
55%Commercial initiatives
WE DESIGNED A METHODOLOGY TO MEASURE THE SOCIO-ECONOMIC FOOTPRINT THAT WILL ALLOW US TO ASSESS THE EFFECTS OF OUR OPERATIONS ON NEIGHBORING COMMUNITIES.
Upcoming challenges
· To maintain the legitimacy of the company among our communities while preventing potential risks through a proactive, not reactive, approach based on periodic, open dialogue.
· To continue adapting programs in communities to generate capabilities that will allow them to be less dependent on our operations in the event we relocate facilities.
Construction of El Carmelo rural education center, Antioquia, Colombia
Click here for more information about Community Engagement KPIs: http://reporteintegrado.argos.co/pdf/CommunityEngagement.pdf
89
04 C
ontr
ibut
ing
to S
ocie
ty
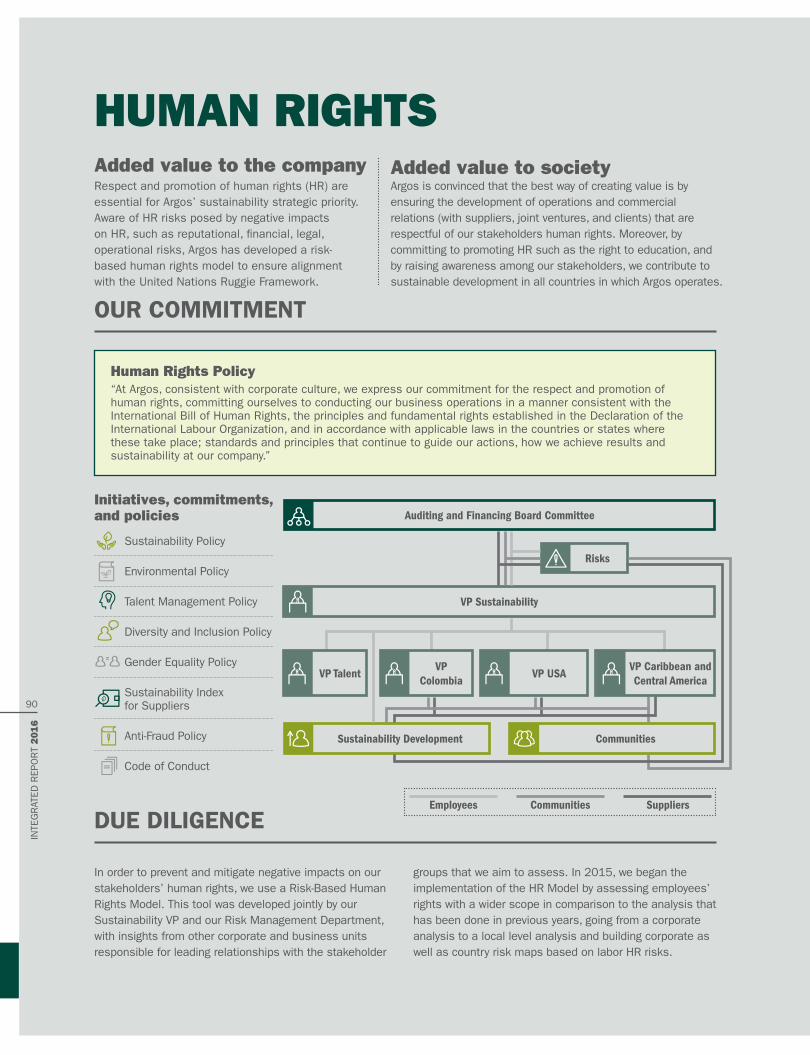
HUMAN RIGHTS
DUE DILIGENCE
Human Rights Policy “At Argos, consistent with corporate culture, we express our commitment for the respect and promotion of human rights, committing ourselves to conducting our business operations in a manner consistent with the International Bill of Human Rights, the principles and fundamental rights established in the Declaration of the International Labour Organization, and in accordance with applicable laws in the countries or states where these take place; standards and principles that continue to guide our actions, how we achieve results and sustainability at our company.”
In order to prevent and mitigate negative impacts on our stakeholders’ human rights, we use a Risk-Based Human Rights Model. This tool was developed jointly by our Sustainability VP and our Risk Management Department, with insights from other corporate and business units responsible for leading relationships with the stakeholder
groups that we aim to assess. In 2015, we began the implementation of the HR Model by assessing employees’ rights with a wider scope in comparison to the analysis that has been done in previous years, going from a corporate analysis to a local level analysis and building corporate as well as country risk maps based on labor HR risks.
OUR COMMITMENT
Respect and promotion of human rights (HR) are essential for Argos’ sustainability strategic priority. Aware of HR risks posed by negative impacts on HR, such as reputational, financial, legal, operational risks, Argos has developed a risk-based human rights model to ensure alignment with the United Nations Ruggie Framework.
Argos is convinced that the best way of creating value is by ensuring the development of operations and commercial relations (with suppliers, joint ventures, and clients) that are respectful of our stakeholders human rights. Moreover, by committing to promoting HR such as the right to education, and by raising awareness among our stakeholders, we contribute to sustainable development in all countries in which Argos operates.
Added value to the company Added value to society
Initiatives, commitments, and policies
Sustainability Policy
Environmental Policy
Talent Management Policy
Diversity and Inclusion Policy
Gender Equality Policy
Sustainability Index for Suppliers
Anti-Fraud Policy
Code of Conduct
Sustainability Development Communities
VP Sustainability
Auditing and Financing Board Committee
Risks
VP Colombia
VP USAVP TalentVP Caribbean and Central America
Employees Communities Suppliers
INTE
GR
ATED
REP
OR
T 2016
90
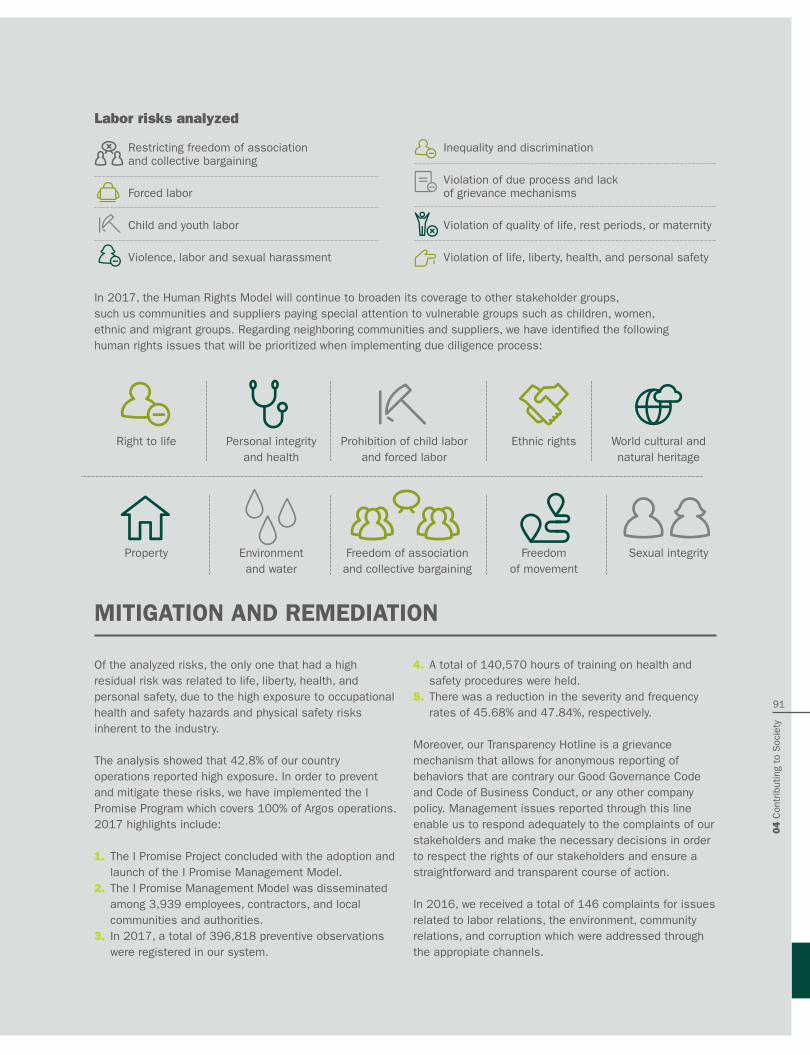
MITIGATION AND REMEDIATION
Of the analyzed risks, the only one that had a high residual risk was related to life, liberty, health, and personal safety, due to the high exposure to occupational health and safety hazards and physical safety risks inherent to the industry.
The analysis showed that 42.8% of our country operations reported high exposure. In order to prevent and mitigate these risks, we have implemented the I Promise Program which covers 100% of Argos operations. 2017 highlights include:
1. The I Promise Project concluded with the adoption and launch of the I Promise Management Model.
2. The I Promise Management Model was disseminated among 3,939 employees, contractors, and local communities and authorities.
3. In 2017, a total of 396,818 preventive observations were registered in our system.
4. A total of 140,570 hours of training on health and safety procedures were held.
5. There was a reduction in the severity and frequency rates of 45.68% and 47.84%, respectively.
Moreover, our Transparency Hotline is a grievance mechanism that allows for anonymous reporting of behaviors that are contrary our Good Governance Code and Code of Business Conduct, or any other company policy. Management issues reported through this line enable us to respond adequately to the complaints of our stakeholders and make the necessary decisions in order to respect the rights of our stakeholders and ensure a straightforward and transparent course of action.
In 2016, we received a total of 146 complaints for issues related to labor relations, the environment, community relations, and corruption which were addressed through the appropiate channels.
In 2017, the Human Rights Model will continue to broaden its coverage to other stakeholder groups, such us communities and suppliers paying special attention to vulnerable groups such as children, women, ethnic and migrant groups. Regarding neighboring communities and suppliers, we have identified the following human rights issues that will be prioritized when implementing due diligence process:
Right to life
Property
Personal integrity and health
Environment and water
Prohibition of child labor and forced labor
Sexual integrity
Ethnic rights World cultural and natural heritage
Freedom of movement
Freedom of association and collective bargaining
Labor risks analyzed
Restricting freedom of association and collective bargaining
Forced labor
Child and youth labor
Violence, labor and sexual harassment
Inequality and discrimination
Violation of due process and lack of grievance mechanisms
Violation of quality of life, rest periods, or maternity
Violation of life, liberty, health, and personal safety
91
04 C
ontr
ibut
ing
to S
ocie
ty


05Appendix

Barranquilla, February 24, 2017
To the attention of the shareholders of Cementos Argos S. A. and the general public:As legal representative of the company, I hereby certify that the consolidated financial statements as of December 31, 2016, which have been made public, do not contain any material flaws, imprecisions, or errors that could interfere with understanding of the actual assets and financial position or transactions made by Cementos Argos S. A. during the reporting period.
CERTIFICATION OF THE LEGAL REPRESENTATIVE OF THE COMPANY
Juan Esteban CalleLegal RepresentativeCementos Argos S. A.
INTE
GR
ATED
REP
OR
T 2016
94

Barranquilla, February 24, 2017
To the attention of the shareholders of Cementos Argos S. A.:We, the undersigned Legal Representative and Corporate Accounting Manager of Cementos Argos S. A., hereby certify that the consolidated financial statements of the company as of December 31, 2016 and 2015, have been faithfully taken from the accounting books and that the following statements have been verified before being disclosed to the shareholders and third parties:
a) All assets and liabilities included in the company’s financial statements as of December 31, 2016 and 2015 exist and all transactions included in those financial statements have been made during the years ending on those dates.
b) All the economic activities carried out by the company during the years ending on December 31, 2016 and 2015 have been recorded in the financial statements.
c) Assets represent probable future economic benefits (rights) and liabilities represent probable future financial commitments (obligations), obtained or accrued by the company as of December 31, 2016 and 2015.
d) All items have been recorded with their proper values in accordance with financial reporting standards applicable in Colombia.
e) All economic events that affected the company were correctly classified, described, and disclosed in the financial statements.
LEGAL REPRESENTATIVE AND CORPORATE ACCOUNTINGMANAGER OF THE COMPANY
Juan Esteban CalleLegal RepresentativeCementos Argos S. A.
Óscar Rodrigo Rubio C.Corporate Accounting ManagerT. P. 47208-T
95
05 A
ppen
dix

To the shareholders of CEMENTOS ARGOS S.A.:
Report on Consolidated Financial StatementsI have audited the consolidated financial statements of CEMENTOS ARGOS S.A. and its subsidiaries which comprise the consolidated statement of financial position as at Decem-ber 31st, 2016, and the related consolidated income statement and other comprehensive income, changes in shareholders’ equity and cash flow for the year then ended, and a summary of the main accounting policies and other explanatory notes. The consolidated financial statements as at December 31st 2015 which were audited by me and reported on February 25th, 2016 with no qualifications, are included for comparative purposes.
Management’s Responsibility for the Consolidated Financial StatementsManagement is responsible for the preparation and fair presentation of these consolidated financial statements in accordance with the Accounting and Financial Reporting Standards accepted in Colombia; and for such internal control as management determines is neces-sary to enable the preparation and presentation of consolidated financial statements that are free from material misstatements, whether due to fraud or error; selecting and applying appropriate accounting policies, as well as making accounting estimates that are reason-able in the circumstances.
Statutory Auditor’s ResponsibilityMy responsibility is to express an opinion on these consolidated financial statements based on my audit. I conducted my audit in accordance with International Auditing Stan-dards accepted in Colombia. Those standards require that I comply with ethical require-ments and plan and perform the audit to obtain reasonable assurance about whether the financial statements are free from material misstatements. An audit of financial statements involves performing procedures to obtain audit evidence about the amounts and disclosures in the consolidated financial statements. The audit procedures selected depend on the auditor’s professional judgment, including the assessment of the risks of material misstatements in the financial statements. As part of the risk assessments the auditor considers internal control relevant to the Company’s preparation and fair presenta-tion of the financial statements in order to design audit procedures that are appropriated in the circumstances, but not for the purpose of expressing an opinion on the effectiveness of the entity’s internal control. An audit also includes evaluating the appropriateness of accounting policies used and significant accounting estimates made by management, as well as evaluating the overall presentation of consolidated financial statement.
I believe that the audit evidence that I obtained is sufficient and appropriated to provide a basis for my audit opinion.
STATUTORY AUDITOR’S REPORT
INTE
GR
ATED
REP
OR
T 2016
96
OpinionIn my opinion, the consolidated financial statements referred to above, present fairly, in all material respects, the consolidated financial position of CEMENTOS ARGOS S.A. and its subsidiaries as at December 31st 2016, as well as the results of all its operations, the changes in its equity, and the cash flows for the year then ended, in accordance with the Accounting and Financial Reporting Standards accepted in Colombia.
These financial statements and notes to the financial statements were translated into En-glish for the convenience of readers outside Colombia from financial statements originally issued in Spanish.
Cesar Augusto Arango VélezStatutory Auditor | T.P. 197463-TDesignated by Deloitte & Touche Ltda. February 24th 2017
97
05 A
ppen
dix

Notes 2016 2015ASSETS
Cash and cash equivalents 5 $ 531,666 $ 545,708Derivative financial instruments 6 1,420 22,114Other financial current assets 7 2,301 3,676Trade receivables and other accounts receivable, net 8 1,318,499 1,071,587Tax receivable 9 269,904 278,959Inventories 10 839,247 727,709Prepaid expenses 78,992 64,268Assets held for sale or for distribution to owners 18 8,373 10,114Total current assets $ 3,050,402 $ 2,724,135Trade receivables and other accounts receivable, net 8 111,920 35,628Investments in associates and joint ventures 12 79,529 81,857Derivative financial instruments 6 650 324Other non-current financial assets 7 1,389,944 1,466,654Other intangible assets, net 14 1,117,529 1,202,700Biological assets 11 20,870 20,242Property, plants, and equipment, net 15 11,078,053 9,373,182Investment property, net 16 153,976 153,033Goodwill 17 1,753,268 1,836,087Deferred tax assets 9 396,172 550,883Prepaid expenses and other assets 4,490 2,273Total non-current assets $ 16,106,401 $ 14,722,863TOTAL ASSETS $ 19,156,803 $ 17,446,998LIABILITIESFinancial liabilities 19 2,485,743 1,145,372Trade liabilities and accounts payable 22 1,118,894 988,134Taxes, liens, and duties 9 238,443 323,805Employee benefits 23 146,716 145,041Provisions 24 88,947 86,055Other financial liabilities 25 - 45,019Derivative financial instruments 6 102,555 -Outstanding bonds and preferred shares 26 475,621 263,840Prepaid income and other liabilities 25 181,198 154,955Liabilities associated with assets held for sale or for distribution to owners 18 824 856Total current liabilities $ 4,838,941 $ 3,153,077Financial liabilities 19 2,402,996 2,283,782Trade liabilities and accounts payable 22 9,497 10,495Employee benefits 23 287,129 245,395Derivative financial instruments 6 8,901 172,156Provisions 24 180,670 186,920Outstanding bonds and preferred shares 26 1,948,877 1,984,955Other liabilities 25 43,063 8,720Deferred tax liabilities 9 363,150 663,992Total non-current liabilities $ 5,244,283 $ 5,556,415
TOTAL LIABILITIES $ 10,083,224 $ 8,709,492
EQUITY (SEE ATTACHED STATEMENT) $ 9,073,579 $ 8,737,506TOTAL EQUITY AND LIABILITIES $ 19,156,803 $ 17,446,998
Notes are an integral part of the consolidated financial statments.
Cementos Argos S. A. and subsidiaries
As of December 31 | millions of Colombian pesosCONSOLIDATED STATEMENT OF FINANCIAL POSITION
INTE
GR
ATED
REP
OR
T 2016
98

Notes 2016 2015CONTINUING OPERATIONSIncome from operations 32 $ 8,517,382 $ 7,912,003Cost of sales 10 6,595,353 6,097,927Gross profit $ 1,922,029 $ 1,814,076Administrative expenses 34 699,310 598,662Selling expenses 35 263,373 264,387Other income (expenses) from operations, net 36 79,532 (11,608)Impairment of goodwill and non-current assets 17 56,517 234Operating profit $ 982,361 $ 939,185Financial expenses, net 38 340,828 274,963Foreign currency exchange gains, net 30,157 33,107Share of net loss of associates and joint ventures (1,824) (787)Profit before income tax $ 669,866 $ 696,542Income tax 9 107,354 126,905Income from continuing operations for the year 39 $ 562,512 $ 569,637Net discontinued operations, after tax 18 - (13,315)NET INCOME FOR THE YEAR $ 562,512 $ 556,322
Income for the period attributable to:Owners of the parent company 419,970 491,357Non-controlling interest 31 142,542 64,965Net income for the year $ 562,512 $ 556,322
OTHER COMPREHENSIVE INCOME, NET OF TAXESItems that will not be reclassified to profit or loss:Loss on new measurements of defined benefits obligations $ (40,019) $ (9,982)Gains (losses) from equity investments measured at fair value 159,965 (257,854)Income tax on items that will not be reclassified to profit or loss 26,049 3,830 Total items that will not be reclassified to profit or loss $ 145,995 $ (264,006)Items that will be reclassified to profit or loss:Net profit (loss) of cash-flow hedging instruments 15,109 (5,929)(Losses) gains from foreign currency translation differences (363,944) 1,235,118 Income tax on items that will be reclassified to profit or loss (6,391) (3,534)Total items that will be reclassified to profit or loss $ (355,226) $ 1,225,655 OTHER COMPREHENSIVE INCOME, NET OF TAXES $ (209,231) $ 961,649TOTAL COMPREHENSIVE INCOME FOR THE PERIOD $ 353,281 $ 1,517,971
Other comprehensive income attributable to:Owners of the parent company (160,716) 836,090Non-controlling interest (48,515) 125,559Other comprehensive income $ (209,231) $ 961,649
Total comprehensive income attributable to:Owners of the parent company 259,254 1,327,447Non-controlling interest 94,027 190,524Total comprehensive income $ 353,281 $ 1,517,971
Earnings per share:Basic, net income attributable to owners of the parent 40 364,66 426,65Basic, net income from continuing operations attributable to owners of the parent 364,66 438,21Basic, net income from discontinued operations attributable to owners of the parent - (11,56)
The notes are an integral part of the consolidated financial statements.
Cementos Argos S. A. y subsidiarias
CONSOLIDATED STATEMENT OF COMPREHENSIVE INCOMEAs of December 31 | millions of Colombian pesos
99
05 A
ppen
dix

The
note
s ar
e an
inte
gral
par
t of
the
con
solid
ated
fina
ncia
l sta
tem
ents
.
Cem
ento
s A
rgos
S. A
. and
sub
sidi
arie
s
CO
NS
OLI
DATE
D S
TATE
ME
NT
OF
CH
AN
GES
IN
EQ
UIT
Y
As o
f Dec
embe
r 31
| m
illio
ns o
f Col
ombi
an p
esos
Issu
ed
Cap
ital
Tre
asury
shar
es
Sta
tuto
ryre
serv
eO
ther
rese
rves
Reta
ined
ear
ning
s
Oth
er
com
prehe
nsiv
ein
com
e a
nd
oth
er
com
pone
nts
Equ
ity
attr
ibu
tabl
eto
the
ow
ners
o
f th
e p
are
nt
com
pany
No
n-co
ntro
llin
gin
tere
stE
quit
y
Bal
ance
as
of J
anua
ry 1
, 2015
1,5
58,2
90
(113,7
97)
19,1
31
1,1
38,4
98
1,9
18,3
64
2,5
27,1
49
7,0
47,6
35
466,4
88
7,5
14,1
23
Net
inco
me
for
the
perio
d -
- -
- 491,3
57
- 491,3
57
64,9
65
556,3
22
Oth
er c
ompr
ehen
sive
inco
me
for
the
perio
d,
net
of in
com
e ta
x -
- -
- -
836,0
90
836,0
90
125,5
59
961,6
49
Com
preh
ensi
ve in
com
e fo
r th
e pe
riod
- -
- -
491,3
57
836,0
90
1,3
27,4
47
190,5
24
1,5
17,9
71
Cas
h di
vide
nds
- -
- -
(204,9
98)
- (2
04,9
98)
(39,6
83)
(244,6
81)
Appr
opria
tion
of r
eser
ves
- -
2,0
25
16,2
92
(18,3
17)
- -
- -
Oth
er r
eser
ve m
ovem
ents
- -
- 38,4
93
(38,4
93)
- -
- -
Bus
ines
s co
mbi
natio
ns -
- -
- -
- -
23,0
05
23,0
05
Wea
lth t
ax -
- -
(54,3
24)
(374)
- (5
4,6
98)
(9)
(54,7
07)
Oth
er m
ovem
ents
- -
- -
(9,8
83)
(43)
(9,9
26)
(8,2
79)
(18,2
05)
Bal
ance
as
of D
ecem
ber
31, 2
015
1,5
58,2
90
(113,7
97)
21,1
56
1,1
38,9
59
2,1
37,6
56
3,3
63,1
96
8,1
05,4
60
632,0
46
8,7
37,5
06
Bal
ance
as
of J
anua
ry 1
, 2016
1,5
58,2
90
(113,7
97)
21,1
56
1,1
38,9
59
2,1
37,6
56
3,3
63,1
96
8,1
05,4
60
632,0
46
8,7
37,5
06
Net
inco
me
for
the
perio
d -
-
-
-
419,9
70
- 419,9
70
142,5
42
562,5
12
Oth
er c
ompr
ehen
sive
inco
me
for
the
perio
d,
net
of in
com
e ta
x -
-
-
-
- (1
60,7
16)
(160,7
16)
(48,5
15)
(209,2
31)
Com
preh
ensi
ve in
com
e fo
r th
e pe
riod
-
-
-
-
419,9
70
(160,7
16
)259,2
54
94,0
27
353,2
81
Tran
sfer
to
reta
ined
ear
ning
s -
-
-
-
209,0
90
(209,0
90)
- -
- C
ash
divi
dend
s -
-
-
-
(230,3
34)
-
(230,3
34)
(68,4
48)
(298,7
82)
Cas
h di
vide
nds
on p
refe
rred
sha
res
--
--
(29,8
11)
- (29,8
11)
- (29,8
11)
Cap
italiz
atio
n of
res
erve
s 5
84,0
23
-
-
(584,0
23)
-
-
- -
- Ap
prop
riatio
n of
res
erve
s -
-
167
358,2
11
(307,4
85)
-
50,8
93
- 5
0,8
93
Rel
ease
of re
serv
es -
-
-
(50,8
93)
-
-
(50,8
93)
- (50,8
93)
Cha
nges
in o
wne
rshi
p w
ith n
o lo
ss o
f co
ntro
l -
-
-
-
-
281,2
57
281,2
57
80,5
57
361,8
14
Wea
lth t
ax -
-
-
(47,4
38)
-
- (47,4
38)
(37)
(47,4
75)
Oth
er m
ovem
ents
-
-
(396)
-
4,4
29
- 4
,033
(6,9
87)
(2,9
54)
Bal
ance
as
of D
ecem
ber
31, 2
016
2,1
42,3
13
(113,7
97)
20,9
27
814,8
16
2,2
03,5
15
3,2
74,6
47
8,3
42,4
21
731,1
58
9,0
73,5
79
INTE
GR
ATED
REP
OR
T 2016
100

Las notas son parte integral de los estados financieros consolidados.
Cementos Argos S. A. and subsidiaries
CONSOLIDATED STATEMENT OF CASH FLOWSAs of December 31 | millions of Colombian pesos
Notes 2016 2015 CASH FLOWS FROM OPERATING ACTIVITIESNET INCOME $ 562,512 $ 556,322 Adjustments to reconcile profit:Depreciation and amortization 611,602 580,271 Income tax 107,354 126,905 Net financial expenses 378,945 277,165 Provisions, post-employment, and long-term defined benefit plans 13,830 27,950 Net impairment losses 73,183 21,724 (Gain) loss from exchange difference (64,133) 282,032 Net (gains) losses on fair value measurement 849 10,261 Share of net loss of associates and joint ventures 1,824 787 Net (gains) losses on the disposal of non-current assets (63,499) 864 Others, net (45,607) (32,763)Changes in the working capital of:Increase in inventory (49,103) (58,376)(Increase) decrease in receivables and other accounts receivable (501,795) 605,170 Increase (decrease) in liabilities and other accounts payable 3,444 (1,110,080)Total adjustments to reconcile profit 466,894 731,910 Net cash flows from operating activities $ 1,029,406 $ 1,288,232 CASH FLOWS FROM INVESTING ACTIVITIES
Cash flows used to obtain control of subsidiaries or other businesses 42 (2,088,959) (43,701)Acquisition of financial assets (10,648) (284)Proceeds from sale of financial assets 237,787 8,867 Acquisition of investment in associates and joint ventures (2,890) (170)Other charges for the sale or liquidation of investment in associates and joint ventures 2,323 -Proceeds from the sale of property, plant and equipment, and investment properties 100,676 27,054 Purchase of property, plants, and equipment and investment properties (746,842) (688,177)Purchase of intangible assets (10,124) (15,740)Dividends received 35,360 31,167 Payments from financial derivatives contracts (33,248) (106,312)Collection from financial derivatives contracts 24,456 16,091Net cash flows used in investing activities $ (2.492.109) $ (771,205)
CASH FLOWS FROM FINANCING ACTIVITIES
Proceeds from loans 6,302,204 3,310,956 Payments of loans and debt instruments (4,565,265) (3,123,908)Proceeds from bond issue 399,218 - Payment of outstanding bonds (212,561) (191,400)Payments for finance lease liabilities (30,355) (44,991)Dividends paid 30 (292,448) (241,226)Dividends paid on preferred shares (45,082) (48,325)Interest paid (353,667) (257,037)Disposals of ownership interests with no loss of control 288,008 -Net cash flows from (used in) financing activities $ 1,490,052 $ (595,931)INCREASE (DECREASE) OF CASH AND CASH EQUIVALENT BY OPERATIONS $ 27,349 $ (78,904)Net effect of foreign currency translation on cash and cash equivalents (41,391) 98,748 Net (decrease) increase of cash and cash equivalent (14,042) 19,844 CASH AND CASH EQUIVALENTS AT THE BEGINNING OF THE PERIOD 552,215 $ 532,371 CASH AND CASH EQUIVALENTS AT END OF PERIOD $ 538,173 $ 552,215
The notes are an integral part of the consolidated financial statements.
101
05 A
ppen
dix

Barranquilla, February 24, 2017
To the attention of the shareholders of Cementos Argos S. A. and the general public: As the legal legal representative of the company, I hereby certify that the separate financial statements as of December 31, 2016, which have been made public, do not contain any material flaws, imprecisions or errors that could impede the understanding of the actual assets and financial position or transactions made by Cementos Argos S. A. during the reporting period.
CERTIFICATION OF THE LEGAL REPRESENTATIVE OF THE COMPANY
Juan Esteban CalleLegal Representative
INTE
GR
ATED
REP
OR
T 2016
102

Barranquilla, February 24, 2017
To the attention of the shareholders of Cementos Argos S. A.: The undersigned Legal Representative and Corporate Accounting Manager of Cementos Argos S. A., hereby certifies that the separate financial statements of the company as of December 31, 2016 and 2015, have been faithfully taken from the accounting books and that the following statements have been verified before being disclosed to the shareholders and third parties:
a) All assets and liabilities included in the company’s financial statements as of December 31, 2016 and 2015 exist and all transactions included in those financial statements have been made during the years ended on those dates.
b) All of the economic activities carried out by the company during the years ended on December 31, 2016 and 2015 have been recorded in the financial statements.
c) Assets represent probable future economic benefits (rights) and liabilities represent probable future financial commitments (obligations), obtained or accrued by the company as December 31, 2016 and 2015.
d) All items have been recorded with their proper values in accordance with the financial reporting standards applicable in Colombia.
e) All economic events that affected the company were correctly classified, described and disclosed in the financial statements.
CERTIFICATION OF THE LEGAL REPRESENTATIVE AND CORPORATE ACCOUNTING MANAGER OF THE COMPANY
Juan Esteban CalleLegal Representative
Óscar Rodrigo Rubio C.Corporate Accounting ManagerT.P. 47208-T (See attached certification)
103
05 A
ppen
dix

To the shareholders of CEMENTOS ARGOS S.A.:
Report on Financial StatementsI have audited the financial statements of CEMENTOS ARGOS S.A. which comprise the statement of financial position as at December 31st, 2016, and the statement of income and other comprehensive income, changes in shareholders’ equity and cash flow for the year then ended, and a summary of the main accounting policies and other explanatory notes. The financial statements as at December 31st 2015 which were audited by me and reported on February 25th, 2016 with no qualifications, are included for comparative purposes.
Management’s Responsibility for the Financial StatementsManagement is responsible for the preparation and fair presentation of these finan-cial statements in accordance with the Accounting and Financial Reporting Standards accepted in Colombia, and for such internal control as management determines is necessary to enable the preparation and presentation of financial statements that are free from material misstatements, whether due to fraud or error; selecting and apply-ing appropriate accounting policies; as well as making accounting estimates that are reasonable in the circumstances.
Statutory Auditor’s ResponsibilityMy responsibility is to express an opinion on these financial statements based on my audit. I conducted my audit in accordance with International Auditing Standards accepted in Colombia. Those standards require that I comply with ethical require-ments and plan and perform the audit to obtain reasonable assurance about whether the financial statements are free from material misstatements. An audit of financial statements involves performing procedures to obtain audit evidence about the amounts and disclosures in the financial statements. The audit procedures selected depend on the auditor’s professional judgment, including the assessment of the risks of material misstatements in the financial statements. As part of the risk assessments the auditor considers internal control relevant to the Company’s preparation and fair presentation of the financial statements in order to design audit procedures that are appropriated in the circumstances, but not for the purpose of expressing an opinion on the effectiveness of the entity’s internal control. An audit also includes evaluating the appropriateness of accounting policies used and significant accounting estimates made by management, as well as evaluating the overall presentation of financial statement.
I believe that the audit evidence that I obtained is sufficient and appropriated to provide a basis for my audit opinion.
STATUTORY AUDITOR’S REPORT
INTE
GR
ATED
REP
OR
T 2016
104
OpinionIn my opinion, the financial statements referred to above, present fairly, in all material respects, the financial position of CEMENTOS ARGOS S.A. as at December 31st 2016, as well as the results of all its operations, the changes in its equity, and the cash flows for the year then ended, in accordance with the Accounting and Financial Reporting Standards accepted in Colombia.
Other Information The financial statements referred to above where prepared by the Management accord-ing with the legal requirements of information that applies to the Company as an inde-pendent entity, therefore these financial statements do not comprise the adjustments or eliminations that are necessary for the presentation of the consolidated financial statements of the Company and its subsidiaries. These separate financial statements should be read jointly with the consolidated financial statements of CEMENTOS ARGOS S.A. and its subsidiaries.
Report on Other Legal and Regulatory RequirementsBased on the scope of my audit, I report that the Company´s accounting records have been kept according to legal regulations and the accounting techniques; the transac-tions recorded in the accounting books and the acts by management conform to the bylaws and the decisions of the Shareholders´ Meeting and the Board of Directors; the correspondence, account vouchers and books of minutes and shareholder ledger are duly kept and preserved; the management´s report agrees with the basic finan-cial statements, the Company is not in default in the payment of contributions to the Integral Social Security System, and the mechanisms for money laundering prevention and control have been implementing in accordance with the instructions from Superin-tendencia Financiera de Colombia. My assessment of the internal control, performed with the purpose of defining the scope of my audit testing, highlighted the recommenda-tions about internal control which I have properly communicate to the Management in separate communications.
These financial statements and notes to the financial statements were translated into English for the convenience of readers outside Colombia from financial statements originally issued in Spanish.
Cesar Augusto Arango VélezStatutory Auditor | T.P. 197463-TAppointed by Deloitte & Touche Ltda. (See attached report)
February 24th 2017
105
05 A
ppen
dix

Cementos Argos S. A.
As of December 31| millions of Colombian PesosSEPARATE STATEMENT OF FINANCIAL POSITION
Notes 2016 2015
ASSETS Cash and cash equivalents 5 $ 117,587 $ 45,607Derivative financial instruments 6 - 22,114Trade receivables and other accounts receivable, net 8 835,952 1,120,302Tax receivable 9 123,581 158,725Inventories 10 139,250 134,697Prepaid expenses 15,818 14,954Non-current assets held for sale 17 - 2,389Total current assets $ 1,232,188 $ 1,498,788Trade receivables and other accounts receivable, net 8 789,885 747,857Investments in subsidiaries 13 7,082,018 6,609,054Investments in associates and joint ventures 12 56,420 56,295Derivative financial instruments 6 650 324Other financial assets 7 1,371,388 1,453,087Other intangible assets, net 14 379,227 406,808Biological assets 11 20,870 20,242Property, plant and equipment, net 15 2,073,902 1,927,152Investment property, net 16 105,298 101,674
Total non-current assets $ 11,879,658 $ 11,322,493
TOTAL ASSETS $ 13,111,846 $ 12,821,281
LIABILITIES Financial liabilities 18.19 472,596 662,810Trade liabilities and other accounts payable 21 570,199 599,689Taxes, liens and duties 9 65,343 152,586Derivative financial instruments 6 101,135 -Employee benefits liability 22 72,669 81,777Provisions 23 28,728 9,403Other financial liabilities 24 - 45,019Outstanding bonds and preferred shares 25 475,621 263,840Prepaid income and other liabilities 72,428 88,525
Total current liabilities $ 1,858,719 $ 1,903,649
Financial liabilities 18.19 240,858 217,227Trade liabilities and other accounts payable 21 5,766 8,543Employee benefits liability 22 271,125 231,036Derivative financial instruments 6 3,239 160,033Provisions 23 31,848 37,854Outstanding bonds and preferred shares 25 1,948,877 1,984,955Other liabilities 15,830 15,830Deferred tax liability 9 84,389 189,183
Total non-current liabilities $ 2,601,932 $ 2,844,661
TOTAL LIABILITIES $ 4,460,651 $ 4,748,310EQUITY (SEE ATTACHED STATEMENT) $ 8,651,195 $ 8,072,971TOTAL EQUITY AND LIABILITIES $ 13,111,846 $ 12,821,281
The notes are an integral part of the separate financial statements.
INTE
GR
ATED
REP
OR
T 2016
106

SEPARATE STATEMENT OF COMPREHENSIVE INCOMEAs of December 31| millions of Colombian Pesos
Cementos Argos S. A.
Notes 2016 2015CONTINUING OPERATIONS
Income from operations 30 $ 1,623,903 $ 1,898,076
Costs of goods sold 10 1,113,273 1,199,098
Gross profit $ 510,630 $ 698,978
Administrative expenses 31 314,101 281,472
Selling expenses 32 91,809 90,285
Other income (expenditure) from operations, net 33 69,189 (6,406)
Assets Impairment 15 49,033 -
Operating profit $ 124,876 $ 320,815
Financial income 34 68,002 66,420
Finance charges 35 291,143 236,947
Gain (loss) on the net monetary position, net 2,245 23,784
Net equity in investments income statement 775,441 355,258
Profit before income tax $ 679,421 $ 529,330
Income tax 9 (34,215) 28,834
Income from continuing operations for the year 36 713,636 $ 500,496
Net discontinued operations, after tax - (1,844)
Net Income for the year $ 713,636 $ 498,652
OTHER AFTER-TAX COMPREHENSIVE INCOME
Items that will not be reclassified after income statement for the period:
Earnings (loss) on new measurements of defined benefit obligations $ (39,240) $ (7,562)
Earnings (loss) from equity investments measured at fair value 156,623 (259,221)
Income tax of components that will not be reclassified 29,448 3,836
Total items that will not be reclassified after income statement for the period $ 146,831 $ (262,947)
Items that will be reclassified after income statement for the period:
Net profit (loss) of instruments in cash flow hedges 15,064 (5,813)
Exchange differences by foreign currency translation (258,349) 1,146,823
Income tax of components that will be reclassified (6,392) (3,536)
Total items that will be reclassified after income statement for the period $ (249,677) $ 1,137,474
OTHER COMPREHENSIVE INCOME, NET OF TAXES $ (102,846) $ 874,527
TOTAL COMPREHENSIVE INCOME FOR THE PERIOD $ 610,790 $ 1,373,179
The notes are an integral part of the separate financial statements. 107
05 A
ppen
dix

Issu
ed
capi
tal
Re
purc
hase
dtr
eas
ury
sto
cks
Re
serv
eO
the
rre
serv
es
Re
tain
ed
ear
ning
s
New
me
asu
re-
me
nts
of
defi
ned
bene
fits
obl
igat
ions
Pro
fits
and
lo
ssfr
om
equ
ity
inve
stm
ent
Net
ear
ning
sca
sh fl
ow
hedg
es
Exc
hang
edi
ffere
nces
by f
ore
ign
inve
st-
ment
str
ansl
atio
n
Inco
me
tax
equ
ity
Tota
l
Bal
ance
at
Janu
ary
1, 2
015
1,5
58,2
90
(113,7
97)
16,0
61
1,1
38,4
98
1,9
34,6
52
14,5
22
1,6
46,1
24
(9,1
64)
916,1
09
(7,4
62)
7,0
93,8
33
Inco
me
for
the
perio
d-
--
-498,6
52
--
--
-498,6
52
Oth
er c
ompr
ehen
sive
inco
me
for
the
perio
d, n
et o
f in
com
e ta
x-
--
--
(7,5
62)
(259,2
21)
(5,8
13)
1,1
46,8
23
301
874,5
28
Com
preh
ensi
ve in
com
e fo
r
the
period
-
--
-498,6
52
(7,5
62)
(259,2
21)
(5,8
13)
1,1
46,8
23
301
1,3
73,1
80
Cas
h di
vide
nds
--
--
(204,9
98)
--
--
-(2
04,9
98)
Appr
opria
tion
of r
eser
ves
--
-38,4
93
(38,4
93)
--
--
--
Wea
lth t
ax-
--
(40,6
04)
--
--
--
(40,6
04)
Equi
ty in
Sub
sidi
arie
s-
-419
2,5
72
(151,4
31)
--
--
-(1
48,4
40)
Bal
ance
at
Dec
embe
r 31, 2
015
1,5
58,2
90
(113,7
97)
16,4
80
1,1
38,9
59
2,0
38,3
82
6,9
60
1,3
86,9
03
(14,9
77)
2,0
62,9
32
(7,1
61)
8,0
72,9
71
Bal
ance
at
Janu
ary
1, 2
016
1,5
58,2
90
(113,7
97)
16,4
80
1,1
38,9
59
2,0
38,3
82
6,9
60
1,3
86,9
03
(14,9
77)
2,0
62,9
32
(7,1
61)
8,0
72,9
71
Inco
me
for
the
perio
d-
--
-713,6
36
--
--
-713,6
36
Oth
er c
ompr
ehen
sive
inco
me
for
the
perio
d, n
et o
f in
com
e ta
x-
--
--
(39,2
40)
156,6
23
15,0
64
(258,3
49)
23,0
56
(102,8
46)
Com
preh
ensi
ve in
com
e fo
r
the
period
-
--
-713,6
36
(39,2
40)
156,6
23
15,0
64
(258,3
49)
23,0
56
610,7
90
Tran
sfer
s fr
om t
he o
ther
co
mpr
ehen
sive
inco
me
to r
etai
ned
earn
ings
-
--
-209,0
90
-(2
09,0
90)
--
--
Cas
h or
dina
ry d
ivid
ends
--
--
(230,3
34)
--
--
-(2
30,3
34)
Cas
h pr
efer
red
divi
dend
s-
--
-(2
9,8
11)
--
--
-(2
9,8
11)
Cap
italiz
atio
n of
res
erve
s584,0
23
--
(584,0
23)
--
--
--
-W
ealth
tax
--
-(3
4,7
06)
--
--
--
(34,7
06)
Con
stitu
tion
of r
eser
ves
--
-275,7
50
(224,8
57)
--
--
-50,8
93
Rel
ease
of re
serv
es-
--
(50,8
93)
--
--
--
(50,8
93)
Cha
nges
in p
artic
ipat
ion
of
subs
idia
ries
with
out
cont
rol l
oss
--
--
89
--
--
-89
Equi
ty in
Sub
sidi
arie
s-
-7,2
73
77,0
25
177,8
98
--
--
-262,1
96
Bal
ance
at
Dec
embe
r 31, 2
016
2,1
42,3
13
(113,7
97)
23,7
53
822,1
12
2,6
54,0
93
(32,2
80)
1,3
34,4
36
87
1,8
04,5
83
15,8
95
8,6
51,1
95
The
note
s ar
e an
inte
gral
par
t of
the
sep
arat
e fin
anci
al s
tate
men
ts.
SEPA
RATE
STA
TEM
EN
T O
F C
HA
NG
ES
IN
EQ
UIT
Y
As o
f Dec
embe
r 31|
mill
ions
of C
olom
bian
Pes
os
Cem
ento
s A
rgos
S. A
.
INTE
GR
ATED
REP
OR
T 2016
108

2016 2015CASH FLOW FROM OPERATING ACTIVITIES NET INCOME $ 713,636 $ 498,652
Adjustments to reconcile profit:
Depreciation and amortization 156,330 111,194
Income tax (34,215) (4,790)
Net financial expenses 273,106 195,861
Provisions, post-employment and long-term defined benefit plans (19,038) 17,140
Assets impairment (Property, plant and equipment, inventories and trade receivables) 60,804 2,838
Gain on exchange difference (37,808) (76,634)
(Gain) loss from fair value measurement 19,516 (4,895)
Participation in the (gain) loss on investments (775,441) (355,258)
(Gain) Loss on the disposal of non-current assets 5,183 (2,156)
Other income and expenses not in cash (59,573) 21,198
Changes in the working capital of:
Increase in inventory (10,933) (20,447)
Increase in receivables and other accounts receivable 60,464 19,776
Decrease in other assets (29,916) 1,193
Decrease in liabilities and other accounts payable (1,629) 385,507
Increase (Decrease) in labor liabilities 2,579 16,779
Decrease in provisions - (20,045)
Increase in other liabilities (94,927) 5,092
Total adjustments to reconcile profit (loss) (485,498) 292,353
Net cash flows from (used in) operating activities $ 228,138 $ 791,005
CASH FLOWS FROM INVESTING ACTIVITIES
Cash flows from sales of subsidiaries or joint ventures - (5,462)
Purchase of equity in associates and joint ventures (125) -
Amount received from the sale of property, plant and equipment and investment properties (3,833) 5,040
Purchase of property, plant and equipment and investment properties (228,987) (387,013)
Amount received from the sale of intangible assets 237,637 -
Purchase of intangible assets (3,394) (10,831)
Dividends received 334,128 153,390
Net cash flows in investing activities 18,589 215,843
Flujos netos de efectivo originados por actividades de inversión $ 354,015 $ (29,033)
CASH FLOWS FROM INVESTING ACTIVITIES
Cash flows from sales of subsidiaries without control loss 115,327 -
Amount received from loans 2,392,096 1,550,030
Payments of loans and debt instruments (2,634,672) (1,704,208)
Payment for finance lease liabilities (34,360) (19,782)
Proceeds from bond issue 399,218 -
Payment of outstanding bonds (212,561) (191,400)
Interest paid (272,496) (192,486)
Dividends paid for ordinaries shares (217,643) (201,543)
Dividends paid for preferred shares (45,082) (48,325)
Other cash flows from financing activities - (78,434)
Net cash flows originated from financing activities $ (510,173) (886,148)
Increase (decrease) of cash and cash equivalent by operations $ 71,980 $ (124,176)
CASH AND CASH EQUIVALENTS AT THE BEGINNING OF THE PERIOD 45,607 169,783
CASH AND CASH EQUIVALENT AT THE END OF THE PERIOD $ 117,587 $ 45,607
The notes are an integral part of the separate financial statements
Cementos Argos S. A.
As of December 31| millions of Colombian Pesos
SEPARATE STATEMENT OF CASH FLOWS
$
109
05 A
ppen
dix


Innovation
Inno
vatio
n
Occupational Health and Safety
Occu
patio
nal H
ealth
an
d Sa
fety
Suppliers development and management
Supp
liers
dev
elop
men
t an
d m
anag
emen
t
Community Engagement
Com
mun
ity
Enga
gem
ent
Profitability and Capital Structure
Profi
tabi
lity
and
Capi
tal S
truct
ure
Customer Relationship Management
Cust
omer
Rel
atio
nshi
p M
anag
emen
tExpansion and Consolidation
Geog
raph
ic E
xpan
sion
an
d Co
nsol
idat
ion
Other Air Emissions
Othe
r Air
Emis
sion
s
Energy and Co-processing
Ener
gy a
nd
Co-p
roce
ssin
g
Talent Management
Tale
nt M
anag
emen
tCO2 Emissions and Climate change
CO2 E
mis
sion
s an
d Cl
imat
e Ch
ange
Biodiversity
Biod
iver
sity
Sustainable Construction and Materials
Sust
aina
ble
Cons
truct
ion
and
Mat
eria
ls
Compliance
Regu
lato
ry
Com
plia
nce
Water Management
Wat
er M
anag
emen
t
MATERIAL ASPECTS INTERRELATIONS
Content element Included Aspects / Chapter Page
Basis for preparation and presentationLetter from our Chairman 5
About this report 6
Organizational vision and operational contextOur foundations 8
Letter from our CEO 5
GovernanceOur foundations 44
Governance of each material topic See the first page of each material topic in this report
Business model risks and opportunities Our foundations 34
Strategy and resources Our foundations See the Management Report on page 8
Future projections Future projections for every material topic
See the Upcoming Challenges sections of each of the material topics in this report
IIRC INDEX
111
05 A
ppen
dix

Principles Progress Goals Page
AREA: HUMAN RIGHTS | Vision: Human Rights Policy 90
1Businesses should support and respect the protection of internationally proclaimed human rights
1. In 2016, we reached 200,912 hours of training on policies and proce-dures related to human rights. In the Colombian Region, we also trained 100% of local authorities that safeguard operations in Colombia and 65 supplier companies.
2. We launched an online human rights toolkit for local mining suppliers.
3. We evaluated 637 suppliers in the Colombia, and the Caribbean and Central America Region on human rights areas such as labor practices, including the prohibition of child labor, forced labor, freedom of association and collective bargaining, health and safety, and other related topics such as environmental performance and anti-corruption and transparency practices.
4. We disseminated the results of the human rights due diligence process to employees.
5. When the due diligence process with employees showed that 48.2% of our country operations had high exposure to the human rights risk of “violation of life, liberty, health and personal safety,” we continued with implementation of mitigation plans through the I Promise Project in all Argos operations.
6. As a result of gaps identified in the HR due diligence process with employees, Argos adopted and disseminated a corporate due process procedure.
1. Continue raising human rights awareness among our stakeholders. In 2017, we will launch a human rights course on Educa that will be available to our employees in all three regions. In addition, we will continue to train suppliers and local authorities in order to ensure a supply chain that is both, responsible and sustainable and the development of alliances of trust at local operations.
2. Continue to evaluate our suppliers on human rights through screening processes both before and after negotiations in order to monitor their performance.
3. Continue implementing the Human Rights Management Model with employees by updating the risks maps and adapting the corporate work plan to local contexts.
4. Expand the scope of the Human Rights Management Model by including a human rights approach to the risk analysis pro-cesses of communities and suppliers.
62 84 86
2 Make sure that the company is not complicit in human rights abuses.
AREA: LABOR | Vision: Talent Management Policy - Equality and Diversity Policies 86
3 Businesses should uphold the freedom of association and the effective recognition of the right to collective bargaining
1. We respect the right to join or not join unions. There are 16 unions at Argos.
2. We believe in dialogue. In 2016 Argos held 306 meeting with unions.
3. We continued to build agreement through collective bargaining. In 2016 a total of 6 collective agreements were adopted.
4. We believe in the importance of trusting relations with our employees. A total of 180 employees, including union members, the talent management team, and other employees, participated in the Workplace Studies Program event in the Colombia Region.
5. Argos values the participation of unions in strategic processes. In 2016 unions actively participated in the implementation of the I Promise Project (health and safety) and in the Equipares Seal (gender equity)
1. Aware of the importance of preparing our employees to address business challenges and achieve our goals, we will continue to strengthen our Educa training model.
2. Reinforce our pillars of culture in different geographical areas in which we operate and promote leadership styles that embody the pillar of respect.
3. Continue to promote work-life balance initiatives.
4. Continue strengthening trusting relationships with our unions, promoting dialogue and capacity-building initiatives.
5. Because we believe diversity is a competitive advantage, we will continue to promote respect and intercultural mobility.
6. Continue to disseminate the Transparency Hotline as, an anonymous mechanism available to all our stakeholders that allows remediation for human rights cases as well as labor practices, community and environmental impacts, and fraud.
86
4 The elimination of all forms of forced and compulsory labor
1. Argos continues to reaffirm its commitment the elimination of all forms of forced and compulsory labor. In 2016, a total of 200,744 hours of training on human rights policies and procedures was given.
2. Argos consistently promotes work-life balance; in Colombia, we continued implementing the telecommuting program and the gradual return of maternity leave. In 2017, we launched a benefit for new parents in this Region, which grants paid leave of one hour a day during the month following of the birth of the child.
3. The risk of forced and compulsory labor is monitored throught the Human Rights Management Model; as a result of the analysis, no operation was identified as having a high exposure to this risk; however, there are opportunities for improvements in regarding the monitoring of overtime.
4. We continued to raise awareness among our suppliers of the prohibition of forced and compulsory labor, and we continued to include this criterion as part of our selection and evaluation mechanisms. In 2016, a total of 637 suppliers were evaluated.
GLOBAL COMPACT COMMUNICATION ON PROGRESS
INTE
GR
ATED
REP
OR
T 2016
112

Principles Progress Goals Page
5The effective abolition of child labor
1. Argos continues to reaffirm its commitment to the elimination of all forms of forced and compulsory labor. In 2016, a total of 200,744 hours of training on human rights policies and procedures was given.
2. The risk of child labor is monitored throught the Human Rights Management Model; as a result of the analysis, no operation was identified as having high exposure to this risk.
3. We continued to raise awareness among our suppliers of the prohibition of child labor, and we continued to include this criterion as part of our selection and evaluation mechanisms. In 2016, a total of 637 suppliers were evaluated.
1. Aware of the importance of preparing our employees to address business challenges and achieve our goals, we will continue to strengthen our Educa training model.
2. Reinforce our pillars of culture in different geographical areas in which we operate and promote leadership styles that embody the pillar of respect.
3. Continue to promote work-life balance initiatives.
4. Continue strengthening trusting relationships with our unions, promoting dialogue and capacity-building initiatives.
5. Because we believe diversity is a competitive advantage, we will continue to promote respect and intercultural mobility.
6. Continue to disseminate the Transparency Hotline as, an anonymous mechanism available to all our stakeholders that allows remediation for human rights cases as well as labor practices, community and environmental impacts, and fraud.
86
6 The elimination of discrimination in employment and occupation
1. We continue to reaffirm our commitment to the promotion of equality and diversity. In 2016, a total of 200,744 hours of training on human rights policies and procedures was given.
2. The risk of discrimination is monitored throught the Human Rights Management Model; as a result of the analysis, no operation was identified as having high exposure to this risk.
3. In 2016, we received the Equipares Silver Seal in recognition of our gender equality practices in the concrete business in Colombia, follow-ing up on the 2015 Equipares Silver Seal we obtained for the cement business in this region.
4. In collaboration with UC Berkely, we held the second session of the Leadership for Equality Program.
AREA: ENVIRONMENT | Vision: Environmental Policy 68
7 Businesses should support a precautionary approach to environmental challenges 1. 6.8% substitution of fossil fuels
2. 6.5% alternative materials substitution in cement and 2.3% in concrete
3. 29% reduction in CO2 emissions per ton of cementitious products
Other air emissions reductions: 88% reduction in dust emissions per ton of clinker 74% reduction in SOx emissions per ton of clinker 1.58 kg NOx per ton of clinker
5. 37% reduction in water consumption for cement and 13% for concrete
6. Closure plans in place for 78% of quarries
We have stablished the following as 2025 goals:
1. Reach 18% of heat consumption substitu-tion through use of alternative fuels.
2. Decrease heat consumption by 10% and electricity consumption by 15% (2012 baseline).
3. Reach 7% of alternative material use in cement business.
4. Reach 3% of alternative material use in concrete business.
5. 35% reduction in CO2 emissions per ton of cementitious products by 2025.
6. 100% of active quarries with closure plans in place.
7. 85% reduction of dust emissions.
8. 65% reduction in SO2 emissions.
9. Stabilization of NOx emissions. (1.35kg/t clinker).
10. Reduce specific water consumption by 30% for the cement business and 20% for concrete production.
707274767880
8 Undertake initiatives to promote greater environmental responsibility
9 Encourage the development and diffusion of environmentally friendly technologies
AREA: ANTI-CORRUPTION | Vision: Antifraud Policy. Code of Business Conduct. Code of Good Governance 50
10 Businesses should work against corruption in all its forms, including extortion and bribery
1. 38,46% of our operations were analyzed for corruption risks.
1. 2,945 hours of training on transparency and anti-corruption issues for our stakeholders.
2. In 2016, 31 corruption cases were received, 45 were addressed (including pending cases from 2015), and 27 were resolved.
1. Continue with the training plan and dissemination of corporate policies and their regional annexes in all the countries where we operate.
50
113
05 A
ppen
dix
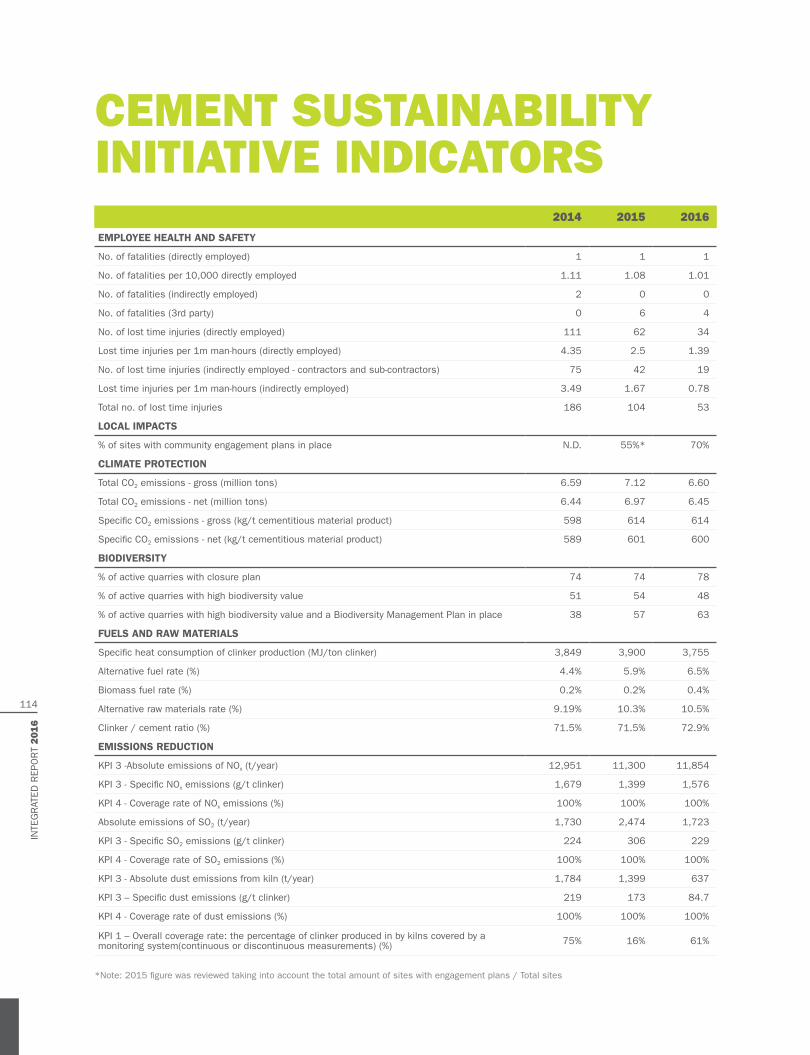
CEMENT SUSTAINABILITY INITIATIVE INDICATORS
2014 2015 2016
EMPLOYEE HEALTH AND SAFETY
No. of fatalities (directly employed) 1 1 1
No. of fatalities per 10,000 directly employed 1.11 1.08 1.01
No. of fatalities (indirectly employed) 2 0 0
No. of fatalities (3rd party) 0 6 4
No. of lost time injuries (directly employed) 111 62 34
Lost time injuries per 1m man-hours (directly employed) 4.35 2.5 1.39
No. of lost time injuries (indirectly employed - contractors and sub-contractors) 75 42 19
Lost time injuries per 1m man-hours (indirectly employed) 3.49 1.67 0.78
Total no. of lost time injuries 186 104 53
LOCAL IMPACTS
% of sites with community engagement plans in place N.D. 55%* 70%
CLIMATE PROTECTION
Total CO2 emissions - gross (million tons) 6.59 7.12 6.60
Total CO2 emissions - net (million tons) 6.44 6.97 6.45
Specific CO2 emissions - gross (kg/t cementitious material product) 598 614 614
Specific CO2 emissions - net (kg/t cementitious material product) 589 601 600
BIODIVERSITY
% of active quarries with closure plan 74 74 78
% of active quarries with high biodiversity value 51 54 48
% of active quarries with high biodiversity value and a Biodiversity Management Plan in place 38 57 63
FUELS AND RAW MATERIALS
Specific heat consumption of clinker production (MJ/ton clinker) 3,849 3,900 3,755
Alternative fuel rate (%) 4.4% 5.9% 6.5%
Biomass fuel rate (%) 0.2% 0.2% 0.4%
Alternative raw materials rate (%) 9.19% 10.3% 10.5%
Clinker / cement ratio (%) 71.5% 71.5% 72.9%
EMISSIONS REDUCTION
KPI 3 -Absolute emissions of NOx (t/year) 12,951 11,300 11,854
KPI 3 - Specific NOx emissions (g/t clinker) 1,679 1,399 1,576
KPI 4 - Coverage rate of NOx emissions (%) 100% 100% 100%
Absolute emissions of SO2 (t/year) 1,730 2,474 1,723
KPI 3 - Specific SO2 emissions (g/t clinker) 224 306 229
KPI 4 - Coverage rate of SO2 emissions (%) 100% 100% 100%
KPI 3 - Absolute dust emissions from kiln (t/year) 1,784 1,399 637
KPI 3 – Specific dust emissions (g/t clinker) 219 173 84.7
KPI 4 - Coverage rate of dust emissions (%) 100% 100% 100%
KPI 1 – Overall coverage rate: the percentage of clinker produced in by kilns covered by a monitoring system(continuous or discontinuous measurements) (%) 75% 16% 61%
*Note: 2015 figure was reviewed taking into account the total amount of sites with engagement plans / Total sites
INTE
GR
ATED
REP
OR
T 2016
114

2014 2015 2016
KPI 2 – Coverage rate continuous measurement: the percentage of clinker produced by kilns which have installed continuous measurement for dust, NOx and SO2. (%) 68% 87% 91%
KPI 3 -VOC / THC - Absolute emissions (t/year) N.D. 91.23 251.60
KPI 3 -VOC / THC - Specific emissions in (g/t clinker) N.D. 26.28 50.29
KPI 4 -VOC / THC - Coverage rate (%) N.D. 43% 67%
KPI 3 -PCDD / F - Absolute emissions (mg/year) N.D. 54.31 24.03
KPI 3 -PCDD / F - Specific emissions in (ng/t clinker) N.D. 20.08 4.15
KPI 4 -PCDD / F - Coverage rate (%) N.D. 34% 77%
KPI 3 Hg - Absolute emissions (kg/year) N.D. 166.2 224.4
KPI 3 Hg - Specific emissions (mg/t clinker) N.D. 40.63 36.24
KPI 4 Hg - Coverage Rate (%) N.D. 51% 82%
KPI 3 HM1 (Cd + Tl) - Absolute emissions in (kg/year) N.D. 172.3 26.3
KPI 3 HM1 (Cd + Tl) - Specific emissions (mg/t clinker) N.D. 33.63 4.84
KPI 4 HM1 (Cd + Tl) - Coverage rate (%) N.D. 63% 82%
KPI 3 HM2 (Sum of Sb, As, Pb, Cr, Co, Cu, Mn, Ni, V) - (kg/year) N.D. 514 2678
KPI 3 HM2 (Sum of Sb, As, Pb, Cr, Co, Cu, Mn, Ni, V) - Specific emissions (mg/t clinker) N.D. 100 432
KPI 4 HM2 (Sum of Sb, As, Pb, Cr, Co, Cu, Mn, Ni, V) – coverage rate (%) N.D. 63% 82%
WATER
Total water withdrawal according to source (m3) N.D. 10,606,830 13,407,143
Total water discharge according to quality and destination (m3) N.D. 2,532,501 4,823,563
Total water consumption (m3) N.D. 8,074,329 8,583,580
% Of plants with recirculation system N.D. 72% 72%
% Of sites with process water – aggregates N.D. 100% 100%
% Of sites with water recycling system – aggregates N.D. 80% 33%
115
05 A
ppen
dix

General ContentGRI Standard Name Location
in the ReportExternal
verificationUN Global Compact
(advanced) SDG
FOUNDATION
101
Foundation: a. Reporting principles b. Using the GRI Standards for sustainability reporting c. Claims related to the use of the GRI Standards
1. ORGANIZATIONAL PROFILE
102-1 Name of the organization Cementos Argos S.A. X Required for COP
102-2 Activities, brands, products, and services 3 X Required for COP
102-3 Location of headquarters
Headquarters: Calle 7D No. 43A-99 (Medellín, Colombia) Registered address: Vía 40, Las Flores (Barranquilla, Colombia)
X Required for COP
102-4 Location of operations 3 and 14 X Required for COP
102-5 Ownership and legal form Corporation X Required for COP
102-6 Markets served 14 X Required for COP
102-7 Scale of the organization 87 X Required for COP
102-8 Information on employees and other workers 87 X Required for COP 8
102-9 Supply chain 63 X 2 and required for COP
102-10 Significant changes to the organization and its supply chain
Purchase of the Martinsburg plant in the USA X 2 and required for COP
102-11 Precautionary principle or approach 68 X
102-12 External initiatives 37 X
102-13 Membership in associations 37 X 18
2. STRATEGY
102-14 Statement from senior decision-maker Letter from our CEO X 19
102-15 Key impacts, risks, and opportunities 34 X 19
3. ETHICS AND INTEGRITY
102-16 Values, principles, standards, and norms of behavior 50 X 12 to 14 11, 16
102-17 Mechanisms for advice and concerns about ethics 52 X 12 to 14 11, 16
4. GOVERNANCE
102-18 Governance structure 45 X 1
102-19 Delegating authority 45 X 1, 20
102-20 Executive-level responsibility for economic, environmental, and social topics 45 X 1, 20
102-21 Consulting stakeholders on economic, environmental, and social topics 43 X 1, 20 16
102-22 Composition of the highest governance body and its committees 45 X 1 5, 16
102-23 Chair of the highest governance body 46 X 1 16
102-24 Nominating and selecting the highest governance body 48 X 1 5, 16
102-25 Conflicts of interest 48 X 1, 20 16
102-26 Role of highest governance body in setting purpose, values, and strategy 44 X 1
102-27 Collective knowledge of highest governance body 46 X 1, 20 3
GLOBAL REPORTING INITIATIVE CONTENT INDEX
INTE
GR
ATED
REP
OR
T 2016
116
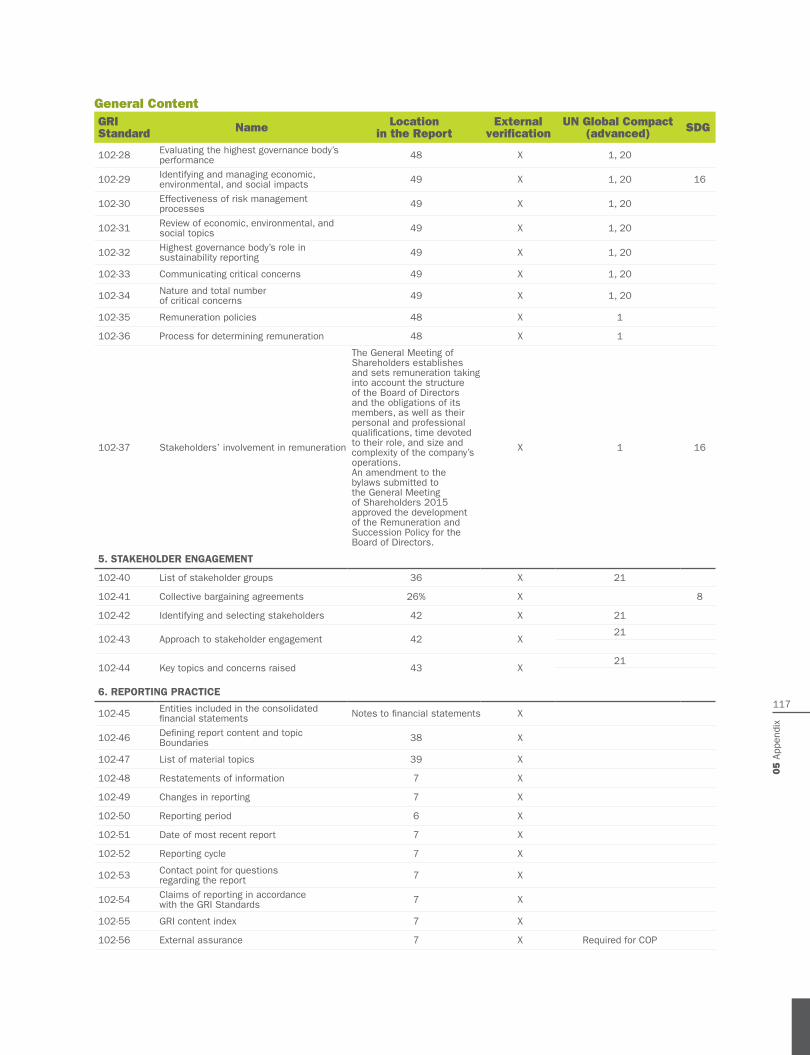
General ContentGRI Standard Name Location
in the ReportExternal
verificationUN Global Compact
(advanced) SDG
102-28 Evaluating the highest governance body’s performance 48 X 1, 20
102-29 Identifying and managing economic, environmental, and social impacts 49 X 1, 20 16
102-30 Effectiveness of risk management processes 49 X 1, 20
102-31 Review of economic, environmental, and social topics 49 X 1, 20
102-32 Highest governance body’s role in sustainability reporting 49 X 1, 20
102-33 Communicating critical concerns 49 X 1, 20
102-34 Nature and total number of critical concerns 49 X 1, 20
102-35 Remuneration policies 48 X 1
102-36 Process for determining remuneration 48 X 1
102-37 Stakeholders’ involvement in remuneration
The General Meeting of Shareholders establishes and sets remuneration taking into account the structure of the Board of Directors and the obligations of its members, as well as their personal and professional qualifications, time devoted to their role, and size and complexity of the company’s operations. An amendment to the bylaws submitted to the General Meeting of Shareholders 2015 approved the development of the Remuneration and Succession Policy for the Board of Directors.
X 1 16
5. STAKEHOLDER ENGAGEMENT
102-40 List of stakeholder groups 36 X 21
102-41 Collective bargaining agreements 26% X 8
102-42 Identifying and selecting stakeholders 42 X 21
102-43 Approach to stakeholder engagement 42 X21
102-44 Key topics and concerns raised 43 X21
6. REPORTING PRACTICE
102-45 Entities included in the consolidated financial statements Notes to financial statements X
102-46 Defining report content and topic Boundaries 38 X
102-47 List of material topics 39 X
102-48 Restatements of information 7 X
102-49 Changes in reporting 7 X
102-50 Reporting period 6 X
102-51 Date of most recent report 7 X
102-52 Reporting cycle 7 X
102-53 Contact point for questions regarding the report 7 X
102-54 Claims of reporting in accordance with the GRI Standards 7 X
102-55 GRI content index 7 X
102-56 External assurance 7 X Required for COP
117
05 A
ppen
dix
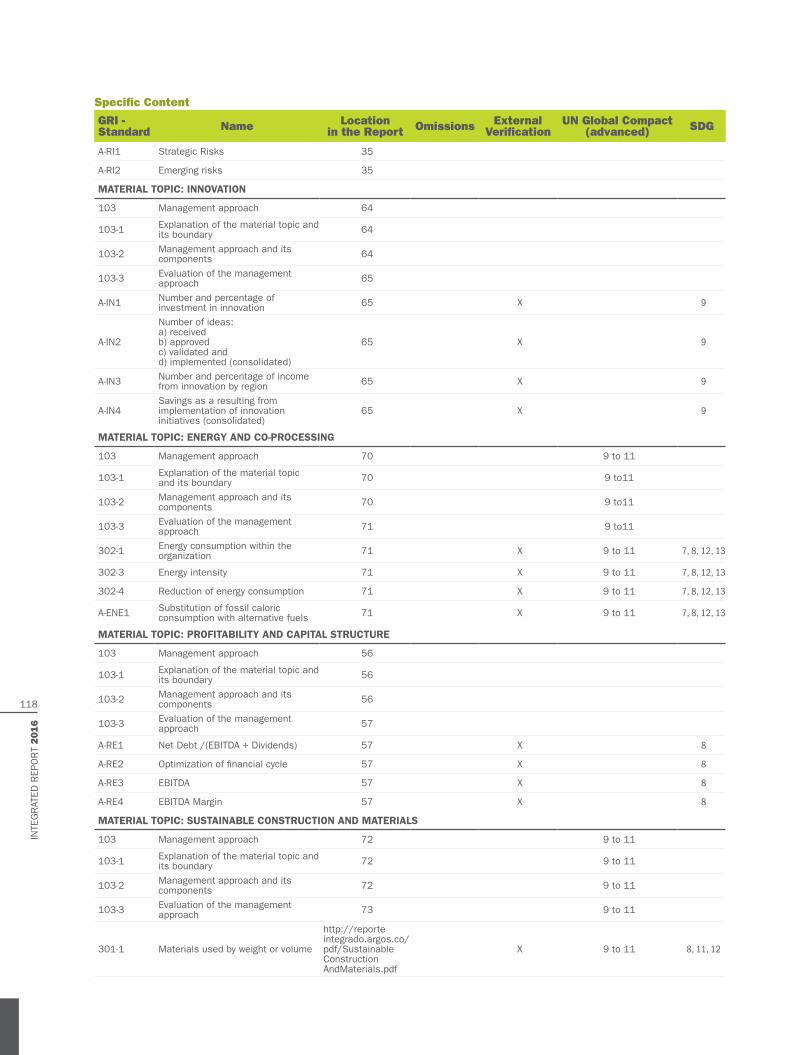
Specific Content
GRI - Standard Name Location
in the Report Omissions External Verification
UN Global Compact (advanced) SDG
A-RI1 Strategic Risks 35
A-RI2 Emerging risks 35
MATERIAL TOPIC: INNOVATION
103 Management approach 64
103-1 Explanation of the material topic and its boundary 64
103-2 Management approach and its components 64
103-3 Evaluation of the management approach 65
A-IN1 Number and percentage of investment in innovation 65 X 9
A-IN2
Number of ideas: a) received b) approved c) validated and d) implemented (consolidated)
65 X 9
A-IN3 Number and percentage of income from innovation by region 65 X 9
A-IN4Savings as a resulting from implementation of innovation initiatives (consolidated)
65 X 9
MATERIAL TOPIC: ENERGY AND CO-PROCESSING
103 Management approach 70 9 to 11
103-1 Explanation of the material topic and its boundary 70 9 to11
103-2 Management approach and its components 70 9 to11
103-3 Evaluation of the management approach 71 9 to11
302-1 Energy consumption within the organization 71 X 9 to 11 7, 8, 12, 13
302-3 Energy intensity 71 X 9 to 11 7, 8, 12, 13
302-4 Reduction of energy consumption 71 X 9 to 11 7, 8, 12, 13
A-ENE1 Substitution of fossil caloric consumption with alternative fuels 71 X 9 to 11 7, 8, 12, 13
MATERIAL TOPIC: PROFITABILITY AND CAPITAL STRUCTURE
103 Management approach 56
103-1 Explanation of the material topic and its boundary 56
103-2 Management approach and its components 56
103-3 Evaluation of the management approach 57
A-RE1 Net Debt /(EBITDA + Dividends) 57 X 8
A-RE2 Optimization of financial cycle 57 X 8
A-RE3 EBITDA 57 X 8
A-RE4 EBITDA Margin 57 X 8
MATERIAL TOPIC: SUSTAINABLE CONSTRUCTION AND MATERIALS
103 Management approach 72 9 to 11
103-1 Explanation of the material topic and its boundary 72 9 to 11
103-2 Management approach and its components 72 9 to 11
103-3 Evaluation of the management approach 73 9 to 11
301-1 Materials used by weight or volume
http://reporte integrado.argos.co/pdf/Sustainable Construction AndMaterials.pdf
X 9 to 11 8, 11, 12
INTE
GR
ATED
REP
OR
T 2016
118
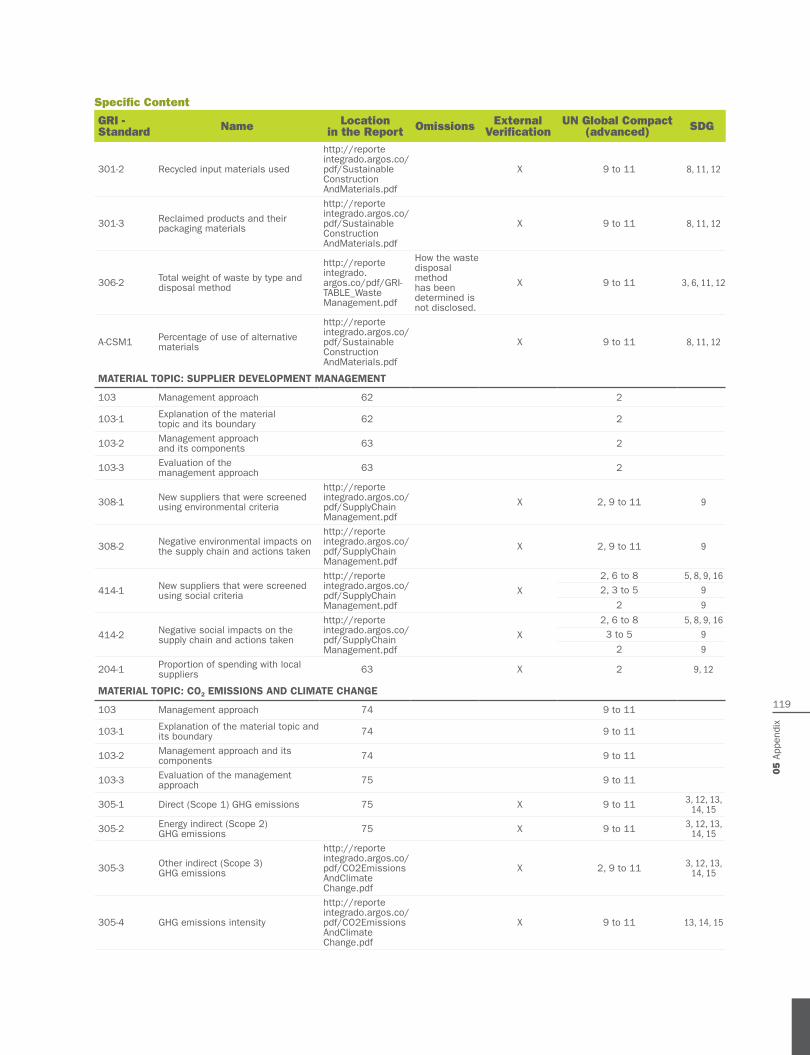
Specific Content
GRI - Standard Name Location
in the Report Omissions External Verification
UN Global Compact (advanced) SDG
301-2 Recycled input materials used
http://reporte integrado.argos.co/pdf/Sustainable Construction AndMaterials.pdf
X 9 to 11 8, 11, 12
301-3 Reclaimed products and their packaging materials
http://reporte integrado.argos.co/pdf/Sustainable Construction AndMaterials.pdf
X 9 to 11 8, 11, 12
306-2 Total weight of waste by type and disposal method
http://reporte integrado. argos.co/pdf/GRI-TABLE_Waste Management.pdf
How the waste disposal method has been determined is not disclosed.
X 9 to 11 3, 6, 11, 12
A-CSM1 Percentage of use of alternative materials
http://reporte integrado.argos.co/pdf/Sustainable Construction AndMaterials.pdf
X 9 to 11 8, 11, 12
MATERIAL TOPIC: SUPPLIER DEVELOPMENT MANAGEMENT
103 Management approach 62 2
103-1 Explanation of the material topic and its boundary 62 2
103-2 Management approach and its components 63 2
103-3 Evaluation of the management approach 63 2
308-1 New suppliers that were screened using environmental criteria
http://reporte integrado.argos.co/pdf/SupplyChainManagement.pdf
X 2, 9 to 11 9
308-2 Negative environmental impacts on the supply chain and actions taken
http://reporte integrado.argos.co/pdf/SupplyChainManagement.pdf
X 2, 9 to 11 9
414-1 New suppliers that were screened using social criteria
http://reporte integrado.argos.co/pdf/SupplyChainManagement.pdf
X
2, 6 to 8 5, 8, 9, 16
2, 3 to 5 9
2 9
414-2 Negative social impacts on the supply chain and actions taken
http://reporte integrado.argos.co/pdf/SupplyChainManagement.pdf
X
2, 6 to 8 5, 8, 9, 16
3 to 5 9
2 9
204-1 Proportion of spending with local suppliers 63 X 2 9, 12
MATERIAL TOPIC: CO2 EMISSIONS AND CLIMATE CHANGE
103 Management approach 74 9 to 11
103-1 Explanation of the material topic and its boundary 74 9 to 11
103-2 Management approach and its components 74 9 to 11
103-3 Evaluation of the management approach 75 9 to 11
305-1 Direct (Scope 1) GHG emissions 75 X 9 to 11 3, 12, 13, 14, 15
305-2 Energy indirect (Scope 2) GHG emissions 75 X 9 to 11 3, 12, 13,
14, 15
305-3 Other indirect (Scope 3) GHG emissions
http://reporte integrado.argos.co/pdf/CO2EmissionsAndClimate Change.pdf
X 2, 9 to 11 3, 12, 13, 14, 15
305-4 GHG emissions intensity
http://reporte integrado.argos.co/pdf/CO2EmissionsAndClimate Change.pdf
X 9 to 11 13, 14, 15
119
05 A
ppen
dix

Specific Content
GRI - Standard Name Location
in the Report Omissions External Verification
UN Global Compact (advanced) SDG
305-5 Reduction of GHG emissions
http://reporte integrado.argos.co/pdf/CO2EmissionsAndClimate Change.pdf
X 9 to 11 13, 14, 15
201-2Financial implications and other risks and opportunities due to climate change
http://reporte integrado.argos.co/pdf/CO2EmissionsAndClimate Change.pdf
X 13
A-EC1 CO2 Net specific emissions 75 X 9 to 11 3, 12, 13, 14, 15
MATERIAL TOPIC: OTHER AIR EMISSIONS
103 Management approach 76 9 to 11
103-1 Explanation of the material topic and its boundary 76 9 to 11
103-2 Management approach and its components 76 9 to 11
103-3 Evaluation of the management approach 77 9 to 11
305-7Nitrogen oxides (NOX), sulfur oxides (SOX), and other significant air emissions
77 X 9 to 11 3, 12, 14, 15
A-OE1
Specific SOX emissions and reduction goals Specific NOX emissions and reduction goals Specific emissions of dust and reduction goals
77 X 9 to 11 3,12, 14, 15
MATERIAL TOPIC: EXPANSION AND CONSOLIDATION
103 Management approach 58
103-1 Explanation of the material topic and its boundary 58
103-2 Management approach and its components 58
103-3 Evaluation of the management approach 59
A-X1Description of the company’s expansion process aligned with the organization’s strategic Mega
58 X 8
A-X2 Number and location of expansions carried out in the reporting period 59 X 8
A-X3Description of the new business consolidation process by performance of business plans
59 X 8
MATERIAL TOPIC: OCCUPATIONAL HEALTH AND SAFETY
103 Management approach 84 6 to 8
103-1 Explanation of the material topic and its boundary 84 6 to 8
103-2 Management approach and its components 84 6 to 8
103-3 Evaluation of the management approach 85 6 to 8
403-1Workers representation in formal joint management–worker health and safety committees
85 X 6 to 8 8
403-2
Types of injury and rates of injury, occupational diseases, lost days, absenteeism, and number of work-related fatalities
http://reporte integrado.argos.co/pdf/Occupational HealthAnd Safety.pdf
Data is not broken down by gender; total is presented by years.
X 2, 6 to 8 3, 8
403-3Workers with high incidence or high risk of diseases related to their occupation
http://reporte integrado.argos.co/pdf/Occupational HealthAnd Safety.pdf
X 6 to 8 3, 8
INTE
GR
ATED
REP
OR
T 2016
120

Specific Content
GRI - Standard Name Location
in the Report Omissions External Verification
UN Global Compact (advanced) SDG
A-SI1Employees and contractors Lost Time Incident Frequency and Severity Rates
85 X
A-SI2 Number of injuries and fatalities of contractors and third parties
http://reporte integrado.argos.co/pdf/Occupational HealthAnd Safety.pdf
X
MATERIAL TOPIC: TALENT MANAGEMENT
103 Management approach 86 6 to 8
103-1 Explanation of the material topic and its boundary 86 6 to 8
103-2 Management approach and its components 87 6 to 8
103-3 Evaluation of the management approach
http://reporte integrado.argos.co/pdf/TalentManagement.pdf
6 to 8
202-2 Proportion of senior management hired from the local community
http://reporte integrado.argos.co/pdf/TalentManagement.pdf
X 8
401-1 New employee hires and employee turnover 87 X 6 to 8 5, 8
401-2Benefits provided to full-time employees that are not provided to temporary or part-time employees
http://reporte integrado.argos.co/pdf/TalentManagement.pdf
X 6 to 8 8
402-1 Minimum notice periods regarding operational changes
Timely communica-tion of organization-al changes is an essential element to achieve goals. Thus, we have a strategy of internal means that allows us to cover all of employees and geographies. An advance notice in number of weeks before putting orga-nizational changes into practice has not been standard-ized. However, there are formal commu-nication channels with employee trade unions, including meetings with a defined frequency.
X 6 to 8 8
404-1 Average hours of training per year per employee
http://reporte integrado.argos.co/pdf/TalentManagement.pdf
X 6 to 8 4, 5, 8
404-2Programs for upgrading employee skills and transition assistance programs
http://reporte integrado.argos.co/pdf/TalentManagement.pdf
X 6 to 8 8
404-3Percentage of employees receiving regular performance and career development reviews
http://reporte integrado.argos.co/pdf/TalentManagement.pdf
X 6 to 8 5, 8
405-1 Diversity of governance bodies and employees
http://reporte integrado.argos.co/pdf/TalentManagement.pdf
X 6 to 8 5, 8
405-2 Ratio of basic salary and remuneration of women to men
http://reporte integrado.argos.co/pdf/TalentManagement.pdf
X 6 to 8 5, 8, 10
121
05 A
ppen
dix

Specific Content
GRI - Standard Name Location
in the Report Omissions External Verification
UN Global Compact (advanced) SDG
MATERIAL TOPIC: CUSTOMER RELATIONSHIP MANAGEMENT
103 Management approach 60
103-1 Explanation of the material topic and its boundary 60
103-2 Management approach and its components 60
103-3 Evaluation of the management approach 61
417-2Incidents of non-compliance concerning product and service information and labeling
No incidents were identified during the reporting period
X 9 and 16
417-3Incidents of non-compliance concerning marketing communications
No incidents were identified during the reporting period
X 9 and 16
418-1Substantiated complaints concerning breaches of customer privacy and losses of customer data
No incidents were identified during the reporting period
X 9 and 16
A-RCL1 Percentage of income from retained customers 61 X 9
A-RCL2 Customer Satisfaction
http://reporte integrado.argos.co/pdf/Customer Satisfaction.pdf
X
MATERIAL TOPIC: ETHICS AND COMPLIANCE
103 Management approach 50 12 to 14
103-1 Explanation of the material topic and its boundary 50 12 to 14
103-2 Management approach and its components 50 12 to 14
103-3 Evaluation of the management approach 52 12 to 14
419-1 Non-compliance with social and economic laws and regulations
No lack of compliance with social, economic, or environmental laws and regulations was identified during the reporting period.
X 9 and 16
307-1 Non-compliance with environmental laws and regulations X 9 to 11 9 and 16
206-1Legal actions for anti-competitive behavior, anti-trust, and monopoly practices
51 X 9 and 16
205-1 Operations assessed for risks related to corruption
5 of our operations were assessed during the reporting period, accounting for 38.46% of our total operations.
X 12 to 14 9 and 16
205-2 Communication and training on anti-corruption policies and procedures
100% of our Execu-tive Level (President and Vice Presi-dents) were trained on transparency and anti-corruption matters. Link
Data is not broken down by region, employee type, or percentage.
X 12 to 14 9 and 16
205-3 Confirmed incidents of corruption and actions taken
No incidents of corruption were confirmed during the reporting period
X 12 to 14 9 and 16
415-1 Political contributions
No political contributions were made in the reporting period
X 17 9 and 16
A-ETH1 Environmental, social, labor and human rights complains. 53 X
A-TAX1 Taxes paid by country
http://reporte integrado.argos.co/pdf/EthicsAndCompliance.pdf
X
MATERIAL TOPIC: COMMUNITY MANAGEMENT
103 Management approach 88 12 to 14
103-1 Explanation of the material topic and its boundary 88 12 to 14
INTE
GR
ATED
REP
OR
T 2016
122
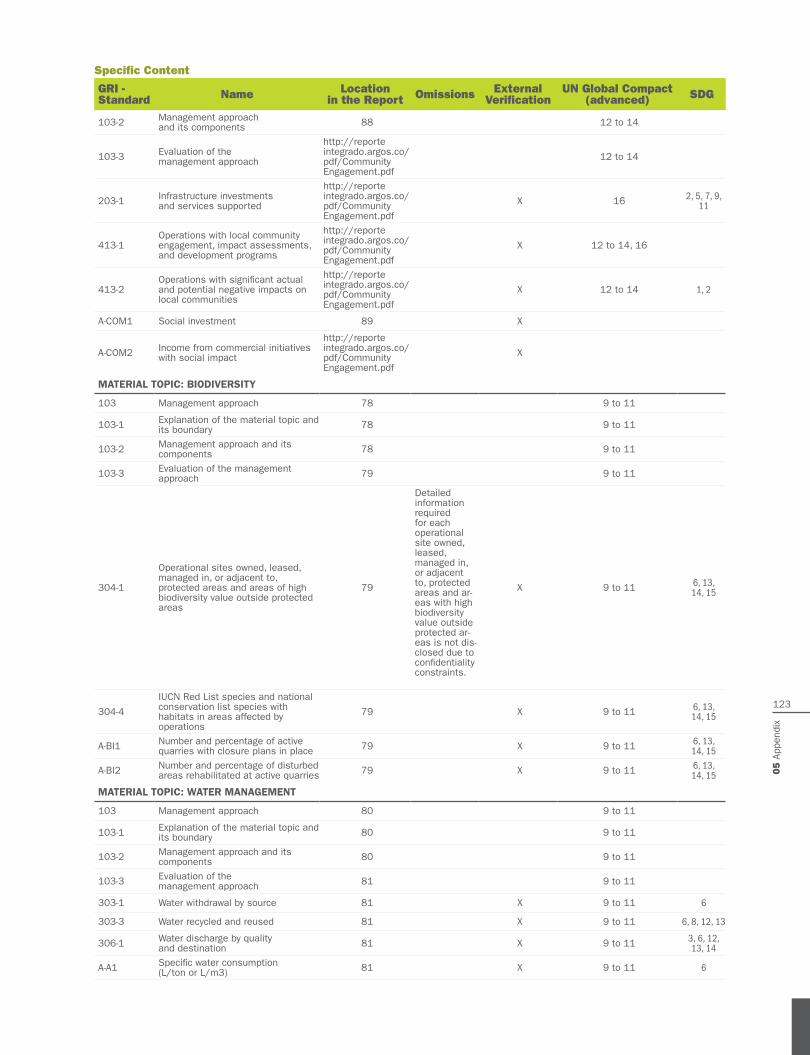
Specific Content
GRI - Standard Name Location
in the Report Omissions External Verification
UN Global Compact (advanced) SDG
103-2 Management approach and its components 88 12 to 14
103-3 Evaluation of the management approach
http://reporte integrado.argos.co/pdf/CommunityEngagement.pdf
12 to 14
203-1 Infrastructure investments and services supported
http://reporte integrado.argos.co/pdf/CommunityEngagement.pdf
X 16 2, 5, 7, 9, 11
413-1Operations with local community engagement, impact assessments, and development programs
http://reporte integrado.argos.co/pdf/CommunityEngagement.pdf
X 12 to 14, 16
413-2Operations with significant actual and potential negative impacts on local communities
http://reporte integrado.argos.co/pdf/CommunityEngagement.pdf
X 12 to 14 1, 2
A-COM1 Social investment 89 X
A-COM2 Income from commercial initiatives with social impact
http://reporte integrado.argos.co/pdf/CommunityEngagement.pdf
X
MATERIAL TOPIC: BIODIVERSITY
103 Management approach 78 9 to 11
103-1 Explanation of the material topic and its boundary 78 9 to 11
103-2 Management approach and its components 78 9 to 11
103-3 Evaluation of the management approach 79 9 to 11
304-1
Operational sites owned, leased, managed in, or adjacent to, protected areas and areas of high biodiversity value outside protected areas
79
Detailed information required for each operational site owned, leased, managed in, or adjacent to, protected areas and ar-eas with high biodiversity value outside protected ar-eas is not dis-closed due to confidentiality constraints.
X 9 to 11 6, 13, 14, 15
304-4
IUCN Red List species and national conservation list species with habitats in areas affected by operations
79 X 9 to 11 6, 13, 14, 15
A-BI1 Number and percentage of active quarries with closure plans in place 79 X 9 to 11 6, 13,
14, 15
A-BI2 Number and percentage of disturbed areas rehabilitated at active quarries 79 X 9 to 11 6, 13,
14, 15
MATERIAL TOPIC: WATER MANAGEMENT
103 Management approach 80 9 to 11
103-1 Explanation of the material topic and its boundary 80 9 to 11
103-2 Management approach and its components 80 9 to 11
103-3 Evaluation of the management approach 81 9 to 11
303-1 Water withdrawal by source 81 X 9 to 11 6
303-3 Water recycled and reused 81 X 9 to 11 6, 8, 12, 13
306-1 Water discharge by quality and destination 81 X 9 to 11 3, 6, 12,
13, 14
A-A1 Specific water consumption (L/ton or L/m3) 81 X 9 to 11 6
123
05 A
ppen
dix
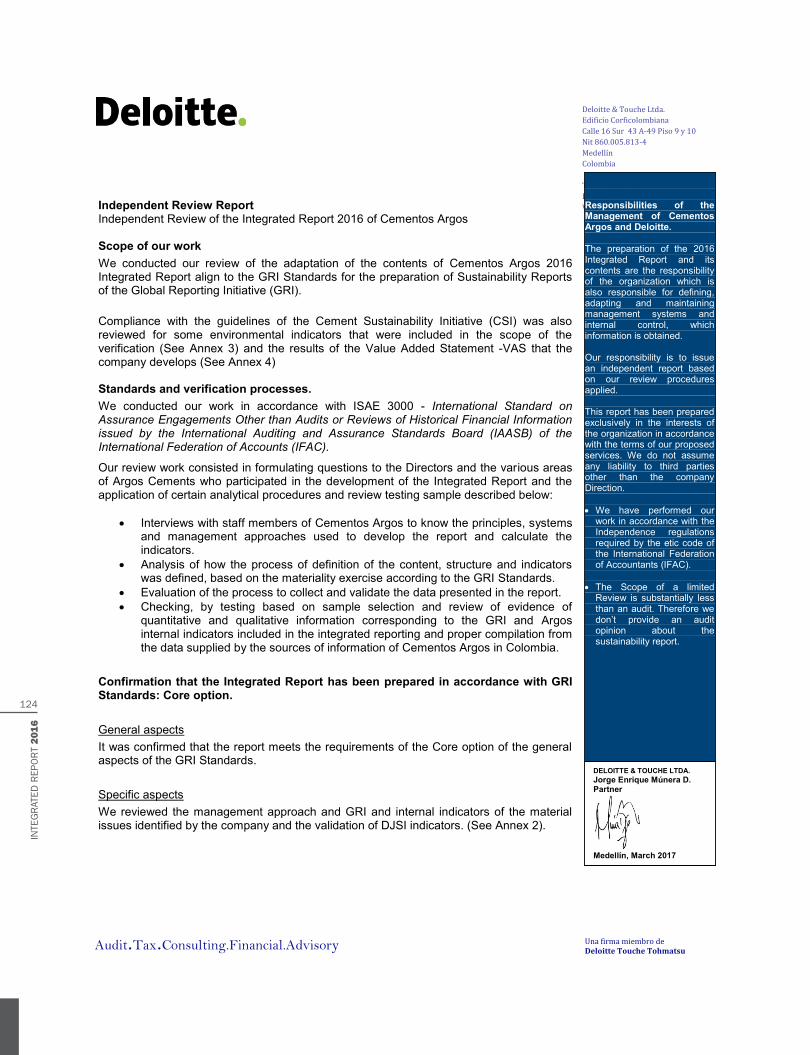
Una firma miembro de Deloitte Touche Tohmatsu Audit.Tax.Consulting.Financial.Advisory
Deloitte & Touche Ltda. Edificio Corficolombiana Calle 16 Sur 43 A-49 Piso 9 y 10 Nit 860.005.813-4 Medellín Colombia Tel : 57(4) 313 88 99 Fax : 57(4) 313 32 25 www.deloitte.com.co Independent Review Report
Independent Review of the Integrated Report 2016 of Cementos Argos Scope of our work We conducted our review of the adaptation of the contents of Cementos Argos 2016 Integrated Report align to the GRI Standards for the preparation of Sustainability Reports of the Global Reporting Initiative (GRI). Compliance with the guidelines of the Cement Sustainability Initiative (CSI) was also reviewed for some environmental indicators that were included in the scope of the verification (See Annex 3) and the results of the Value Added Statement -VAS that the company develops (See Annex 4) Standards and verification processes. We conducted our work in accordance with ISAE 3000 - International Standard on Assurance Engagements Other than Audits or Reviews of Historical Financial Information issued by the International Auditing and Assurance Standards Board (IAASB) of the International Federation of Accounts (IFAC).
Our review work consisted in formulating questions to the Directors and the various areas of Argos Cements who participated in the development of the Integrated Report and the application of certain analytical procedures and review testing sample described below:
Interviews with staff members of Cementos Argos to know the principles, systems and management approaches used to develop the report and calculate the indicators.
Analysis of how the process of definition of the content, structure and indicators was defined, based on the materiality exercise according to the GRI Standards.
Evaluation of the process to collect and validate the data presented in the report. Checking, by testing based on sample selection and review of evidence of
quantitative and qualitative information corresponding to the GRI and Argos internal indicators included in the integrated reporting and proper compilation from the data supplied by the sources of information of Cementos Argos in Colombia.
Confirmation that the Integrated Report has been prepared in accordance with GRI Standards: Core option. General aspects It was confirmed that the report meets the requirements of the Core option of the general aspects of the GRI Standards. Specific aspects We reviewed the management approach and GRI and internal indicators of the material issues identified by the company and the validation of DJSI indicators. (See Annex 2).
Responsibilities of the Management of Cementos Argos and Deloitte. The preparation of the 2016 Integrated Report and its contents are the responsibility of the organization which is also responsible for defining, adapting and maintaining management systems and internal control, which information is obtained. Our responsibility is to issue an independent report based on our review procedures applied. This report has been prepared exclusively in the interests of the organization in accordance with the terms of our proposed services. We do not assume any liability to third parties other than the company Direction. We have performed our
work in accordance with the Independence regulations required by the etic code of the International Federation of Accountants (IFAC).
The Scope of a limited
Review is substantially less than an audit. Therefore we don’t provide an audit opinion about the sustainability report.
DELOITTE & TOUCHE LTDA. Jorge Enrique Múnera D. Partner
Medellín, March 2017
INTE
GR
ATED
REP
OR
T 2016
124

Conclusions As a result of our review, there was nothing that make us believe that the integrated report contains significant errors or has not been prepared in accordance with the GRI Standards in its Core version. Recommendations Additionally, we have presented our recommendations to Cementos Argos regarding areas for improvement to strengthen processes, programs and related sustainability management systems. The most important recommendations concern:
Continue strengthening the process of standardization of reporting protocols in the different regions where the company operates.
To continue perform a periodic monitoring of progress in the management of material issues, which will make the reporting process more efficient at year end.
ANNEX 1 Declaration of Independence Deloitte is one of the largest companies of professional services in audit, tax, consulting and financial advisory and sustainability to public and private clients in multiple industries. With a globally connected network of member firms in more than 185 countries, Deloitte brings world-class capabilities and high quality service to its customers. Approximately 250,000 professionals are committed to becoming the standard of excellence. We confirm our independence from Cementos Argos. All our employees perform annual updates to the Ethics Policy which promptly declare that we have no conflicts of interest with Cementos Argos, its subsidiaries and its stakeholders.
ANNEX 2 Material Issues GRI or Internal Indicators
Innovation A-IN1, A-IN2, A-IN3, A-IN4
Carbon Emissions 305-1, 305-2, 305-3, 305-4, 305-5, 201-2, A-EC1
Sustainable Construction and materials 301-1, 301-2, 301-3, A-CSM1 Biodiversity 304-1, 304-4, A-BI1, A-BI2
Energy and co-processing 302-1, 302-3, 302-4, A-ENE1
Water 303-1, 303-3, 306-1, A-A1 Other emissions 305-7, A-OE1
Compliance 206-1, 205-1, 205-2, 205-3, 307-1, 415-1,419-1, A-TAX1
Customer relations
417-2, 417-3, 418-1, A-RCL1, A-RCL2
Expansion and consolidation A-X1, A-X2, A-X3
Profitability and capital structure A-RE1, A-RE2, A-RE3, A-RE4 Occupational health and safety 403-1, 403-2, 403-3, A-SI1, A-SI2
Communities management 203-1, 413-1, 413-2, A-COM1, A-COM2
Talent Management 202-2, 401-1, 401-2, 402-1, 404-1, 404-2, 404-3, 405-1, 405-2
Supply Chain Management 308-1, 308-2, 414-1, 414-2, 204-1
DJSI Indicator DJSI. 2.3.7 EP - Waste and 306-2
125
05 A
ppen
dix

ANNEX 3 – CSI As part of the verification process of the CSI environmental indicators, we performed calls to Argos operations; the selection took into account quantitative and qualitative variables, as it sought cover operations in the three regions where the company operates:
Cartagena Seca – Colombia Yumbo – Colombia Piedras Azules – Honduras Panamá Harleyville – USA Atlanta – Usa Zona Golfo – USA Miraflores – Panamá Caimito – Panamá Calle 80 – Colombia Fontibón – Colombia Mina arroyo de piedra - Colombia
In the calls, personnel responsible for internal reporting and data collection was interviewed, validating the consolidation process and sending that information to the corporate level. Criteria
For our review we considered the following CSI guidelines:
WBCSD's CO2 and Energy Accounting and Reporting Standard for the Cement Industry : The cement CO2 and Energy
Protocol WBCSD's CO2 and Energy Accounting and Reporting Standard for the Cement Industry : Emissions monitoring and
reporting WBCSD's Guidelines for the Selection and Use of Fuels and Raw Materials in the Cement Manufacturing Process WBCSD CSI Environmental and Social Impact Assessment (ESIA) WBCSD Guidelines on Quarry Rehabilitation
Assessment indicators and information consolidation process
• We test based on samples for evidence calculations to measure the following indicators:
Indicators Scope
WATER
Total water withdrawal according to source 2016 Total water discharge according to quality and destination 2016 Total water consumption 2016 % Of plants with recirculation system 2016 % Of sites with process water – aggregates 2016 % Of sites with water recycling system – aggregates 2016 BIODIVERSITY Number and % of active quarries with Closure Plan in place 2016 Number and % of active quarries with high biodiversity value 2016 Number and % of active quarries with high biodiversity value and a Biodiversity Management Plan in place
2016
CLIMATE PROTECTION Total CO2 emissions - gross (in million tonnes) 2016 Total CO2 emissions - net (million tonnes) 2016 Specific CO2 emissions - gross (kg CO2 / t cementitious material) 2016 Specific CO2 emissions -net (kg CO2 / t cementitious material) 2016
INTE
GR
ATED
REP
OR
T 2016
126

COMBUSTIBLES AND MATERIALS Alternative fuels rate (%) 2016 Specific heat consumption of clinker production (MJ/ t clinker) 2016 Biomass fuel rate (%) 2016 Clinker / Cement Ratio (%) 2016 Use of alternative raw materials (%) 2016 REDUCTION OF EMISSIONS KPI 1 – Overall coverage rate :the percentage of clinker produced in by kilns covered by a monitoring system(continuous or discontinuous measurements) (%)
2015-2016
KPI 2 – Coverage rate continuousmeasurement : thepercentage of clinker produced by kilns which have installed continuous measurement for dust NOx and SO2. (%)
2015-2016
KPI 3-Absolute dust emissions from kiln (t/year) 2016 KPI 3 – Specific dust emissions f (g/t clinker) 2016 KPI 3-Absolute NOx emissions (t/year) 2016 KPI 3 - Specific NOx emissions (g/t clinker) 2016 KPI 3 - Absolute SO2 emissions (t/year) 2016 KPI 3 - Specific SO2 emissions (g/t clinker) 2016 KPI 4 - Coverage rate of dust emissions (%) 2015-2016
KPI 4 - Coverage rate of NOx emissions (%)) 2015-2016
KPI 4 - Coverage ratefor SO2 emissions (%) 2015-2016
KPI 3 -VOC / THC - Absolute emissions (t/year) 2016 KPI 3 -VOC / THC - Specific emissions in (g/t clinker) 2016 KPI 4 -VOC / THC - Coverage rate (%) 2016 KPI 3 -PCDD / F - Absolute emissions (mg/yr) 2016 KPI 3 -PCDD / F - Specific emissions in (ng/t clinker) 2016 KPI 4 -PCDD / F - Coverage rate (%) 2016 KPI 3 Hg - Absolute emissions (kg/year) 2016 KPI 3 Hg - Specific emissions (mg/t clinker) 2016 KPI 4 Hg - Coverage Rate (%) 2016 KPI 3 HM1 (Cd + Tl) - Absolute emissions in (kg/year) 2016 KPI 3 HM1 (Cd + Tl) - Specific emissions (mg/t clinker) 2016 KPI 4 HM1 (Cd + Tl) - Coverage rate (%) 2016 KPI 3 HM2 (Sum of Sb, As, Pb, Cr, Co, Cu, Mn, Ni, V) - (kg/year( 2016 KPI 3 HM2 (Sum of Sb, As, Pb, Cr, Co, Cu, Mn, Ni, V) - Specific emissions inmg/tclinker 2016 KPI 4 HM 2 (Sum of Sb, As, Pb, Cr, Co, Cu, Mn, Ni, V) – coverage rate (%) 2016
Conclusion • The WBCSD CSI guidelines for reporting CO2 emissions, energy, emissions (NOx, SOx, and dust), water and biodiversity are applied properly. • The system of internal reporting and consolidation procedures of information for CO2 emissions, energy, emissions (NOx, SOx, and dust), water and biodiversity are functioning and provide appropriate information be disclosed.
127
05 A
ppen
dix

ANNEX 4 – VALUE ADDED STATEMENT Scope of our work
Review the included indicators for the construction of the Value Added Statement model, which allows to measure the societal value that the company creates.
Verification processes- Our review work has consisted of:
• Interviews with Cementos Argos staff to learn about the principles, systems and approaches used for the preparation of the Value Added Statement
• Analysis and identification of indicators used to prepare the Value Added Statement that are part of the verification process (GRI Standards, DJSI and / or CSI)
• Checking, by means of tests of review of the quantitative and qualitative information corresponding to the additional indicators that are not part of the verification process (GRI Standards, DJSI and / or CSI),:
Number of lost time injuries - short absence
Number of lost time injuries - long absence
Average salary (men & women) Average retirement age in the region (men) Average retirement age in the region (women) Average departure age (men)
Average departure age (women) Electricity provided to local communities Extreme water scarcity areas Scarcity areas Water stress areas Areas with sufficient water reserves Water abundant areas Net impacts to biodiversity per type of ecosystem (affected areas, restored areas, offset areas)
Conclusion
We have performed a verification process for all the indicators for 2015 and 2016 that were necessary for Argos to develop its Value Added Statement. .
INTE
GR
ATED
REP
OR
T 2016
128