integrated quality and operational compliance report - … … · · 2017-09-22integrated quality...
TRANSCRIPT

Integrated Quality and Operational
Compliance Report
Draft Report v1.4
August 2017
Page | 1

Contents
Domain Pages
Safe 03 to 13
Effective 14 to 18
Caring 19 to 22
Responsive 23 to 29
Well-led - Workforce 30 to 32
Domain Scorecard Summary 33 to 36
Glossary 37 to 42
Page | 2

Safe Commentary - Is Care Safe? August 2017
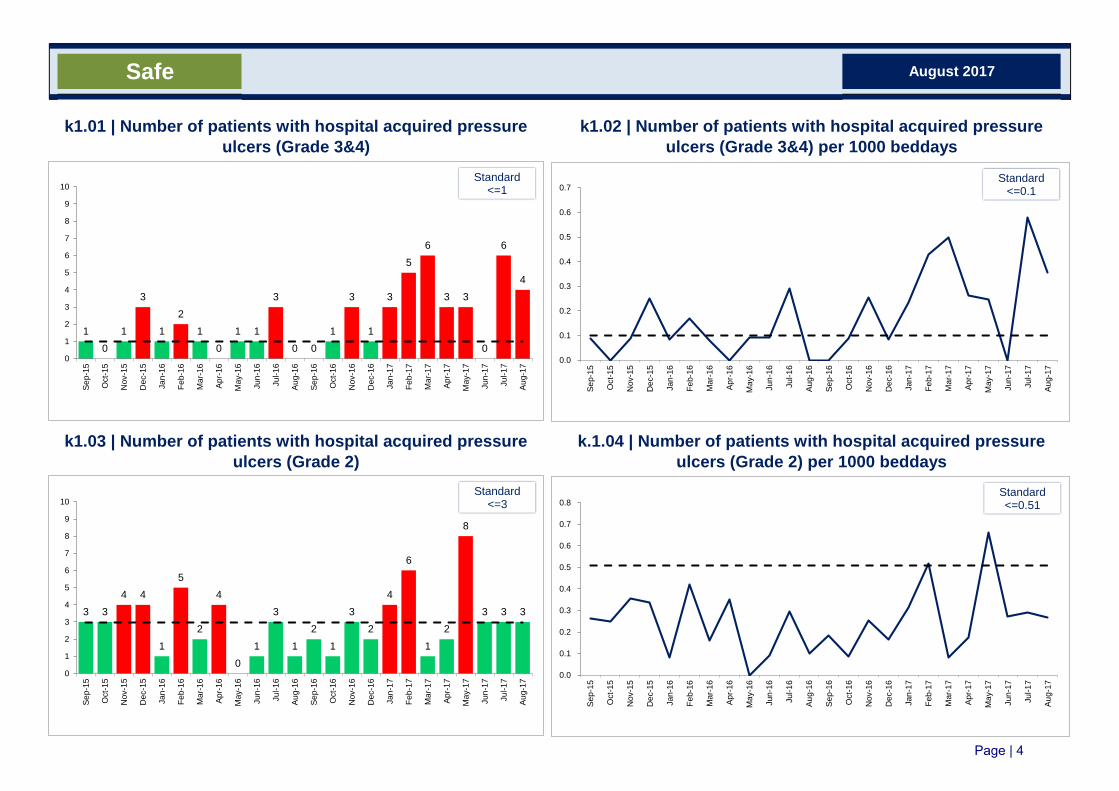
K1.03 Pressure Ulcers In August 2017, the Trust had 7 patients with Trust acquired pressure ulcers 4 of these were Grade 3/4 and 3 grade 2. All the pressure ulcers have been discussed at the PUMP group following which 4 were deemed avoidable and 3 unavoidable. Actions following PUMP have included further training on the use of anti-thromboembolic stockings, and ensuring appropriate staff attend the Tissue Viability study day, There have been specific communications with staff where this is deemed necessary. It has been noted and discussed with community teams and commissioners that there has been an increase of community acquired pressure ulcers in recent months. Good co-operation is being achieved to share learning and practice. The increasing numbers of patients who are being cared for in the hospital with pressure damage does however stretch the resource of the TVN team. There has been a focus on training in ED which is important both for recognition of patients being admitted with pressure damage and to ensure that all actions are put in place early to prevent deterioration or indeed new pressure damage occurring. New incontinence products are being sourced following an audit and evaluation of the current supplies. Whilst not statistically significant there is a suggestion that the number of more serious pressure ulcers is increasing in the Trust. An analysis of the this over the last 6 months is being undertaken and will be presented to Quality Assurance Committee in November 2017.
Infection Control (K1.19) - Gram Negative Blood Stream Infection rates In May 2017 NHS Improvement set a target to reduce Gram-negative bloodstream infections (GNBSIs) by 50% by 2021. Kingston Hospital NHS Foundation Trust is currently listed in the thirty trusts with the lowest rates of E. coli bacteraemia in 2016/17 (NHS Improvement 2017). The IPCT implemented an initial Action Plan in January 2017. Post Infection Review of all E coli blood stream infections (BSI’s) commenced as part of this plan. Baseline figures from April 1st – August 8th demonstrated that 57% of E. coli BSIs were related to urinary tract infections (UTIs), and learning points were identified. Other causes such as hepatobiliary; gastrointestinal and endocarditis identified no learning points. The Trust will target reducing urinary tract infections and a CAUTI (catheter associated urinary tract infection). A project group has been established to deliver the expanded action plan. 4.06 Safer Staffing - % of Registered Nurse and Midwife Expenditure on Agency Staff The significant reduction in agency expenditure is reflective of an accrual for cancelled shifts that had been included in previous months data. This figure therefore should be treated in this context as it represents a one-off financial adjustment accrued from previous months. July 2017
Page | 3
Safe August 2017
k1.02 | Number of patients with hospital acquired pressure
ulcers (Grade 3&4) per 1000 beddays
k1.01 | Number of patients with hospital acquired pressure
ulcers (Grade 3&4)
k1.03 | Number of patients with hospital acquired pressure
ulcers (Grade 2)
k.1.04 | Number of patients with hospital acquired pressure
ulcers (Grade 2) per 1000 beddays
1
0
1
3
1
2
1
0
1 1
3
0 0
1
3
1
3
5
6
3 3
0
6
4
0
1
2
3
4
5
6
7
8
9
10
Se
p-1
5
Oct-
15
Nov-1
5
Dec-1
5
Jan
-16
Feb-1
6
Mar-
16
Ap
r-16
May-1
6
Jun
-16
Jul-1
6
Au
g-1
6
Se
p-1
6
Oct-
16
Nov-1
6
Dec-1
6
Jan
-17
Feb-1
7
Mar-
17
Ap
r-17
May-1
7
Jun
-17
Jul-1
7
Au
g-1
7
Standard <=1
0.0
0.1
0.2
0.3
0.4
0.5
0.6
0.7
Se
p-1
5
Oct-
15
Nov-1
5
Dec-1
5
Jan
-16
Feb-1
6
Ma
r-1
6
Ap
r-16
May-1
6
Jun
-16
Jul-1
6
Au
g-1
6
Se
p-1
6
Oct-
16
Nov-1
6
Dec-1
6
Jan
-17
Feb-1
7
Mar-
17
Ap
r-17
May-1
7
Jun
-17
Jul-1
7
Au
g-1
7
Standard <=0.1
3 3
4 4
1
5
2
4
0
1
3
1
2
1
3
2
4
6
1
2
8
3 3 3
0
1
2
3
4
5
6
7
8
9
10
Se
p-1
5
Oct-
15
Nov-1
5
Dec-1
5
Jan
-16
Feb-1
6
Mar-
16
Ap
r-16
May-1
6
Jun
-16
Jul-1
6
Au
g-1
6
Se
p-1
6
Oct-
16
Nov-1
6
Dec-1
6
Jan
-17
Feb-1
7
Mar-
17
Ap
r-17
May-1
7
Jun
-17
Jul-1
7
Au
g-1
7
Standard <=3
0.0
0.1
0.2
0.3
0.4
0.5
0.6
0.7
0.8
Se
p-1
5
Oct-
15
Nov-1
5
Dec-1
5
Jan
-16
Feb-1
6
Ma
r-1
6
Ap
r-16
May-1
6
Jun
-16
Jul-1
6
Au
g-1
6
Se
p-1
6
Oct-
16
Nov-1
6
Dec-1
6
Jan
-17
Feb-1
7
Mar-
17
Ap
r-1
7
May-1
7
Jun
-17
Jul-1
7
Au
g-1
7
Standard <=0.51
Page | 4
Safe August 2017
k1.05 | MRSA Bacteraemias - Post 48 hour (Hospital
Acquired)k1.06 | MSSA Bacteraemias - Post 48 hour (Hospital Acquired)
k1.07 | Clostridium difficile infections - Post 72 hours
(Hospital Acquired)
k1.08 | Clostridium difficile infections - Post 72 hours (Hospital
Acquired) due to confirmed Lapse in Care
1
0 0 0 0 0
1
0 0 0 0 0 0 0
1
0
1 1
0
2
0 0 0 0 0
1
2
3
Se
p-1
5
Oct-
15
Nov-1
5
Dec-1
5
Jan
-16
Feb-1
6
Mar-
16
Ap
r-16
May-1
6
Jun
-16
Jul-1
6
Au
g-1
6
Se
p-1
6
Oct-
16
Nov-1
6
Dec-1
6
Jan
-17
Feb-1
7
Mar-
17
Ap
r-17
May-1
7
Jun
-17
Jul-1
7
Au
g-1
7
Standard Zero
4
2
0 0
1
3
1
0
2
0
2
1
2
1 1
0
5
1 1 1 1
0
1 1
0
1
2
3
4
5
6
7
Se
p-1
5
Oct-
15
Nov-1
5
Dec-1
5
Jan
-16
Feb-1
6
Mar-
16
Ap
r-16
May-1
6
Jun
-16
Jul-1
6
Au
g-1
6
Se
p-1
6
Oct-
16
Nov-1
6
Dec-1
6
Jan
-17
Feb-1
7
Mar-
17
Ap
r-17
May-1
7
Jun
-17
Jul-1
7
Au
g-1
7
Standard N/A
1
0 0 0 0 0 0 0 0 0 0 0 0 0 0 0
1
0 0 0 0 0 0 0 0
1
2
3
4
Se
p-1
5
Oct-
15
Nov-1
5
Dec-1
5
Jan
-16
Feb-1
6
Mar-
16
Ap
r-16
Ma
y-1
6
Jun
-16
Jul-1
6
Au
g-1
6
Se
p-1
6
Oct-
16
Nov-1
6
Dec-1
6
Ja
n-1
7
Feb-1
7
Mar-
17
Ap
r-17
May-1
7
Jun
-17
Jul-1
7
Au
g-1
7
Standard 9 for year
1 1 1
0 0 0
2
0 0
1
0 0 0 0 0 0 0
1
2
1
0 0 0 0 0
1
2
3
4
Se
p-1
5
Oct-
15
Nov-1
5
Dec-1
5
Jan
-16
Feb-1
6
Ma
r-1
6
Ap
r-16
May-1
6
Jun
-16
Jul-1
6
Au
g-1
6
Se
p-1
6
Oct-
16
Nov-1
6
Dec-1
6
Jan
-17
Feb-1
7
Ma
r-1
7
Ap
r-17
May-1
7
Jun
-17
Jul-1
7
Au
g-1
7
Standard <=1
Page | 5

Safe August 2017
k1.09 | Completed Patient Observations - Adult inpatients k1.10 | Completed Patient Observations - Paediatric inpatients
k1.11 | Patient Safety Thermometer - % Harm Free Care
0%
10%
20%
30%
40%
50%
60%
70%
80%
90%
100%
Se
p-1
5
Oct-
15
Nov-1
5
Dec-1
5
Jan
-16
Fe
b-1
6
Ma
r-1
6
Ap
r-16
May-1
6
Jun
-16
Jul-1
6
Au
g-1
6
Se
p-1
6
Oct-
16
Nov-1
6
Dec-1
6
Jan
-17
Fe
b-1
7
Ma
r-1
7
Ap
r-17
May-1
7
Jun
-17
Jul-1
7
Au
g-1
7
Standard N/A
86%
88%
90%
92%
94%
96%
98%
100%
Se
p-1
5
Oct-
15
No
v-1
5
Dec-1
5
Jan
-16
Feb-1
6
Mar-
16
Ap
r-16
May-1
6
Jun
-16
Ju
l-1
6
Au
g-1
6
Se
p-1
6
Oct-
16
No
v-1
6
Dec-1
6
Jan
-17
Feb-1
7
Mar-
17
Ap
r-17
May-1
7
Jun
-17
Ju
l-1
7
Au
g-1
7
Standard >=97%
90%
92%
94%
96%
98%
100%
Se
p-1
5
Oct-
15
No
v-1
5
Dec-1
5
Jan
-16
Feb-1
6
Mar-
16
Ap
r-16
May-1
6
Jun
-16
Ju
l-1
6
Au
g-1
6
Se
p-1
6
Oct-
16
No
v-1
6
Dec-1
6
Jan
-17
Feb-1
7
Mar-
17
Ap
r-17
May-1
7
Jun
-17
Ju
l-1
7
Au
g-1
7
Kingston National
Standard N/A
June data currently
unavailable
Page | 6

Safe August 2017
k1.12 | Number of Patient Safety Incident (PSI) Fallsk1.13 | Number of Patient Safety Incident Falls per 1000 G&A
beddays
k1.14 | Number of Patient Safety Incident Falls where
moderate or severe harm occurredk1.15 | Never Events
73 72
64 59
77 78
64
54
38
57 57 61 59
62
53 49
86
60 61
41
57 56
64 61
0
10
20
30
40
50
60
70
80
90
100
Se
p-1
5
Oct-
15
Nov-1
5
Dec-1
5
Jan
-16
Feb-1
6
Mar-
16
Ap
r-16
May-1
6
Jun
-16
Jul-1
6
Au
g-1
6
Se
p-1
6
Oct-
16
Nov-1
6
Dec-1
6
Jan
-17
Feb-1
7
Mar-
17
Ap
r-17
May-1
7
Jun
-17
Jul-1
7
Au
g-1
7
Standard <=58
3.0
4.0
5.0
6.0
7.0
8.0
Se
p-1
5
Oct-
15
Nov-1
5
Dec-1
5
Jan
-16
Feb-1
6
Ma
r-1
6
Ap
r-16
May-1
6
Jun
-16
Jul-1
6
Au
g-1
6
Se
p-1
6
Oct-
16
Nov-1
6
Dec-1
6
Jan
-17
Feb-1
7
Mar-
17
Ap
r-17
May-1
7
Jun
-17
Jul-1
7
Au
g-1
7
Standard <=5.3
2
1
0 0
3 3
2
4
0
1
2
4
1
2
1
3
4
0
1 1
0
2
1
2
0
1
2
3
4
5
6
7
Se
p-1
5
Oct-
15
Nov-1
5
Dec-1
5
Jan
-16
Feb-1
6
Mar-
16
Ap
r-16
May-1
6
Jun
-16
Jul-1
6
Au
g-1
6
Se
p-1
6
Oct-
16
Nov-1
6
Dec-1
6
Jan
-17
Feb-1
7
Mar-
17
Ap
r-17
May-1
7
Jun
-17
Jul-1
7
Au
g-1
7
Standard <=6
0 0 0 0 0 0 0 0 0 0
2
0
1
0 0 0 0 0 0 0 0 0 0 0 0
1
2
3
4
Se
p-1
5
Oct-
15
Nov-1
5
Dec-1
5
Jan
-16
Feb-1
6
Mar-
16
Ap
r-16
Ma
y-1
6
Jun
-16
Jul-1
6
Au
g-1
6
Se
p-1
6
Oct-
16
Nov-1
6
Dec-1
6
Ja
n-1
7
Feb-1
7
Mar-
17
Ap
r-17
May-1
7
Jun
-17
Jul-1
7
Au
g-1
7
Standard Zero
Page | 7

Safe August 2017
k1.16 | Medication Incidentsk1.17 | % of Medication Incidents Where Moderate or Severe
Harm Occurred
k1.18 | Number of Serious Untoward Incidents
64 68
64
77
65
56
42 49 49
46
60 65 63 63
56
48
67
53 46
30
51
75 73
61
0
10
20
30
40
50
60
70
80
90
100
Se
p-1
5
Oct-
15
Nov-1
5
Dec-1
5
Jan
-16
Feb-1
6
Mar-
16
Ap
r-16
May-1
6
Jun
-16
Jul-1
6
Au
g-1
6
Se
p-1
6
Oct-
16
Nov-1
6
Dec-1
6
Jan
-17
Feb-1
7
Mar-
17
Ap
r-17
May-1
7
Jun
-17
Jul-1
7
Au
g-1
7
Standard N/A
0%
1%
2%
3%
4%
5%
Se
p-1
5
Oct-
15
Nov-1
5
Dec-1
5
Jan
-16
Feb-1
6
Ma
r-1
6
Ap
r-16
May-1
6
Jun
-16
Jul-1
6
Au
g-1
6
Se
p-1
6
Oct-
16
Nov-1
6
Dec-1
6
Jan
-17
Feb-1
7
Mar-
17
Ap
r-17
May-1
7
Jun
-17
Jul-1
7
Au
g-1
7
Standard <=4%
6
0
3
4
5
3
2
4
2
0
3
5
2
0
1
9
5
4
3
2
3
2
3
1
0
2
4
6
8
10
12
Se
p-1
5
Oct-
15
Nov-1
5
Dec-1
5
Jan
-16
Feb-1
6
Mar-
16
Ap
r-16
May-1
6
Jun
-16
Jul-1
6
Au
g-1
6
Se
p-1
6
Oct-
16
Nov-1
6
Dec-1
6
Jan
-17
Feb-1
7
Mar-
17
Ap
r-17
May-1
7
Jun
-17
Jul-1
7
Au
g-1
7
Standard N/A
Page | 8

k1.19 | Number of Escherichia (E. coli) bacteraemia
Safe August 2017
k1.011/2 | Number of patients with hospital acquired pressure
ulcers (Grade 3&4) - Avoidable / Unavoidable
k1.031/2 | Number of patients with hospital acquired pressure
ulcers (Grade 2) - Avoidable / Unavoidable
0 0 1
0
2
4 4
2
0 0
2 2
0 1
2
0
1
1 2
1
3
0
4
2
0
1
2
3
4
5
6
7
8
9
10
Se
p-1
5
Oct-
15
Nov-1
5
Dec-1
5
Jan
-16
Feb-1
6
Ma
r-1
6
Ap
r-1
6
May-1
6
Jun
-16
Jul-1
6
Au
g-1
6
Avoidable Unavoidable
Standard N/A
8
18
14
20
12
14
10
12
17
15 16
12
14 14
12
6
0
2
4
6
8
10
12
14
16
18
20
22
Ap
r-16
May-1
6
Jun
-16
Jul-1
6
Au
g-1
6
Se
p-1
6
Oct-
16
Nov-1
6
Dec-1
6
Jan
-17
Feb-1
7
Mar-
17
Ap
r-17
May-1
7
Jun
-17
Jul-1
7
Standard N/A
1 0
3
1 2
5
0 0
4
2 1
2 1
1
0
1
2
1
1 2
4
1 2
1
0
1
2
3
4
5
6
7
8
9
10
Se
p-1
5
Oct-
15
Nov-1
5
Dec-1
5
Jan
-16
Feb-1
6
Mar-
16
Ap
r-16
May-1
6
Jun
-16
Jul-1
6
Au
g-1
6
Avoidable Unavoidable
Standard N/A
Page | 9

Safe
Ward Day Staffing Rate - RN/MW Day Staffing Rate - HCA Night Staffing Rate - RN/MW Night Staffing Rate - HCACare Hours Per Patient Day
(CHPPD)
AAU 95.39% 104.67% 95.98% 114.76% 8.14 RN Registered Nurse
Alex 112.96% 93.27% 103.23% 148.95% 6.19 MW Registered Midwife
Astor 99.17% 101.36% 97.85% 107.71% 6.22 HCA Healthcare Assistant
Blyth 127.28% 89.82% 269.57% 100.18% 8.47
Bronte 94.14% 153.16% 101.65% 101.61% 5.20
Cambridge 106.27% 133.61% 100.00% 118.97% 6.33
Canbury 98.41% 103.70% 98.39% 122.23% 6.34
Derwent 91.57% 111.29% 95.70% 154.28% 5.86
Hamble 100.65% 109.39% 102.20% 119.35% 5.85
Hardy 97.07% 131.84% 98.88% 230.01% 5.98
Intensive Care Unit 82.89% 81.18% 29.53
Isabella 91.14% 69.72% 85.08% 14.37% 10.30
Keats 87.29% 107.74% 78.45% 88.99% 7.60
Kennet 98.71% 103.86% 98.92% 132.40% 5.74
Neonatal Unit 100.00% 100.00% 100.00% 100.00% 9.45
Sunshine 96.09% 42.46% 102.42% 9.68% 15.57
Maternity 88.04% 69.57% 91.70% 74.49% 14.00
Trust 93.07% 99.37% 94.73% 100.28% 8.19
Key
August 2017
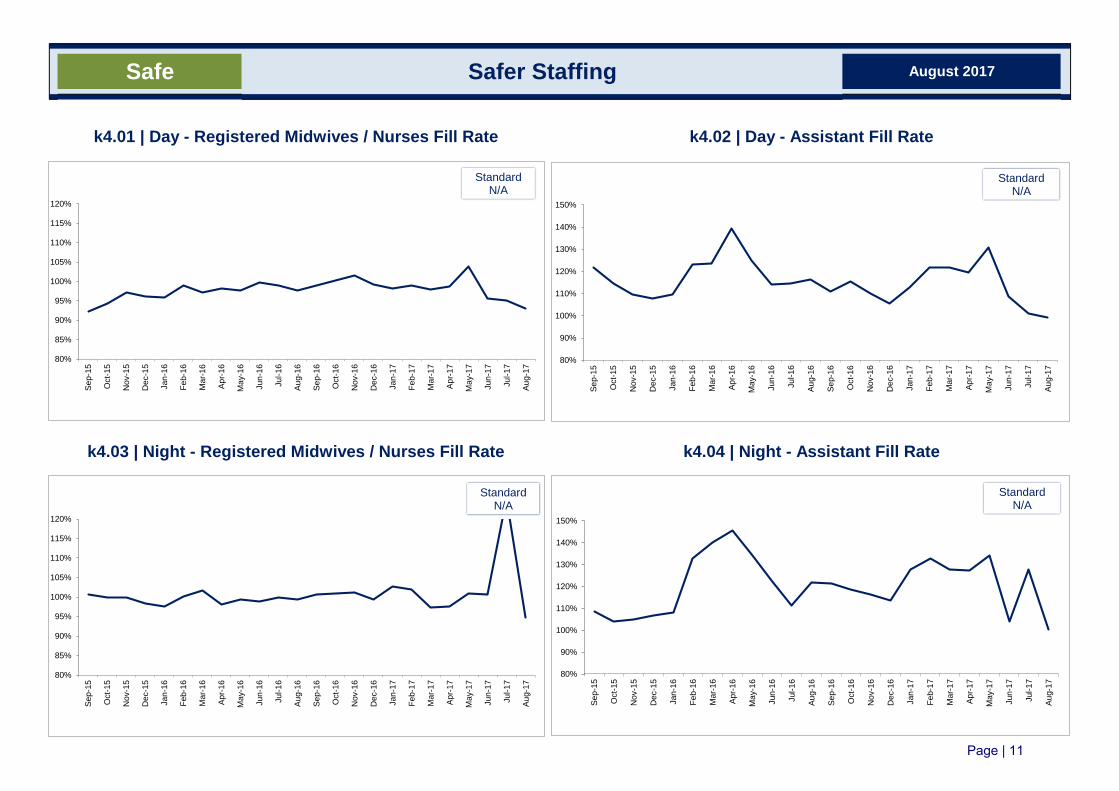
Against a backdrop of increased turnover (band 5, and unqualified staff), increased joiners and reduced sickness, overall fill rates continue to be at a good level; where fill rates are not achieved staff are
moved to support as necessary. The recruitment pipeline remains strong following recruitment from the Philippines. Midwifery vacancies will reduce as the newly recruited midwives join in September.
The Safer Staffing Group for nursing staff now meets weekly with further detailed analysis and predicted recruitment plans being introduced.
For further information see workforce commentary.
Safer Staffing : Ward and Shift Analysis
0%
50%
100%
150%
200%
250%
AA
U
Ale
x
Asto
r
Bly
th
Bro
nte
Ca
mb
rid
ge
Ca
nbu
ry
De
rwe
nt
Ha
mble
Ha
rdy
Inte
nsiv
eC
are
Un
it
Isa
be
lla
Ke
ats
Ke
nn
et
Ne
on
ata
lU
nit
Su
nsh
ine
Ma
tern
ity
Tru
st
Day Staffing Rate - RN/MW Day Staffing Rate - HCA Night Staffing Rate - RN/MW Night Staffing Rate - HCA
Page | 10
k4.03 | Night - Registered Midwives / Nurses Fill Rate k4.04 | Night - Assistant Fill Rate
Safer StaffingSafe August 2017
k4.01 | Day - Registered Midwives / Nurses Fill Rate k4.02 | Day - Assistant Fill Rate
80%
90%
100%
110%
120%
130%
140%
150%
Se
p-1
5
Oct-
15
Nov-1
5
Dec-1
5
Jan
-16
Fe
b-1
6
Ma
r-1
6
Ap
r-16
May-1
6
Jun
-16
Jul-1
6
Au
g-1
6
Se
p-1
6
Oct-
16
Nov-1
6
Dec-1
6
Jan
-17
Fe
b-1
7
Ma
r-1
7
Ap
r-17
May-1
7
Jun
-17
Jul-1
7
Au
g-1
7
Standard N/A
80%
85%
90%
95%
100%
105%
110%
115%
120%
Se
p-1
5
Oct-
15
No
v-1
5
Dec-1
5
Jan
-16
Feb-1
6
Mar-
16
Ap
r-16
May-1
6
Jun
-16
Ju
l-1
6
Au
g-1
6
Se
p-1
6
Oct-
16
No
v-1
6
Dec-1
6
Jan
-17
Feb-1
7
Mar-
17
Ap
r-17
May-1
7
Jun
-17
Ju
l-1
7
Au
g-1
7
Standard N/A
80%
85%
90%
95%
100%
105%
110%
115%
120%
Se
p-1
5
Oct-
15
Nov-1
5
Dec-1
5
Jan
-16
Feb-1
6
Ma
r-1
6
Ap
r-16
May-1
6
Jun
-16
Jul-1
6
Au
g-1
6
Se
p-1
6
Oct-
16
Nov-1
6
Dec-1
6
Jan
-17
Feb-1
7
Ma
r-1
7
Ap
r-17
May-1
7
Jun
-17
Jul-1
7
Au
g-1
7
Standard N/A
80%
90%
100%
110%
120%
130%
140%
150%
Se
p-1
5
Oct-
15
Nov-1
5
Dec-1
5
Jan
-16
Fe
b-1
6
Ma
r-1
6
Ap
r-16
May-1
6
Jun
-16
Jul-1
6
Au
g-1
6
Se
p-1
6
Oct-
16
Nov-1
6
Dec-1
6
Jan
-17
Feb-1
7
Mar-
17
Ap
r-17
May-1
7
Jun
-17
Jul-1
7
Au
g-1
7
Standard N/A
Page | 11

k4.07 | Care Hours per Patient Day (CHPPD)
Safer StaffingSafe August 2017
k4.05 | Overall Trust Fill Ratek4.06 | % of Registered Nurse and Midwife Expenditure on
Agency Staff
0%
2%
4%
6%
8%
10%
12%
14%
16%
18%
20%
Se
p-1
5
Oct-
15
Nov-1
5
Dec-1
5
Jan
-16
Fe
b-1
6
Ma
r-1
6
Ap
r-16
May-1
6
Jun
-16
Jul-1
6
Au
g-1
6
Se
p-1
6
Oct-
16
Nov-1
6
Dec-1
6
Jan
-17
Fe
b-1
7
Ma
r-1
7
Ap
r-17
May-1
7
Jun
-17
Jul-1
7
Au
g-1
7
Standard N/A
85%
90%
95%
100%
105%
110%
115%
Se
p-1
5
Oct-
15
No
v-1
5
Dec-1
5
Jan
-16
Feb-1
6
Mar-
16
Ap
r-16
May-1
6
Jun
-16
Ju
l-1
6
Au
g-1
6
Se
p-1
6
Oct-
16
No
v-1
6
Dec-1
6
Jan
-17
Feb-1
7
Mar-
17
Ap
r-17
May-1
7
Jun
-17
Ju
l-1
7
Au
g-1
7
Standard N/A
0.00
1.00
2.00
3.00
4.00
5.00
6.00
7.00
8.00
9.00
Se
p-1
5
Oct-
15
Nov-1
5
Dec-1
5
Jan
-16
Fe
b-1
6
Mar-
16
Ap
r-16
May-1
6
Jun
-16
Jul-1
6
Au
g-1
6
Se
p-1
6
Oct-
16
Nov-1
6
Dec-1
6
Jan
-17
Fe
b-1
7
Mar-
17
Ap
r-17
May-1
7
Jun
-17
Jul-1
7
Au
g-1
7
Standard N/A
Page | 12
k5.03 | % women with a primary postpartum haemorrhage of
2000ml or morek5.04 | Significant Perineal Trauma
MaternitySafe August 2017
k5.01 | Caesarean section ratek5.02 | % women with a primary postpartum haemorrhage of
1500ml or more
0%
1%
2%
3%
4%
5%
6%
Se
p-1
5
Oct-
15
Nov-1
5
Dec-1
5
Jan
-16
Fe
b-1
6
Ma
r-1
6
Ap
r-16
May-1
6
Jun
-16
Jul-1
6
Au
g-1
6
Se
p-1
6
Oct-
16
Nov-1
6
Dec-1
6
Jan
-17
Fe
b-1
7
Ma
r-1
7
Ap
r-17
May-1
7
Jun
-17
Jul-1
7
Au
g-1
7
Standard <3.1%
20%
22%
24%
26%
28%
30%
32%
34%
Se
p-1
5
Oct-
15
Nov-1
5
Dec-1
5
Ja
n-1
6
Fe
b-1
6
Mar-
16
Ap
r-16
May-1
6
Ju
n-1
6
Jul-1
6
Au
g-1
6
Se
p-1
6
Oct-
16
Nov-1
6
Dec-1
6
Jan
-17
Fe
b-1
7
Mar-
17
Ap
r-17
May-1
7
Ju
n-1
7
Jul-1
7
Au
g-1
7
Standard <=26%
0.0%
0.5%
1.0%
1.5%
2.0%
2.5%
Se
p-1
5
Oct-
15
Nov-1
5
Dec-1
5
Jan
-16
Fe
b-1
6
Mar-
16
Ap
r-16
May-1
6
Jun
-16
Jul-1
6
Au
g-1
6
Se
p-1
6
Oct-
16
Nov-1
6
Dec-1
6
Jan
-17
Fe
b-1
7
Mar-
17
Ap
r-17
May-1
7
Jun
-17
Jul-1
7
Au
g-1
7
Standard <=1.0%
0%
1%
2%
3%
4%
5%
Se
p-1
5
Oct-
15
Nov-1
5
Dec-1
5
Jan
-16
Fe
b-1
6
Ma
r-1
6
Ap
r-16
May-1
6
Jun
-16
Jul-1
6
Au
g-1
6
Se
p-1
6
Oct-
16
Nov-1
6
Dec-1
6
Jan
-17
Feb-1
7
Mar-
17
Ap
r-17
May-1
7
Jun
-17
Jul-1
7
Au
g-1
7
Standard N/A
Page | 13

Effective Commentary - Is Care Effective? August 2017
k2.01 Mortality The Trust mortality KPIs remain good with SHMI now 84 which is below the expected mortality (i.e. in the lowest quartile nationally). Progress is being made with implementing ‘Learning from Deaths – NHSI April 2017) with all departments now undertaking Mortality and Morbidity meeting and recording case discussion on the standardised Trust proforma. This allows deaths to be categorised along in keeping with national guidance. A programme of training is being rolled out to support Systematic Judgement Review – the methodology described within the ‘Learning from Deaths’ guidance for cases where issues in care require internal peer review. An over-view of the deaths subject to this process will be provided to the November 2017 Trust Board. k2.03 Sepsis The percentage of patients screened for Sepsis and who have documented evidence of receiving antibiotics within 1 hour when needed has not been achieved to date despite considerable focus on this in the Emergency Department. Training and awareness raising continues. Sepsis week in September 2017 was used to highlight the issues and importance of identifying those patients at risk with a ‘Sock it to Sepsis’ campaign. A new proforma has been introduced to the Emergency Department which helps staff both screen and start treatment, but also aids case ascertainment for audit. Processes to avoid prescribing and administration delays including nurse prescribing are being developed. Recruitment of sepsis nurses in both adults and paediatrics is underway. The Board has previously recognised the difficulty in data collection of the inpatients who require screening for sepsis. Most of these patients are already receiving treatment and the screening refers to a review that their treatment is effective. The Outreach Team dashboard also identifies and alerts the team to deteriorating patients some of whom will have sepsis. The Trust is exploring mobile devices to make this alerting system even more effective. Alternatives methods of identifying and recording the details for audit are being explored. k2.07 Dementia Screening Screening all patients over 65 for Dementia is not being achieved. A prompt is present within the CRS admission screen. Patients who are not admitted to Elderly care such as routine elective surgery are less likely to have been asked about impairment of their memory. The rate of appropriate assessment of those patients with dementia has improved.
k2.09 Readmission following Elective Admission There appears to be a rising trend in readmissions following elective admission. The data is currently being analysed Previous reviews of this KPI have indicated data issues. This has been apparent in paediatrics where planned re-attendances have been recorded as emergency re-admissions. The data will be reviewed at Clinical Quality Improvement Group and the details provided to the Board through the Integrated Report in November. Clinical Audit & Effectiveness Seven Day Services Audit The Trust is aiming for compliance with the Seven Day Services 4 priority standards by March 2018. The four priority standards are patient assessment by a suitable consultant within 14 hours of emergency admission, consultant directed diagnostic tests and completed reporting availability seven days a week, 24 hour inpatient access to key consultant directed interventions and patient review twice a day (high dependency) or, once a clear pathway of care has been established, once every 24 hours, seven days a week unless it has been determined that this would not affect the patient's care pathway. The Trust is participating in 6 monthly audits organised by NHS Improvement and NHS England. The results of the latest audit conducted in March 2017, showed that whilst not meeting the 90% target, the Trust compares well and is above both national and London averages for all domains except once daily consultant reviews which are lower than both averages on both weekdays and weekends. Planned actions include changes to the Medical Consultants on call rota and consideration of extension to Acute Care Physician working day.
Page | 14

k2.03 | Sepsis - % of eligible patients screened for sepsis -
Emergency Department
k2.04 | Sepsis - % of eligible patients who received antibiotics
within 1 hour of arrival - Emergency Department
Effective August 2017
k2.01 | SHMI k2.02 | Unadjusted Mortality Rate
0.0%
0.2%
0.4%
0.6%
0.8%
1.0%
1.2%
1.4%
1.6%
1.8%
Se
p-1
5
Oct-
15
Nov-1
5
Dec-1
5
Jan
-16
Fe
b-1
6
Ma
r-1
6
Ap
r-16
May-1
6
Jun
-16
Jul-1
6
Au
g-1
6
Se
p-1
6
Oct-
16
Nov-1
6
Dec-1
6
Jan
-17
Fe
b-1
7
Ma
r-1
7
Ap
r-17
May-1
7
Jun
-17
Jul-1
7
Au
g-1
7
Standard N/A
80
82
84
86
88
90
92
94
96
98
100
102
Se
p-1
5
Oct-
15
Nov-1
5
Dec-1
5
Ja
n-1
6
Fe
b-1
6
Mar-
16
Ap
r-16
May-1
6
Ju
n-1
6
Jul-1
6
Au
g-1
6
Se
p-1
6
Oct-
16
Nov-1
6
Dec-1
6
Jan
-17
Fe
b-1
7
Mar-
17
Ap
r-17
May-1
7
Ju
n-1
7
Jul-1
7
Au
g-1
7
Standard <=95
0%
10%
20%
30%
40%
50%
60%
70%
80%
90%
100%
Se
p-1
5
Oct-
15
No
v-1
5
Dec-1
5
Jan
-16
Feb-1
6
Mar-
16
Ap
r-16
May-1
6
Jun
-16
Ju
l-1
6
Au
g-1
6
Se
p-1
6
Oct-
16
No
v-1
6
Dec-1
6
Jan
-17
Feb-1
7
Mar-
17
Ap
r-17
May-1
7
Jun
-17
Ju
l-1
7
Au
g-1
7
Standard >=90%
0%
10%
20%
30%
40%
50%
60%
70%
80%
90%
100%
Se
p-1
5
Oct-
15
Nov-1
5
Dec-1
5
Jan
-16
Fe
b-1
6
Ma
r-1
6
Ap
r-16
May-1
6
Jun
-16
Jul-1
6
Au
g-1
6
Se
p-1
6
Oct-
16
Nov-1
6
Dec-1
6
Jan
-17
Feb-1
7
Mar-
17
Ap
r-17
May-1
7
Jun
-17
Jul-1
7
Au
g-1
7
Standard >=90%
Page | 15

k2.05 | Prevention of hospital acquired VTE - % patients risk
assessedk2.06 | Incidence of Hospital Acquired VTE (HAT)
Effective August 2017
k2.13 | Sepsis - % of eligible patients screened for sepsis -
Inpatients
k2.14 | Sepsis - % of eligible patients who received antibiotics
within 1 hour - Inpatients
0%
10%
20%
30%
40%
50%
60%
70%
80%
90%
100%
Se
p-1
5
Oct-
15
No
v-1
5
Dec-1
5
Jan
-16
Feb-1
6
Mar-
16
Ap
r-16
May-1
6
Jun
-16
Ju
l-1
6
Au
g-1
6
Se
p-1
6
Oct-
16
No
v-1
6
Dec-1
6
Jan
-17
Feb-1
7
Mar-
17
Ap
r-17
May-1
7
Jun
-17
Ju
l-1
7
Au
g-1
7
Standard >=90%
90%
91%
92%
93%
94%
95%
96%
97%
98%
99%
100%
Se
p-1
5
Oct-
15
Nov-1
5
Dec-1
5
Jan
-16
Feb-1
6
Ma
r-1
6
Ap
r-16
May-1
6
Jun
-16
Jul-1
6
Au
g-1
6
Se
p-1
6
Oct-
16
Nov-1
6
Dec-1
6
Jan
-17
Feb-1
7
Ma
r-1
7
Ap
r-17
May-1
7
Jun
-17
Jul-1
7
Au
g-1
7
Standard >=95%
0 0 0
2
1
0 0 0
3
1 1
2 2
1 1 1 1
5
3
4
1
5
4
3
0
1
2
3
4
5
6
Se
p-1
5
Oct-
15
Nov-1
5
Dec-1
5
Jan
-16
Feb-1
6
Mar-
16
Ap
r-16
May-1
6
Jun
-16
Jul-1
6
Au
g-1
6
Se
p-1
6
Oct-
16
Nov-1
6
Dec-1
6
Jan
-17
Feb-1
7
Mar-
17
Ap
r-17
May-1
7
Jun
-17
Jul-1
7
Au
g-1
7
Standard N/A
0%
10%
20%
30%
40%
50%
60%
70%
80%
90%
100%
Se
p-1
5
Oct-
15
No
v-1
5
Dec-1
5
Jan
-16
Feb-1
6
Mar-
16
Ap
r-16
Ma
y-1
6
Ju
n-1
6
Ju
l-1
6
Au
g-1
6
Se
p-1
6
Oct-
16
Nov-1
6
Dec-1
6
Ja
n-1
7
Fe
b-1
7
Mar-
17
Ap
r-17
May-1
7
Jun
-17
Jul-1
7
Au
g-1
7
Standard >=90%
Page | 16

k2.09 | % Emergency Readmissions following an elective
admission - 30 days
k2.10 | % Emergency Readmissions following an emergency
admission - 30 days
Effective August 2017
k2.07 | % of eligible patients screened for dementiak2.08 | % of patients with dementia who were appropriately
assessed
0%
10%
20%
30%
40%
50%
60%
70%
80%
90%
100%
Se
p-1
5
Oct-
15
Nov-1
5
Dec-1
5
Jan
-16
Fe
b-1
6
Ma
r-1
6
Ap
r-16
May-1
6
Jun
-16
Jul-1
6
Au
g-1
6
Se
p-1
6
Oct-
16
Nov-1
6
Dec-1
6
Jan
-17
Fe
b-1
7
Ma
r-1
7
Ap
r-17
May-1
7
Jun
-17
Jul-1
7
Au
g-1
7
Standard >=90%
0%
10%
20%
30%
40%
50%
60%
70%
80%
90%
100%
Se
p-1
5
Oct-
15
No
v-1
5
Dec-1
5
Jan
-16
Feb-1
6
Mar-
16
Ap
r-16
May-1
6
Jun
-16
Ju
l-1
6
Au
g-1
6
Se
p-1
6
Oct-
16
No
v-1
6
Dec-1
6
Jan
-17
Feb-1
7
Mar-
17
Ap
r-17
May-1
7
Jun
-17
Ju
l-1
7
Au
g-1
7
Standard >=90%
0.0%
0.5%
1.0%
1.5%
2.0%
2.5%
3.0%
3.5%
Se
p-1
5
Oct-
15
Nov-1
5
Dec-1
5
Jan
-16
Feb-1
6
Mar-
16
Ap
r-16
May-1
6
Jun
-16
Jul-1
6
Au
g-1
6
Se
p-1
6
Oct-
16
Nov-1
6
Dec-1
6
Jan
-17
Feb-1
7
Mar-
17
Ap
r-17
May-1
7
Jun
-17
Jul-1
7
Au
g-1
7
Standard N/A
0%
2%
4%
6%
8%
10%
12%
14%
16%
18%
Se
p-1
5
Oct-
15
Nov-1
5
Dec-1
5
Jan
-16
Fe
b-1
6
Ma
r-1
6
Ap
r-16
May-1
6
Jun
-16
Jul-1
6
Au
g-1
6
Se
p-1
6
Oct-
16
Nov-1
6
Dec-1
6
Jan
-17
Feb-1
7
Mar-
17
Ap
r-17
May-1
7
Jun
-17
Jul-1
7
Au
g-1
7
Standard N/A
Page | 17

Effective August 2017
k2.11 | Hand Hygienek2.12 | Open Incidents - % of Managers Reports completed
within policy guidelines
0%
10%
20%
30%
40%
50%
60%
70%
80%
90%
100%
Se
p-1
5
Oct-
15
Nov-1
5
Dec-1
5
Jan
-16
Fe
b-1
6
Ma
r-1
6
Ap
r-16
May-1
6
Jun
-16
Jul-1
6
Au
g-1
6
Se
p-1
6
Oct-
16
Nov-1
6
Dec-1
6
Jan
-17
Fe
b-1
7
Ma
r-1
7
Ap
r-17
May-1
7
Jun
-17
Jul-1
7
Au
g-1
7
Standard N/A
0%
10%
20%
30%
40%
50%
60%
70%
80%
90%
100%
Se
p-1
5
Oct-
15
No
v-1
5
Dec-1
5
Jan
-16
Feb-1
6
Mar-
16
Ap
r-16
May-1
6
Jun
-16
Ju
l-1
6
Au
g-1
6
Se
p-1
6
Oct-
16
No
v-1
6
Dec-1
6
Jan
-17
Feb-1
7
Mar-
17
Ap
r-17
May-1
7
Jun
-17
Ju
l-1
7
Au
g-1
7
Standard >=95%
Page | 18

Caring Commentary August 2017
Complaints The Trust received 24 formal complaints in August 2017 compared to 31 in August 2016. Emergency Services received the highest amount of complaints accounting for 42% of the total, followed by Specialist Services (33%), Clinical Support Services (17%) and Trust (8%). Within Emergency Services, the following Service Lines received complaints in August 2017: Accident & emergency (2), Gastroenterology & Endoscopy (2), Specialist Outpatients (2), Respiratory (1), Acute Assessment Unit (1), Cardiology & Haematology (1) and Elderly Care (1). Within Specialist Services, the following Service Lines received complaints in August 2017: General Surgery & Urology (3), Oral & ENT (2), Paediatrics & NNU (1), Maternity (1), Ophthalmology (1). The most frequent complaint subjects that were received related to communications (25%), followed by care & treatment (21%), appointments (17%), diagnosis (8%), infrastructure & resources, tests/investigations, procedure (Incl. surgery/endoscopy/anaesthesia etc.), admission/discharge, transfer, failure to monitor/escalate and estates (4% each). Reopened complaints Five complaints were reopened in August 2017, arising from complaints first received in February 2017 (1), April 2017 (1) and May 2017 (1) and June 2017 (2). The reasons for these complaints reopening were: Further questions - 4 Facts Challenged - 1 Ombudsman Referrals No complaints were referred to the Ombudsman in August 2017.
Friends and Family Test
)
The Trusts FFT continue to be strongly positive with an overall rate of 95.7%. Response rates will continue to be variable in the run up to the implementation of a new FFT system during Q3 and Q4 2017/18. Response rates in ED are expected to rise in November as the Trust commenced text and interactive voice mail capture of FFT. Quality Account Update A template has been devised and discussed at the CQIC for the collation of contributions to the 2017/18 Quality Account. Following amendments to reflect the discussions this has started to be used from 1st September 2017 and will be reported to the CQIC, starting in October. A summary update on the Quality Account will be included within the regular Integrated Performance Report going forward.
Page | 19

k3.03 | Number of Complaints referred to ombudsmank3.14 | % Complaints responded to within 25 working days or
date as agreed with complainant
Caring August 2017
k3.01 | Number of Complaints received k3.02 | Number of Complaints reopened
37
30
39 36
39 42
38 40
34 32 35
31 30 26
40
30 30 27
37
31 30 27
35
24
0
10
20
30
40
50
60
70
80
Se
p-1
5
Oct-
15
Nov-1
5
Dec-1
5
Jan
-16
Feb-1
6
Mar-
16
Ap
r-16
May-1
6
Jun
-16
Jul-1
6
Au
g-1
6
Se
p-1
6
Oct-
16
Nov-1
6
Dec-1
6
Jan
-17
Feb-1
7
Mar-
17
Ap
r-17
May-1
7
Jun
-17
Jul-1
7
Au
g-1
7
Standard N/A
1
0 0
1 1 1
0 0 0 0 0 0
1
0 0
1
2
0
1 1
0 0 0 0 0
1
2
3
Se
p-1
5
Oct-
15
Nov-1
5
Dec-1
5
Jan
-16
Feb-1
6
Mar-
16
Ap
r-16
May-1
6
Jun
-16
Jul-1
6
Au
g-1
6
Se
p-1
6
Oct-
16
Nov-1
6
Dec-1
6
Jan
-17
Feb-1
7
Mar-
17
Ap
r-17
May-1
7
Jun
-17
Jul-1
7
Au
g-1
7
Standard N/A
5
3
7
5
4
8
5
9
4 4
3
6
10
2
5 5
6 6 6 6
5
2
4
5
0
2
4
6
8
10
12
14
Se
p-1
5
Oct-
15
Nov-1
5
Dec-1
5
Jan
-16
Feb-1
6
Ma
r-1
6
Ap
r-16
May-1
6
Jun
-16
Jul-1
6
Au
g-1
6
Se
p-1
6
Oct-
16
Nov-1
6
Dec-1
6
Jan
-17
Feb-1
7
Ma
r-1
7
Ap
r-17
May-1
7
Jun
-17
Jul-1
7
Au
g-1
7
Standard N/A
50%
55%
60%
65%
70%
75%
80%
85%
90%
95%
100%
Se
p-1
5
Oct-
15
Nov-1
5
Dec-1
5
Jan
-16
Fe
b-1
6
Ma
r-1
6
Ap
r-16
May-1
6
Jun
-16
Jul-1
6
Au
g-1
6
Se
p-1
6
Oct-
16
Nov-1
6
Dec-1
6
Jan
-17
Feb-1
7
Mar-
17
Ap
r-17
May-1
7
Jun
-17
Jul-1
7
Au
g-1
7
Standard >=90%
Page | 20

k3.07 | Friends and Family Score - Paediatric Inpatient k3.08 | Friends and Family Score - Outpatient
Caring August 2017
k3.05 | Friends and Family Score - Trustk3.06 | Friends and Family Score - Inpatients (excluding
daycases)
96.0
%
93
.6%
94
.2%
94.9
%
92
.7%
94
.1%
95.2
%
94.3
%
92
.6%
94.5
%
93.7
%
95.6
%
95.2
%
96.1
%
95.0
%
95
.9%
93
.9%
95
.3%
94
.6%
95.1
%
95
.2%
96
.1%
95
.7%
95.7
%
0%
20%
40%
60%
80%
100%
Se
p-1
5
Oct-
15
Nov-1
5
Dec-1
5
Jan
-16
Fe
b-1
6
Ma
r-1
6
Ap
r-16
May-1
6
Jun
-16
Jul-1
6
Au
g-1
6
Se
p-1
6
Oct-
16
Nov-1
6
Dec-1
6
Jan
-17
Fe
b-1
7
Ma
r-1
7
Ap
r-17
May-1
7
Jun
-17
Jul-1
7
Au
g-1
7
% Would Recommend % Would Not Recommend
Standard N/A
93.3
%
89.0
%
93
.8%
93.4
%
95.0
%
94.3
%
94.6
%
94.2
%
95
.4%
94.8
%
95.5
%
96.4
%
95
.7%
96.4
%
96.2
%
96
.3%
93.0
%
95.5
%
95.8
%
94.8
%
95.5
%
98.2
%
97
.0%
96.9
%
0%
20%
40%
60%
80%
100%
Se
p-1
5
Oct-
15
Nov-1
5
Dec-1
5
Jan
-16
Fe
b-1
6
Mar-
16
Ap
r-16
May-1
6
Jun
-16
Jul-1
6
Au
g-1
6
Se
p-1
6
Oct-
16
Nov-1
6
Dec-1
6
Jan
-17
Feb-1
7
Ma
r-1
7
Ap
r-17
May-1
7
Jun
-17
Jul-1
7
Au
g-1
7
Response Rate % Would Recommend % Would Not Recommend Standard
Standard >=96%
97.2
%
94.8
%
94.3
%
94
.0%
91.5
%
92
.0%
94.1
%
93.4
%
88.8
%
93.7
%
90
.3%
92.8
%
95
.1%
95.3
%
94.7
%
95
.0%
94.2
%
94
.7%
94.7
%
95.6
%
95.7
%
96.0
%
96
.4%
95.3
%
0%
20%
40%
60%
80%
100%
Se
p-1
5
Oct-
15
Nov-1
5
Dec-1
5
Jan
-16
Feb-1
6
Mar-
16
Ap
r-16
May-1
6
Jun
-16
Jul-1
6
Au
g-1
6
Se
p-1
6
Oct-
16
Nov-1
6
Dec-1
6
Jan
-17
Feb-1
7
Mar-
17
Ap
r-17
May-1
7
Jun
-17
Jul-1
7
Au
g-1
7
% Would Recommend % Would Not Recommend
Standard N/A
100
.0%
90
.0%
90
.9%
100
.0%
100
.0%
92
.5%
90.3
%
87
.7%
94
.7%
92.9
%
96
.2%
95.6
%
97.4
%
100
.0%
92
.6%
95.9
%
87
.5%
97.1
%
93
.5%
86
.7%
89.4
%
94
.1%
95
.2%
100
.0%
0%
20%
40%
60%
80%
100%
Se
p-1
5
Oct-
15
Nov-1
5
Dec-1
5
Jan
-16
Feb-1
6
Ma
r-1
6
Ap
r-16
May-1
6
Jun
-16
Jul-1
6
Au
g-1
6
Se
p-1
6
Oct-
16
Nov-1
6
Dec-1
6
Jan
-17
Feb-1
7
Ma
r-1
7
Ap
r-17
May-1
7
Jun
-17
Jul-1
7
Au
g-1
7
Response Rate % Would Recommend % Would Not Recommend
Standard N/A
Standard N/A
Page | 21

k3.11 | Friends and Family Score - Daycases k3.13 | Number of Mixed Sex Accommodation Breaches
Caring August 2017
k3.09 | Friends and Family Score - A&E k3.10 | Friends and Family Score - Maternity
96.8
%
98.0
%
96.4
%
97.5
%
95.2
%
94
.3%
95.9
%
95.9
%
91.4
%
94.5
%
97.3
%
97.4
%
92.3
%
96.5
%
93.5
%
96.5
%
93
.1%
94.9
%
91.0
%
93.2
%
88.5
%
93.6
%
88
.2%
94
.2%
0%
20%
40%
60%
80%
100%
Se
p-1
5
Oct-
15
Nov-1
5
Dec-1
5
Jan
-16
Fe
b-1
6
Ma
r-1
6
Ap
r-16
May-1
6
Jun
-16
Jul-1
6
Au
g-1
6
Se
p-1
6
Oct-
16
Nov-1
6
Dec-1
6
Jan
-17
Fe
b-1
7
Mar-
17
Ap
r-17
May-1
7
Jun
-17
Jul-1
7
Au
g-1
7
Response Rate % Would Recommend % Would Not Recommend
Standard N/A
96.6
%
93.1
%
93
.3%
96.6
%
90.2
%
98
.0%
97.6
%
96.7
%
96
.4%
96.3
%
97.0
%
96.1
%
98.9
%
97.5
%
94.7
%
94
.9%
96.1
%
97.0
%
98.1
%
97.8
%
100.0
%
100.0
%
10
0.0
%
100.0
%
0%
20%
40%
60%
80%
100%
Se
p-1
5
Oct-
15
Nov-1
5
Dec-1
5
Jan
-16
Fe
b-1
6
Mar-
16
Ap
r-16
May-1
6
Jun
-16
Jul-1
6
Au
g-1
6
Se
p-1
6
Oct-
16
Nov-1
6
Dec-1
6
Jan
-17
Feb-1
7
Ma
r-1
7
Ap
r-17
May-1
7
Jun
-17
Jul-1
7
Au
g-1
7
% Would Recommend % Would Not Recommend
Standard N/A
98
.9%
98.6
%
98.2
%
96.8
%
99.0
%
97
.9%
98
.0%
98.0
%
98.2
%
97.4
%
98.0
%
98
.0%
98.2
%
98.3
%
97.9
%
98.8
%
99
.1%
10
0.0
%
99.0
%
98.1
%
98.2
%
100.0
%
98
.3%
98.0
%
0%
20%
40%
60%
80%
100%
Se
p-1
5
Oct-
15
Nov-1
5
Dec-1
5
Jan
-16
Feb-1
6
Ma
r-1
6
Ap
r-16
May-1
6
Jun
-16
Jul-1
6
Au
g-1
6
Se
p-1
6
Oct-
16
Nov-1
6
Dec-1
6
Jan
-17
Feb-1
7
Mar-
17
Ap
r-17
May-1
7
Jun
-17
Jul-1
7
Au
g-1
7
Response Rate % Would Recommend % Would Not Recommend
Standard N/A
0 0 0 0 0 0 0 0 0 0
2
0 0 0 0
4
0 0 0 0 0 0 0 0 0
1
2
3
4
5
Se
p-1
5
Oct-
15
No
v-1
5
Dec-1
5
Jan
-16
Feb-1
6
Mar-
16
Ap
r-16
May-1
6
Ju
n-1
6
Jul-1
6
Au
g-1
6
Se
p-1
6
Oct-
16
No
v-1
6
Dec-1
6
Ja
n-1
7
Feb-1
7
Mar-
17
Ap
r-17
May-1
7
Ju
n-1
7
Jul-1
7
Au
g-1
7
Standard Zero
Page | 22

Responsive Commentary - Is Care Responsive? August 2017
Accident & Emergency In August performance against the emergency standard was 91.34%. The quarter 2 position for the Trust was 92.07% as of Sept 18th which together with the performance of the Walk in Centre at Teddington is expected to meet the trajectory target of 92.44%. The emergency care programme board work streams have continued to make progress: 1. The Urgent Care project (UCC) design has moved to prebuild fabrication construction with foundations and enabling works starting on site and is on plan. A GP Clinical lead for the UCC has commenced in post and is working with ED colleagues to finalise the operational policy for the service. 2. A new physician on call rota has commenced and includes two consultants at weekends supporting ED, AAU and inpatient wards. 3. Funding has been secured for the development of a frailty team in 2017/18 in collaboration with social care and community health partners. 4. The medically optimised for discharge ward is being piloted on Claremont Ward, with 16 beds. This project is aiming to support early discharge for those patients who no longer require acute care in the hospital. 5. A programme for ward engagement in 'plan for every patient' is being formulated and is expected to be launched in October.
18 weeks Referral to Treatment (RTT) Incomplete pathway position for August was 94.47%, which is above target. Focused work has continued in ophthalmology to improve administrative processes and to review demand and capacity. These are being monitored through the service line and improvements have already been identified. Elective work has continued to transfer from St. George's Hospital in ENT and general surgery. Closer links with the managerial team at St. George's Hospital have been established with a view to improving the pathway between each organisation. Cancer All cancer targets were met in July. Recruitment of MDT coordinators is underway in breast and gynaecology. Bids for funding to support improvement in pathways in colorectal and urology have been submitted to RM partners and have been successful. The implementation of these schemes is being monitored through the Cancer Board.
Page | 23

k6.03 | 18 weeks Referral to Treatment - number of
incomplete over 52 week waitersk6.04 | Diagnostic test - % waiting 6 weeks or less
Responsive August 2017
k6.01 | Average length of stay - Emergency Admissions k6.02 | 18 weeks Referral to Treatment - Incomplete pathways
90%
91%
92%
93%
94%
95%
96%
97%
98%
Se
p-1
5
Oct-
15
Nov-1
5
Dec-1
5
Jan
-16
Fe
b-1
6
Ma
r-1
6
Ap
r-16
May-1
6
Jun
-16
Jul-1
6
Au
g-1
6
Se
p-1
6
Oct-
16
Nov-1
6
Dec-1
6
Jan
-17
Fe
b-1
7
Ma
r-1
7
Ap
r-17
May-1
7
Jun
-17
Jul-1
7
Au
g-1
7
Standard >=92%
0.0
0.5
1.0
1.5
2.0
2.5
3.0
3.5
4.0
4.5
5.0
5.5
6.0
6.5
Se
p-1
5
Oct-
15
Nov-1
5
Dec-1
5
Ja
n-1
6
Fe
b-1
6
Mar-
16
Ap
r-16
May-1
6
Ju
n-1
6
Jul-1
6
Au
g-1
6
Se
p-1
6
Oct-
16
Nov-1
6
Dec-1
6
Jan
-17
Fe
b-1
7
Mar-
17
Ap
r-17
May-1
7
Ju
n-1
7
Jul-1
7
Au
g-1
7
Standard <=5.23
97%
98%
99%
100%
Se
p-1
5
Oct-
15
Nov-1
5
Dec-1
5
Jan
-16
Fe
b-1
6
Ma
r-1
6
Ap
r-16
May-1
6
Jun
-16
Jul-1
6
Au
g-1
6
Se
p-1
6
Oct-
16
Nov-1
6
Dec-1
6
Jan
-17
Feb-1
7
Mar-
17
Ap
r-17
May-1
7
Jun
-17
Jul-1
7
Au
g-1
7
Standard >=99%
0 0 0 0 0 0 0 0 0 0 0 0 0 0 0 0 0 0
1
0
1
2 2
1
0
1
2
3
Se
p-1
5
Oct-
15
Nov-1
5
Dec-1
5
Jan
-16
Feb-1
6
Mar-
16
Ap
r-16
May-1
6
Jun
-16
Jul-1
6
Au
g-1
6
Se
p-1
6
Oct-
16
Nov-1
6
Dec-1
6
Jan
-17
Feb-1
7
Mar-
17
Ap
r-17
May-1
7
Jun
-17
Jul-1
7
Au
g-1
7
Standard Zero
Page | 24

k6.07 | Number of A&E 12 hour trolley waits k6.08 | LAS Ambulance Handovers - % within 15 minutes
Responsive August 2017
k6.05 | A&E 4 hour waiting time (type 1) k6.06 | A&E 4 hour waiting time (all types)
80%
82%
84%
86%
88%
90%
92%
94%
96%
98%
100%
Se
p-1
5
Oct-
15
No
v-1
5
De
c-1
5
Ja
n-1
6
Feb-1
6
Mar-
16
Ap
r-16
Ma
y-1
6
Ju
n-1
6
Ju
l-1
6
Au
g-1
6
Se
p-1
6
Oct-
16
Nov-1
6
Dec-1
6
Jan
-17
Feb-1
7
Mar-
17
Ap
r-17
May-1
7
Jun
-17
Jul-1
7
Au
g-1
7
Standard >=95%
0%
10%
20%
30%
40%
50%
60%
70%
80%
90%
100%
Se
p-1
5
Oct-
15
Nov-1
5
Dec-1
5
Jan
-16
Fe
b-1
6
Ma
r-1
6
Ap
r-16
May-1
6
Jun
-16
Jul-1
6
Au
g-1
6
Se
p-1
6
Oct-
16
Nov-1
6
Dec-1
6
Jan
-17
Feb-1
7
Mar-
17
Ap
r-17
May-1
7
Jun
-17
Jul-1
7
Au
g-1
7
Standard N/A
80%
82%
84%
86%
88%
90%
92%
94%
96%
98%
100%
Se
p-1
5
Oct-
15
No
v-1
5
Dec-1
5
Jan
-16
Feb-1
6
Mar-
16
Ap
r-16
May-1
6
Jun
-16
Ju
l-1
6
Au
g-1
6
Se
p-1
6
Oct-
16
No
v-1
6
Dec-1
6
Jan
-17
Feb-1
7
Mar-
17
Ap
r-17
May-1
7
Jun
-17
Ju
l-1
7
Au
g-1
7
Standard N/A
0 0 0 0 0 0 0 0 0 0 0 0 0 0 0 0 0 0 0 0 0 0 0 0 0
1
2
3
Se
p-1
5
Oct-
15
Nov-1
5
Dec-1
5
Jan
-16
Feb-1
6
Mar-
16
Ap
r-16
May-1
6
Jun
-16
Jul-1
6
Au
g-1
6
Se
p-1
6
Oct-
16
Nov-1
6
Dec-1
6
Jan
-17
Feb-1
7
Mar-
17
Ap
r-17
May-1
7
Jun
-17
Jul-1
7
Au
g-1
7
Standard Zero
Page | 25

k6.11 | Cancer - Two week waitk6.12 | Cancer - Two week referral to 1st outpatient - breast
symptoms
Responsive August 2017
k6.09 | LAS Ambulance Handovers - 30 min waits k6.10 | LAS Ambulance Handovers - 60 min waits
88%
90%
92%
94%
96%
98%
100%
Se
p-1
5
Oct-
15
Nov-1
5
Dec-1
5
Jan
-16
Feb-1
6
Mar-
16
Ap
r-16
May-1
6
Jun
-16
Jul-1
6
Au
g-1
6
Se
p-1
6
Oct-
16
Nov-1
6
Dec-1
6
Jan
-17
Feb-1
7
Mar-
17
Ap
r-17
May-1
7
Jun
-17
Jul-1
7
Au
g-1
7
Standard >=93%
80%
82%
84%
86%
88%
90%
92%
94%
96%
98%
100%
Se
p-1
5
Oct-
15
Nov-1
5
Dec-1
5
Jan
-16
Fe
b-1
6
Ma
r-1
6
Ap
r-16
May-1
6
Jun
-16
Jul-1
6
Au
g-1
6
Se
p-1
6
Oct-
16
Nov-1
6
Dec-1
6
Jan
-17
Feb-1
7
Mar-
17
Ap
r-17
May-1
7
Jun
-17
Jul-1
7
Au
g-1
7
Standard >=93%
5 5 5 7 4
13
5 8 9
3 4 7
3
29
20
49
68
26 27
11
19
10
21 17
0
10
20
30
40
50
60
70
80
Se
p-1
5
Oct-
15
Nov-1
5
Dec-1
5
Jan
-16
Feb-1
6
Mar-
16
Ap
r-16
May-1
6
Jun
-16
Jul-1
6
Au
g-1
6
Se
p-1
6
Oct-
16
Nov-1
6
Dec-1
6
Jan
-17
Feb-1
7
Mar-
17
Ap
r-17
May-1
7
Jun
-17
Jul-1
7
Au
g-1
7
Standard Zero
0 0 0 0 0 0 1 4
0 0 0 0 0 5
9 6
26
4 3 2 5
2 2 1 0
10
20
30
40
50
60
70
80
Se
p-1
5
Oct-
15
Nov-1
5
Dec-1
5
Jan
-16
Feb-1
6
Ma
r-1
6
Ap
r-16
May-1
6
Jun
-16
Jul-1
6
Au
g-1
6
Se
p-1
6
Oct-
16
Nov-1
6
Dec-1
6
Jan
-17
Feb-1
7
Ma
r-1
7
Ap
r-17
May-1
7
Jun
-17
Jul-1
7
Au
g-1
7
Standard Zero
Page | 26

k6.15 | Cancer - 31 day second or subsequent treatment -
surgeryk6.16 | Cancer - Two month urgent referral to treatment wait
Responsive August 2017
k6.13 | Cancer - Patients receiving first definitive treatment
within one month (31 days) of a cancer diagnosisk6.14 | Cancer - 31 day second or subsequent treatment - drug
90%
91%
92%
93%
94%
95%
96%
97%
98%
99%
100%
Se
p-1
5
Oct-
15
No
v-1
5
Dec-1
5
Jan
-16
Feb-1
6
Mar-
16
Ap
r-16
May-1
6
Jun
-16
Ju
l-1
6
Au
g-1
6
Se
p-1
6
Oct-
16
No
v-1
6
Dec-1
6
Jan
-17
Feb-1
7
Mar-
17
Ap
r-17
May-1
7
Jun
-17
Ju
l-1
7
Au
g-1
7
Standard >=94%
70%
75%
80%
85%
90%
95%
100%
Se
p-1
5
Oct-
15
Nov-1
5
Dec-1
5
Jan
-16
Fe
b-1
6
Ma
r-1
6
Ap
r-16
May-1
6
Jun
-16
Jul-1
6
Au
g-1
6
Se
p-1
6
Oct-
16
Nov-1
6
Dec-1
6
Jan
-17
Feb-1
7
Mar-
17
Ap
r-17
May-1
7
Jun
-17
Jul-1
7
Au
g-1
7
Standard >=85%
91%
92%
93%
94%
95%
96%
97%
98%
99%
100%
Se
p-1
5
Oct-
15
Nov-1
5
Dec-1
5
Jan
-16
Feb-1
6
Ma
r-1
6
Ap
r-16
May-1
6
Jun
-16
Jul-1
6
Au
g-1
6
Se
p-1
6
Oct-
16
Nov-1
6
Dec-1
6
Jan
-17
Feb-1
7
Ma
r-1
7
Ap
r-17
May-1
7
Jun
-17
Jul-1
7
Au
g-1
7
Standard >=96%
90%
100%
Se
p-1
5
Oct-
15
No
v-1
5
De
c-1
5
Ja
n-1
6
Fe
b-1
6
Mar-
16
Ap
r-16
Ma
y-1
6
Ju
n-1
6
Ju
l-1
6
Au
g-1
6
Se
p-1
6
Oct-
16
Nov-1
6
Dec-1
6
Jan
-17
Feb-1
7
Mar-
17
Ap
r-17
May-1
7
Jun
-17
Jul-1
7
Au
g-1
7
Standard >=98%
Page | 27

k6.20 | Number of delayed transfers of care - bed days k6.21 | Delayed transfers of care - Rate per occupied bed day
Responsive August 2017
k6.17 | Cancer - 62 day wait for first treatment following
referral from a NHS Cancer Screening Service
k6.18 | Cancer - 62 day wait for first treatment following
consultant upgrade
70%
75%
80%
85%
90%
95%
100%
Se
p-1
5
Oct-
15
Nov-1
5
Dec-1
5
Jan
-16
Feb-1
6
Ma
r-1
6
Ap
r-16
May-1
6
Jun
-16
Jul-1
6
Au
g-1
6
Se
p-1
6
Oct-
16
Nov-1
6
Dec-1
6
Jan
-17
Feb-1
7
Ma
r-1
7
Ap
r-17
May-1
7
Jun
-17
Jul-1
7
Au
g-1
7
Standard >=90%
70%
75%
80%
85%
90%
95%
100%
Se
p-1
5
Oct-
15
No
v-1
5
De
c-1
5
Ja
n-1
6
Fe
b-1
6
Mar-
16
Ap
r-16
Ma
y-1
6
Ju
n-1
6
Ju
l-1
6
Au
g-1
6
Se
p-1
6
Oct-
16
Nov-1
6
Dec-1
6
Jan
-17
Feb-1
7
Mar-
17
Ap
r-17
May-1
7
Jun
-17
Jul-1
7
Au
g-1
7
Standard >=85%
429
771
65
6 748
561
475
600 7
48
631
605
605
666
67
5 787
831
744
77
6
616
643 746
936
673
453
50
7
0
200
400
600
800
1,000
1,200
Se
p-1
5
Oct-
15
No
v-1
5
Dec-1
5
Jan
-16
Feb-1
6
Mar-
16
Ap
r-16
May-1
6
Jun
-16
Jul-1
6
Au
g-1
6
Se
p-1
6
Oct-
16
Nov-1
6
Dec-1
6
Jan
-17
Feb-1
7
Mar-
17
Ap
r-1
7
May-1
7
Jun
-17
Jul-1
7
Au
g-1
7
Standard N/A
0%
1%
2%
3%
4%
5%
6%
7%
8%
9%
Se
p-1
5
Oct-
15
No
v-1
5
Dec-1
5
Jan
-16
Feb-1
6
Mar-
16
Ap
r-16
May-1
6
Ju
n-1
6
Jul-1
6
Au
g-1
6
Se
p-1
6
Oct-
16
No
v-1
6
Dec-1
6
Ja
n-1
7
Feb-1
7
Mar-
17
Ap
r-17
May-1
7
Ju
n-1
7
Jul-1
7
Au
g-1
7
Standard <=4%
Page | 28

Responsive August 2017
k6.22 | Number of cancelled operationsk6.23 | Number of patients not treated within 28 days of last
minute cancellation
21
6 7
2
6 5
12
4
8 7
8 7
5
14
12
15
2
7
1 1
11
0
5
10
15
20
25
Se
p-1
5
Oct-
15
Nov-1
5
Dec-1
5
Jan
-16
Feb-1
6
Mar-
16
Ap
r-16
May-1
6
Jun
-16
Jul-1
6
Au
g-1
6
Se
p-1
6
Oct-
16
Nov-1
6
Dec-1
6
Jan
-17
Feb-1
7
Mar-
17
Ap
r-17
May-1
7
Jun
-17
Jul-1
7
Au
g-1
7
Standard N/A
0 0 0 0 0 0
2
0 0
1
0 0 0 0 0
1
3
0 0 0 0 0 0
1
2
3
4
Se
p-1
5
Oct-
15
No
v-1
5
Dec-1
5
Jan
-16
Feb-1
6
Mar-
16
Ap
r-16
May-1
6
Ju
n-1
6
Ju
l-1
6
Au
g-1
6
Se
p-1
6
Oct-
16
Nov-1
6
Dec-1
6
Jan
-17
Feb-1
7
Mar-
17
Ap
r-17
Ma
y-1
7
Jun
-17
Jul-1
7
Au
g-1
7
Standard Zero
Page | 29

Well-led August 2017
Vacancy (k7.01) The vacancy rate decreased this month to 10.64%. This is largely due to the decrease in number of leavers. The highest WTE vacant remains in the Qualified Nursing staff group (112wte) and Admin & Estates (74wte), although both theses areas have decreased this month. Qualified Midwifery vacancies have risen but the recruitment in the pipeline will mean that this will reduce next month. The average vacancy rates for our local comparator's is now 13.57%, which we fall below. Turnover (k7.02) The Turnover rate has also reduced to his month to 17.47%, but is still a red rating. High turnover remains within the Accident & Emergency and Elderly Care Service Lines and within the Unqualified Nursing staff group. The Trust are reintroducing the 100 survey but in the form of Focus Groups and it is hoped that by engaging with new starters this will help retain their employment within the Trust for longer. The average turnover rate for our local comparator's is 14.43% which we are currently sit some way above. Sickness (k7.03) The Sickness rate has decreased this month to 2.44% an amber rating. Long Term sickness has also reduced this month. The Unqualified Nursing staff group remains the only staff group that is red rated. The Ask HR team continue to monitor sickness triggers for all employees, both long and short term, and liaise with managers and occupational health about non compliant staff. The average sickness rate for our local comparator's is 2.81%, which we fall below.
Mandatory Training (k7.04) This month the compliance rate has fallen again to 71.27%, a red rating. All face-to-face training has lower compliance rates and this needs to be tackled to increase compliance. Focus also continues to be on employees completing training before they come out of compliance. Only 7 Service Lines are green rated. Lowest compliance rates are in the Unplanned Care Division and in the Clinical Support and Unqualified Nursing staff groups. The average Mandatory Training compliance for our local comparator's is 80.42% which we now fall almost 10% below. Appraisals (k7.05) The Appraisal target this year is to reach 90% by quarter 1. Currently we have reached 75.06%, so 15% below our intended target. 11 service Lines have reached compliance, and 6 are amber rate, Lowest compliance is within the Corporate directorates and needs to be tackled.
Local Comparators (10): St George's Healthcare, Epsom & St Helier, Croydon Health, Guy's and St Thomas', Imperial College Healthcare, Chelsea & Westminster, West Middlesex, Ashford & St Peter's, Frimley and Royal Surrey
Page | 30

k7.03 | Sickness rate k7.04 | Mandatory training
Well-led August 2017
k7.01 | Vacancy rate k7.02 | Turnover rate
0.0%
0.5%
1.0%
1.5%
2.0%
2.5%
3.0%
3.5%
4.0%
Se
p-1
5
Oct-
15
Nov-1
5
Dec-1
5
Ja
n-1
6
Feb-1
6
Mar-
16
Ap
r-16
May-1
6
Ju
n-1
6
Jul-1
6
Au
g-1
6
Se
p-1
6
Oct-
16
Nov-1
6
Dec-1
6
Jan
-17
Feb-1
7
Mar-
17
Ap
r-17
May-1
7
Ju
n-1
7
Jul-1
7
Au
g-1
7
Standard <=2.3%
0%
10%
20%
30%
40%
50%
60%
70%
80%
90%
100%
Se
p-1
5
Oct-
15
Nov-1
5
Dec-1
5
Jan
-16
Fe
b-1
6
Ma
r-1
6
Ap
r-16
May-1
6
Jun
-16
Jul-1
6
Au
g-1
6
Se
p-1
6
Oct-
16
Nov-1
6
Dec-1
6
Jan
-17
Feb-1
7
Mar-
17
Ap
r-17
May-1
7
Jun
-17
Jul-1
7
Au
g-1
7
Standard >=85%
0%
2%
4%
6%
8%
10%
12%
Se
p-1
5
Oct-
15
Nov-1
5
Dec-1
5
Jan
-16
Feb-1
6
Mar-
16
Ap
r-16
May-1
6
Jun
-16
Jul-1
6
Au
g-1
6
Se
p-1
6
Oct-
16
Nov-1
6
Dec-1
6
Jan
-17
Feb-1
7
Mar-
17
Ap
r-17
May-1
7
Jun
-17
Jul-1
7
Au
g-1
7
Standard <=5%
0%
5%
10%
15%
20%
25%
Se
p-1
5
Oct-
15
No
v-1
5
De
c-1
5
Ja
n-1
6
Fe
b-1
6
Mar-
16
Ap
r-16
Ma
y-1
6
Ju
n-1
6
Ju
l-1
6
Au
g-1
6
Se
p-1
6
Oct-
16
Nov-1
6
Dec-1
6
Jan
-17
Feb-1
7
Mar-
17
Ap
r-17
May-1
7
Jun
-17
Jul-1
7
Au
g-1
7
Standard <=15%
Page | 31
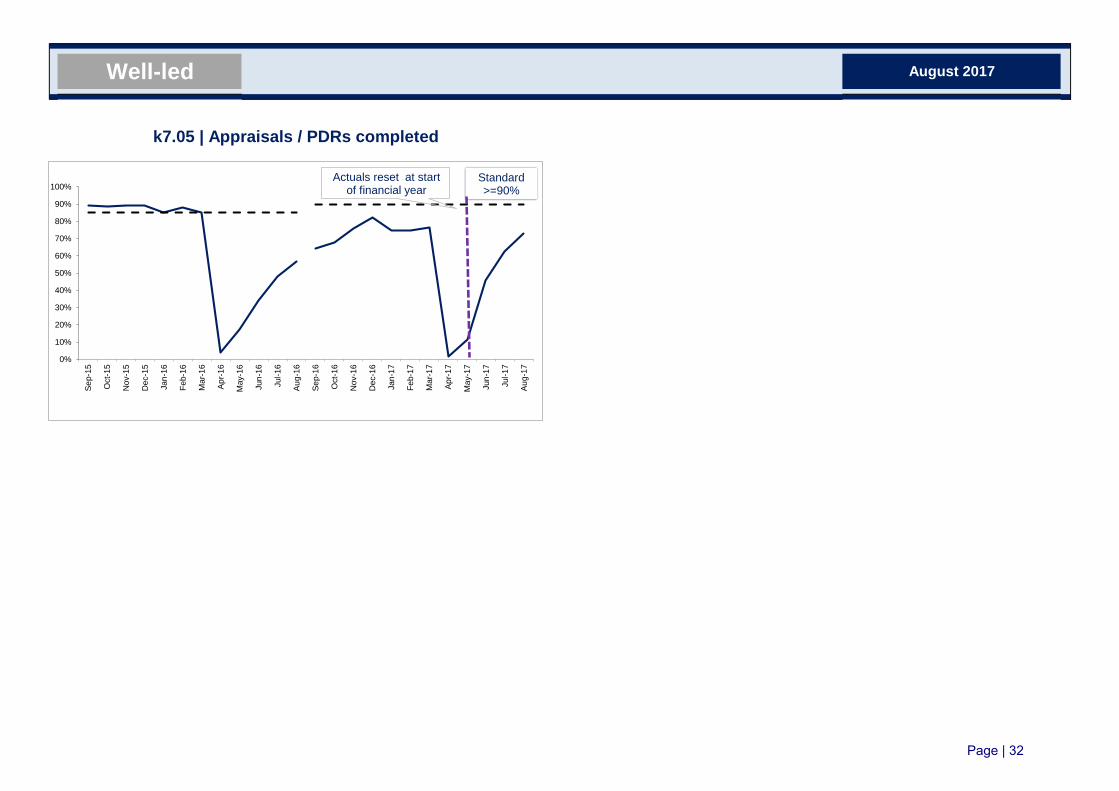
k7.05 | Appraisals / PDRs completed
Well-led August 2017
0%
10%
20%
30%
40%
50%
60%
70%
80%
90%
100%
Se
p-1
5
Oct-
15
Nov-1
5
Dec-1
5
Jan
-16
Feb-1
6
Mar-
16
Ap
r-16
May-1
6
Jun
-16
Jul-1
6
Au
g-1
6
Se
p-1
6
Oct-
16
Nov-1
6
Dec-1
6
Jan
-17
Feb-1
7
Mar-
17
Ap
r-1
7
May-1
7
Jun
-17
Jul-1
7
Au
g-1
7
Standard >=90%
Actuals reset at start of financial year
Page | 32

KPI Description
Sep-16
Oct-16
Nov-16
Dec-16
Jan-17
Feb-17
Mar-17
Apr-17
May-17
Jun-17
Jul-17
Aug-17
Type
Sep-16 Oct-16 Nov-16 Dec-16 Jan-17 Feb-17 Mar-17 Apr-17 May-17 Jun-17 Jul-17 Aug-17 YTD 2016/17
k1.01 Pressure ulcers - Hospital acquired (Grade 3 and 4)per
monthNumber 0 1 3 1 3 5 6 3 3 0 6 4 16 24
k1.011 Pressure ulcers - Hospital acquired (Grade 3 and 4) - Avoidable Number 0 0 1 0 2 4 4 2 0 0 2 2 0 0
k1.012 Pressure ulcers - Hospital acquired (Grade 3 and 4) - Unavoidable Number 0 1 2 0 1 1 2 1 3 0 4 2 19 28
k1.02Patients with Hospital acquired pressure ulcers (Grade 3 and 4) per 1000
beddays
per
monthRate 0.00 0.09 0.25 0.08 0.23 0.43 0.50 0.26 0.25 0.00 0.58 0.36 0.28 0.18
k1.03 Pressure ulcers - Hospital acquired (Grade 2)per
monthNumber 2 1 3 2 4 6 1 2 8 3 3 3 19 28
k1.031 Pressure ulcers - Hospital acquired (Grade 2) - Avoidable Number 1 0 3 1 2 5 0 0 4 2 1 2 1 4
k1.032 Pressure ulcers - Hospital acquired (Grade 2) - Unavoidable Number 1 1 0 1 2 1 1 2 4 1 2 1 4 16
k1.04 Patients with Hospital acquired pressure ulcers (Grade 2) per 1000 beddaysper
monthRate 0.18 0.09 0.25 0.17 0.31 0.52 0.08 0.17 0.66 0.27 0.29 0.27 0.34 0.21
k1.05 MRSA Bacteraemias - Post 48 hour (hospital acquired)per
monthNumber 0 0 1 0 1 1 0 2 0 0 0 0 2 3
k1.06 MSSA Bacteraemias - Post 48 hour (Hospital Acquired)per
monthNumber 0 0 0 0 0 1 2 1 0 0 0 0 1 4
k1.07 Clostridium difficile Infections - Post 72 hours (Hospital Acquired) Number 2 1 1 0 5 1 1 1 1 0 1 1 4 16
k1.08Clostridium difficile Infections - Post 72 hours (Hospital Acquired) due to
Lapse in Care (confirmed cases)
per
annumNumber 0 0 0 0 1 0 0 0 0 0 0 0 0 1
k1.09 Completed Patient Observations - All (same as Adult inpatients)per
month% 98.35% 96.89% 97.76% 97.15% 96.47% 95.80% 95.79% 99.35% 97.72% 98.42% 95.18% 95.24% 97.14% 95.89%
k1.10 Completed Patient Observations - Paediatricper
month% 100.00% 95.24% 100.00% 94.16% 100.00% 98.10% 100.00% 98.99% 99.12% 100.00% 100.00% 92.08% 97.99% 94.65%
k1.11 Harm Free Care (All) (PST) - KHT % 95.54% 92.19% 92.74% 95.51% 96.25% 97.81% 94.38% 98.16% 98.52% 99.30% 96.64% 98.16% 94.36%
k1.12 Patient Safety Incident (PSI) Fallsper
monthNumber 59 62 53 49 86 60 61 41 57 56 64 61 279 697
k1.13 Number of Patient Safety incident Falls per 1000 (G&A) bed daysper
monthRate 5.45 5.35 4.48 4.07 6.74 5.15 5.07 3.59 4.70 5.10 6.16 5.44 4.97 5.11
k1.14 Patient Safety Incident Falls where moderate or severe harm occurredper
monthNumber 1 2 1 3 4 0 1 1 0 2 1 2 6 23
k1.15 Never Eventsper
monthNumber 1 0 0 0 0 0 0 0 0 0 0 0 0 3
k1.16 Medication Incidents Number 63 63 56 48 67 53 46 30 51 75 73 61 290 654
k1.17 Medication Incidents where Moderate or Severe Harm occurredper
month% 0.00% 0.00% 0.00% 0.00% 0.00% 0.00% 0.00% 0.00% 0.00% 0.00% 0.00% 0.00% 0.00% 0.15%
k1.18 Serious Untoward Incidents Number 2 0 1 9 5 4 3 2 3 2 3 1 11 38
k1.19 Escherichia coli (E. coli) bacteraemia Number 14 10 12 17 15 16 12 14 14 12 6 0 46 168
k4.01 Safer Staffing - Day - Registered Midwives / Nurses fill rate % 99.08% 100.25% 101.57% 99.11% 98.05% 99.00% 98.05% 98.60% 103.91% 95.52% 95.10% 93.07% 97.23% 98.95%
k4.02 Safer Staffing - Day - Assistant Fill Rate % 110.97% 115.26% 109.88% 105.76% 113.00% 121.86% 121.82% 119.52% 130.76% 108.50% 101.08% 99.37% 111.26% 117.31%
k4.03 Safer Staffing - Night - Registered Midwives / Nurses fill rate % 100.63% 100.87% 101.16% 99.27% 102.75% 102.04% 97.41% 97.52% 101.02% 100.73% 125.16% 94.73% 102.75% 99.98%
k4.04 Safer Staffing - Night - Assistant Fill Rate % 121.17% 118.84% 116.47% 113.38% 128.00% 132.75% 127.62% 127.07% 134.22% 103.90% 127.61% 100.28% 117.23% 124.32%
k4.05 Safer Staffing - Overall trust fill rate % 104.16% 105.19% 104.55% 101.89% 105.40% 107.70% 105.28% 105.15% 111.29% 100.55% 107.27% 95.70% 103.86% 105.30%
k4.06Safer Staffing - % of Registered Nurse and Midwife expenditure on agency
staff% 6.40% 8.42% 5.07% 7.24% 7.15% 6.84% 6.38% 5.59% 7.50% 4.82% 1.54% 3.68% 4.68% 7.51%
k4.07 Safer Staffing - Care Hours per Patient Day Rate 7.72 7.59 7.53 7.33 7.45 7.77 7.89 7.66 7.90 7.86 8.30 8.19 7.97 7.82
<=9
-
Rolling 12-Month ScorecardDomain Scorecard Summary
Safe
-
<=5.3
<=6
=0
-
<=0.04
-
-
-
-
-
-
-
<=58
Standard
<=1
<=0.1
<=3
<=0.51
=0
<=1
>=0.97
>=0.97
-
Page | 33

KPI Description
Sep-16
Oct-16
Nov-16
Dec-16
Jan-17
Feb-17
Mar-17
Apr-17
May-17
Jun-17
Jul-17
Aug-17
Type
Sep-16 Oct-16 Nov-16 Dec-16 Jan-17 Feb-17 Mar-17 Apr-17 May-17 Jun-17 Jul-17 Aug-17 YTD 2016/17
Rolling 12-Month ScorecardDomain Scorecard Summary
Standard
k5.01 Maternity - Caesarean section rateper
month% 30.37% 32.87% 30.93% 32.80% 27.08% 30.75% 31.47% 26.97% 25.95% 27.00% 30.79% 32.49% 28.57% 29.98%
k5.02Maternity - % of women with a primary postpartum haemorrhage of
1500ml or more
per
month% 2.71% 2.28% 2.71% 3.42% 3.14% 3.56% 3.15% 2.47% 3.38% 4.22% 2.47% 2.53% 3.04% 3.59%
k5.03Maternity - % of women with a primary postpartum haemorrhage of
2000ml or more
per
month% 1.04% 0.62% 1.17% 1.37% 0.42% 1.43% 1.80% 1.12% 1.05% 1.48% 0.90% 0.46% 1.01% 1.35%
k5.04 Maternity - Significant Perineal Trauma % 2.48% 3.56% 2.33% 2.28% 2.92% 2.58% 1.79% 3.37% 1.69% 2.53% 1.57% 3.23% 2.46% 2.58%
k2.01 Standardised healthcare mortality index (SHMI) - most recent score Index 90.921 90.921 90.921 90.640 90.640 90.640 87.630 87.630 87.630 85.840 85.840 85.840 85.840 90.921
k2.02 Unadjusted Mortality Rate % 0.78% 0.66% 0.84% 1.18% 1.57% 1.30% 0.90% 0.93% 1.05% 1.07% 0.74% 0.96% 0.95% 1.01%
k2.03 Sepsis - % of eligible patients screened for sepsis - EDper
month% 84.38% 82.14% 80.00% 75.00% 78.57% 45.83% 76.19% 68.00% 64.00% 54.00% 62.00% 72.60%
k2.04Sepsis - % of eligible patients who received antibiotics within 1 hour of
arrival - ED
per
month% 70.00% 55.56% 69.23% 56.25% 66.67% 77.27% 55.00% 42.42% 50.00% 62.50% 50.59% 62.78%
k2.13 Sepsis - % of eligible patients screened for sepsis - Inpatientsper
month% 56.52% 40.00% 47.83% 54.17% 65.38% 57.14% 42.11% 74.00% 48.00% 40.00% 54.00% 53.60%
k2.14Sepsis - % of eligible patients who received antibiotics within 1 hour -
Inpatients
per
month% 66.67% 50.00% 33.33% 60.00% 33.33% 40.00% 35.71% 35.29% 18.18% 40.00% 32.56% 51.76%
k2.05 VTE Assessments (Trust)per
month% 98.64% 97.81% 98.24% 98.05% 97.85% 97.89% 98.14% 97.99% 97.56% 98.29% 98.29% 97.88% 98.00% 98.31%
k2.06 Incidence of Hospital Acquired VTE (HAT) Number 2 1 1 1 1 5 3 4 1 5 4 3 17 21
k2.07 % of eligible patients screened for dementiaper
month% 67.21% 72.79% 64.38% 80.39% 76.49% 81.11% 74.92% 72.66% 76.68% 71.21% 73.54% 63.15%
k2.08 % of patients with dementia who were properly assessedper
month% 80.00% 73.91% 91.49% 84.44% 94.00% 89.47% 91.84% 83.72% 90.24% 86.96% 86.92% 75.81%
k2.09 % emergency readmissions following elective admission - 30 days % 1.74% 2.16% 1.98% 2.79% 1.96% 1.83% 2.01% 1.63% 2.78% 2.47% 2.84% 2.93% 2.56% 1.95%
k2.10 % emergency readmissions following emergency admission - 30 days % 12.00% 12.33% 12.55% 13.55% 14.26% 13.61% 15.12% 14.76% 15.67% 16.01% 16.03% 14.48% 15.42% 12.92%
k2.11 Hand Hygieneper
month% 89.20% 94.12% 92.99% 92.18% 95.96% 96.26% 96.11% 94.00% 96.65% 96.82% 97.80% 97.05% 96.45% 91.49%
k2.12 Open Incidents - % of managers reports completed within 10 days % 43.65% 39.80% 44.21% 37.31% 45.48% 39.45% 50.25% 37.82% 41.34% 32.95% 34.20% 35.90% 36.29% 41.95%
Caring
k3.01 Number of complaints received this month Number 30 26 40 30 30 27 37 31 30 27 35 24 147 392
k3.02 Number of complaints reopened this month Number 10 2 5 5 6 6 6 6 5 2 4 5 22 66
k3.03 Number of complaints referred to ombudsman this month Number 1 0 0 1 2 0 1 1 0 0 0 0 1 5
k3.14 Complaints Response Rate % 87.50% 79.41% 82.14% 79.17% 76.32% 88.46% 82.05% 64.52% 80.00% 82.61% 93.10% 96.77% 83.33% 81.93%
k3.05 FFT - Trust - % Would Recommend % 95.22% 96.08% 95.04% 95.86% 93.91% 95.30% 94.57% 95.10% 95.19% 96.11% 95.69% 95.74% 95.57% 94.64%
k3.06 FFT - InPatients - % Would Recommendper
month% 95.74% 96.37% 96.22% 96.35% 93.04% 95.49% 95.79% 94.82% 95.53% 98.16% 96.99% 96.95% 96.51% 95.46%
k3.07 FFT - Paediatric InPatients - % Would Recommend % 97.44% 100.00% 92.59% 95.89% 87.50% 97.06% 93.55% 86.67% 89.36% 94.12% 95.24% 100.00% 93.78% 94.32%
k3.08 FFT - OutPatients - % Would Recommend % 95.09% 95.35% 94.67% 95.05% 94.24% 94.71% 94.70% 95.64% 95.73% 95.98% 96.36% 95.33% 95.70% 93.31%
k3.09 FFT - A&E - % Would Recommend % 92.33% 96.50% 93.54% 96.49% 93.15% 94.87% 91.03% 93.18% 88.53% 93.59% 88.18% 94.23% 109.52% 94.34%
k3.10 FFT - Maternity - % Would Recommend % 98.85% 97.48% 94.68% 94.89% 96.09% 96.96% 98.08% 97.75% 100.00% 100.00% 100.00% 100.00% 98.83% 96.65%
-
-
>=90%
>=90%
>=95%
<=0.26
<0.031
<=0.01
-
-
>=90%
>=90%
-
-
-
-
-
-
>96%
-
-
-
-
Effective
<=95
-
>=90%
>=90%
>=95%
Page | 34

KPI Description
Sep-16
Oct-16
Nov-16
Dec-16
Jan-17
Feb-17
Mar-17
Apr-17
May-17
Jun-17
Jul-17
Aug-17
Type
Sep-16 Oct-16 Nov-16 Dec-16 Jan-17 Feb-17 Mar-17 Apr-17 May-17 Jun-17 Jul-17 Aug-17 YTD 2016/17
Rolling 12-Month ScorecardDomain Scorecard Summary
Standard
k3.11 FFT - Daycases - % Would Recommend % 98.24% 98.33% 97.86% 98.77% 99.13% 100.00% 99.00% 98.09% 98.23% 100.00% 98.28% 98.02% 98.13% 98.33%
k3.13 Number of Mixed Sex accommodation breaches Number 0 0 0 4 0 0 0 0 0 0 0 0 0 6
k6.01 Average length of stay - Emergency Services (Emergency admissions only)per
monthRate 6.00 5.52 5.87 6.02 6.01 6.13 5.93 5.11 5.03 4.73 4.46 4.38 4.75 5.27
k6.02 RTT - incomplete 92% in 18 weeks (NONC)per
month% 95.42% 95.44% 95.18% 95.02% 94.81% 95.03% 95.12% 94.63% 94.67% 94.55% 94.31% 94.47% 94.53% 95.70%
k6.03 RTT - incomplete 52+ Week Waiters (NONC)per
monthNumber 0 0 0 0 0 0 1 0 1 2 2 1 6 1
k6.04 Diagnostic Test Waiting Times - Completed within 6 weeks (ALL)per
month% 99.78% 99.84% 99.54% 99.27% 99.68% 99.73% 99.79% 99.27% 99.27% 99.45% 99.18% 99.06% 99.25% 99.73%
k6.05 A&E 4 hour waiting time (type 1) - % 91.37% 88.48% 86.79% 84.58% 80.85% 85.59% 89.84% 89.44% 87.78% 88.96% 92.14% 90.24% 89.69% 88.99%
k6.06 A&E 4 hour waiting time (all types)per
month% 92.29% 89.56% 87.99% 85.94% 82.62% 87.13% 90.94% 90.39% 89.04% 90.17% 92.93% 91.34% 90.76% 90.06%
k6.07 A&E 12 hour trolley waitsper
monthNumber 0 0 0 0 0 0 0 0 0 0 0 0 0 0
k6.08 LAS Ambulance Handovers - within 15 minutes - % 58.50% 53.40% 57.40% 50.50% 47.80% 54.00% 55.30% 52.90% 49.70% 52.60% 54.20% 52.30% 52.30% 55.70%
k6.09 LAS Ambulance Handovers - 30 min handover waitsper
monthNumber 3 29 20 49 68 26 27 11 19 10 21 17 78 253
k6.10 LAS Ambulance Handovers - 60 min handover waitsper
monthNumber 0 5 9 6 26 4 3 2 5 2 2 1 12 57
k6.11 All Cancer Two Week Waitper
month% 98.30% 98.83% 98.51% 99.11% 98.54% 97.96% 99.35% 99.05% 99.41% 98.22% 98.96% 98.90% 98.31%
k6.12 2 week GP referral to 1st outpatient - breast symptomsper
month% 100.00% 99.29% 100.00% 99.33% 98.79% 96.91% 99.00% 98.04% 98.83% 100.00% 98.52% 98.86% 98.66%
k6.13Percentage of patients receiving first definitive treatment within one month
(31-days) of a cancer diagnosis (measured from ‘date of decision to treat’)
per
month% 100.00% 100.00% 100.00% 98.90% 98.77% 100.00% 100.00% 100.00% 100.00% 100.00% 100.00% 100.00% 99.71%
k6.14 31 day second or subsequent treatment - drug per
month% 100.00% 100.00% 100.00% 100.00% 100.00% 100.00% 100.00% 100.00% 100.00% 100.00% 100.00% 100.00% 100.00%
k6.15 31-Day Standard for Subsequent Cancer Treatments-Surgeryper
month% 93.75% 100.00% 100.00% 100.00% 100.00% 100.00% 100.00% 100.00% 100.00% 100.00% 94.44% 98.15% 99.01%
k6.16 All Cancer Two Month Urgent Referral to Treatment Waitper
month% 90.48% 90.57% 93.94% 95.88% 94.74% 92.79% 94.23% 93.81% 100.00% 93.07% 94.44% 95.44% 93.72%
k6.1762-Day Wait for First Treatment Following Referral from an NHS Cancer
Screening Service
per
month% 100.00% 100.00% 100.00% 100.00% 100.00% 85.71% 100.00% 100.00% 100.00% 100.00% 100.00% 100.00% 96.55%
k6.1862-Day Wait for First Treatment Following Referral from Consultant
Upgrade
per
month% 95.45% 100.00% 99.00% 100.00% 100.00% 100.00% 100.00% 85.71% 83.33% 100.00% 90.91% 92.31% 98.67%
k6.20 Delayed transfers of care (bed days) - Number 675 787 831 744 776 616 643 746 936 673 453 507 3315 8327
k6.21 Delayed transfers of care (rate per occupied bed days)per
month% 6.23% 6.79% 7.03% 6.18% 6.08% 5.29% 5.34% 6.53% 7.72% 6.13% 4.36% 4.52% 5.90% 6.11%
k6.22 Number of last minute cancelled operations - Number 5 14 29 12 15 2 7 1 1 11 0 0 13 118
k6.23 Number of patients not treated within 28 days of last minute cancellationper
monthNumber 0 0 0 1 3 0 0 0 0 0 0 0 0 5
k7.01 Vacancy rateper
month% 7.73% 6.68% 5.96% 6.99% 6.36% 6.20% 4.99% 10.70% 10.93% 11.02% 11.10% 10.64% 10.64% 5.00%
k7.02 Turnover rateper
month% 16.91% 16.20% 16.27% 16.75% 16.57% 16.41% 16.33% 16.59% 17.21% 17.59% 17.72% 17.47% 17.47% 17.00%
k7.03 Sickness rateper
month% 2.76% 3.22% 2.79% 2.60% 3.15% 3.01% 2.76% 2.52% 2.65% 2.29% 2.57% 2.44% 2.52% 2.50%
k7.04 Mandatory Trainingper
month% 85.30% 84.86% 82.78% 81.12% 80.98% 80.45% 82.12% 82.78% 81.81% 78.61% 75.61% 71.27% 71.27% 84.86%
>=95%
=0
=0
>=85%
<=4%
>=96%
>=98%
>=94%
>=85%
>=90%
>=92%
<=5.23
=0
-
Well-led
<=5%
<=15%
Responsive
=0
=0
>=93%
>=93%
=0
>=99%
<=2.3%
>=85%
Page | 35

KPI Description
Sep-16
Oct-16
Nov-16
Dec-16
Jan-17
Feb-17
Mar-17
Apr-17
May-17
Jun-17
Jul-17
Aug-17
Type
Sep-16 Oct-16 Nov-16 Dec-16 Jan-17 Feb-17 Mar-17 Apr-17 May-17 Jun-17 Jul-17 Aug-17 YTD 2016/17
Rolling 12-Month ScorecardDomain Scorecard Summary
Standard
k7.05 Appraisals / PDRs completed year end % 64.00% 68.00% 76.00% 82.08% 74.64% 74.94% 76.42% 1.59% 11.33% 45.77% 62.40% 72.86% 72.86% 68.00%>=90%
Page | 36
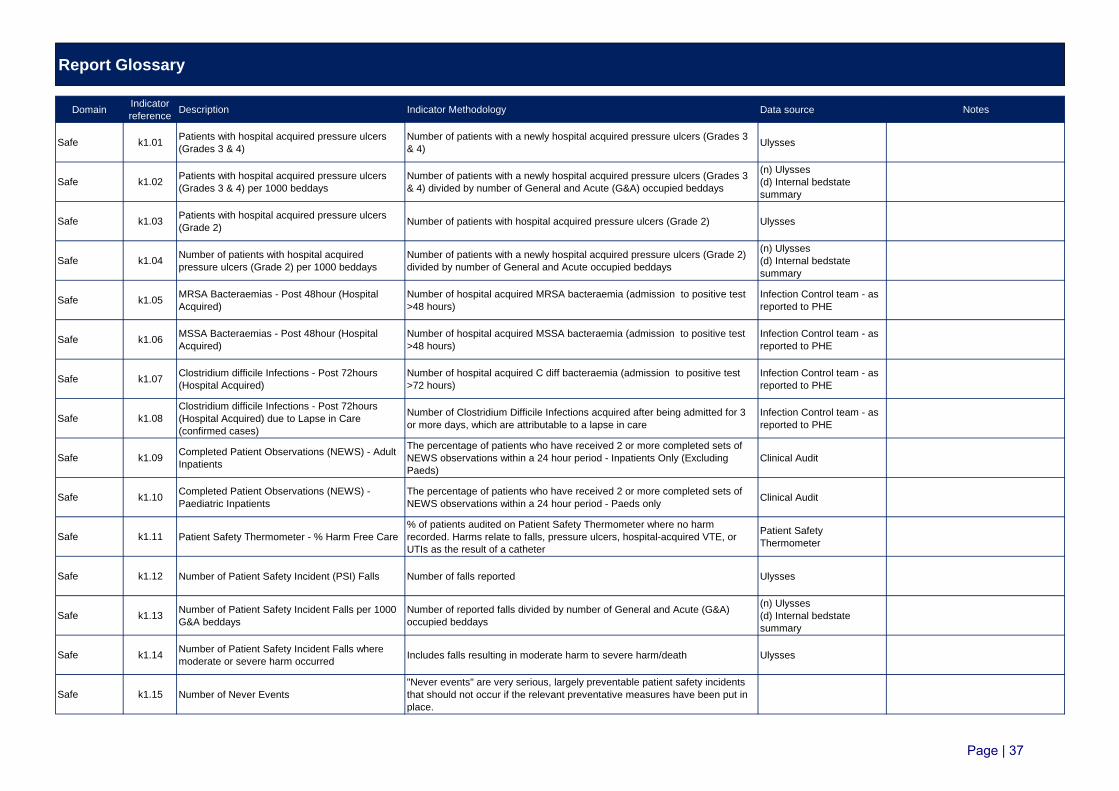
Report Glossary
DomainIndicator
referenceDescription Indicator Methodology Data source Notes
Safe k1.01Patients with hospital acquired pressure ulcers
(Grades 3 & 4)
Number of patients with a newly hospital acquired pressure ulcers (Grades 3
& 4)Ulysses
Safe k1.02Patients with hospital acquired pressure ulcers
(Grades 3 & 4) per 1000 beddays
Number of patients with a newly hospital acquired pressure ulcers (Grades 3
& 4) divided by number of General and Acute (G&A) occupied beddays
(n) Ulysses
(d) Internal bedstate
summary
Safe k1.03Patients with hospital acquired pressure ulcers
(Grade 2)Number of patients with hospital acquired pressure ulcers (Grade 2) Ulysses
Safe k1.04Number of patients with hospital acquired
pressure ulcers (Grade 2) per 1000 beddays
Number of patients with a newly hospital acquired pressure ulcers (Grade 2)
divided by number of General and Acute occupied beddays
(n) Ulysses
(d) Internal bedstate
summary
Safe k1.05MRSA Bacteraemias - Post 48hour (Hospital
Acquired)
Number of hospital acquired MRSA bacteraemia (admission to positive test
>48 hours)
Infection Control team - as
reported to PHE
Safe k1.06MSSA Bacteraemias - Post 48hour (Hospital
Acquired)
Number of hospital acquired MSSA bacteraemia (admission to positive test
>48 hours)
Infection Control team - as
reported to PHE
Safe k1.07Clostridium difficile Infections - Post 72hours
(Hospital Acquired)
Number of hospital acquired C diff bacteraemia (admission to positive test
>72 hours)
Infection Control team - as
reported to PHE
Safe k1.08
Clostridium difficile Infections - Post 72hours
(Hospital Acquired) due to Lapse in Care
(confirmed cases)
Number of Clostridium Difficile Infections acquired after being admitted for 3
or more days, which are attributable to a lapse in care
Infection Control team - as
reported to PHE
Safe k1.09Completed Patient Observations (NEWS) - Adult
Inpatients
The percentage of patients who have received 2 or more completed sets of
NEWS observations within a 24 hour period - Inpatients Only (Excluding
Paeds)
Clinical Audit
Safe k1.10Completed Patient Observations (NEWS) -
Paediatric Inpatients
The percentage of patients who have received 2 or more completed sets of
NEWS observations within a 24 hour period - Paeds onlyClinical Audit
Safe k1.11 Patient Safety Thermometer - % Harm Free Care
% of patients audited on Patient Safety Thermometer where no harm
recorded. Harms relate to falls, pressure ulcers, hospital-acquired VTE, or
UTIs as the result of a catheter
Patient Safety
Thermometer
Safe k1.12 Number of Patient Safety Incident (PSI) Falls Number of falls reported Ulysses
Safe k1.13Number of Patient Safety Incident Falls per 1000
G&A beddays
Number of reported falls divided by number of General and Acute (G&A)
occupied beddays
(n) Ulysses
(d) Internal bedstate
summary
Safe k1.14Number of Patient Safety Incident Falls where
moderate or severe harm occurredIncludes falls resulting in moderate harm to severe harm/death Ulysses
Safe k1.15 Number of Never Events
"Never events" are very serious, largely preventable patient safety incidents
that should not occur if the relevant preventative measures have been put in
place.
Page | 37

Report Glossary
DomainIndicator
referenceDescription Indicator Methodology Data source Notes
Safe k1.16 Number of Medication Incidents
The number of incidents which actually caused harm or had the potential to
cause harm involving an error in administrating, prescribing, preparing,
dispensing or monitoring medication.
Ulysses
Safe k1.17% of Medication Incidents Where Moderate or
Severe Harm Occurred
The number of Medication Incidents Where Moderate or Severe Harm
Occurred divided by the total Number of Medication IncidentsUlysses
Safe k1.18 Number of Serious Untoward Incidents Total number of serious untoward incidents reported Ulysses
Effective k2.01Standardised healthcare mortality index (SHMI) -
most recent score
This ratio demonstrates the ratio between the actual number of deaths
following hospital care in relation to the number of patients who were
expected to die based on the patient's characteristics and comorbidities
HSCIC
Effective k2.02 Unadjusted Mortality RateThe number of deaths as a percentage of all discharges, including daycase
patientsCRS
Effective k2.03Sepsis - % of eligible patients screened for sepsis
- Emergency Dept.
The percentage of patients sampled who met the criteria of the local protocol
and were screened for sepsis.Clinical Audit
Effective k2.04Sepsis - % of eligible patients who received
antibiotics within 1 hour of arrival
The total number of patients sampled who received antibiotics within 1 hour of
arrival as a percentage of those who should have received antibiotics within 1
hour of arrival.
Clinical Audit
Effective k2.05 VTE Assessments (Trust)Percentage of patients risk-assessed for Venous-Thromboembolism within 24
hours of admissionCRS
Effective k2.06 Incidence of Hospital Acquired VTE (HAT) Number of recorded instances of VTE acquired while admitted Ulysses
Effective k2.07 % of eligible patients screened for dementiaOf the patients who were eligible to be screened for dementia (aged 75 and
with a length of stay of 72 hours or greater), how many were screenedClinical Audit
Effective k2.08% of patients with dementia who were properly
assessed
Of the patients who were identified using the dementia screening
assessments, how many were appropriately assessed.Clinical Audit
Effective k2.09% emergency readmissions following elective
admission - 30 days
Percentage of patients re-admitted within 30 days of a previous elective
admissionCRS
Effective k2.10% emergency readmissions following emergency
admission - 30 days
Percentage of patients re-admitted within 30 days of a previous emergency
admissionCRS
Effective k2.11 Hand Hygiene Compliance rate with the Infection Control Saving Lives Audit Infection Control
Effective k2.12Open Incidents - % of managers reports
completed within 10 days
Percentage of Incidents Recorded on Ulysses that have been completed
within appropriate time frameUlysses
Page | 38

Report Glossary
DomainIndicator
referenceDescription Indicator Methodology Data source Notes
Patient
Experiencek3.01 Number of complaints received this month Number of complaints received this month Ulysses
Patient
Experiencek3.02 Number of complaints reopened this month Number of complaints reopened this month Ulysses
Patient
Experiencek3.03
Number of complaints referred to ombudsman
this monthNumber of complaints referred to ombudsman this month Ulysses
Patient
Experiencek3.14
% complaints responded to within agreed
timeframe
Percentage of complaints that have received a response within the agreed
time frame, based on the month in which the response was due.Ulysses
Patient
Experiencek3.05 Friends and Family Score - Trust
Number of patients who would recommend the Trust to friends and family, as
a percentage of all respondents.FFT
Patient
Experiencek3.06
Friends and Family Score - Inpatient (excluding
daycases)
Number of patients who would recommend the Trust to friends and family, as
a percentage of all respondents.FFT
Patient
Experiencek3.07 Friends and Family Score - Paediatric Inpatient
Number of patients who would recommend the Trust to friends and family, as
a percentage of all respondents.FFT
Patient
Experiencek3.08 Friends and Family Score - Outpatient
Number of patients who would recommend the Trust to friends and family, as
a percentage of all respondents.FFT
Patient
Experiencek3.09 Friends and Family Score - A&E
Number of patients who would recommend the Trust to friends and family, as
a percentage of all respondents.FFT
Patient
Experiencek3.10 Friends and Family Score - Maternity
Number of patients who would recommend the Trust to friends and family, as
a percentage of all respondents.FFT
Patient
Experiencek3.11 Friends and Family Score - Daycases
Number of patients who would recommend the Trust to friends and family, as
a percentage of all respondents.FFT
Patient
Experiencek3.12 Friends and Family Score - Dementia Carers
Number of carers of patients with dementia who would recommend the Trust
to friends and family, as a percentage of all respondents.FFT
Patient
Experiencek3.13 Number of Mixed Sex accommodation breaches Number of Mixed Sex accommodation breaches CRS
Safer Staffing k4.01Safer Staffing - Day - Registered Midwives /
Nurses fill rate
Total hours worked by registered nurses and midwives as a percentage of the
planned hours - Day shiftHealthRoster
Safer Staffing k4.02 Safer Staffing - Day - Assistant Fill RateTotal hours worked by healthcare assistants as a percentage of the planned
hours - Day shiftHealthRoster
Page | 39

Report Glossary
DomainIndicator
referenceDescription Indicator Methodology Data source Notes
Safer Staffing k4.03Safer Staffing - Night - Registered Midwives /
Nurses fill rate
Total hours worked by registered nurses and midwives as a percentage of the
planned hours - Night shiftHealthRoster
Safer Staffing k4.04 Safer Staffing - Night - Assistant Fill RateTotal hours worked by healthcare assistants as a percentage of the planned
hours - Night shiftHealthRoster
Safer Staffing k4.05 Safer Staffing - Overall trust fill rate Total hours worked as a percentage of the planned hours - All shifts HealthRoster
Safer Staffing k4.06Safer Staffing - % of Registered Nurse and
Midwife expenditure on agency staff
Safer Staffing - % of Registered Nurse and Midwife expenditure on agency
staffHealthRoster
Safer Staffing k4.07 Safer Staffing - Care Hours per Patient DayTotal hours worked by staff proportionate to the number of occupied beds at
midnightHealthRoster/CRS
Maternity k5.01 Maternity - Caesarean section rate Percentage of caesarean sections relative to all births CRS/Maternity Forms
Maternity k5.02Maternity - % of women with a primary
postpartum haemorrhage of 1500ml or more
Maternity - % of women with a primary postpartum haemorrhage of 1500ml or
moreCRS/Maternity Forms
Maternity k5.03Maternity - % of women with a primary
postpartum haemorrhage of 2000ml or more
Maternity - % of women with a primary postpartum haemorrhage of 2000ml or
moreCRS/Maternity Forms
Maternity k5.04 Maternity - Significant Perineal Trauma Maternity - Significant Perineal Trauma CRS/Maternity Forms
Responsive k6.01Average length of stay (ALOS) - Emergency
Admissions
The mean length of stay for patients, calculated by dividing the total inpatient
days by the number of dischargesCRS
Responsive k6.02Referral to Treatment (RTT) within 18 weeks -
incomplete pathwaysRTT 18 weeks - incomplete pathway UNIFY2 / NHS England
Responsive k6.03RTT 18 weeks - incomplete pathway 52+ week
waitersRTT 18 weeks - incomplete pathway 52+ week waiters UNIFY2 / NHS England
Responsive k6.04 Diagnostic test waiting times Diagnostic test waiting times UNIFY2 / NHS England
Responsive k6.05 A&E 4 hour waiting time (type 1)Percentage of patients who received treatment and were admitted or
discharged within 4 hours of arrival - Main A&E OnlyUNIFY2 / NHS England
Responsive k6.06 A&E 4 hour waiting time (all types)Percentage of patients who received treatment and were admitted or
discharged within 4 hours of arrival - Both Main A&E and Royal Eye UnitUNIFY2 / NHS England
Page | 40

Report Glossary
DomainIndicator
referenceDescription Indicator Methodology Data source Notes
Responsive k6.07 A&E 12 hour trolley waits A&E 12 hour trolley waits UNIFY2 / NHS England
Responsive k6.08London Ambulance Service (LAS) Handovers - %
within 15 minutes
Percentage of Ambulance handovers completed within 15 minutes of Arrival
at A&ELAS portal
Responsive k6.09 LAS Ambulance Handovers - 30 min waits LAS Ambulance Handovers - 30 min waits LAS portal
Responsive k6.10 LAS Ambulance Handovers - 60 min waits LAS Ambulance Handovers - 60 min waits LAS portal
Responsive k6.11 Cancer - Two week waitPercentage of patients seen by a specialist within two weeks of an urgent GP
referral for suspected cancerInfoflex
Responsive k6.12Cancer - Two week referral to 1st outpatient -
breast symptoms
Percentage of patients seen by a specialist within two weeks of an urgent GP
referral for suspected breast cancerInfoflex
Responsive k6.13
Cancer - Patients receiving first definitive
treatment within one month (31 days) of a cancer
diagnosis
Percentage of patients who began first definitive treatment within 31 days of
receiving a cancer diagnosisInfoflex
Responsive k6.14Cancer - 31 day second or subsequent treatment -
drug
Percentage of patients who began treatment within 31 days of diagnosis,
where the required treatment was an anti-cancer drug regimenInfoflex
Responsive k6.15Cancer - 31 day second or subsequent treatment -
surgery
Percentage of patients who began treatment within 31 days of diagnosis,
where the required treatment was surgeryInfoflex
Responsive k6.16Cancer - Two month urgent referral to treatment
waitPercentage of patients treated within two months of an urgent GP referral Infoflex
Responsive k6.17Cancer - 62 day wait for first treatment following
referral from an NHS Cancer Screening Service
Percentage of patients treated within two months of an urgent referral from an
NHS Cancer Screening ServiceInfoflex
Responsive k6.1862-Day Wait for First Treatment Following
Referral from Consultant Upgrade
Percentage of patients treated within two months of a consultant's decision to
upgrade their priorityInfoflex
Responsive k6.19 Delayed transfers of care (number)Number of patients whose transfer is delayed at midnight on the last Thursday
of the month
Responsive k6.20 Delayed transfers of care (bed days) Number of General and Acute (G&A) occupied beddays
Responsive k6.21Delayed transfers of care (rate per occupied bed
days)Delayed transfers per 1,000 bed days
Page | 41

Report Glossary
DomainIndicator
referenceDescription Indicator Methodology Data source Notes
Responsive k6.22 Number of last minute cancelled operations Number of operations cancelled within 24 hours of the planned operation
Responsive k6.23Number of patients not treated within 28 days of
last minute cancellationNumber of patients not treated within 28 days of last minute cancellation
Enablers k7.01 Vacancy rate Vacancy rate Human Resources
Enablers k7.02 Turnover rate Turnover rate Human Resources
Enablers k7.03 Sickness rate Sickness rate Human Resources
Enablers k7.04 Mandatory Training Mandatory Training Human Resources
Enablers k7.05 Appraisals / PDRs completed Appraisals / PDRs completed Human Resources
Enablers k7.06 Flu Immunisation Percentage of staff who have received the flu vaccination Human Resources
Enablers k7.07 Staff FFT (Work) - ScorePercentage of staff who would recommend the Trust to friends and family as a
place to workNHS England
Enablers k7.08 Staff FFT (Care) - ScorePercentage of staff who would recommend the Trust to friends and family if
they needed care or treatmentNHS England
Enablers k7.09 Staff Survey - Response RatePercentage of staff who completed the survey, of those who were asked to
complete itHuman Resources Annual Survey
Page | 42