integrated pension journey planning: what does it really mean?
TRANSCRIPT

Integrated Pension Journey PlanningWhat does it really mean?
September 23, 2010
© 2010 Towers Watson. All rights reserved.

2towerswatson.com© 2010 Towers Watson. All rights reserved. Proprietary and Confidential. For Towers Watson and Towers Watson client use only.
Today’s Presenters
Matt Herrmann, Retirement Risk Management Group
Adam Levine, Towers Watson Investment Services
Jason Richards, Retirement Risk Management Group

3towerswatson.com© 2010 Towers Watson. All rights reserved. Proprietary and Confidential. For Towers Watson and Towers Watson client use only.
Today’s Discussion
Background on Journey Planning
The Role of Investment Strategy
The Role of Settlement Strategy
4towerswatson.com© 2010 Towers Watson. All rights reserved. Proprietary and Confidential. For Towers Watson and Towers Watson client use only.
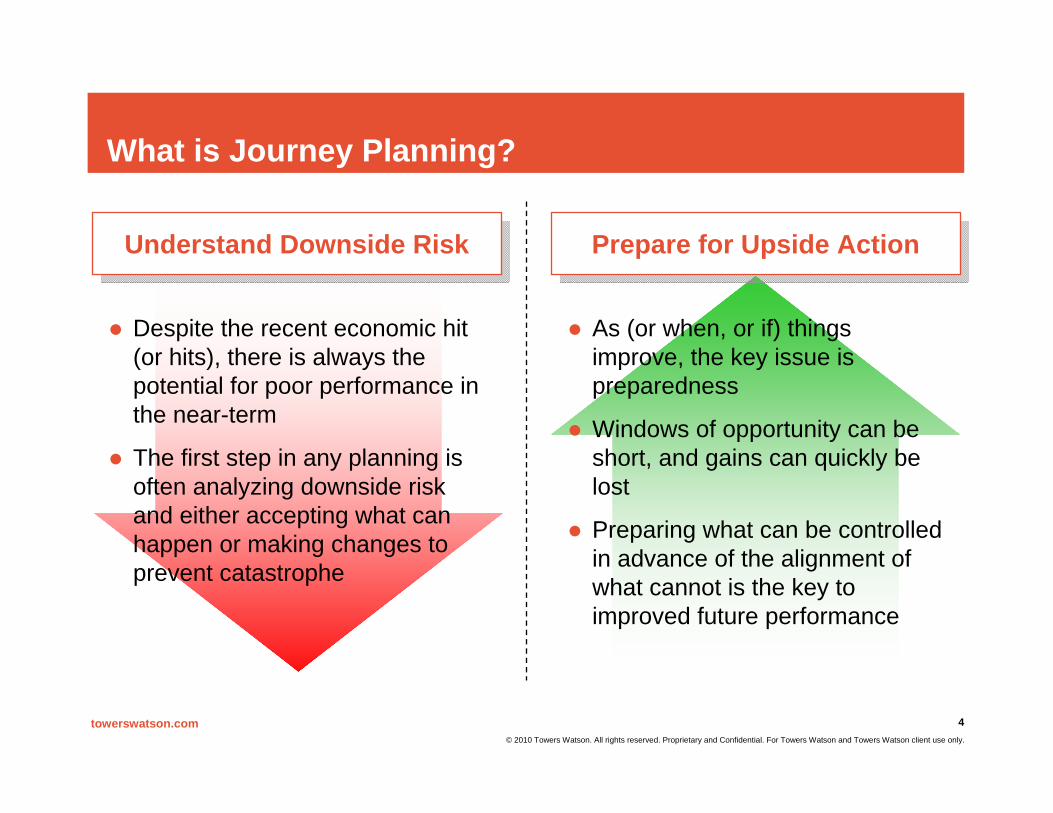
What is Journey Planning?
Understand Downside RiskUnderstand Downside Risk Prepare for Upside ActionPrepare for Upside Action
Despite the recent economic hit (or hits), there is always the potential for poor performance in the near-term
The first step in any planning is often analyzing downside risk and either accepting what can happen or making changes to prevent catastrophe
As (or when, or if) things improve, the key issue is preparedness
Windows of opportunity can be short, and gains can quickly be lost
Preparing what can be controlled in advance of the alignment of what cannot is the key to improved future performance
5towerswatson.com© 2010 Towers Watson. All rights reserved. Proprietary and Confidential. For Towers Watson and Towers Watson client use only.
5
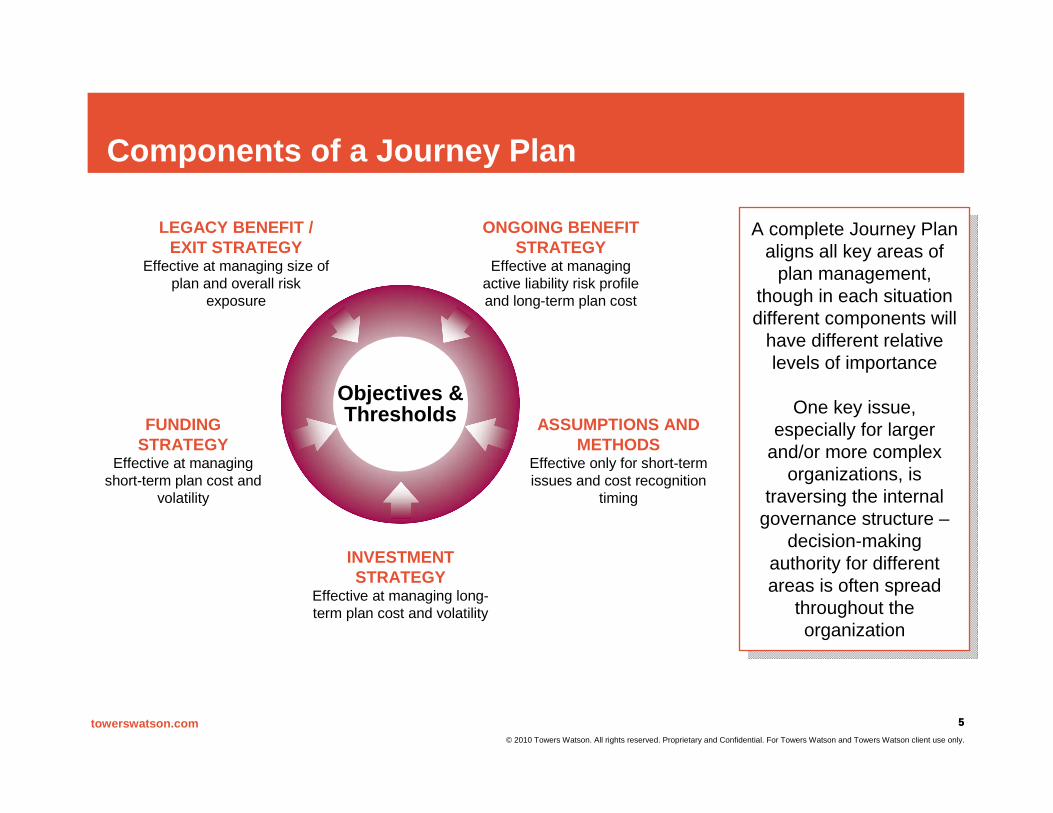
Components of a Journey Plan
Objectives & Thresholds
ONGOING BENEFIT STRATEGY
Effective at managing active liability risk profile and long-term plan cost
ASSUMPTIONS AND METHODS
Effective only for short-term issues and cost recognition
timing
INVESTMENT STRATEGY
Effective at managing long-term plan cost and volatility
FUNDINGSTRATEGY
Effective at managing short-term plan cost and
volatility
LEGACY BENEFIT / EXIT STRATEGY
Effective at managing size of plan and overall risk
exposure
A complete Journey Plan aligns all key areas of
plan management, though in each situation different components will
have different relative levels of importance
One key issue, especially for larger
and/or more complex organizations, is
traversing the internal governance structure –
decision-making authority for different areas is often spread
throughout the organization

6towerswatson.com© 2010 Towers Watson. All rights reserved. Proprietary and Confidential. For Towers Watson and Towers Watson client use only.
Past Opportunities
Towers Watson Pension Index
50
60
70
80
90
100
110
120
130
140
1999 2000 2001 2002 2003 2004 2005 2006 2007 2008 2009 2010
60.0 as of 8/31/10
2000 2001 2002 2003 2004 2005 2006 2007 2008 2009 2010
Strong funded status prior to 2002 would have allowed for numerous risk reduction options
Short recovery window in 2007 was available
Two week period during October 2008 showed annuity purchase rates near 8% in some instances
Decreasing rates leads to potential for lump sums in 2010 below projected year-end discount rates
Unwind dollar duration strategies after swap yields fall below Treasuries

7towerswatson.com© 2010 Towers Watson. All rights reserved. Proprietary and Confidential. For Towers Watson and Towers Watson client use only.
Marketplace Update
Termination/Immunization
Partialsettlement
Annuity products/LDI
Lump sums/ Dynamic allocations
5%6%14%47%EOY 20093%6%14%31%EOY 200830%53%80%95%EOY 2007
> 110%> 100%> 90%> 80 %Funded Status
Distribution of Funded Status of Large Plans by Year
Note: Average funded status dropped 10% + from EOY 2009 to June 30, 2010
8towerswatson.com© 2010 Towers Watson. All rights reserved. Proprietary and Confidential. For Towers Watson and Towers Watson client use only.
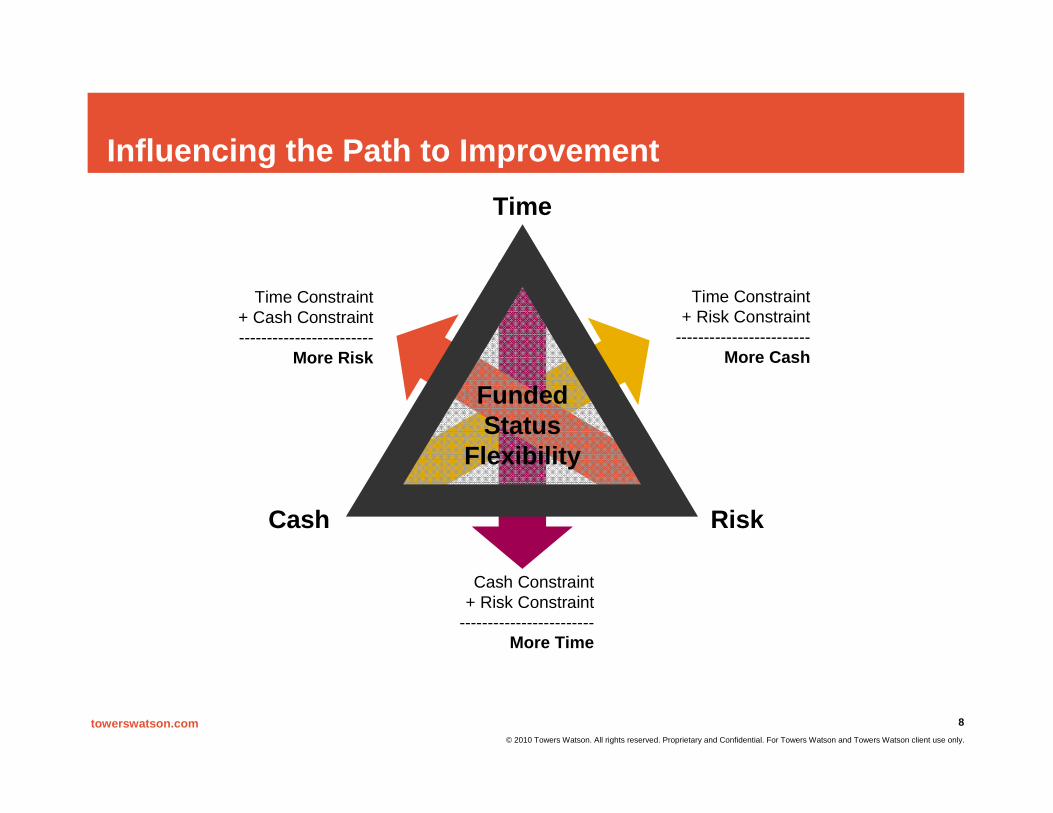
Influencing the Path to ImprovementTime
Cash Risk
Funded Status
Flexibility
Time Constraint+ Cash Constraint------------------------
More Risk
Time Constraint+ Risk Constraint
------------------------More Cash
Cash Constraint+ Risk Constraint
------------------------More Time

9towerswatson.com© 2010 Towers Watson. All rights reserved. Proprietary and Confidential. For Towers Watson and Towers Watson client use only.
Setting Objectives and Thresholds
Debt to Capitalization - Target Asset Allocation, Ongoing Plan
0% 10% 20% 30% 40% 50%
60% 70% 80% 90%
100%
2009 2010 2011 2012 2013 2014
5th-25th percentile 25th-50th 50th-75th 75th-95th Baseline Mean
Debt to Capitalization - Target Asset Allocation, Ongoing Plan
0% 10% 20% 30% 40% 50%
60% 70% 80% 90%
100%
2009 2010 2011 2012 2013 2014
5th-25th percentile 25th-50th 50th-75th 75th-95th Baseline Mean
Debt to Capitalization - Target Asset Allocation, Ongoing Plan
0% 10% 20% 30% 40% 50%
60% 70% 80% 90%
100%
2009 2010 2011 2012 2013 2014
5th-25th percentile 25th-50th 50th-75th 75th-95th Baseline Mean
Cat 4Cat 3
Cat 2Cat 1
$0
$100
$200
$300
$400
$500
2010 2011 2012 2013 2014 2015 2016 2017 2018
5th-25th percentile 25th-50th 50th-75th 75th-95th Mean
Debt to CapitalizationUnreimbursed Contributions – Utility Client
51%
31%
42%
38%
23%
0% 10% 20% 30% 40% 50% 60%
Probabi l i ty
Funded status exceeds 120%
Year over year change in contribution of more than 50%
Present value of cumulative contributions more than $100M
Funded status falls below 80% in any year after 2010
Contribution in any year more than $20M
Funded status exceeds 120%
Year over year change in contribution of more than 50%
Present value of cumulative contributions more than $100M
Funded status falls below 80% in any year after 2010
Contribution in any year more than $20M
Probability of Exceed Key Thresholds
Trapped SurplusThreshold
RestrictionThreshold
50%
75%
100%
125%
150%
175%
2008 2009 2010 2011 2012 2013 2014
Projection of Funded Status vs. Thresholds

10towerswatson.com© 2010 Towers Watson. All rights reserved. Proprietary and Confidential. For Towers Watson and Towers Watson client use only.
Combined: PV Total Cont + Deficit ($M) - 2019
$0
$500
$1,000
$1,500
$2,000
Target (No Shutdown) Settle at 110% Dynamic Allocation to Settlement
5th-25th percentile 25th-50th 50th-75th 75th-95th Mean
The Value of PreparednessImpactApproaches Being Considered
Settling obligations once 110% funded status is reached improvesboth expected cost and downside risk, essentially through significant reduction in asymmetric riskWhen coupled with the settlement strategy, the dynamic allocation does not have much of an impact on long-term costs (results are dependent on order analyzed)
Settling obligations once target funded status is reachedDynamically reducing equity exposure as plan funded status improves
11towerswatson.com© 2010 Towers Watson. All rights reserved. Proprietary and Confidential. For Towers Watson and Towers Watson client use only.
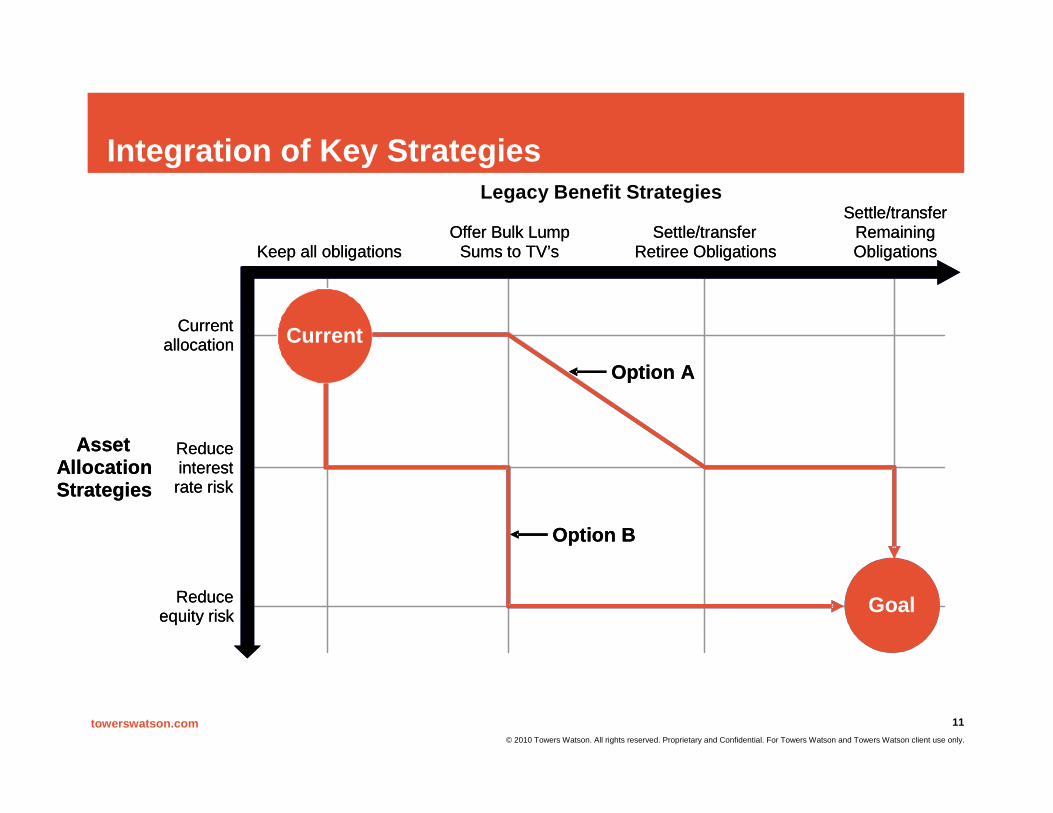
Integration of Key StrategiesLegacy Benefit Strategies
Asset Allocation Strategies
Current
Keep all obligationsOffer Bulk Lump
Sums to TV’sSettle/transfer
Retiree Obligations
Settle/transfer Remaining Obligations
Currentallocation
Reduce interest rate risk
Reduce equity risk Goal
Option A
Option B
Asset Allocation Strategies
Current
Keep all obligationsOffer Bulk Lump
Sums to TV’sSettle/transfer
Retiree Obligations
Settle/transfer Remaining Obligations
Currentallocation
Reduce interest rate risk
Reduce equity risk Goal
Option A
Option B

towerswatson.com© 2010 Towers Watson. All rights reserved. Proprietary and Confidential. For Towers Watson and Towers Watson client use only.
12
The Role of Investment Strategy

13towerswatson.com© 2010 Towers Watson. All rights reserved. Proprietary and Confidential. For Towers Watson and Towers Watson client use only.
1313
Dynamic StrategiesFu
nded
Rat
ioBond A
lloca
tion
One-Way Dynamic
Fund
ed R
atioBon
d Allo
catio
n
Two-Way Dynamic
Standard Approach
Funded Ratio
Bond Allocation

14towerswatson.com© 2010 Towers Watson. All rights reserved. Proprietary and Confidential. For Towers Watson and Towers Watson client use only.
1414
Dynamic Strategy Options
Question Examples of ConsiderationsOne-way or two-way? Frozen or ongoing
Potential for surplus usageWhat is the speed and magnitude of allocation shifts?
Duration of liabilitiesAccrual ratesStarting funded statusStarting asset allocation
What is the end point? Frozen or ongoingDiversification benefitsImmunization versus settlement

15towerswatson.com© 2010 Towers Watson. All rights reserved. Proprietary and Confidential. For Towers Watson and Towers Watson client use only.
1515
Dynamic Asset Allocations: Annual Funded RatioCombined: TL Funded Ratio
50%
75%
100%
125%
150%
175%
2010
40%F
I (LGC
)
Dyna
mic (
6%)
2011
40%F
I (LGC
)
Dyna
mic (
6%)
2012
40%F
I (LGC
)
Dyna
mic (
6%)
2013
40%F
I (LGC
)
Dyna
mic (
6%)
2014
40%F
I (LGC
)
Dyna
mic (
6%)
2015
40%F
I (LGC
)
Dyna
mic (
6%)
2016
40%F
I (LGC
)
Dyna
mic (
6%)
2017
40%F
I (LGC
)
Dyna
mic (
6%)
2018
40%F
I (LGC
)
Dyna
mic (
6%)
2019
40%F
I (LGC
)
Dyna
mic (
6%)
5th‐25th percentile 25th‐50th 50th‐75th 75th‐95th
The dynamic strategy has a significantly more noticeable impact on future funded ratios, specifically future deficits
In 2019, under the dynamic strategy the 5th percentile funded ratio is 95% versus 86% under the static 40% policy

16towerswatson.com© 2010 Towers Watson. All rights reserved. Proprietary and Confidential. For Towers Watson and Towers Watson client use only.
1616
1. Securing Funded Status
2. Capitalizing on Yield Curve Movements
100%
80%
60%
Static Policy Dynamic PolicyTime
Dynamic Asset Allocations: Sources of Improvement
Long G/C Return = -6.5%
Long G/C Return = 14.8%

17
Dynamic Asset Allocations: Possible Glidepaths
0102030405060708090
100
60 70 80 90 100 110 120
Ret
urn
See
king
Allo
catio
n
Funded Ratio
Static Asset Allocation
0102030405060708090
100
60 70 80 90 100 110 120
Ret
urn
See
king
Allo
catio
n
Funded Ratio
Linear Dynamic Allocation
0102030405060708090
100
60 70 80 90 100 110 120
Retu
rn S
eeki
ng A
lloca
tion
Funded Ratio
Non- Linear Dynamic Allocations
0102030405060708090
100
60 70 80 90 100 110 120
Retu
rn S
eeki
ng A
lloca
tion
Funded Ratio
Possible Combinations

18
18.518.3
1.0 78
0.0 -0.6-15.1
$(323.4)
$(220.5)
69%
78%
50%
60%
70%
80%
90%
100%
(400)
(350)
(300)
(250)
(200)
(150)
(100)
(50)
0
50
100
Beginning Deficit
12/31/09
Equity Returns FI Returns / Change in
Discount Rate
Alternatives Returns
Cash Contributions
Benefit Payments
Plan Expenses/
Census Update
Service Cost Interest Cost Ending Deficit 2/28/2010
Fund
ed R
atio
Sup
lus/
Def
icit
base
d on
PP
A Li
abili
ties (
in $
mill
ions
)
2010 Year to Date - Funded Status On a dollar basis, the funded ratio has increased from ($323) to ($220) during 2010On a percentage basis, the funded ratio has increased to 78% as a result of:
Asset gains of ~$24M;A decrease in the liabilities of ~$17M; andA contribution of $78M
With the March 31 funded ratio of 78%, the plan has reached the 2nd trigger of the Journey Plan
The new target allocation to fixed income is 35% of assetsTo reach the new target allocation to fixed income, approximately $43M will need to be reallocated from equities
If the additional $120M contribution had been made on March 31, the Plan would have reached the 5th Journey Plan trigger
Target fixed income allocation would increase to 57.5%An additional $181M would need to be re-allocated to fixed income
18
Implementation of Dynamic Strategies: Sample Funded Status Monitoring
towerswatson.com© 2010 Towers Watson. All rights reserved. Proprietary and Confidential. For Towers Watson and Towers Watson client use only.
19
The Role of Settlement Strategy
20towerswatson.com© 2010 Towers Watson. All rights reserved. Proprietary and Confidential. For Towers Watson and Towers Watson client use only.
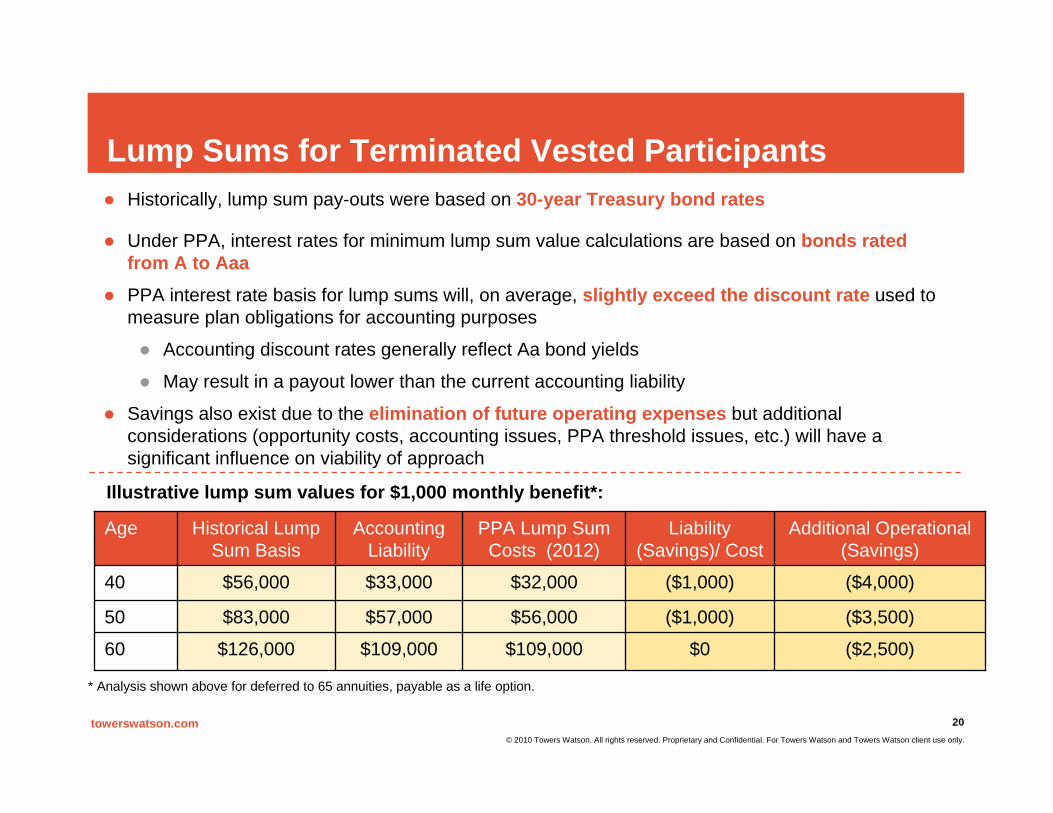
Lump Sums for Terminated Vested ParticipantsHistorically, lump sum pay-outs were based on 30-year Treasury bond rates
Under PPA, interest rates for minimum lump sum value calculations are based on bonds rated from A to AaaPPA interest rate basis for lump sums will, on average, slightly exceed the discount rate used to measure plan obligations for accounting purposes
Accounting discount rates generally reflect Aa bond yields
May result in a payout lower than the current accounting liability
Savings also exist due to the elimination of future operating expenses but additional considerations (opportunity costs, accounting issues, PPA threshold issues, etc.) will have a significant influence on viability of approach
$0
($1,000)
($1,000)
Liability (Savings)/ Cost
($2,500)
($3,500)
($4,000)
Additional Operational (Savings)
$126,000
$83,000
$56,000
Historical Lump Sum Basis
$109,000
$56,000
$32,000
PPA Lump Sum Costs (2012)
$109,00060
$57,00050
$33,00040
Accounting Liability
Age
Illustrative lump sum values for $1,000 monthly benefit*:
* Analysis shown above for deferred to 65 annuities, payable as a life option.
21towerswatson.com© 2010 Towers Watson. All rights reserved. Proprietary and Confidential. For Towers Watson and Towers Watson client use only.
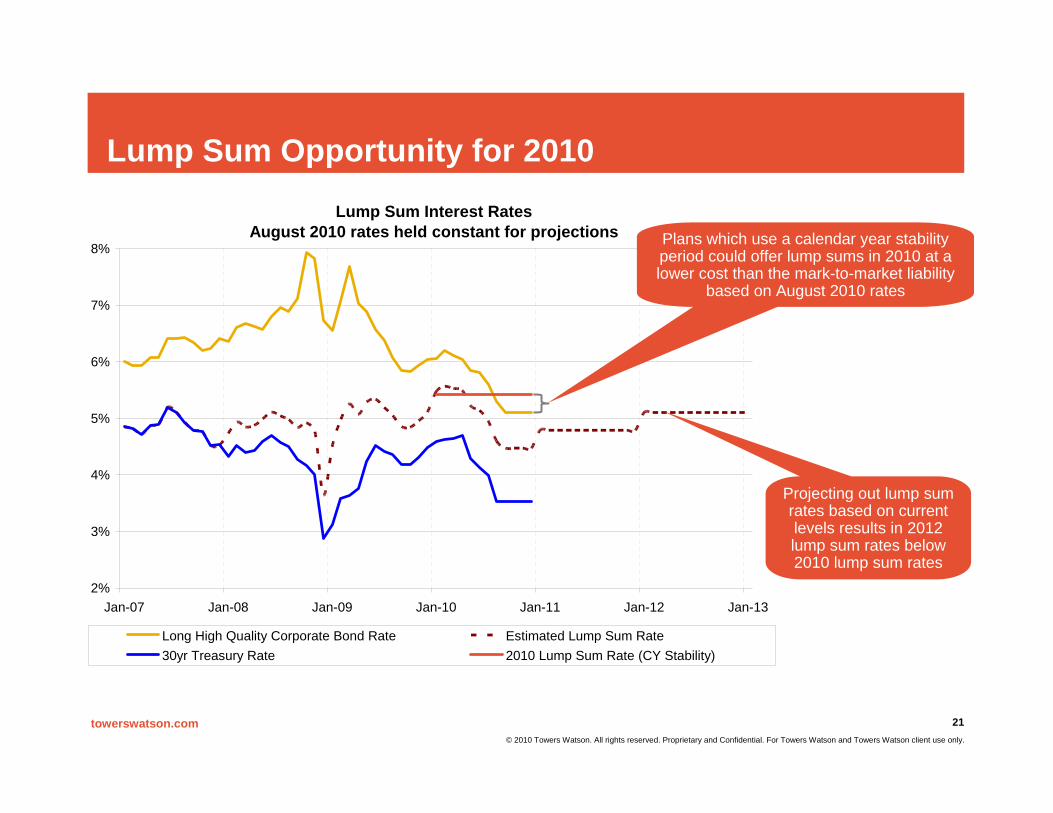
Lump Sum Interest RatesAugust 2010 rates held constant for projections
2%
3%
4%
5%
6%
7%
8%
Jan-07 Jan-08 Jan-09 Jan-10 Jan-11 Jan-12 Jan-13
Long High Quality Corporate Bond Rate Estimated Lump Sum Rate30yr Treasury Rate 2010 Lump Sum Rate (CY Stability)
Lump Sum Opportunity for 2010
Plans which use a calendar year stability period could offer lump sums in 2010 at a lower cost than the mark-to-market liability
based on August 2010 rates
Projecting out lump sum rates based on current levels results in 2012 lump sum rates below 2010 lump sum rates
22towerswatson.com© 2010 Towers Watson. All rights reserved. Proprietary and Confidential. For Towers Watson and Towers Watson client use only.
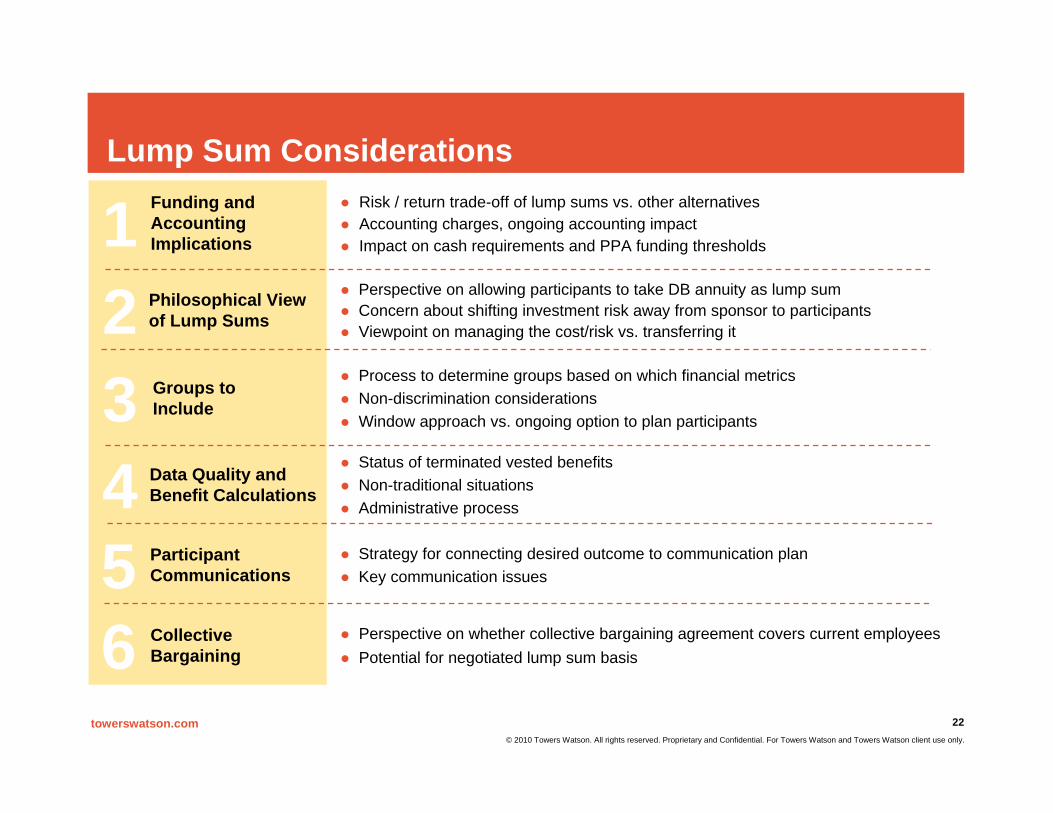
Lump Sum Considerations
1234
Funding and AccountingImplications
Philosophical View of Lump Sums
Data Quality andBenefit Calculations
Risk / return trade-off of lump sums vs. other alternativesAccounting charges, ongoing accounting impactImpact on cash requirements and PPA funding thresholds
Perspective on allowing participants to take DB annuity as lump sumConcern about shifting investment risk away from sponsor to participantsViewpoint on managing the cost/risk vs. transferring it
Status of terminated vested benefitsNon-traditional situationsAdministrative process
Groups to Include
Process to determine groups based on which financial metricsNon-discrimination considerationsWindow approach vs. ongoing option to plan participants
5 Participant Communications
Strategy for connecting desired outcome to communication planKey communication issues
6 CollectiveBargaining
Perspective on whether collective bargaining agreement covers current employeesPotential for negotiated lump sum basis
23towerswatson.com© 2010 Towers Watson. All rights reserved. Proprietary and Confidential. For Towers Watson and Towers Watson client use only.
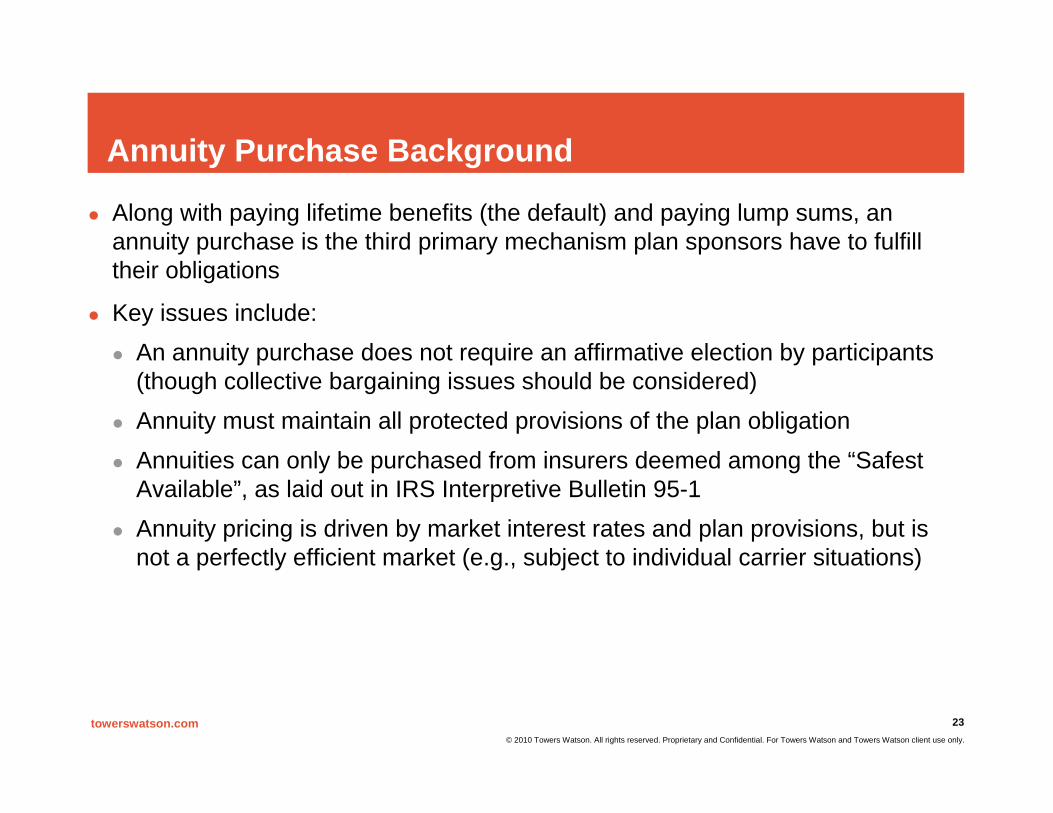
Annuity Purchase Background
Along with paying lifetime benefits (the default) and paying lump sums, an annuity purchase is the third primary mechanism plan sponsors have to fulfill their obligations
Key issues include:An annuity purchase does not require an affirmative election by participants (though collective bargaining issues should be considered)Annuity must maintain all protected provisions of the plan obligationAnnuities can only be purchased from insurers deemed among the “Safest Available”, as laid out in IRS Interpretive Bulletin 95-1Annuity pricing is driven by market interest rates and plan provisions, but is not a perfectly efficient market (e.g., subject to individual carrier situations)

24towerswatson.com© 2010 Towers Watson. All rights reserved. Proprietary and Confidential. For Towers Watson and Towers Watson client use only.
Annuity Purchase Marketplace Opportunities
2.0%2.5%3.0%3.5%4.0%4.5%5.0%5.5%6.0%6.5%7.0%7.5%8.0%8.5%9.0%
5/26
/200
86/
26/2
008
7/26
/200
88/
26/2
008
9/26
/200
810
/26/
2008
11/2
6/20
0812
/26/
2008
1/26
/200
92/
26/2
009
3/26
/200
94/
26/2
009
5/26
/200
96/
26/2
009
7/26
/200
98/
26/2
009
9/26
/200
910
/26/
2009
11/2
6/20
0912
/26/
2009
1/26
/201
02/
26/2
010
3/26
/201
04/
26/2
010
5/26
/201
06/
26/2
010
7/26
/201
0
Annuity Purchase Proxy Liability Rate Proxy 10Yr Treas 30Yr Treas Actual Transactions
Annuity purchase rates will vary with market interest rates, typically trending between corporate bond rates and Treasury rates
However, market inefficiencies and competitive pressures among insurers can create windows where annuity purchase rates reflect a much lower (or no) premium over liabilities

25towerswatson.com© 2010 Towers Watson. All rights reserved. Proprietary and Confidential. For Towers Watson and Towers Watson client use only.
Monitoring and Dynamic Triggers
Ongoing Accounting Implications
One-time Accounting Implications
Data Quality And Calculation Of Benefits
Regret Risk And Market Timing
Plan Value Transfer
Impact Of Operational Costs
Philosophical View Of Lump Sums
Basis For Lump Sum
YNParticipant Data Clean
TBD$5MEst. Buy-out Premium
YNLegal Due Diligence Complete
YNSafest Available Insurers Identified
TBD$22MEst. Accounting Settlement Charge
> 100 bps119 bpsSpread over 10-year Treasury Bond
Acceptable Funding Implications
Benefit Restrictions Apply
Est. Annuity Rates for Retirees
Key Statistic
YTBD
NTBD
> 6.00%4.50%
Trigger ReadinessDesired TriggerCurrent Measure
YNCommunications developed
YNParticipants located / Data clean
> 6.00%5.75%Est. Discount Rate
> $0M-$1.3MEst. Lump Sum Gain / Loss
TBD$9MEst. Accounting Settlement Charge
= 0 bps-25 bpsSpread over Discount Rate
Acceptable Funding Implications
Benefit Restrictions Apply
Est. Lump Sum Rates
Key Statistic
YTBD
NTBD
> 6.00%5.50%
Trigger ReadinessDesired TriggerCurrent Measure
Sample Annuity Purchase Dynamic Triggers
Sample Bulk Lump Sum Dynamic TriggersPotential Considerations – Bulk Lump Sums
Potential Considerations – Annuity Purchase
Market Capacity and Financial Services Industry
Plan Value Transfer
Compliance With 95-1
Data Quality and Administration
Ongoing Accounting Implications
One-time Accounting Implications
Components of Annuity Purchase Pricing
26towerswatson.com© 2010 Towers Watson. All rights reserved. Proprietary and Confidential. For Towers Watson and Towers Watson client use only.
Key Takeaways
Especially in the near-term, understanding downside risk may be as important as planning for upside risk reduction
Preparedness and adaptability are key
Non-financial issues need attention throughout the process
An integrated Journey Plan can add value if well aligned with corporate objectives
27towerswatson.com© 2010 Towers Watson. All rights reserved. Proprietary and Confidential. For Towers Watson and Towers Watson client use only.
27
Contact Details
Matt Herrmann120 South Central Avenue, Suite 1400, St. Louis, MO 63105-1705314-290-1422
[email protected] Levine
335 Madison Avenue, New York, NY [email protected]
Jason Richards120 South Central Avenue, Suite 1400, St. Louis, MO 63105-1705314-290-1415 [email protected]

28towerswatson.com© 2010 Towers Watson. All rights reserved. Proprietary and Confidential. For Towers Watson and Towers Watson client use only.
Disclaimer
The information included in this presentation is general information only and should not be relied upon without further review by the appropriate professional advisors. Towers Watson is not a law firm or accounting firm, and we are not providing legal, accounting or tax services or advice. Some of the information included in this presentation might involve the application of law; accordingly, we strongly recommend that audience members consult with and involve their legal counsel and other professional advisors as appropriate to ensure that they are fully advised concerning such matters. Additionally, material developments may occur subsequent to this presentation rendering it incomplete and inaccurate. Towers Watson assumes no obligation to advise you of any such developments or to update the presentation to reflect such developments.