integrated evaluation of marine food items: … · project cp/56 - “integrated evaluation of...
TRANSCRIPT

S P S D I I I N T E G R A T E D E V A L U A T I O N O F M A R I N E F O O D I T E M S : N U T R I T I O N A L V A L U E , S A F E T Y A N D C O N S U M E R P E R C E P T I O NJ. WILLEMS, J. VAN CAMP, W. VERBEKE, K. COOREMAN
PART 1
SUSTAINABLE PRODUCTION AND CONSUMPTION PATTERNS
GENERAL ISSUES
AGRO-FOOD
ENERGY
TRANSPORT
S C I E N T I F I C S U P P O R T P L A N F O R A S U S T A I N A B L E D E V E L O P M E N T P O L I C Y

Part 1: Sustainable production and consumption patterns
Prof. Dr. Stefaan De Henauw, Prof. Dr. Jan Willems, ir. Isabelle Sioen Department of Public Health. Ghent University.
Prof. Dr. ir. John Van Camp, ir. Isabelle Sioen
Department of Food Safety and Food Quality. Ghent University.
Prof. Dr. ir. Wim Verbeke, ir. Isabelle De Lange, ir. Filiep Vanhonacker Department of Agricultural Economics. Ghent University.
Dr. ir. Kris Cooreman, Dr. ir. Marc Raemaekers, Dr. ir. Koen Parmentier
Animal Sciences Unit, Sea Fisheries. Institute for Agricultural and Fisheries Research. Ghent.
Prof. Dr. ir. Peter Vanrolleghem, Dr. ir. Frederik Verdonck, lic. Nicky Van Thuyne
Department of Applied Mathematics, Biometrics and Process Control. Ghent University
July 2006
FINAL REPORT
INTEGRATED EVALUATION OF MARINE FOOD ITEMS:
NUTRITIONAL VALUE, SAFETY AND CONSUMER PERCEPTION
CP/56
SCIENTIFIC SUPPORT PLAN FOR A SUSTAINABLE DEVELOPMENT POLICY (SPSD II)

D/2006/1191/27 Published in 2006 by the Belgian Science Policy Rue de la Science 8 Wetenschapsstraat 8 B-1000 Brussels Belgium Tel: +32 (0)2 238 34 11 – Fax: +32 (0)2 230 59 12 http://www.belspo.be Contact person: Mrs Christine Mathieu Secretariat: +32 (0)2 238 37 61 Neither the Belgian Science Policy nor any person acting on behalf of the Belgian Science Policy is responsible for the use which might be made of the following information. The authors are responsible for the content.
No part of this publication may be reproduced, stored in a retrieval system, or transmitted in any form or by any means, electronic, mechanical, photocopying, recording, or otherwise, without indicating the reference.

Project CP/56 - “Integrated evaluation of marine food items: nutritional value, safety, and consumer perception”
SPSD II - Part I - Sustainable production and consumption patterns - Agro-Food 3
Users Committee AFSCA-FAVV G. De Poorter WTC III S. Bolivarlaan 30 1000 Brussel FEVIA J. Hellaert Kunstlaan 43 1040 Brussel FOD Volksgezondheid, DG Dier, Plant en Voeding C. Vinckx Victor Hortaplein 40 bus 10 1060 Brussel asbl NUBEL vzw C. Seeuws RAC – Arcade 4.024 Oratoriumberg 1010 Brussel OIVO-CRIOC I. Vanhaevre Boulevard Paepsem 20 1070 Brussel Programmatorische Federale Overheidsdienst Duurzame Ontwikkeling J. Schoofs Koning Albert II-laan 9 1210 Brussel Vlaams Instituut Gezondheidspromotie E. Vanhauwaert G. Schilderknechtstraat 9 1020 Brussel VLAM - NICE H. De Geeter I. Coene Leuvenseplein 4 1000 Brussel

Project CP/56 - “Integrated evaluation of marine food items: nutritional value, safety, and consumer perception”
SPSD II - Part I - Sustainable production and consumption patterns - Agro-Food 4
Table of contents INTRODUCTION .................................................................................................................... 7 OBJECTIVES........................................................................................................................... 8
Objectives....................................................................................................................... 8 Expected outcomes......................................................................................................... 8 Structure of the report .................................................................................................... 8
GLOSSARY AND ABBREVIATIONS.................................................................................. 9 PART I. DATA BASES CONCERNING ORIGIN, NUTRIENTS, AND CONTAMINANTS IN SEAFOOD, AND SEAFOOD CONSUMPTION ........................ 11
1. TRACEABILITY AND NUTRIENT & CONTAMINANT CONTENT OF SEAFOOD ON THE BELGIAN MARKET .................................................................................................... 11
1.1 Introduction ................................................................................................................ 11 1.2 Species relevant for the Belgian market (parallel with food consumption data base)11 1.3 Traceability of seafood on the Belgian market .......................................................... 12
1.3.1 Introduction ......................................................................................................... 12 1.3.2 Methodology used ............................................................................................... 12 1.3.3 Results traceability study .................................................................................... 14
1.4 Data base of nutrient and contaminant concentrations in seafood ............................. 15 1.4.1 Methodology used ............................................................................................... 15 1.4.2 Results: Nutrient concentrations and distributions for the different species ...... 16 1.4.3 Results: Contaminant concentrations and distributions for the different species ................................................................................................................. 19
1.5. Discussion and conclusion ........................................................................................ 25 1.6. References ................................................................................................................. 25
2. SEAFOOD CONSUMPTION ........................................................................................... 27
2.1 Introduction ................................................................................................................ 27 2.2 Seafood consumption data of Flemish adolescents.................................................... 27
2.2.1 Methodology: preparing the data base to be introduced in ProbIntakeUG ......... 27 2.2.2 Results ................................................................................................................. 28
2.3 Seafood consumption data of Belgian adults ............................................................. 29 2.3.1 Methodology: preparing the data base to be introduced in ProbIntakeUG ......... 29 2.3.2 Results ................................................................................................................. 30
2.4 Discussion and conclusion ......................................................................................... 30 2.5 References .................................................................................................................. 32
PART II. PROBABILISTIC INTAKE ASSESSMENT OF NUTRIENTS AND CONTAMINANTS VIA FISH, AND BENEFIT-RISK ASSESSMENT .......................... 33
1. INTAKE ASSESSMENT.................................................................................................... 33
1.1. Introduction ............................................................................................................... 33 1.2. Methodology: a probabilistic intake procedure......................................................... 33
1.2.1. General principles and steps.............................................................................. 33 1.2.2. Software program............................................................................................... 39
1.3. Results ....................................................................................................................... 39 1.3.1. Intake assessment for the Flemish adolescent via seafood consumption........... 39 1.3.2. Intake assessment for the Belgian adults via seafood consumption................... 48

Project CP/56 - “Integrated evaluation of marine food items: nutritional value, safety, and consumer perception”
SPSD II - Part I - Sustainable production and consumption patterns - Agro-Food 5
1.4. Discussion and conclusion ........................................................................................ 55 1.5. References ................................................................................................................. 55
2. BENEFIT - RISK ASSESSMENT...................................................................................... 57
2.1. Benefit ....................................................................................................................... 57 2.1.1. Recommended intakes ........................................................................................ 57 2.1.2. Estimated intake via seafood, enough or too low?............................................. 58 2.1.3. Other sources ..................................................................................................... 58
2.2. Risk............................................................................................................................ 59 2.2.1. Tolerated intakes ................................................................................................ 59 2.2.2. Estimated intake via seafood, acceptable or too high?...................................... 60 2.2.3. Other sources ..................................................................................................... 62
2.3. Combined evaluation of benefit and risk, and scenario analysis .............................. 63 2.3.1 Inclusion or exclusion of contamination data and variations in seafood consumption ........................................................................................................ 63 2.3.2 Scenario analyses based on the recommendations of the Belgian Health Council................................................................................ 65
2.4. Discussion and conclusion ........................................................................................ 68 2.5. References ................................................................................................................. 68
PART III. RISK – BENEFIT AND CONSUMER BEHAVIOUR .................................... 71
1. CONSUMER PERCEPTION VERSUS SCIENTIFIC KNOWLEDGE ............................. 71 1.1 Introduction ................................................................................................................ 71 1.2 Research method ........................................................................................................ 71
1.2.1 Study design and subjects.................................................................................... 71 1.2.2 Questionnaire ...................................................................................................... 72 1.2.3 Statistical analyses .............................................................................................. 72
1.3 Empirical findings ...................................................................................................... 73 1.3.1 Attitude towards eating fish................................................................................. 73 1.3.2 General beliefs about fish ................................................................................... 73 1.3.3 Health benefit beliefs from regular fish consumption ......................................... 73 General beliefs about fish ............................................................................................ 74 1.3.4 Fish nutrient content beliefs ................................................................................ 74 1.3.5 Fish contaminant content beliefs......................................................................... 75 1.3.6 Perceived effect of nutrients ................................................................................ 75 1.3.7 Perceived effect of contaminants......................................................................... 75
1.4 Discussion .................................................................................................................. 75 1.5 Conclusions ................................................................................................................ 76
2. RISK – BENEFIT COMMUNICATION ........................................................................... 78
2.1 Introduction ................................................................................................................ 78 2.2 Research method ........................................................................................................ 79
2.2.1 Experimental design ............................................................................................ 79 2.2.2 Questionnaire ...................................................................................................... 79 2.2.3 Data collection and subjects ............................................................................... 80
2.3 Empirical findings ...................................................................................................... 81 2.3.1 Behaviour and attitude towards fish ................................................................... 81 2.3.2 Use and trust in information sources .................................................................. 81 2.3.3 Communication impact ....................................................................................... 82
2.4 Conclusions ................................................................................................................ 85

Project CP/56 - “Integrated evaluation of marine food items: nutritional value, safety, and consumer perception”
SPSD II - Part I - Sustainable production and consumption patterns - Agro-Food 6
3. CONSUMER PERCEPTION ABOUT ETHICAL AND SUSTAINABILITY ISSUES OF FISH ..................................................................................................................................... 86
3.1 Introduction ................................................................................................................ 86 3.2 Research method ........................................................................................................ 87
3.2.1 Study design and subjects.................................................................................... 87 3.2.2 Questionnaire ...................................................................................................... 87
3.3 Empirical findings ...................................................................................................... 87 3.3.1 Description of the mean values ........................................................................... 87 3.3.2 Identification of consumers who refuse farmed or wild fish ............................... 88 3.3.3 Identification of respondents with low and high interest in fish origin (farmed/wild) ................................................................................................................ 89
3.4 Conclusions .................................................................................................................... 90 REFERENCES PART III................................................................................................... 91
PART IV. CONCLUSIONS AND RECOMMENDATIONS............................................. 97
4.1. Drawbacks and shortcomings of the study................................................................ 97 4.2. Overall conclusions ................................................................................................... 98 4.3. Specific recommendations ........................................................................................ 98
4.3.2. Relevant information in the context of food and nutrition monitoring .............. 99 4.3.3. Recommendations about farmed versus wild fish ............................................ 100 4.3.4. Relevant information about consumer perception and behaviour ................... 100
4.4. References ............................................................................................................... 101 PART V. SCIENTIFIC PUBLICATIONS ........................................................................ 103

Project CP/56 - “Integrated evaluation of marine food items: nutritional value, safety, and consumer perception”
SPSD II - Part I - Sustainable production and consumption patterns - Agro-Food 7
INTRODUCTION Over the past decades, nutritional epidemiological research has identified a number of food groups, that are recommended on the basis of their potential preventive effect on chronic degenerative diseases. One of the food groups with a high ranking in this context is seafood. The terms seafood, marine foods or fish, used in this report, describe collectively fish and other aquatic animals such as crustaceans and molluscs. Seafood represents a unique dietary source of long chain omega-3 poly-unsaturated fatty acids (LC n-3 PUFA). Moreover, seafood products also contain a number of other valuable nutrients (e.g. high quality amino acids and micronutrients like vitamin D, iron, iodine, selenium and zinc). On the basis of this, it is generally accepted today that seafood is an important element in a healthy and balanced omnivorous human diet. There is also considerable consensus that the intake of n-3 PUFA should be increased in the Western diet. The favourable health perception of marine foods is however troubled by less favourable information regarding the potential adverse health impact of chemical contamination of marine foods. Persistent organochlorine compounds, e.g. PCBs, dioxin-like substances, organochlorine pesticides (DDT/DDE) and heavy metals, e.g. mercury and lead, accumulate in the marine food chain. This overall dichotomous picture of marine foods and their health effects forms the basis of a potential model of conflict between dietary recommendations, toxicological safety assurance and risk-benefit communication. Obviously, a substantial increase in seafood consumption in order to achieve the recommended daily intakes for LC n-3 PUFA would at the same time increase the total intake and internal dose of persistent organic chemicals and heavy metals. In an attempt to understand in more detail the significance of such a combined exposure – taking into account the current state-of-the-art in both the nutritional and the toxicological dimension of the problem – a quantitative intake assessment of selected nutrients (two LC n-3 PUFA (EPA and DHA), vitamin D, and iodine) and contaminants ((methyl) mercury, PCBs, and dioxins) via seafood for the Belgian population is executed in this project. Another axe of the project investigated consumer perception of fish and fish related items as well as benefit-risk communication and sustainability issues. COLLABORATING CENTRES 1. Department of Public Health. Ghent University. 2. Department of Food Safety and Food Quality. Ghent University. 3. Department of Agricultural Economics. Ghent University. 4. Animal Sciences Unit, Sea Fisheries. Institute for Agricultural and Fisheries Research.
Ghent. 5. Department of Applied Mathematics, Biometrics and Process Control. Ghent University

Project CP/56 - “Integrated evaluation of marine food items: nutritional value, safety, and consumer perception”
SPSD II - Part I - Sustainable production and consumption patterns - Agro-Food 8
OBJECTIVES
Objectives In an attempt to understand in more detail the significance of the combined intake of nutrients and contaminants, a quantitative intake assessment of LC n-3 PUFA, vitamin D, and iodine, and of (methyl) mercury, PCBs, and dioxins by two subgroups of the Belgian population, via seafood, is executed in this project. The first part of this exercise starts with the construction of data bases containing detailed fish consumption patterns in selected populations, and all available data on nutrient and contaminant concentrations in the different fish species concerned. In a following step, a probabilistic intake model has been developed to calculate the distribution of intakes in the population groups of the nutrients and contaminants of interest. Finally, these intakes have to be compared with recommended intakes of nutrients and the tolerated daily intakes of contaminants. In the second part of the research project, research was undertaken from the social sciences perspective, e.g., an analysis of consumer perception and reactions with regard to the risk-benefit issues of seafood consumption. Consumer perception has been set against scientific facts, which allows identifying the reality-perception gap with respect to seafood risks and benefits. Finally, the potential impact of risk-benefit communication, and consumer perception of sustainability issues, have been assessed through an experimental consumer survey.
Expected outcomes The probabilistic assessment will, on one hand, identify the nutrient and contaminant intake by particular subgroups of the population – for which sufficient food consumption data are available – and will, on the other hand, make predictions possible concerning recommendations to change fish consumption patterns for the population in general.
Structure of the report PART I describes the construction of the data bases. Part II briefly describes the development of the probabilistic intake model, gives the results of the intake calculations and continues with the benefit-risk assessment. PART III concerns the consumer perception results and pays attention to sustainability issues. PART IV attempts to formulate recommendations concerning fish consumption on the basis of the results obtained and makes suggestions for further follow-up of this benefit-risk evaluation. Scientific papers that have already been published in the course of this project are given in PART V.

Project CP/56 - “Integrated evaluation of marine food items: nutritional value, safety, and consumer perception”
SPSD II - Part I - Sustainable production and consumption patterns - Agro-Food 9
GLOSSARY Consumers-only: those individuals of the consumers database who did consume the food
items taken into consideration Dioxins: sum of PCDDs (polychlorinated dibenzo-p-dioxins) and PCDFs
(polychlorinated dibenzofurans), 17 congeners Total TEQ: total sum of dioxin-like compounds (12 dlPCB congeners and 17 dioxin
congeners) ABBREVIATIONS bw: body weight CEC: Central Economic Council CHD: coronary heart disease Cons.: only seafood consumers COT: Committee on Toxicity of Chemicals in Food, Consumer Products and
the Environment (United Kingdom) dlPCBs: dioxin-like PCBs (congeners 77, 81, 126, 169, 105, 114, 118, 123, 156, 157, 167, 189) EPA: eicosapentaenoic acid EFSA: European Food Standard Agency DHA: docosahexaenoic acid FAO: Food and Agricultural Organisation FG: fat group Hg: mercury ICES: International Council for the Exploration of the Sea iPCBs: indicator PCBs (congeners 28, 52, 101, 118, 138, 153, 180) JECFA: Joint Expert Committee on Food Additives and Contaminants MeHg: methyl mercury (LC) n-3 PUFAs: (long chain) omega-3 polyunsaturated fatty acids NA: not available ndl-PCBs: non-dioxin like PCBs PCBs: polychlorinated biphenyls PCDDs: polychlorinated dibenzo-p-dioxins PCDFs: polychlorinated dibenzofurans POPs: persistent organic pollutants RDA: recommended daily amount RfD: reference dose S.D.: standard deviation, Sp-code: Species-code SpC-code: Species-Country-code TDI : tolerable daily intake TEQ: toxic equivalents totTEQ: total TEQ TWI : tolerable weekly intake US EPA: United States Environmental Protection Agency WHO: World Health Organisation


Project CP/56 - “Integrated evaluation of marine food items: nutritional value, safety, and consumer perception”
SPSD II - Part I - Sustainable production and consumption patterns - Agro-Food 11
PART I. DATA BASES CONCERNING ORIGIN, NUTRIENTS, AND CONTAMINANTS IN SEAFOOD, AND SEAFOOD CONSUMPTION
1. TRACEABILITY AND NUTRIENT & CONTAMINANT CONTENT OF SEAFOOD ON THE BELGIAN MARKET 1.1 Introduction The intake assessment executed in this project is based on combining fish consumption data with nutrient and contaminant concentrations – if possible taking into account the origin of the fish – by using a probabilistic approach (see Part II for more detailed information). Such a probabilistic approach is essentially an attempt to translate, as good as possible, the complexity of real situations into interpretable results, thereby considering the existing variability of the different parameters (consumption data, body weight data and concentration data). In contrast with a deterministic approach, where point estimates (mean or 97.5th percentile values) are applied, taking into account the variability of a parameter is more relevant in the case of contaminant and nutrient concentrations in fish as well as for consumption patterns. In this project, the variability of the fish consumption by the population is taken into account in a non-parametric way (i.e. all the individual data are used as such, no distribution is fitted to the data), whereas the variability of the nutrient and contaminant concentrations is taken into account in a parametric way (i.e. by representing them by parametric probability distributions). Nutrient and contaminant data can be collected either by performing laboratory analyses in representative samples or by using published literature data (articles, reports, food composition tables, etc.). In this project, the second approach – retrieving literature data - was applied. Different data bases were constructed: one on the nutrient concentrations of seafood species mentioned in the food consumption surveys and another on the contaminant concentrations. Moreover, special attention was given to the origin of the seafood consumed in Belgium. Therefore, an attempt was done to establish a data base describing the origin of the seafood products on the Belgian market. 1.2 Species relevant for the Belgian market (parallel with food consumption data base) On the basis of the food consumption studies used in this project (see 2.3), 41 seafood species and two fish products (caviar and surimi) were considered (Table I.1). Five fat groups (FG) were determined in order to group the species according to their fat concentration (the percentages given are expressed on fresh weight basis): 1) FG1: <1.0% fat; 2) FG2: 1.0% ≥ fat < 2.5%; 3) FG3: 2.5% ≥ fat < 5.0%; 4) FG4: 5.0% ≥ fat < 10%; 5) FG5: fat ≥ 10%. In Annex 1, a table is given with the English, Dutch, French and scientific names of the 41 seafood species.

Project CP/56 - “Integrated evaluation of marine food items: nutritional value, safety, and consumer perception”
SPSD II - Part I - Sustainable production and consumption patterns - Agro-Food 12
Table I. 1 The 41 fish species and 2 fish products taken into account because of their relevance for consumption by the subgroup of the populations studied Fat Group 1 Fat Group 2 Fat Group 3 Fat Group 4 Fat Group 5
Anglerfish Common shrimp Sole Anchovy Milkfish Eel Brill Common whelk Squid Caviar Sardine European catfish Cod European plaice Tilapia Conger Trout Herring Crab John dory Turbot Halibut Mackerel Haddock Lobster Sea bream Salmon Ling Mussel Swordfish Sprat Saithe &Pollack Nile perch Tuna Skate Norway lobster Wolf fish St-James shell Oyster Surimi Redfish Whiting Scampi 1.3 Traceability of seafood on the Belgian market 1.3.1 Introduction One of the aims of the project was to take into consideration the origin of the seafood available on the Belgian market, as the contaminant concentrations in each seafood species is known to strongly depend (1) on the region where seafood species was living before its catch or during its production and (2) on its metabolism and the environmental conditions (feed pattern, …) (Judd et al., 2003). For example, partially due to volcanic activity, mercury concentrations in species from the Mediterranean Sea are about two or three times higher than in the same species dwelling in the Atlantic Ocean (Storelli et al., 1999). Furthermore, since PCBs and dioxins originate from human and industrial activities, fishing grounds in the vicinity of industrially developed regions will be more contaminated than others (Karl et al., 2002). It became, however, rapidly clear that many impediments exist which make the detailed execution of this part of the project quite difficult and the results of less relevance for the aim of the study: (1) the information needed comes from different, non related data bases, (2) countries of import do not necessarily define fishing grounds or product sites, (3) fish caught at a certain fishing ground may have transited many others during his life, and (4) contaminant concentration data identify fishing grounds only in a few cases. It remains, however, of interest to briefly summarize the attempts made and the preliminary results obtained. 1.3.2 Methodology used Four different data sources were combined. Two national data bases: (1) An economical data base from the Central Economic Council (CEC) depending on the Ministry of Economic Affairs of Belgium (received in November, 2004); (2) Data on landings in Belgian harbours, provided by the Sea Fisheries Department, Agricultural Research Centre (received in November, 2004). Two international data bases: (3) The landings/production data bases of seafood from the Food and Agricultural Organisation (FAO) (together with the software FishStat Plus Version 2.3) (www.fao.org; consulted in January 2005); (4) Catch data from the International Council for the Exploration of the Sea (ICES) (www.ices.dk; consulted in January 2005).

Project CP/56 - “Integrated evaluation of marine food items: nutritional value, safety, and consumer perception”
SPSD II - Part I - Sustainable production and consumption patterns - Agro-Food 13
Step 1: Defining the countries of origin The CEC-data base contains Belgian import and export data of all seafood products (fresh, frozen, canned …). For import, only the import data from other countries into Belgium were taken into account, no landing data (i.e. no catching data of the Belgian fleet). A large amount of this import is, however, again exported. Lacking more detailed information, the assumption had to be made that exporting seafood products from Belgium to other countries (whether it were own landings or imports) did not change the country’s proportional import contribution. Only the data of the year 2000 were used, describing quantitatively the different countries of import for each seafood product on the Belgian market in 2000. For each seafood product the ratio coming from each country of interest was calculated in terms of percentages. Step 2: Defining the fishing grounds of origin The FAO defines worldwide 24 different fishing grounds. Six codes describe a zone of inland waters and 18 describe a sea or a part of an ocean (see Annex 2 for a map and a table). Furthermore, it was of interest to subdivide four fishing grounds: the North-eastern Atlantic Ocean, the Eastern Central Atlantic Ocean, the South-eastern Atlantic Ocean, and the Mediterranean & Black Sea, since a large part of the seafood on the Belgian market comes from those fishing grounds. The relative amounts per country were converted to relative amounts per fishing ground. Therefore, a second assumption had to be made, considering that the country of import is equal to the country of origin (thus assuming that there was no transit). The FAO FishStat Plus software and data bases were used, as well as the ICES catch data. The FAO provides datasets about the annual catching and production data of all different seafood species by all countries. ICES collects annual landings data officially submitted by 19 ICES Member States in the Northeast Atlantic Sea including over 200 species. These data were sorted per species (based on the scientific name) and per country and for each of these species-country combinations the amounts caught or produced per fishing ground were given in tons. In summary, two data bases were constructed (CEC2000 and FAO2000). CEC2000 describes the amount imported from all relevant countries (species-country combination), for each seafood product on the Belgian market (defined by a product name). FAO2000 describes the amount caught or produced in each relevant fishing ground (species-country-fishing ground combination), for each seafood species and all countries all over the world. These two data bases were then linked to each other at the level of species and country by creating 101 Sp-codes (Species-codes) and 1022 unique SpC-codes (Species-Country-codes). As such, the species-country combinations in both files could be described by that code. Subsequently, the distribution per SpC-code out of CEC2000 over the different fishing grounds was calculated case by case by multiplying the amount imported in ton by the relative percentage caught or produced by that country over the different fishing grounds (found by looking up the corresponding SpC-code in FAO2000). The landings in Belgian harbours in 2000 were not taken into account. These data were available in a data base containing the same details as the CEC-data base, and the amounts were already split up for each fishing ground. These data could be added to the newly composed data base. Thereupon, for each Sp-code the distributions over the fishing grounds were summed in order to get the overall division per species without the separation per country. Finally, the relative percentages for each species per fishing ground were calculated to reach the objective of the study.

Project CP/56 - “Integrated evaluation of marine food items: nutritional value, safety, and consumer perception”
SPSD II - Part I - Sustainable production and consumption patterns - Agro-Food 14
1.3.3 Results traceability study Results of step 1 From the CEC 2000 data, it appeared that 219,000 tons of seafood was imported in 2000 from 116 countries, spread over the five continents and 26,000 tons seafood was landed in Belgian harbours. This leads to a total amount of 245,000 tons of seafood entering Belgium in 2000 from which 89% was imported. Of the total of Belgian imports and landings, 90% was contributed by only 22 countries (Belgium inclusive) (Table I.2), 71% of which originated from European countries. When different product groups are considered, it appeared that 98% of the crustaceans and shellfish is imported, imported fish accounted for 85% of the total fish landings and imports. Table I. 2 The 22 most important countries supplying seafood for the Belgian market, with their percentage supplied relative to the total amount (% of 245,000 tons) The Netherlands 23.89% Vietnam 1.96% Thailand 1.13%Belgium 10.62% China 1.92% Senegal 1.00%France 9.31% India 1.73% Ireland 0.99%Denmark 7.73% Sweden 1.64% Uganda 0.92%Germany 6.99% United States of America 1.56% Indonesia 0.92%Tanzania 6.35% Canada 1.46% Ecuador 0.89%United Kingdom 3.68% Spain 1.45% Iceland 2.36% Bangladesh 1.26% As shown in Table I.2, more than 50% is supplied by Belgium and three neighbouring countries: The Netherlands, France and Denmark. It is important to repeat that the table describes the countries of import, not of origin. Of the total amount of 245,000 tons of seafood entering in Belgium, 40% (99,000 tons) were subsequently exported to other countries, leading to 146,000 tons available on the Belgian market for consumption. This is roughly 14.6 kg/year/caput or 280 g/week/caput. Results of step 2 Within the assumptions made, the combination of the estimated data would indicate that more than 50% of the seafood products on the Belgian market originates from the Northeast Altantic Area, with the North Sea being the most important sub area (counting for 13%). Figure I.1 shows the results for two individual fish species frequently consumed in Belgium.

Project CP/56 - “Integrated evaluation of marine food items: nutritional value, safety, and consumer perception”
SPSD II - Part I - Sustainable production and consumption patterns - Agro-Food 15
Cod
0%
5%
10%
15%
20%
25%
30%
35%
40%
21 27_01 27_02 27_03A 27_03B_C 27_03D 27_04 27_05 27_07 27ns
Tuna
0%
5%
10%
15%
20%
25%
30%
35%
21 31 34 37 41 47 51 57 61 67 71 77 81 87 27_08 27_09 27ns
Figure I. 1 The presumed origin of two frequently eaten fish species in Belgium (in percentage) 1.4 Data base of nutrient and contaminant concentrations in seafood 1.4.1 Methodology used Two Excel®-data bases were constructed in function of the different fish species: one with nutrient concentrations and another with contaminant concentrations. For the nutrients, vitamin D, EPA & DHA (two omega-3 fatty acids), iodine and total fat content have been taken into consideration. Furthermore, the following contaminants have been included: polychlorinated biphenyls (PCBs), dioxin-like (dl) PCBs, dioxins (sum of polychlorinated dibenzo-p-dioxins (PCDDs) and polychlorinated dibenzofurans (PCDFs)), total dioxin-like compounds (sum of PCDDs, PCDFs and dl PCBs) – further on called total TEQ content- and mercury. Concerning the contaminant concentrations, an attempt was made to distinguish different origins within some of the species. In contrast, this was not done for the nutrient concentrations since most of the data sources were not informative about the origin of the samples. In the newly compiled nutrient data base, all relevant information was included: commercial and scientific name of the fish, culinary processing procedure (if relevant), farmed or wild fish (if known), number of samples, number of individual sample units per sample in the case of composite samples, (mean) fat content of the fish and (mean) nutrient content, with extra statistical data if available (standard deviation, minimum and maximum). Concentrations of EPA&DHA, as well as the total fat content were expressed in mg/g fresh weight. Concentrations of vitamin D and iodine were expressed in µg/g fresh weight. Fourteen food composition data bases (Beemster et al., 2001; Carnovale et al., 2000; Danish Institute for Food and Veterinary Research, 2005; Favier et al., 1995; Food Standards Agency, 2002; Health Canada, 2005; Holland et al., 1993; Institut Paul Lambin, 2004; National Public Health Institute of Finland, 2004; NUBEL, 1999; Salvini S. et al., 1998; Souci et al., 2000; Sugiyama
Area code Area name (FAO) 21 Atlantic, Northwest 27 Atlantic, Northeast 27_01 Barents Sea
27_02 Norwegian Sea, Spitsbergen & Bear Island
27_03A Skagerrak and Kattegat 27_03B_C Sont and Belten 27_03D Baltic Sea 27_04 North Sea 27_05 Iceland and Faroer Islands 27_07 Irish Sea and coast 27_08 Gulf of Biskaje 27_09 Portuguese coast 31 Atlantic, Western Central 34 Atlantic, Eastern Central 37 Mediterranean and Black Sea 41 Atlantic, Southwest 47 Atlantic, Southeast 51 Indian Ocean, Western 57 Indian Ocean, Eastern 61 Pacific, Northwest 67 Pacific, Northeast 71 Pacific, Western Central 77 Pacific, Eastern Central 81 Pacific, Southwest 87 Pacific, Southeast

Project CP/56 - “Integrated evaluation of marine food items: nutritional value, safety, and consumer perception”
SPSD II - Part I - Sustainable production and consumption patterns - Agro-Food 16
Jogakuen University, 2004; USDA National Data Laboratory, 2004), 44 peer reviewed research papers (mostly about original research), two books (Ackman, 2000; Sondergaard et al., 1984) and own analytical data were used (see Annex 3 for the complete reference list). The selection of the food composition data bases is based on their availability, either as a book or freely available from the internet (found via LanguaL-website maintained and supported by the EuroFIR Consortium and funded under the EU 6th Framework Food Quality and Safety Programme). The contaminant data base contained the following information: commercial name, scientific name, farmed or wild fish (if known), period of capture, age of the fish at the moment of analysis, fishing ground where the fish was caught, number of samples, number of individual sample units per sample in the case of composite samples, mean fat content of the fish and mean contaminant content, with extra statistical data if available (standard deviation, minimum and maximum). Concentration data of dioxins and dl PCBs in seafood were expressed in pg TEQ/g fresh weight, other PCB concentrations and mercury concentrations in ng/g fresh weight. Mercury concentrations were converted to methyl mercury concentrations, since this organic form is the major chemical form in which mercury is present in fish. Organic mercury in the form of methyl mercury is the most toxic chemical species of the element (Storelli et al., 2003). On the basis of literature data, it was assumed that 80% of the total mercury in fish is present in methylated form; being 68% and 34% for molluscs and crustacean, respectively. For the contaminant data base, it was decided to consider only data points from analyses in the last 10 years (period 1995-2005). Up to now, the data base search (exploring PubMed, Web of Science and Google) had retrieved 127 relevant data sources: 30 reports and/or data bases of governments/research institutes; two important national data sources: a confidential data base from the Belgian Food Safety Agency, and data analysed in collaboration with the own department (in the frame work of a MSc thesis); 80 peer reviewed research papers; and 15 proceedings from the International Symposia on Halogenated Environmental Organic Pollutants and POPs (Persistent Organic Pollutants) (see Annex 4 for the complete reference list). The nutrient and concentration data were described by probability distributions to use as input for the probabilistic model (see Part II). The probability distributions were fitted to the data using the fitting program BestFit® (Palisade Corporation, Newfield, NY, USA, 2002). In this statistical procedure, available data per species were weighed for their cumulative probability of occurrence. The weighing factor was based on the number of samples used during the concentration measurements to avoid overrepresentativeness of studies with many samples. The selection of the best fit was based on a goodness-of-fit test (the method of the least squares) and on visual evaluation of the probability plot (Palisade Corporation, 2002). Distribution models able to create unrealistic high or low concentrations, were truncated: on half of the lowest observed concentration at the lower end of the distribution and on the double of the highest observed concentration at the higher end of the distribution. 1.4.2 Results: Nutrient concentrations and distributions for the different species The results of the intake assessment will be based on 32 different seafood species and 2 fish products (see Part I.2), therefore the results given here will mostly be about these 34 seafood products. The result of the collected data and their weighing factors formed the basis for the distribution fitting and selection process. In a first phase, EPA and DHA were considered separately. Later on, it was decided to combine them and fit distributions for the summed concentrations, since

Project CP/56 - “Integrated evaluation of marine food items: nutritional value, safety, and consumer perception”
SPSD II - Part I - Sustainable production and consumption patterns - Agro-Food 17
this would be more relevant for the intake assessment. It was possible to describe the EPA & DHA, vitamin D, iodine, and total fat concentrations of these species, using one of the following five different distribution models: a beta distribution (defined by two shape parameters α1 and α2, and a minimum and maximum), a truncated normal distribution (defined by a mean, standard deviation, and an imposed minimum and maximum to avoid unrealistic low or high values), a truncated lognormal distribution (defined by its mean, standard deviation, an imposed minimum and maximum), a truncated loglogistic distribution (defined by a location, shape and scale parameter, and an imposed minimum and maximum) and finally a uniform distribution (defined by a minimum and maximum).
1.4.2.1 EPA & DHA Figure I.2 shows box plots of the published EPA&DHA concentrations in the different species of interest, where four or more data points were available. The species are sorted according to their median EPA&DHA concentration. The figure shows that trout, anchovy, herring, salmon, sardines, mackerel and sprat contain a high concentration of LC n-3 PUFA. Nevertheless, the figure makes clear that a high within variability exists in the PUFA concentrations. In other words, not only the fish species, but a lot of other factors influence the PUFA concentration, leading to high within-species variability. For 3 species (skate, John dory and conger) only two data points were available. Therefore, their EPA concentration is defined by a uniform distribution, using the two data points as minimum and maximum. For 3 seafood species: Norway lobster, Nile perch and sea bream, no EPA & DHA concentrations could be found. Their EPA & DHA concentration is therefore described by these of lobster, sole and wolf fish, respectively, because of the similar fat content. The distribution of the EPA&DHA concentrations for the 34 relevant fish species can be found in Annex 5, Table 1.
1 2 3 4 5 6 7 8 9 10 11 12 13 14 15 16 17 18 19 20 21 22 23 24 25
Species
0
10
20
30
40
50
Con
cent
ratio
n of
EP
A&
DH
A (m
g/g
wet
wei
ght)
Figure I. 2 Concentrations of EPA&DHA in different species, box plots. Data available from the open literature and from national and international reports (Annex 3)
1.Sole; 2.Haddock; 3.Whiting; 4.Anglerfish; 5.Saint-James shell; 6.Lobster; 7.European plaice; 8.Cod; 9.Scampi; 10.Crab; 11.Common shrimp; 12.Saithe and Pollack; 13.Tuna; 14.Mussel; 15.Squid; 16.Wolf fish; 17.Halibut; 18.Eel; 19.Trout; 20.Anchovy; 21.Herring; 22.Salmon; 23.Sardine; 24.Caviar; 25.Mackerel; 26.Sprat

Project CP/56 - “Integrated evaluation of marine food items: nutritional value, safety, and consumer perception”
SPSD II - Part I - Sustainable production and consumption patterns - Agro-Food 18
1.4.2.2 Vitamin D Figure I.3 shows the published data of vitamin D for different species, ordered by the median vitamin D concentration.
1 2 3 4 5 6 7 8 9 10 11 12 13 14 15 16 17 18 19 20Species
0
10
20
30
40
Con
cent
ratio
n of
vita
min
D (µ
g/10
0 g
wet
wei
ght)
1.Scampi; 2.Haddock; 3.Mussel; 4.Wolf fish; 5.Sea bream; 6.European plaice; 7.Saithe and Pollack; 8.Sole; 9.Cod; 10.Anchovy; 11.Tuna; 12.Whiting; 13.Halibut; 14.Mackerel; 15.Trout; 16.Sardine; 17.Caviar; 18.Salmon; 19.Herring; 20.Eel
Figure I. 3 Concentrations of vitamin D in different species, box plots. Data available from the open literature and from national and international reports (Annex 3) Sardine, salmon, herring and eel are the species with a rather high vitamin D concentration, but all with high within-species variability. Also caviar contains quite high vitamin D concentrations. Since only few data were available for sprat, and since it is of the same family as herring, the distribution of herring shall also be used to describe the vitamin D content of sprat. For 8 non-fish seafood species (crustacean, shellfishes and molluscs) and 6 fishes with a rather low fat content, the vitamin D concentration was described by a uniform distribution with zero as minimum and the LOD (0.1 µg/100 g) as maximum, since the available published concentration data only indicated ‘Traces’. Table 2 of Annex 5 shows for the 34 relevant fish species the distribution of their vitamin D concentration. 1.4.2.3 Iodine In contrast to EPA&DHA as well as vitamin D, iodine is a water soluble nutrient. Nevertheless, literature data showed that the iodine concentration is influenced by the fat concentration of the fish, as well as by its habitat (saltwater fish versus freshwater fish). Figure I.4 shows box plots of the iodine concentration in different species.

Project CP/56 - “Integrated evaluation of marine food items: nutritional value, safety, and consumer perception”
SPSD II - Part I - Sustainable production and consumption patterns - Agro-Food 19
1 2 3 4 5 6 7 8 9 10 11 12 13 14 15 16 17 18 19Species
0
200
400
600
800
1000
Con
cent
ratio
n of
jodi
um (µ
g/10
0 g
wet
wei
ght)
1.Trout; 2.Sole; 3.Eel; 4.Sardine; 5.European plaice; 6.Herring; 7.Salmon; 8.Tuna; 9.Halibut; 10.Oyster; 11.Mackerel; 12.Red fish; 13.Tilapia; 14.Caviar; 15.Saithe and Pollack; 16.Mussels; 17.Lobster; 18.Haddock; 19.Cod
Figure I. 4 Concentration data of iodine in different species, box plots. Data available from the open literature and from national and international reports (Annex 3) High within species variability was found for cod and lobster. Due to lack of data for some seafood species, data of different species with similar characteristics were aggregated and distributions were fitted based on the aggregated data. Two times five groups were made, related to the fat groups but separated for saltwater versus freshwater species. The distributions can be found in Annex 5 (Table 3). 1.4.2.4 Fat The most important reason to gather data on the total fat content of the different seafood species was to study the correlation between the intake of fat and the intake of other nutrients and contaminants via seafood consumption. This information also formed the basis for the determination of the different fat groups (see Part I.1.2). Data about the fat content are not shown here, but Table 4 in Annex 5 shows the distribution of the fat concentration for the 34 relevant fish species. 1.4.3 Results: Contaminant concentrations and distributions for the different species The concentration data together with their cumulative probabilities were used per species and – where possible - per fishing ground, to fit probability distributions. Currently, the data base contains 2082 mercury concentrations, 1177 concentrations of indicator PCBs (iPCBs), 1254 of dl PCBs, 1615 dioxin concentrations and 1139 total TEQ concentrations.
1.4.3.1 Mercury and methyl mercury Figure 1.5 shows the published mercury data for different fish species. The species are sorted according to their median mercury concentration.

Project CP/56 - “Integrated evaluation of marine food items: nutritional value, safety, and consumer perception”
SPSD II - Part I - Sustainable production and consumption patterns - Agro-Food 20
1 2 3 4 5 6 7 8 9 10 11 12 13 14 15 16 17 18 19 20 21 22 23 24 25 26 27 28 29 30 31 32 33 34 35 36
Species
1
10
100
1000
Mer
cury
con
cent
ratio
n (n
g/g
fresh
wei
ght)
- Log
sca
le
1. Halibut; 2. Squid, non-Mediterranean; 3. Tilapia; 4. Sardine, Eastern Central Atlantic Sea; 5. Mussel; 6. Saint James shells; 7. Oyster; 8. Norway lobster; 9. Scampi; 10. Herring; 11. Sprat; 12. Brill; 13. Salmon, farmed; 14. Mackerel, Northeast Atlantic Sea; 15. European plaice; 16. Salmon, Pacific, wild; 17. Anchovy; 18. Common shrimp; 19. Sole; 20. Crab; 21. Saithe and Pollack; 22. Haddock; 23. Redfish; 24. Trout; 25. Squid, Mediterranean Sea; 26. Cod; 27. Nile perch; 28. Skate; 29. Whiting; 30. Anglerfish; 31. Sardine, Mediterranean Sea; 32. Eel; 33. Ling; 34. Mackerel, Mediterranean Sea; 35. Tuna; 36. Swordfish
Figure I. 5 Mercury concentrations in different species, box plots. Data available from the open literature and from national and international reports (Annex 4) The box plots show that tuna and swordfish have the highest mercury load and that mackerel, squid, and sardines from the Mediterranean Sea contain more mercury compared to other catching areas. It seems that molluscs and crustacean have rather low mercury concentrations. Moreover, the plotted data visualize the within-species variability of the mercury concentrations: the lowest measured mercury concentration in tuna falls within the 75th percentile of the mercury concentrations in halibut (species with the lowest median). To protect public health, maximum levels of mercury in fishery products are laid down by the European Commission (Regulation (EC) No 466/2001 of 8 March 2001 93/351/EEC). The levels should be as low as reasonably achievable, taking into account that for physiological reasons certain species concentrate mercury more easily in their tissues than others. Mercury limit for fishery products in general is 0.5 mg/kg fresh weight. It is 1.0 mg/kg fresh weight for anglerfish, Atlantic catfish, bass, blue ling, bonito, eel, halibut, little tuna, marlin, pike, plain bonito, Portuguese dogfish, rays, redfish, sail fish, scabbard fish, shark, snake mackerel, sturgeon, swordfish, and tuna. In the compiled data base, these limits were exceeded for four species: cod, common shrimp, tuna, swordfish, and Nile perch; for respectively 1.0%, 2.4%, 28.7%, 51.1%, and 7.7% of the concentration data. Table 5 in Annex 5 gives the distributions and parameters of the mercury concentration in different fish species. The table shows that a distinction according to origin of the seafood product and its mercury concentration could be made for mackerel, sardine, squid, and salmon. For salmon, a distinction was made between farmed and wild salmon. For the other three species, concentrations of fish caught in the Mediterranean Sea were separated from the other areas of interest. The percentages given in the second column are a result of the work executed in the traceability study and give an indication of the importance of each catching area. The data in the table also indicate that no data were available for three seafood products: caviar, conger, and surimi. In those cases, the mercury contamination was assumed to be negligible. The underestimation of the total mercury intake caused by this assumption will be very small, due to the low amount of these products that is consumed.

Project CP/56 - “Integrated evaluation of marine food items: nutritional value, safety, and consumer perception”
SPSD II - Part I - Sustainable production and consumption patterns - Agro-Food 21
As described in Part I.1.4.1 (used methodology), calculations were done to determine the methyl mercury concentration in the species. On the basis of the calculated concentration data, distributions were fitted, shown in table 6 of Annex 5.
1.4.3.2 Indicator PCBs (iPCBs) In order to gather data about the concentration of iPCBs, seven different congeners were taken into account: congeners 28, 52, 101, 118, 138, 153, 180. The collected data considering the sum of iPCBs are shown per species in the box plots below, sorted according to their median iPCB concentrations.
1.Skate; 2.Scampi; 3.Saint James shells; 4.(Alaska) pollack and saithe; 5.Whiting; 6.Haddock; 7.FG1; 8.Cod; 9.Common shrimp; 10.European plaice; 11.FG2; 12.Sole; 13.Redfish; 14.Mussels; 15.non-Baltic Herring; 16.Halibut; 17.Sprat; 18.Squid; 19.Salmon; 20.Mackerel; 21.FG3; 22.FG4; 23.Anchovy; 24.Sardine; 25.Herring, Baltic Sea; 26.FG5; 27.Crab; 28.Eel
Figure I. 6 Concentrations of the sum of iPCBs in different species, box plots. Data available from the open literature and from national and international reports (Annex 4) This figure shows that lean fishes have generally a lower iPCB concentration, only crab seems to be an exception; which was confirmed by the results of a Norwegian study (Norwegian scientific committee for food safety, 2006). Again, large within-species variability can be observed. The only species, for which a distinction according to different catching areas was made, is herring form the Baltic Sea versus the other catching areas. As a solution to fill the gaps of lacking data, the different concentrations data of all species belonging to the same fat group were pooled and used for distribution fitting. When no data were available for an individual species, the distribution of the corresponding fat group was used. Table 7 of Annex 5 gives the distributions and parameters of the iPCB concentration in different fish species.
1.4.3.3 Dioxin-like compounds: dlPCBs, dioxins and total TEQ The European Commission published recently a regulation (Commission Regulation (EC) No 199/2006 of 3 February 2006 amending Regulation (EC) No 466/2001) setting maximum levels for certain contaminants in foodstuffs as regards dioxins and dl PCBs. Concerning muscle meat of fish, fishery products and products thereof, the maximum levels for dioxins is 4.0 pg TEQ/g fresh weight and the maximum level for the sum of dioxins and dioxin-like
1 2 3 4 5 6 7 8 9 10 11 12 13 14 15 16 17 18 19 20 21 22 23 24 25 26 27 28Species
0.1
1
10
100
1000
23457
23457
23457
23457
234579
Indi
cato
r PC
Bs (n
g/g
wet
wei
ght)
- Log
sca
le

Project CP/56 - “Integrated evaluation of marine food items: nutritional value, safety, and consumer perception”
SPSD II - Part I - Sustainable production and consumption patterns - Agro-Food 22
PCBs is 8.0 pg TEQ/g fresh weight, with exception of eel which may contain 12.0 pg TEQ/g fresh weight. In the compiled data base, concentrations exceeding the limit were found for seven species. Table I.3 gives the percentages of those data in relation to the total data. Table I. 3 Percentage of data exceeding the limits for dioxin-like compounds Species Dioxins Total dioxin-like compounds
% of the data exceeding the limit
(number of data points) Eel 4.9 (4) 24.5 (26) Halibut 2.6 (1) 10.0 (1) Herring, Baltic Sea 48.7 (127) 50.0 (93) Herring, non-Baltic 4.5 (3) 13.4 (9) Mackerel 1.6 (1) 1.9 (1) Salmon, Baltic Sea 66.7 (34) 96.0 (48) Salmon, farmed 15.4 (8) 4.5 (8) Salmon, Pacific, wild 0.0 0.0 Trout 3.3 (2) 6.3 (5) Tuna 2.4 (1) 22.0 (9) To describe the dlPCB content in the different fish species, the sum of the four non-ortho and eight mono-ortho dl PCBs (congeners 77, 81, 126, 169, 105, 114, 118, 123, 156, 157, 167, 189) were considered. The data found are shown in the figure below.
1.Scampi; 2.Haddock; 3.FG1; 4.Cod; 5.(Alaska) Pollack and saithe; 6.Whiting; 7.Mussels; 8.FG2; 9.Redfish; 10.Squid; 11.Common shrimp; 12.Swordfish; 13.European plaice; 14.Salmon, Pacific Ocean; 15.Trout; 16.FG4; 17.Turbot; 18.Halibut; 19.Tuna; 20.FG3; 21.Sardine; 22.Mackerel; 23.Farmed salmon; 24.Herring (North Sea); 25.Anchovy; 26.FG5; 27.Sprat; 28.Herring (Baltic Sea); 29.Eel; 30.Herring (others); 31.Salmon (Baltic Sea)
Figure I. 7 Concentrations of the sum of dlPCBs in different species, box plots. Data available from the open literature and from national and international reports (Annex 4) The box plots visualize that the fatty fish species have the highest dlPCB load: herring, salmon, eel and sprat, but again with high within-species variability. A very similar figure is made about the published dioxin concentrations.
1 2 3 4 5 6 7 8 9 10111213141516171819202122232425262728293031Species
0.00
0.01
0.10
1.00
10.00
100.00
Dio
xin-
like
PCB
conc
entra
tion
(pg
TEQ
/g w
et w
eigh
t) - L
og s
cale
Project CP/56 - “Integrated evaluation of marine food items: nutritional value, safety, and consumer perception”
SPSD II - Part I - Sustainable production and consumption patterns - Agro-Food 23
1 2 3 4 5 6 7 8 9 10 11 12 13 14 15 16 17 18 19 20 21 22 23 24 25 26 27 28 29 30 31 32 33 34 35 36
Species
0.001
0.010
0.100
1.000
10.000
Dio
xin
conc
entra
tion
(pg
TEQ
/g fr
esh
wei
ght)
- Log
sca
le
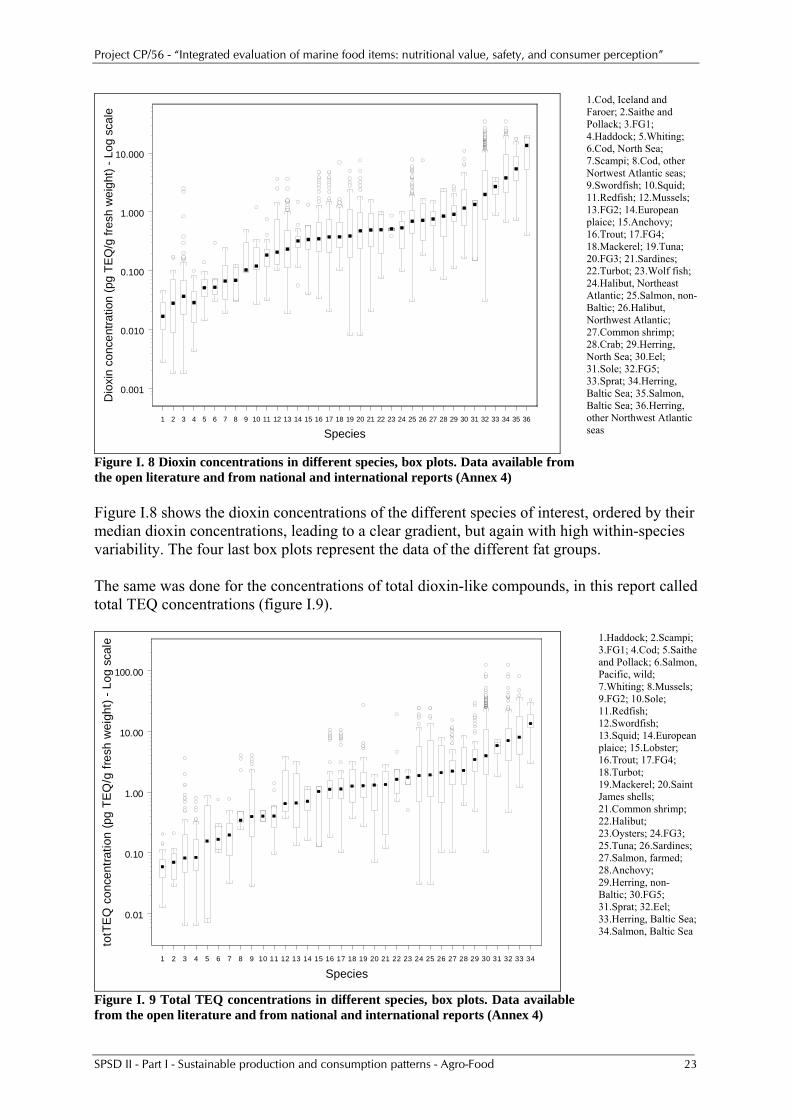
Figure I. 8 Dioxin concentrations in different species, box plots. Data available from the open literature and from national and international reports (Annex 4)
1.Cod, Iceland and Faroer; 2.Saithe and Pollack; 3.FG1; 4.Haddock; 5.Whiting; 6.Cod, North Sea; 7.Scampi; 8.Cod, other Nortwest Atlantic seas; 9.Swordfish; 10.Squid; 11.Redfish; 12.Mussels; 13.FG2; 14.European plaice; 15.Anchovy; 16.Trout; 17.FG4; 18.Mackerel; 19.Tuna; 20.FG3; 21.Sardines; 22.Turbot; 23.Wolf fish; 24.Halibut, Northeast Atlantic; 25.Salmon, non-Baltic; 26.Halibut, Northwest Atlantic; 27.Common shrimp; 28.Crab; 29.Herring, North Sea; 30.Eel; 31.Sole; 32.FG5; 33.Sprat; 34.Herring, Baltic Sea; 35.Salmon, Baltic Sea; 36.Herring, other Northwest Atlantic seas
Figure I.8 shows the dioxin concentrations of the different species of interest, ordered by their median dioxin concentrations, leading to a clear gradient, but again with high within-species variability. The four last box plots represent the data of the different fat groups. The same was done for the concentrations of total dioxin-like compounds, in this report called total TEQ concentrations (figure I.9).
1 2 3 4 5 6 7 8 9 10 11 12 13 14 15 16 17 18 19 20 21 22 23 24 25 26 27 28 29 30 31 32 33 34
Species
0.01
0.10
1.00
10.00
100.00
totT
EQ
con
cent
ratio
n (p
g TE
Q/g
fres
h w
eigh
t) - L
og s
cale
Figure I. 9 Total TEQ concentrations in different species, box plots. Data available from the open literature and from national and international reports (Annex 4)
1.Haddock; 2.Scampi; 3.FG1; 4.Cod; 5.Saithe and Pollack; 6.Salmon, Pacific, wild; 7.Whiting; 8.Mussels; 9.FG2; 10.Sole; 11.Redfish; 12.Swordfish; 13.Squid; 14.European plaice; 15.Lobster; 16.Trout; 17.FG4; 18.Turbot; 19.Mackerel; 20.Saint James shells; 21.Common shrimp; 22.Halibut; 23.Oysters; 24.FG3; 25.Tuna; 26.Sardines; 27.Salmon, farmed; 28.Anchovy; 29.Herring, non-Baltic; 30.FG5; 31.Sprat; 32.Eel; 33.Herring, Baltic Sea; 34.Salmon, Baltic Sea

Project CP/56 - “Integrated evaluation of marine food items: nutritional value, safety, and consumer perception”
SPSD II - Part I - Sustainable production and consumption patterns - Agro-Food 24
Again, a clear gradient appears when ordering the seafood species according to their median total TEQ concentration. The species with the highest median concentration are herring and salmon from the Baltic Sea. In this context, it is important to mention that different methodologies can be applied to measure the concentrations of total dioxin-like compounds, other than summing the measured dioxin and dioxin-like PCB concentrations. As a result, in the compiled data base, it is possible that the highest total TEQ concentration found in a certain species is lower than the highest dioxin-like PCB concentration in the same species. For the determination of the probability distributions of these compounds, the same approach as for iPCBs was applied to deal with the problem of data gaps. Tables 8 to 10 of Annex 5 present the distributions and parameters of the different fish species for the different dioxin-like compounds. For the different dioxin-like compounds, available data made it possible to distinguish between catching area for salmon and herring. For dioxins, this was also possible for cod and halibut.
1.4.3.4 Contamination data from the Belgian Food Safety Agency Because of the uncertainties concerning data on the concentration and catching area, data from the Belgian Food Safety Agency were also considered. These data on seafood available on the Belgian market would make extra considerations about the origin unnecessary. However, the amount of data delivered by the Agency was rather limited. For mercury, data were available for eight relevant species (with the number of concentration data between brackets): Saint James shells (8), sole (17), cod (18), whiting (18), common shrimp (21), European plaice (21) and skate (26). An intake assessment for mercury, on the basis of these data only, would need the clustering of species. In contrast to the other contaminants, this clustering can not be done on the basis of the fat content of the seafood species, since mercury is not fat soluble. Considering the fat soluble contaminants of interest, the Belgian Food Safety Agency delivered data for 13 different species (shown in the table I.14). For the dioxin-like compounds, an important part of the data was below the limit of detection (LOD) used, i.e. 1 pg TEQ/g fresh weight. Table I. 4 Number of concentration data (>LOD and <LOD) in seafood delivered the Belgian Food Safety Agency Species or group Number of available data points > LOD + < LOD iPCB dlPCB Dioxin Total TEQ Anchovy 0 0 2+0 0 Cod 12 1+0 0 1+4 Common shrimp 12 0 1+0 2+0 European plaice 11 1+0 1+0 1+4 Mackerel 2 3+3 3+5 0 Mussels 0 1+0 1+0 1+0 Saint James shells 5 0 0 3+1 Salmon 1 4+5 7+7 2+0 Sardine 2 1+0 2+1 0 Skate 12 0 0 1+5 Sole 12 0 2+0 1+4 Tuna 0 2+8 2+10 0 Whiting 12 0 0 0+3 FG1 41 1 0 5+13 FG2 35 2 5+0 5+8 FG3 0 2+8 4+10 0 FG4 2 1 2+1 0 FG5 3 7+8 10+12 2+0

Project CP/56 - “Integrated evaluation of marine food items: nutritional value, safety, and consumer perception”
SPSD II - Part I - Sustainable production and consumption patterns - Agro-Food 25
In order to determine distributions for these contaminants, the data were grouped according to fat content. As shown in the table, even after grouping, data remained scarce. Grouping is therefore not a valid alternative. 1.5. Discussion and conclusion Extensive work has been done to gather the best available data about origin, nutrient content and contamination load of seafood products on the Belgian market and to construct new data bases to be used in the probabilistic intake assessment of nutrients and contaminants. Nonetheless, we are aware that, in this way, representativiness remains difficult to achieve: (1) concentrations in the fish actually consumed by different groups of the Belgian population were not at our disposal, (2) data from our National Food Safety Agency remain limited in numbers and in species sampled, (3) analytical data gathered for economical purposes, nationally and internationally, are mostly not published in the open literature and are, therefore, difficult to access, and (4) the usefullness of data coming from ecological monitoring studies may not be representative for seafood intended for human consumption. The availability of analytical data covering more in detail the fish and fish products put on the Belgian market, would greatly improve the possibility to perform benefit and/or risk assessments in general conditions or at the occasion of punctual incidents. Besides that, additional problems were faced when constructing these data bases, e.g., lack of internationally standardised analytical methodologies, and differences in the reporting of the result. This strengthens the concern, already expressed by the EU Scientific Steering Committee, about the need to improve the comparability of data critical for the conduct of intake assessment (EU Scientific Steering Committee, 2000). It was recommended that EFSA should contribute to the development of a European framework for the harmonisation of food-related data collection in the EU and for public accessibility of these data (EFSA, 2005). 1.6. References Ackman RG. Fatty acids in Fish and Shellfish. In: Chow CK, editor. Fatty acids in food and their health implications. New York: Marcel Dekker, 2000: 153-175.
Beemster CJM, van der Heijden LJM, Hulshof KFAM, Langius JAE, van Oosten HM, Pruissen-Boskaljon JC et al. Nevo-tabel. Nederlands voedingsstoffenbestand. Den Haag: Nederlands Voedingscentrum, 2001.
Carnovale E, Marletta L. Copmosizione degli alimenti - Aggiornamento 2000. INRAN - Milano, editor. 2000.
Danish Institute for Food and Veterinary Research. Danish Food Composition Databank (revision 6.0). www.foodcomp.dk. 1-6-2005.
EFSA. Opinion of the scientific committee on a request from EFSA related to exposure assessments. The EFSA Journal 2005; 249:1-26.
EU Scientific Steering Committee. First report on the harmonisation of risk assessment procedures in the European Union. 20-12-2000.

Project CP/56 - “Integrated evaluation of marine food items: nutritional value, safety, and consumer perception”
SPSD II - Part I - Sustainable production and consumption patterns - Agro-Food 26
Favier J-C, Ireland-Ripert J, Toque C, Feinberg M. Répertoire général des aliments. 2 ed. Paris: 1995.
Food Standards Agency. McCance and Widdowson's. The composition of foods, Sixth summary edition. Cambridge: Royal Society of Chemistry, 2002.
Health Canada. Canadian Nutrient File, version 2005. http://www.hc-sc.gc.ca/food-aliment/ns-sc/nr-rn/surveillance/cnf-fcen/e_index.html. 10-1-2005.
Holland B, Brown J, Buss DH. Fish and fish products. The third supplement to McCance & Widdowson's. The composition of food (5th edition). Cambridge: 1993.
Institut Paul Lambin. Table de composition des aliments. Buxelles: 2004.
Judd N, O'Neill SM, Kalman DA. Are seafood PCB data sufficient to assess health risk for high seafood consumption groups? Hum Ecol Risk Assess 2003; 9(3):691-707.
Karl H, Ruoff U, Bluthgen A. Levels of dioxins in fish and fishery products on the German market. Chemosphere 2002; 49(7):765-773.
National Public Health Institute of Finland. Finnish Food Composition Database. www.fineli.fi. 18-4-2004.
Norwegian scientific committee for food safety. Fish and seafood consumption in Norway - Benefits and risks. 2006. Oslo.
NUBEL. Belgische voedingsmiddelentabel. 3e editie. Brussels: Ministerie van Volksgezondheid, 1999.
Bestfit® Distribution Fitting for Windows, Version 4.5. Newfield, NY USA: 2002.
Salvini S., Parpinel M., Gnagnarella P., Maisonneuve P., Turrini A. Food Composition Database for Epidemiological Studies in Italy. 1998.
Sondergaard H, Leerbeck E. Vitamin D content of Danish foods. Supplement concerning fish. Soborg, Denmark: 1984.
Souci SW, Fachmann W, Kraut H. Food composition and nutrition tables. 6 ed. München: Scientific Publishers Stuttgart, 2000.
Storelli MM, Giacominelli-Stuffler R, Storelli A, D'Addabbo R, Palermo C, Marcotrigiano GO. Survey of total mercury and methylmercury levels in edible fish from the Adriatic Sea. Food Additives and Contaminants 2003; 20(12):1114-1119.
Storelli MM, Marcotrigiano GO. Cadmium and total mercury in some cephalopods from the South Adriatic Sea (Italy). Food Additives and Contaminants 1999; 16(6):261-265.
Sugiyama Jogakuen University. Food Composition Database in Sugiyama Univ. Standard Tables of Food Composition in Japan. http://database.food.sugiyama-u.ac.jp . 9-2-2004.
USDA National Data Laboratory. USDA National Nutrient Database for Standard Reference. Release 16-1. www.nalusda.gov/fnic/foodcomp/ . 2004.

Project CP/56 - “Integrated evaluation of marine food items: nutritional value, safety, and consumer perception”
SPSD II - Part I - Sustainable production and consumption patterns - Agro-Food 27
2. SEAFOOD CONSUMPTION
2.1 Introduction In order to execute a quantitative intake assessment of nutrients and contaminants by the Belgian population via seafood, consumption data are needed. During this project, two different secondary data bases were used. A first data base was collected among Flemish adolescents between March and May 1997 by the Department of Public Health in the course of an international collaborative project. A second data base was collected from a representative sample of Belgian men and women between November and December 2004 within SEAFOODplus1. 2.2 Seafood consumption data of Flemish adolescents 2.2.1 Methodology: preparing the data base to be introduced in ProbIntakeUG The data were collected in Ghent (Belgium) using a self-reported, semi-structured seven-day food record. They allowed a cross-sectional description of the dietary habits in 341 boys and girls between 13 and 18 years old (Matthys et al., 2003). Body weights of the individuals were also recorded. More detailed information is given by Matthys et al. (Matthys et al., 2003). Within the context of this project, the data regarding non-seafood products were excluded from the data base. Second, some adaptations concerning the description of the seafood products consumed were made. All the fish in fish sticks, fish croquets and in fish pie were considered as saithe. The fish used in paella, stockfish, fish described as ‘frozen fish’ and fish without any specification was considered as being cod. ‘Fried fish’ was considered as European plaice. Frog’s leg was replaced by lobster (since it has an equal amount of LC n-3 PUFA) and gurnard was replaced by plaice, in their equal fat concentration. Fried fish fillet (called ‘lekkerbekje’) was considered as whiting; and smoked herring (called ‘bokking’) and young herring (called ‘maatje’) were considered as herring. These adaptations are based on expert judgement by trained dieticians. Third, some of the individuals had recorded the amount of seafood consumed as the amount of raw seafood, while others had noted the amount after processing. To obtain uniform data, and since most of the concentrations used to determine the probability distributions were expressed per gram fresh weight, the amounts of seafood consumed were recalculated to amounts of raw seafood. Therefore, the shrinking factors as found in McCance & Widdowson (Food Standards Agency, 2002) were applied in this study. This is summarized in Table I.5.
Table I. 5 Shrinking factors applied for different seafood items and cooking procedures Cooking procedure Seafood Fraction left after
processing cooking, steaming, poaching (also in magnetron) and pan-frying of fish 0.9 cooking, steaming, poaching (also in magnetron) of crustacean (except
brown shrimps) 0.9
cooking, steaming, poaching (also in magnetron) of brown shrimps 0.75 cooking, steaming, poaching (also in magnetron) of mussels 0.67 cooking, steaming, poaching (also in magnetron) of squid 0.5 Pan-frying of squid 0.65
1 SEAFOODplus is an Integrated Project (contract no. FOOD-CT-2004-506359; www.seafoodplus.org) funded by the European Commission within the Sixth Framework Programme for research and technological development. Permission for using fish consumption frequency data from the Belgian subsample of the consumer survey 2004 is gratefully acknowledged.

Project CP/56 - “Integrated evaluation of marine food items: nutritional value, safety, and consumer perception”
SPSD II - Part I - Sustainable production and consumption patterns - Agro-Food 28
Other information on the percentages of fish content as specified on product labels was used: - fish in fish sticks: amount of fish= 0.65 * total amount (35% of breadcrumbs) - squid in calamari’s: amount of squid= 0.40 * total amount (60% of fritter dough) - fish in salads:
fish salads: 80% of cod shrimp salads: 60% of brown shrimps tuna salads: 65% percent of tuna crab salads: 15% of crab and 25% of surimi
- canned fish: Anchovy in olive oil: amount of anchovy= 0.66 * total amount Herring in sauce: amount of herring= 0.70 * total amount Mackerel in oil: amount of mackerel= 0.69 * total amount Sardines in oil/sauce: amount of sardines= 0.725 * total amount Salmon in oil: amount of salmon= 0.70 * total amount
Concerning the body weights of the adolescent population, all individual body weights were known and used in the intake assessment model. Only four different girls had a missing value for their body weight. Therefore, the mean body weight (bw) of the overall population (59.1 kg) was applied for them. 2.2.2 Results From the 341 respondents, 123 (36%) did not eat any seafood during the week of the study. The mean seafood consumption of the adolescent population was 106.8 (±131.5) gram per week. When only consumers were taken into account, the mean seafood consumption was 167.0 (±130.3) gram per week. The mean fish eating occasions per week was 1.14, with a maximum of five. In total, 32 different seafood species and two seafood products (caviar and surimi) were consumed in this study. The total amount of seafood consumed by the 341 adolescents over the week of the study was 36,405.9 gram. The most important species were cod (21.0%), saithe & Pollack (15.7%), and salmon (13.6%), counting for more than half of the amount of seafood consumed (Table I.6). Table I. 6 The average amount consumed and the importance of the different species in the adolescent consumption data base Species g/week % Species g/week % Cod 22.46 21.04 Wolffish 0.83 0.78 Saithe and Pollack 16.71 15.66 Lobster 0.73 0.68 Salmon 14.56 13.64 Halibut 0.64 0.60 Common shrimp 7.82 7.33 Crab 0.55 0.52 Sole 6.93 6.49 Sprat 0.54 0.51 Mussel 6.15 5.76 Mackerel 0.48 0.45 Tuna 5.56 5.21 John dory 0.44 0.41 Scampi 4.05 3.80 Anglerfish 0.44 0.41 European plaice 3.27 3.06 Skate 0.42 0.39 Herring 2.53 2.37 Squid 0.29 0.27 Whiting 2.43 2.27 Surimi 0.25 0.23 Nile perch 1.80 1.68 Anchovy 0.22 0.21 Haddock 1.47 1.37 Common whelk 0.21 0.19 Eel 1.32 1.24 Conger 0.18 0.17 Sardine 1.20 1.13 Saint-James shell 0.18 0.16 Trout 1.11 1.04 Norway lobster 0.11 0.10 Sea bream 0.88 0.82 Caviar 0.01 0.01

Project CP/56 - “Integrated evaluation of marine food items: nutritional value, safety, and consumer perception”
SPSD II - Part I - Sustainable production and consumption patterns - Agro-Food 29
2.3 Seafood consumption data of Belgian adults 2.3.1 Methodology: preparing the data base to be introduced in ProbIntakeUG As part of a larger questionnaire, data were registered on the frequency and the amount of seafood consumption of Belgian men and women (n= 852, 208 men, 635 women and 9 with a missing value for the gender) aged between 19 and 83 years. The sample was representative for the Belgian population with respect to age and region. The consumption data were gathered using a whole other methodology (Brunsø et al., 2005; Honkanen et al., 2005) than the previously described methodology. In fact, a comprehensive questionnaire, including many constructs relevant in consumer science, was distributed to the study population, and questions about seafood consumption were only a minor part of the whole questionnaire. The answers on the following questions were useful to determine the seafood consumption pattern of the study population: 1. ‘How much fish do you prepare per person as part of a hot meal?’ Answer categories: 100
g or less, 101-150 g, 151-200 g, 201-250 g, 251-300 g, more than 300 g, or I never prepare fish as part of a hot meal.
2. ‘How often do you eat the following species: cod, salmon, sole, trout, tuna, European plaice, hake (stockfish), mackerel, eel, herring, saithe, and Pollack?’ Answer categories per species: never, daily or almost daily, 3-4 times a week, 2 times a week, once a week, 2-3 times a month, once a month, 1-5 times in six months or maximum once a year.
3. ‘How often do you eat fish: (a) at home; (b) out of home?’ Answer categories: never, daily or almost daily, 3-4 times a week, 2 times a week, once a week, 2-3 times a month, once a month, 1-5 times in six months or maximum once a year.
In order to obtain quantitative information about the fish consumption of the Belgian population, the raw data from answers on the above mentioned questions were manipulated and computed as follows: The answered frequencies of question 3a and 3b were summed and all expressed on
weekly basis to have the overall frequency of fish consumption (Never or maximum once a year= 0/week; daily or almost daily= 6.5/week; 3-4 times a week= 3.5/week; 2 times a week= 2/week; once a week= 1/week; 2-3 times a month= 0.65/week; once a month= 0.25/week; 1-5 times in six months= 0.12/week).
This overall weekly frequency was multiplied with the amount reported under question 1 (the mean of the given interval was used). As such, the average amount of total fish consumption per week was determined for each individual.
The answers on question 2 were also converted on a weekly basis, yielding for each species the weekly frequency of consumption. Next, the share in total fish consumption was calculated for each species (by dividing the weekly frequency of each species by the sum of all frequencies).
The average amount per individual of total fish consumption per week (calculated in step 2) was multiplied with the share of each species (calculated in step 3). This resulted in the average consumption expressed in gram week for each species and each individual.
In the end, the amount consumed of cod and hake were summed, since hake was considered quite similar to cod.
The consumer survey, however, did not record individual body weights. Gender and age were known. Therefore, normal body weight distributions were applied per gender and per age interval, based on representative data of the Belgian population (B.I.R.N.H study: De Backer, 1984; Kornitzer et al., 1989). The mean and standard deviation of these normal distributions are given in table I.7.

Project CP/56 - “Integrated evaluation of marine food items: nutritional value, safety, and consumer perception”
SPSD II - Part I - Sustainable production and consumption patterns - Agro-Food 30
Table I. 7 Mean and standard deviation (S.D.) of the applied body weight distributions Age interval (years) Men Women
Mean (kg) S.D. Mean (kg) S.D. <30 75.5 10.7 60.1 9.6
30-39 77.2 11.2 62.7 10.9 40-49 78.9 11.5 66.7 11.7 50-59 77.4 11.4 69.5 11.2 60-69 75.3 12.3 69.5 11.9 ≥70 73.1 10.6 66.1 11.0
2.3.2 Results Due to missing data, seafood consumption data were eventually available for 821 individuals, 202 men and 619 women. Despite the requirement that the participants of the survey had to be seafood consumer, 52 of the respondents answered not to consume any seafood. The mean calculated seafood consumption was 215.45 ± 203.49 g/week. The table below gives the average amount consumed and the importance of the different species. The resulting data will further be referred to as “Belgian adult data”. Table I.8 The average amount consumed and the importance of the species in the Belgian adult dataset Species Mean consumption (g/week) Percentage Cod 46.64 21.6% Salmon 40.52 18.8% Tuna 29.38 13.6% Saithe & Pollack 24.87 11.5% Sole 21.99 10.2% European plaice 12.94 6.0% Herring 12.15 5.6% Trout 11.82 5.5% Mackerel 10.76 5.0% Eel 4.38 2.0% Total 215.45 100.0% 2.4 Discussion and conclusion Two different methodologies were at the basis of the seafood consumption data. One data base was obtained via a seven day food record, the other via a food frequency questionnaire including questions on amounts usually eaten. In order to allow the probabilistic intake assessment, quantitative information about the consumption of different species had to be available. That information was extracted from both data bases. Also the body weight of the men and women in the population studied needed to be known. This was not the case in the second adult population; therefore, estimations were made based on age and gender. The fish consumption data obtained in this project via these two data bases can be compared in two different ways with the other data. With regard to frequency of fish consumption – consumers, weekly or more, versus non-consumers, less than weekly – the following studies contain the information required: (1) the Health Interview Survey 2001 of the Belgian Scientific Institute of Public Health, a statistically representative sample of 12,111 respondents, of which 4,100 were Flemish; (2) data from INRA (a research bureau for

Project CP/56 - “Integrated evaluation of marine food items: nutritional value, safety, and consumer perception”
SPSD II - Part I - Sustainable production and consumption patterns - Agro-Food 31
Belgian market surveys), obtained during a 2002 fish campaign "Fish or fish"; (3) a consumer questionnaire survey, performed in March 2003 by the Department of Agricultural Economy of the Faculty of Bioscience Engineering; (4) the food consumption data of 3200 Belgian consumers of at least 15 years old, collected by the Belgian National Food Consumption Survey (BNFCS) of 2004 (De Vriese et al., 2006), data available very recently and not yet adapted for our intake assessment program. The results of interest are shown in Table I.8. Table I. 9 The frequency (%) of fish consumption by Belgian and Flemish populations Research Frequency of fish consumption Weekly or
more Less than weekly
Weekly or more
Less than weekly
Weekly or more
Less than weekly
Total population (%) Men (%) Women (%) Adolescent data (1997) 63.9 36.1 62.8 37.2 64.6 35.4 Belgian adult data (2004) 93.7 6.3 90.6 9.4 94.4 5.6 Consumer questionnaire 2003 (Flanders) 56.9 43.1 50.7 49.3 59.9 40.1
Health Interview Survey 2001 (Belgium) 54.7 45.3 54.4 45.6 55.0 45.0
Health Interview Survey 2001 (Flanders) 55.6 44.4 55.5 44.5 55.8 44.2
Belgian National Food Consumption Survey (BNFCS) 2004
77.8 22.2 79.5 20.5 76.2 23.8
A second comparison is possible on the level of the amount of seafood consumed per week. Data from the literature – in comparison with the adolescent and Belgian adult data – are given in table I.9. The intake of the Belgian adults seems rather high when compared to the Netherlands and Germany. A probable explanation is that the study populations used in the research of Welch et al. (2002) contains a higher percentage of non-consumers of seafood products. Remember that the Belgian adult data set calculated from the SEAFOODplus data contains only people who declared to be seafood consumer. Table I. 10 Mean weekly seafood consumption (g/week) for Belgium and three neighbouring countries. Data extracted from Welch et al., 2002 Mean weekly seafood consumption (g/week) Women Men Belgium, adolescents 99.1 119.5 Belgium, adults (calculated from SEAFOODplus) 219.9 204.1 Belgium, BNFCS 161.7 179.2 The Netherlands, Bilthoven 93.1 123.2 The Netherlands, Utrecht 93.8 NA France, South Coast 282.8 NA France, South 245.0 NA France, North-west 366.8 NA France, North-east 266.0 NA Germany, Heidelberg 111.3 118.3 Germany, Postdam 139.3 168.0 NA: not available Finally, since fish and seafood products are food items which are not consumed on a daily basis, food consumption data gathered over only one or two days will not give sufficient information on the individual level and are, therefore, not quite suitable for our intake assessment model. Food consumption data of other subpopulations than those described

Project CP/56 - “Integrated evaluation of marine food items: nutritional value, safety, and consumer perception”
SPSD II - Part I - Sustainable production and consumption patterns - Agro-Food 32
above, e.g. a data base of 641 women, aged 18 to 39 years, randomly selected from the population register of Ghent, are available. Their dietary assessment was performed on the basis of a 2-day food record during the year 2002 (January 29th until December 22nd), covering the four seasons. The answers showed that only 301 women (47%) consumed seafood on the two days covered by the food record. This figure is much lower than that obtained in the BNFCS, confirming that such short term food consumption data are not representative for the overall seafood consumption. Nevertheless, statistical techniques exist which use food frequency data to convert short term consumption data to long term (Hoffmann et al., 2002; Nusser et al., 1996; Wallace et al., 2005). 2.5 References Brunsø K, Fruensgaard L, Honkanen P, Olsen SO, Pieniak Z, Scholderer J, and Verbeke W. Seafood Consumption: Explaining Attitudes, Preferences, and eating Habits Across consumer Segments in Europe. 2005. Deliverable 2, Project 2.1, SEAFOODplus.
De Backer G. Nutrition and Health: an Interuniversity study. Regional differences in dietary habits, coronary risk factors and mortality rates in Belgium. I. Design and Methodology. Acta Cardiol 1984; 39:285-292.
De Vriese SR, Huybrechts I, Moreau M, Van Oyen H. De Belgische Voedselconsumptiepeiling 1-2004. IPH/EPI REPORTS N° 2006 - 016. 2006. Brussels, Scientific Health Institute, Department of Epidemiology.
Food Standards Agency. McCance and Widdowson's. The composition of foods, Sixth summary edition. Cambridge: Royal Society of Chemistry, 2002.
Hoffmann K, Boeing H, Dufour A, Volatier JL, Telman J, Virtanen M et al. Estimating the distribution of usual dietary intake by short-term measurements. Eur J Clin Nutr 2002; 56 Suppl 2:S53-S62.
Honkanen P, Olsen SO, Brunsø K, Verbeke W, Scholderer J, Fruensgaard L, Pieniak Z.. Testing and validating the measurement scales. 2005. Deliverable 4, Project 2.1, SEAFOODplus.
Kornitzer M, Dramaix M. The Belgian Interuniversity Research on Nutrition and Health (B.I.R.N.H.): general introduction. For the B.I.R.N.H. Study Group. Acta Cardiol 1989; 44(2):89-99.
Matthys C, De Henauw S, Devos C, De Backer G. Estimated energy intake, macronutrient intake and meal pattern of Flemish adolescents. Eur J Clin Nutr 2003; 57(2):366-375.
Nusser SM, Carriquiry AL, Dodd KW, Fuller WA. A semiparametric transformation approach to estimating usual daily intake distributions. Journal of the American Statistical Association 1996; 61:1440-1449.
Wallace L, Williams R. Validation of a Method for Estimating Long-Term Exposures Based on Short-Term Measurements. Risk Analysis 2005; 25(3):687-694.
Welch AA, Lund E, Amiano P, Dorronsoro M, Brustad M, Kumle M et al. Variability of fish consumption within the 10 European countries participating in the European Investigation into Cancer and Nutrition (EPIC) study. Public Health Nutr 2002; 5(6B):1273-1285.

Project CP/56 - “Integrated evaluation of marine food items: nutritional value, safety, and consumer perception”
SPSD II - Part I - Sustainable production and consumption patterns - Agro-Food 33
PART II. PROBABILISTIC INTAKE ASSESSMENT OF NUTRIENTS AND CONTAMINANTS VIA FISH, AND BENEFIT-RISK ASSESSMENT
1. INTAKE ASSESSMENT 1.1. Introduction Nutrient and/or contaminant intake assessments can be performed by combining food consumption data with nutrient and/or contaminant concentration data in food items, and this according to different approaches: deterministic or probabilistic. In a deterministic approach, a single “best guess” or “worst case” point estimate of each input parameter (consumption and concentration data) is used. In a probabilistic intake assessment, the variability of all the input parameters can be accounted for by using probability distributions, defined by a model (e.g. normal, lognormal, …) with some parameters (e.g. mean, standard deviation, …). A probability distribution allows making interpolations between and beyond observed data points. As such, every possible value of the input parameter is taken into account (Cullen et al., 1999; Gilsenan et al., 2003). The result of a probabilistic intake assessment is a probability distribution giving an insight in the variability of the assessed intake in a population. In this project, the probabilistic intake assessment is applied. In the first section of this part of the report, the methodology used for the calculation of the intake assessment will be explained, including the general principles of the probabilistic approach as well as some information about the software program used. Next, the results of the intake simulations will be shown and described, followed by a discussion and conclusions. 1.2. Methodology: a probabilistic intake procedure
1.2.1. General principles and steps The probabilistic intake procedure consists of several steps. (1) Definition of the intake model: intake is determined by a combination of the origin-dependent concentration of contaminants and nutrients in seafood products and the seafood quantities consumed. (2) The variability of the different input parameters (being the concentration, the consumption, and the body weight) has to be characterised. (3) The variability of the input parameters needs to be propagated through the model to determine the variability of the output, i.e. the intake of nutrients and contaminants. This is schematically visualised in figure II.1.

Project CP/56 - “Integrated evaluation of marine food items: nutritional value, safety, and consumer perception”
SPSD II - Part I - Sustainable production and consumption patterns - Agro-Food 34
Figure II. 1 Probabilistic intake assessment. Each curve represents the cumulative distribution of the parameter concerned
1.2.1.1 Intake model The combined dietary intake of nutrients and contaminants can be indirectly estimated based on the following parameters: (1) the concentration of the nutrients and contaminants in the food consumed and (2) the amount of food consumed. The following simulation model, combining fish consumption data with nutrient and contaminant concentrations, is used for the intake assessment of each nutrient and contaminant:
i
avtivtvai BWT
CXY
⋅⋅⋅
= ∑ ∑∑ ) b( ,,,av,
Yi the average dietary intake of nutrients and contaminants considered for individual i
(expressed in mg, µg, ng or pg TEQ (depending on the nutrient/contaminant considered) per kg bodyweight and per day),
bv,a the probability determining whether food item v origins from region a (bv,a is equal to 0 or 1 depending on the region),
Xv,i,t the amount of food item v consumed by individual i on day t (expressed in g per day), Cv,a the concentration of a nutrient/contaminant in food item v coming from region a
(expressed in mg, µg, ng or pg TEQ/g food item (depending on the nutrient/contaminant considered)),
BWi body weight of individual i (expressed in kg), T the number of days of the study over which the sommation is made (expressed in
number of days).
1.2.1.2 Variability representation A probabilistic approach is essential to represent the complexity of real occurring situations and takes into account the variability of the consumption, the body weight and the concentration data. There are two approaches to characterise the variability of a parameter: parametric and nonparametric. Parametric methods assume that the data come from a fixed underlying distribution. This assumption enables to work with smaller sample sizes. Nonparametric methods rely on the data points themselves. This makes them less vulnerable
...
i
avtivtvai BWT
CXY
⋅⋅⋅
= ∑∑∑ ) b( ,,,av,
…
i
avtivtvai BWT
CXY
⋅⋅⋅
= ∑∑∑ ) b( ,,,av,
...
Food- consumption-data
Intake model
Concentration data
Intake

Project CP/56 - “Integrated evaluation of marine food items: nutritional value, safety, and consumer perception”
SPSD II - Part I - Sustainable production and consumption patterns - Agro-Food 35
to deviations from certain distribution assumptions but more vulnerable to deviations in the data points (such as outliers). We used graphical plots like histograms and scatter plots to explore the different parameter data in order to select a parametric or a nonparametric distribution. A parametric distribution was selected using best fitting criteria – such as goodness-of-fit tests – and expert knowledge. As far as the adolescent consumption data are concerned, the variability of the consumption and body weight data is taken into account in a non-parametric way (i.e. all the individual data points are used as such instead of assuming an underlying (parametric) probability distribution). This was possible as the number of individuals is large enough to assume that they are representative enough for the underlying population. For the Belgian adult data, the body weight data were included in a parametric way as the body weight of the individuals was not known. The variability of the nutrient and contaminant concentrations is also taken into account by representing them by parametric probability distributions. The choice for parametric models was justified by the lack of sufficient data points for most fish species. The best fitting distribution was selected for each concentration data set.
1.2.1.3 Correlations between parameters Correlations between input data are important for subsequent Monte Carlo simulation, where the different parameters will be combined. Vose's 'cardinal rule of risk analysis modelling' is "Every iteration of a risk analysis model must be a scenario that could physically occur" (Vose D., 1996). An obvious example is when in a parametric procedure a high body weight is selected at random. A higher consumption rate of fatty food products will then be more likely than a small consumption rate, at least if the body weight is highly correlated with fat intake. Therefore, one of the restrictions that must be placed on the model is to recognise inter-dependencies between its uncertain components. There are a number of correlations between the parameters of the intake model to be considered. First, any correlation between the consumption rate and the body weight is already accounted for in the non-parametric approach as each individual its consumption rate is divided by its corresponding body weight. Second, the consumption rate was assumed to be independent from the concentration. Third, it was deemed necessary to investigate if any within-species/within-region correlation exists between the different nutrient and contaminant concentrations. The data in the data base did not allow looking for such a correlation, since for that purpose, several nutrient and contaminant data samples need to be measured in the same fish species sample. This was not the case. Alternatively, a literature study was elaborated on that topic: a) Correlation between contaminant and fat concentration In different publications, several factors are considered to influence the contaminant concentration of a species within a region: season, sex, age, weight and length of the fish and lipid content (Cleemann et al., 2000; Falandysz et al., 2004). Age, for example, influences clearly the body burden of pollutants by the longer exposure time (Falandysz et al., 2004). Vuorinen et al. (Vuorinen et al., 2002) measured dioxin and PCB concentration in sprat as well as in herring. No significant correlations were found by them between fat content and the fresh-weight concentrations of PCBs and dioxins. Wiesmuller and Schlatterer (Wiesmuller et al., 1999) measured PCBs and dioxins concentrations in eels and also reported that no correlations could be found between the latter and the fat content. Conversely, Bressa et al. stated that the PCB concentration that they measured in eel was correlated with fat concentrations in muscle tissue, but did not mention any r²-value (Bressa et al., 1997). Fromme et al. (Fromme et al., 1999) analysed the PCB concentration in 58 eel samples and

Project CP/56 - “Integrated evaluation of marine food items: nutritional value, safety, and consumer perception”
SPSD II - Part I - Sustainable production and consumption patterns - Agro-Food 36
found a correlation between the fat content and the concentration of the PCBs (r=0.36; p<0.001). In conclusion, it is hard to find data valuable to investigate the correlation between contaminant concentrations and fat concentrations within a species of a certain region. Therefore, it was decided not to take this in consideration in this study. Moreover it was not possible to take into account the origin of every fish species considered, which made it impossible to determine a realistic correlation factor (r or r²). b) Correlation between nutrient and fat concentration b.1. At the level of the fatty acid concentration Several studies have established that the concentrations of fatty acids are influenced by the size of the fish, the geographic location, the age, the sex maturity, the season, the salinity and temperature of the aquatic environment, the reproductive status, the diet (availability and composition of food) and the fat content (Candela et al., 1997; Celik et al., 2005; Ibrahim Haliloglu et al., 2004; Rasoarahona et al., 2005). Espe et al. (Espe et al., 2002) measured the fat and fatty acid concentration in ocean-ranched and farmed salmon. They found that EPA and DHA showed opposite trends to one another in that the leaner the fillet, the less EPA (r=0.62) and the more DHA (r=0.64). Conversely, in a study on muscle lipids of common carp, a high correlation was found between the fat content and the total PUFA content, with correlation factors near 0.9 (Rasoarahona et al., 2004). Nevertheless, since there was no consensus and since no species-specific data are available to determine correlation factors, this correlation was not taken into account. b.2. At the level of the vitamin D concentration Only few data are published about the relation between fat content of the fish and vitamin D concentration. Kenny et al. (Kenny et al., 2004) mentioned that higher fish lipid content should lead to a higher storage of vitamin D. Nevertheless, Matilla et al. (Mattila, 1995; Mattila et al., 1995; Mattila et al., 1997), who did a lot of research on vitamin D concentration in different food items, stated in different publications that the correlation between fat and vitamin D contents in the fish and fish products was statistically insignificant, and that even lean fish contained remarkable amounts of this vitamin. As a consequence, no correlation between the fat content and the vitamin D concentration was taken into account.
1.2.1.4 Variability propagation Once the variability of the different input parameters is characterised, this information can then be propagated through the intake model by means of a Monte Carlo simulation. Monte Carlo simulation In each run of the Monte Carlo simulation, random parameter values are drawn from the input distributions of the contaminant and nutrient concentrations. Once the samples from each input distribution are selected, the set of samples is entered into the intake model. The model is then solved as if one would do for any deterministic analysis. Each individual model result is stored and the process is repeated until the specified number of model iterations is completed. Instead of obtaining a discrete number of model results (as in a deterministic simulation), a set of output results is obtained, which are all together used to characterise an output distribution (Cullen et al., 1999). In this way, difficulties to estimate model input parameters and to take into account the inherent variability in specific processes are overcome. The uptake from the different sources (different fish species) and the different days were summed per individual according the intake model. Finally, several summary statistics can be calculated. For example, a mean per day was calculated by dividing the total intake by the number of days of the consumption study.

Project CP/56 - “Integrated evaluation of marine food items: nutritional value, safety, and consumer perception”
SPSD II - Part I - Sustainable production and consumption patterns - Agro-Food 37
Extension of the food consumption data base (increasing the number of calculated intakes) For the purpose of optimising integration of respectively the intra-individual and inter-individual variability in food consumption in the overall exposure assessment model and to obtain an adequate coverage of the contaminant or nutrient concentration variability on population level, (1) the number of individuals can be artificially extended and (2) the consumption data per individual can be extended in time (by simply copying the data). First, the consumption data base can be repeated several times, just by using successively the complete consumption file several times and so increasing the number of calculated intakes and output data points. This may be required to obtain an adequate coverage of the contaminant or nutrient concentration variability on population level. This can be explained as follows: when for example swordfish is only consumed by one individual in the whole consumption data base, only one sample will be taken out of the concentration distributions of swordfish. As a result, the variability of the concentration distribution will not be well described. When using the consumption data several times, more samples will be taken, resulting in a better description of the probability distribution. Using the adolescent consumption data base e.g. 5 times will lead in the end to intake data for 5 times 341 individuals. Increasing the number of usages leads to an increased number of calculated intakes (having a consumption database of e.g. 341 individuals will lead in the end to intake data of a whole number of multiplications of those 341 individuals, being for example, 682, 1023, 3410, 6820, …) Increasing the number of individuals leads to an increased number of output data points. Second, the usage of the consumption data per individual can also be increased, leading to the possibility to expand the consumption data of every individual to a larger number of days. This implies that when having consumption data of three days per individual, the same data can be used different times consecutively, pretending that you have for example 12 days per individual. This may be required to obtain an adequate coverage of the contaminant or nutrient concentration variability on individual level. As such, less extreme intakes will result. In contrast to what happens when repeating the consumption data several times, increasing the number of days per individual will not increase the total number of output data points. This is explained by the fact that during the further processing of the calculations, the mean calculated intake over the different days is calculated as the final output result (see formula in Part II.1.2.1.1). Nevertheless, the higher the number of intakes to be calculated, the longer it will take to execute the analysis. For the purpose of optimising this process, convergence plots were made. Figure II.2 shows an example of a convergence graph used to determine the optimal number of intakes to be calculated, based on the adolescent consumption data.

Project CP/56 - “Integrated evaluation of marine food items: nutritional value, safety, and consumer perception”
SPSD II - Part I - Sustainable production and consumption patterns - Agro-Food 38
Figure II. 2 Convergence graph for the median intake of dl PCBs in function of the number of individuals taken into account Figure II.2 shows the calculated median of the dl PCB intake of the consumers in the adolescent data base in function of the number of consumers taken into account. It is clear that the oscillations decrease when the number of consumers increases, leading in the end to a good convergence. The same can be done for other compounds as well as for other percentiles (e.g. 95th percentile). Using this procedure for the adolescent consumption data, it was decided to extend the number of individuals artificially to 3410 (by copying individuals 10 times) and the 7-day diary per individual to a fictive 35-day diary (by simply copying the diary per individual five times). The former procedure accounted predominantly for the uncertainty arising from a limited sample size in the consumption data. The latter procedure increased the likelihood of a good description of the variability of the nutrient/contaminant concentration on the level of individual intake assessment. This led to a total of 119,350 intakes to be calculated. Using this procedure with regard to the Belgian adult consumption data, it was decided to extend the number of individuals artificially to 8210 (by copying individuals 10 times) and the 1-week consumption pattern to a 10-week consumption pattern (by simply copying the data per individual ten times). This led to a total of 82,100 intakes to be calculated.
Number of consumers taken into account
Med
ian
of th
e dl
PC
B in
take
(pg
TEQ
/kg
body
wei
ght /
day)

Project CP/56 - “Integrated evaluation of marine food items: nutritional value, safety, and consumer perception”
SPSD II - Part I - Sustainable production and consumption patterns - Agro-Food 39
1.2.2. Software program To execute such probabilistic simulations for a wide range of food-related risks, a software program was developed at Ghent University, called ProbIntakeUG. This program combines each data point out of a consumption data base with concentration data of multiple compounds in order to calculate a combined intake assessment. More information can be found in the technical manual (Van Thuyne et al., 2006)). 1.3. Results The probabilistic combination of seafood consumption data, body weight data and nutrient/contaminant concentration data results in a distribution of nutrient/contaminant intake via seafood by the population under study. These results are presented in different ways. A first visualisation is made by cumulative probability plots, which can express the intake of the whole population or can focus only on the seafood consumers. These plots also show the reference intake values for the different nutrients/contaminants considered (for explanation see Part II.2.1 and II.2.2). The second way to present the results includes statistics of the numerical data in table format. Both ways will be used here. A third way focuses on the correlation between the intakes of different compounds using scatter plots to visualize the results. The first part of this result section (1.3.1) is based on the food consumption data base of the Flemish adolescents, the second part (1.3.2) is based on the food consumption data from Belgian adults collected in the SEAFOODplus project. It should be emphasized that in both cases the simulation results only describe the intake via seafood and neglect the intake via other dietary sources or other ways. The reference intake values concern the total intake (for discussion see Part II.1.4). 1.3.1. Intake assessment for the Flemish adolescent via seafood consumption From the 341 adolescents in the food consumption data base, 123 (36%) did not consume any seafood during the week of the study and as such their calculated intake for each nutrient and contaminant through seafood consumption was equal to zero. The graphs below will therefore represent only the intake of the seafood consumers’ population, being 64% of the whole study group. The results in the tables are given both for the whole population and the consumers-only population.
1.3.1.1. Distribution of the nutrient intake via seafood The simulated intake of EPA&DHA, vitamin D and iodine via seafood consumption for the Flemish adolescents is given below. Also the fat intake via seafood is calculated, but these results are not described in detail, since many other food items in the adolescent’s diet contribute to the fat intake. The intake of fat via seafood will be of interest when correlations between different compounds are described.

Project CP/56 - “Integrated evaluation of marine food items: nutritional value, safety, and consumer perception”
SPSD II - Part I - Sustainable production and consumption patterns - Agro-Food 40
Figures II.3 and 4 show that only a small part of the population achieves, via the consumption of seafood, the nutritional recommendation for EPA&DHA and vitamin D intake. Figure II.5 indicates that almost none of the adolescents achieve the recommendation for iodine when only seafood items are taken into account for the intake assessment
Figure II. 5 Cumulative probability graph of the intake of iodine (µg/kg bw/day) via seafood consumption for Flemish adolescents (consumers-only). The total recommended intake is set at 2.54 µg/kg bw/day Table II.1 summarizes the intake assessment of the different nutrients of interest for the whole adolescents’ population as well as for the consumers only. The figures higher than the recommended daily amount (RDA) are indicated in bold.
Figure II. 4 Cumulative probability graph of the intake of vitamin D (µg/kg bw/day) via seafood consumption for Flemish adolescents (consumers-only). The recommended intake is set at 0.085 µg/kg bw/day
Figure II. 3 Cumulative probability graph of the intake of EPA&DHA (mg/kg bw/day) via seafood consumption for Flemish adolescents (consumers-only). The recommended intake is set at 12.2 mg/kg bw/day

Project CP/56 - “Integrated evaluation of marine food items: nutritional value, safety, and consumer perception”
SPSD II - Part I - Sustainable production and consumption patterns - Agro-Food 41
Table II. 1 Summary of the intake assessment for nutrients via seafood consumption for the adolescents (The figures higher than the RDA are indicated in bold) EPA&DHA
(mg/kg bw/day) Vitamin D
(µg/kg bw/day) Iodine
(µg/kg bw/day) All Consumers All Consumers All Consumers Mean 1.7430 2.7264 0.0095 0.0148 0.2780 0.4349 S.D. 2.8818 3.2110 0.0217 0.0257 0.4665 0.5217 25th percentile 0.0000 0.6505 0.0000 0.0014 0.0000 0.0738 50th percentile 0.5612 1.5645 0.0010 0.0051 0.0606 0.1991 75th percentile 2.1085 3.1723 0.0079 0.0168 0.3332 0.6771 90th percentile 5.3084 7.5948 0.0302 0.0458 0.9431 1.1891 95th percentile 8.4431 10.0346 0.0518 0.0639 1.3164 1.4594 97.5th percentile 10.7390 12.0476 0.0691 0.0849 1.5195 1.7427 99th percentile 13.9947 14.6088 0.0955 0.1096 2.0696 2.4265 (S.D.: standard deviation) A combined cumulative graph is shown in figure II.6. In order to plot the intakes of the different nutrients together, they first need to be normalised by taking the ratio of the intakes over their RDA. Afterwards, the data were transformed logarithmically. As a result, all the normalized intakes of nutrients higher than zero (since it is a logarithmic graph) are favourable, since they achieve the RDA. It is clear that only for a very small percentage of the studied population, the considered nutrient intakes via seafood alone are above the recommendation.
Figure II. 6 Combined cumulative plot of the ratio of the intake on the RDA for three nutrients (log transformed) via seafood consumption (Flemish adolescents)
1.3.1.2. Distribution of the contaminant intake via seafood
Figures II.7 and II.8 show the intake assessment of respectively mercury and methyl mercury via seafood for the adolescent population. The reference value showed on these graphs is the Tolerable Daily Intake (TDI) for methyl mercury in both cases. This means that even when all the mercury in fish should be present in its most toxic form, i.e. organic methyl mercury, only a very small percentage of the study population would exceed this TDI. As the concentration of methyl mercury in seafood is assessed to be smaller than the mercury concentration, the assessed intake is also lower which results in a smaller percentage of people exceeding the
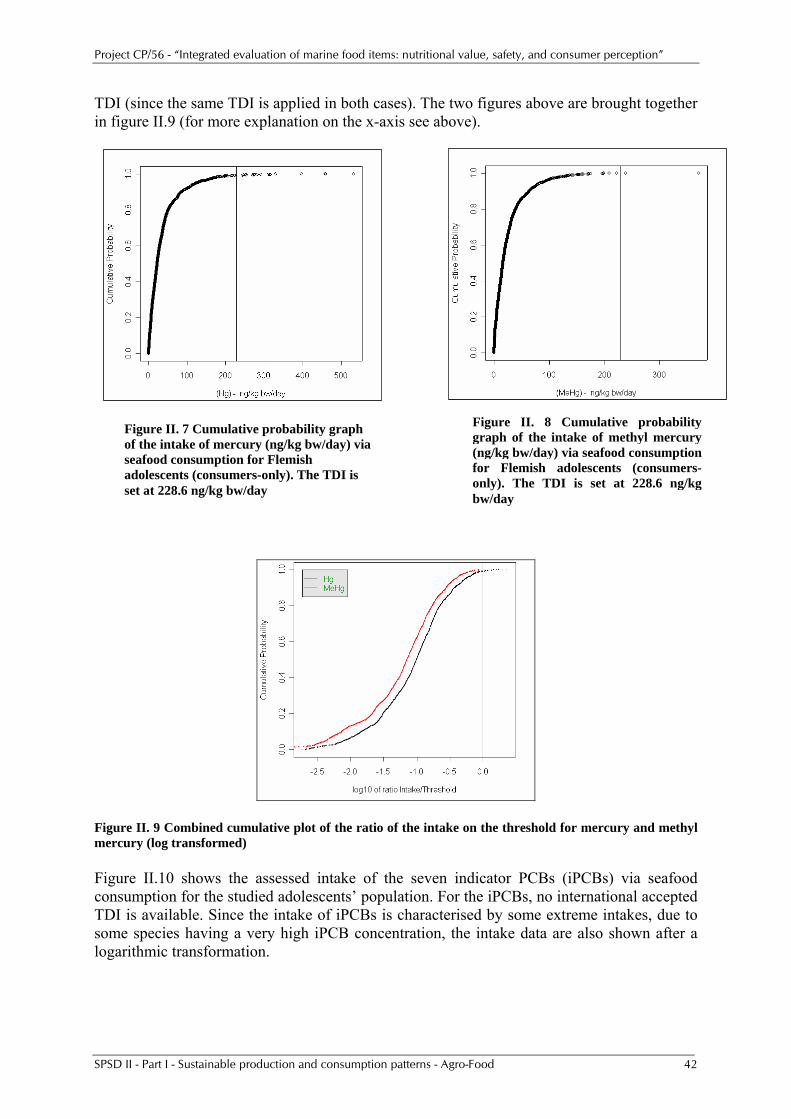
Project CP/56 - “Integrated evaluation of marine food items: nutritional value, safety, and consumer perception”
SPSD II - Part I - Sustainable production and consumption patterns - Agro-Food 42
TDI (since the same TDI is applied in both cases). The two figures above are brought together in figure II.9 (for more explanation on the x-axis see above).
Figure II. 9 Combined cumulative plot of the ratio of the intake on the threshold for mercury and methyl mercury (log transformed)
Figure II.10 shows the assessed intake of the seven indicator PCBs (iPCBs) via seafood consumption for the studied adolescents’ population. For the iPCBs, no international accepted TDI is available. Since the intake of iPCBs is characterised by some extreme intakes, due to some species having a very high iPCB concentration, the intake data are also shown after a logarithmic transformation.
Figure II. 7 Cumulative probability graph of the intake of mercury (ng/kg bw/day) via seafood consumption for Flemish adolescents (consumers-only). The TDI is set at 228.6 ng/kg bw/day
Figure II. 8 Cumulative probability graph of the intake of methyl mercury (ng/kg bw/day) via seafood consumption for Flemish adolescents (consumers-only). The TDI is set at 228.6 ng/kg bw/day

Project CP/56 - “Integrated evaluation of marine food items: nutritional value, safety, and consumer perception”
SPSD II - Part I - Sustainable production and consumption patterns - Agro-Food 43
Figure II. 10 Cumulative probability graph of the intake of iPCBs (ng/kg bw/day) via seafood consumption for Flemish adolescents (consumers-only); left: not transformed, right: logarithmic transformation By studying the assessed iPCB intake data, it became clear that all the values higher than 25 ng/kg bw/day resulted from the consumption data of two different adolescents. The highest intakes resulted from an individual who consumed 450 gram eel in the week of the study, which is rather eceptional. It is noticeable that he was the only one of the 341 studied adolescents who consumed eel during the week of the study. The second adolescent with a rather high iPCB intake consumed during the week of the study 135 gram crab, 135 gram scampi’s and 30 gram brown shrimps. Figure I.6 in Part I indicated that eel and crab are those species with the highest iPCB load. The graphs below show the assessed intake of the different dioxin-like compounds as well as the combined figure (figures II.11-14). In all cases, the TDI value for the intake of the total of dioxin-like compounds is applied.

Project CP/56 - “Integrated evaluation of marine food items: nutritional value, safety, and consumer perception”
SPSD II - Part I - Sustainable production and consumption patterns - Agro-Food 44
It is important to mention that the intake assessment for the three different compounds all start from a different data base. As such, there is no direct link between the dlPCB, the dioxin and the total TEQ concentrations. As a result, the intake of total dioxin-like compounds (fig.II.13) is not equal to the sum of the intake assessment for dlPCBs and dioxins. The extreme high intake results for dlPCB (higher than 6.1 pg TEQ/kg bw/day) and total TEQ (higher than 9.0 pg TEQ/kg bw/day) belong to the adolescent who consumed 450 gram eel in the week of the study. Figure II.14 shows that the percentage of the population exceeding the TDI is highest for the total of dioxin-like compounds, followed by dl PCBs and dioxins.
Figure II. 11 Cumulative probability graph of the intake of dlPCBs (pg TEQ/kg bw/day) via seafood consumption for Flemish adolescents (consumers-only). The TDI is set at 2 pg TEQ/kg bw/day
Figure II. 12 Cumulative probability graph of the intake of dioxins (pg TEQ/kg bw/day) via seafood consumption for Flemish adolescents consumers-only). The TDI is set at 2 pg TEQ/kg bw/day
Figure II. 13 Cumulative probability graph of the intake of total TEQ (pg TEQ/kg bw/day) via seafood consumption for Flemish adolescents (consumers-only). The TDI is set at 2 pg TEQ/kg bw/day
Figure II. 14 Combined cumulative plot of the ratio of the intake on the TDI for the three considered groups of dioxin-like compounds (log transformed) via seafood consumption (Flemish adolescents)

Project CP/56 - “Integrated evaluation of marine food items: nutritional value, safety, and consumer perception”
SPSD II - Part I - Sustainable production and consumption patterns - Agro-Food 45
In table II.2 an overview is given of the intake assessment results for the contaminants included in this study. The assessed intakes exceeding the TDI are indicated in bold. Table II. 2 Summary of assessed intakes of contaminants via seafood consumption for the adolescents (the assessed intakes exceeding the TDI are indicated in bold)
Hg MeHg iPCB dlPCB dioxin totTEQ ng/kg bw/day pg TEQ/kg bw/day All Cons. All Cons. All Cons. All Cons. All Cons. All Cons. Mean 23.64 36.98 16.81 26.29 3.13 4.89 0.36 0.57 0.23 0.35 0.48 0.75 S.D. 41.14 46.42 27.87 31.08 31.50 39.29 1.12 1.36 0.51 0.60 1.14 1.35 25th percentile 0.00 9.24 0.00 6.14 0.00 0.42 0.00 0.05 0.00 0.03 0.00 0.08 50th percentile 7.71 22.74 5.27 16.37 0.35 1.46 0.04 0.17 0.02 0.12 0.07 0.26 75th percentile 30.16 43.81 21.97 32.90 2.53 4.28 0.29 0.66 0.19 0.40 0.41 0.87 90th percentile 64.36 86.80 47.29 64.32 5.90 7.62 1.12 1.56 0.66 0.98 1.51 2.21 95th percentile 103.83 126.24 73.27 90.66 8.47 10.31 1.79 2.33 1.26 1.55 2.56 3.16 97.5th percentile 143.15 166.94 97.46 116.11 11.71 14.31 2.65 3.28 1.82 2.19 3.43 3.95 99th percentile 186.18 216.89 133.12 150.38 18.10 21.74 3.66 4.01 2.47 2.90 4.82 5.38
S.D.: standard deviation, Cons.: only seafood consumers The results in table II.2 show that the assessed mean intakes of all contaminants, calculated for the whole population, as well as for the seafood consumers only are far below the TDI. Exceeding of the threshold at the higher percentiles becomes relevant only for the different dioxin-like compounds. As the intake assessment depends on the concentration data of contaminants in fish, the intake of dlPCBs, dioxins and total TEQ has also been estimated excluding data from herring and salmon of the Baltic Sea. For many years, the Baltic has been contaminated by emissions of dioxins from paper and metal industry plants and waste incineration plants, as well as from rivers discharging into the Baltic, and other sources (Danish Veterinary and Food Administration, 2004), leading to higher concentrations in fish (Gallani et al., 2004). In order to reduce human consumption of dioxin-like compounds, the European Commission set in July 2002 a new maximum allowable concentration in edible parts of fish of 4 pg TEQ/gram fresh weight. Finland and Sweden got an exemption order until the end of 2006 to place on the domestic market fish from the Baltic region with higher dioxin levels. Therefore, in theory, fish caught in the Baltic Sea would not be available on the Belgian market. The scenario results below describe the intake under this assumption (Figures II.15 and Table II.3).
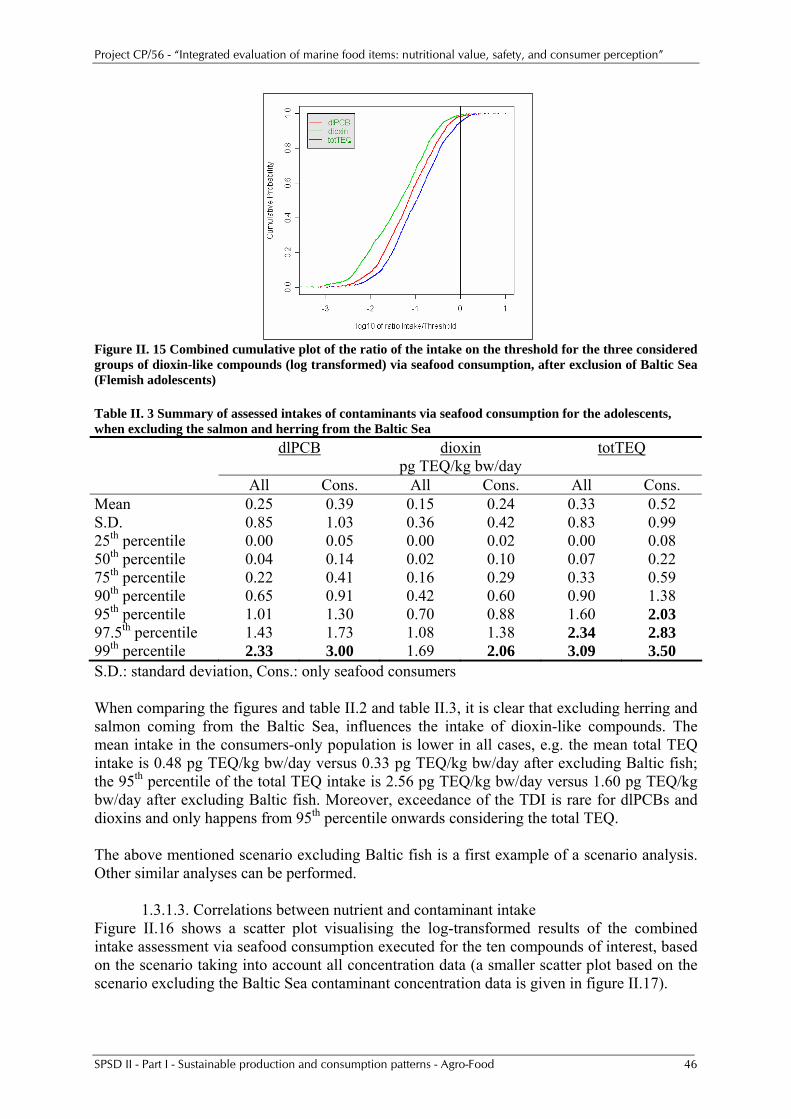
Project CP/56 - “Integrated evaluation of marine food items: nutritional value, safety, and consumer perception”
SPSD II - Part I - Sustainable production and consumption patterns - Agro-Food 46
Figure II. 15 Combined cumulative plot of the ratio of the intake on the threshold for the three considered groups of dioxin-like compounds (log transformed) via seafood consumption, after exclusion of Baltic Sea (Flemish adolescents) Table II. 3 Summary of assessed intakes of contaminants via seafood consumption for the adolescents, when excluding the salmon and herring from the Baltic Sea dlPCB dioxin totTEQ pg TEQ/kg bw/day All Cons. All Cons. All Cons. Mean 0.25 0.39 0.15 0.24 0.33 0.52 S.D. 0.85 1.03 0.36 0.42 0.83 0.99 25th percentile 0.00 0.05 0.00 0.02 0.00 0.08 50th percentile 0.04 0.14 0.02 0.10 0.07 0.22 75th percentile 0.22 0.41 0.16 0.29 0.33 0.59 90th percentile 0.65 0.91 0.42 0.60 0.90 1.38 95th percentile 1.01 1.30 0.70 0.88 1.60 2.03 97.5th percentile 1.43 1.73 1.08 1.38 2.34 2.83 99th percentile 2.33 3.00 1.69 2.06 3.09 3.50 S.D.: standard deviation, Cons.: only seafood consumers When comparing the figures and table II.2 and table II.3, it is clear that excluding herring and salmon coming from the Baltic Sea, influences the intake of dioxin-like compounds. The mean intake in the consumers-only population is lower in all cases, e.g. the mean total TEQ intake is 0.48 pg TEQ/kg bw/day versus 0.33 pg TEQ/kg bw/day after excluding Baltic fish; the 95th percentile of the total TEQ intake is 2.56 pg TEQ/kg bw/day versus 1.60 pg TEQ/kg bw/day after excluding Baltic fish. Moreover, exceedance of the TDI is rare for dlPCBs and dioxins and only happens from 95th percentile onwards considering the total TEQ. The above mentioned scenario excluding Baltic fish is a first example of a scenario analysis. Other similar analyses can be performed.
1.3.1.3. Correlations between nutrient and contaminant intake Figure II.16 shows a scatter plot visualising the log-transformed results of the combined intake assessment via seafood consumption executed for the ten compounds of interest, based on the scenario taking into account all concentration data (a smaller scatter plot based on the scenario excluding the Baltic Sea contaminant concentration data is given in figure II.17).

Project CP/56 - “Integrated evaluation of marine food items: nutritional value, safety, and consumer perception”
SPSD II - Part I - Sustainable production and consumption patterns - Agro-Food 47
On the diagonal axes of the scatter plot, frequency distributions of the intake assessments of all individual compounds are shown. At the left lower part of the diagonal, 45 scatter plots show the ratio of the intake of one compound to the intake of another one. In the triangle right-on top, the correlation coefficients between the intakes of respectively two different compounds are given; for ease of interpretation, the larger the font of the number shown, the larger the correlation coefficient. The highest correlations are found between the assessed intake of several fat-soluble compounds, e.g. r²(iPCBs versus dioxins) = 0.71, r²(total TEQ versus fat intake) = 0.77. The observed correlation coefficients can be explained (1) by the fact that a higher seafood consumption will lead in all cases to a higher nutrient and contaminant intake; and (2) people consuming more fatty fish species will have both a higher fat intake, as well as a higher intake of fat-soluble contaminants and nutrients, reflecting the fact that these substances are jointly present at the level of the seafood species themselves. A negligible correlation exists between the iodine intake and all the other compounds on the one hand and between (methyl) mercury and all the other compounds. Iodine and (methyl) mercury are not lipophilic and this is translated in the low correlation coefficients. In both figures (II.16-17), rather high correlations between PCBs and dioxins on the one hand and EPA&DHA on the other hand indicate that it is hard to achieve a higher intake of EPA&DHA via seafood consumption without resulting in higher intake of PCBs and dioxins.
Figure II. 16 Scatter plot visualising the log-transformed results of the combined intake assessment via seafood consumption for the ten compounds of interest (Flemish adolescents)

Project CP/56 - “Integrated evaluation of marine food items: nutritional value, safety, and consumer perception”
SPSD II - Part I - Sustainable production and consumption patterns - Agro-Food 48
Figure II. 17 Scatter plot visualising the log-transformed results of the combined intake assessment via seafood consumption for four compounds of interest, based on the scenario with exclusion of herring and salmon of the Baltic Sea (Flemish adolescents)
Figure II. 18 Combined cumulative plot of the ratio of the intake on the threshold for different nutrients and contaminants for the seafood consuming adolescents (without exclusion of data) Figure II.18 is based on the simulation results without data exclusion and shows that the percentage of the population of seafood consuming adolescents that is exceeding the threshold for total dioxin-like compounds is the highest. 1.3.2. Intake assessment for the Belgian adults via seafood consumption From the 821 respondents in the data base of Belgian adults, 52 (6.33%) individuals did not consume seafood.

Project CP/56 - “Integrated evaluation of marine food items: nutritional value, safety, and consumer perception”
SPSD II - Part I - Sustainable production and consumption patterns - Agro-Food 49
1.3.2.1. Distribution of the nutrient intake via seafood The intake of EPA&DHA, vitamin D and iodine via seafood was assessed for the group of Belgian adults. Figure II.19 shows a combined cumulative probability plot for the three nutrients of interest, expressed as the ratio of the intake to the RDA.
Figure II. 19 Combined cumulative plot of the ratio of the intake on the RDA for three nutrients (log transformed; seafood consumers only) via seafood consumption (Belgian adults) This graph shows that only a very limited percentage of the population achieve the RDA of EPA&DHA and vitamin D by the consumption of seafood. For iodine, this percentage is negligible. Table II.4 gives an overview of the intake assessment of the three different nutrients of interest for the studied adults. The figures given in bold are assessed intakes higher than the RDA for that nutrient. Table II. 4 Summary of the intake assessment for nutrients via seafood consumption for adults (the figures given in bold are assessed intakes higher than the RDA for that nutrient)
EPA and DHA Vitamin D Iodine (mg/kg bw/day) (µg/kg bw/day) (µg/kg bw/day) All Cons. All Cons. All Cons. Mean 3.531 3.769 0.023 0.024 0.334 0.356 S.D. 3.569 3.564 0.023 0.023 0.359 0.360 25th percentile 1.036 1.271 0.006 0.008 0.098 0.120
50th percentile 2.577 2.792 0.016 0.017 0.246 0.268
75th percentile 4.863 5.066 0.031 0.032 0.454 0.472
90th percentile 7.679 7.918 0.050 0.051 0.724 0.749
95th percentile 10.107 10.346 0.067 0.067 0.997 1.015
97.5th percentile 13.068 13.567 0.086 0.087 1.291 1.311
99th percentile 18.044 18.234 0.119 0.122 1.540 1.550
S.D.: standard deviation, Cons.: only seafood consumers
1.3.2.2. Distribution of the contaminant intake via seafood Figure II.20 shows the assessed intake of (methyl) mercury for a group of Belgian adults via seafood. The risk of exceeding the TDI is very small.

Project CP/56 - “Integrated evaluation of marine food items: nutritional value, safety, and consumer perception”
SPSD II - Part I - Sustainable production and consumption patterns - Agro-Food 50
Figure II. 20 Combined cumulative plot of the ratio of the intake on the TDI for mercury and methyl mercury (log transformed) via seafood consumption (Belgian adults) Persons with an extremely high mercury intake had rather high tuna consumption. This could be expected, since tuna is a species with a high mercury load. In figure II.21, the relation between the overall intake of mercury and the consumption of tuna is given. Only the data of one person with extreme high tuna consumption are excluded (tuna consumption of 187 g/day and overall Hg intake of 1756 ng/kg bw/day). When all consumers are taken into account, the correlation coefficient of this relation is 87.4%; when only taking into account the data of the tuna consumers the correlation coefficient is 90.3%
.
Figure II. 21 Two graphs about the relation between the tuna consumption and the overall mercury intake; left: data of all the consumers (n=768), right: data of the tuna consumers only (n=568) Figure II.22 gives the cumulative probability graph of the assessed iPCB intake via seafood consumption for the adult population.
y = 9.8412x + 91.543R2 = 0.9026
0
500
1000
1500
2000
2500
3000
3500
4000
0 50 100 150 200 250 300 350 400
Total Hg intake (ng/kg bw/week)
Tuna
con
sum
ptio
n (g
/wee
k)
y = 9.5182x + 119.04R2 = 0.8738
0
500
1000
1500
2000
2500
3000
3500
4000
0 50 100 150 200 250 300 350 400
Total Hg intake (ng/kg bw/week)
Tuna
con
sum
ptio
n (g
/wee
k)

Project CP/56 - “Integrated evaluation of marine food items: nutritional value, safety, and consumer perception”
SPSD II - Part I - Sustainable production and consumption patterns - Agro-Food 51
Figure II. 22 Cumulative probability graph of the intake of iPCBs (ng/kg bw/week) via seafood consumption for Belgian adults (consumers-only) Since eel is the species with the highest iPCB load, the relation between eel consumption and the overall iPCB intake is studied in detail (figure II.23). Considering (1) all individuals of the consumption data base and (2) the eel consumers only, gives a correlation coefficient of 82.4% and 89.4%, respectively, between the eel consumption and the overall iPCB intake.
Figure II. 23 Two graphs about the relation between the eel consumption and the overall iPCB intake; left: data of all the consumers (n=769), right: data of the tuna consumers only (n=148) Figure II.24 shows a combined graph of the intake for the different dioxin-like compounds via seafood consumption. It is clear that the intake of dioxin-like compounds via seafood consumption is higher for the studied adult population when compared to the adolescent population. Two plausible reasons are the higher overall seafood consumption of the adults and the higher consumption of fatty fish species, having a higher PCB and dioxin load.
y = 5.4486x + 9.3265R2 = 0.894
0
100
200
300
400
500
600
700
800
0 20 40 60 80 100 120 140
Eel consumption (g/week)
Tota
l iPC
B in
take
(ng/
kg b
w/w
eek)
y = 5.1203x + 23.637R2 = 0.8243
0
100
200
300
400
500
600
700
800
0 20 40 60 80 100 120 140
Eel consumption (g/week)
Tota
l iPC
B in
take
(ng/
kg b
w/w
eek)

Project CP/56 - “Integrated evaluation of marine food items: nutritional value, safety, and consumer perception”
SPSD II - Part I - Sustainable production and consumption patterns - Agro-Food 52
Figure II. 24 Combined cumulative plot of the ratio of the intake on the TDI for the three considered groups of dioxin-like compounds (log transformed) via seafood consumption (Belgian adults) In table II.5 an overview is given of the results of the intake assessment via seafood consumption for the different contaminants of interest. The assessed intakes exceeding the TDI are indicated in bold. Table II.6 gives the results of the intake assessment of dioxin-like compounds for the adult population after exclusion of the concentration data of herring and salmon from the Baltic Sea. Table II. 5 Summary of the intake assessment for contaminants via seafood consumption for the adults (the assessed intakes exceeding the TDI are indicated in bold) Hg MeHg iPCB dlPCB dioxin totTEQ ng/kg bw/day pg TEQ/kg bw/day All Cons. All Cons. All Cons. All Cons. All Cons. All Cons. Mean 55.8 59.6 42.7 45.6 6.4 6.8 0.81 0.87 0.47 0.50 0.94 1.00S.D. 90.3 92.1 63.6 64.7 12.7 13.0 0.96 0.96 0.52 0.52 1.04 1.0525th percentile 15.3 19.2 12.2 15.0 1.2 1.4 0.21 0.26 0.13 0.16 0.25 0.3250th percentile 36.3 39.5 28.7 31.2 3.1 3.4 0.54 0.59 0.32 0.35 0.62 0.6875th percentile 70.5 73.8 55.2 57.7 6.6 7.0 1.08 1.13 0.63 0.66 1.27 1.3490th percentile 119.6 122.9 91.8 94.7 13.8 14.5 1.86 1.91 1.09 1.13 2.11 2.1695th percentile 165.0 168.6 125.3 128.6 22.6 23.5 2.49 2.55 1.46 1.50 2.88 2.9597.5th percentile 216.2 222.9 164.9 167.6 35.0 36.5 3.16 3.23 1.88 1.93 3.54 3.6599th percentile 322.9 332.6 229.1 232.3 56.1 58.0 4.59 4.65 2.55 2.59 4.90 4.99S.D.: standard deviation, Cons.: only seafood consumers

Project CP/56 - “Integrated evaluation of marine food items: nutritional value, safety, and consumer perception”
SPSD II - Part I - Sustainable production and consumption patterns - Agro-Food 53
Table II. 6 Summary of the intake assessment for contaminants via seafood consumption for the adults after exclusion of the concentration data of herring and salmon from the Baltic Sea (the assessed intakes exceeding the TDI are indicated in bold) dlPCB dioxin totTEQ pg TEQ/kg bw/day All Cons. All Cons. All Cons. Mean 0.52 0.56 0.33 0.35 0.62 0.66 S.D. 0.66 0.67 0.38 0.38 0.70 0.70 25th percentile 0.13 0.16 0.09 0.11 0.17 0.21 50th percentile 0.33 0.36 0.21 0.23 0.41 0.45 75th percentile 0.68 0.71 0.43 0.46 0.82 0.86 90th percentile 1.20 1.23 0.76 0.78 1.41 1.46 95th percentile 1.67 1.71 1.03 1.06 1.93 1.98 97.5th percentile 2.21 2.25 1.32 1.36 2.43 2.49 99th percentile 3.05 3.09 1.87 1.89 3.14 3.17 S.D.: standard deviation, Cons.: only seafood consumers
1.3.2.3. Correlations between nutrient and contaminant intake Similar scatter plots as created on the basis of the intake assessment results for the adolescent study are shown here on the basis of the consumption data of a group of Belgian adults, (figure II.25 and 26).
Figure II. 25 Scatter plot visualising the log-transformed results of the combined intake assessment via seafood consumption for the ten compounds of interest (Belgian adults)

Project CP/56 - “Integrated evaluation of marine food items: nutritional value, safety, and consumer perception”
SPSD II - Part I - Sustainable production and consumption patterns - Agro-Food 54
Figure II. 26 Scatter plot visualising the log-transformed results of the combined intake assessment via seafood consumption after exclusion of concentration data of herring and salmon from the Baltic Sea (Belgian adults) In accordance to what was found on the basis of the adolescent food consumption data, high correlations are found between the intakes of different fat soluble compounds but not between hydrophilic and lipophilic compounds.
Figure II. 27 Combined cumulative plot of the ratio of the intake on the threshold for different nutrients and contaminants for the seafood consuming adults, without exclusion of concentration data
Project CP/56 - “Integrated evaluation of marine food items: nutritional value, safety, and consumer perception”
SPSD II - Part I - Sustainable production and consumption patterns - Agro-Food 55
Figure II.27 shows that the percentage of the seafood consuming adult population that exceeds the threshold is the highest when considering the intake of total dioxin-like compounds. These data are based on the scenario without exclusion of concentration data. 1.4. Discussion and conclusion It is clear on the basis of both studies (adolescents and adults), that both populations do not reach a sufficiently high intake for the three nutrients considered, as far as only seafood consumption is considered. Regarding the contaminants, contamination of seafood on the Belgian market with mercury does not seem to cause problems. Except for some exceptions, most of the individuals’ intakes stay far below the tolerated daily intake. In contrast, exceedance of the TDI was determined when considering the intake of dioxin-like compounds. However, exclusion of Baltic herring and salmon leads to lower assessed intakes of dioxin-like compounds. More information about the related benefits and risks is given in Part II.2. The intake of nutrients under study can be increased by increasing seafood consumption. At the same time, however, the intake of fat soluble contaminants will also increase. Therefore, when promoting seafood consumption, it must be sure that the intake of contaminants will not reach levels of toxicological concern. Results of scenario analyses considering this problem are described in Part II.2.3. 1.5. References Bressa G, Sisti E, Cima F. PCBs and organochlorinated pesticides in eel (Anguilla anguilla L) from the Po Delta. Marine Chemistry 1997; 58(3-4):261-266.
Candela M, Astiasaran I, Bello J. Effects of frying and warmholding on fatty acids and cholesterol of sole (Solea solea), codfish (Gadus morhua) and hake (Merluccius merluccius). Food Chemistry 1997; 58(3):227-231.
Celik M, Diler A, Kucukgulmez A. A comparison of the proximate compositions and fatty acid profiles of zander (Sander lucioperca) from two different regions and climatic conditions. Food Chemistry 2005; 92(4):637-641.
Cleemann M, Riget F, Paulsen GB, de Boer J, Klungsoyr J, Aastrup P. Organochlorines in Greenland lake sediments and landlocked Arctic char (Salvelinus alpinus). Sci Total Environ 2000; 245(1-3):173-185.
Cullen C, Frey HC. Probabilistic techniques in exposure assessment. New York: Plenum Press, 1999.
Danish Veterinary and Food Administration. Combined report on dioxin in salmon and herring form the Baltic Sea. 2004.
Espe M, Nortvedt R, Lie O, Hafsteinsson H. Atlantic salmon (Salmo salar, L) as raw material for the smoking industry. II: Effect of different smoking methods on losses of nutrients and on the oxidation of lipids. Food Chemistry 2002; 77(1):41-46.

Project CP/56 - “Integrated evaluation of marine food items: nutritional value, safety, and consumer perception”
SPSD II - Part I - Sustainable production and consumption patterns - Agro-Food 56
Falandysz J, Wyrzykowska B, Warzocha J, Barska I, Garbacik-Wesolowska A, Szefer P. Organochlorine pesticides and PCBs in perch Perca fluviatilis from the Odra/Oder river estuary, Baltic Sea. Food Chemistry 2004; 87(1):17-23.
Fromme H, Otto T, Pilz K, Neugebauer F. Levels of synthetic musks; bromocyclene and PCBs in eel (Anguilla anguilla) and PCBs in sediment samples from some waters of Berlin/Germany. Chemosphere 1999; 39(10):1723-1735.
Gallani B, Boix A. Dioxins and PCBs in Food and Feed: Data available to the European Commission. EUR 21093 EN. 2004.
Gilsenan MB, Lambe J, Gibney MJ. Assessment of food intake input distributions for use in probabilistic exposure assessments of food additives. Food Addit Contam 2003; 20(11):1023-1033.
Ibrahim Haliloglu H, Bayir A, Necdet Sirkecioglu A, Mevlut Aras N, Atamanalp M. Comparison of fatty acid composition in some tissues of rainbow trout (Oncorhynchus mykiss) living in seawater and freshwater. Food Chemistry 2004; 86(1):55-59.
Kenny DE, O'Hara TM, Chen TC, Lu ZR, Tian X, Holick MF. Vitamin D content in Alaskan Arctic zooplankton, fishes, and marine mammals. Zoo Biology 2004; 23(1):33-43.
Mattila P. Analysis of cholecalciferol, ergocalciferol and their 25-hydroxylated metabolites in food by HPLC. University of Helsinki, Department of Applied Chemistry and Microbiology, 1995.
Mattila P, Piironen V, Haapala R, Hirvi T, UusiRauva E. Possible factors responsible for the high variation in the cholecalciferol contents of fish. Journal of Agricultural and Food Chemistry 1997; 45(10):3891-3896.
Mattila P, Piironen V, Uusi-Rauva E, Koivistoinen P. Cholecalciferol and 25-hydroxycholecalciferol contents in fish and fish products. Journal of food composition and analysis 1995; 8:232-243.
Rasoarahona JR, Barnathan G, Bianchini JP, Gaydou EM. Annual evolution of fatty acid profile from muscle lipids of the common carp (Cyprinus carpio) in Madagascar inland waters. J Agric Food Chem 2004; 52(24):7339-7344.
Rasoarahona JRE, Barnathan G, Bianchini JP, Gaydou EM. Influence of season on the lipid content and fatty acid profiles of three tilapia species (Oreochromis niloticus, O-macrochir and Tilapia rendalli) from Madagascar. Food Chemistry 2005; 91(4):683-694.
Vose D. Quantitative risk analysis. A guide to Monte Carlo simulation modeling. 1996.
Vuorinen PJ, Parmanne R, Vartiainen T, Keinanen M, Kiviranta H, Kotovuori O et al. PCDD, PCDF, PCB and thiamine in Baltic herring (Clupea harengus L.) and sprat [Sprattus sprattus (L.)] as a background to the M74 syndrome of Baltic salmon (Salmo salar L.). Ices Journal of Marine Science 2002; 59(3):480-496.
Wiesmuller T, Schlatterer B. PCDDs/PCDFs and coplanar PCBs in eels (Anguilla anguilla) from different areas of the rivers Havel and Oder in the state of Brandenburg (Germany). Chemosphere 1999; 38(2):325-334.

Project CP/56 - “Integrated evaluation of marine food items: nutritional value, safety, and consumer perception”
SPSD II - Part I - Sustainable production and consumption patterns - Agro-Food 57
2. BENEFIT - RISK ASSESSMENT 2.1. Benefit 2.1.1. Recommended intakes Fish and seafood in general are natural dietary sources of long chain (LC) omega-3 polyunsaturated fatty acids (n-3 PUFAs), especially eicosapentaenoic acid (EPA) and docosahexaenoic acid (DHA). Seafood also contains proteins of high biological value, is rich in certain minerals (iodine and selenium) and vitamins (D and E), and low in saturated fatty acids and cholesterol. Recommendations to eat fish and other seafood are included in most national dietary guidelines (World Health Organization, 2003). Research into the frequency of seafood consumption, portions and quantity of nutrient intake via seafood is therefore important to investigate whether the contribution of seafood to our diet is sufficient or not. In order to evaluate whether the intake of nutrients is adequate, reference intake values have to be determined. These reference values are expressed as recommended daily or weekly intakes. The recommended intakes for nutrients used in this report are based on the recommendations formulated by the Belgian Health Council (Belgian Health Council, 2003) (see table II.7). It is important to mention that these thresholds refer to the intake via the total diet. In this study they are used to evaluate the intake of only one group of food items, namely seafood. The consumption of n-3 PUFAs is related to several health benefits: reduction of the risk of coronary heart disease, decrease in mild hypertension, prevention of certain cardiac arrhythmias and sudden death, drop in the incidence of diabetes and alleviation of the symptoms of rheumatoid arthritis. Moreover, it has been suggested that n-3 PUFAs play a vital role in the development and function of the brain, the photoreception and the reproductive system (Kris-Etherton et al., 2002; Kris-Etherton et al., 2003; Sidhu, 2003). An adequate intake of n-3 PUFAs is therefore necessary. For total fat and EPA&DHA, the recommendations are, respectively, 30% and 0.3% of the total energy intake per day. For adolescents, the mean energy intake calculated from the total food consumption data base was 2161.5 kcal/day and the mean body weight 59.1 kg (Matthys et al., 2003). Using these data, the recommended daily intake for EPA&DHA is 12.2 mg/kg bw/day and for total fat 1220 mg/kg bw/day. For Belgian adults, a mean body weight of 70 kg was applied. A mean energy intake of 2046 kcal was used, based on the data of the most recent Belgian Food Consumption Survey (De Vriese et al., 2006). This led to a recommended intake of 9.7 mg/kg bw/day for EPA&DHA and 971 mg/kg bw/day for total fat. A deficiency of vitamin D leads to rickets in children and osteomalacia in adults (Bender, 2002). Therefore, an adequate dietary intake of vitamin D is of great importance for young children, pregnant women, and elderly people. For vitamin D, the Belgian recommendation is 5 µg/day, i.e. 0.085 µg/kg bw/day for the adolescents and 0.071 µg/kg bw/day for the adults. Iodine is an essential trace element required for normal activity of the thyroid gland. Iodine deficiency causes mental defects, goitre, reproductive damage, childhood mortality, and hypothyroidism and hyperthyroidism (Hetzel, 1983). For iodine, 150 µg/day is recommended (2.54 µg/kg bw/day for the adolescents and 2.14 µg/kg bw/day for the adults).
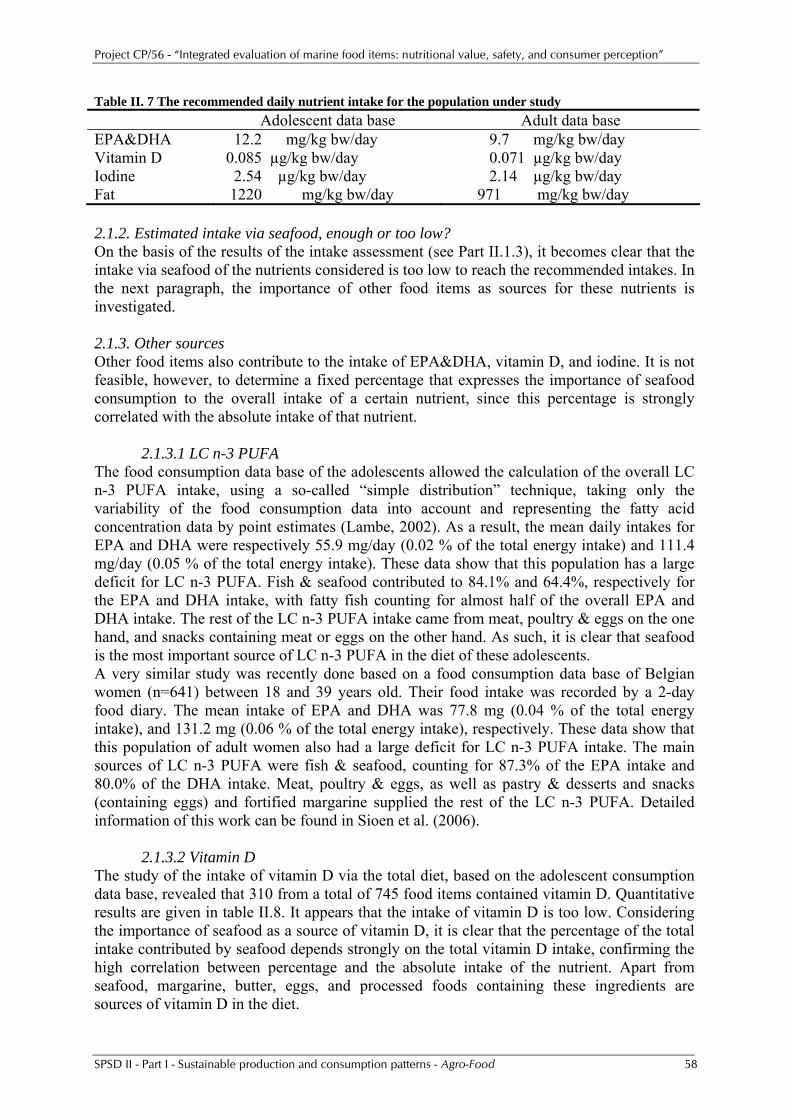
Project CP/56 - “Integrated evaluation of marine food items: nutritional value, safety, and consumer perception”
SPSD II - Part I - Sustainable production and consumption patterns - Agro-Food 58
Table II. 7 The recommended daily nutrient intake for the population under study Adolescent data base Adult data base EPA&DHA 12.2 mg/kg bw/day 9.7 mg/kg bw/day Vitamin D 0.085 µg/kg bw/day 0.071 µg/kg bw/day Iodine 2.54 µg/kg bw/day 2.14 µg/kg bw/day Fat 1220 mg/kg bw/day 971 mg/kg bw/day 2.1.2. Estimated intake via seafood, enough or too low? On the basis of the results of the intake assessment (see Part II.1.3), it becomes clear that the intake via seafood of the nutrients considered is too low to reach the recommended intakes. In the next paragraph, the importance of other food items as sources for these nutrients is investigated. 2.1.3. Other sources Other food items also contribute to the intake of EPA&DHA, vitamin D, and iodine. It is not feasible, however, to determine a fixed percentage that expresses the importance of seafood consumption to the overall intake of a certain nutrient, since this percentage is strongly correlated with the absolute intake of that nutrient.
2.1.3.1 LC n-3 PUFA The food consumption data base of the adolescents allowed the calculation of the overall LC n-3 PUFA intake, using a so-called “simple distribution” technique, taking only the variability of the food consumption data into account and representing the fatty acid concentration data by point estimates (Lambe, 2002). As a result, the mean daily intakes for EPA and DHA were respectively 55.9 mg/day (0.02 % of the total energy intake) and 111.4 mg/day (0.05 % of the total energy intake). These data show that this population has a large deficit for LC n-3 PUFA. Fish & seafood contributed to 84.1% and 64.4%, respectively for the EPA and DHA intake, with fatty fish counting for almost half of the overall EPA and DHA intake. The rest of the LC n-3 PUFA intake came from meat, poultry & eggs on the one hand, and snacks containing meat or eggs on the other hand. As such, it is clear that seafood is the most important source of LC n-3 PUFA in the diet of these adolescents. A very similar study was recently done based on a food consumption data base of Belgian women (n=641) between 18 and 39 years old. Their food intake was recorded by a 2-day food diary. The mean intake of EPA and DHA was 77.8 mg (0.04 % of the total energy intake), and 131.2 mg (0.06 % of the total energy intake), respectively. These data show that this population of adult women also had a large deficit for LC n-3 PUFA intake. The main sources of LC n-3 PUFA were fish & seafood, counting for 87.3% of the EPA intake and 80.0% of the DHA intake. Meat, poultry & eggs, as well as pastry & desserts and snacks (containing eggs) and fortified margarine supplied the rest of the LC n-3 PUFA. Detailed information of this work can be found in Sioen et al. (2006).
2.1.3.2 Vitamin D The study of the intake of vitamin D via the total diet, based on the adolescent consumption data base, revealed that 310 from a total of 745 food items contained vitamin D. Quantitative results are given in table II.8. It appears that the intake of vitamin D is too low. Considering the importance of seafood as a source of vitamin D, it is clear that the percentage of the total intake contributed by seafood depends strongly on the total vitamin D intake, confirming the high correlation between percentage and the absolute intake of the nutrient. Apart from seafood, margarine, butter, eggs, and processed foods containing these ingredients are sources of vitamin D in the diet.

Project CP/56 - “Integrated evaluation of marine food items: nutritional value, safety, and consumer perception”
SPSD II - Part I - Sustainable production and consumption patterns - Agro-Food 59
Table II. 8 The total vitamin D intake of the adolescents Vitamin D intake (µg/day) Total intake Intake via seafood Intake via non-seafood µg/day µg/day % of total intake µg/day % of total intakeMean 3.17 0.39 9.5 2.79 90.5 S.D. 1.56 0.81 15.8 1.31 15.8 Median 2.84 0.03 1.1 2.54 98.9 Minimum 0.46 0.00 0.0 0.46 30.9 Maximum 12.8 6.43 69.1 11.74 100.0
2.1.3.3 Iodine
For iodine, calculations as described for vitamin D and LC n-3 PUFA are not executed. Vitti et al. published in 2003 data about the iodine nutrition status of populations in different European countries, based on urinary iodine excretion. They indicated that the Belgian population is iodine deficient since the mean urinary iodine excretion is lower than 100 µg/L. Data about the iodine intake were found for Norway (Dahl et al., 2004), the United Kingdom (Lee et al., 1994) and Denmark (Rasmussen et al., 2002). In Norway, the calculated iodine intake was in the range of 100–250 mg/day in the majority of the adult population. The mean iodine intake was 136 mg/day among women and 176 mg/day among men. For children, the iodine intake was in the range of 100–120 mg/day. Milk and dairy products contributed approximately 55% and 70% of the dietary iodine intake in adults and children, respectively. Fish contributed more than 20% of the iodine intake in adults and about 10% in children. Iodisation of cow fodder has been mandatory in Norway since 1950 and provides an efficient alternative to universal salt iodisation (Dahl et al., 2004). In the UK, intake of iodine as estimated from a total diet study was 166 µg/day in 1991. Milk and milk products contributed to one third of iodine intake. Fish accounts for less than 10% of iodine intake (Lee et al., 1994). In Denmark, the iodine intake is lower than the recommendation. Milk and milk products alone contributed about 44% of the iodine intake; fish gave about 15% (Rasmussen et al., 2002). To compare, Vitti et al. (2003) stated that the iodine nutrition status in the UK is sufficient, that of Norway likely sufficient and that of Denmark as deficient. 2.2. Risk 2.2.1. Tolerated intakes The chronic exposure to mercury and methyl mercury potentially produces a series of toxic effects on the kidney, the endocrine, and the neurological system. Major attention is drawn towards developmental toxicity, mental deficiency, retarded development, and other neurological effects in infants whose mothers were exposed to methyl mercury during pregnancy. The Joint Expert Committee on Food Additives and Contaminants (JEFCA (WHO and FAO) 2003) proposes a tolerable weekly intake (TWI) for methyl mercury, of 1.6 µg/kg of bw/week (equal to a TDI of 0.228 µg/kg bw/day), taking into account the latest epidemiological results with regard to developmental toxicity (Crepet et al., 2005; EFSA, 2004). Based on similar observations, the US EPA set a reference dose (RfD) of 0.1 µg/kg bw/day (equal to 0.7 µg/kg bw/week). The United Kingdom Committee on Toxicity of Chemicals in Food, Consumer Products and the Environment (COT) adapted the JECFA reference value of 1.6 µg/kg bw/week when assessing the dietary exposure of women who are pregnant, and who may become pregnant within the following year (Scientific Advisory Committee on Nutrition et al., 2004). On the other hand, COT concluded that an intake of

Project CP/56 - “Integrated evaluation of marine food items: nutritional value, safety, and consumer perception”
SPSD II - Part I - Sustainable production and consumption patterns - Agro-Food 60
methyl mercury of 3.3 µg/kg bw/week may be used as a guideline to protect against non-development adverse effects. Within the context of a risk-benefit analysis concerning fish consumption, COT proposes to adapt this last intake limit for the rest of the population (Scientific Advisory Committee on Nutrition et al., 2004). In the context of this report, it is also noticeable that new evidence points to the possibility that methyl mercury should diminish the favourable health effect of the omega-3 PUFAs (Kris-Etherton et al., 2002). Two recent epidemiologic studies, investigating the association between methyl mercury exposure and ischemic heart disease, reported conflicting findings. One study showed a negative effect on coronary heart disease (CHD) in adult men (Guallar et al., 2002; Guallar et al., 2003). The other reported no association between methyl mercury exposure and CHD in a large cohort of male health professionals (Yoshizawa et al., 2002). Dioxins and PCBs are persistent environmental chemicals. A number of dioxin congeners, as well as the dlPCBs, produce toxic effects via the interaction with the cytoplasmatic aromatic hydrocarbon receptor (AhR). These effects include dermal toxicity, immunotoxicity, reproductive toxicity and teratogenicity, endocrine disruption, multiple organ toxicity, and carcinogenicity (Van den Berg et al., 2000). On the basis of toxic equivalence factors, a combined tolerated daily or weekly intake has been proposed for dioxin-like compounds by different authorities. Based on developmental toxicity in the animal, a WHO Expert Committee recommended two reference values, 1 or 4 pg TEQ/kg bw/day as a TDI (van Leeuwen et al., 2000). The EU proposes 2 pg TEQ/kg bw/day, or a TWI of 14 pg TEQ/kg bw/week (Gallani et al., 2004). This TDI, or TWI, is considered adequate to protect against other possible effects of dioxins, such as cancer and cardiovascular effects. COT also proposed a TDI of 2 pg TEQ/kg bw/day (COT, 2001) to protect against developmental toxicity, e.g. effects on the developing male reproductive system resulting from maternal exposure to dioxins. In line with its approach for methyl mercury, COT proposes a different guideline of 8 pg TEQ/kg bw/day, which should be appropriate when considered in relation to the most sensitive and relevant non-development effects of dioxin-like compounds (increased cancer risk). According to COT, this guideline level should be used for older women and males when considering risk-benefit aspects of fish consumption. The non-dioxin like PCBs (ndl-PCBs) produce a series of toxic effects, including cancer, similar to those produced by dioxins but via a different mechanism. Nevertheless, no health based guidance value for humans has been established for these ndl-PCBs. Because exposure to ndl-PCBs is generally accompanied by exposure to compounds with dioxin-like activity, the qualitative and quantitative interpretation of toxicological and epidemiological studies becomes quite hazardous. Furthermore, the data base on effects of individual ndl-PCB congeners is rather limited (EFSA, 2005). The health based advice is, therefore, that the intake of ndl-PCBs should be as low as possible. 2.2.2. Estimated intake via seafood, acceptable or too high? Taking into account experimental and human variability, tolerable daily or weekly intakes are generally set to protect the most susceptible subgroups of the population against the most sensitive toxic effects. They define an amount that can be consumed daily over an entire lifetime without appreciable risk to health. Uncertainty, however, remains about the degree of risk below and above the proposed tolerable intake. The most sensitive individuals may be at risk from a small exceedance of the TDI/TWI, or even below it, whereas many individuals will not be at risk when the reference value is exceeded in a limited way (Scientific Advisory Committee on Nutrition et al., 2004).

Project CP/56 - “Integrated evaluation of marine food items: nutritional value, safety, and consumer perception”
SPSD II - Part I - Sustainable production and consumption patterns - Agro-Food 61
2.2.2.1 Mercury On the basis of the results described in PartII.1.3, it seems that the intake of (methyl) mercury via seafood is not an issue of toxicological concern for the Belgian population, taking into account the available consumption data and the most severe TWI of 1.6 µg/kg bw/week (228.6 ng/kg bw/day) (table II.9). Nevertheless, the high seafood consumers among the adults are just above that TDI on the basis of fish consumption only, but below the less stringent TDI of 3.3 µg/kg bw/week or 471.4 ng/kg bw/day. Our data show a good correlation between mercury intake and the consumption of seafood species placed higher in the food chain (like tuna), indeed methyl mercury biomagnifies in the food chain. Larger predatory species, like shark, swordfish and marlin, susceptible for a high mercury load, are not frequently consumed by the Belgian population. Tressou et al. (2004) assessed the intake of methyl mercury via seafood consumption for the French population, using an overall non-parametric probabilistic approach. Their data are given in table II.9 in comparison with ours. Table II. 9 Comparative data from this study and from literature about the intake of MeHg intake via seafood consumption
MeHg intake Adolescent data consumers only
Belgian adult data consumers only
French adult data consumers only
TDI
This study This study Tressou et al., 2004 ng/kg bw/day ng/kg bw/day mean 26.29 45.57 22.86 228.6 median 16.37 31.19 228.6 95th percentile 90.66 128.63 228.6 97.5th percentile 116.11 167.63 167.14 228.6 99th percentile 150.38 232.34 228.6
2.2.2.2 Dioxin-like compounds On the basis of seafood consumption only, the TDI for dioxin-like compounds was exceeded in the higher percentiles of the population, both for the adolescent population (table II.10) as for the Belgian adults (table II.11). When compared with the probabilistic intake assessment performed on the same adolescent data – but with contaminant data that were available in 1999 – it would appear that the intake of dioxin-like compounds via fish has declined (Dioxin Body Burden Working Group, 2001). This is due to an overall decrease in the contaminant concentrations in our data base. It remains uncertain whether this reflects a real decrease in contamination. Nevertheless, for high seafood consumers, the intake of dioxin-like compounds still poses a health risk. However, as far as an older population is concerned, the higher intake percentiles could also be compared with the less stringent TDI of 8 pg TEQ/kg bw/day proposed by COT. In the older population, developmental toxicity is of no concern whereas the positive effects of fish consumption for cardiovascular disease become more important. In comparison with our data, it should be mentioned that COT calculated an intake via fish of 0.6 pg TEQ/kg bw/day for an average UK adult consumer and 3.9 pg TEQ/kg bw/day for a high level adult consumer (Scientific Advisory Committee on Nutrition et al., 2004).

Project CP/56 - “Integrated evaluation of marine food items: nutritional value, safety, and consumer perception”
SPSD II - Part I - Sustainable production and consumption patterns - Agro-Food 62
Table II. 10 Comparative data about the intake of total dioxin-like compounds for the adolescents Adolescent data (all individuals) : totTEQ intake (pg TEQ/kg bw/day) TDI Data of 1999 Without data exclusion Exclusion of Baltic Sea fish Total diet Seafood Total diet % of total diet Seafood 2006 Total diet 2006 Seafood 2006 Total diet 2006 pg TEQ/kg bw/d
mean 0.48 0.33 2.00 median 0.21 2.53 8 0.07 0.84 0.07 0.88 2.00 95th percentile 4.13 6.52 63 2.56 4.04 1.60 2.54 2.00 97.5th percentile 5.18 7.47 69 3.43 4.95 2.34 3.39 2.00 99th percentile 7.28 9.65 75 4.82 6.39 3.09 4.12 2.00
Table II. 11 Data about the intake of total dioxin-like compounds for the Belgian adults
Belgian adult data: totTEQ intake via seafood (pg TEQ/kg bw/day) TDI Without data exclusion Exclusion of Baltic Sea fish Total diet All Consumers All Consumers pg TEQ/kg bw/d
mean 0.94 1.00 0.61 0.66 2.00 median 0.63 0.69 0.41 0.46 2.00 95th percentile 2.87 2.96 1.93 1.97 2.00 97.5th percentile 3.54 3.66 2.43 2.49 2.00 99th percentile 4.90 4.99 3.14 3.17 2.00 2.2.3. Other sources
2.2.3.1 Mercury Mercury intake assessment simulations for the studied populations were not executed on the basis of their total diet. Nevertheless, it is known from the literature that the main human sources of exposure to mercury (apart from occupational exposure) are from the diet and dental filling amalgam. Mercury is present in food naturally (e.g. in seafood which take up mercury from marine sediment), or as a result of pollution (e.g. emissions from industrial processes). The main dietary mercury sources are fish and fishery products, where it is mainly found as methyl mercury. In other food items, it is almost entirely inorganic mercury (Crepet et al., 2005; EU Directorate-General Health and Consumer Protection, 2004; Ministry of Agriculture, 1999).
2.2.3.2 iPCBs The exposure of iPCBs in the general population is for more than 90% via food. No Belgian data are available about the intake of iPCBs via the total diet. In the Netherlands, the median iPCB intake of the population was estimated in 2003 to be 5.6 ng/kg bw/day, and 11.9 ng/kg bw/day at the 95th percentile. The contribution of the different food items is quite scattered over the complete Dutch diet. The contribution of food of animal origin is assessed to be 75%: 27% of meat products, 26% of fishery products, 17% of dairy products and 5% of eggs (Bakker et al., 2003). Assuming a similar contribution of seafood towards the total intake, at the median level calculated in the subgroups of fish consumers from our populations the intake would increase from 1.46 ng/kg bw/day to 5.62 ng/kg bw/day (adolescents), and from 3.36 ng/kg bw/day to 12.92 ng/kg bw/day (adults).
2.2.3.3 Dioxin-like compounds Table II.10 also shows part of the intake distribution of total TEQ that was obtained by a similar probabilistic procedure, applied on the whole food intake of the same adolescent data base in combination with contaminant concentration data that were available in 1999 (Dioxin Body Burden Working Group, 2001; Vrijens et al., 2002). An analysis of the intake via different foods indicated that a significant contribution to the total intake happened through milk and other dairy products. For individuals with higher intakes, e.g. above the 80th percentile, fish and fish oils became the major source of dioxin-like substances. The third important source was beef, whereas the other sources were of minor importance (Vrijens et

Project CP/56 - “Integrated evaluation of marine food items: nutritional value, safety, and consumer perception”
SPSD II - Part I - Sustainable production and consumption patterns - Agro-Food 63
al., 2002). From the results, the percentage of the dioxin intake via fish as function of the intake via the total diet can be estimated (table II.10). As the intake distributions for fish and for total diet were calculated independently, these percentages are quite rough estimations. Applying the same percentages to the data of the current study gives the data for the total diet shown in table II.10. It would appear that at this moment a larger part of the adolescent population remains below the TDI of 2 pg TEQ/kg bw/day than in 1999. A new probabilistic intake assessment of dioxin-like substances via the whole diet should, therefore, be performed in order to confirm or deny this possibility. 2.3. Combined evaluation of benefit and risk, and scenario analysis 2.3.1 Inclusion or exclusion of contamination data and variations in seafood consumption Based on the adolescent and adult food consumption data bases, benefit and risk aspects regarding omega-3 fatty acids and dioxin-like compounds can be combined in the output of the ProbIntakeUG program.
2.3.1.1 Taking into account Baltic herring and salmon Figures II.28 and 29 provide a scatter plot, focussing on total TEQ on the one hand and EPA&DHA on the other hand. The graphs show the ratio of the intake of total TEQ divided by the TDI (2 pg TEQ/kg bw/day) and the intake of EPA&DHA divided by the requirement (RDA: 0.3% of the total energy requirement). By expressing the intake divided by the TDI or RDA, the limit value for being at the risk or benefit side is 1 on both axes. As such, four quadrants (zones) are obtained, all with a relevant meaning: Zone1: consumption of enough seafood to meet the EPA&DHA RDA, without exceeding the 2 pg TEQ/kg bw/day limit; Zone2: consumption of enough seafood to meet the EPA&DHA RDA, but exceeding the 2 pg TEQ/kg bw/day limit; Zone3: consumption of too little seafood to meet the EPA&DHA RDA, and not exceeding the 2 pg TEQ/kg bw/day limit; and Zone4: consumption of too little seafood to meet the EPA&DHA RDA, but exceeding the 2 pg TEQ/kg bw/day limit. Only a few people meet their EPA&DHA requirement without exceeding the limit for total dioxin-like compounds. Due to the rather high correlation between the intakes of these two compounds, it can be assumed that an increase of seafood consumption in order to increase the omega-3 fatty acid intake will lead to an increase of the intake of dioxin-like compounds. The results of an intake assessment, doubling fish consumption without any other changes to their dietary pattern (no alterations of the species consumed), are shown in figures II.30 and 31. The cloud of points representing the EPA&DHA on total TEQ intake ratio shifted to the upper right corner (towards zone 2), meaning that more individuals meet their EPA&DHA intake, but at the same time increase their intake of dioxin-like compounds proportionally. The problem of the low intake of omega-3 fatty acids, therefore, can not be solved by promoting higher seafood consumption in general only.
2.3.1.2 Exclusion of Baltic herring and salmon A similar exercise was performed without the data from Baltic fish. The results are shown in figures II.32 and II.33. In that case, the point of clouds shifts to the left (towards zone1 and 3), leading to a higher percentage of people in zone1, the most beneficial zone. Doubling the seafood consumption, without changes in the species consumed, but after exclusion of Baltic herring and salmon, leads to the results shown in figures II.34 and II.35.

Project CP/56 - “Integrated evaluation of marine food items: nutritional value, safety, and consumer perception”
SPSD II - Part I - Sustainable production and consumption patterns - Agro-Food 64
1.E-04
1.E-03
1.E-02
1.E-01
1.E+00
1.E+01
1.E-04 1.E-03 1.E-02 1.E-01 1.E+00 1.E+01 1.E+02
totTEQ (intake/TDI)
EPA
&D
HA
(int
ake/
RD
A)
1
3
2
4
1.E-03
1.E-02
1.E-01
1.E+00
1.E+01
1.E-03 1.E-02 1.E-01 1.E+00 1.E+01
totTEQ (intake/TDI)
EPA
&D
HA
(int
ake/
RD
A)
1
43
2
Figure II. 28 (L) and 29 (R) Ratio of the intake of total TEQ divided by the TDI (2 pg TEQ/kg bw/day) and the intake of EPA&DHA divided by the requirement (0.3% of the total energy requirement) as a result of the real seafood consumption of Belgian adolescents (L) and Belgian adults (R) (log-scale)
1.E-04
1.E-03
1.E-02
1.E-01
1.E+00
1.E+01
1.E-04 1.E-03 1.E-02 1.E-01 1.E+00 1.E+01 1.E+02
totTEQ (intake/TDI)
EPA
&D
HA
(int
ake/
RD
A)
1
43
2
1.E-03
1.E-02
1.E-01
1.E+00
1.E+01
1.E-03 1.E-02 1.E-01 1.E+00 1.E+01 1.E+02
totTEQ (intake/TDI)
EPA
&D
HA
(int
ake/
RD
A)
1
43
2
Figure II. 30 (L) and 31 (R) Ratio of the intake of total TEQ divided by the TDI (2 pg TEQ/kg bw/day) and the intake of EPA&DHA divided by the RDA (0.3% of the total energy requirement) as a result of a doubling of the seafood consumption of Belgian adolescents (L) and Belgian adults (R) (log-scale)
1.E-04
1.E-03
1.E-02
1.E-01
1.E+00
1.E+01
1.E-04 1.E-03 1.E-02 1.E-01 1.E+00 1.E+01 1.E+02
totTEQ (intake/TDI)
EPA
&D
HA
(int
ake/
RD
A)
43
1 2
1.E-03
1.E-02
1.E-01
1.E+00
1.E+01
1.E-03 1.E-02 1.E-01 1.E+00 1.E+01
totTEQ (intake/TDI)
EPA
&D
HA
(int
ake/
RD
A)
43
1 2
Figure II. 32 (L) and 33 (R) Ratio of intake of total TEQ divided by TDI (2 pg TEQ/kg bw/day) and intake of EPA&DHA divided by RDA (0.3% of total energy requirement) as a result of seafood consumption of Belgian adolescents (L) and adults (R) with exclusion of Baltic seafood(log-scale)
1.E-04
1.E-03
1.E-02
1.E-01
1.E+00
1.E+01
1.E-04 1.E-03 1.E-02 1.E-01 1.E+00 1.E+01 1.E+02
totTEQ (intake/TDI)
EPA
&D
HA
(int
ake/
RD
A)
43
21
1.E-03
1.E-02
1.E-01
1.E+00
1.E+01
1.E-03 1.E-02 1.E-01 1.E+00 1.E+01 1.E+02
totTEQ (intake/TDI)
EPA
&D
HA
(int
ake/
RD
A)
43
1 2
Figure II. 34 (L) and 35 (R) Ratio of intake of total TEQ divided by TDI (2 pg TEQ/kg bw/day) and intake of EPA&DHA divided by RDA (0.3% of total energy requirement) as a result of doubling of the seafood consumption of Belgian adolescents (L) and adults (R) with exclusion of Baltic seafood(log-scale)

Project CP/56 - “Integrated evaluation of marine food items: nutritional value, safety, and consumer perception”
SPSD II - Part I - Sustainable production and consumption patterns - Agro-Food 65
The different analyses mentioned above are quantitatively summarized in figure II.36.
0.7
2.7
1.1
6.3
0.7
3.0
2.2
9.9
2.3
0.6
9.3
7.2
5.1
2.8
24.9
16.8
87.9
92.2
77.1
80.2
87.3
92.1
62.2
69.8
9.1
4.5
12.5
6.2
6.9
2.1
10.7
3.6
0% 20% 40% 60% 80% 100%
Adol.
Adol.-BS
Adol.x2
Adol.x2-BS
Adul.
Adul.-BS
Adul.x2
Adul.x2-BS
Zone1: >RDA & <TDI Zone2: >RDA & >TDI Zone3: <RDA & <TDI Zone4: <RDA & >TDI
Figure II. 36 Percentage of the studied population in each zone, according to the different scenarios Legend: Adol.= Adolescents; Adul.= Adults; x2= doubling the seafood consumption; -BS= exclusion of the Baltic herring and salmon Figure II.36 shows that for the adult population, only 9.9% of the population reach the recommendation for EPA&DHA without exceeding the TDI for total dioxin-like compounds. In all cases, most of the people stay in zone3 (not reaching the EPA&DHA recommendation as well as not exceeding the TDI for the total dioxin-like compounds). In order to increase the percentage of people reaching the EPA&DHA RDA, other strategies are necessary. Some scenarios based on the dietary recommendations of the Belgian Health Council are executed and described below. 2.3.2 Scenario analyses based on the recommendations of the Belgian Health Council The recommendation of the Belgian Health Council is to consume one to two portions of seafood a week, being 150 to 300 grams of seafood a week (Belgian Health Council, 2004). A fictive population of 400 individuals was created (200 men and 200 women), equally divided over four different age classes (30-39y; 40-49y; 50-59y; 60-69y). The parametric data base of body weights as used for the adult population was applied. In all analyses, the contaminant concentrations of salmon and herring from the Baltic Sea were excluded, assuming that they would not enter on the Belgian market. In a first analysis, it was assumed that all individuals consumed 150 g of lean fish (cod) and 150 g of fatty fish (salmon) per week, and this on two different days. In a second analysis, they consumed two portions (2x 150 g) of fatty fish (salmon) on two different days.
2.3.2.1 Consumption of 150 g of cod and 150 g of salmon a week The results obtained are shown in figures II.37 to II.42

Project CP/56 - “Integrated evaluation of marine food items: nutritional value, safety, and consumer perception”
SPSD II - Part I - Sustainable production and consumption patterns - Agro-Food 66
Figure II. 37 Cumulative probability graph of the intake of dlPCB (pg TEQ/kg bw/day) when consuming 150 g of cod and 150 g of salmon a week. The TDI is set at 2 pg TEQ/kg bw/day
Figure II. 38 Cumulative probability graph of the intake of dioxins (pg TEQ/kg bw/day) when consuming 150 g of cod and 150 g of salmon a week. The TDI is set at 2 pg TEQ/kg bw/day
Figure II. 39 Cumulative probability graph of the intake of totTEQ (pg TEQ/kg bw/day) when consuming 150 g of cod and 150 g of salmon a week. The TDI is set at 2pg TEQ/kg bw/day
Figure II. 40 Cumulative probability graph of the intake of EPA&DHA (mg/kg bw/day) when consuming 150 g of cod and 150 g of salmon a week. The RDA is set at 9.7 mg/kg bw/day

Project CP/56 - “Integrated evaluation of marine food items: nutritional value, safety, and consumer perception”
SPSD II - Part I - Sustainable production and consumption patterns - Agro-Food 67
1.E-01
1.E+00
1.E+01
1.E-01 1.E+00 1.E+01
totTEQ (intake/TDI)
EPA
&D
HA
(int
ake/
RD
A)
The consumption of 150 g of cod and 150 g of non-Baltic salmon a week, would present a very low risk for exceeding the TDI for dioxin-like compounds. On the other hand, it does not satisfy the EPA&DHA recommendations.
2.3.2.2 Consumption of two times 150 g of salmon a week The results obtained are shown in figures II.43 to II.44.
Figure II. 41 Combined cumulative plot of the ratio of the intake on the threshold for different nutrients and contaminants when all individuals should consume 150 g of cod and 150 g of salmon a week
Figure II. 42 Ratio of the intake of total TEQ divided by TDI (2 pg TEQ/kg bw/day) and the intake of EPA&DHA divided by RDA (0.3% of total energy requirement) as a result of consuming 150 g of cod and 150 g of salmon a week
1.E-01
1.E+00
1.E+01
1.E-01 1.E+00 1.E+01
totTEQ (intake/TDI)
EPA
&D
HA
(int
ake/
RD
A)
Figure II. 43 Combined cumulative plot of the ratio of the intake on the threshold for different nutrients and contaminants when all individualsshould consume two portions of non-Baltic salmon a week
Figure II. 44 Ratio of the intake of total TEQ divided by TDI (2 pg TEQ/kg bw/day) and the intake of EPA&DHA divided by RDA (0.3% of total energy requirement) as a result of consuming two times a week non-Baltic salmon

Project CP/56 - “Integrated evaluation of marine food items: nutritional value, safety, and consumer perception”
SPSD II - Part I - Sustainable production and consumption patterns - Agro-Food 68
The consumption of two times a week non-Baltic salmon satisfies in most cases the EPA&DHA recommendation, whereas the risk to exceed the level of 2 pg total TEQ/kg bw/day is low. Specific recommendations might, therefore, create a positive balance between benefit and risk when consuming seafood products. Whether the follow up of these recommendations are, however, practically possible remains a topic of discussion. Finally, one should keep in mind that in these intake assessments only seafood consumption was considered as a source for contaminants. Although seafood remains an important source for persistent organic compounds, a similar assessment taking into account the total diet would be of interest to perform. 2.4. Discussion and conclusion With regard to this risk-benefit analysis, it should be emphasized that at this moment no common currency exists to evaluate the benefits as well as the risks in one single step. In other words, no common scale of measurement exists to compare human health risks and benefits. Attempts have been undertaken to combine both assessments in terms of QUALY’s (Ponce et al., 2000), but many uncertainties remain to be solved before a broad application of this procedure becomes possible. In our approach, RDAs and TDIs are used for the evaluation on human health benefits and human health risks, respectively, but these values were determined taking into consideration different end points. Nevertheless, an attempt was maid to describe the situation as accurate as possible, by a combined assessment of nutrients and contaminants together. 2.5. References Bakker M, Baars B-J, Baumann B, Boon P, Hoogerbrugge R. Indicator PCBs in foodstuffs: occurrence and dietary intake in The Netherlands at the end of the 20th century. RIVM-RIKILT, editor. RIVM report 639102 025. 2003.
Belgian Health Council. Voedingsaanbevelingen voor België. Herziene versie 2003. 2003. Brussels.
Belgian Health Council. Vis en gezondheid bij volwassenen. FOD Volksgezondheid. D/2004/7795/3. 2004.
Bender DA. The Vitamins. In: Gibney MJ, Vorster HH, Kok FJ, editors. Introduction to human nutrition. Oxford: Blackwell Science Ltd, 2002: 125-176.
COT (Committee on toxicity of chemicals in food). Statement on the tolerable daily intake for dioins and dioxin-like polychlorinated biphenyls. Food Standards Agency, pp.1-26. 2001.
Crepet A, Tressou J, Verger P, Leblanc JC. Management options to reduce exposure to methyl mercury through the consumption of fish and fishery products by the French population. Regul Toxicol Pharmacol 2005.

Project CP/56 - “Integrated evaluation of marine food items: nutritional value, safety, and consumer perception”
SPSD II - Part I - Sustainable production and consumption patterns - Agro-Food 69
Dahl L, Johansson L, Julshamn K, Meltzer HM. The iodine content of Norwegian foods and diets. Public Health Nutrition 2004; 7(4):569-576.
De Vriese SR, Huybrechts I, Moreau M, Van Oyen H. De Belgische Voedselconsumptiepeiling 1-2004. IPH/EPI REPORTS N° 2006 - 016. 2006. Brussels, Scientific Health Institute, Department of Epidemiology.
Dioxin Body Burden Working Group. The Belgian PCB-dioxin incident 1999. Report presented before the Belgian Health Council. 7300/1. 2001. Brussels, Belgium.
EFSA. Opinion of the scientific panel on contaminants in the food chain on a request from the Commission related to mercury and methylmercury in food. The EFSA Journal 2004; 34:1-14.
EFSA. Opinion of the scientific panel on contaminants in the food chain on a request of the Commission related to the presence of non dioxin-like polychlorinated biphenyls (PCB) in feed and food. The EFSA Journal 2005; 284:1-137.
EU Directorate-General Health and Consumer Protection. Assessment of the dietary exposure to arsenic, cadmium, lead and mercury of the population of the EU Member States. 2004.
Gallani B, Boix A. Dioxins and PCBs in Food and Feed: Data available to the European Commission. EUR 21093 EN. 2004.
Guallar E, Riemersma RA, Kok FJ. Mercury and the risk of myocardial infarction. New England Journal of Medicine 2003; 348(21):2153-2154.
Guallar E, Sanz-Gallardo MI, van't Veer P, Bode P, Aro A, Gomez-Aracena J et al. Mercury, fish oils, and the risk of myocardial infarction. New England Journal of Medicine 2002; 347(22):1747-1754.
Hetzel BS. Iodine Deficiency Disorders (Idd) and Their Eradication. Lancet 1983; 2(8359):1126-1129.
Kris-Etherton PM, Harris WS, Appel LJ. Fish consumption, fish oil, omega-3 fatty acids, and cardiovascular disease. Circulation 2002; 106(21):2747-2757.
Kris-Etherton PM, Harris WS, Appel LJ. Omega-3 fatty acids and cardiovascular disease - New recommendations from the American Heart Association. Arteriosclerosis Thrombosis and Vascular Biology 2003; 23(2):151-152.
Lambe J. The use of food consumption data in assessments of exposure to food chemicals including the application of probabilistic modelling. Proc Nutr Soc 2002; 61(1):11-18.
Lee SM, Lewis J, Buss DH, Holcombe GD, Lawrance PR. Iodine in British Foods and Diets. Br J Nutr 1994; 72(3):435-446.
Matthys C, De Henauw S, Devos C, De Backer G. Estimated energy intake, macronutrient intake and meal pattern of Flemish adolescents. Eur J Clin Nutr 2003; 57(2):366-375.

Project CP/56 - “Integrated evaluation of marine food items: nutritional value, safety, and consumer perception”
SPSD II - Part I - Sustainable production and consumption patterns - Agro-Food 70
Ministry of Agriculture FaF. 1997 tatoal diet study - Aluminium, arsenicum, cadmium, chromium, copper, lead, mercury, nickel, selenium, tin and zinc. Food Surveillance Sheet No. 191. 1999. MAFF, London.
Ponce RA, Bartell SM, Wong EY, LaFlamme D, Carrington C, Lee RC et al. Use of Quality-Adjusted Life Year Weights with Dose-Response Models for Public Health Decisions: A Case Study of the Risks and Benefits of Fish Consumption. Risk Analysis 2000; 20(4):529-542. Rasmussen LB, Ovesen L, Bulow I, Jorgensen T, Knudsen N, Laurberg P et al. Dietary iodine intake and urinary iodine excretion in a Danish population: effect of geography, supplements and food choice. Br J Nutr 2002; 87(1):61-69.
Scientific Advisory Committee on Nutrition, Committee on Toxicity of Chemicals in Food CPatE. Advice on fish consumption: benefits and risks. 1-204. 2004. London, TSO.
Sidhu KS. Health benefits and potential risks related to consumption of fish or fish oil. Regulatory Toxicology and Pharmacology 2003; 38(3):336-344.
Sioen I, Pynaert I, Matthys C, De Backer G, Van Camp J, De Henauw S. Dietary intakes and food sources of fat and individual polyunsaturated fatty acids in Belgian women. Lipids 2006; 41(5):415-422.
Tressou J, Crepet A, Bertail P, Feinberg MH, Leblanc JC. Probabilistic exposure assessment to food chemicals based on extreme value theory. Application to heavy metals from fish and sea products. Food Chem Toxicol 2004; 42(8):1349-1358.
Van den Berg M, van Birgelen A, Birnbaum L, Brouwer B, Carrier G, Dragan Y et al. Consultation on assessment of the health risk of dioxins; re-evaluation of the tolerable daily intake (TDI): Executive Summary. Food Additives and Contaminants 2000; 17(4):223-240.
van Leeuwen FXR, Feeley M, Schrenk D, Larsen JC, Farland W, Younes M. Dioxins: WHO’s tolerable daily intake (TDI) revisited. Chemosphere 2000; 40(9-11):1095-1101.
Van Thuyne N, Sioen I, Verdonck F. ProbIntakeUG User Manual. Release 1.0. June 2006.
Vitti P, Delange F, Pinchera A, Zimmermann M, Dunn JT. Europe is iodine deficient. The Lancet 2003; 361(9364):1226.
Vrijens B, De Henauw S, Dewettinck K, Talloen W, Goeyens L, De Backer G et al. Probabilistic intake assessment and body burden estimation of dioxin-like substances in background conditions and during a short food contamination episode. Food Additives and Contaminants 2002; 19(7):687-700.
World Health Organization. Food based dietary guidelines in the WHO European Region. EUR/03/5045414, 1-38. 2003. Denmark.
Yoshizawa K, Rimm EB, Morris JS, Spate VL, Hsieh CC, Spiegelman D et al. Mercury and the risk of coronary heart disease in men. New England Journal of Medicine 2002; 347(22):1755-1760.

Project CP/56 - “Integrated evaluation of marine food items: nutritional value, safety, and consumer perception”
SPSD II - Part I - Sustainable production and consumption patterns - Agro-Food 71
PART III. RISK – BENEFIT AND CONSUMER BEHAVIOUR 1. CONSUMER PERCEPTION VERSUS SCIENTIFIC KNOWLEDGE 1.1 Introduction Several studies indicate that fish is strongly perceived as a healthy food by consumers (Brunsø, 2003; Gross, 2003), particularly as compared with meat as its main substitute protein source. Nevertheless, dietary recommendations of eating two portions of fish a week, of which one should be fatty fish, are not met by large groups of the population in many countries (Welch et al, 2002; Scientific Advisory Committee on Nutrition, 2004). This is also the case for Belgium, despite the increase of 10.2% in fish consumption since 1990 that has been observed in 2000. The per capita fish consumption in Belgium amounted to 21.6 kg in 2000, which is just above the average per capita European fish consumption of 20.5 kg (FAO, 2000). Only about one-third of this volume (7.3 kg per capita in 2003) is consumed as fresh fish at home (GfK, 2003). One of the potential barriers to eating fish more frequently (Leek et al., 2000; Trondsen, 2003; Verbeke et al., 2005) may pertain to safety risks. Recently, the perception of fish as healthy food has been troubled by less favourable information regarding safety risks. The objective of this part is, first, to investigate consumer attitude and perception towards fish. Second, the potential gap between scientific evidence versus consumer perception related to fish consumption benefits and risks will be explored. 1.2 Research method 1.2.1 Study design and subjects This analysis has been performed using previously collected primary consumer data. The database for the analysis comprises survey data collected through questionnaires in Belgium during March 2003. The sample was composed of 284 women (66.2%) and 145 men (33.8%). This gender distribution reflects that all respondents were the main responsible people for food purchasing within their household. A quota sampling procedure with age as the main quota control variable was applied. Respondents were recruited either in shopping streets, at supermarkets or at-home during a door-by-door walking route procedure, until the envisaged age quota were met. Further sampling restrictions pertained to region (coastal or inland), education (until or beyond the age of 18 years), family size and presence of children (yes or no). Respondents were selected based on convenience or the judgement of the researchers, and they were personally interviewed at home and completed a self-administered questionnaire taking 30 to 40 minutes. It is important to note that the non-probability sampling and respondent selection procedures do not yield a statistically representative sample, and hence do not allow generalisations to the overall population. Nevertheless, with the characteristics as presented in Table III.1, the sample covers a wide range of consumers in terms of socio-demographics. With respect to age, a small over-sampling of younger respondents (under 25 years) occurred. The presence of children in the household closely matches the distribution within the population, with around 60% of the households having children, and 20% of the households having children younger than 12 years of age (NIS, 2002). The average family size in the sample was 2.9 persons per family, which is somewhat higher in comparison to the population, which has 2.4 persons per family (NIS, 2002). In order to check the external validity of the response obtained from this sample, fish consumption frequency and outlet choice are compared with external secondary data. The number of consumers reporting that they eat fish once a week amounted to 65% immediately

Project CP/56 - “Integrated evaluation of marine food items: nutritional value, safety, and consumer perception”
SPSD II - Part I - Sustainable production and consumption patterns - Agro-Food 72
after the dioxin crisis during the summer of 1999. Repeated in 2002, 52% of a representative sample of consumers reported that they ate fish once a week (Inra, 2003). In a similar vein, the Belgian Scientific Institute of Public Health reported in their 2001 Health Interview Survey (representative sample of 4,100 households) that 55.6% of the Flemish population consume fish once a week or more (WIV, 2001). In our sample, 57.0% of the respondents claim to eat fish once a week. Table III.1 Sample characteristics (%, n=429) Gender Male 33.1 Yes 57.3 Female 66.9
Children No 42.7
Age ≤ 25 years 21.9 < 850 €/month 5.9 26 to 35 years 17.5
Net income 850-1700 € 25.6
36 to 45 years 22.9 1700-2550 € 36.4 46 to 55 years 22.9 > 2550 € 32.1 > 55 years 14.9 Mean (S.D.) 40.6
(15.0) Education ≤ 18 years 32.6
> 18 years 67.4 Family size 1 or 2 persons 48.5 3 or 4 persons 38.0 Region West Flanders 24.2 5 or more persons 11.9 East Flanders 19.7 Antwerp 56.1 1.2.2 Questionnaire First, attitude towards fish was measured using several 5-point Likert scaled variables. Second, general consumer perception of fish as being nutritious, healthy and safe was also measured on a 5-point interval scale ranging from “totally not agree”, over “neutral” to “totally agree”. Third, consumer beliefs of potential health benefits from consuming fish were assessed. Three groups of scientific evidence-based health benefits were included. Based on the evidence that fish contains vitamin D, which is essential for bone mineralisation, the statements that regular fish consumption “improves bone development” and “makes people strong” were included. Three statements were included based on fish’s content of omega-3 fatty acids, and its potential beneficial role in the prevention of coronary heart disease and certain cancers: “reduces risk for coronary heart disease”, “reduces risk for certain cancers”, and “prolongs people’s life”. Finally, given the presence of DHA in fish, and its potential role in brain development, consumer’s beliefs in the statements “stimulates brain development” and “makes people smart” were measured. Note that benefits were included with both scientific and lay formulations. Fifth, consumers were probed about their knowledge of nutrient and contaminant content in fish. They were asked whether they believe that fish contains vitamin D, omega-3 fatty acids and dietary fibre. Similarly, consumers were asked whether they believe that fish contains PCB’s and dioxins, pesticide and other residues, heavy metals, medicinal residues, and colorants as potential harmful substances. Consumers were also asked to indicate the perceived effect of these components on human health in terms of “negative”, “neutral”, “positive”, and “don’t know”. 1.2.3 Statistical analyses Data were analysed using SPSS 12.00. Mean scores and standard deviations on 5-point scales, as well as frequency distributions in recoded categories (strongly disagree and disagree; agree and strongly agree) are presented in table format. Principal component analyses are used to
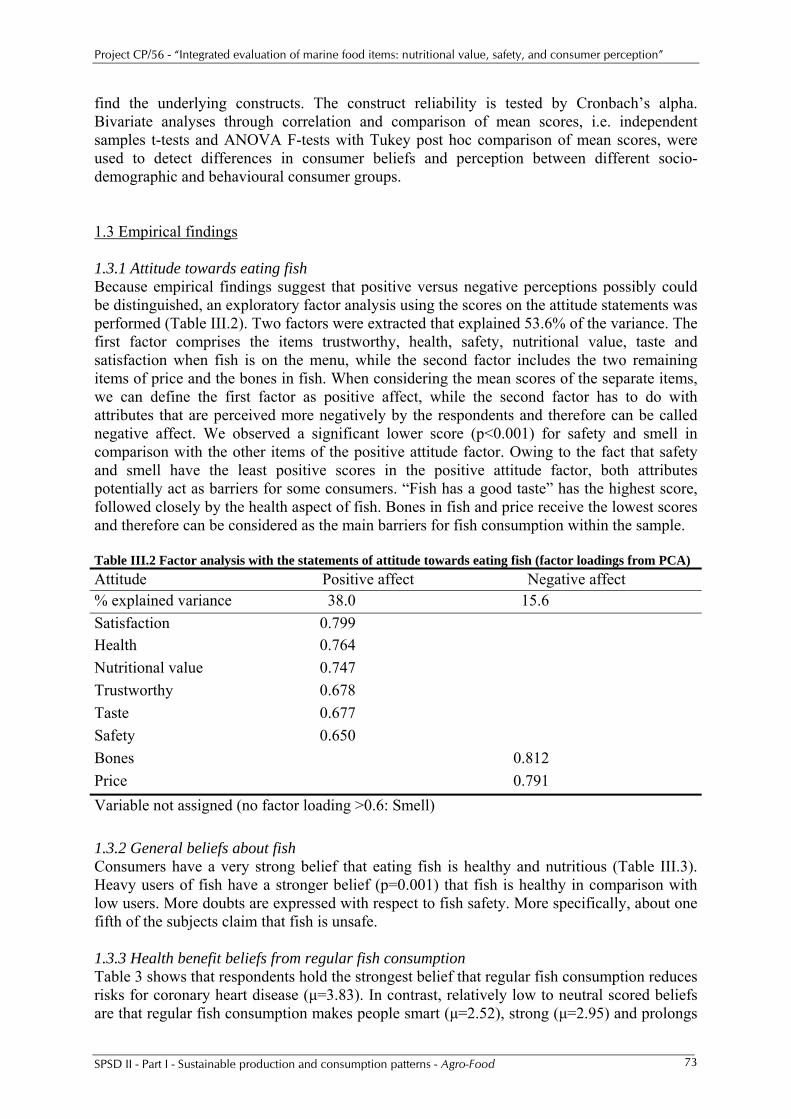
Project CP/56 - “Integrated evaluation of marine food items: nutritional value, safety, and consumer perception”
SPSD II - Part I - Sustainable production and consumption patterns - Agro-Food 73
find the underlying constructs. The construct reliability is tested by Cronbach’s alpha. Bivariate analyses through correlation and comparison of mean scores, i.e. independent samples t-tests and ANOVA F-tests with Tukey post hoc comparison of mean scores, were used to detect differences in consumer beliefs and perception between different socio-demographic and behavioural consumer groups. 1.3 Empirical findings 1.3.1 Attitude towards eating fish Because empirical findings suggest that positive versus negative perceptions possibly could be distinguished, an exploratory factor analysis using the scores on the attitude statements was performed (Table III.2). Two factors were extracted that explained 53.6% of the variance. The first factor comprises the items trustworthy, health, safety, nutritional value, taste and satisfaction when fish is on the menu, while the second factor includes the two remaining items of price and the bones in fish. When considering the mean scores of the separate items, we can define the first factor as positive affect, while the second factor has to do with attributes that are perceived more negatively by the respondents and therefore can be called negative affect. We observed a significant lower score (p<0.001) for safety and smell in comparison with the other items of the positive attitude factor. Owing to the fact that safety and smell have the least positive scores in the positive attitude factor, both attributes potentially act as barriers for some consumers. “Fish has a good taste” has the highest score, followed closely by the health aspect of fish. Bones in fish and price receive the lowest scores and therefore can be considered as the main barriers for fish consumption within the sample. Table III.2 Factor analysis with the statements of attitude towards eating fish (factor loadings from PCA) Attitude Positive affect Negative affect % explained variance 38.0 15.6 Satisfaction 0.799 Health 0.764 Nutritional value 0.747 Trustworthy 0.678 Taste 0.677 Safety 0.650 Bones 0.812 Price 0.791 Variable not assigned (no factor loading >0.6: Smell)
1.3.2 General beliefs about fish Consumers have a very strong belief that eating fish is healthy and nutritious (Table III.3). Heavy users of fish have a stronger belief (p=0.001) that fish is healthy in comparison with low users. More doubts are expressed with respect to fish safety. More specifically, about one fifth of the subjects claim that fish is unsafe. 1.3.3 Health benefit beliefs from regular fish consumption Table 3 shows that respondents hold the strongest belief that regular fish consumption reduces risks for coronary heart disease (μ=3.83). In contrast, relatively low to neutral scored beliefs are that regular fish consumption makes people smart (μ=2.52), strong (μ=2.95) and prolongs

Project CP/56 - “Integrated evaluation of marine food items: nutritional value, safety, and consumer perception”
SPSD II - Part I - Sustainable production and consumption patterns - Agro-Food 74
life (μ=2.98). Except for the statement relating to coronary heart disease, about half of the respondents scored neutral for health benefit beliefs, which reflects doubts or uncertainty at the level of consumers. Table III.3 Consumer beliefs about fish (%, n=429), mean and standard deviation on 5-point scale*
Item Strongly disagree/ disagree*
Neutral
Agree / Strongly agree*
Mean SD
General beliefs about fish Fish is nutritious Fish is healthy Fish is safe
1.9 3.1
18.4
17.8 18.4 59.1
80.3 78.5 22.5
3.95 3.98 3.06
0.67 0.76 0.74
Health benefit beliefs
“Regular fish consumption …” Reduces risk for coronary heart disease Reduces risks for certain cancers Prolongs your life Improves bone development Makes people strong Stimulates brain development Makes people smart
4.0 12.8 22.3 10.9 22.3 12.1 44.8
23.0 47.9 55.9 56.0 59.5 51.3 46.0
73.0 39.3 21.8 33.1 18.3 36.6 9.2
3.83 3.29 2.98 3.22 2.95 3.29 2.52
0.75 0.81 0.81 0.76 0.73 0.82 0.89
Fish content beliefs
“Fish contains …” Vitamin D Omega-3-acids (PUFA) Dietary fibre
4.6 6.3
17.1
42.1 61.9 37.4
53.3 31.8 45.5
3.65 3.37 3.35
0.82 0.79 1.01
PCB’s Dioxins Pesticide and other chemical
residues Heavy metals Medicinal residues Colorants
18.8 22.6 28.4 12.2 29.3 37.2
50.6 48.3 46.8 42.0 52.0 41.3
30.6 29.1 24.9 45.8 18.7 21.5
3.16 3.08 2.94 3.40 2.87 2.79
0.82 0.86 0.89 0.83 0.83 0.97
* Categories “strongly disagree” and “disagree”, and “agree” and “strongly agree” from the initial 5-point scale have been merged for clarity of presentation; statistical analyses as reported in the text have been performed with the original 5-point scale data. 1.3.4 Fish nutrient content beliefs Table 3 shows that respondents hold the strongest belief about the presence of vitamin D in fish. Surprisingly, 45.5% of the subjects claim that fish contains dietary fibre, whereas less than one third of the respondents are aware of omega-3 fatty acids in fish. Almost 62% of the

Project CP/56 - “Integrated evaluation of marine food items: nutritional value, safety, and consumer perception”
SPSD II - Part I - Sustainable production and consumption patterns - Agro-Food 75
respondents in the case of omega-3 fatty acids and 42% in case of vitamin D are unsure that fish contains those nutrients. Heavy users have a stronger belief (p=0.034) that fish contains vitamin D in comparison with low users, whereas no differences with respect to omega-3 fatty acids and dietary fibre are detected between fish use levels. 1.3.5 Fish contaminant content beliefs Respondents hold the strongest beliefs that fish may contain heavy metals (μ=3.40), PCB’s (μ=3.16) and dioxins (μ=3.08) as harmful substances. The lowest level of belief is noticed for the statement that fish contains colorants (μ=2.79). The average belief scores for harmful substances are lower than the belief scores for nutrients, which denotes a stronger belief in the presence of beneficial than harmful components. Low users hold a stronger belief (p=0.003) that fish contains heavy metals compared with heavy users. 1.3.6 Perceived effect of nutrients A large majority of the subjects are aware of the fact that vitamin D and dietary fibre have a positive effect on human health (Table III.4), although the latter is obviously not relevant when considering fish. Remarkably, only 30% of the respondents state that omega-3 fatty acids have a positive effect on human health.
Table III.4 Consumer perception of the effects, frequency distribution (%, n=429)
Item Negative Neutral Positive Don’t know
“Effect of …” Vitamin D Omega-3-acids (PUFA) Dietary fibre
2.4 16.3 3.3
10.8 14.4 9.8
71.6 30.0 70.3
15.2 39.3 16.5
PCB’s
Dioxins Pesticide and other chemical residues Heavy metals Medicinal residues Colorants
77.1 81.7 83.1 77.3 76.3 53.0
2.9 1.9 1.4 2.6 5.0
27.4
4.1 5.0 4.1 5.0 4.1 4.5
15.9 11.4 11.4 15.1 14.6 15.0
1.3.7 Perceived effect of contaminants Most of the respondents believe that heavy metals (77.3%), medicinal residues (76.3%), pesticide and other chemical residues (83.1%), PCB’s (77.1%) and dioxins (81.7%) have a negative effect on human health (Table 4). No significant impact of fish consumption level is noticed for the perception of contaminants’ effects on human health. 1.4 Discussion

Project CP/56 - “Integrated evaluation of marine food items: nutritional value, safety, and consumer perception”
SPSD II - Part I - Sustainable production and consumption patterns - Agro-Food 76
Consumers believe with reason that fish is healthy and nutritious, viewed its content of proteins and essential micronutrients like vitamin D, and viewed the fact that fish and other marine foods are a unique source of long chain omega-3 PUFAs. Surprisingly, only 17.1% of the respondents really knew that fish contains no dietary fibre. It is assumed that this misunderstanding results from the “fibrous” texture of the flesh of some fish species, which however has nothing to do with dietary fibre. The knowledge of the vitamin D content in fish is better, but the results with respect to omega-3 fatty acids show that most people are not fully aware of the nutrient content of fish. This shows that there is a definite need to inform people about the nutritional value and benefit of fish. A majority of consumers score neutral on the belief that fish is safe. Fish safety is difficult to confirm from a scientific point of view, given the large number of quite divergent concentrations for contaminants in fish found in literature and the scientific debate and uncertainty about the effects of contaminants in fish on human health. In cases where science is inconclusive, it should come as no surprise that consumers score neutral. Thanks to the content of omega-3 PUFAs in marine food products, regular fish consumption reduces risk for coronary heart diseases, which is also the strongest health benefit belief of consumers. People have some belief that regular fish consumption reduces risk for some types of cancer, though this belief is much weaker than the belief in risk reduction for coronary heart disease. The potential protective effect of regular fish consumption vis-à-vis the development of malignant tumours is currently somewhat controversial and subject to further debate. The fact that science is inconclusive in this matter is reflected to some extent in consumer’s belief scores. Regular fish consumption can improve the development of bones, thanks to the content of vitamin D in fish. In contrast with scientific evidence, this fact is only believed by one third of the consumers. The presence of DHA may be one of the probable causes that regular fish consumption stimulates brain development. This health benefit is only believed by slightly over one third of the respondents. It is today generally accepted that fish is an important component of a healthy and balanced omnivorous human diet, seen its nutritious benefits. Such a healthy diet will benefit human health, strength and life expectancy. In this context, it is noteworthy that the lay or popular statements relating to health benefits (“prolongs people’s life”, “makes people strong”, and “makes people smart”) received significantly lower belief scores as compared to the more scientific formulation of the belief statements. This finding suggests that communication messages with a clear scientific base and formulation have a higher potential effectiveness (higher belief and plausibility) as compared to lay or vulgarised slogans. Further research should confirm this issue of effectiveness depending on the baseline formulation of public health and nutrition information messages. The results of the consumer study also show that the best known contaminants that can be present in fish are heavy metals, PCB’s and dioxins. It is remarkable to see that the belief that fish contains heavy metals has a higher score than the belief that fish contains omega-3 PUFAs. This denotes that consumer awareness of these safety risks is higher than their awareness of a definite health benefit. Furthermore, consumer awareness of the negative effect of harmful substances is higher as compared to consumer awareness of the positive effect of nutrients. These findings exemplify the alleged conflict model in consumer’s minds, and it shows that there is a lot that must be done about the image of fish for human consumption. The hypotheses is whether “safety first” and safety-related risk information intrinsically prevail over health benefit information in consumer’s decision-making, or whether “safety” prevails only because “health” is already taken for granted (most strongly believed in) in this specific case of fish. 1.5 Conclusions

Project CP/56 - “Integrated evaluation of marine food items: nutritional value, safety, and consumer perception”
SPSD II - Part I - Sustainable production and consumption patterns - Agro-Food 77
Attitude towards fish is found to include positive versus negative perceived attributes. This confirms previous findings by Leek et al. (2000) and Olsen (2001) about the distinction between positive and negative aspects of attitude. In general, the taste and the healthy image of fish are two well-appreciated characteristics, but the bones in fish and the price are identified as the most likely attitudinal barriers to more frequent fish consumption. Gaps between consumer perception and scientific evidence related to fish are discovered in particular with respect to the nutrient content and health promoting effects of fish. Despite conclusive evidence about the content and positive effect of omega-3 fatty acids in fish, related consumer awareness and beliefs are rather poor. In general, the healthy image of fish prevails over its image of being potentially unsafe. Nevertheless, 43% of the respondents do not eat fish at least once a week. This study exemplifies the need for nutrition education and more effective communication about fish to the broader public. Further research to strengthen scientific evidence about benefits and risks from fish consumption is recommended. More specifically, research on balancing nutrient intake and harmful substance exposure is needed in order to issue appropriate dietary recommendations and public health information. Even so, further research is needed dealing with the impact of conflicting information and communication on consumer decision-making in the specific case of fish consumption, which emerges as a showcase where consumers will have to balance distinct health benefits against likely safety risks.

Project CP/56 - “Integrated evaluation of marine food items: nutritional value, safety, and consumer perception”
SPSD II - Part I - Sustainable production and consumption patterns - Agro-Food 78
2. RISK – BENEFIT COMMUNICATION 2.1 Introduction Fish and seafood products are subject to a potential conflict situation with respect to communication: stimulating fish demand is desirable because of fish’s nutritional benefits, but an increased fish consumption also leads to an increased intake of potentially harmful environmental contaminants. Should fish consumption be promoted because of its positive nutrients or should it be hold back because of its negative substances? Or should balanced information be provided? A first relevant issue to be addressed pertains to the impact of negative versus positive versus balanced information provision. Little research is done about the influence of balanced information and the differential impact of a different sequence of risk and benefit information within a message. The opposite is true for the comparison between positive and negative information concerning health, where every single study points out a stronger impact of negative information. Richey et al. (1967), Chang & Kinnucan (1991), Verbeke & Viaene (2001) en Verbeke & Ward (2001) even conclude that one instance of negative information can neutralize four to seven instances of positive information. A second relevant question is who should best communicate the message in case of a negative, a positive or a balanced situation. Trust is a factor that is of increasing importance when explaining the impact of a message on consumers’ attitude and behaviour. Trust in an information source is a multi-dimensional issue and is associated with the belief that the source is expert, knowledgeable, unbiased, has no vested interest in the hazard and is not seeking to sensationalise the hazard (Breakwell, 2000). If consumers do not trust the information source, they will not believe the message and there will be no impact on attitude and behaviour. However, even if people trust the source, the message does not always result in a changed attitude and/or behaviour. Other criteria such as habit strength, practicality and identity can make that people do not change their behaviour (De Boer et al., 2005). A study conducted by Frewer et al. (2003) about the mediating effects of trust in an attitude change experiment towards genetically modified foods involving consumers from Denmark, Germany, Italy and the United Kingdom, showed no real impact of information source on attitude change. Also, the extent to which people trusted the information sources appeared to be driven by people’s attitudes to genetically modified foods, rather than trust influencing the way people react to the information, which makes trust rather a consequence than a cause of attitude change. It is also important to note that the public perception of risk is very different from scientists’ understanding of risk. Scientists consider the nature of harm that would occur, the probability that it will occur and the number of people who may be affected. The public in contrast is less aware of probabilities and the size of the risk, and is much more concerned with attributes such as whether the risk is voluntarily assumed, whether the risks and benefits are fairly distributed, whether the risk is controllable by the individual, whether the risk is necessary and unavoidable, whether the risk is familiar or exotic and whether the risk is natural of technological in origin. Awareness of this gap is important when composing the informational message. In a study by De Boer et al. (2005), food safety experts were convinced that public understanding of food risk messages could be improved by communicating clear and simple messages of high visual impact. Food risk messages that provide a solution to the food risk issue were also viewed positively. Fewer believed that food risk messages that are communicated in a humorous or accusatory manner are effective.

Project CP/56 - “Integrated evaluation of marine food items: nutritional value, safety, and consumer perception”
SPSD II - Part I - Sustainable production and consumption patterns - Agro-Food 79
The objective of this part is to assess the potential impact of risk-benefit information (risk only, benefit only, balanced information about fish), on consumer attitude and behavioural intention towards eating fish. 2.2 Research method 2.2.1 Experimental design For this part of the analysis, primary consumer data were collected within the frame and for the specific purpose of this Science Policy project. The survey combined a classical questionnaire approach with an experimental design for testing information impact. The survey constituted of three main parts: first, some measurements before the experiment, then the experiment itself and finally some measurements after the experiment. The experiment consisted of reading one of twelve communication messages that were composed specifically for this research. The measurements before the experiment were used as basis or reference, while those afterwards should enable us to determine the effect of the experiment. The message was made up of a short text where benefits and risks of fish consumption were entered. The different messages were formulated based on a profound literature research and in consultation with the other partners in the research consortium. With regard to the benefits, emphasis was made on the presence of omega-3 fatty acids and vitamin D, while the presence of dioxins and mercury were mentioned as risks, since previous research indicated that these nutrients and contaminants were well-known by the consumer. The structure of the messages was completely analogous and consisted of five building blocks: the importance of the components (nutrient or contaminant), their impact on human health, the fact that fish and marine products are the main sources of these components in human and finally, the positive/negative influence associated with the recommended consumption of fish, i.e. two portions a week. Beside the information about the benefits and/or risks of fish consumption, the source of the information was mentioned. In total, three different sources were tested: fish- and food industry, government and consumer organisation, which are perceived as the most responsible ones for communicating about food safety (De Boer et al., 2005). Before providing the actual message, it was quoted: ”The message below recently appeared in a brochure about food and health, edited by [source]”. After exposure to the message, it was quoted again: “This message was provided by [source]”. In the resulting experimental design, the variable “message” consisted of four conditions: benefit only, risk only, balanced benefit-risk and balanced risk-benefit. The variable “source” consisted of three conditions: fish- and food industry, government and consumer organisation. Since a full factorial design was employed, the [4 messages x 3 sources] design yielded twelve different conditions (questionnaires) in total. In May 2005, a pretest was conducted with a group of students to test the messages. Too little distinction occurred between the interpretation of the different messages in terms of benefit or risk perception. Therefore, as well the benefits as the risk messages were formulated a bit stronger. 2.2.2 Questionnaire First, behaviour towards fish was measured through different items, using a self administered frequency scale, sounding out past month’s fish consumption. The same scale was repeated after exposure to the message, now sounding out next month’s intentional fish consumption frequency. Also, questions concerning the consumption frequency of different types of fish (cod, salmon, sole, trout, tuna and Pollack) and the in home and out of home consumption frequency of fish were enclosed. Second, general attitude towards eating fish was measured

Project CP/56 - “Integrated evaluation of marine food items: nutritional value, safety, and consumer perception”
SPSD II - Part I - Sustainable production and consumption patterns - Agro-Food 80
by means of six items using a seven-point semantic differential. Moreover, a question was asked concerning some attributes about fish and fish consumption, also applying a seven-point semantic differential, with “unhealthy/healthy, unsafe/safe, not nutritious/nutritious, unethical/ethical, expensive/cheap and not favourable/favourable” as bipolar adjectives. This question was asked as well before as after exposure to the message. Third, use of and trust in the different information sources used in this study were probed, using a seven-point Likert scale, ranging from “never” (1) over “sometimes” (4) to “very often” (7) with regard to use and from “complete distrust” (1) over “neither distrust, nor trust” (4) to “complete trust” (7). Finally, attitude of the respondents towards the message was measured, first by variables measured on a seven-point Likert scale and second by variables measured on a seven-point semantic differential. 2.2.3 Data collection and subjects The final survey data were collected in Flanders during June 2005. The sample was composed of 381 women, aged between 20 and 50 years. The choice for a female sample relates to the fact that women constitute about 70 percent of the main responsible persons for food purchase. The criterion for age was chosen to obtain an important share of families with children. The questionnaires were initially distributed via primary and nursery schools during June 2005. A total of 1430 surveys were distributed, of which 431 were send back, yielding a gross response of 30.1 percent. When the blanc or incomplete questionnaires or those completed by men were eliminated, 381 remained what corresponds with a net or valid response of 26.6 percent. In Table III.5, the distribution of the valid questionnaires over the different conditions (message-source) is presented. Table III.5 Distribution of the valid questionnaires over the variables message-source
Fish and food industry Government Consumer
organisation Total
Message with… Benefit only 31 31 32 94 Risk only 31 36 30 97 Benefit – Risk 31 31 32 94 Risk – Benefit 32 32 32 96 Total 125 130 126 381 It is important to note that the specific respondent selection and recruiting procedures yield a statistically non-representative sample, hence generalisation to the overall population is speculative. Table III.6 provides an overview of the socio-demographic characteristics of the sample. Data were analysed using descriptive statistical procedures as described in 1.2.3.

Project CP/56 - “Integrated evaluation of marine food items: nutritional value, safety, and consumer perception”
SPSD II - Part I - Sustainable production and consumption patterns - Agro-Food 81
Table III.6 Socio-demographic characteristics of the sample (% of the respondents, n=381) 20 to 29 years 14.2 ≤ 18 years 28.9 30 to 39 years 55.5 Education > 18 years 71.1
40 to 50 years 30.3 Age
Yes 85.6 Self-employed 10.5 Children No 14.4
Employee 64.6 Workman 5.2 1 or 2 persons 14.5
Housewife 5.0 3 or 4 persons 63.5 Profession
Others 14.7 Family size
5 or more persons 22.0
2.3 Empirical findings
2.3.1 Behaviour and attitude towards fish The average fish consumption frequency of this sample was 1.14 times a week, with 68.5% of the sample claiming to eat fish once a week, which is somewhat higher than the percentage found in formerly performed representative studies (cfr. 1.2.1). The highest consumption frequency was noticed for tuna (0.44 times a week), followed by salmon (0.43) and cod (0,40). Plain lower frequencies were noticed for Pollack (0,19), sole (0,17) and trout (0,10). General attitude was measured by six bipolar adjectives on a seven-point scale, yielding a Cronbach’s alfa of 0.95. Hence, one construct is calculated across these variables, with an average score of 5.62 on a 7-point scale, confirming the strongly positive attitude towards eating fish among consumers. The second question examined perceptions of fish on different product attributes (Figure III.1).
1 2 3 4 5 6 7
healthy
nutritious
favourable
ethical
safe
cheap
Figure III.1 Attitude towards eating fish (measured on a 7-pt. semantic differential, with the positive adjective at the right); “Eating fish is …”
2.3.2 Use and trust in information sources Consumer organisations were the sources most trusted, followed by the government and the food industry, while fish and food industry appeared to be the source most used, followed by consumer organisations and government (Table III.7). Hence, the source most used, is trusted the least. However, low average scores regarding use of each source indicate that none of

Project CP/56 - “Integrated evaluation of marine food items: nutritional value, safety, and consumer perception”
SPSD II - Part I - Sustainable production and consumption patterns - Agro-Food 82
these sources really contribute to the provision of information about fish, at least as far as consumer perception is concerned. Table III.7 Use of and trust in sources, mean score (7 point-scale) Use of … Trust in … Fish & food industry 2.46 Fish & food industry 4.13 Consumer organisation 2.27 Consumer organisation 4.57 Government 1.91 Government 4.34
2.3.3 Communication impact 2.3.3.1 Message evaluation After exposure to the message, people were asked questions to evaluate the message as well concerning content as concerning attractiveness. This gives the opportunity to determine differences in judgement between different messages and different sources. A benefit only message was perceived most positive, as well regarding content as attractiveness. The risk only message on the other hand was perceived least positive. Regarding the balanced messages, the first statements mentioned seemed to be most influencing. With regard to the impact of source on the evaluation, information originating of fish and food industry was perceived most credible and most attractive, while the opposite could be determined concerning governmental information. Information published by consumer organisations was judged in between. 2.3.3.2 Message impact in terms of behavioural change It was possible to measure the impact on behavioural change through subtraction of behavioural intention by actual behaviour. Because actual behaviour and behavioural intention is not the same, the overall difference between both (i.e. 0.1614) is taken as reference point in stead of zero, and marked with a thick line (Figure III.2). The impact of the message content on behavioural change showed to be significant (p=0.000). However, only the unbalanced messages differed significantly from the reference point, which is marked in Figure III.2 by means of a “*”, with the benefit only message leading to an increase in fish consumption frequency and the risk only message yielding a decrease. Bonferroni post hoc tests indicate a significant different impact of the benefit only message in comparison to all other messages, while the risk only message did not differ significantly from the balanced risk/benefit message. Both balanced messages also had no different impact.

Project CP/56 - “Integrated evaluation of marine food items: nutritional value, safety, and consumer perception”
SPSD II - Part I - Sustainable production and consumption patterns - Agro-Food 83
a
b
c
b,c
-0,6
-0,4
-0,2
0
0,2
0,4
0,6
0,8
1
BEH
AVI
OU
RA
L C
HA
NG
E (F
REQ
UEN
CY/
MO
NTH
)
Benefit only Risk only Benefit first Risk first
*
*
Figure III.2 Impact of message content on behavioural change No influence of information source was found (p=0.702), while behaviour before exposure was significantly negative correlated with behavioural change (r=-0.306; p=0.000). This is due to first, the benefit only message spurring the heavy user less on increasing their fish consumption compared to low and medium users and second, a risk only message resulting in a larger decrease of fish consumption for the heavy users. Attitude towards fish consumption before exposure on the other hand was not significantly correlated with behavioural change (r=0.029; p=0.576). The same could be concluded concerning use of information source to which exposed (r=-0.056, p=0.278) and trust in source to which exposed (r=-0.003; p=0.960). The impact of credibility and attractiveness of the message on the other hand did yield a significant correlation (respectively r=0.132 & 0.121; p=0.010 & 0.019). Finally, no socio-demographic characteristics resulted in a different impact on behavioural change (p>0.05). 2.3.3.3 Message impact on attitudinal change People were asked as well before as after exposure to the message how they perceived fish consumption: healthy / safe / nutritious / ethical / cheap / favourable. The message touched matters about health, safety and nutritional value, so the expectation was that these items would yield a difference, together with the item favourable, which gives a general view on the perception of fish consumption. The aspect of price was not touched in the messages and functioned as control variable, while concerning the ethical matter, we did not know what to expect. On the one hand, it was not mentioned in the message, but on the other hand, people perhaps make the association between their own health and the welfare of animals. With regard to the impact of message content, a significant effect is determined (p=0.000) for all items, except for the control variable price (Figure III.3). A ”*” means that the change in attitude does not differ from zero. Regarding the ethical matter, the benefit only message yields no effect, while a clear negative impact is noticed when exposed to all other types, especially the risk only message. So, the respondent assumes that something that can do harm to human health, can not be good for animal welfare either. Concerning the items touched in the message, the same conclusions can be withdrawn:
- the benefit only message only result in a very little attitudinal change, probably due to the very positive image that already corresponds with the consumption of fish
- the risk only message results in a strong negative attitudinal change - both balanced messages result in a decreased attitude towards fish consumption,
although less pronounced compared to the risk only message. When the risk part is

Project CP/56 - “Integrated evaluation of marine food items: nutritional value, safety, and consumer perception”
SPSD II - Part I - Sustainable production and consumption patterns - Agro-Food 84
mentioned first, the change was higher each time in magnitude, but never significant, indicating a larger influence of the first part of the message.
- the largest impact was seen for health, followed by safety and nutritional value
aaa
a
a
a ba
bbbb cacccc cab,cccc
-3
-2,5
-2
-1,5
-1
-0,5
0
0,5
ATT
ITUD
INAL
CHA
NG
E
Benefit only Risk only Benefit first Risk first
health
safetynutritional value
ethics
favourability
price
* * * * * * *
Figure III.3 Impact of message content on attitudinal change With regard to information source, no significant impact was found on attitudinal change (p>0.05). Also, as well behaviour as attitude before exposure showed no significant correlation with attitudinal change (p>0.05). The same goes for use of and trust in source to which exposed (p>0.05). On the other hand, the credibility and attractiveness of the message showed a significant and positive correlation with attitudinal change. Finally, not any of the socio-demographical variables resulted in a significant impact on attitudinal change (p>0.05). 2.3.3.4 Interaction effects Not only the main effects were of interest, also interaction effects were investigated. However, this research faces some limitations. First, only categorical variables are qualified for measuring interaction effects. Hence, interval-scaled variables had to be categorised, which goes together with the loss of some information. The second constraint was the rather limited number of respondents, which leads to groups that often are too small to draw valid and reliable conclusions. For this reason, no third order interactions are taken into consideration. The dependent variables still are the change in consumption frequency and attitude. The interaction effects of interest for this study are those of (content * source), (trust * source), (use * source) and finally (trust * use). Regarding the interaction between content and source, no significant impact was found neither on behavioural change nor on attitudinal change (p>0.05). The influence of trust in the information source on the message outcome has been the issue of numerous studies the last years. As already stated above, no significant impact was found of trust as simple main effect on behavioural and attitudinal change. The same is true for the interaction effect of (trust * source) on attitudinal change (p>0.05). The effect on behavioural change however does show a significant impact (p=0.011). When looked at the figures however, this interaction effect seems rather small, with changes of

Project CP/56 - “Integrated evaluation of marine food items: nutritional value, safety, and consumer perception”
SPSD II - Part I - Sustainable production and consumption patterns - Agro-Food 85
consumption frequency per month not larger then 0.5 (Table III.8). One thing that can be deduced out of the table is that high trust in fish and food industry results in a decrease of fish consumption frequency in comparison to the low trust group, while the opposite is true for both other sources. The interaction effect of both (use * source) and (trust * use) did not yield significant impact neither on behavioural change nor on attitudinal change (p>0.05). Table III.8 Impact of interaction trust*source on behavioural change (consumption freq./month)
Fish and food industry Government Consumer organisation Low trust High trust Low trust High trust Low trust High trust
Behavioural change 0.289 -0.359 0.035 0.333 -0.034 0.532
2.4 Conclusions The present sample has a fish consumption frequency which is higher than population average, probably partly due to the composition of the sample (all female consumers). With regard to the experimental part in the study, especially message content appeared to be influential. A benefit only message yielded an increase in the intention to consume fish, but no impact on attitude. The latter is explained by a ceiling effect with respect to attitude, which is already very positive, hence leaving no room for further improvement following favourable news. A risk only message resulted in a lower intention to eat fish, which however is smaller in absolute value compared to the increase yielded by a benefit only message. Regarding attitudinal change however, a strong decrease or worsening of fish perception is noticed following risk only messages. A balanced message does not significantly influence behavioural intention, but lowers the attitude, with the first part of the message apparently being most influential. The impact of message content was also much stronger on attitude compared to behaviour, meaning that a more negative attitude is not consistently translated into a proportionate decrease of intention to consume fish. Neither information source, nor consumer trust in and use of information sources mediated the impact of the message in terms of attitudinal or behavioural intention change. Perceived credibility and attractiveness of the message showed positive and significant correlations with the impact on both behaviour and attitude.

Project CP/56 - “Integrated evaluation of marine food items: nutritional value, safety, and consumer perception”
SPSD II - Part I - Sustainable production and consumption patterns - Agro-Food 86
3. CONSUMER PERCEPTION ABOUT ETHICAL AND SUSTAINABILITY ISSUES OF FISH 3.1 Introduction The expansion of the world’s fishing fleet, together with a higher efficiency of fish capture, has contributed to the depletion of several fish stocks (Van Delsen et al., 2005). In response to the depleting wild fish stocks and the increasing consumer demand for fish, consumers are now being offered farmed fish as a valuable alternative (Cahu et al., 2004), with aquaculture being the fastest growing food production sector of the world (FAO, 2000). This fast development, together with an increased attention on health and food safety, has made aquaculture of increased public importance. However, aquaculture and aquacultural products are subject of rather conflicting communications towards the public. As a result, consumer perception and acceptance of farmed fish plays a crucial role in the success of aquaculture (Kole, 2003). Recently, several studies were conducted opposing farmed fish to wild fish regarding consumer perception (Farmer et al., 2000; Luten et al., 2002; Kole, 2003; Arvanitoyannis et al., 2004; Verbeke et al., 2006). In general, wild fish is perceived more positive than farmed fish by the consumer, while there is no scientific evidence supporting this perception (Luten et al., 2002; Cahu et al., 2004; EFSA, 2005). The main cause seems to be the lack of consumer knowledge concerning aquaculture. Since consumers can not rely on scientific information, they use their emotions to judge aquaculture (Verbeke et al., 2006). Whereas overfishing led to an unsustainable image for the fishery sector, aquaculture is associated with some negative environmental externalities. However, as experience with aquaculture grows worldwide, the concept of sustainable aquaculture is increasingly recognised and practitioners discover more and more that sustainable aquaculture must not only maximize benefits, but also minimize accumulation of detriments, as well as other types of negative impacts on the natural and social environment (Frankic & Hershner, 2003). With regard to ethical matters, intensive fish farming, either taking place in cages, ponds or tanks, has led to a series of problems that may be classified as husbandry diseases that are of animal welfare concern (Poppe et al., 2002). Such systems will inevitably present challenges regarding acceptable ethical standards (Baeverfjord, 1998). The life of wild fishes is also perceived as being nicer compared to the life of farmed fish, while literature is conflicting in this respect, some denying that fish can experience pain or emotions (Rose, 2002), others confirming it (Cawley, 1993; Southgate & Wall, 2001; Sneddon, 2002; Sneddon et al., 2003). Fish does not invoke compassion in the same way as most other animals (Hastein, 2004; Frewer et al., 2005). Also, little is known about how differences in perceptions of ethical issues influence consumer behaviour. Although several studies show a strong increase of consumer interest in ethical and environmental issues (Antil, 1984; Dagnoli, 1991; Charter, 1992; Mintel, 1994; Ethical Consumer, 1997/1998; Shaw & Clarke, 1999; Follows & Jobber, 2000), only few research is devoted to reveal the role and impact of these ethical and sustainable concerns in consumer decision making (Shaw & Shiu, 2003). The objective of this part is to verify if ethical matters contribute to choosing or rejecting either farmed or wild fish. In addition, characterisation is made of persons who show more interest in ethical matters and sustainability, based on socio-demographics, behaviour and attitude towards fish and involvement in fish consumption.

Project CP/56 - “Integrated evaluation of marine food items: nutritional value, safety, and consumer perception”
SPSD II - Part I - Sustainable production and consumption patterns - Agro-Food 87
3.2 Research method 3.2.1 Study design and subjects This survey was incorporated in the study dealing with the impact of risk/benefit communication as described in part III, section 2. For the data collection method and timing and for the socio-demographic distribution of the sample, we refer to that part. A specific part of the survey was intended to measure ethical and sustainability issues. The ethical items relate mainly to fish welfare, while sustainability refers to the depletion of natural fish stocks and care for the environment. Also the topic farmed versus wild was highlighted. 3.2.2 Questionnaire The first question about the subject originates from the scale of Lindeman and Väänänen (2000) dealing with ethical motives involved with food choice. These items sound out the consciousness of the consumer about animal welfare and protection of the environment. The original items in the scale were adapted to fish and were measured on a 7-point Likert scale, ranging from “totally disagree” (1) over “neither agree, nor disagree” (4) to “totally agree” (7). The consumer receives more and more information and becomes more and more involved in discussions about specific problems about over-fishing and about the differences between wild and farmed fish. The second type of questions were added to measure these ethical aspects. First, respondents were asked to which degree they agreed that by choosing farmed fish, one can attribute to the saving of fish stocks, again based on the 7-point Likert scale mentioned above. Second, respondents were asked if they would refuse to eat fish products if they knew that they had farmed(wild) origin. Third, a question was asked concerning the importance the respondent attach to the region where the fish they eat is caught, again on a 7-point Likert scale. Due to the increasing importance of traceability, there is a higher possibility to provide more information to the consumer. With the help of some items, we investigate if the consumer believes that more information can play a role in ethical matters like fish welfare and over-fishing. The scale ranged from “strong disbelief” (1) over “neutral”(4) to “strong belief”(7). Data were analysed using descriptive statistical procedures as described in 1.2.3. 3.3 Empirical findings 3.3.1 Description of the mean values Ethical matters and sustainability issues are measured by five items, yielding a satisfactory Cronbach’s alfa (0.93). Nevertheless, not all the items are combined, because different issues are touched, namely fish welfare (2 items), over-fishing (1 item) and environmental well-being (2 items). The latter was given the highest importance (5.77 on a 7-point scale), followed by over-fishing (5.60) and fish welfare (5.21), indicating a higher concern for a healthy world instead of good fish welfare. The difference in means proved to be significant (p=0.000). With regard to the item, measuring the extent of agreement that by choosing farmed fish, one can contribute to the saving of fish stocks, a more neutral mean score was found (4.11), indicating an impartial perceived consumer effectiveness. Information and communication can play a crucial role here. People are slightly aware of this, given a mean score of 4.83 on the belief that more information can guarantee a better conservation of natural fish stocks. A similar question regarding the impact of more information on animal welfare resulted in a mean of 4.33. Regarding the

Project CP/56 - “Integrated evaluation of marine food items: nutritional value, safety, and consumer perception”
SPSD II - Part I - Sustainable production and consumption patterns - Agro-Food 88
items about the interest in origin (farmed versus wild) and capture area, a negative score is obtained (respectively 3.49 and 2.83 on a 7-point scale). 3.3.2 Identification of consumers who refuse farmed or wild fish Respectively 10.2 and 11.7 percent of the respondents declare to refuse either farmed or wild fish. Cross-tabulation indicate that these are not the same persons. In what follows, characterisation of those two groups is made based on behaviour, attitude towards fish, ethical and sustainability issues and socio-demographics. Regarding behaviour, the overall fish consumption frequency and the consumption frequency of different fish types are of interest. Salmon for instance is expected to be less consumed by respondents indicating not to eat farmed fish. Besides salmon, also more than half of the trout on the market has farmed origin. The other fish types enclosed in the questionnaire (cod, tuna, Pollack and sole) are traded as wild fish. With regard to overall fish consumption frequency, no significant difference was found, although there is a clear difference in mean and direction (Table III.9). Respondents refusing to eat farmed fish have a higher average fish consumption, while the opposite is true for respondents refusing wild fish. This could be linked to the fact that consumers perceive wild fish as more tasty and healthy (Verbeke et al., 2004). With regard to both farmed fish types and wild fish types, no significant differences were found, neither between respondents who do or do not refuse farmed fish, nor between respondent who do or do not refuse wild fish. Apparently, consumers do not really know which fish types have either farmed or wild origin. Table III.9 Typifying consumers who refuse farmed or wild fish based on behaviour Reject FARMED fish Reject WILD fish Yes No p Yes No p Overall frequency#
5.43 4.48 0.126 3.88 4.67 0.063
Salmon$ 0.506 0.404 0.154 0.459 0.401 0.604 Trout$ 0.078 0.084 0.889 0.048 0.088 0.282 Cod$ 0.436 0.386 0.480 0.530 0.372 0.127 Sole$ 0.184 0.166 0.631 0.146 0.172 0.438 Tuna$ 0.808 0.402 0.172 0.609 0.419 0.173 Pollack$ 0.236 0.187 0.537 0.180 0.194 0.856 # frequency per month; $ frequency per week Regarding attitude, the items general attitude, health and nutritional value are expected to be in favour of wild fish, based on literature (Farmer et al., 2000; Luten et al., 2002; Kole, 2003; Arvanitoyannis et al., 2004; Verbeke et al., 2006). Absolute values confirm literature data when respondents refusing farmed fish or not are taken into consideration. However, only the item nutritional value yields significance (p=0.040). With respect to wild fish, none of the items showed significance. The non-significance of the item safety on the other hand was in line with literature.

Project CP/56 - “Integrated evaluation of marine food items: nutritional value, safety, and consumer perception”
SPSD II - Part I - Sustainable production and consumption patterns - Agro-Food 89
Table III.10 Typifying consumers who refuse farmed or wild fish based on attitude Reject FARMED fish Reject WILD fish Yes No p Yes No p General attitude$ 5.73 5.61 0.554 5.42 5.66 0.338 Health$ 6.63 6.40 0.126 6.28 6.44 0.249 Nutritional value$ 6.60 6.25 0.040 6.28 6.29 0.940 Safety$ 5.31 5.32 0.968 5.40 5.31 0.654 $ 7-point semantic differential with negative adjective at the left Next, analysis are done to investigate whether people refusing either farmed or wild fish act out of ethical or sustainability considerations. A summary of the results is given in Table III.11. Refusal of farmed fish does not seem to be based on ethical or sustainability consideration, given no differences in importance of fish welfare, over-fishing and environmental care between both groups. Also, the group not refusing farmed fish does not obtain a significant higher extent of agreement on the statement that by choosing farmed fish, one can attribute to the savings of natural fish-stocks. A total different conclusion can be withdrawn when the respondents who do or do not refuse wild fish are taken into consideration. A significant higher importance attached to fish welfare and environmental care associated with the group indicating to refuse wild fish indicates that ethical and sustainability considerations contribute to this refusal. The refuse’s are also more convinced of the contribution of fish capture to the depletion of natural fish-stocks. Table III.11 Typifying consumers who refuse farmed or wild fish based on ethical and sustainability issues (all items are measured on a 7-point scale)
Reject FARMED fish Reject WILD fish Yes No p Yes No p
Importance fish welfare 5.21 5.19 0.935 5.84 5.11 0.007Importance over-fishing 5.51 5.60 0.750 5.90 5.56 0.187Importance environmental care 5.71 5.77 0.824 6.23 5.71 0.034Choose farmed=>less over-fishing 3.64 4.16 0.149 4.64 4.05 0.046 Finally, socio-demographical influences are examined between the different groups (refuse farmed versus not refuse farmed and refuse wild versus not refuse wild). The socio-demographics included within this questionnaire are age, presence of children and educational level. No significant differences are found with regard to age and the presence of children. Concerning education level on the other hand, significant differences are found between respectively refusal of farmed (yes or no) and refusal of wild (yes or no). It appeared that relative more low educated people were encountered in the group claiming to refuse wild fish. 3.3.3 Identification of respondents with low and high interest in fish origin (farmed/wild) For this discussion, the three issues (fish welfare, over-fishing and environmental care) related to the importance of ethical matters and sustainability issues when eating fish are combined into one construct, based on the satisfactory Cronbach’s alfa (0.933). This construct is considered as being interval scaled and correlations are used to link this variable to behaviour, general attitude, interest in capture area and origin, importance of information to guarantee better fish and environmental welfare (Table III.12).

Project CP/56 - “Integrated evaluation of marine food items: nutritional value, safety, and consumer perception”
SPSD II - Part I - Sustainable production and consumption patterns - Agro-Food 90
Table III.12 Correlation between “importance of ethical and sustainability issues” and … r p
Behaviour (fish consumption frequency) 0.099 0.064 General attitude 0.078 0.151 Interest in capture area 0.245 0.000 Interest in origin (farmed/wild) 0.223 0.000 Choosing farmed=>less over-fishing 0.267 0.000 Importance of information 0.431 0.000 A slightly positive, but non-significant correlation is found between fish consumption frequency and general attitude towards fish consumption on the one hand and importance attached to ethical and sustainability issues associated with fish consumption on the other hand. Hence, neither behaviour nor attitude seems to be strongly shaped by ethical and sustainability matters. With respect to the interest in capture area and origin of the fish consumed, a positive and highly significant correlation is found, meaning that either capture area and origin is associated by the respondent with ethical and sustainability issues or that respondents attaching the largest importance to ethical and sustainability issues are the ones with the highest interest and concerns in general. The strongly positive correlation corresponding with the last item in Table 4, measuring the extent to which the respondent believes that more information can guarantee a higher degree of both fish welfare and saving of natural fish stocks, points in the direction of the latter possibility. Finally, the positive and significant correlation with the statement that by choosing farmed fish, one can attribute to the saving of natural fish stocks, indicates a higher awareness of the present problems associated with fish capture for respondents with the higher importance attached to ethics and sustainability. With regard to socio-demographics, only age appeared to result in a different importance of ethical and sustainability issues (r=0.138; p=0.010). 3.4 Conclusions Based on a consumer survey performed in June 2005, this paper examined the importance of ethical and sustainability issues towards fish and its relationship with fish consumption frequency, attitude towards fish consumption, socio-demographics and the refusal of either farmed or wild fish. In general, ethical and sustainability issues were indicated as being important by the consumer in relation to fish consumption. This claimed importance however, was neither translated in a significant correlation with total fish consumption frequency nor with general attitude towards eating fish. The choice not to eat wild fish seemed to have part of its origin in ethical and sustainability issues, given a significantly higher importance attached to these issues by consumers who claim to refuse wild fish, and a negative correlation between interest in sustainability and cod consumption. This was not the case with respect to rejecting farmed fish, which was not associated with importance attached to ethical or sustainability issues. Finally, respondents with the highest importance attached to ethical and sustainability issues are the ones with the highest interest in information in general, with the highest belief in a potential benefit of receiving more information, and the highest perceived efficacy of their own deliberate choice.

Project CP/56 - “Integrated evaluation of marine food items: nutritional value, safety, and consumer perception”
SPSD II - Part I - Sustainable production and consumption patterns - Agro-Food 91
REFERENCES PART III Alderman DJ, Hastings TS. Antibiotic use in aquaculture: development of antibiotic resistance – potential for consumers’ health risks. Int J Food Science and Techn 1998;33:139-55.
Antil JH. Socially responsible consumers: profile and implications for public policy. J Macromarketing 1984;Autumn:18-39.
Arvanitoyannis IS, Krystallis A, Panagiotiaki, P, Theodorou AJ. A marketing survey on Greek consumers’ attitudes towards fish. Aquacult Int 2004;12:259-279.
Baeverfjord G. Ethics and animal welfare in intensive aquaculture production. Farming marine fish beyond the year 2000. Technological solutions for biological challenges, Copenhagen, Denmark, ICES CM/1998/ L:18; 1998.
Bender DA. The vitamins. In: Gibney MJ, Vorster HH, Kok FJ, editors. Introduction to human nutrition. Oxford: Blackwell Science Ltd; 2002. p. 125-76.
Breakwell G. Risk communication: factors affecting impact. Br Med Bull 2001;56(1):110-20.
Brunsø K. Consumer research on fish in Europe. In: Luten JB, Oehlenschlager J, Olafsdottir G, editors. Quality of fish from catch to consumer: labelling, monitoring and traceability. Wageningen: Wageningen Academic Publishers; 2003. p. 335-44.
Cahu C, Salen P, De Lorgeril M. Farmed and wild fish in the prevention of cardiovascular diseases: Assessing possible differences in lipid nutritional values. Nutrition Metabolism and Cardiovascular Diseases 2004;14:34-41.
Cawley G. Welfare aspects of aquatic veterinary medicine. Aquaculture for Veterinarians. L. Brown editor. Pergamon Press: Oxford; 1993. p. 169-71.
Caygill CPJ, Charlett A, Hill MJ. Fat, fish, fish oil and cancer. Brit J Cancer 1996;74:159-64.
Chang H, Kinnucan H. Advertising, information and product quality: The case of butter. American Journal of Agricultural Economics 1991;11:1195-1203.
Charter M. Greener Marketing: A responsible approach to business. Greenleaf Publishing: Sheffield. 1992.
Dagnoli J. Consciously green. Advertising Age 1991;62:14.
De Boer M, McCarthy M, Brennan M, Kelly A, Ritson C. Public understanding of food risk issues and food risk messages on the island of ireland: the views of food safety experts. J Food Saf 2005;25:241-65.
De Deckere EAM, Korver O, Verschuren PM, Katan MB. Health aspects of fish and n-3 polyunsaturated fatty acids from plant and marine origin. Eur J Clin Nutr 1998;52:749-53.

Project CP/56 - “Integrated evaluation of marine food items: nutritional value, safety, and consumer perception”
SPSD II - Part I - Sustainable production and consumption patterns - Agro-Food 92
EFSA. Opinion of the scientific panel on contaminants in the food chain on a request from the European Parliament related to the safety assessment of wild and farmed fish. The EFSA Journal 2005;236:1-118.
ETHICAL CONSUMER. The rise and rise of ethical consumerism. Ethical Consumer 1997/1998;50:22-25.
European Commission. Assessment of dietary intake of dioxins and related PCBs by the population of EU members states. Scoop Report. Brussels: European Commission, Directorate-General Health and Consumer Protection, 2000.
FAO. Statistical databases. [Online]. 2000; Available from: URL: http://apps.fao.org
Farmer LJ, Mc Connell JM, Kilpatrick DJ. Sensory characteristics of farmed and wild Atlantic salmon. Aquaculture 2000;187(1-2):105-25.
Follows SB, Jobber D. Environmentally responsible purchase behaviour: a test of a consumer model. Eur J Marketing 2000;34(5/6):17.
Frankic A, Hershner C. Sustainable aquaculture: developing the promise of aquaculture. Aquacult Int 2003;11(6):517-30.
Frewer L, Kole A, Van de Kroon S, De Lauwere C. Consumer attitudes towards the development of animal-friendly husbandry systems. J Agric Environ Ethics 2005;18:345-67.
Frewer L, Scholderer J, Bredahl L. Communicating about the risks and benefits of genetically modified foods: the mediating role of trust. Risk Anal 2003;23(6):1117-33.
GfK. Consumer tracking: Meat and fish. Brussels: VLAM and Gesellschaft für Konsumforschung; 2003.
Gross T. Consumer attitudes towards health and food safety. In: Luten JB, Oehlenschlager J, Olafsdottir G, editors. Quality of fish from catch to consumer: labelling, monitoring and traceability. Wageningen: Wageningen Academic Publishers; 2003. p. 401-11.
Hastein T. Animal welfare issues relating to aquaculture. Conference paper, Global Conference on Animal Welfare: an OIE initiative. Paris 2004 February 23-25:219-27.
Hoge Gezondheidsraad. Vis en gezondheid bij volwassen [Fish and Health among adults]. Report D/2004/7795/3. Brussels: FOD Volksgezondheid; 2004.
Inra Marketing Research. Fish campaign evaluation ‘fish or fish’ Results after one year of campaigning. Brussels: Inra Marketing Research; 2003.
Karl H, Kuhlmann H, Ruoff U. Transfer of PCDDs and PCDFs into the edible parts of farmed rainbow trout, Oncorhynchus mykiss (Walbaum), via feed. Aq Res 2003;34:1009-14.
Karl H, Ruoff U, Bluthgen A. Levels of dioxins in fish and fishery products on the German market. Chemosphere 2002;49:765-73.

Project CP/56 - “Integrated evaluation of marine food items: nutritional value, safety, and consumer perception”
SPSD II - Part I - Sustainable production and consumption patterns - Agro-Food 93
Kole A. Consumer opinions towards farmed fish, accounting for relevance and individual knowledge. In: Luten JB, Oehlenschläger, J, Olafsdottir G, editors. Quality of fish from catch to consumer: labelling, monitoring and traceability. Wageningen: Wageningen Academic Publishers; 2003. p. 393-400.
Kris-Etherthon PM, Harris WS, Appel LJ. Omega-3 fatty acids and cardiovascular disease – new recommendations from the American Heart Association. Arteriosclerosis, Thrombosis and Vascular Biology 2003;23:151-2.
Kris-Etherton PM, Harris WS, Appel LJ. Fish consumption, fish oil, omega-3 fatty acids, and cardiovascular disease. Circulation 2002;106:2747-57.
Larsson SC, Kumlin M, Ingelman-Sundberg M, Wolk A. Dietary long-dchain n-3 fatty acids for the prevention of cancer: a review of potential mechanisms. Am J Clin Nutr 2004;79:935-45.
Leek S, Maddock S, Foxall G. Situational determinants of fish consumption. Br Food J 2000;102(1):18-39.
Lobb AE. Consumer trust, risk and food safety: a review. Food Econ 2005;2(1):3-12.
Luten J, Kole A, Schelvis R, Veldman M, Heide M, Carlehög M, Akse L. Evaluation of wild cod versus wild caught, farmed raised cod from Norway by Dutch consumers. Økonomisk Fiskeriforskning 2002;12:44-60.
MINTEL. The green consumer. Mintel Special Report. Mintel: London. 1994.
National Institute of Statistics (NIS). Population Census Data January 1, 2003. Brussels: NIS; 2002.
Olsen SO. Understanding the relationship between age and seafood consumption: the mediation role of attitude, health involvement and convenience. Food Quality and Preference 2003;14:199-209.
Poppe TT, Barnes AC, Midtlyng PT. Welfare and ethics in fish farming. Beull Eur Assoc Fish Pathol 2002;22(2):148-51.
Richey MH, McClelland L, Shimkunas, A. Relative influence of positive and negative information in impression formation and persistence. J Personality and Social Psychology 1967;6:322-7.
Rose JD. The neurobehavioral nature of fishes and the question of awareness and pain. Rev Fish Sci 2002;10(1):1-38.
Salem NJ, Pawlosky RJ. Docosahexaenoic acid is an essential nutrient in the nervous system. J Nutr Science and Vitaminology 1992;38:153-6
Sasaki S, Horacsek M, Kesteloot H. An ecological study of the relationship between dietary-fat intake and breast-cancer mortality. Prev Med 1993;22:187-202.

Project CP/56 - “Integrated evaluation of marine food items: nutritional value, safety, and consumer perception”
SPSD II - Part I - Sustainable production and consumption patterns - Agro-Food 94
Scientific Advisory Committee on Nutrition. Committee on Toxicity of Chemicals in Food. Advice on fish consumption: Benefits and Risks. London: The Stationery Office; 2004.
Shaw D, Clarke I. Belief formation in ethical consumer groups: an exploratory study. Marketing Intelligence and Planning 1999;17(2):109-19.
Shaw D, Shiu E. Ethics in consumer choice: a multivariate modelling approach. Eur J Marketing 2003;37(10):1485-98.
Sidhu KS. Health benefits and potential risks related to consumption of fish or fish oil. Regul Toxicol Pharmacol 2003;38:336-44.
Sneddon LU, Braithwaite VA, Gentle MJ. Do fishes have nociceptors? Evidence for the evolution of a vertebrate sensory system. Proc R Soc Lond series B – Biol Sci 2003;270(1520):1115-21.
Sneddon LU. Anatomical and electrophysical analysis of the trigeminal nerve in a teleost fish, Oncorhynchus mykiss. Neurosci Lett 2002;319(3):167-71.
Southgate P, Wall T. Welfare of farmed fish at slaughter. In Practice 2001;23(5):277-84.
Tanaka Y, Funada T, Hirano J, Hashizume R. Triacylglycerol specificity of Candida cylindracea lipase: effect of docosahexaenoic acid on resistance of triacylglycerol to lipase. J Am Oil Chemists’ Society 1993;70:1031-4.
Terry PD, Rohan TE, Wolk L. Intakes of fish and marine fatty acids and the risks of cancers of the breast and prostate and of other hormone-related cancers: a review of the epidemiological evidence. Am J Clin Nutr 2003;77:532-43.
Trondsen T, Scholderer J, Lund E, Eggen A.E. Perceived barriers to consumption of fish among Norwegian women. Appetite 2003;41:301-14.
Van Delsen B, Dhont J, Bossier P, Sorgeloos P. Aquacultuur: sleutel tot de blauwe revolutie. Het Ingenieursblad 2005;11-12:34-40.
Verbeke W, Sioen I, Pieniak Z, Van Camp J, De Henauw S. Consumer perception versus scientific evidence about health benefits and safety risks from fish consumption. Public Health Nutr 2004;8(4):422-29.
Verbeke W, Sioen I, Vermeir I, Brunsø K, Van Camp J, De Henauw S. Consumer perception versus scientific evidence of farmed versus wild fish: exploratory insights from Belgium. Aquacult Int, submitted.
Verbeke W, Vackier I. Individual determinants of fish consumption in Belgium: application of the theory of planned behaviour. Appetite 2005;44(1):67-82.
Verbeke W, Viane J. Effects of communication (advertising or news) on sales of commodity. In: Frewer, L., Risvik, E., Schifferstein, H. (eds.), Food, people and society: A European perspective of consumers’ food choices. Springer, Berlin; 2001. p. 299-315.

Project CP/56 - “Integrated evaluation of marine food items: nutritional value, safety, and consumer perception”
SPSD II - Part I - Sustainable production and consumption patterns - Agro-Food 95
Verbeke W, Ward R. A fresh meat almost ideal demand system incorporating negative TV press and advertising impact. Agric Econ 2001;25:359-74.
Vrijens B, De Henauw S, Dewettinck K, Talloen W, Goeyens L, De Backer G et al. Probabilistic intake assessment and body burden estimation of dioxin-like substances in background conditions and during a short food contamination episode. Food Additives and Contaminants 2002;19:687-700.
Welch AA, Zavitsanos X, Tumino R, Galasso R, Bueno-de-Mesquita HB, Ocké MC et al. Variability of fish consumption within the 10 European countries participating in the European investigation into Cancer and Nutrition (EPIC) study. Public Health Nutr 2002;5:1273-85.
Wetenschappelijk Instituut voor Volksgezondheid (WIV). Health interview survey. Brussels: WIV; 2001.
Whelton SP, He J, Whelton PK, Munter P. Meta-analysis of observational studies on fish intake and coronary heart disease. Am J Card 2004;93:1119-23.


Project CP/56 - “Integrated evaluation of marine food items: nutritional value, safety, and consumer perception”
SPSD II - Part I - Sustainable production and consumption patterns - Agro-Food 97
PART IV. CONCLUSIONS AND RECOMMENDATIONS
This project has generated a number of new and valuable scientific insights, of use in the broad debate on: The potential conflict between on the one hand the nutritional benefits from seafood
consumption – mainly related to its content of LC n-3 PUFAs – and on the other hand the potential adverse health effects due to toxicological hazards present in marine foods – mainly persistent organochlorine compounds and heavy metals;
The position of the consumer in this conflictive landscape; The development of innovative economical and scientific lines aimed at establishment of
a sustainable fish supply and consumption. 4.1. Drawbacks and shortcomings of the study Before summarizing the main results, it seems useful, however, to touch on the most prominent drawbacks and shortcomings of the study, that are of influence to the overall interpretation of the results. Sources of “noise” on the results are situated on different levels of input data: (1) nutrient composition data and contaminant contents in marine foods, (2) origin of the marine foods for consumption on local level and particularities in the distribution of marine foods across the consumers in Belgium, and (3) consumption data. Clearly, the use of secondary data in stead of own analytical data – both on the level of nutrients and contaminants – introduces a number of potential biases; e.g. the data published in reports worldwide are often based on different sampling strategies, different analytical methods, different format for reporting etc. It has to be noted, however, that the use of new analytical data has never been envisaged for this project and was not calculated in the budget. Therefore, the adoption of a strategy for using secondary data was the only option. The experience of setting up a new data base for use in probabilistic modelling has however led to a number of proposals for remediation of the most important problems in this context. A number of data manipulations have been proposed that should guarantee the best possible preparation of each new dataset for input in the probabilistic models. Mutatis mutandis, outmost efforts have been done in order to move from sets of limited numbers of observations to curtailed parametric distributions for contaminants in fish species, ready-to-use in probabilistic models. The resulting data base is a most valuable basis for the modelling envisaged in this project. Moreover, the project managers will take initiatives – in consultation with the commissioners – in order to allow other potential users of such data to a full and guided access to this data base. The same applies to the nutrient data bases. Perhaps the largest potential source of bias is linked to the traceability of marine foods as a condition for an adequate linkage of contamination data with consumption data. Here, a clear recommendation can be formulated vis-à-vis the responsible public authorities to take further initiatives in order to guarantee the traceability up to the level of the actual fishing grounds, and not merely to the countries from which the seafood has been imported. Another limitation of the overall results comes from the data base on seafood consumption. Only two data bases have been used, that were of sufficient quality and ready to use at the time of the embarking of the analyses, one in adolescents and one in adults. Ideally, a nationwide food consumption survey based on a sufficiently detailed methodology in terms of

Project CP/56 - “Integrated evaluation of marine food items: nutritional value, safety, and consumer perception”
SPSD II - Part I - Sustainable production and consumption patterns - Agro-Food 98
dietary assessment method should be used for this kind of exercise. However, at the time of the project, the data from the Belgian National Food Consumption Survey – 2004 – were not yet available. A more sophisticated approach might have been adopted by incorporating in the model also different levels of uncertainty, e.g. with respect to the origin of the fish. However, by doing this, one introduces a lot of extra technical procedures, which were considered beyond the scope of this project. 4.2. Overall conclusions Having looked at some limitations and cautions for the overall interpretation of the results, a number of important overall conclusions from this project can be listed: Data on the nutrients under study in this project (LC n-3 PUFA, vitamin D, and iodine) in
seafood allow concluding that a large variability exists between and within species. Likewise, for the contaminants under study in this project (mercury, indicator PCBs, and
dioxin-like compounds), a considerable within and between species variability can be found. The within-species variability is partly explained by the origin – with the Baltic area and the Mediterranean area being hot spots for dioxin-like compounds and mercury, respectively. Standard cut-off values for toxicological safety were found to be exceeded in a non-negligible part of the considered data.
Consumption data for marine foods show that both in adolescents and in adults, consumption of fish is too low and certainly below recommendations. Likewise, the intake of the typical marine foods derived LC n-3 PUFA is found to be low in the populations under study and substantially below the recommended population reference intakes.
Combined intake assessment for nutrients and contaminants, shows a strong overall correlation between the intakes of beneficial nutrients and potentially hazardous contaminants. If, however, specific origins of highly contaminated marine foods (e.g. fish from Baltic area) are excluded, it seems realistic and feasible to increase the intake of LC n-3 PUFA from seafood up to recommended population levels, without substantially exceeding intake of contaminants above levels of real toxicological concern.
In general, consumers have insufficient knowledge on the importance of seafood for human health. In developing strategies to increase awareness and consumption, it should be recognised that positive messages regarding fish consumption have a lower weight in the overall perception as compared to negative messages.
4.3. Specific recommendations On the basis of the final results of the project, a number of specific recommendations and relevant information concerning seafood consumption can be formulated, regarding the following topics:
1. Current and amended recommendations concerning seafood consumption; 2. Food and nutrition monitoring; 3. Wild versus farmed fish; 4. Consumer perception and behaviour related to seafood.

Project CP/56 - “Integrated evaluation of marine food items: nutritional value, safety, and consumer perception”
SPSD II - Part I - Sustainable production and consumption patterns - Agro-Food 99
Overall, such recommendations can be useful for different sectors, mainly (1) the public authorities in the field of Public Health and Food & Nutrition Policy; (2) Food and Feed Industry; (3) Consumer organizations. 4.3.1. Current and amended recommendations concerning seafood consumption The actual recommendation of the Belgian Health Council is to consume one to two portions of seafood per week, corresponding to 150 to 300 grams of seafood per week (Belgian Health Council, 2004). The results of this project, scenario analyses included, showed that these recommendations are still valid. The omega-3 fatty acids intake of the Belgian population is far below the current recommendation. As far as it is chosen to increase the intake via seafood species, the weekly consumption of two portions of fatty fish – as shown for salmon in our scenario simulations - can lead to an adequate intake of EPA and DHA, and this would moreover lead to an increased vitamin D and iodine intake. If, however, lean and fatty fish species are alternated, other sources of omega-3 fatty acids should also be taken into account. In a scenario where no Baltic fish is allowed on the Belgian market, such consumption would not lead to an intake of dioxin-like compounds of major toxicological concern. Regarding mercury, no risk was assessed for the Belgian population. Nevertheless, pregnant women, most vulnerable for the toxicological concerns related to that compound, are advised to avoid frequent and abundant consumption of large predatory fishes, e.g. tuna, sword fish and shark. In addition, within the context of this proposal, variation between fatty seafood species is recommended in order to avoid repeated consumption of the most contaminated species (e.g. salmon and eel). The above summarized results make clear that there is no need to alter the current dietary recommendations concerning fish consumption. It is important to communicate to the consumer population that seafood is an important nutrient source in the human diet and that the benefits of seafood consumption should not be overlooked nor underestimated. There are indeed unfavourable contaminants present in seafood, but at the current and the recommended consumption rate and under the assumption that Baltic fish does not reach the Belgian market, there is no reason for major concern. 4.3.2. Relevant information in the context of food and nutrition monitoring As described in part I of this report, an extensive effort was made to collect data describing the nutrient and contaminant concentration in seafood. In that phase of the project, different problems were encountered. In addition, the available data from the Belgian Food Safety Agency were evaluated, and it was clear that not enough data were available for the execution of a detailed intake assessment. It should be recommended that extensive, regular, and detailed monitoring of seafood products available on the Belgian market would be considered as high priority from public health point of view. A detailed sampling plan and analytical protocol according to international recommendations should thereby be developed and followed. Moreover, a more systematic and thorough monitoring of a number of species coming from certain “doubtful” fishing grounds, can be relevant. In addition, as stated above, continued efforts regarding the traceability of the origin of the fish sold on local markets, are considered of high importance, in order to optimise the possibilities of linking consumption data with nutrient and/or contaminant data.

Project CP/56 - “Integrated evaluation of marine food items: nutritional value, safety, and consumer perception”
SPSD II - Part I - Sustainable production and consumption patterns - Agro-Food 100
Obviously, such transparency “from fishing ground to fork” is not a local issue, but necessitates constructive international political efforts. Rules about the labelling of seafood products exist now on EU level (European Commission, 2001), with one of the obligatory issues being the labelling of the origin. One of the problems, however, seems to be that the obligatory level of detail for the labelling of the origin, does not allow the type of linkage necessary for a thorough monitoring of exposure assessment. As an example, on the basis of the current regulation, one cannot make the distinction between fish from the North Sea and fish from the Baltic Sea or Mediterranean Sea, since these are all part of the “North West Atlantic region”. It should also be kept in mind that the conclusion that “recommended seafood consumption would not lead to contaminant intakes of major toxicological concern”, is essentially conditional upon existing structural and rather strict rules and regulations, and extensive control programs aimed at avoiding that highly contaminated food items (above the EU limits) would become available for consumers. In other words, such positive conclusion should in no way be interpreted as an argument in favour of any weakening or downplaying of such regulations and monitoring programmes. 4.3.3. Recommendations about farmed versus wild fish Levels of contamination are similar in wild and farmed fish (EFSA, 2005). Nevertheless, the contamination levels in wild fish can only be reduced by reducing emission of contaminants to the environment. In contrast, reduced contamination of farmed fish can be obtained by choosing feed ingredients naturally low in contaminants or by introducing cleaning processes, whilst safeguarding the nutritional value. A Norwegian study showed that the total exposure to dioxins and dlPCBs from the whole diet can be reduced by about 25% by reducing the level in fish from 2 to 0.5 pg TEQ/g fish. They concluded that the results of such a reduction in farmed fish would be that: (1) the adult population would not exceed the TDI for dioxins and dlPCBs; and (2) the consumption of oily fish should not need to be restricted (Norwegian scientific committee for food safety, 2006). Moreover, encouraging the population to consume fish, will unarguable need to go together with the development of sustainable fish farms, since overfishing has exhausted the natural sources of the seas and oceans. 4.3.4. Relevant information about consumer perception and behaviour Consumer research has revealed that a lot of misunderstandings are circulating in the consumers’ knowledge regarding fish, mainly as far as the presence of nutrients is concerned, and less so regarding contaminants. This means that when communicating about fish more prejudices about nutrients have to be put aside. Consumer research also showed that a “risk-only message” about fish consumption will have a negative impact on consumers’ attitude that will not be counterweighted by “benefit-only message”. The reason for this is that fish already has a very positive imago for the Belgian consumers. A risk-only message will have a strong impact on that imago (so it is better to avoid this), but the influence on the behavioural intention is low. On the other hand a benefit only message will have a positive effect on behavioural intention. The intake assessment results showed that the intake of omega-3 fatty acids is low. Based on the previous mentioned results, communication only focussing on the benefits of omega-3 fatty acids can have a positive effect on the behavioural intention of the consumers. But this is not possible, as there are also risks related to seafood consumption. When one can be sure that no Baltic fish would be available on the Belgian market, the risks decrease

Project CP/56 - “Integrated evaluation of marine food items: nutritional value, safety, and consumer perception”
SPSD II - Part I - Sustainable production and consumption patterns - Agro-Food 101
clearly, and a benefit-only message is possible. It is important to mention that it was only possible to measure behavioural intentions of the consumers, not the behaviour as such. The behaviour related to fish is also influenced by the price, the presence of fish bones, and the typical smell of fish … 4.4. References Belgian Health Council. Vis en gezondheid bij volwassenen. FOD Volksgezondheid. D/2004/7795/3. 2004.
EFSA. Opinion of the scientific panel on contaminants in the food chain on a request from the European Parliament related to the safety assessment of wild and farmed fish. The EFSA Journal 2005; 236.
European Commission. COMMISSION REGULATION (EC) No 2065/2001 of 22 October 2001 laying down detailed rules for the application of Council Regulation (EC) No 104/2000 as regards informing consumers about fishery and aquaculture products. L 278/6. 22-10-2001. Brussels.
Norwegian scientific committee for food safety. Fish and seafood consumption in Norway - Benefits and risks. 1-7. 2006. Oslo.


Project CP/56 - “Integrated evaluation of marine food items: nutritional value, safety, and consumer perception”
SPSD II - Part I - Sustainable production and consumption patterns - Agro-Food 103
PART V. SCIENTIFIC PUBLICATIONS A1-Publications o Verbeke W, Sioen I, Pieniak Z, Van Camp J, De Henauw S. Consumer perception versus
scientific evidence about health benefits and safety risks from fish consumption. Public Health Nutrition 2005; 8(4):422-429.
o Sioen I, Haak L, Raes K, Hermans C, De Henauw S, De Smet S, Van Camp J. Effects of pan-frying in margarine and olive oil on the fatty acid composition of cod and salmon. Food Chemistry 2006; 98(4):609-617.
o Sioen I, Pynaert I, Matthys C, De Backer G, Van Camp J, De Henauw S. Dietary intakes and food sources of fat and individual polyunsaturated fatty acids in Belgian women. Lipids 2006; 41(5):415-422.
o Sioen I, Van Camp J, Verdonck F, Van Thuyne N, Willems J, De Henauw S. How to use secondary data on seafood contamination for probabilistic exposure assessment purposes? Main problems and potential solutions. Human and Ecological Risk Assessment. Accepted (in press).