integrated computational materials engineering for
TRANSCRIPT

Copyright © 2014 by Lockheed Martin Corporation. Published by the American Institute of Aeronautics and Astronautics, Inc., with permission. 1
Integrated Computational Materials Engineering for Airframe Composite Structure Applications
S. P. Engelstad, R.W. Koon, J.E. Action Lockheed Martin Aeronautics Company
J.M. Riga Lockheed Martin Advanced Technology Labs
A.M. Waas The University of Michigan D. Robbins, R.W. Dalgarno
Autodesk A.R. Arafath, A. Poursartip
Convergent Manufacturing Technologies Inc. Introduction
Integrated Computational Materials Engineering (ICME) is a game-changing AFRL and industry vision to reduce the material and process development cycle time and cost, simultaneously bringing optimized material systems to the war fighter tailored to the needs of both the airframe and propulsion systems [Ref: National Materials Advisory Board]. The near-term path to achieving these goals is through integration of material modeling capabilities. AFRL is currently working on two Foundational Engineering Problems (FEPs), one for metallic aircraft applications, and one for composites. GE Aviation and Lockheed Martin Aeronautics (LM Aero) have teamed to work the composites FEP, called “Integrated Computational Methods for Composite Materials (ICM2)” specifically targeting integration of composites processing, micromechanics, and damage progression modeling codes to address composite material development and application issues. GE is focused on engine applications, whereas LM Aero is focused on airframe applications.
For the airframe specific ICM2 FEP, LM Aero is targeting the fundamental issues that drive the design of acreage composite materials on the next generation airframes. In order to meet composite airframe future needs, large scale airframe manufacturing will target larger, unitized composite assemblies with increased use of bonding and reduced part-count. Process automation will be utilized to reduce costs through reductions in touch labor. Improvements in composite design allowables are critical to optimal airframe weight (and hence performance) and must be obtained through use of higher performance resins and fibers along with reduced variability in key sizing properties. The ICM2 program intends to integrate composite process and design modeling codes to streamline the development cycle time and reduce the cost to implement such new high performance materials on next generation aircraft. For the ICM2 program’s demonstration purposes LM Aero is studying the IM7/M65 bismaleimide (BMI) system for application to large acreage wing skin and web applications. M65 is an established BMI system (MRL ≥5) well suited to manufacturing using high speed automated fiber placement (AFP).
BMI systems have experienced increased usage on fighter aircraft due primarily to key structural design properties such as open hole compression (OHC) and compression-strength-after-impact (CSAI), the values for which exceed epoxies at max service temperature and moisture conditions [Rousseau et al.] These key properties often “size” the acreage of the aircraft composite skins. Bolted joint strength and acreage repair criteria are most closely related
Dow
nloa
ded
by U
nive
rsity
of
Mic
higa
n -
Dud
erst
adt C
ente
r on
Dec
embe
r 14
, 201
7 | h
ttp://
arc.
aiaa
.org
| D
OI:
10.
2514
/6.2
015-
0198
56th AIAA/ASCE/AHS/ASC Structures, Structural Dynamics, and Materials Conference
5-9 January 2015, Kissimmee, Florida
10.2514/6.2015-0198
Copyright © 2015 by Lockheed Martin Corporation.
Published by the American Institute of Aeronautics and Astronautics, Inc., with permission.
AIAA SciTech Forum

Copyright © 2014 by Lockheed Martin Corporation. Published by the American Institute of Aeronautics and Astronautics, Inc., with permission. 2
to OHC, whereas CSAI properties relate to damage tolerance. The ICM2 program will build on and amplify the weight advantage offered by IM7/M65 by studying the autoclave cure cycle effects on this BMI system with the goal to optimize these critical design properties for aircraft weight.
As for modeling tools selected for use on ICM2 (see Figure 1), the GE/LM team has chosen Convergent Manufacturing Technologies’ COMPRO to predict the effect of varied cure process parameters for both the engine and airframe applications. The team has also selected the multi-scale progressive damage modeling capability provided by Autodesk Simulation Composite Analysis (ASCA) software, a commercial advanced capability add-on to finite element codes including ABAQUS and ANSYS. The ASCA and COMPRO tools will be uniquely connected by a micromechanics analysis tool from the University of Michigan (UofM).
Figure 1. ICM2 Composite Modeling Tools
Model Definition
In this section descriptions are given for the general capabilities of the three analysis tools used in the ICM2 program: Convergent COMPRO, Autodesk ASCA, and UofM Micromechanics. These three tools are to be integrated during this program, and form the nucleus of the integrated software suite. Convergent COMPRO - Process-induced residual stress and deformation are two of the most critical issues in the processing of composite structures. Residual stresses that develop during processing have a significant impact on the performance of composite structures, by consuming a significant amount of the matrix capacity, and by potentially adding assembly loads due to poor fit up. While process-induced stresses are unavoidable in a manufacturing process, prior knowledge of the main drivers helps to optimize the cure cycle.
Integrated Computational ModelsLocalized
MechanicalBehavioral
Models
Bonding & Process
Models
Engine/ Airframe
Component
Element
Coupon & Material Characterization
Material Databases
Current Building
Block Testing
Coupon & Material
Characterization
Element
Global DesignModels
Component
Engine/ Airframe
ICME BuildingBlock Testing
DigitalFramework
Global Design
Hypersizer - Wing Box Structure
ABAQUS or ANSYS -Component Buckling
ABAQUS or ANSYS -Global Stress
Localized Mech. Behavior
Autodesk ASCA -Progressive Damage
UofM Micromechanics –Lamina Elastic Properties & Strengths
Bonding and Process
COMPRO - Residual Stress & Cure Process
UofM Cure Analysis -Cure Process
GRC Matlab Script -Polyimide Cure
Dow
nloa
ded
by U
nive
rsity
of
Mic
higa
n -
Dud
erst
adt C
ente
r on
Dec
embe
r 14
, 201
7 | h
ttp://
arc.
aiaa
.org
| D
OI:
10.
2514
/6.2
015-
0198

Copyright © 2014 by Lockheed Martin Corporation. Published by the American Institute of Aeronautics and Astronautics, Inc., with permission. 3
The factors that drive residual stresses can be classified as intrinsic (material related) and extrinsic (part and process related). Examples of intrinsic factors are anisotropic thermal expansion and resin cure shrinkage, and examples of extrinsic factors are lay-up, part and tool geometry, cure cycle, tool material, tool surface, and caul-sheets. COMPRO, a multi-physics composite processing plug-in for third party finite element solvers such as ABAQUS, ANSYS, MSC MARC etc., is specifically designed to account for all major sources of process-induced stress and deformation identified in the literature in addition to the effects of tooling (see Figure 2). The basic details of the underlying science have been described elsewhere [Hubert et al. (1999) and Johnston et al. (2001)], with the capabilities being continuously updated and extended, e.g. [Zobeiry et al. 2003].
Figure 2. COMPRO: a multi-physics composite processing plug-in for 3rd party FE solvers UofM: Micromechanics Based Modeling of Effects of Curing on Ply Strengths –The stress induced by the curing process can cause micro damage that can alter the mechanical properties of the final structural configuration. Cracks already existing before applying external loading can affect the final properties of the laminate. Shrinkage developed during the curing, and the non-uniformity in the cure process may change the shape of the final product. To improve the design of composite structures and predict the material properties of laminated structures these effects have to be analyzed. A micromechanics analysis is performed at the fiber-matrix scale to capture failure mechanisms that influence deformation response at the component (structural) scales. To this purpose, an assumption is made that it is possible to identify a repeating Representative Unit Cell (RUC) of a lamina in the laminate. The RUC is analyzed to compute the actual strengths of the laminate taking into account the phenomena mentioned above. Numerical simulations reduce the costs since the number of
Figure 3. Hexagonally packed fiber-matrix RUC
Dow
nloa
ded
by U
nive
rsity
of
Mic
higa
n -
Dud
erst
adt C
ente
r on
Dec
embe
r 14
, 201
7 | h
ttp://
arc.
aiaa
.org
| D
OI:
10.
2514
/6.2
015-
0198

Copyright © 2014 by Lockheed Martin Corporation. Published by the American Institute of Aeronautics and Astronautics, Inc., with permission. 4
experimental tests needed decreases. By means of virtual tests it is possible to optimize the cure cycle to reduce detrimental effects of residual stresses developed during the process. The UoM approach is based on two subsequent steps. For a given cure cycle, the first step is to determine the stress evolution due to the curing and the possibility of damage during cure. The matrix material is initially a liquid resin, during the curing it gradually solidifies. Due to the solid networks formed during curing the stiffness increases and simultaneously the RUC contracts. If a volume of material cracks, it is assumed that no further curing can take place in this cracked region. That is, it is assumed that cracking during the cure process leads to no further curing. The critical tensile stress for cracking typically changes with the degree of cure. When cracks occur, the stiffness of the matrix material is reduced, which ultimately controls the tensile strength of the RUC. A detailed description of the stress evolution model is given in [Heinrich et al. (2011)]. The crack band approach is used to evaluate damage [Bazant (1983)]. The second step in the UoM microscale approach consists in simulating a mechanical problem where loading is applied to the RUC in different directions to determine strengths. Damage progression modeled using the crack band approach continues until failure. The outcome of this analysis is ply level composite stiffness and strengths, while accounting for the cure cycle. The analysis is done using commercially available finite element software ABAQUS/Standard using a UMAT user subroutine. Autodesk ASCA - Autodesk Simulation Composite Analysis (ASCA) software integrates with commercial finite element codes to facilitate progressive failure analysis of structures composed of unidirectional and woven composite materials. The code decomposes composite stress and strain states into constituent average stress and strain states. These constituent average stress states are used to predict damage, failure and stiffness reduction of the individual constituent materials. The stiffness of the damaged composite material is obtained by homogenization of the microstructure that is made up of the damaged constituent materials. ASCA features two different methods for degrading the stiffness of damaged constituent materials. The first method is instantaneous degradation where the stiffness of the damaged constituent is instantaneously reduced to a user-specified fraction of the original stiffness. The second method is energy-based degradation where the stiffness of the material is gradually reduced to zero as the strain level increases beyond the damage initiation level.
In ASCA, the multiscale processes of decomposition and homogenization are based on high fidelity finite element models of the heterogeneous composite material. However, the use of these high fidelity micromechanical finite element models is restricted to the process of characterizing the composite material, i.e., fitting the multiscale material model to measured composite material data. Once the composite material is characterized for a small number of discrete damage states, the results can be stored in a composite material library, and the multiscale material model can be used in structural level progressive failure simulations without having to repeatedly invoke the micromechanical finite element model of the composite material.
Progressive failure simulations traditionally suffer from poor convergence or even a complete lack of convergence that is caused by material softening that is associated with material damage. These convergence problems are most severe when the composite structure exhibits simultaneous ply damage and delamination. However, the ASCA code features proprietary convergence enhancing technology that improves convergence robustness of progressive failure problems. This technology makes it practical to routinely simulate the entire load history for problems that exhibit simultaneous ply failure and delamination.
Dow
nloa
ded
by U
nive
rsity
of
Mic
higa
n -
Dud
erst
adt C
ente
r on
Dec
embe
r 14
, 201
7 | h
ttp://
arc.
aiaa
.org
| D
OI:
10.
2514
/6.2
015-
0198
Copyright © 2014 by Lockheed Martin Corporation. Published by the American Institute of Aeronautics and Astronautics, Inc., with permission. 5
Model Integration
The ICM2 program will utilize a digital framework to integrate the three modeling tools previously introduced. This framework is based on the model integration interface ModelCenter®, and will be built through a joint effort between GE and LM Aero. In order to facilitate this joint task, a virtual hub will be set-up to serve as a demonstration prototype that can later be extended and maintained at an ICME Center of Excellence and/or a Government agency lab. The program’s ultimate goal is to show end-to-end integration from materials database through part structure performance and capability to carry out process trade analysis and optimization with minimal user intervention. The focus of this paper is to describe the individual components of the digital framework, as well as current results of the airframe portion of this program. Maturity of the details of the digital framework integration will be described in follow-on papers. Current Results
During the first year of the ICM2 program, airframe efforts are focused on panel level autoclave cure models to evaluate the effect of cure cycle modifications on critical lamina and laminate material properties. At the lamina level, the team is conducting model based process analysis using COMPRO’s cure analysis tools (see Figure 2). Modeling will be conducted for IM7/M65 BMI composite to virtually characterize the resin and composite’s physical and mechanical characteristics including degree of cure, residual stress state and, most importantly, the lamina properties after various autoclave cure conditions. UofM’s cure model will link with COMPRO cure kinetics model results to predict the cure cycle effects on the lamina elastic properties and strengths which will greatly affect the resultant laminate level properties. While M65 resin has been well characterized by Convergent for the COMPRO tool, additional physical resin effect of cure cycle tests are being conducted to assist UofM in their analysis. These modeling efforts are intended to identify cure parameters that will lead to improvements in laminate properties, namely in-plane strength, modulus, notched laminate properties, and damage tolerance.
At the laminate level the ASCA progressive damage tool is being linked with the COMPRO cure residual stress and UofM’s micromechanics strength property predictions. This linkage will make the connection for the cure cycle effects on specific ASCA models developed for Open-Hole Compression (OHC), Filled-Hole Compression (FHC), and Compression-Strength-After-Impact (CSAI). LM Aero plans to mature/exercise these existing ASCA models during this task to virtually characterize the cure cycle effects on these critical airframe design properties which are known to greatly reduce overall airframe weight in acreage skins and webs. Laminate coupon testing will be performed for baseline and alternate cure cycle protocols for OHC, FHC, and CSAI specimens to verify and validate predicted improvements for these in-plane and damage tolerance properties.
In the next sub-sections, progress-to-date will be presented for the Convergent and ASCA analyses. An example of the UofM analysis to compute the tensile strength in the transverse direction, S2
+, is also included for a given cure cycle and a RUC with volume fraction vf=0.63. Whereas this paper is only for baseline cure processing, future results will include effects of alternate cure cycles on the prescribed properties.
Dow
nloa
ded
by U
nive
rsity
of
Mic
higa
n -
Dud
erst
adt C
ente
r on
Dec
embe
r 14
, 201
7 | h
ttp://
arc.
aiaa
.org
| D
OI:
10.
2514
/6.2
015-
0198

Copyright © 2014 by Lockheed Martin Corporation. Published by the American Institute of Aeronautics and Astronautics, Inc., with permission. 6
COMPRO Material Characterization and Effect of Cure Cycle on Residual Stresses Material Characterization. An appropriate mechanical constitutive model is needed to analyze the process-induced residual stress development due to cure advancement and temperature variation. Different models in the literature have been used to describe this behavior. The simplest approach that still gives good predictions are cure hardening instantaneously linear elastic (CHILE) models, where the modulus of elasticity changes as a function of the instantaneous temperature and degree of cure (e.g. White and Hahn (1992) and Johnston et al. (2001)). In general, the CHILE constitutive model for thermoset polymers has been shown to provide good predictions in analyzing the behavior of composite materials [Fernlund et al., 2002a, 2002b, 2003]. However, it is known that polymers in general show viscoelastic behavior (e.g. Ferry, 1980), and this behavior is especially pronounced for partially cured polymers at high temperatures in a cure cycle. For example, it can be shown that CHILE constitutive models do not accurately capture the residual stress development during free standing post cure of a partially cured composite structure [Zobeiry 2003]. A differential viscoelastic approach [Zobeiry et al. 2003] is being implemented in the upcoming next release of COMPRO (Version 3) to represent the viscoelastic behavior of a curing thermoset matrix composite. In this section, an efficient methodology [Thorpe et al. 2013] to characterize the Hexply M65 material for viscoelastic constants is used.
Testing was performed on neat resin beams and uni-directional (UD) beams. Neat resin beams were manufactured by casting resin in a bench top scale autoclave. UD beams were manufactured by curing a laminate according to the manufacturer’s recommended layup and cure cycle. The laminate was then cut into beams using a slow speed diamond saw. Note that all UD beams were prepared such that testing could be performed in the 2-direction (in-plane, transverse). The following figure shows neat resin and UD beams.
Figure 4. Neat resin and unidirectional beam samples Testing was performed using a TA Instruments Q800 Dynamic Mechanical Analyzer
(DMA) using 3-point bend geometry with a 50mm span. During each test, the complex moduli (storage modulus, loss modulus and tan delta) were measured. Two types of tests were performed; constant frequency temperature ramps and iso-thermal frequency sweeps. The
Dow
nloa
ded
by U
nive
rsity
of
Mic
higa
n -
Dud
erst
adt C
ente
r on
Dec
embe
r 14
, 201
7 | h
ttp://
arc.
aiaa
.org
| D
OI:
10.
2514
/6.2
015-
0198

Copyright © 2014 by Lockheed Martin Corporation. Published by the American Institute of Aeronautics and Astronautics, Inc., with permission. 7
constant frequency temperature ramps examine the temperature dependent moduli and the Iso-thermal frequency sweep tests examine the frequency dependent moduli.
A generalized Maxwell model was used to predict the viscoelastic modulus of HexPly IM7/M65 Material.
∑
∑
=
=
+−+=′
+−+=′
I
i ixT
ixTi
rur
I
i ixT
ixTi
rur
aa
gKKKTxK
aa
gTxGTGTxGTxG
122
,2
22,
2
122
,2
22,
2
1][),,(
1)],()([),(),,(
τωτω
ω
τωτω
ω (1)
( )( ) ( )
( ) ( )[ ] ( )( ) ( )
−≥−+
≥−>−+−
≥−−+⋅
−
=
gg
gggp
ggg
gg
xT
TTTTTLL
TTTTTTpTTpf
TTTTTfC
TTfC
aLog*
221
*2
*1
221
*1
2
1
, )( (2)
The model prediction is compared with experiment in the following figure (Figure 5):
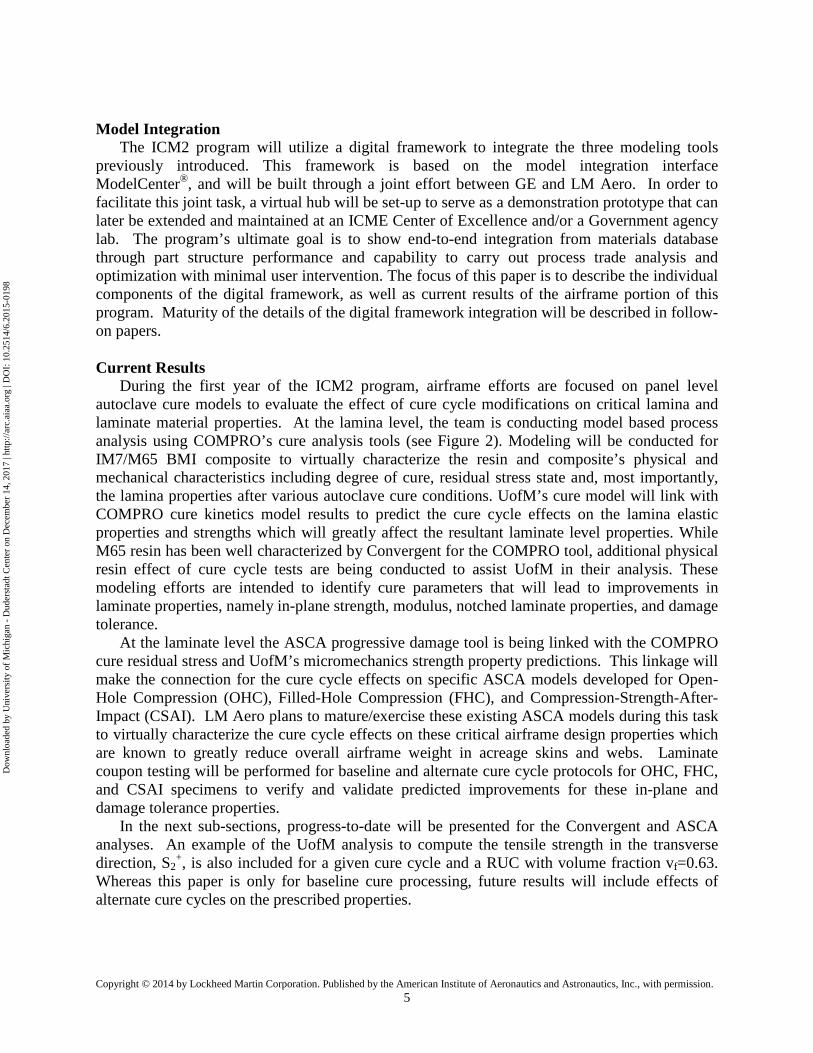
Figure 5. Prediction of storage modulus using the developed Maxwell model
The developed model was verified by comparing the spring-in angle of an L-shaped part
manufactured on an invar tool using the baseline cure cycle. The model prediction of spring-in angle compared to the experiment is shown in the following figure.
Temperature
Stor
age
Mod
ulus
Dow
nloa
ded
by U
nive
rsity
of
Mic
higa
n -
Dud
erst
adt C
ente
r on
Dec
embe
r 14
, 201
7 | h
ttp://
arc.
aiaa
.org
| D
OI:
10.
2514
/6.2
015-
0198
Copyright © 2014 by Lockheed Martin Corporation. Published by the American Institute of Aeronautics and Astronautics, Inc., with permission. 8
Figure 6. Model prediction of spring-in angle of an L-shape composite part compared
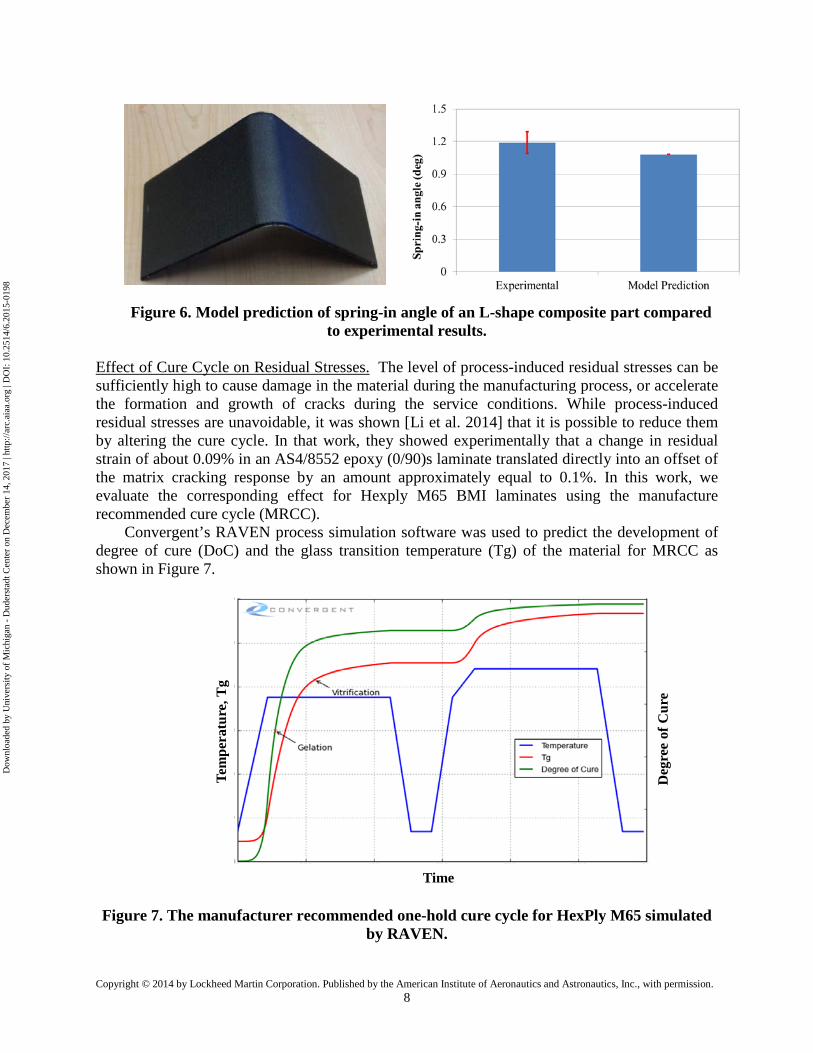
to experimental results. Effect of Cure Cycle on Residual Stresses. The level of process-induced residual stresses can be sufficiently high to cause damage in the material during the manufacturing process, or accelerate the formation and growth of cracks during the service conditions. While process-induced residual stresses are unavoidable, it was shown [Li et al. 2014] that it is possible to reduce them by altering the cure cycle. In that work, they showed experimentally that a change in residual strain of about 0.09% in an AS4/8552 epoxy (0/90)s laminate translated directly into an offset of the matrix cracking response by an amount approximately equal to 0.1%. In this work, we evaluate the corresponding effect for Hexply M65 BMI laminates using the manufacture recommended cure cycle (MRCC).
Convergent’s RAVEN process simulation software was used to predict the development of degree of cure (DoC) and the glass transition temperature (Tg) of the material for MRCC as shown in Figure 7.
Figure 7. The manufacturer recommended one-hold cure cycle for HexPly M65 simulated
by RAVEN.
Time
Tem
pera
ture
, Tg
Deg
ree
of C
ure
Dow
nloa
ded
by U
nive
rsity
of
Mic
higa
n -
Dud
erst
adt C
ente
r on
Dec
embe
r 14
, 201
7 | h
ttp://
arc.
aiaa
.org
| D
OI:
10.
2514
/6.2
015-
0198

Copyright © 2014 by Lockheed Martin Corporation. Published by the American Institute of Aeronautics and Astronautics, Inc., with permission. 9
As shown in other studies [Madhukar et al, 2000, White and Hahn, 1993 and Li et al., 2014],
an intermediate hold can be added to the cure cycle to reduce the processing-induced residual stresses. A three hold cure cycle was designed using RAVEN software such that the gelation and vitrification occur during the first hold. The second ramp rate was decreased to a small value to ensure that Tg always remains higher than the part temperature as shown in figure 8.
Figure 8. Modified three-hold cure cycle for HexPly M65 simulated by RAVEN.
An un-balanced cross ply [02/902] Hexply M65 laminate shown in figure 9 was analyzed
using the cure cycle from Figure 8.
Figure 9. Schematic of an unbalanced cross-ply laminate analyzed for process-induced
residual stress. Preliminary results of the residual stresses in the 90 degree layer for the two different cure
cycles are shown in Figure 10. In both cure cycles, the residual stresses are zero before gelation since the resin modulus is negligible. During the isothermal hold, cure shrinkage coupled with the resin modulus development result in the development of residual stress. Upon cooling down, the residual stress further increases due to the thermal shrinkage.
Time
Tem
pera
ture
, Tg
Deg
ree
of C
ure
[0][90]1 mm
1 mm
400 mm
Dow
nloa
ded
by U
nive
rsity
of
Mic
higa
n -
Dud
erst
adt C
ente
r on
Dec
embe
r 14
, 201
7 | h
ttp://
arc.
aiaa
.org
| D
OI:
10.
2514
/6.2
015-
0198

Copyright © 2014 by Lockheed Martin Corporation. Published by the American Institute of Aeronautics and Astronautics, Inc., with permission. 10
Figure 10. Residual stresses in unbalanced cross-ply laminate along two different cure
cycles. As can be seen, the process induced residual stress can be reduced by around 6% with the
preliminary alternate cycle shown here. Although a smaller value than shown by Li et al [2014], this reduction is still significant compared to the transverse failure strain of Hexply M65. Larger effects may exist when the design space is fully probed. UofM: Micromechanics Based Modeling of Effects of Curing on Ply Strengths
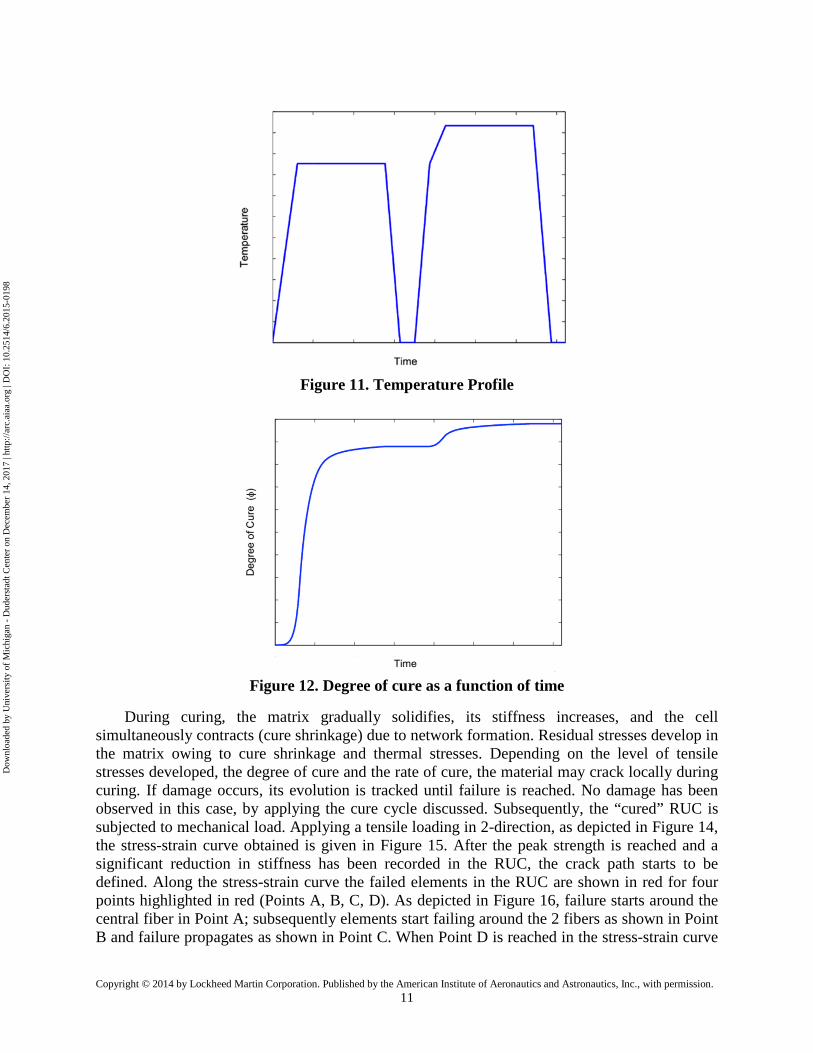
A 3D hexagonally packed representative unit cell (RUC) with volume fraction vf=0.63 is chosen to model the damage during cure and to subsequently compute the ply strengths (see Figure 3). Both the fibers and the matrix are modeled as isotropic respectively with IM7 and M65 material properties. Carbon fibers of 6 μm diameter are arranged in a hexagonal packing to get the desired fiber volume fraction. The RUC model run in this analysis has a width w = 7.73 μm, height h = 13.9 μm and thickness t = 0.25 μm. First the temperature profile, degree of cure and cure rate in the matrix are computed using the COMPRO software. Since the RUC dimensions are on the micron scale, it can be assumed that there is little to no variation in the temperature field across the RUC. Thus, temperature is prescribed on the entire volume at every time instance. The temperature profile applied is shown in Figure 11, which was a result of the COMPRO analysis. The degree of cure (ϕ) and rate of cure (dϕ/dt) are shown in Figures 12 and 13, respectively.
Temperaturue
Res
idua
l Str
ess
Dow
nloa
ded
by U
nive
rsity
of
Mic
higa
n -
Dud
erst
adt C
ente
r on
Dec
embe
r 14
, 201
7 | h
ttp://
arc.
aiaa
.org
| D
OI:
10.
2514
/6.2
015-
0198
Copyright © 2014 by Lockheed Martin Corporation. Published by the American Institute of Aeronautics and Astronautics, Inc., with permission. 11
Figure 11. Temperature Profile
Figure 12. Degree of cure as a function of time
During curing, the matrix gradually solidifies, its stiffness increases, and the cell simultaneously contracts (cure shrinkage) due to network formation. Residual stresses develop in the matrix owing to cure shrinkage and thermal stresses. Depending on the level of tensile stresses developed, the degree of cure and the rate of cure, the material may crack locally during curing. If damage occurs, its evolution is tracked until failure is reached. No damage has been observed in this case, by applying the cure cycle discussed. Subsequently, the “cured” RUC is subjected to mechanical load. Applying a tensile loading in 2-direction, as depicted in Figure 14, the stress-strain curve obtained is given in Figure 15. After the peak strength is reached and a significant reduction in stiffness has been recorded in the RUC, the crack path starts to be defined. Along the stress-strain curve the failed elements in the RUC are shown in red for four points highlighted in red (Points A, B, C, D). As depicted in Figure 16, failure starts around the central fiber in Point A; subsequently elements start failing around the 2 fibers as shown in Point B and failure propagates as shown in Point C. When Point D is reached in the stress-strain curve
Dow
nloa
ded
by U
nive
rsity
of
Mic
higa
n -
Dud
erst
adt C
ente
r on
Dec
embe
r 14
, 201
7 | h
ttp://
arc.
aiaa
.org
| D
OI:
10.
2514
/6.2
015-
0198

Copyright © 2014 by Lockheed Martin Corporation. Published by the American Institute of Aeronautics and Astronautics, Inc., with permission. 12
the RUC is completely spit along the red path. This sequence of events has been verified for different finite element meshes and mesh objectivity is found to prevail.
Figure 13. Cure rate as a function of time
3
2 1: Fibers direction
Figure 14. RUC dimensions and mechanical loading applied.
Dow
nloa
ded
by U
nive
rsity
of
Mic
higa
n -
Dud
erst
adt C
ente
r on
Dec
embe
r 14
, 201
7 | h
ttp://
arc.
aiaa
.org
| D
OI:
10.
2514
/6.2
015-
0198

Copyright © 2014 by Lockheed Martin Corporation. Published by the American Institute of Aeronautics and Astronautics, Inc., with permission. 13
Figure 15. Stress-Strain curve mechanical loading Figure 16. Crack path at Point A ASCA OHC and FHC Analysis
In this section, current results for modeling the OHC and FHC test coupons using the ASCA software are presented. These analyses represent the baseline cure process properties.
Composite OHC and FHC models for the baseline cure cycle for three different laminates were developed using the ASCA software. The three layups were: T1 [45/-45/45/-45/90/-45/0/45/-45/45/-45/45]s, T2 [45/90/-45/0]3s, and T3 [45/0/-45/0/0/45/90/-45/0/0/45/0/-45/0]s. The dimensions of the panels follow the standard ASTM specifications for those tests. Since these are symmetric layups, half the thickness of the specimen was modeled, and symmetry boundary conditions were used. The panels that were actually tested were 1.5” x 12”. However, these panels were placed into 2 2/3” grips within the test fixture on the top and bottom, effectively reducing their total length. The panels that were actually modeled had dimensions of 6 2/3”x1.5”. Solid C3D8R reduced integrated solid continuum elements were used, with one layer of elements representing each ply in the thickness direction. Thus, for example, the T1 laminate model contained 12 elements in the thickness direction, accounting for symmetry. For the FHC model, a steel insert represented the fastener, with contact conditions defined between the fastener and aperture. Figure 17 shows a close-up view of the mesh around the hole for both the filled and open hole specimens. In both the OHC and FHC models, the shear stress factor for fiber failure within ASCA was raised to prevent inaccurate finite element shear stresses from causing premature fiber failure. Finally, the stiffness reduction factors after matrix and fiber failure for the FHC model were set to 0.3 and 0.01, respectively, and for the OHC models, they were set to 0.1 and 1E-06, respectively.
Point D Point C
Point B Point A
Dow
nloa
ded
by U
nive
rsity
of
Mic
higa
n -
Dud
erst
adt C
ente
r on
Dec
embe
r 14
, 201
7 | h
ttp://
arc.
aiaa
.org
| D
OI:
10.
2514
/6.2
015-
0198

Copyright © 2014 by Lockheed Martin Corporation. Published by the American Institute of Aeronautics and Astronautics, Inc., with permission. 14
Figure 17. Aperture meshing for filled and open hole specimens
Load-stroke plots for laminate T1 are shown in Figure 18. The plot shows reasonable agreement with stiffness and the peak load value for the OHC specimen. As for the FHC specimen, the peak load value is low compared with the test. Future work will focus on improving the FHC model as premature simulated bearing failure produces an unrealistic stress distribution around the notch, which is believed to be the main culprit for the large discrepancy between the FHC simulation and experiment.
Figure 18. Load-stroke plots comparing model and test data for OHC and FHC test panels
for the T1 laminate
For the T2 and T3 laminates shown in Figures 19 and 20, excellent agreement between peak load is achieved for the OHC specimen, while again peak load is under-predicted for the FHC specimen. Additionally, the load-deflection of the model did not track the test. Typically models of test coupons do not compare well to load-stroke plots, as compliance in the load train of the test machine is included in the test data, but not in the model. Thus the model appears to be too stiff. For this reason it is always best to compare with local deflection or strain measurements isolated to the coupon itself. For the T2 laminate, strain gauge test data was available, so load vs. longitudinal strain comparisons were made in Figure 21. In these plots, the stiffness between the model and test agrees very well.
-1
0
1
2
3
4
5
6
7
8
0 0.02 0.04 0.06 0.08 0.1 0.12
Com
pres
sion
Loa
d (k
ips)
Actuator Displacement (in)
T1 Laminate, OHC, Room Temperature
Test 1 Load
Test 2 Load
Test 3 Load
Model Load0 0.2 0.4 0.6 0.8 1.0 1.2
Normalized Displacement
Nor
mal
ized
Com
pres
sion
Load
0
0.5
1.0
0
2
4
6
8
10
12
0 0.02 0.04 0.06 0.08 0.1 0.12 0.14
Co
mp
ress
ion
Lo
ad (
kip
s)
Actuator Displacement (in)
T1 Laminate, FHC, Room Temperature
Test 1 LoadTest 2 LoadTest 3 LoadModel Load
0 0.2 0.4 0.6 0.8 1.0 1.2
Normalized Displacement
Nor
mal
ized
Com
pres
sion
Load
0
0.5
1.0
1.5
1.4
Dow
nloa
ded
by U
nive
rsity
of
Mic
higa
n -
Dud
erst
adt C
ente
r on
Dec
embe
r 14
, 201
7 | h
ttp://
arc.
aiaa
.org
| D
OI:
10.
2514
/6.2
015-
0198

Copyright © 2014 by Lockheed Martin Corporation. Published by the American Institute of Aeronautics and Astronautics, Inc., with permission. 15
Figure 19. Load-stroke plots comparing model and test data for OHC and FHC test panels
for the T2 laminate
Figure 20. Load-stroke plots comparing model and test data for OHC and FHC test panels
for the T3 laminate
Figure 21. Load-strain plots comparing model and test data for OHC and FHC test panels
for the T2 laminate
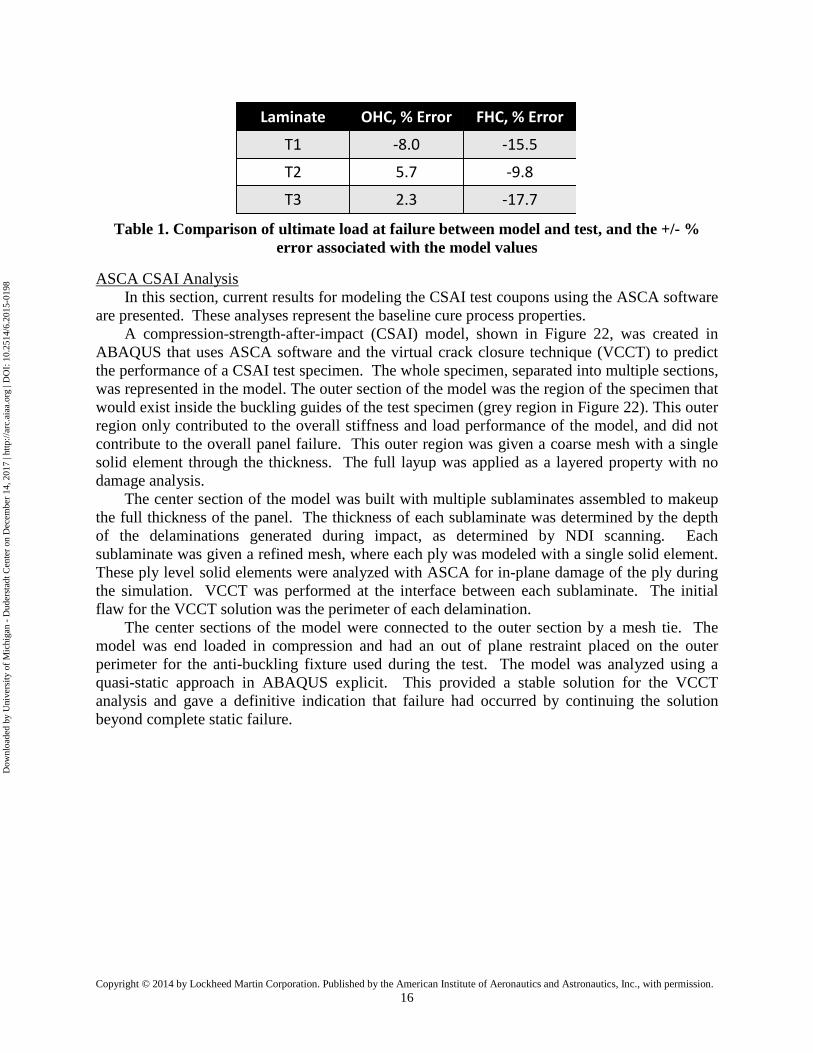
The ultimate load at failure for all three of the laminates modeled agrees with experimental data within 8% for OHC specimens and within 18% for FHC specimens, as shown in Table 1. Next steps include finalization of the baseline room temperature models (with a focus on improving the FHC model) and the development of models for the other process conditions, cold-dry and hot-wet. This work is expected to be complete in early 2015.
0
2
4
6
8
10
12
0 0.02 0.04 0.06 0.08 0.1 0.12
Com
pres
sion
Loa
d (k
ips)
Actuator Displacement (in)
T2 Laminate, OHC, Room Temperature
Test 1 LoadTest 2 LoadTest 3 LoadModel Load
0 0.2 0.4 0.6 0.8 1.0 1.2
Normalized Displacement
Nor
mal
ized
Com
pres
sion
Load
0
0.5
1.0
1.5
-5
0
5
10
15
20
0 0.02 0.04 0.06 0.08 0.1 0.12Com
pres
sion
Loa
d (k
ips)
Actuator Displacement (in)
T2 Laminate, FHC, Room Temperature
Test 1 LoadTest 2 LoadTest 3 LoadModel Load
0 0.2 0.4 0.6 0.8 1.0 1.2
Normalized Displacement
Nor
mal
ized
Com
pres
sion
Load
0
0.5
1.0
0
5
10
15
20
0 0.02 0.04 0.06 0.08 0.1 0.12
Com
pres
sion
Loa
d (k
ips)
Actuator Displacement (in)
T3 Laminate, OHC, Room Temperature
Test 1 LoadTest 2 LoadTest 3 LoadModel Load
0 0.2 0.4 0.6 0.8 1.0 1.2
Normalized Displacement
Nor
mal
ized
Com
pres
sion
Load
0
0.5
1.0
0
5
10
15
20
25
30
0 0.02 0.04 0.06 0.08 0.1 0.12 0.14
Com
pres
sion
Loa
d (k
ips)
Actuator Displacement (in)
T3 Laminate, FHC, Room Temperature
Test 1 LoadTest 2 LoadTest 3 LoadModel Load
0 0.2 0.4 0.6 0.8 1.0 1.2
Normalized Displacement
Nor
mal
ized
Com
pres
sion
Load
0
0.5
1.0
1.4
0
2
4
6
8
10
12
0 1000 2000 3000 4000 5000 6000 7000 8000
Com
pres
sion
Loa
d (k
ips)
Strain (µε)
3s
75°F Dry
Test 1 LoadTest 2 LoadTest 3 LoadModel Load
0 0.2 0.4 0.6 0.8 1.0 1.2
Normalized Strain
0
0.5
1.0
1.4 1.6
T2 Laminate, OHC, Room Temperature
Nor
mal
ized
Com
pres
sion
Load
0
2
4
6
8
10
12
14
16
18
0 2000 4000 6000 8000 10000 12000 14000
Com
pres
sion
Loa
d (k
ips)
Strain (µε)
ed o e Co p ess o | [ 5/90/ 5/0]3s
75°F Dry
Test 1 LoadTest 2 LoadTest 3 LoadModel Load
0 0.2 0.4 0.6 0.8 1.0 1.2
Normalized Strain
0
0.5
1.0
1.4
T2 Laminate, FHC, Room Temperature
Nor
mal
ized
Com
pres
sion
Load
Dow
nloa
ded
by U
nive
rsity
of
Mic
higa
n -
Dud
erst
adt C
ente
r on
Dec
embe
r 14
, 201
7 | h
ttp://
arc.
aiaa
.org
| D
OI:
10.
2514
/6.2
015-
0198
Copyright © 2014 by Lockheed Martin Corporation. Published by the American Institute of Aeronautics and Astronautics, Inc., with permission. 16
Table 1. Comparison of ultimate load at failure between model and test, and the +/- %
error associated with the model values
ASCA CSAI Analysis In this section, current results for modeling the CSAI test coupons using the ASCA software
are presented. These analyses represent the baseline cure process properties. A compression-strength-after-impact (CSAI) model, shown in Figure 22, was created in
ABAQUS that uses ASCA software and the virtual crack closure technique (VCCT) to predict the performance of a CSAI test specimen. The whole specimen, separated into multiple sections, was represented in the model. The outer section of the model was the region of the specimen that would exist inside the buckling guides of the test specimen (grey region in Figure 22). This outer region only contributed to the overall stiffness and load performance of the model, and did not contribute to the overall panel failure. This outer region was given a coarse mesh with a single solid element through the thickness. The full layup was applied as a layered property with no damage analysis.
The center section of the model was built with multiple sublaminates assembled to makeup the full thickness of the panel. The thickness of each sublaminate was determined by the depth of the delaminations generated during impact, as determined by NDI scanning. Each sublaminate was given a refined mesh, where each ply was modeled with a single solid element. These ply level solid elements were analyzed with ASCA for in-plane damage of the ply during the simulation. VCCT was performed at the interface between each sublaminate. The initial flaw for the VCCT solution was the perimeter of each delamination.
The center sections of the model were connected to the outer section by a mesh tie. The model was end loaded in compression and had an out of plane restraint placed on the outer perimeter for the anti-buckling fixture used during the test. The model was analyzed using a quasi-static approach in ABAQUS explicit. This provided a stable solution for the VCCT analysis and gave a definitive indication that failure had occurred by continuing the solution beyond complete static failure.
Laminate OHC, % Error FHC, % Error
T1 -8.0 -15.5
T2 5.7 -9.8
T3 2.3 -17.7
Dow
nloa
ded
by U
nive
rsity
of
Mic
higa
n -
Dud
erst
adt C
ente
r on
Dec
embe
r 14
, 201
7 | h
ttp://
arc.
aiaa
.org
| D
OI:
10.
2514
/6.2
015-
0198

Copyright © 2014 by Lockheed Martin Corporation. Published by the American Institute of Aeronautics and Astronautics, Inc., with permission. 17
Figure 22. Compression Strength after Impact Model
Figure 23 shows the CSAI test data that the initial model was correlated to. The test panel
(colored green) was a 32 ply, quasi-isotropic layup of IM7/M65 hand-laid tape material. The test panel was placed in a fixture (colored grey) that had a 5” x 7” window placed in the middle of the section. This fixture keeps the entire specimen stable during the test, but allows a local instability inside the test window. The test panel was fitted with six strain gauges, four far-field gauges (1, 2, 3, and 4) and two near-field gages (5 and 6). The gages inside the test window are positioned back-to-back to capture any bending or buckling event that might happen.
During the test, the far-field gauges show a linear response, and the back-to-back far-field gauges (3 and 4) do not show a significant amount of divergence. This indicates that the specimen remained globally stable. The back-to-back near-field gages (5 and 6) show a divergence, indicating that a local buckle developed which led to the ultimate failure of the panel.
Outer Section(Single Layer)
ImpactLocation
Delaminationsfrom Impact
Inner Section
(Multiple Layers)
Impact LocationDelaminationsfrom Impact
Inner Section (multiple sublaminates through the thickness)
Sublaminate 1
Sublaminate 2
Sublaminate 3
Sublaminate 4
Dow
nloa
ded
by U
nive
rsity
of
Mic
higa
n -
Dud
erst
adt C
ente
r on
Dec
embe
r 14
, 201
7 | h
ttp://
arc.
aiaa
.org
| D
OI:
10.
2514
/6.2
015-
0198

Copyright © 2014 by Lockheed Martin Corporation. Published by the American Institute of Aeronautics and Astronautics, Inc., with permission. 18
Figure 23. CSAI Test Data
Figure 24 shows correlation of the initial model to the test data. At low load and strain, the
model stiffness correlates to the measured test data. However the model predicts a significantly higher failure load than what was seen in the test data. The peak load of the test data was only 54% of the peak load from the analysis. The response of the model at the strain gauge locations does not indicate that the predicted failure mode matches what was seen during the test. The far-field and near-field strain predictions at the corresponding strain gage locations show a linear response with load until a normalized strain value of approximately 0.65. After this point, both the far-field and near-field back-to-back strain predictions show a divergence. This indicates the model predicts that the entire section inside the modeled test window becomes unstable. This was not seen in the test data, where the near-field back to back gages showed a divergence while the far-field back-to-back gauges remained linear and parallel.
1
2/3
45/6
Test Fixture(grey)
StrainGauges
Specimen(green)
Applied Load
0.00
0.10
0.20
0.30
0.40
0.50
0.60
0.00 0.20 0.40 0.60 0.80
Nor
mal
ized
Load
Normalized Strain
Far-Field Strain Gauges
Test: SG 1Test: SG 2Test: SG 3Test: SG 4
0.00
0.10
0.20
0.30
0.40
0.50
0.60
0.00 0.20 0.40 0.60 0.80 1.00
Nor
mal
ized
Load
Normalized Strain
Near-Field Strain Gauges
Test: SG 5Test: SG 6
Divergence
Dow
nloa
ded
by U
nive
rsity
of
Mic
higa
n -
Dud
erst
adt C
ente
r on
Dec
embe
r 14
, 201
7 | h
ttp://
arc.
aiaa
.org
| D
OI:
10.
2514
/6.2
015-
0198

Copyright © 2014 by Lockheed Martin Corporation. Published by the American Institute of Aeronautics and Astronautics, Inc., with permission. 19
Figure 24. Initial Model Correlation to Test Data
The VCCT solution does not predict crack initiation from the impact delaminations until
near the peak load in the analysis (Figure 25). This initial crack extension was predicted to be a Mode II failure, and was initiated from the overall instability of the entire section in the test window at this load. After peak load, the model predicts continued crack extension. Figure 26 shows the in-plane damage calculated by ASCA. ASCA predicts very small areas of damage begin at the same time that the crack began to grow from the impact delaminations. Near the predicted peak load, the ASCA solution does not show large regions of fiber damage. However, after predicted failure, ASCA predicts large in-plane fiber damage to nearly all plies, which has propagated completely across the test window.
0.0
0.2
0.4
0.6
0.8
1.0
1.2
0.00 0.50 1.00 1.50 2.00
Nor
mal
ized
Loa
d
Normalized Strain
Far-Field Back-to-Back
Test: SG 2Model: SG2Test: SG 3Model: SG3
0.0
0.2
0.4
0.6
0.8
1.0
1.2
0.00 0.50 1.00 1.50 2.00
Nor
mal
ized
Loa
d
Normalized Strain
Near-Field Back-to-Back
Test: SG 6Model: SG6Test: SG 5Model: SG5
Dow
nloa
ded
by U
nive
rsity
of
Mic
higa
n -
Dud
erst
adt C
ente
r on
Dec
embe
r 14
, 201
7 | h
ttp://
arc.
aiaa
.org
| D
OI:
10.
2514
/6.2
015-
0198

Copyright © 2014 by Lockheed Martin Corporation. Published by the American Institute of Aeronautics and Astronautics, Inc., with permission. 20
Figure 25. VCCT Prediction
This initial model provided a much higher load prediction than what was seen in the test. The only impact damage accounted for in the analysis was the delaminations that were detected from the time of flight NDI scans of the specimen. The model included ASCA progressive analysis to capture any matrix and fiber damage that might occur, however the analysis started with pristine material properties. The initial model did not include any zones where matrix or fiber damage existed from the impact prior to the analysis. It is believed that the amount of damage that can be detected from the time of flight NDI scans is not sufficient enough to provide an accurate prediction from the model. There may be additional delaminations in the laminate that would affect the local stability of the panel during the analysis. Figure 27 shows a study where additional delaminations were added to the specimen. Three additional delaminations were added at varying locations through the thickness such that all of the remaining sublaminates were similar in thickness.
0.0
0.2
0.4
0.6
0.8
1.0
1.2
0.00 0.50 1.00 1.50 2.00
Nor
mal
ized
Load
Normalized Strain
Far-Field Back-to-Back
Test: SG 2Model: SG2Test: SG 3Model: SG3
Delam Growth at Peak Load1 Delam Growth at Failure2
1
2
Dow
nloa
ded
by U
nive
rsity
of
Mic
higa
n -
Dud
erst
adt C
ente
r on
Dec
embe
r 14
, 201
7 | h
ttp://
arc.
aiaa
.org
| D
OI:
10.
2514
/6.2
015-
0198

Copyright © 2014 by Lockheed Martin Corporation. Published by the American Institute of Aeronautics and Astronautics, Inc., with permission. 21
Figure 26. ASCA Prediction
Figure 27. Sensitivity model with additional impact delaminations
The additional delaminations showed an effect on the solution, though it was not
significant enough to improve the overall correlation to the test data. To improve the fidelity of the analysis, a collaborative effort with AFRL/RX is being
coordinated. In this effort, the baseline panels will be rebuilt, and then impacted with the same energy levels previously completed. Detailed Computed Tomography (CT) scans will be completed to obtain an accurate measurement of damage in the panel after impact. Compression
In-Plane Damage at Peak Load1 In-Plane Damage at Failure2
0.0
0.2
0.4
0.6
0.8
1.0
1.2
0.00 0.50 1.00 1.50 2.00
Nor
mal
ized
Load
Normalized Strain
Far-Field Back-to-Back
Test: SG 2Model: SG2Test: SG 3Model: SG3
1
2
ASCA Solution
Green =
Blue = Undamaged CompositeMatrix Damage
Red = Fiber Damage
Center of Panel(Impact Location)
DelamPerimeter
Fixture PlateBoundary Condition
Linear ElasticMaterial (green)
ASCA ProgressiveDamage Material
(grey)
Red = TOF DelamYellow = Added Delam
Through Thickness at Center of PanelDow
nloa
ded
by U
nive
rsity
of
Mic
higa
n -
Dud
erst
adt C
ente
r on
Dec
embe
r 14
, 201
7 | h
ttp://
arc.
aiaa
.org
| D
OI:
10.
2514
/6.2
015-
0198

Copyright © 2014 by Lockheed Martin Corporation. Published by the American Institute of Aeronautics and Astronautics, Inc., with permission. 22
strength after impact testing will then be completed using Digital Image Correlation (DIC) on both sides of the specimen to measure the displacement and strain field behavior of the test section. The detailed CT images of the post-impact state and high resolution DIC measurements will be used for improved model correlation. Validation
While the ICM2 airframe team is leveraging an existing full three batch B-basis allowables dataset to support the progressive damage analysis efforts described above there is a smaller set of panel level tests being used to assess the impact of cure cycle changes to the M65 composite material. The test matrix shown in Figure 28 is conducted using both the vendor recommended cure cycle (that used for the B-basis dataset) and a cure cycle to be directed from exercising the integrated set of cure and micromechanics models described in this paper. All panels needed to complete the tests shown in Figure 28 are built using Automated Fiber Placement (AFP) processing.
To date the baseline panels, using the vendor recommended cure, have been fabricated and tested. Modeling efforts are in work to provide a cure cycle revision which provides for desired improvements in the laminate properties. Fabrication and testing of panels using the model directed cure cycle are planned for early 2015.
Figure 28. Panel Level Testing to Validate the Effectiveness of
Cure Directed Modelling Efforts
Summary In this paper, results of the airframe portion of the GE/LM Aero ICM2 program are given.
LM Aero is studying the IM7/M65 bismaelimide (BMI) system for application to next generation airframes. The general capabilities of the three analysis tools (Convergent COMPRO, Autodesk ASCA, and University of Michigan Micromechanics) used in the ICM2 program are given, along with current analysis results. These results include COMPRO analysis of two cure cycles for the IM7/M65 system, University of Michigan micromechanics analysis of failure strengths in an RUC for this system, and ASCA progressive damage analysis of OHC, FHC, and CSAI specimens. In the near future, these three codes will be integrated, allowing laminate level progressive damage analysis of these three and other coupons, including effects of varying cure
-65°F Dry 70°F Dry 350°F Wet*Short Beam Shear D2344 [0]50 50 1.5"x0.5" 3 3 3
Double Cantilever Beam D5528 [0]26 26 9.0"x1.0" 3 3 3
90°/0° Compression D6641 [90/0]7s 28 5.5"x0.5" 3 3 3
In-Plane Shear D3518 [45/-45]2s 8 9.0"x1.0" 3 3 3
Open Hole Tension D5766 [45/90/-45/0]3s 24 12.0"x1.5" 3 3 3
Filled Hole Tension D5766/D6742 [45/90/-45/0]3s 24 12.0"x1.5" 3 3 3
Open Hole Compression D6484 [45/90/-45/0]3s 24 12.0"x1.5" 3 3 3
Filled Hole Compression D6484/D6742 [45/90/-45/0]3s 24 12.0"x1.5" 3 3 3
Compression Str. After ImpactLMA-PT001
Method 4.30[45/90/-45/0]4s 32 11.0"x13.0" Impact
10.0"x12.0" Comp.3 3 3
Lam
ina
Lam
inat
e
Test ConditionsTest
Test Specification
Layup# of
PliesSpecimen Size
Dow
nloa
ded
by U
nive
rsity
of
Mic
higa
n -
Dud
erst
adt C
ente
r on
Dec
embe
r 14
, 201
7 | h
ttp://
arc.
aiaa
.org
| D
OI:
10.
2514
/6.2
015-
0198

Copyright © 2014 by Lockheed Martin Corporation. Published by the American Institute of Aeronautics and Astronautics, Inc., with permission. 23
cycles (from COMPRO), and effects of cure cycle on ply level input strengths (from UofM micromechanics analysis). References: 1. National Materials Advisory Board, “Integrated Computational Materials Engineering: A
Transformational Discipline for Improved Competitiveness and National Security, 2008, The National Academies Press, Washington, D.C.
2. Rousseau, C.Q., Engelstad, S.P., and Owens, S.D., “Industry Perspectives on Composite Structural Certification and Design,” Presented at the 53rd AIAA/ASME/ASCE/AHS/ASC SDM Conference, Honolulu, Hawaii, April 2012.
3. Dalgarno, R., and Robbins, D., “Fiber-Aligned, Discrete-Layer Modeling Approaches for Progressive Failure Simulation of Open Hole Composite Panels,” presented at the 53rd AIAA/ASME/ASCE/AHS/ASC Structures, Structural Dynamics, and Materials Conference, Honolulu, Hawaii, April 23-26, 2012.
4. C. Heinrich, A. Waas, et. al., “Integrated Computational Materials Science and Engineering of Textile Polymer Composites”, 52nd AIAA/ASME/ASCE/AHS/ASC Structures, Structural Dynamics and Materials Conference, 19th 4 - 7 April 2011, Denver, Colorado. AIAA 2011-1745
5. Fernlund,G., Griffith,J., Courdji,R., et al, "Experimental and Numerical Study of the Effect of Caul-Sheets on Corner Thinning of Composite Laminates", Composites - Part A: Applied Science and Manufacturing, 33(3), pp. 411-426, 2002a.
6. Fernlund,G., Rahman,N., Courdji,R., et al, "Experimental and Numerical Study of the Effect of Cure Cycle, Tool Surface, Geometry, and Lay-Up on the Dimensional Fidelity of Autoclave-Processed Composite Parts", Composites - Part A: Applied Science and Manufacturing, 33(3), pp. 341-351,2002b.
7. Fernlund,G., Osooly,A., Poursartip,A., et al, "Finite Element Based Prediction of Process-Induced Deformation of Autoclaved Composite Structures Using 2D Process Analysis and 3D Structural Analysis ", Composite Structures, 62(2), pp. 223-234,2003.
8. Ferry,J.D., "Viscoelastic properties of polymers", John Wiley & Sons Inc., New York, 1980. 9. Hubert P, Vaziri R, Poursartip A. A two dimensional flow model for the process simulation
of complex shape composite laminates. International Journal of Numerical Methods in Engineering, 44(1): pp.1–26, 1999.
10. Johnston,A., Vaziri,R., and Poursartip,A., "A Plane Strain Model for Process-Induced Deformation of Laminated Composite Structures", Journal of Composite Materials, 35(16), pp. 1435-1469,2001.
11. Li, C., Keil, K., Zobeiry, N., Chatterjee, S., and Poursartip, A. Advances in the Characterization of Residual Stress in Composite Structures, to be presented at SAMPE Seattle 2014 June 2-5.
12. M. S. Madhukar, M. S. Genidy, J. D. Russell, A. Y. Lee, “A new method to reduce cure-induced stresses in thermoset polymer composites,” Journal of Composite Materials, vol. 34, no. 22, pp. 1882-1947, 2000.
13. Thorpe, R. and Poursartip, A. Experimentally Determining the Viscoelastic Behaviour of Curing Thermoset Epoxy, 19th International Conference on Composite Materials (ICCM-19), Montreal, QB, Canada, July 28 – Aug 2, 2013.
14. White,S.R. and Hahn,H.T., "Process Modeling of Composite Materials: Residual Stress Development During Cure. Part I. Model Formulation", Journal of Composite Materials,
Dow
nloa
ded
by U
nive
rsity
of
Mic
higa
n -
Dud
erst
adt C
ente
r on
Dec
embe
r 14
, 201
7 | h
ttp://
arc.
aiaa
.org
| D
OI:
10.
2514
/6.2
015-
0198

Copyright © 2014 by Lockheed Martin Corporation. Published by the American Institute of Aeronautics and Astronautics, Inc., with permission. 24
26(16), pp. 2402-2422, 1992. 15. S. R. White, H. T. Hahn, “Cure cycle optimization for the reduction of processing-induced
residual stresses in composite materials,” Journal of Composite Materials, vol. 27, no. 14, pp. 1352-1378, 1993.
16. Zobeiry, N., Vaziri, R. and Poursartip, A. Differential Implementation of the Viscoelastic Response of a Curing Thermoset Matrix for Composites Processing, Transactions of ASME, Journal of Engineering Materials and Technology, 128(1): 90-95, 2006.
17. Bazant Z. P., and Oh B.H., Crack band theory for fracture concrete. Material and Structures, 16:155-177. 1983.
Dow
nloa
ded
by U
nive
rsity
of
Mic
higa
n -
Dud
erst
adt C
ente
r on
Dec
embe
r 14
, 201
7 | h
ttp://
arc.
aiaa
.org
| D
OI:
10.
2514
/6.2
015-
0198