integrated annual repor t 2014 - south african share prices, jse … · 2014-10-15 · the king...
TRANSCRIPT

Integrated annual report 2014

Seardel Investment Corporation Limited (“Seardel” or “the Group”) is pleased to
present its 2014 Integrated Annual Report to stakeholders in accordance with
the King Code of Governance Principles (King III). As a JSE-listed company, the
Group subscribes to the principles of integrated reporting, which strive to provide
insight into the business practices which have a material influence on the future
sustainability of the Group.
The Integrated Report aims to provide a greater understanding of the Group’s
business model, its social and environmental impact and insight into how the
Group’s businesses are managed. We see this report as an evolving process
and undertake to provide further enhanced reporting each year, where deemed
appropriate.
Scope and BoundaryThe 2014 Integrated Report covers the activities and performances of the Group
for the financial year 1 April 2013 to 31 March 2014. The Group operates principally
in South Africa and generates the majority of its revenue from South Africa.
The Integrated Report and the Financial Statements have been prepared
according to International Financial Reporting Standards (IFRS), the requirements
of the Companies Act (71 of 2008, as amended), and the Listings Requirements
of the JSE. The Group has implemented the recommendations of King III, except
where noted to the contrary, and management has also considered the guidelines
published by the Integrated Reporting Committee of South Africa.
It has further applied the principles of materiality in determining the content and
levels of disclosure throughout the Integrated Annual Report.
approval of the integrated reportThe integrity of the Integrated Report is the responsibility of the board of directors.
The directors confirm they have collectively reviewed the content of the Integrated
Report and are of the opinion that it is a fair representation of the integrated
performance of the Group.
external aSSuranceAssurance and the contents of the Integrated Report were considered
throughout the process. The board, assisted by the audit and risk committees,
is ultimately responsible for overseeing the integrity of the Integrated Report. The
Group’s external auditors have assured the financial statements and accredited
specialist agencies have verified the disclosure on broad-based black economic
empowerment, property valuations and carbon emissions. The Group has
implemented a combined assurance framework which considers the assurance
provided by all independent assurance providers.
additional informationOur 2014 Integrated Report is available online at: www.seardel.co.za. A printed
copy of the financial statements is available on request from [email protected].
aBout thiS report

contentSour groupProfile ............................................................................ 2
Financial highlights ......................................................... 4
Ten-year review ............................................................. 6
Directors’ profile .......................................................... 10
CEO’s report ................................................................ 12
Sustainability report ......................................................16
Cash value added statement ....................................... 21
our governance
Corporate governance ................................................. 22
Social and ethics committee report .............................. 29
Risk committee report ................................................. 30
Remuneration report .................................................... 31
our numBerSAudit committee report ................................................ 40
Directors’ responsibility
statement and certificate of company secretary ........... 42
Directors’ report .......................................................... 43
Independent auditor’s report ........................................ 45
Financial statements .................................................... 46
our ShareholderS Analysis of shareholders ............................................ 125
Notice of annual general meeting ............................... 128
Form of proxy ............................................................ 135
our contact detailSCorporate information ................................................ IBC
Seardel integrated annual report 20141
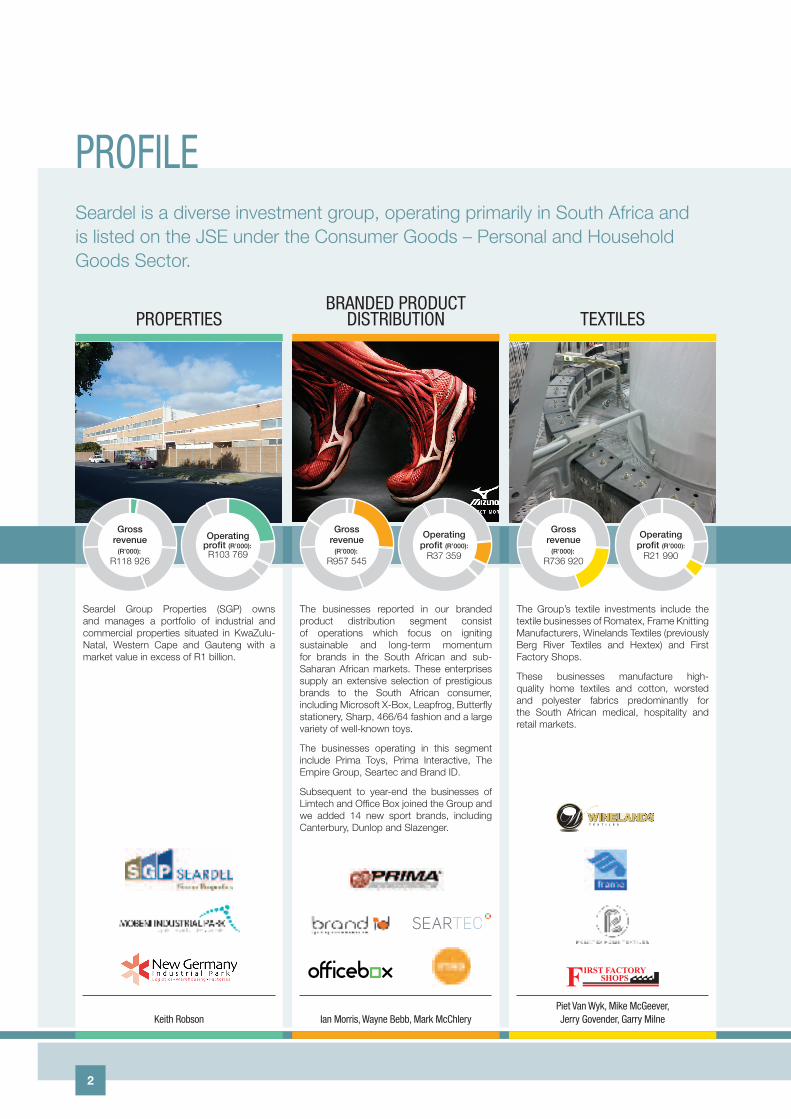
PROFILE
Seardel Group Properties (SGP) owns and manages a portfolio of industrial and commercial properties situated in KwaZulu-Natal, Western Cape and Gauteng with a market value in excess of R1 billion.
PROPERtIEs
The businesses reported in our branded product distribution segment consist of operations which focus on igniting sustainable and long-term momentum for brands in the South African and sub-Saharan African markets. These enterprises supply an extensive selection of prestigious brands to the South African consumer, including Microsoft X-Box, Leapfrog, Butterfly stationery, Sharp, 466/64 fashion and a large variety of well-known toys.
The businesses operating in this segment include Prima Toys, Prima Interactive, The Empire Group, Seartec and Brand ID.
Subsequent to year-end the businesses of Limtech and Office Box joined the Group and we added 14 new sport brands, including Canterbury, Dunlop and Slazenger.
BRANDED PRODUCt DIstRIBUtION
The Group’s textile investments include the textile businesses of Romatex, Frame Knitting Manufacturers, Winelands Textiles (previously Berg River Textiles and Hextex) and First Factory Shops.
These businesses manufacture high-quality home textiles and cotton, worsted and polyester fabrics predominantly for the South African medical, hospitality and retail markets.
tEXtILEs
Keith Robson Ian Morris, Wayne Bebb, Mark McChleryPiet Van Wyk, Mike McGeever, Jerry Govender, Garry Milne
Seardel is a diverse investment group, operating primarily in South Africa and is listed on the JSE under the Consumer Goods – Personal and Household Goods Sector.
Gross revenue
(R’000): R118 926
Operating profit (R’000): R103 769
Gross revenue
(R’000): R957 545
Operating profit (R’000):
R37 359
Gross revenue
(R’000): R736 920
Operating profit (R’000):
R21 990
2
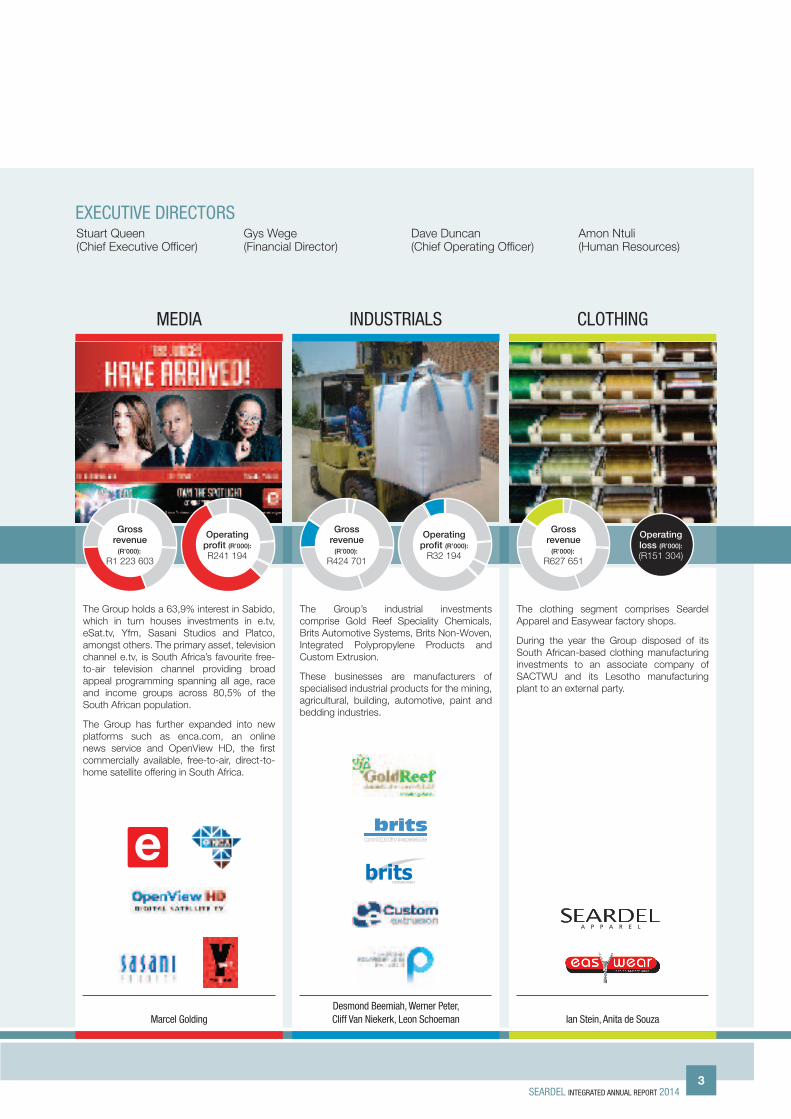
Stuart Queen (Chief Executive Officer)
Gys Wege (Financial Director)
Dave Duncan (Chief Operating Officer)
Amon Ntuli (Human Resources)
EXECUtIVE DIRECtORs
The Group holds a 63,9% interest in Sabido, which in turn houses investments in e.tv, eSat.tv, Yfm, Sasani Studios and Platco, amongst others. The primary asset, television channel e.tv, is South Africa’s favourite free-to-air television channel providing broad appeal programming spanning all age, race and income groups across 80,5% of the South African population.
The Group has further expanded into new platforms such as enca.com, an online news service and OpenView HD, the first commercially available, free-to-air, direct-to-home satellite offering in South Africa.
MEDIA
The Group’s industrial investments comprise Gold Reef Speciality Chemicals, Brits Automotive Systems, Brits Non-Woven, Integrated Polypropylene Products and Custom Extrusion.
These businesses are manufacturers of specialised industrial products for the mining, agricultural, building, automotive, paint and bedding industries.
INDUstRIALs
The clothing segment comprises Seardel Apparel and Easywear factory shops.
During the year the Group disposed of its South African-based clothing manufacturing investments to an associate company of SACTWU and its Lesotho manufacturing plant to an external party.
Marcel GoldingDesmond Beemiah, Werner Peter, Cliff Van Niekerk, Leon schoeman Ian stein, Anita de souza
CLOthING
Gross revenue
(R’000): R1 223 603
Operating profit (R’000):
R241 194
Gross revenue
(R’000): R424 701
Operating profit (R’000):
R32 194
Gross revenue
(R’000): R627 651
Operating loss (R’000):
(R151 304)
sEARDEL INtEGRAtED ANNUAL REPORt 20143

financial highlightSRand thousands, unless otherwise indicated 2014 2013*Revenue 3 387 121 1 845 524 Profit before taxation from continued operations 282 784 84 907 Loss before taxation from discontinued operations (159 901) (45 173)Profit before taxation 122 883 39 734 (Loss)/profit attributable to shareholders (11 157) 40 851 Equity attributable to equity holders 2 717 969 1 460 586 Total tangible assets (excluding cash) 3 957 161 2 467 279 Return from continued operations on total tangible assets (%) 11,4 4,4%Return on shareholders’ interest (%) (0,4) 2,8 Ratio of borrowings to capital and reserves (%) 195 34
StatiSticS per ShareIn cents, where applicable 2014 2013Headline earnings 0,10 2,92Headline earnings – continued operations 14,13 9,37Headline loss – discontinued operations (14,03) (6,44)Basic (loss)/earnings (1,26) 5,96Basic earnings – continued operations 16,83 12,55Basic loss – discontinued operations (18,09) (6,59)Operating cash flow 25 30 Net asset value 229 214 Market price – End of period
– Ordinary 200 120 – N Ordinary 174 120
High price range – Ordinary 320 154 – N Ordinary 315 145
Low price range – Ordinary 116 86 – N Ordinary 120 96
Revenue, total tangible assets (excluding cash and deferred tax) and return on total tangible assets
Segment
Revenue Total tangible assetsReturn on totaltangible assets
2014 2013* 2014 2013 2014 2013*Rm % Rm % Rm % Rm % % %
Media 1 224 36 – – 1 416 36 – – 17 – Branded Product Distribution 954 28 793 43 542 14 451 18 7 3 Properties 71 2 47 3 1 075 27 997 41 10 6 Textiles 690 20 650 35 478 12 474 19 5 7 Industrials 425 13 328 18 246 6 206 8 13 8 Clothing 23 1 27 1 165 4 334 14 (3) (1)Head office – – – – 35 1 5 – 69 (275)
3 387 100 1 845 100 3 957 100 2 467 100 11 4 2013* 1 845 2 467 4
2012 2 507 2 384 8
2011 2 359 2 058 6
2010 2 166 2 110 3
* Restated, refer to note 36.
4

2 5072012
1 8462013
3 3872014
REVENUE (rm)
1 4122012
1 4612013
2 7182014
CAPITAL AND RESERVES (rm)
1792012
1092013
4562014
OPERATING PROFIT (rm)
39
2012
2032013
2172014
FREE CASH FLOW (rm)
158 86 2012012 2013 2014
PROFIT FROm CONTINUING OPERATIONS (rm)
2 3832012
2 4672013
3 9572014
TANGIBLE ASSETS (rm)
Brand ID
Seardel integrated annual report 20145

ten-year revieWRand thousands 2014 2013* 2012 2011 2010
20099 months 2008 2007 2006 2005
operationSRevenue 3 387 121 1 845 524 2 506 794 2 358 986 2 165 727 2 169 584 3 867 565 3 793 357 3 583 702 3 745 145
Continued operations
Operating profit/(loss) before finance costs 456 123 108 625 179 015 121 658 66 907 (117 312) (165 455) 111 668 152 276 129 210
Net finance costs 167 972 23 718 33 873 27 726 22 268 38 253 81 645 57 078 46 572 56 030
Share of losses from joint venture 5 367 – – – – 2 503 9 181 2 973 446 –
Profit/(loss) before taxation 282 784 84 907 145 142 93 932 44 639 (158 068) (256 281) 51 617 105 258 73 180
Taxation 81 270 (1 117) (13 131) (10 084) 1 740 (27 470) (72 212) 855 18 841 23
Profit/(loss) from continued operations for the year 201 514 86 024 158 273 104 016 42 899 (130 598) (184 069) 50 762 86 417 73 157
Loss from discontinued operations for the year (159 901) (45 173) (21 442) (95 440) (246 355) (153 962) – – – –
Profit/(loss) attributable to shareholders (11 157) 40 851 136 944 8 567 (203 593) (279 344) (178 842) 50 770 85 471 73 255
caSh floWNet cash flow 332 448 50 843 175 954 105 594 62 788 (195 652) (86 619) 98 185 159 902 98 899
Cash generated from/(utilised by) operations – nominal 217 444 202 584 39 386 (57 281) 149 628 (162 040) 6 023 (161 019) 128 246 102 863
Net cash (outflow)/inflow from investing activities (191 614) (210 751) (170 076) 22 786 6 521 (56 616) (78 608) (4 629) 4 560 (34 756)
Operating cash flow per share (cents) 25 30 6 (8) 21 (37) 19 (150) 134 99
financial poSitionCapital and reserves (including negative goodwill) 2 717 969 1 460 586 1 411 645 1 253 982 1 291 348 1 408 949 1 390 233 1 541 093 1 373 205 1 394 782
Net borrowings 5 312 476 503 502 474 564 338 810 304 315 460 464 542 157 466 364 296 571 319 368
Other debt (excluding deferred liabilities) 885 124 460 481 452 509 424 319 456 360 574 399 753 410 625 349 588 023 500 047
Working capital 588 190 168 291 354 458 365 204 407 359 634 868 527 054 886 730 817 179 850 251
Total tangible assets (excluding cash and deferred tax) 3 957 161 2 467 279 2 383 917 2 058 119 2 110 160 2 556 781 2 831 028 2 853 994 2 473 202 2 435 313
* Restated, refer to note 36.
Years prior to 2012 have not been restated for discontinued operations.
6

Rand thousands 2014 2013* 2012 2011 20102009
9 months 2008 2007 2006 2005
operationSRevenue 3 387 121 1 845 524 2 506 794 2 358 986 2 165 727 2 169 584 3 867 565 3 793 357 3 583 702 3 745 145
Continued operations
Operating profit/(loss) before finance costs 456 123 108 625 179 015 121 658 66 907 (117 312) (165 455) 111 668 152 276 129 210
Net finance costs 167 972 23 718 33 873 27 726 22 268 38 253 81 645 57 078 46 572 56 030
Share of losses from joint venture 5 367 – – – – 2 503 9 181 2 973 446 –
Profit/(loss) before taxation 282 784 84 907 145 142 93 932 44 639 (158 068) (256 281) 51 617 105 258 73 180
Taxation 81 270 (1 117) (13 131) (10 084) 1 740 (27 470) (72 212) 855 18 841 23
Profit/(loss) from continued operations for the year 201 514 86 024 158 273 104 016 42 899 (130 598) (184 069) 50 762 86 417 73 157
Loss from discontinued operations for the year (159 901) (45 173) (21 442) (95 440) (246 355) (153 962) – – – –
Profit/(loss) attributable to shareholders (11 157) 40 851 136 944 8 567 (203 593) (279 344) (178 842) 50 770 85 471 73 255
caSh floWNet cash flow 332 448 50 843 175 954 105 594 62 788 (195 652) (86 619) 98 185 159 902 98 899
Cash generated from/(utilised by) operations – nominal 217 444 202 584 39 386 (57 281) 149 628 (162 040) 6 023 (161 019) 128 246 102 863
Net cash (outflow)/inflow from investing activities (191 614) (210 751) (170 076) 22 786 6 521 (56 616) (78 608) (4 629) 4 560 (34 756)
Operating cash flow per share (cents) 25 30 6 (8) 21 (37) 19 (150) 134 99
financial poSitionCapital and reserves (including negative goodwill) 2 717 969 1 460 586 1 411 645 1 253 982 1 291 348 1 408 949 1 390 233 1 541 093 1 373 205 1 394 782
Net borrowings 5 312 476 503 502 474 564 338 810 304 315 460 464 542 157 466 364 296 571 319 368
Other debt (excluding deferred liabilities) 885 124 460 481 452 509 424 319 456 360 574 399 753 410 625 349 588 023 500 047
Working capital 588 190 168 291 354 458 365 204 407 359 634 868 527 054 886 730 817 179 850 251
Total tangible assets (excluding cash and deferred tax) 3 957 161 2 467 279 2 383 917 2 058 119 2 110 160 2 556 781 2 831 028 2 853 994 2 473 202 2 435 313
* Restated, refer to note 36.
Years prior to 2012 have not been restated for discontinued operations.
* Restated, refer to note 36.
2010 2011 2012 2013* 2014
2 1662 359 2 507
1 845
3 387
Branded product distribution
properties
media
textiles
industrials
SEGmENT REVENUE (rm)
clothing
Seardel integrated annual report 20147

ten-year revieW (continued)
Rand thousands 2014 2013* 2012 2011 20102009
9 months 2008 2007 2006 2005
ratioSProfitability
Operating profit/(loss) as percentage of revenue – continued operations (%) 13,5 5,9 7,1 5,2 3,1 (5,4) (4,3) 2,9 4,2 3,5
Profit/(loss) for the period as percentage of revenue – continued operations (%) 5,9 4,7 6,3 4,4 2,0 (6,0) (4,8) 1,3 2,4 2,0
Return on total tangible assets – continued operations (%) 11,4 4,4 7,5 5,9 3,2 (6,2) (6,2) 3,8 6,1 5,3
Return on investments (%) (0,3) 1,7 5,7 0,4 (9,6) (14,6) (6,3) 1,8 3,5 3,0
Return on shareholders’ interest (%) (0,4) 2,8 9,7 0,7 (15,8) (26,4) (12,9) 3,3 6,2 5,2
Leverage
Ratio of borrowings to capital and reserves (%) 195 34 34 27 24 33 39 31 22 23
Ratio of debt to capital and reserves (%) 228 66 66 61 59 73 93 71 64 58
Liquidity
Current ratio (times) 1,4 1,2 1,4 1,5 1,5 1,7 1,4 1,9 2,0 2,2
Solvency ratio (%) 5,2 5,2 18,9 13,6 7,5 (23,9) (6,4) 7,9 15,1 7,2
Finance charges cover (times) 2,7 4,6 5,3 4,4 3,0 (3,1) (2,0) 2,0 3,3 2,3
Productivity
Total assets turn 0,9 0,7 1,1 1,1 1,0 1,1 1,4 1,3 1,4 1,5
Number of employees 6 301 6 475 7 887 9 541 11 771 13 221 14 847 15 343 15 170 15 280
Revenue per employee (Rand) 537 553 285 023 317 839 247 247 183 988 218 802 260 495 247 237 236 236 245 101
Operating profit/(loss) per employee (Rand) 72 389 16 776 22 697 12 751 5 684 (11 831) (11 144) 7 278 10 038 8 456
Assets per employee (Rand) 628 021 381 047 302 259 215 713 179 268 193 388 190 680 186 013 163 032 159 379
Cash value added factor (%) 97 51 54 55 85 39 61 55 69 65
Share StatiSticS (Refer to page 125 for analysis of shareholders)
Weighted average number of shares issued (000) 884 013 685 310 703 398 702 946 702 946 443 253 90 048 91 015 105 224 122 362
Headline earnings/(loss) per share (cents) 0,1 2,9 20,9 (3,5) (22,2) (45,6) (111,0) 22,7 73,0 58,6
Earnings/(loss) per share (cents) (1,3) 6,0 19,5 1,2 (29,0) (63,0) (198,6) 55,8 81,2 58,3
Proposed dividend – – – – – – – 12,0 27,0 11,0
Headline earnings/(loss) yield at period-end (%) 0,1 2,4 17,6 (4,2) (62,5) (157,3) (33,1) 3,0 10,6 16,4
Dividend yield at period-end (%) – – – – – – – 1,6 4,0 3,0
Proposed dividend cover (times) – – – – – – – 1,9 2,7 5,3
Net asset value per share – excluding intangible assets (cents) (321) 212 199 177 183 197 1 514 1 703 1 502 1 212
Total number of shares traded (000) (000) 54 555 19 711 23 732 57 982 8 957 9 870 6 962 7 136 36 715 31 137
Total value of shares traded (R000) (R000) 134 992 24 513 19 260 28 979 3 491 5 372 41 609 49 384 173 247 86 883
Percentage of issued shares traded (%) 4,5 2,8 3,4 8,2 1,3 1,9 7,6 7,8 39,3 0,3
Market price – highest – ordinary (cents) 320 154 120 100 50 350 1 000 810 700 430
– N ordinary (cents) 315 145 115 90 60 330 785 825 700 425
– lowest – ordinary (cents) 116 86 71 32 33 33 340 651 365 205
– N ordinary (cents) 120 96 72 31 30 32 220 600 350 181
– period-end – ordinary (cents) 200 120 119 85 36 38 350 750 700 360
– N ordinary (cents) 174 120 111 83 31 42 330 750 670 370
* Restated, refer to note 36.
Years prior to 2012 have not been restated for discontinued operations.
8

Rand thousands 2014 2013* 2012 2011 20102009
9 months 2008 2007 2006 2005
ratioSProfitability
Operating profit/(loss) as percentage of revenue – continued operations (%) 13,5 5,9 7,1 5,2 3,1 (5,4) (4,3) 2,9 4,2 3,5
Profit/(loss) for the period as percentage of revenue – continued operations (%) 5,9 4,7 6,3 4,4 2,0 (6,0) (4,8) 1,3 2,4 2,0
Return on total tangible assets – continued operations (%) 11,4 4,4 7,5 5,9 3,2 (6,2) (6,2) 3,8 6,1 5,3
Return on investments (%) (0,3) 1,7 5,7 0,4 (9,6) (14,6) (6,3) 1,8 3,5 3,0
Return on shareholders’ interest (%) (0,4) 2,8 9,7 0,7 (15,8) (26,4) (12,9) 3,3 6,2 5,2
Leverage
Ratio of borrowings to capital and reserves (%) 195 34 34 27 24 33 39 31 22 23
Ratio of debt to capital and reserves (%) 228 66 66 61 59 73 93 71 64 58
Liquidity
Current ratio (times) 1,4 1,2 1,4 1,5 1,5 1,7 1,4 1,9 2,0 2,2
Solvency ratio (%) 5,2 5,2 18,9 13,6 7,5 (23,9) (6,4) 7,9 15,1 7,2
Finance charges cover (times) 2,7 4,6 5,3 4,4 3,0 (3,1) (2,0) 2,0 3,3 2,3
Productivity
Total assets turn 0,9 0,7 1,1 1,1 1,0 1,1 1,4 1,3 1,4 1,5
Number of employees 6 301 6 475 7 887 9 541 11 771 13 221 14 847 15 343 15 170 15 280
Revenue per employee (Rand) 537 553 285 023 317 839 247 247 183 988 218 802 260 495 247 237 236 236 245 101
Operating profit/(loss) per employee (Rand) 72 389 16 776 22 697 12 751 5 684 (11 831) (11 144) 7 278 10 038 8 456
Assets per employee (Rand) 628 021 381 047 302 259 215 713 179 268 193 388 190 680 186 013 163 032 159 379
Cash value added factor (%) 97 51 54 55 85 39 61 55 69 65
Share StatiSticS (Refer to page 125 for analysis of shareholders)
Weighted average number of shares issued (000) 884 013 685 310 703 398 702 946 702 946 443 253 90 048 91 015 105 224 122 362
Headline earnings/(loss) per share (cents) 0,1 2,9 20,9 (3,5) (22,2) (45,6) (111,0) 22,7 73,0 58,6
Earnings/(loss) per share (cents) (1,3) 6,0 19,5 1,2 (29,0) (63,0) (198,6) 55,8 81,2 58,3
Proposed dividend – – – – – – – 12,0 27,0 11,0
Headline earnings/(loss) yield at period-end (%) 0,1 2,4 17,6 (4,2) (62,5) (157,3) (33,1) 3,0 10,6 16,4
Dividend yield at period-end (%) – – – – – – – 1,6 4,0 3,0
Proposed dividend cover (times) – – – – – – – 1,9 2,7 5,3
Net asset value per share – excluding intangible assets (cents) (321) 212 199 177 183 197 1 514 1 703 1 502 1 212
Total number of shares traded (000) (000) 54 555 19 711 23 732 57 982 8 957 9 870 6 962 7 136 36 715 31 137
Total value of shares traded (R000) (R000) 134 992 24 513 19 260 28 979 3 491 5 372 41 609 49 384 173 247 86 883
Percentage of issued shares traded (%) 4,5 2,8 3,4 8,2 1,3 1,9 7,6 7,8 39,3 0,3
Market price – highest – ordinary (cents) 320 154 120 100 50 350 1 000 810 700 430
– N ordinary (cents) 315 145 115 90 60 330 785 825 700 425
– lowest – ordinary (cents) 116 86 71 32 33 33 340 651 365 205
– N ordinary (cents) 120 96 72 31 30 32 220 600 350 181
– period-end – ordinary (cents) 200 120 119 85 36 38 350 750 700 360
– N ordinary (cents) 174 120 111 83 31 42 330 750 670 370
* Restated, refer to note 36.
Years prior to 2012 have not been restated for discontinued operations.
Seardel integrated annual report 20149

1 STuaRT Queen (42) BCompt (Hons), CA (SA)
Executive: Mr Queen was appointed to the board in
October 2008 and became chief executive officer
in December 2009. Prior to joining the board he was
financial director of Johnnic Holdings Limited and held
directorships within various subsidiaries of both Hosken
Consolidated Investment Limited and Johnnic Holdings
Limited. He is a member of the executive and risk
committees.
2 GyS WeGe (40) BCompt (Hons), CA (SA)
Executive: Mr Wege appointed to the board as financial
director in August 2009. Prior to joining the board
he served in various senior financial roles within the
automotive logistics industry. Mr Wege is a member of
the executive committee, risk committee and the social
and ethics committee.
3 amOn nTuLi (55)
Executive: Mr Ntuli was appointed to the board in
October 2008. He was the president of the Southern
African Clothing and Textile Workers Union from 1985
to 2003. Mr Ntuli joined the Seardel Group in 1978 and
was appointed as an executive in 2006. He is a director
of SACTWU Investment Group and various trade union
investment companies. He is chairman of the social and
ethics committee.
4 Dave DunCan (BRiTiSh) (59) BCom
Executive: Mr Duncan was appointed to the board in
May 2013 as chief operating officer. He has been with
the Group for more than 30 years in the industrial
manufacturing sector and is a member of the executive
committee.
eXeCutIVe
1 2 3 4
directorS’ profile
10

5 JOhn COPeLyn (64) BA Hons (Wits), BProc (UNISA)
Non-executive chairperson: Mr Copelyn was appointed
to the board in May 2005. He joined Hosken Consolidated
Investments Limited as chief executive officer in 1997.
Prior to this he was a member of parliament and general
secretary of the Southern African Clothing and Textile
Workers Union. He holds various directorships including
the Industrial Development Corporation Limited, Tsogo
Sun Holdings Limited and Niveus Investments Limited.
6 Kevin GOvenDeR (43) BCom (Hons), BCompt (Hons)
Non-executive: Mr Govender was appointed to the board
in October 2008. He joined the Hosken Consolidated
Investments Group in 1997 and was appointed to the
board of Hosken Consolidated Investments Limited as
an executive director in 2009.
7 RaCheL WaTSOn (55)
Independent, non-executive: Ms Watson was appointed
to the board in August 2009. She has 33 years’
operational experience within the clothing industry. During
her last 14 years within the industry Ms Watson served
as a trade union representative in various organisational
positions. She currently holds a position as an executive
at a regional broadcaster and was appointed to the
board of Hosken Consolidated Investments Limited in
March 2014. She is a member of the audit, risk, and
social and ethics committees.
8 yuniS ShaiK (56) BProc (UNISA)
Independent, non-executive: Mr Shaik was appointed
to the board in October 2008. Mr Shaik is an executive
director of Hosken Consolidated Investments Limited.
Prior to his appointment at HCI he was an attorney of the
High Court and served as a senior commissioner to the
CCMA in KwaZulu-Natal. He is a former deputy-general
secretary of the Southern African Clothing and Textile
Workers Union and a non-executive director of Tsogo
Sun Holdings Limited and Niveus Investments Limited.
9 mOhameD ahmeD (49) BCompt
Independent, non-executive: Mr Ahmed was appointed
to the board in October 2008. He previously held
directorships in Hosken Consolidated Investments
Limited, MTN, Real Africa Holdings and numerous
entities within the clothing and textile industry. He is a
member of the audit and risk committees and the lead
independent non-executive director.
non-eXeCutIVe
5 6 7 8
Seardel integrated annual report 201411

The year ended 31 March 2014 has been a transformative
year for the Group, with two very significant events being
reflected in the financial results as presented:
• Firstly, theGroupacquireda63,9% interest inSabido
Investments Proprietary Limited (Sabido). Sabido is the
investment vehicle that houses e.tv, eSat.tv, Yfm and
Sasani Studios, amongst others. The acquisition was
funded through a combination of R4,4 billion of debt and
R800 million of equity. The equity portion was settled
by the issue of 350 million N ordinary shares to Hosken
Consolidated Investments Limited (HCI) and 150 million
N ordinary shares to SACTWU. Subsequent to the
financial year-end the Group successfully concluded a
R5 billion rights issue, the proceeds of which have gone
to reducing the Group’s debt, including repayment of the
debt associated with the Sabido acquisition.
• Secondly, the Group disposed of its apparel
manufacturing business to an associate company of
SACTWU. The effect of the transaction on the current
year’s results is a R160 million loss which is reflected as
a loss from discontinued operations.
In addition to the above transactions, the businesses
themselves are also going through transformative periods,
the most notable of which being Sabido/e.tv, which is
transitioning from a single channel to a multi-channel
business. Some of the non-media businesses of Seardel are
also transitioning themselves from a defensive turnaround
phase into a growth phase. These transitional initiatives will
require increased costs being absorbed, ahead of future
benefit.
The effect of the above renders any year-on-year
comparisons meaningless and the results are best analysed
within the segmental results. Having said that, the following
items reflected in the results are important considerations
in analysing the overall financial performance for the year
ended 31 March 2014:
a) The Group recorded a R160 million loss attributable to
its apparel manufacturing business, disclosed as a loss
from discontinued operations.
b) Financing expenses include R110 million relating to the
debt assumed on the acquisition of Sabido. This debt
was fully repaid on 25 April 2014.
c) Accounting convention dictates that on the acquisition
of a new business, certain intangible assets need to be
identified, valued and then amortised against the cost
of the acquisition in future years. The amortisation of
the intangible assets included for the six-month period
that Sabido has been owned by the Group amounted to
R40 million.
d) R7 million of transaction costs associated with the
Sabido transaction were expensed during the current
financial year.
e) The current period’s results include non-recurring
income of R38 million relating to the final piece of the
litigation with former directors as disclosed in the SENS
announcement of 10 May 2013.
mediaThis is the first year that the Group is reporting on the
Sabido numbers. Therefore, as can sometimes be the
case, particularly in the first year of reporting, accounting
convention often makes it difficult to reconcile the numbers
as reported back to the underlying performance of the
business acquired. We believe that users of these financial
statements will benefit from some information on Sabido’s
full-year performance, before commenting on what has
ultimately been reported in the Group numbers.
Sabido performanceIn the year ended 31 March 2014 Sabido has undergone significant expansion. The investments into this expansion, which consisted primarily of investments into Platco Digital’s free-to-view OpenView HD platform, e.tv’s new multi-channel
chief executive officer’S report
12

offering and the online news business, enca.com, has had
a negative effect on the profits in the current year. However,
these businesses will assist Sabido, over time, to transition
from a single-channel business to a multi-channel business
operating across multiple platforms.
Sabido’s full-year profit after taxation from continuing
operations was R447 million, which is down from
R499 million in the previous year. If the impact of the
expansion operations was to be excluded, the profit from
continuing operations would have increased by 19% from
R508 million in the prior year, to R604 million in the current
year. The improved performance was achieved by a 12%
increase in revenue, on the back of continued advertising
and subscription revenue growth. On the EBITDA line
Sabido delivered R763 million in the current year, down from
R820 million in the previous year. However, if the impact
of the expansion operations was to be excluded, EBITDA
would have increased by R98 million to R926 million.
Sabido numbers as reflected in the Group numbersUsing the R447 million profit after taxation recorded by
Sabido as a starting point, Seardel has made the following
adjustments in arriving at its own numbers:
• R266millionwerepre-acquisitionprofitsandhencenot
accounted for in the Seardel numbers.
• R110millionof financecostswere incurred relating to
acquisition debt. Following the rights issue this debt has
been repaid in full on 25 April 2014.
• R33millionof amortisationcosts (net of taxation)was
recorded, being the amortisation of the intangible assets
identified on acquisition. This amortisation cost is for the
six months since the effective date of the acquisition.
• R7 million of transaction costs, associated with
the Sabido transaction, were expensed during the
current period.
Seardel non-mediaThe results of the continuing Seardel non-media businesses
were pleasing, with good growth being shown across all
the segments. Revenue was up 17% to R2,2 billion, whilst
gross margins improved by 900 basis points to 25,5%.
The combination of revenue growth and improved margins
resulted in operating profit before interest improving by 98%
to R215 million. Excluding the effects of the non-recurring
items (once-off settlement income, revaluation of investment
properties and impairment reversals) operating profit before
interest increased by 72% to R154 million.
What is encouraging is that, despite what remain very
challenging economic times, collectively these non-media
businesses have been on a consistent growth path for
the past few years. However, their performance was
often overshadowed by the poor results of the apparel
manufacturing division.
Seardel integrated annual report 201413

Property segmentThe property segment results exclude Sabido properties,
valued at R504 million, which are accounted for under the
media segment.
Overall property values increased by 6% to R1 005 million
from R944 million in the prior year. The increase is driven
by R37 million spent on redevelopments, R39 million on
property acquisitions, R39 million in upward revaluations at
year-end, less disposals and transfers to assets held for sale
of R54 million.
Revenue increased 28% to R119 million as the developed
properties were either completed during the year or
accounted for a full twelve-month period, as opposed to a
portion of the corresponding period. Revenue from external
tenants increased by 51% to R72 million and now represents
60% of the total revenue for this segment.
Operating profit before finance costs increased by 61%
to R104 million, up from R64 million in the prior period.
However, it should be noted that the current year’s profit
number includes a R21 million upwards revaluation of
investment properties, whilst the prior period included a
downward revaluation of R2 million. Excluding the effects of
the revaluations sees operating profit up 26%.
Branded product segmentThe branded product segment recorded pleasing revenue
growth of 20% to R958 million while operating profit before
finance costs climbed 141% to R37 million, admittedly off a
low base in the prior year. Although the growth in operating
profit is pleasing, operating margins remain low at 3,9%.
We have previously mentioned that we were continuing to
invest in marketing and building our distribution platforms
in this segment, with much of this investment being ahead
of expected future revenue growth. This remains the case,
particularly within our office automation business and Brand
ID. We expect operating margins to improve once these
businesses find the requisite traction. To aid in this, post
the year-end we have concluded a transaction to acquire
the distribution rights for a number of sporting brands, most
notably Canterbury, Mizuno, Skins, Karrimor, Dunlop and
Slazenger. These brands will be housed within the Brand
ID business and the revenue they generate will allow for a
better amortisation of the fixed costs.
Textile segmentAlthough trading conditions for the businesses within this
sector remained tough throughout the current financial
period, the businesses managed to achieve revenue growth
of 7%.
chief executive officer’S report (continued)
14

To compare the current year’s operating profit to the prior year the non-recurring items from the prior period need to be excluded. These non-recurring items included a R23 million impairment reversal, as well as R9 million of extra energy costs due to liquidation of an external steam supplier. Adjusting for these items sees operating profits on a normalised basis climb 20% to R20 million.
Although the improved profitability is pleasing, operating margins at a little over 2,5% are extremely thin, especially considering that they include the benefits derived from the government’s production incentive scheme. The thin margins reflect the vulnerability of these businesses despite them having, in our view, very able and committed management teams. Our challenge over the next few years will be to guide and transition these businesses into areas where they can glean higher margins.
industrial segmentThe manufacturing businesses within the industrial sector
continue to deliver pleasing growth. During the course of the
current financial year the Group completed an acquisition
of a bulk bag manufacturer, which helped grow segmental
revenue by 27% to R425 million.
The revenue growth enabled operating margins to be
widened from 5,1% in the prior period to 8,3% in the current
period, which resulted in operating profit more than doubling
to R33 million.
diScontinued apparel manufacturingThe Group has disposed of its loss-making apparel
manufacturing business to an associate company of
SACTWU. The R160 million loss reflected in the discontinued
operations line includes the operating losses through to
30 September 2013 of R46 million, the discount on the assets
sold of R105 million, as well as associated closure costs.
appreciationWe would like to take this opportunity to thank all our
employees for their concerted efforts during the past financial
year. The improvements reflected in this report are as a
direct result of the commitment shown by our management
teams and all the staff that support them.
Stuart Queen
Chief Executive Officer
Cape Town
18 September 2014
Seardel integrated annual report 201415
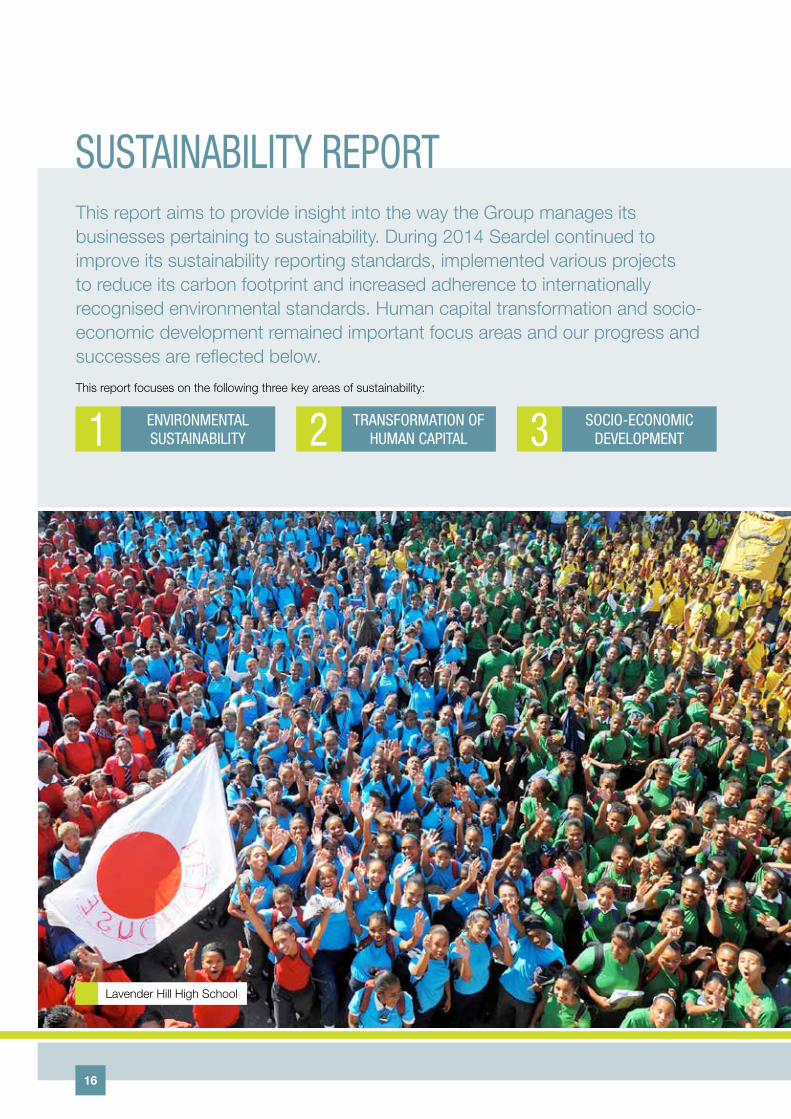
SuStainaBility reportThis report aims to provide insight into the way the Group manages its businesses pertaining to sustainability. During 2014 Seardel continued to improve its sustainability reporting standards, implemented various projects to reduce its carbon footprint and increased adherence to internationally recognised environmental standards. Human capital transformation and socio-economic development remained important focus areas and our progress and successes are reflected below.
This report focuses on the following three key areas of sustainability:
1 environmental SuStainaBility 2 tranSformation of
human capital 3 Socio-economic development
Lavender Hill High School
16

environmental Carbon footprint measurement
A greenhouse gas (GHG) emissions report (carbon footprint)
is the basis for accounting emissions-related risks and
opportunities for the Group. The group continues to report
in terms of the GHG Protocol and units of tonnes CO2e, the
universal unit measure.
The Group’s effort to reduce its carbon footprint is focused
on Scope 1 direct emissions and Scope 2 indirect emissions
as a result of purchased energy requirements. The bulk
of its focus is directed to the manufacturing businesses
which have high energy requirements. The GHG Protocol
related to Scope 1 and Scope 2 emissions are set out in the
below table:
SCOPe 1
Direct GHG
emissions
Direct emissions occur from sources
that are owned or controlled by the
company. For example, emissions
from company-owned vehicles
and kilns.
SCOPe 2
Electricity/Steam
indirect emissions
Scope 2 accounts for GHG
emissions from the generation
of purchased electricity/steam
consumed by the company.
Scope 2 emissions physically occur
at the facility where electricity or
steam is generated.
The Group’s dedication to drive continuous energy efficiency improvements has resulted in further progress to reduce
production input costs and reduce total emissions compared to the prior reporting period.
Scope
2014 Tonnes of CO2
2013 Tonnes of CO2 Notes
Scope 1 – Direct emissions from 30 342 12 169
Diesel used 642 957 ê
Petrol used 1 062 1 241 ê
Coal used 19 661 7 218 é� n2
Heavy fuel oil used 4 637 1 041 ê
Liquified petroleum gas used 1 271 1 712 ê
Natural gas used 3 068 – é� n1
Scope 1 from new companies acquired through business combinations 411 – � n3
Scope 2 – indirect emissions from 53 434 74 945
Purchased electricity 41 029 43 424 ê
Purchased stream – 31 521 é� n2
Scope 2 from new companies acquired through business combinations 12 405 – � n3
Total scope 1 and 2 emissions 83 776 87 114
n1 Natural gas not previously recorded.
n2 Steam previously purchased from an external steam supplier is now produced in-house after the commissioning of a modern coal-fired boiler. This intervention represents the bulk of the Group’s reduction in carbon emissions. (Please note: Externally procured steam is reported in Scope 2 as opposed to internally produced steam, which is in Scope 1.)
n3 To enhance the comparability of the data, businesses acquired during the year is disclosed separately.
The Group’s overall carbon emissions reduced by 3,8% year on year. However, if carbon emissions from new business
acquisitions are excluded, year-on-year emissions reduced by 18,5%.
Seardel integrated annual report 201417

tranSformation of human capitalSeardel is committed to the transformation of its human
capital and its efforts are aligned with the principles and
objectives of broad-based black economic empowerment
as envisaged by the Department of Trade and Industry.
The Group continued to improve its transformation score
compared to the prior year. This improvement is reflective of
the Group’s efforts to practically implement its empowerment
philosophies.
Transformation is monitored and managed within a
governance framework which includes the social and ethics
committee, an internal transformation committee, in which
the chief executive participates, and the business unit
transformation forums.
Seardel’s broad-based black economic empowerment profile is summarised below:
BBBee Max 2014 2013
Ownership 20,00 23,00 23,00
Management control 10,00 5,39 6,00
Employment equity 15,00 11,18 10,34
Skills development 15,00 7,33 8,07
Preferential procurement 20,00 20,00 18,60
Enterprise development 15,00 15,00 15,00
Socio-economic development 5,00 5,00 5,00
Total % 100,00 86,90 86,01
Level 2 Level 2
The Group’s transformation objectives are set out below:
• developmentofhumancapital tosustainaskilledand
motivated workforce;
• monitoringtheGroup’sadherencetoandperformance
under the BBBEE Codes;
• monitoringtheGroup’scompliancewiththerequirements
of the Department of Labour in respect of employment
equity; and
• maintainingtheoverallLevel2BBBEEaccreditation.
Transformation rating
Seardel has maintained its Level 2 BBBEE status with an
overall score of 86,9 out of 100. This places Seardel firmly
amongst the top empowerment companies listed on the JSE.
23,00 / 20,00
ownership
5,39 / 10,00
management control
11,18 / 15,00
employment equity
7,33 / 15,00
Skills development
20,00 / 20,00
preferential procurement
15,00 / 15,00
enterprise development
5,00 / 5,00
Socio-economic development
86,90 / 100,00
Total
Seardel’s 2014 broad-based black economic empowerment profile
SuStainaBility report (continued)
18

Ownership and management controlSeardel’s majority shareholder is Hosken Consolidated Investments Limited (HCI), which in turn is a black-owned and controlled company with 34% exercisable voting rights by women. The Group’s ownership element remained exemplary. A change in the board of directors’ composition resulted in a decrease in the management control element in the current period.
Employment equity During the year under review the Group continued to progress and implement its transformation policies. The Group’s employment equity plan focuses on increasing the representation of designated groups, mainly in the senior management and professionally qualified areas.
Strategies have been developed to achieve internal employment equity targets. These strategies include, amongst other things, the implementation of in-house training and development projects. The Group has also implemented a management trainee programme whereby graduates are employed and given the opportunity to work within the Group’s various businesses, gaining valuable exposure across various business functions. The ultimate goal is to equip the students with the required knowledge and skills to facilitate a permanent employment within the Group.
Skills developmentInvesting in our employees is integral in maintaining high levels of competency. During the year the Group continued to focus on the development of its people, with a wide range of skills programmes being offered internally and externally.
These training interventions have been implemented across all levels of employment. Such interventions include operator training, quality training, mentoring, experiential training, engineering apprenticeships, information technology, IR and disciplinary handling, world-class manufacturing, employment equity, supervisory and team leader training, root cause analysis/risk management training, ISO 14000/ISO 9000 training. In addition to the aforementioned, the Group continued with the NQF Level 2 learnership programmes in the respective divisions. Training focused on providing a safe workplace for all employees, continued relentlessly during the reporting period. This includes the training of first-aid, workplace health and safety, and fire-fighting skills. Whilst statutory training is required to ensure compliance with the provisions of the Occupational Health
and Safety (OHS) Act, the company also believes that such
training is critical to ensure a safe working environment
for our employees and every effort is made to reduce and
eliminate risks in all spheres of the organisation.
Changes in the accreditation requirements, as well as
restructuring within the Group, meant that the Seardel
College, which was registered as a Workplace Further
Education and Training (FET) institution with the Department
of Higher Education and Training, had to apply for voluntary
deregistration. Whilst the college has been deregistered, we
are still able to register and train NQF Level 2 learnership
programmes via our in-house accredited training facilities.
The Seardel Mentorship Programme continued during the
reporting period. Management in the respective businesses
participated in the programme on a voluntary basis and give
of their time and expertise to mentor and assist students
who participate in the Group’s bursary programmes.
The students are full-time students at recognised tertiary
institutions in South Africa. The programme has been in
operation for three years and was initially introduced as an
intervention to improve the success/pass rate of students
participating in the Group’s bursary programme. We are
proud of the positive results that have been achieved
through the mentorship programme and the success/pass
rate since the inception of the programme has been 91,5%,
93,9% and 89,4% for the last three years respectively.
These statistics are encouraging when compared with the
high failure rate at tertiary institutions.
Preferential procurement
The Group procured in excess of 96% of its total qualifying
spend from black-owned companies. This reaffirms the
Group’s commitment to source merchandise and services
from empowered local suppliers.
Enterprise development
Enterprise development presents an opportunity to stimulate
sustainable economic growth by assisting the development
and sustainability of black-owned small and medium
businesses in South Africa. Financial assistance is given
to multiple small to medium suppliers, the vast majority of
which are black-owned. The support is mainly in the form
of favourable payment terms to support the cash flows of
these operations.
Seardel integrated annual report 201419

Socio-economic developmentSeardel acknowledges its social responsibility towards
the communities in which we operate. Together with the
HCI Foundation the Group has been involved in various
community projects. These projects have covered a diverse
spectrum, from supporting orphaned and abandoned
children, people with disabilities, to HIV/AIDS rehabilitation
centres.
The Group’s projects have been focused on education,
women, children and wildlife-related organisations. In order
to create awareness, direct involvement and ownership of
projects, the various businesses within the Seardel Group
are encouraged to adopt a needy organisation in the area
in which they operate. This results in the management and
employees in the businesses taking a direct interest in the
organisation and, in addition to financial support, giving
freely of their own time and expertise. This direct involvement
adds great value to the Group’s CSI project. In support of
the aforementioned and dependent on circumstances,
businesses are encouraged to adopt a charity for more than
one year. We have also supported a principle of assisting a
smaller number of organisations to ensure a more meaningful
contribution and support.
y.e.S. ProjectDuring the year under review we continued our support and
involvement in the Lavender Hill Development Trust Project.
The Y.E.S. Project – Youth Encouragement through School
Project – is a joint project with the HCI Foundation. The project
has been very rewarding and resulted in great success for
the Lavender Hill Secondary School. Pupils have been given
renewed hope of an education and a future. Furthermore, they
have become involved in school and extramural activities,
which ensure they are kept off the streets and limit exposure
to drugs and undesirable activities. Through the Y.E.S. Project
and other activities undertaken by Lavender Hill Development
Trust the school has made massive strides to improve its
facilities and infrastructure. The current project is the building
of a school hall.
COmPaSSSeartec continued to support a COMPASS (Community
Provision and Social Services) project to provide support
and sustain three babies, triplets, for a year.
KZn Cerebral Palsy Reunion SchoolGold Reef Speciality Chemicals supports the KZN Cerebral
Palsy Reunion School. The management and staff have
embraced the concept of adopting the Reunion School.
They have provided much-needed assistance and made a
difference in the lives of these severely handicapped children.
Save the RhinoPrima Toys, in association with the HCI Foundation and Pick
n Pay, was involved in the Save the Rhinos Project/Baby
Rhino Campaign. The project was highly successful and, in
collaboration with Pick n Pay, some R235 000 was raised
towards this worthy cause. In the current calendar year
658 rhinos have succumbed to poaching, whilst more than
1 000 rhinos were poached in 2013.
Saartjie Baartman Centre For Women and ChildrenThe Saartjie Baartman Centre in the Western Cape is
supported by Group’s Western Cape clothing operation. The
organisation provides much-needed support and education
for abused woman and children. Women are taught skills
to be able to earn an income and thereby become self-
sufficient, which reduces the risk of abuse against them.
Jess Foord FoundationThe Jess Foord Foundation is a new project supported by
Brits Automotive Systems. The foundation was created
in 2008 to support women who have been victims of
physical or sexual abuse and/or rape. Statistics indicate
that 282 women are raped in South Africa every 80 minutes.
Brits Automotive Systems, with the support of the HCI
Foundation, was a major contributor towards the creation
of a community and crisis centre at Marianhill, Durban. Most
of our employees live in the area and will benefit from the
services provided by the Community Crisis Centre.
The Seardel Group is proud to be associated with these
worthy causes and appreciates the contribution and
sacrifices made by management and staff in support of
these organisations. We also record our appreciation of the
ongoing support provided by the HCI Foundation towards
our CSI projects. Together we have made a difference.
SuStainaBility report (continued)
20

caSh value added Statement2014
R000’s2013
R000’s2012
R000’s2011
R000’s2010
R000’s
Cash derived from revenue 2 979 401 2 564 619 2 514 194 2 489 813 2 586 923
Paid to suppliers for materials and services 1 509 093 1 703 613 1 616 967 1 610 024 1 580 839
Cash value added 1 470 308 861 006 897 227 879 789 1 006 084
Interest received 2 080 2 971 4 594 7 925 22 563
Total wealth created 1 472 388 863 977 901 821 887 714 1 028 647
Distributed as follows:
employees
Administration 302 801 180 009 168 638 233 758 207 692
Production 279 338 267 710 379 291 396 680 468 763
Sales 165 217 142 444 147 554 120 798 136 759
747 356 590 163 695 483 751 236 813 214
Providers of capital
Interest paid on borrowings 170 052 43 095 38 467 35 651 58 438
Dividend to shareholders – – – – –
170 052 43 095 38 467 35 651 58 438
monetary exchanges with government
Taxation (including customs and excise duty) 226 983 46 579 46 899 22 983 40 770
PAYE 107 531 64 968 84 499 94 956 111 404
VAT 42 867 12 560 35 797 77 833 131 266
Incentives (39 845) (95 972) (38 710) (37 664) (14 851)
337 536 28 135 128 485 158 108 268 589
Retained to develop future growth/(utilised in operations) 217 444 202 584 39 386 (57 281) (111 594)
Total wealth distributed 1 472 388 863 977 901 821 887 714 1 028 647
Value added is a measure of the wealth that the Group has created in its broadcasting, letting, manufacturing and distribution operations by adding value to the cost of its raw materials and services purchased.
The statement above shows how that wealth was created, and also how it was shared between employees and the providers of funds to the Group.
The statement takes into account the amounts retained and reinvested in the Group for the replacement of assets and the development of future operations.
Distribution of wealth 2014 2013 2012 2011 2010
Employees (%) 50,8 68,3 77,1 84,6 79,1
Government (%) 22,9 3,3 14,2 17,8 26,1
Retained/(utilised) (%) 14,8 23,4 4,4 (6,4) (10,9)
Lenders (%) 11,5 5,0 4,3 4,0 5,7
Shareholders (%) – – – – –
(%) 100,0 100,0 100,0 100,0 100,0
Seardel integrated annual report 201421

corporate governance
The Seardel Group’s directors, officers and senior
management remain committed to the highest level of
corporate governance and endorse the Code of Corporate
Practices and Conduct as enshrined in the Third King Report
on Corporate Governance. Sound corporate governance
structures are viewed as pivotal to delivering on the Group’s
sustainability objectives.
application of King iiiThe JSE Limited Listings Requirements made adherence
to selected King III requirements compulsory. The directors
assessed the Group’s compliance to the recommendations
of King III and confirmed that, except where indicated, the
Group complied with all material aspects of these corporate
governance principles. With reference to the remainder of
the King III requirements, where the directors’ assessment
has indicated that certain practices are not in the best
interest of Seardel, we explain the reasons for our alternative
approach as follows:
Principle 2.16 recommends that the board should elect
a chairman who is an independent non-executive director.
The board has appointed a non-executive chairman and,
in terms of the definition provided, he is not regarded as
independent. The board is of the opinion that the experience
and specialist knowledge of the environment in which
Seardel operates, makes it appropriate for him to hold this
position. The board has appointed Mr M Ahmed as lead
independent non-executive director.
Principle 2.18 recommends that the majority of non-
executive directors should be independent. As a result
of Mr Shaik accepting the appointment as an executive
director of Hosken Consolidated Investments Limited, the
majority shareholder of Seardel, he no longer meets the
definition of independent in terms of the definition provided.
Consequently, at the reporting date, the majority of the non-
executive directors were not independent. Subsequent to
year-end Mrs N Jappie was appointed to the board as an
independent non-executive member.
Principle 2.26 recommends that the remuneration of each
individual director and the three most highly paid employees
who are not directors in the company be disclosed. The
remuneration report discloses the remuneration of the three
most highly paid employees, however the names of the
employees who are not directors have not been disclosed as
the board is of the opinion that such information is private to
the individuals concerned and adds no value to stakeholders.
Principle 4.6 recommends that frameworks and
methodologies are implemented to increase the probability
of anticipating unpredictable risks. It is the view of the
risk committee that the existing governance principles
and levels of risk tolerance embedded within the Group
provide sufficient coverage of the risks associated with the
probability of anticipated unpredictable risks.
Principles 4.9 and 9.3 recommends that the effectiveness
of the risk management process and sustainable reporting
and disclosure should be independently assured. The
Group’s external auditors have assured the financial
statements and accredited specialist agencies have
verified the disclosure on broad-based black economic
empowerment, property valuations and carbon emissions.
The Group has implemented a combined assurance
framework which considers the assurance provided by
all independent assurance providers. The extent of the
independent assurance received is deemed to be sufficient.
Detailed disclosure of the Group’s adherence to the King III
principles is published on our website, www.seardel.co.za
Board of directorSSeardel has a unitary board which is tasked with both
leading and controlling the Group’s strategy and operations.
The collective experience and diversity of the directors bring
This report provides our stakeholders with insight as to how the board and its underlying committees are overseeing and guiding the Group’s performance and strategy. It further outlines our corporate structure which is responsible to ensure compliance with internal policies and external regulation.
22

a broad perspective and invaluable wealth of insight. Their
knowledge comes from a diverse array of backgrounds
and specialist skills across a range of sectors including law,
accounting, manufacturing, logistics and industrial relations.
Board compositionAt year-end the board of directors comprises nine members,
five non-executive directors and four executive directors.
Two of the five non-executive directors are independent.
Subsequent to year-end the board appointed an additional
independent non-executive director. The composition
of the board is a reflection of the demographics of the
Group’s diversified investments and attempts to ensure a
representative voice of all relevant stakeholders.
The composition of the board is regularly reviewed to ensure a
balance of power and authority, negate individual dominance
in the decision-making processes and promote objectivity.
The board has appointed a non-executive director as
chairman. The roles of chairman and chief executive officer
are separate with a clear division of responsibilities.
During the year Mr N Lazarus resigned from the board
and Mr Ahmed, Mr Shaik and Ms Watson were re-elected
as directors at the annual general meeting (AGM) held on
28 October 2013.
The company’s ultimate controlling shareholder is Hosken
Consolidated Investments Limited (HCI). Mr Copelyn,
Mr Govender, Mr Shaik and Ms Watson also serve on the
HCI board.
Board appointment The appointment to the board of directors is governed by
a formal board-approved mandate regulating the terms of
reference and incorporates the provisions of the Companies
Act of 2008, as amended, the mandatory provisions
as stipulated in paragraph 3.84 of the JSE Listings
Requirements, recommendations of the King Code and the
memorandum of incorporation of the company.
There is a distinctive division of responsibilities at board
level so that not one individual has unfettered powers of
decision-making. The board as a whole, within its powers
and in a formal and transparent manner, is responsible for
the selection and appointment of directors.
Directors do not have a fixed term of appointment and there
is no mandatory retirement age for non-executive directors.
According to the company’s memorandum of incorporation
as adopted, non-executive directors retire every three years,
with at least one-third of non-executive directors to retire
every three years at the AGM. Executive directors are to
retire every five years. A retiring director shall be eligible for
re-election and, if re-elected, shall be deemed not to have
vacated office. The directors retiring at the forthcoming AGM
of the company are Mr J Copelyn and Mr K Govender. Their
reappointment is subject to shareholders’ approval.
Subsequent to year-end Mrs N Jappie was appointed to the
board. As required in terms of the company’s memorandum
of incorporation, at the forthcoming AGM, Mrs N Jappie’s
appointment is subject to shareholders’ approval.
The name and brief curriculum vitae of each director appears
on pages 10 and 11.
independence of directorsSeardel’s non-executive directors acknowledge the need
for their independence, while recognising the importance of
good communication and close co-operation with executive
management. The directors are entitled to seek independent
professional advice at the company’s expense concerning
the company’s affairs and have access to any information
they may require in discharging their duties as directors.
Seardel’s lead independent director is responsible for
verifying on an annual basis the continuing independence
and objectivity of the independent non-executive directors.
This is done by assessing any circumstance or relationships
that could affect such independence.
Board attendanceThe board meets at least four times a year and additional
meetings can be convened to consider specific business
issues which may arise between scheduled meetings. No
additional meetings were required during the year. Directors
are provided with substantive board papers to enable them
to consider the issues on which they are requested to make
decisions. The following table details each director’s board
meeting attendance during the year under review:
Seardel integrated annual report 201423

corporate governance (continued)
company SecretaryHCI Managerial Services (Pty) Ltd is the appointed company secretary of the Group. The company secretary provides support and guidance to the board in matters relating to governance, ethical conduct and their fiduciary duties. Where required, representatives of the company secretary facilitate induction and training for directors and co-ordinate the annual board and committee evaluation process.
Directors have unrestricted access to the advice and services of the company secretary. Neither the company secretary, nor any representatives of the company secretary, is a director of any of the Group’s operations and accordingly maintains an arm’s length relationship with the board and its directors.
The company secretary is responsible for the functions as set out in section 88 of the Companies Act of 2008 (as amended). The board has assessed the directors and the designated staff of the company fulfilling the role of the company secretariat and is satisfied that they have the competence, qualifications and experience to effectively fulfil the role of company secretary. All board, committee and shareholders’ meetings are properly recorded as per the requirements of the Act.
dealingS in the company’S SecuritieSSeardel complies with the continuing obligations of the Listings Requirements of the JSE. The company’s directors, executives and senior employees are prohibited from dealing
in Seardel securities during certain prescribed restricted
periods. The company secretary regularly disseminates
written notices to inform them of the insider trading
legislation and advise them of closed periods. All directors
and senior executives are required to obtain clearance from
the company secretary prior to dealings in the company
securities. All dealings in the company’s securities are
disclosed in terms of the applicable Listings Requirements.
governance of itThe board of directors are responsible for information
technology (IT) governance. The board tasks the Group
head of IT to ensure IT governance compliance within the
Seardel Group.
The Group head of IT further provides oversight and
direction on business level IT strategy, IT investment and
the efficiency and effectiveness of IT. IT risk management
is aligned with the Group risk management structure and is
channelled by way of the risk management committee. The
committee receives feedback on critical risk issues and the
solutions proposed including progress reports.
Board committeeSSeardel’s board committees play a pivotal role in guiding
and overseeing strategy, enhancing high standards of
governance and achieving increased effectiveness within
the Group. The committees comprise members of the board
and executive officers of the Group.
16 May 2013 14 August 2013 11 November 2013 17 March 2014
J A Copelyn ü ü ü üN N Lazarus ü ü ∆ ∆
M H Ahmed ü ü ü üD Duncan ü ü ü üT G Govender ü ü ü üA M Ntuli ü ü ü üS A Queen ü ü ü üY Shaik ü ü ü üR Watson ü ü ü üG Wege ü ü ü ü
√ In attendance.
∆ No longer a member of the board.
24

Board committees are free to take independent, outside professional advice within the scope of their terms of reference and as deemed necessary to carry out their duties. The Group’s chief executive officer and other members of the executive management whose presence is required for such committees’ effective performance of their responsibilities are invited to be in attendance at committee meetings.
The board has established five committees to assist in discharging its responsibilities:
executive committeeChairman: Mr S Queen
Role: The executive committee is responsible for the day-to-day operational activities of the Group, development and implementation of strategy and board directives.
The Seardel executive committee comprises Messrs S Queen (Chairman, Group chief executive officer), G Wege (Group financial director), D Duncan (chief executive officer Industrial and Textiles), K Robson (chief executive officer Properties, Corporate and Legal Services) and I Morris (chief executive officer Prima Group).
The executive committee meets formally once a week and executive committee members attend the monthly operational meetings of each operating entity within the Group. Such formal weekly and monthly meetings include the review of strategic, operational and financial results.
The board is apprised of progress through reporting at board meetings and regular communication with management.
audit committeeChairman: Mr M Ahmed
Role: The audit committee performs an important function by overseeing the Group’s financial statements and reporting processes, including the system of internal financial controls.
The committee’s report is presented on page 40.
Risk committeeGroup risk officer: Mr D Levin
Role: The risk committee is primarily responsible for the governance of risk in accordance with the framework of the Group’s risk management policy.
The committee’s report is presented on page 30.
Remuneration committeeChairman: Mr Y Shaik
Role: The remuneration committee ensures that the Group’s
directors and senior management are fairly rewarded for
their individual contribution to overall performance and
aligned with the Group’s strategy and performance goals.
The committee’s report is presented on page 31.
Social and ethics committeeChairman: Mr A Ntuli
Role: The social and ethics committee monitors activities
relating to ethics, stakeholder engagement and the social
impact of the company on communities within which it
operates. The committee also monitors progress across all
areas of strategic empowerment as well as compliance with
transformation codes.
The committee’s report is presented on page 29.
Seardel integrated annual report 201425
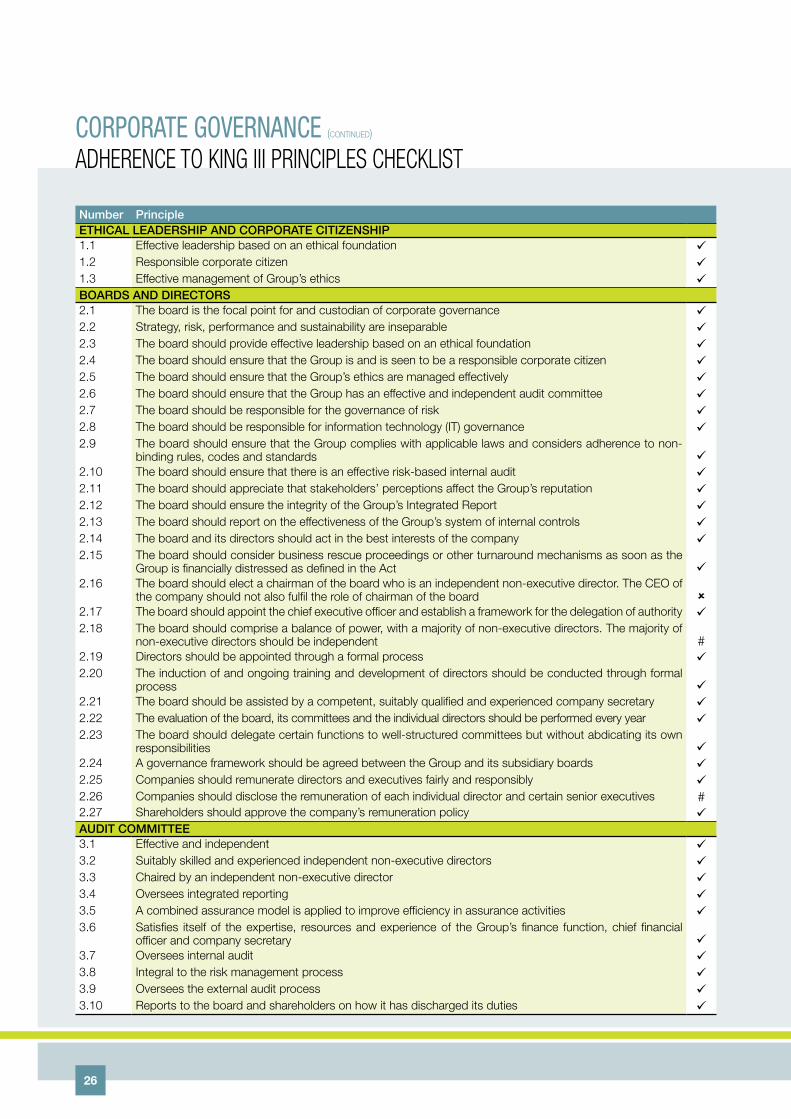
corporate governance (continued)adherenCe to KIng III prInCIples CheCKlIst
number PrincipleeThiCaL LeaDeRShiP anD CORPORaTe CiTiZenShiP1.1 Effective leadership based on an ethical foundation ü1.2 Responsible corporate citizen ü1.3 Effective management of Group’s ethics üBOaRDS anD DiReCTORS2.1 The board is the focal point for and custodian of corporate governance ü2.2 Strategy, risk, performance and sustainability are inseparable ü2.3 The board should provide effective leadership based on an ethical foundation ü2.4 The board should ensure that the Group is and is seen to be a responsible corporate citizen ü2.5 The board should ensure that the Group’s ethics are managed effectively ü2.6 The board should ensure that the Group has an effective and independent audit committee ü2.7 The board should be responsible for the governance of risk ü2.8 The board should be responsible for information technology (IT) governance ü2.9 The board should ensure that the Group complies with applicable laws and considers adherence to non-
binding rules, codes and standards ü2.10 The board should ensure that there is an effective risk-based internal audit ü2.11 The board should appreciate that stakeholders’ perceptions affect the Group’s reputation ü2.12 The board should ensure the integrity of the Group’s Integrated Report ü2.13 The board should report on the effectiveness of the Group’s system of internal controls ü2.14 The board and its directors should act in the best interests of the company ü2.15 The board should consider business rescue proceedings or other turnaround mechanisms as soon as the
Group is financially distressed as defined in the Act ü2.16 The board should elect a chairman of the board who is an independent non-executive director. The CEO of
the company should not also fulfil the role of chairman of the board û2.17 The board should appoint the chief executive officer and establish a framework for the delegation of authority ü2.18 The board should comprise a balance of power, with a majority of non-executive directors. The majority of
non-executive directors should be independent #2.19 Directors should be appointed through a formal process ü2.20 The induction of and ongoing training and development of directors should be conducted through formal
process ü2.21 The board should be assisted by a competent, suitably qualified and experienced company secretary ü2.22 The evaluation of the board, its committees and the individual directors should be performed every year ü2.23 The board should delegate certain functions to well-structured committees but without abdicating its own
responsibilities ü2.24 A governance framework should be agreed between the Group and its subsidiary boards ü2.25 Companies should remunerate directors and executives fairly and responsibly ü2.26 Companies should disclose the remuneration of each individual director and certain senior executives #2.27 Shareholders should approve the company’s remuneration policy üauDiT COmmiTTee3.1 Effective and independent ü3.2 Suitably skilled and experienced independent non-executive directors ü3.3 Chaired by an independent non-executive director ü3.4 Oversees integrated reporting ü3.5 A combined assurance model is applied to improve efficiency in assurance activities ü3.6 Satisfies itself of the expertise, resources and experience of the Group’s finance function, chief financial
officer and company secretary ü3.7 Oversees internal audit ü3.8 Integral to the risk management process ü3.9 Oversees the external audit process ü3.10 Reports to the board and shareholders on how it has discharged its duties ü
26

number PrincipleThe GOveRnanCe OF RiSK4.1/4.2 The board is responsible for the governance of risk and setting levels of risk tolerance ü4.3 The audit committee assists the board in carrying out its risk responsibilities ü4.4 The board delegates the risk management plan to management ü4.5 The board ensures that risk assessments and monitoring are performed on a continual basis ü4.6 Frameworks and methodologies are implemented to increase the probability of anticipating unpredictable risks û4.7 Management implements appropriate risk responses ü4.8 The board ensures continual risk monitoring by management ü4.9 The board receives assurance of the effectiveness of the risk management process û4.10 Sufficient risk disclosure to stakeholders üThe GOveRnanCe OF inFORmaTiOn TeChnOLOGy5.1 The board is responsible for information technology (IT) governance ü5.2 IT is aligned with the performance and sustainability objectives of the Group ü5.3 Management is responsible for the implementation of an IT governance framework ü5.4 The board monitors and evaluates significant IT investments and expenditure ü5.5 IT is an integral part of the Group’s risk management ü5.6 IT assets are managed effectively ü5.7 The audit committee assists the board in carrying out its IT responsibilities üCOmPLianCe WiTh LaWS, CODeS, RuLeS anD STanDaRDS6.1 The board ensures that the Group complies with relevant laws ü6.2 The board has a working understanding of the relevance and implications of non-compliance ü6.3 Compliance risk forms an integral part of the Group’s risk management process ü6.4 The board has delegated to management the implementation of an effective framework and processes üinTeRnaL auDiT7.1 Effective risk-based internal audit ü7.2 Follow risk-based approach to its plan ü7.3 Written assessment of the effectiveness of the Group’s system of internal controls and risk management ü7.4 Be responsible for overseeing internal audit ü7.5 Internal audit is strategically positioned to achieve its objectives üGOveRninG STaKehOLDeR ReLaTiOnShiPS8.1 Appreciation that stakeholders’ perceptions affect the Group’s reputation ü8.2 Management proactively deals with stakeholder relationships ü8.3 There is an appropriate balance amongst the Group’s various stakeholder groupings ü8.4 Equitable treatment of stakeholders ü8.5 Transparent and effective communication to stakeholders ü8.6 Disputes are resolved effectively and timeously üinTeGRaTeD RePORTinG anD DiSCLOSuRe9.1 Ensures the integrity of the Group’s Integrated Report ü9.2 Sustainability reporting and disclosure is integrated with the Group’s financial reporting ü9.3 Sustainability reporting and disclosure is independently assured û
Keyü Compliant# Partially compliantû Not compliant
The Group’s detailed response to the areas of partial or non-compliance is contained in the Corporate Governance report on
page 22.
Seardel integrated annual report 201427

Brits Non-Woven
28

corporate governance (continued)soCIal and ethICs CommIttee report
roleThe committee monitors activities relating to ethics,
stakeholder engagement and the social impact of the
company on communities within which it operates. It also
monitors progress across all areas of strategic empowerment
as well as compliance with transformation codes.
memBerSThe members of the committee consist of Mr A Ntuli
(chairman, executive director), Ms R Watson (independent
non-executive director), Mr S Rubidge (Group IR executive)
and Mr G Wege (executive director).
meetingSThe committee holds a minimum of two meetings per
annum. Additional meetings are convened on request of any
of the members.
The table below records the attendance of committee
members at these meetings:
28/03/2013 16/09/2013 10/04/2014
A Ntuli ü ü ü
S Rubidge ü ü ü
R Watson ü ü ü
G Wege ü ü ü
functionSThe committee fulfilled the following functions:
• monitoredtheGroup’sstandingonsocialactivitiesrelating
to social and economic development, including the
principles of the United Nations Global Compact, broad-
based black economic empowerment, employment
equity and the Organisation for Economic Co-operation
and Development’s (OECD) recommendations on
corruption;
• monitoredadherencetotheGroup’scodeofethics;
• monitored thecompany’spracticespertaining togood
corporate citizenship which includes promotion of
equality, prevention of unfair discrimination, corporate
social responsibility, ethical behaviour and managing
environmental impacts;
• monitoredtheGroup’sactivitiesinrelationtoconsumer
relations, labour and employment including skills
development, and health and safety, and environmental
issues; and
• drewmatterswithinitsmandatetotheattentionofthe
board.
During the year under review the committee reviewed the
social and ethics activities of the Group and more specifically
can confirm that the Group:
• supports and respects theprotectionof internationally
proclaimed human rights and to the best of its knowledge
is not complicit in any human rights abuses;
• upheldfreedomofassociationandtheeffectiverightof
collective bargaining with recognised trade unions;
• hasnoformof forced,compulsoryorchild labourand
does not discriminate on the grounds of gender, race,
sexual or religious preference, disability or age in respect
of employment and occupation;
• remains committed to the principles of broad-based
black economic empowerment;
• continuedtorecordandreviewitscarbonfootprintand
promoted greater environmental responsibility through
the management of energy consumption and waste
control;
• continued to monitor compliance to legislation,
specifically health and safety; and
• vigilantly enforced its zero-tolerance policy towards
fraud and corruption.
Seardel integrated annual report 201429

corporate governance (continued)rIsK CommIttee report
The Group strives to maintain an appropriate balance between risk and reward, recognising that certain risks need to be taken to achieve sustainable growth and returns while at the same time protecting the Group and its stakeholders against avoidable risks.
reSponSiBilityThe board is responsible for the governance of risk and has appointed a risk committee to review the risk management progress of the company, the effectiveness of risk management activities, the key risks facing the company and the responses to the risk. This process is managed in accordance with the Group’s risk management charter.
memBerS of the riSK committeeThe risk committee formally convenes twice a year and consists of the members of the audit committee, the chief executive officer, chief financial officer and the Group risk officer. The composition of the committee ensures a good balance of executive and independent input.
Members as at 31 March 2014: Mr M Ahmed (chairman), Ms R Watson, Mr S Queen, Mr G Wege and Mr D Levin (Group risk officer).
Mr N Lazarus resigned from the board of directors and as a consequence as a member of the risk committee on 19 August 2013 and was replaced by Ms R Watson. Mr Y Shaik resigned as a member of the risk committee on 28 March 2014, further to his designation on the board changing from independent non-executive director to non-executive director.
meeting attendanceMember 15 May 2013 11 Nov 2013
M Ahmed ü ü
N Lazarus ü #
Y Shaik ü ü
R Watson # ü
S Queen ü ü
G Wege ü ü
D Levin ü ü
# Not a member.
riSK management proceSSThe risk committee is accountable to the board for designing, implementing and monitoring the system and process of risk management and integrating it into the day-to-day activities of the company. The committee continued to adhere
to appropriate risk management measures to counter significant risks which could undermine the achievement of its business objectives, focusing in particular on the identification and mitigation of treasury, IT, safety, health and environmental, fraud, and legal risks.
• Details of theGroup’s treasury risk exposure coveringcredit, liquidity and market risks are included in note 24 of the financial statements. Derivative financial instruments are used to hedge certain risk exposures, in particular the Group’s foreign exchange risk which is partly mitigated by entering into forward exchange contracts. Details of the Group’s forward exchange exposure are detailed in note 32 of the financial statements.
• The Group’s IT governance framework is set out onpage 24.
• Allmajorsitesareinternallyauditedonanannualbasisinrespect of safety, health and environmental compliance. This process is undertaken in conjunction with the Group’s independent risk consultants in terms of which selected sites are surveyed on a rotational basis.
• The Group’s internal audit department investigatesany fraud matters which are reported either directly by employees or third parties to the company or to an ethics hotline, administered by an external independent professional firm.
• Thecommitteereviewsallmateriallegaldisputes.
change in riSK profileThe disposal of the company’s apparel manufacturing business and the acquisition of the company’s interest in Sabido Investments Proprietary Limited (Sabido) reflects a material change in the Group’s risk profile during the financial year, with its investments at year-end comprising media and non-media assets (manufacturing, branded product distribution and property).
Further, the proposed unbundling and separate listing of the company’s non-media assets on the securities exchange operated by the JSE Limited as disclosed on SENS on 28 August 2014, and which is noted in further detail in the Directors’ Report on page 43 will, if implemented on this basis, result in the company becoming a media-focused business.
riSK cultureThe Group continued to make good progress to inculcate a risk management culture into all levels of the Group’s decision-making processes.
30

remuneration policieS and remuneration philoSophy The Group’s remuneration policies strive to reward employees
in a fair and responsible way, which ensures a culture of
high performance to deliver returns to shareholders through
employees who are motivated, engaged and committed. The
Group’s remuneration policies and philosophies are contained
in this report and their intended consequences are to attract,
retain and develop employees with scarce and critical skills
who contribute to building sustainable businesses.
memBerSAt year-end the members of the remuneration committee
consisted of Mr Y Shaik (chairman, non-executive director)
and Mr J Copelyn (non-executive director). During the year
Mr N Lazarus resigned from the board and consequently no
longer serves as a member of the remuneration committee.
On request of the committee members the chief executive
officer attends the meetings, but recuses himself from the
meetings before any decisions are made in which he is
affected.
governanceThe board delegates responsibility for the oversight of
the Group’s remuneration practices to the remuneration
committee. The committee ensures that the Group has a
competitive remuneration structure which is aligned with the
Group’s strategy and performance goals. The key duties of
the committee include:
• ensuringtheGroupupholdsitsentrenchedremuneration
philosophy that promotes the achievement of its strategic
objectives;
• determiningonanannualbasis:
– the remuneration of non-executive directors;
– the total remuneration package of each executive
director including, where appropriate, annual
increases, short-term performance bonuses and
long-term incentives; and
– the remuneration packages of senior management
and employees who report directly to the chief
executive officer;
• ensuring the combination of fixed and variable pay is
appropriate when benchmarking remuneration levels;
• reviewingandrecommendingtotheboardallproposals
for executive share-based incentives and other short-
and long-term incentive schemes;
• determining targets for any performance-related pay
schemes and requesting the board, when required, to
seek shareholder approval for any share-based and
other long-term incentive schemes; and
• producing a report for inclusion in the company’s
Integrated Annual Report.
The committee meets at least annually and seeks advice and
guidance from external experts, as deemed appropriate.
Shareholder engagementEach year, at the annual general meeting, the remuneration
committee tables its annual report for a non-binding
advisory vote of shareholders. The report provides insight
into the Group’s remuneration practices and encourages
stakeholders to express their views on the remuneration
practices adopted by the Group.
remuneratIon report
Seardel integrated annual report 201431

corporate governance (continued)remuneratIon report (continued)
compoSition of remunerationnon-executive directorsNon-executive directors receive fees for their services as directors and for serving on board committees. These fees reward the
directors fairly for the time, service and expertise that they provide to the Group. Non-executive directors do not participate in
the Group’s short-term or long-term incentive schemes.
The fees to be paid to the non-executive directors of the company for services as directors from 1 October 2014 to
30 September 2015 are tabled below in R’000 and are to be approved by shareholders at the annual general meeting:
Non-executive directorDirectors’
fees
Audit committee
fees
Remuneration committee
fees
J A Copelyn 106 – 44
N Jappie 106 44
M H Ahmed 106 44 –
T G Govender 106 – –
R Watson 106 44 –
Y Shaik 106 44
The fees paid to the non-executive directors from 1 October 2013 to 30 September 2014 were approved at the 2013 annual
general meeting as set out in the table below:
Non-executive directorDirectors’ fees
R’000
Audit committee fees
R’000
Remuneration committee fees
R’000
J A Copelyn 100 – 41
M H Ahmed 100 41 –
T G Govender 100 – –
R Watson 100 41 –
Y Shaik 100 41 41
Mr Copelyn, Mr Govender, Mr Shaik and Ms Watson are directors of Seardel’s ultimate holding company, Hosken Consolidated
Investments Limited (HCI) and the following table reflects the remuneration received by these directors from HCI and its
subsidiaries for the year ended 31 March 2014 in R’000:
Director Board fees SalaryOther
benefits
Share option
expense Bonus
Total 31 march
2014
Total 31 March
2013
J A Copelyn – 5 449 1 521 3 579 4 085 14 634 13 776
T G Govender – 2 503 582 1 167 1 626 5 878 4 588
Y Shaik 512 92 – 48 – 652 468
R Watson 125 – – – – 125 90
32
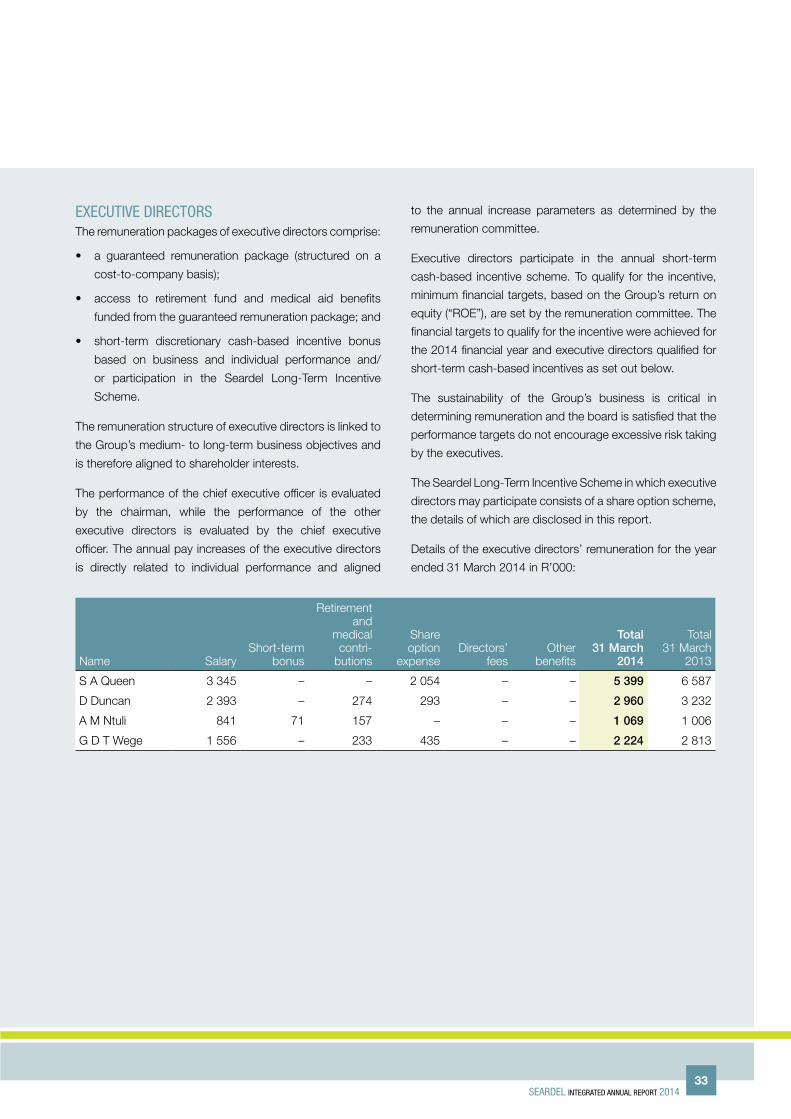
executive directorSThe remuneration packages of executive directors comprise:
• a guaranteed remuneration package (structured on a
cost-to-company basis);
• access to retirement fund and medical aid benefits
funded from the guaranteed remuneration package; and
• short-term discretionary cash-based incentive bonus
based on business and individual performance and/
or participation in the Seardel Long-Term Incentive
Scheme.
The remuneration structure of executive directors is linked to
the Group’s medium- to long-term business objectives and
is therefore aligned to shareholder interests.
The performance of the chief executive officer is evaluated
by the chairman, while the performance of the other
executive directors is evaluated by the chief executive
officer. The annual pay increases of the executive directors
is directly related to individual performance and aligned
to the annual increase parameters as determined by the
remuneration committee.
Executive directors participate in the annual short-term
cash-based incentive scheme. To qualify for the incentive,
minimum financial targets, based on the Group’s return on
equity (“ROE”), are set by the remuneration committee. The
financial targets to qualify for the incentive were achieved for
the 2014 financial year and executive directors qualified for
short-term cash-based incentives as set out below.
The sustainability of the Group’s business is critical in
determining remuneration and the board is satisfied that the
performance targets do not encourage excessive risk taking
by the executives.
The Seardel Long-Term Incentive Scheme in which executive
directors may participate consists of a share option scheme,
the details of which are disclosed in this report.
Details of the executive directors’ remuneration for the year
ended 31 March 2014 in R’000:
Name SalaryShort-term
bonus
Retirement and
medical contri-butions
Share option
expenseDirectors’
feesOther
benefits
Total 31 march
2014
Total 31 March
2013
S A Queen 3 345 – – 2 054 – – 5 399 6 587
D Duncan 2 393 – 274 293 – – 2 960 3 232
A M Ntuli 841 71 157 – – – 1 069 1 006
G D T Wege 1 556 – 233 435 – – 2 224 2 813
Seardel integrated annual report 201433
corporate governance (continued)remuneratIon report (continued)
management and non-Bargaining unit employeeSSenior management receives an annual guaranteed salary
and participate in the short-term incentive bonus scheme.
Guaranteed remuneration for senior executives is set
at levels to retain and recruit management talent. Each
senior executive position is graded, based on the business
turnover, number of employees, assets under management,
locations and the degree of complexity involved in the
business. The associated package is benchmarked against
an external market survey for a similar job rating. As the
Group’s philosophy is to reward performance, the salary
benchmark is set at the 50th percentile median which allows
a lower fixed cost, but higher incentive structure.
The annual review of the performance of senior management
is undertaken by the chief executive officer who provides a
recommendation to the committee on any adjustments or
incentive payments. Key senior managers participate in the
Seardel Long-Term Incentive Scheme, with selection based
on their strategic contribution.
Under the guidance of the remuneration committee the
Group has introduced a uniform appraisal and evaluation
process for all non-bargaining council employees. This
process has been applied to all employees of the Group
and is used as a guideline to determine remuneration
adjustments.
The average salary increase parameter set by the
remuneration committee for the year under review was 6%
(2013: 6%) and the annual increase date is 1 July.
Bargaining unit employeeSCollective salary increases are negotiated each year with the
representatives of recognised trade unions.
incentive SchemeSDiscretionary short-term incentive schemeKey employees in each business unit participate in an annual
discretionary short-term incentive scheme, which rewards
the achievement of performance in excess of predetermined
performance targets.
The performance target is based on the business unit’s
core operating profit after interest, adjusted by an imputed
interest charge at a hurdle rate. The imputed interest charge
is calculated on the higher of net asset value or the average
working capital level utilised by each business unit. In
addition to the quantitative performance targets, the scheme
includes predetermined qualitative performance targets.
Long-term incentive schemeThe Seardel Long-Term Share Incentive Scheme was
approved by the shareholders on 29 October 2009. The
scheme was implemented to more closely align executive
directors and senior management’s objectives with those of
the shareholders so as to ensure that those employees are
encouraged and motivated to pursue sustainable growth
and profitability.
Participants shall become entitled to exercise options in
accordance with the following schedule:
• 10%fromthefirstanniversarydate;
• 20%fromthesecondanniversarydate;
• 30%fromthethirdanniversarydate;and
• 40%fromthefourthanniversarydate.
Each tranche is further subject to:
• theparticipant’scontinuedemploymenton thedateof
which the option is exercised; and
• achievingpredeterminedperformancetargets.
Performance targets are linked to the Group’s and individual
business units’ profitability. The aggregate number of shares
which any participant may acquire in terms of the scheme
may not exceed 12 700 000 ordinary shares. Further, based
on the seniority of the employee’s role, the scheme contains
a ceiling which sets the maximum capital base of options
that can be allocated to any individual employee.
During the year under review Nil ordinary shares
(2013: 10 159 672) were allotted in terms of the rules of the
scheme.
34

Options in issue are as follows:
Option holder Grant dateOptions issued
Strike price (cents) Vesting conditions Life of option
S a Queen 31 March 2010 4 200 000 0 Achieve financial targets and continued employment
8 years
16 July 2010 693 000 42 Achieve financial targets and continued employment
8 years
4 July 2011 1 753 350 76 Achieve financial targets and continued employment
8 years
12 June 2012 2 173 335 110 Achieve financial targets and continued employment
8 years
Total for S a Queen 8 819 685
G D T Wege 31 March 2010 1 000 000 0 Achieve financial targets and continued employment
8 years
16 July 2010 288 750 42 Achieve financial targets and continued employment
8 years
4 July 2011 730 563 76 Achieve financial targets and continued employment
8 years
12 June 2012 753 655 110 Achieve financial targets and continued employment
8 years
Total for G D T Wege 2 772 968
D Duncan 31 March 2010 700 000 0 Achieve financial targets and continued employment
8 years
16 July 2010 202 125 42 Achieve financial targets and continued employment
8 years
4 July 2011 511 394 76 Achieve financial targets and continued employment
8 years
12 June 2012 633 889 110 Achieve financial targets and continued employment
8 years
Total for D Duncan 2 047 408
Other, not being directors
31 March 2010 8 000 000 0 Achieve financial targets and continued employment
8 years
16 July 2010 2 502 601 42 Achieve financial targets and continued employment
8 years
4 July 2011 4 780 656 76 Achieve financial targets and continued employment
8 years
12 June 2012 5 698 050 110 Achieve financial targets and continued employment
8 years
Total other 20 981 307
Seardel integrated annual report 201435

corporate governance (continued)remuneratIon report (continued)
Reconciliation of movements in options:
Number of options 2014 2013
Opening balance 43 819 982 41 594 266
Awarded during period – 10 159 672
Exercised during the period (4 044 426) (5 579 925)
Lapsed/forfeited during the period (5 154 188) (2 354 031)
Closing balance 34 621 368 43 819 982
During the year Seardel acquired a 100% interest in HCI Invest 3 Holdco Proprietary Limited, which holds a 63,9% interest in
Sabido Investment Proprietary Limited (Sabido). Sabido has a share incentive plan that provides selected employees with the
opportunity to acquire ordinary shares in Sabido.
Further details pertaining to the share incentive scheme is disclosed in note 39 of the financial statements.
employee BenefitSRetirement fundsThe majority of the Group’s subsidiaries have defined contribution pension and provident fund arrangements in place. The
assets of such retirement funds are managed separately from the Group’s assets and are administered by independent
trustees and administrators within an umbrella fund. In addition to the independent administrators, each fund has elected a
management committee with 50% employee and 50% employer representation.
The funds are all defined contribution schemes and the Group carries no liability in relation to these funds.
medical aidThe majority of the Group’s subsidiaries offer membership of approved medical aid funds to employees. The Group carries a
liability totalling R97,5 million for post-employment medical aid benefits. Certain employees who joined the company before
1 July 1996 are eligible for a 50% retirement subsidy of their total medical scheme contributions. Note 20 of the financial
statements provide further detail of the post-employment medical aid benefits.
Top three executive management earnersIn accordance with the recommendation of disclosure of King III the top three earners in the Group, excluding executive
directors, during the year under review were remunerated as follows:
NameSalary R’000
Bonus R’000
Retirement fund
contributions R’000
Share options
expense R’000
Medical aid contributions
R’000Other R’000
Total R’000
Exec 1 1 612 3 796 50 135 96 – 5 689
Exec 2 3 400 1 417 204 147 19 26 5 213
Exec 3 1 658 3 000 112 287 74 – 5 131
The names of the three most highly paid employees who are not directors have not been disclosed. The committee is of the
opinion that such information is private to the individuals concerned and adds no value to stakeholders.
36

employment equity StatiSticS
31 march 2014
Designated Non-designated
South Africa
total
Foreign employee
totalGroup
total
Male Female Male Foreign national
Occupational levels A C I A C I W W Male Female
Top management 1 2 2 – – – 4 12 – – 21 – 21
Senior management 10 2 16 13 9 7 29 57 1 1 143 2 145
Professionally qualified, experienced specialists and mid-management 67 30 29 41 28 18 72 104 5 1 389 6 395
Skilled technical and academically qualified workers, junior management, supervisors, foremen and superintendents 403 166 116 309 233 148 160 167 9 4 1 702 13 1 715
Semi-skilled and discretionary decision-making 464 156 69 1 257 128 80 41 43 2 1 2 238 3 2 241
unskilled and defined decision-making 233 84 6 279 240 10 4 9 – – 865 – 865
Total permanent 1 178 440 238 1 899 638 263 310 392 17 7 5 358 24 5 382
non-permanent employees 208 165 29 235 134 28 44 73 1 2 916 3 919
Grand total 1 386 605 267 2 134 772 291 354 465 18 9 6 274 27 6 301
31 March 2013
Designated Non-designated
South Africa
total
Foreign employee
totalGroup
total
Male Female Male Foreign national
Occupational levels A C I A C I W W Male Female
Top management 1 – 1 – – – 2 21 – – 25 – 25
Senior management – 2 7 2 2 4 5 18 3 3 40 6 46
Professionally qualified, experienced specialists and mid-management 4 10 12 5 14 9 33 40 3 10 127 13 140
Skilled technical and academically qualified workers, junior management, supervisors, foremen and superintendents 86 150 121 103 353 131 84 91 30 73 1 119 103 1 222
Semi-skilled and discretionary decision-making 324 233 80 1 005 854 81 41 55 109 561 2 673 670 3 343
Unskilled and defined decision-making 247 141 15 234 417 16 4 9 3 55 1 083 58 1 141
Total permanent 662 536 236 1 349 1 640 241 169 234 148 702 5 067 850 5 917
Non-permanent employees 67 82 7 71 176 5 16 17 28 89 441 117 558
Grand total 729 618 243 1 420 1 816 246 185 251 176 791 5 508 967 6 475
Seardel integrated annual report 201437

38

Audit committee report .................................................................. 41Directors’ responsibility statement and certificate of company secretary ............................................. 42Directors’ report ............................................................................ 43Independent auditor’s report .......................................................... 45Statements of comprehensive income ........................................... 46Statements of financial position ..................................................... 47Statements of changes in equity .................................................... 48Statements of cash flow ................................................................ 50Notes to the financial statements ................................................... 52
The financial statements of Seardel Investment Corporation Limited have been audited in terms of Section 30 of the Companies Act and were prepared under the supervision of the Group Financial Director, Mr G Wege (CA) SA.
financial StatementS
Seardel integrated annual report 201439

audit committee report
The Seardel Group audit committee is a formal committee of the board and functions within its documented terms of reference. This report is presented to shareholders and constitutes the report of the audit committee in respect of the past financial year of the Group as required by section 94 of the Companies Act 2008 (the Companies Act).
primary role and reSponSiBility of the committeeThe audit committee fulfils an independent oversight role regarding the Group’s financial statements and the reporting process, including the system of internal financial control, with accountability to both the board and to shareholders. The committee’s responsibilities include the statutory duties prescribed by the Companies Act, recommendations by King III and additional responsibilities assigned by the board.
compoSition of the audit committeeThe committee comprises three independent, non-executive directors.
The members of the audit committee at financial year-end were Mr M Ahmed (chairman), Ms R Watson and Mr Y Shaik. During the year Mr N Lazarus resigned from the committee and Ms R Watson was appointed to the committee. Mr Y Shaik resigned from the committee on 19 March 2014 and subsequent to year-end, Ms N Jappie was appointed to the committee. Mr Ahmed, Ms Watson and Ms Jappie are independent non-executive directors and will be proposed for election to the committee at the annual general meeting. By invitation the chief executive officer, the chief financial officer, KPMG Inc., external auditors of the Group, and the Group’s head of internal audit have attended all the committee meetings.
The committee meets twice annually, with special meetings called as required. The committee held two meetings during the financial year under review and attendance was as follows:
15/5/2013 11/11/2013
Mohamed Ahmed (BCompt) √ √
Neil Lazarus SC (BA LLB) √ Not a member
Yunis Shaik (BProc) √ √
Rachel Watson Not a member √
Key: √ = in attendance
Fees paid to the committee members are disclosed in the Remuneration Report.
Audit committee agendas provide for confidential meetings between the committee members, internal auditors and the external auditors, without members of executive management being present.
The effectiveness of the committee is assessed as part of the annual board and committee self-evaluation process and the chairman of the committee attends all statutory shareholder meetings to answer any questions on the committee’s activities.
functionS and reSponSiBilitieS of the audit committeeThe audit committee has discharged the functions in terms of its charter and ascribed to it in terms of the Act as follows:
Reporting• Reviewed the interim report, preliminary results
announcement, financial statements and Integrated Report, culminating in a recommendation to the board to adopt them
• Reviewed and approved the appropriateness of theaccounting policies and practices
• Ensured compliance with International FinancialReporting Standards, including consistent application to all periods as presented in the consolidated financial statements
• Evaluated and determined the effectiveness of theGroup’s internal control systems
• Reviewed legal matters that could have a significantimpact on the Group’s consolidated financial statements
• Reviewed the requirements of King III and instanceswhere the King III requirements have not been applied have been explained in the Corporate Governance Report
external audit• Reviewedtheexternalauditreportsontheconsolidated
financial statements
• Nominatedtheexternalauditorforappointmentbytheshareholders
• Monitored and reported on the independence of theexternal auditor
• Approved the budgeted audit fees, audit plan andengagement terms of the external auditor
40
• Determined the nature and extent of allowable non-audit services and approved the contract terms for the provision of non-audit services by the external auditor
• Determined that theaudit firmanddesignatedauditoris accredited as such on the JSE list of auditors and advisers
Finance function• Considered theexpertiseandresourcesof thefinance
function, as well as the experience of the senior members of management responsible for the financial function
• Considered the expertise and experience of the chieffinancial officer
internal audit• Oversawthefunctioningoftheinternalauditdepartment
and performance assessment of the head of internal audit
• Approvedtheannual internalauditplanandmonitoredthe progress thereof
external auditThe audit committee reviewed a representation by the external auditor and, after conducting its own review, confirmed the expertise and objectivity of KPMG Inc. as the external auditor and noted the appointment of Mr Pierre Conradie as the designated auditor. The external auditor has unrestricted access to the Group’s records and management and furnishes a written report to the committee on significant findings arising from the annual audit. The committee is satisfied that the external auditor is independent of the Group.
internal audit and internal controlThe internal audit function is an independent and objective assurance and consulting function that adds value and improves the operations of the Group. It helps to accomplish Group objectives by evaluating and improving the adequacy and effectiveness of risk management, internal control and governance processes. The internal audit function reports
functionally to the chairman of the audit committee, but administratively to the financial director.
A risk-based approach has been applied to develop the annual internal audit plan. The internal audit plan:
• isformallyapprovedbytheauditcommittee;
• isformulatedbyconsideringkeyriskfactorsasidentifiedthrough ongoing risk assessments, but also incorporating any additional matters identified by management and the audit committee;
• considers the evaluation of governance processes,operational and financial processes and associated controls in accordance with the combined assurance model;
• assessestheGroup’sinternalfinancialcontrols;and
• iscontinuallyreviewedtoconsidernewriskareasasthebusiness evolves.
Any material or significant control weaknesses are brought to the attention of management and the audit committee.
expertiSe and financial experience of the financial director and finance functionThe audit committee is satisfied that the expertise and experience of the financial director is appropriate to meet the responsibilities of the position. This is based on the qualifications, continuing professional education and the committee’s assessment of the financial knowledge and levels of experience of the chief financial officer.
The committee has reviewed the resources of the finance function, the experience of the senior members of management responsible for the financial function and has concluded that the function is performing adequately in terms of the requirements of the audit committee.
approval of the audit committee reportThe committee confirms that it has functioned in accordance with its terms of reference for the 2014 financial year and complied with all statutory and regulatory responsibilities.
m ahmedChairman
18 September 2014
Seardel integrated annual report 201441

directorS’ reSponSiBility Statement
certificate of company Secretary
The directors are responsible for the preparation and fair presentation of the Group and separate financial statements of Seardel Investment Corporation Limited, comprising the statements of financial position at 31 March 2014 and the statements of comprehensive income, changes in equity and cash flows for the year then ended, and the notes to the financial statements, which include a summary of significant accounting policies and other explanatory notes, in accordance with International Financial Reporting Standards, SAICA Financial Reporting Guides as issued by the Accounting Practices Committee, the Listings Requirements of the JSE and the requirements of the Companies Act, 2008 (as amended) and Companies Regulations, 2011. In addition, the directors are also responsible for preparing the Directors’ Report.
The directors are also responsible for such internal control as the directors determine is necessary to enable the preparation of financial statements that are free from
material misstatement, whether due to fraud or error and for maintaining adequate accounting records and an effective system of risk management as well as the preparation of the supplementary schedules included in these financial statements.
The directors have made an assessment of the ability of the Group to continue as a going concern and have no reason to believe that the business will not be a going concern in the year ahead.
The auditors are responsible for reporting on whether the financial statements are fairly presented in accordance with the applicable financial reporting framework.
approval of financial StatementSThe Group and separate financial statements of Seardel Investment Corporation Limited, as identified in the first paragraph, were approved by the board of directors on 18 September 2014 and signed on its behalf by:
We certify that Seardel Investment Corporation Limited has lodged with the Registrar of Companies, for the financial year ended 31 March 2014, all such returns as are required by a public company in terms of the Companies Act of South Africa and that such returns appear to be true, correct and up to date.
hCi managerial Services Proprietary LimitedCompany Secretary
18 September 2014
Stuart Queen Gys WegeChief Executive Officer Group Financial Director
42

directorS’ report
The directors have pleasure in submitting their report on the state of affairs of the business together with the Group and company financial statements for the year ended 31 March 2014.
nature of BuSineSSSeardel Investment Corporation Limited is a diverse investment holding company which is listed on the JSE Limited under the Consumer Goods – Personal and Household Goods Sector.
general revieW of operationSThe results of the Group and company and the state of its affairs are set out in the Group and company financial statements of which this report forms part.
Share capitalThe shareholders of the company have approved the conversion of the ordinary shares and N ordinary shares having a par value, to ordinary shares and N ordinary shares having no par value at a general meeting of the company held on 8 August 2013.
Details of the authorised and issued share capital of the company and the movements during the year are disclosed in note 21 of the company financial statements.
holding companyThe company’s ultimate holding company is Hosken Consolidated Investments Limited.
dividendSThe directors have resolved not to declare a dividend for the year ended 31 March 2014 (2013: RNil).
directorateThe names of the directors of the company appear on pages 10 and 11.
Mr D Duncan has been appointed as an executive director of the company with effect from 16 May 2013, Mr N Lazarus resigned from the board with effect from 19 August 2013 and subsequent to year-end Mrs N Jappie has been appointed to the board on 10 July 2014 as an independent non-executive director.
As a result of the resignation of Mr N Lazarus, Mr M Ahmed was appointed the lead independent director by the board.
directorS’ emolumentSDirectors’ emoluments incurred by the company for the year ended 31 March 2014 are set out in the Remuneration Report on page 31 and in note 31 of the financial statements.
Secretary and adminiStrative detailSThe secretary of the company is HCI Managerial Services Proprietary Limited. There was no change in the office of the company secretary. The administrative and contact details of the company is published on the inside back cover.
SuBSidiary companieSThe full particulars of the Group’s subsidiary companies is contained in note 41 of the financial statements.
Special reSolutionSThe following special resolutions were passed by subsidiaries of Seardel Investment Corporation Limited since the date of the previous Directors’ Report:
1 HCI Invest 3 Proprietary Limited’s authorised share capital increased from 1 000 (one thousand) ordinary shares of no par value to 1 000 (one thousand) ordinary shares of no par value and 1 000 000 (one million) redeemable convertible preference shares of no par value and its memorandum of incorporation was amended accordingly. A special resolution was passed to issue the preference shares to Hosken Consolidated Investments Limited in accordance with the preference share subscription and loan agreement dated 19 December 2013 entered into amongst HCI Invest 3 Proprietary Limited, Hosken Consolidated Investments Limited and the Southern African Clothing and Textiles Workers Union.
2 Deneb Investments Proprietary Limited increased authorised share capital from 1 000 (one thousand) shares of no par value to 10 000 000 000 (ten billion) shares of no par value by the creation of 9 999 999 000 (nine billion nine hundred and ninety-nine million nine hundred and ninety-nine thousand) new ordinary shares of no par value which, upon their issue, will rank pari passu in all respects with the existing issued ordinary shares of no par value in the capital of Deneb Investments Proprietary Limited, and the memorandum of incorporation of Deneb Investments Proprietary Limited was amended accordingly.
Seardel integrated annual report 201443

directorS’ report(CONTINUED)
3 Seardel Group Trading Proprietary Limited cancelled unissued preference shares in its share capital (12 000 (twelve thousand) redeemable cumulative preference par value shares of R1,00 (one Rand) each and 20 000 (twenty thousand) “A” cumulative redeemable preference shares of R1,00 (one Rand) each) by way of special resolution.
4 The standard Group memorandum of incorporation was adopted for the following subsidiary companies by way of special resolution:
• CleverLittleMonkeyProprietaryLimited
• CustomExtrusionProprietaryLimited
• EasywearProprietaryLimited
• FrameKnittingManufacturersProprietaryLimited
• FirstFactoryShopsProprietaryLimited
• IntegratedPolypropyleneProductsProprietaryLimited
• RomatexHomeTextilesProprietaryLimited
• SeardelGroupTradingProprietaryLimited
• WinelandsTextilesProprietaryLimited
5 Sabido Investments Proprietary Limited concluded a subordination agreement with Sabido Properties Proprietary Limited in connection with Sabido Properties’ indebtedness to the Standard Bank of South Africa Limited.
6 Sabido Investments Proprietary Limited provided a
guarantee and indemnity to Standard Bank of South Africa
Limited in the amount of R150 million.
SuBSequent eventS1 Subsequent to year-end the authorised share capital of
the company was increased from 200 million N shares to 10 550 million N shares of no par value to enable the company to undertake a rights offer to shareholders in
terms of which each shareholder was given the right to subscribe for 258,93 new N shares for every 100 shares held. Pursuant to the rights offer 3 125 million new N shares were issued at R1,60 per rights offer share and R5 billion cash was raised. The proceeds of the rights offer was utilised to settle the preference share debt of Sabido Holdco to HCI totalling R3,1 billion and repaying the loan of Sabido Holdco to SACTWU totalling R1,3 billion. The remainder was utilised to reduce bank debts.
2 The company’s subsidiary, Sabido Investments Proprietary Limited (63,9% interest), acquired 100% of Crystal Brook Distribution Proprietary Limited and Longkloof Limited (which were 80% held by a subsidiary of Hosken Consolidated Investments Limited and 20% by Venfin Media Beleggings Proprietary Limited) for an aggregate purchase consideration of approximately R11 million and US$45 million respectively.
3 On 28 August 2014 the company announced its intention, subject to shareholder and regulatory approval, to separately list its non-media investments via a newly created investment holding company, Deneb Investments Proprietary Limited, on the securities exchange operated by the JSE Limited and the unbundling of the company’s interest in Deneb Investments Proprietary Limited to Seardel ordinary shareholders and N shareholders.
going concernThe directors have made an assessment of the ability of the Group to continue as a going concern and have no reason to believe that the business will not be a going concern in the year ahead.
material changeThere have been no material changes in the financial or trading position of the company since the publication of its provisional results for the year ended 31 March 2014.
44

independent auditor’S reportTo the shareholders of Seardel Investment Corporation Limited
report on the financial StatementSWe have audited the Group financial statements and the financial statements of Seardel Investment Corporation Limited, which comprise the statements of financial position at 31 March 2014, and the statements of comprehensive income, changes in equity and cash flows for the year then ended, and the notes to the financial statements, which include a summary of significant accounting policies and other explanatory notes as set out on pages 46 to 123.
directorS’ reSponSiBility for the financial StatementSThe company’s directors are responsible for the preparation and fair presentation of these financial statements in accordance with International Financial Reporting Standards, and the requirements of the Companies Act of South Africa, and for such internal control as the directors determine is necessary to enable the preparation of financial statements that are free from material misstatement, whether due to fraud or error.
auditor’S reSponSiBilityOur responsibility is to express an opinion on these financial statements based on our audit. We conducted our audit in accordance with International Standards on Auditing. Those standards require that we comply with ethical requirements and plan and perform the audit to obtain reasonable assurance whether the financial statements are free from material misstatement. An audit involves performing procedures to obtain audit evidence about the amounts and disclosures in the financial statements.
The procedures selected depend on the auditor’s judgement, including the assessment of the risks of material misstatement of the financial statements, whether due to fraud or error. In making those risk assessments, the auditor considers internal control relevant to the entity’s preparation and fair presentation of the financial statements in order to design audit procedures that are appropriate in the circumstances, but not for the purpose of expressing an opinion on the effectiveness of the entity’s internal control. An audit also includes evaluating the appropriateness of accounting policies used and the reasonableness of accounting estimates made by management, as well as evaluating the overall presentation of the financial statements.
We believe that the audit evidence we have obtained is sufficient and appropriate to provide a basis for our audit opinion.
opinionIn our opinion, these financial statements present fairly, in all material respects, the consolidated and separate financial position of Seardel Investment Corporation Limited at 31 March 2014 and its financial performance and cash flows for the year then ended in accordance with International Financial Reporting Standards, and the requirements of the Companies Act of South Africa.
other matterThe supplementary schedules set out on pages 125 to 127 do not form part of the financial statements and are presented as additional information. We have not audited these schedules and accordingly we do not express an opinion on them.
other reportS required By the companieS actAs part of our audit of the financial statements for the year ended 31 March 2014 we have read the Directors’ Report, the Audit Committee’s Report and the Company Secretary’s Certificate for the purpose of identifying whether there are material inconsistencies between these reports and the audited financial statements. These reports are the responsibility of the respective preparers. Based on reading these reports we have not identified material inconsistencies between these reports and the audited financial statements. However, we have not audited these reports and accordingly do not express an opinion on these reports.
KPmG inc.Registered Auditor
Per P J ConradieChartered Accountant (SA)Registered AuditorDirector
18 September 2014
MSC House1 Mediterranean StreetForeshoreCape Town8001
Seardel integrated annual report 201445

StatementS of profit or loSS and other comprehenSive incomeFOR THE YEAR ENDED 31 MARCH
GROuP COmPany
Notes2014
R000’s2013*
R000’s2014
R000’s2013
R000’sContinuing operationsRevenue 3 387 121 1 845 524 7 266 3 268 Cost of sales (2 092 327) (1 391 512) – – Gross profit 1 294 794 454 012 7 266 3 268 Other income 147 619 50 440 – – Selling and distribution expenses (272 041) (208 835) – – Administrative and other expenses (711 767) (207 695) (6 662) – Operating profit before impairments and restructuring and retrenchment expenses 3 458 605 87 922 604 3 268 Net impairment reversal of assets 5 – 21 885 (245 413) – Restructuring and retrenchment expenses (2 482) (1 182) – – Operating profit before finance costs 456 123 108 625 (244 809) 3 268 Finance income 6 2 080 2 909 – – Finance expenses 6 (170 052) (26 627) – – Share of loss of equity-accounted investees, net of tax 16 (5 367) – – – Profit before taxation 282 784 84 907 (244 809) 3 268 Income tax (expense)/income 7 (81 270) 1 117 621 – Profit from continuing operations 201 514 86 024 (244 188) 3 268 Discontinued operationsLoss from discontinued operations, net of tax 8 (159 901) (45 173) – – Profit 41 613 40 851 (244 188) 3 268 Other comprehensive income, net of related taxItems that will not be reclassified to profit or lossRevaluation of land and buildings 19 193 23 489 – – Post-employment medical benefit – actuarial loss (4 295) (5 733) – – Items that are or may be reclassified to profit or lossFair value adjustment on available-for-sale financial assets 51 – 51 – Foreign operations – foreign currency translation differences 2 431 – – –Other comprehensive income, net of tax 17 380 17 756 51 – Total comprehensive income for the year 58 993 58 607 (244 137) 3 268
Profit attributable to:Owners of the company (11 157) 40 851 (244 188) 3 268 Non-controlling interest 42 52 770 – – –
41 613 40 851 (244 188) 3 268
Total comprehensive income attributable to:Owners of the company 5 362 58 607 (244 137) 3 268 Non-controlling interest 42 53 631 – – –
58 993 58 607 (244 137) 3 268
Basic profit per share from continuing operations (cents) 9 16,83 12,55Diluted profit per share from continuing operations (cents) 9 16,37 12,10
* Restated, see note 36.
46

StatementS of financial poSition AS AT 31 MARCH
GROuP COmPany
Notes2014
R000’s2013
R000’s2014
R000’s2013
R000’s
aSSetSnon-current assets 8 928 667 1 385 957 2 865 346 1 727 832 Property, plant and equipment 10 1 363 812 754 481 – –
Plant and equipment 525 316 335 876 – – Owner-occupied property 838 496 418 605 – –
Investment property 11 669 619 525 229 – – Intangible assets 12 2 817 234 13 030 – – Goodwill 28 3 708 837 – – – Interest in subsidiary companies 14 – – 2 829 400 1 698 538 Equity-accounted investees 16 132 698 – – – Other investments 15 3 644 3 580 315 3 580 Long-term receivables 17 146 582 47 544 35 631 25 714 Deferred tax assets 7 86 241 42 093 – – Current assets 2 084 300 1 138 682 – – Non-current assets held for sale 18 54 536 2 295 – – Inventories 19 555 433 627 768 – – Programming rights 13 282 682 – – –Trade and other receivables 20 1 024 750 504 788 – – Current tax assets 6 087 1 594 – – Cash and cash equivalents 160 812 2 237 – –
Total assets 11 012 967 2 524 639 2 865 346 1 727 832
equity and liaBilitieSTotal equity 3 948 047 1 460 586 2 865 083 1 727 087Stated capital/share capital and share premium 21 1 692 429 312 156 1 692 429 312 156Treasury shares 22 (17 794) (17 794) – –Reserves 1 043 334 1 166 224 1 172 654 1 414 931Equity attributable to owners of the company 2 717 969 1 460 586 2 865 083 1 727 087Non-controlling interest 42 1 230 078 – – –non-current liabilities 5 568 810 93 662 12 621Deferred tax liabilities 7 486 583 8 400 12 621Post-employment medical aid benefits 23 91 180 84 388 – –Interest-bearing liabilities 24 4 868 343 756 – –Share-based liabilities 39 122 465 – – –Operating lease accruals 239 118 – –Current liabilities 1 496 110 970 391 251 124Current tax liabilities 529 – – –Post-employment medical aid benefits 23 6 280 5 045 – –Interest-bearing liabilities 24 67 161 298 – –Trade and other payables 25 861 047 460 008 251 124Provisions 27 23 309 355 – –Bank overdraft 537 784 504 685 – –
Total liabilities 7 064 920 1 064 053 263 745Total equity and liabilities 11 012 967 2 524 639 2 865 346 1 727 832
net asset value 2 717 969 1 460 586net asset value per share after treasury shares (cents) 229 214
Seardel integrated annual report 201447

Statedcapital*/
share capital
and sharepremium
R000’s
TreasurysharesR000’s
Otherreserves
R000’s
RetainedincomeR000’s
TotalR000’s
Non-controlling
interestR000’s
TotalR000’s
GROuP
Balance 31 march 2012 304 620 (14 610) 284 791 836 844 1 411 645 – 1 411 645
Total comprehensive income – – 23 489 35 118 58 607 – 58 607
Profit – – – 40 851 40 851 – 40 851
Other comprehensive income – – 23 489 (5 733) 17 756 – 17 756
Revaluation of land and buildings – – 23 489 – 23 489 – 23 489
Post-employment medical benefit – actuarial loss – – – (5 733) (5 733) – (5 733)
Transfers to other reserves – – (9 611) 9 611 – – –
Reclassification of revaluation surplus – – (9 611) 9 611 – – –
Transactions with owners of the company 7 536 (3 184) – (14 018) (9 666) – (9 666)
Own shares acquired – (20 790) – – (20 790) – (20 790)
Shares cancelled (19) 17 606 – (17 587) – – –
Share incentive scheme – – – 3 569 3 569 – 3 569
Share issue 7 555 – – – 7 555 – 7 555
Balance 31 march 2013 312 156 (17 794) 298 669 867 555 1 460 586 – 1 460 586
Total comprehensive income – – 20 814 (15 452) 5 362 53 631 58 993
(Loss)/profit – – – (11 157) (11 157) 52 770 41 613
Other comprehensive income – – 20 814 (4 295) 16 519 861 17 380
Fair value adjustment on available-for-sale financial assets – – 51 – 51 – 51
Foreign operations – foreign currency translation differences – – 1 570 – 1 570 861 2 431
Revaluation of land and buildings – – 19 193 – 19 193 – 19 193
Post-employment medical benefit – actuarial loss – – – (4 295) (4 295) – (4 295)
Transfers to other reserves – – (1 950) 1 580 (370) – (370)
Reclassification of revaluation surplus – – (1 950) 1 580 (370) – (370)
Transactions with owners of the company 10 273 – – (5 449) 4 824 (71 837) (67 013)
Share incentive scheme – – – (5 449) (5 449) – (5 449)
Dividends declared** – – – – – (71 837) (71 837)
Share options exercised 10 273 – – – 10 273 – 10 273
Changes in ownership interest 1 370 000 – (425) (122 008) 1 247 567 1 248 284 2 495 851
Acquisition of subsidiary with non-controlling interests** 1 370 000 – (425) (122 008) 1 247 567 1 248 284 2 495 851
Balance 31 march 2014 1 692 429 (17 794) 317 108 726 226 2 717 969 1 230 078 3 948 047
* Refer to note 36 Change in comparatives.** Refer to note 28 Business combinations for more information.
StatementS of changeS in equity FOR THE YEAR ENDED 31 MARCH
48

Statedcapital*/
share capital
and sharepremium
R000’s
TreasurysharesR000’s
Otherreserves
R000’s
RetainedincomeR000’s
TotalR000’s
Non-controlling
interestR000’s
TotalR000’s
COmPany
Balance 31 march 2012 304 620 – 27 605 1 387 231 1 719 456 – 1 719 456
Total comprehensive income – – – 3 268 3 268 – 3 268
Profit for the year – – – 3 268 3 268 – 3 268
Other comprehensive income – – – – – – –
Transactions with owners recognised directly in equity
Share incentive scheme – – – 6 475 6 475 – 6 475
Dividend – – – – – – –
Shares cancelled (19) – – (9 648) (9 667) – (9 667)
Share issue 7 555 – – – 7 555 – 7 555
Balance 31 march 2013 312 156 – 27 605 1 387 326 1 727 087 – 1 727 087
Total comprehensive income – – 51 (244 188) (244 137) – (244 137)
Profit for the year – – – (244 188) (244 188) – (244 188)
Other comprehensive income – – 51 – 51 – 51
Fair value adjustment on available-for-sale financial assets – – 51 – 51 – 51
Transactions with owners recognised directly in equity
Share incentive scheme – – – 1 860 1 860 – 1 860
Share options exercised 10 273 – – – 10 273 – 10 273
Share issue 1 370 000 – – – 1 370 000 – 1 370 000
Balance 31 march 2014 1 692 429 – 27 656 1 149 998 2 865 083 – 2 865 083
* Refer to note 36 Change in comparatives.
GROuP COmPany
2014
R000’s2013
R000’s2014
R000’s2013
R000’s
Composition of other reserves
Revaluation of investments 2 912 2 861 2 912 2 861
Capital redemption reserve fund 70 440 440 440
Surplus on disposal of subsidiary and associated companies 7 923 7 923 24 304 24 304
Translation reserve 1 145 – – –
Surplus on revaluation of land and buildings 305 058 287 445 – –
317 108 298 669 27 656 27 605
In terms of the undertakings to the Group’s bankers no dividends may be declared to owners of the company without their
prior written consent.
Surpluses arising on the disposal of subsidiary and associated companies are classified as other reserves until such time as
management determines that they be included in distributable reserves, at which time they are reclassified as retained income.
Reserves are created to prevent the distribution of unrealised profits arising through the revaluation of certain assets. Upon
realisation reserves are maintained at management’s discretion.
Seardel integrated annual report 201449
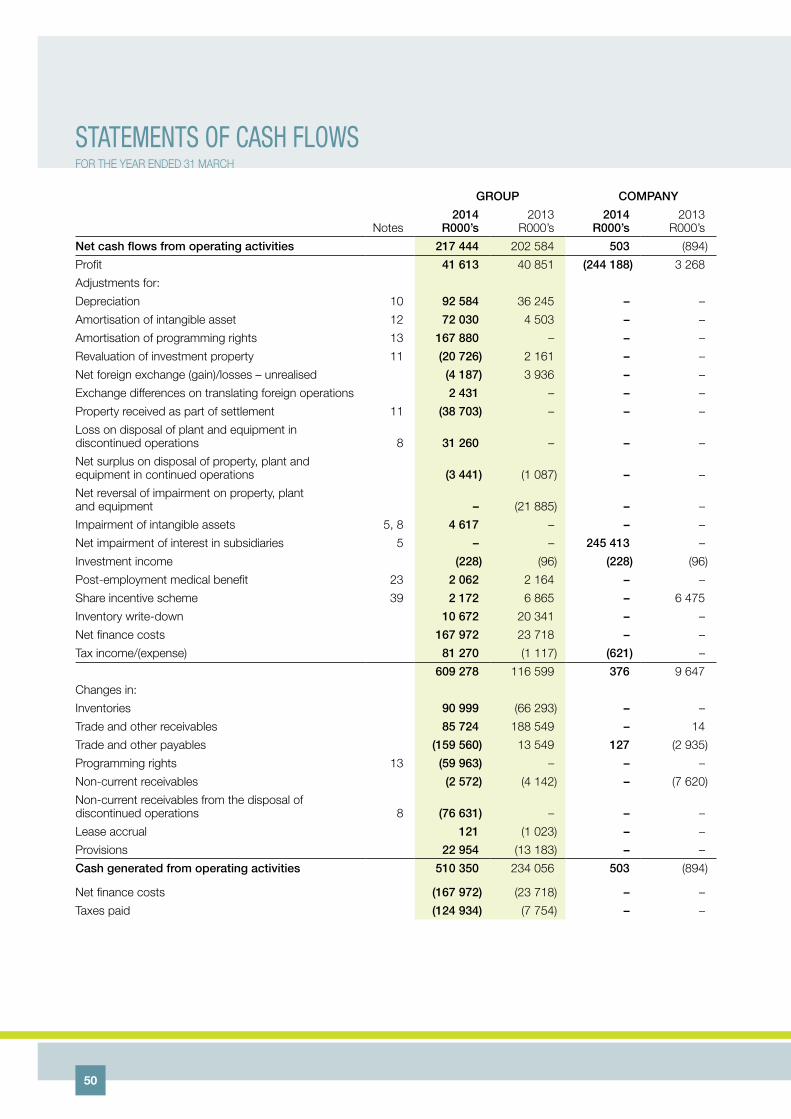
StatementS of caSh floWS FOR THE YEAR ENDED 31 MARCH
GROuP COmPany
Notes2014
R000’s2013
R000’s2014
R000’s2013
R000’s
net cash flows from operating activities 217 444 202 584 503 (894)
Profit 41 613 40 851 (244 188) 3 268
Adjustments for:
Depreciation 10 92 584 36 245 – –
Amortisation of intangible asset 12 72 030 4 503 – –
Amortisation of programming rights 13 167 880 – – –
Revaluation of investment property 11 (20 726) 2 161 – –
Net foreign exchange (gain)/losses – unrealised (4 187) 3 936 – –
Exchange differences on translating foreign operations 2 431 – – –
Property received as part of settlement 11 (38 703) – – –
Loss on disposal of plant and equipment in discontinued operations 8 31 260 – – –
Net surplus on disposal of property, plant and equipment in continued operations (3 441) (1 087) – –
Net reversal of impairment on property, plant and equipment – (21 885) – –
Impairment of intangible assets 5, 8 4 617 – – –
Net impairment of interest in subsidiaries 5 – – 245 413 –
Investment income (228) (96) (228) (96)
Post-employment medical benefit 23 2 062 2 164 – –
Share incentive scheme 39 2 172 6 865 – 6 475
Inventory write-down 10 672 20 341 – –
Net finance costs 167 972 23 718 – –
Tax income/(expense) 81 270 (1 117) (621) –
609 278 116 599 376 9 647
Changes in:
Inventories 90 999 (66 293) – –
Trade and other receivables 85 724 188 549 – 14
Trade and other payables (159 560) 13 549 127 (2 935)
Programming rights 13 (59 963) – – –
Non-current receivables (2 572) (4 142) – (7 620)
Non-current receivables from the disposal of discontinued operations 8 (76 631) – – –
Lease accrual 121 (1 023) – –
Provisions 22 954 (13 183) – –
Cash generated from operating activities 510 350 234 056 503 (894)
Net finance costs (167 972) (23 718) – –
Taxes paid (124 934) (7 754) – –
50

GROuP COmPany
Notes2014
R000’s2013
R000’s2014
R000’s2013
R000’s
net cash flow from investing activities (191 614) (210 751) (503) 3 005
Acquisition of property, plant and equipment (165 174) (104 705) – –
Acquisition of plant and equipment 10 (164 978) (39 225) – –
Acquisition of owner-occupied properties 10 (196) (65 480) – –
Proceeds from sale of property, plant and equipment 26 767 14 178 – –
Book value of assets disposed 54 586 13 091 – –
(Loss)/surplus on disposal (27 819) 1 087 – –
Acquisition of investment property 11 (37 499) (104 496) – –
Proceeds on sale of investment property 1 850 – – –
Interest capitalised to investment property – (8 603) – –
Acquisition of subsidiary, net of cash acquired 25 59 190 – – –
Additions to investments 15 – (251) – (251)
Additions to intangible assets 12 (75 641) (6 970) – –
Increase in loans to equity-accounted investees 16 (6 702) – – –
Decrease in equity-accounted investees 16 5 367 – – –
Investment income 228 96 228 96
(Increase)/decrease in interest in subsidiary companies – – (731) 3 160
net cash flow from financing activities 99 646 (45 859) – (2 111)
Change in borrowings 171 483 (25 088) – –
Repurchase of own shares – (20 771) – (9 666)
Share issue – – – 7 555
Dividends paid to non-controlling interest (71 837) – – –
net change in cash and cash equivalents 125 476 (54 026) – –
Cash and cash equivalents at the beginning of the year (502 448) (448 422) – –
Cash and cash equivalents at the end of the year (376 972) (502 448) – –
Cash and cash equivalents comprise the following
Cash and cash equivalents 160 812 2 237 – –
Bank balances 159 636 1 196 – –
Cash floats and petty cash 1 176 1 041 – –
Bank overdrafts (537 784) (504 685) – –
(376 972) (502 448) – –
Seardel integrated annual report 201451

1 accounting policieSSeardel Investment Corporation Ltd (the company) is a company domiciled in South Africa. The consolidated financial statements of the company for the year ended 31 March 2014 and comparative figures for the year ended 31 March 2013 comprise the company, its equity accounted investees and its subsidiaries (together referred to as the Group). Where reference is made to the Group in the accounting policies it should be interpreted as referring to the company where the context requires, and unless otherwise noted. The company’s registered office is at 1 Moorsom Avenue, cnr Bofors Circle and Moorsom Avenue, Epping Industria II, 7460.
Statement of complianceThe consolidated and company financial statements have been prepared in accordance with International Financial Reporting Standards (IFRS) and the International Financial Reporting Interpretations Committee (IFRIC) and the SAICA Financial Reporting Guides as issued by the Accounting Practices Committee and Financial Reporting Pronouncements as issued by the Financial Reporting Standards Council, the JSE Listings Requirements and the requirements of the Companies Act, 2008.
Basis of preparationThe financial statements are presented in South African Rand, which is the company’s functional currency, rounded to the nearest thousand.
They have been prepared on the going concern and historical cost bases under IFRS, except for those assets and liabilities which are stated at fair value as disclosed in the notes to the financial statements.
The preparation of financial statements in conformity with IFRS requires management to make judgements, estimates and assumptions that affect the application of policies and reported amounts of assets and liabilities, income and expenses. The estimates and associated assumptions are based on historical experience and various other factors that are believed to be reasonable under the circumstances, the results of which form the basis of making judgements about carrying values of assets and liabilities that are not readily apparent from other sources. Actual results may differ from these estimates.
The assumptions and estimates are reviewed on an ongoing basis. Revisions to accounting estimates are recognised in the period in which the estimate is revised if the revision affects only that period, or in the period of the revision and future periods if the revision affects both current and future periods. The areas involving information about significant areas of estimation, uncertainty and critical judgements are given in note 2 Use of Judgements and estimates.
Except for the changes below the Group has consistently applied the accounting policies set out here to all periods presented in these consolidated and separate financial statements. The Group has adopted the following new standards and amendments to standards, including any consequential amendments to other standards, with a date of initial application of 1 April 2013:
a) IFRS 10: Consolidated Financial Statements (2011)
b) IFRS 12: Disclosure of Interests in Other Entities
c) IFRS 13: Fair Value Measurement
d) Presentation of Items of Other Comprehensive Income (Amendments to IAS 1)
e) IAS 19: Employee Benefits (2011)
The nature and effects of the changes are explained below.
a) Subsidiaries As a result of IFRS 10 (2011) the Group has changed it accounting policy for determining whether it has control over and,
consequently, whether it consolidates it investees. IFRS 10 (2011) introduces a new control model that focuses on whether the Group has power over an investee, exposure of rights to variable returns from its involvement with the investee and ability to use its power to affect those returns.
In accordance with the transitional provision of IFRS 10 (2011), the Group reassessed the control conclusion for its investees at 1 April 2013. There were no changes to the control conclusion of any of the Group’s investments.
b) Disclosure of interest in other entities As a result of IFRS 12 the Group has expanded its disclosure about its interest in subsidiaries. See note 28 Business combinations
and note 16 Equity accounted investees.
c) Fair value measurement IFRS 13 establishes a single framework for measuring fair value and making disclosure about fair value measurements when
such measurements are required or permitted by other IFRS. It unifies the definition of fair value as the price that would be
noteS to the financial StatementSFOR THE YEAR ENDED 31 MARCH
52
received to see an asset or paid to transfer a liability in an orderly transaction between market participants at the measurement date. It replaces and expands the disclosure requirements about fair value measurements in other IFRS, including IFRS 7. As a result the Group has included additional disclosure in this regard (see notes 10, 11, 18, 24 and 28).
d) Presentation of items of other comprehensive income As a result of the amendments to IAS 1 the Group has modified the presentation of items of other comprehensive income (OCI)
in its statement of profit or loss and OCI, to present separately items that would be reclassified to profit or loss from those that would not be. Comparative information has been re-presented accordingly.
Basis of consolidationSubsidiariesSubsidiaries are entities controlled by the Group. The financial statements of subsidiaries are included in the consolidated financial statements from the date that control commences until the date that control ceases.
The Group controls an entity when it is exposed to, or has rights to, variable returns from its involvement with the entity and has the ability to affect those returns through its power over the entity.
The accounting policies of subsidiaries have been changed, when necessary, to align them with the policies adopted by the Group. Losses applicable to the non-controlling interests in a subsidiary are allocated to the non-controlling interests even if doing so causes the non-controlling interests to have a deficit balance.
Interests in equity-accounted investmentsThe Group’s interests in equity-accounted investees comprise interest in associates.
Associates are those entities in which the Group has significant influence, but not control or joint control, over the financial and operating policies.
Interests in associates are accounted for using the equity method. They are recognised initially at cost, which includes transaction costs. Subsequent to initial recognition the consolidated financial statements include the Group’s share of profit or loss and OCI of equity-accounted investees, until the date on which significant influence ceases.
Business combinationsBusiness combinations are accounted for using the acquisition method as at the acquisition date – i.e. when control is transferred to the Group. The Group controls an entity when it is exposed to, or has rights to, variable returns from its involvement with the entity and has the ability to affect those returns through its power over the entity.
When the excess is negative a bargain purchase gain is recognised immediately in profit or loss.
The consideration transferred does not include amounts related to the settlement of pre-existing relationships. Such amounts are generally recognised in profit or loss.
Transactions costs, other than those associated with the issue of debt or equity securities, that the Group incurs in connection with a business combination are expensed as incurred.
Any contingent consideration payable is recognised at fair value at the acquisition date. If the contingent consideration is classified as equity it is not remeasured and settlement is accounted for within equity. Otherwise, subsequent changes to the fair value of the contingent consideration are recognised in profit or loss.
If share-based payment awards (replacement awards) are required to be exchanged for awards held by the acquiree’s employees (acquiree’s awards) and relate to past services, then all or a portion of the amount of the acquirer’s replacement awards is included in measuring the consideration transferred in the business combination. This determination is based on the market-based value of the replacement awards compared with the market-based value of the acquiree’s awards and the extent to which the replacement awards relate to past and/or future services.
Goodwill and bargain purchaseGoodwill that arises on the acquisition of subsidiaries is presented with intangible assets. Goodwill is subsequently measured at cost less accumulated impairment losses.
Seardel integrated annual report 201453

Company financial statementsIn the company financial statements investments in subsidiaries are carried at cost less impairment.
Loss of controlUpon the loss of control over a subsidiary the Group derecognises the assets and liabilities of the subsidiary, any non-controlling interests and the other components of equity related to the subsidiary.
Any surplus or deficit arising on the loss of control is recognised in profit or loss. If the Group retains any interest in the previous subsidiary then such interest is measured at fair value at the date that control is lost. Subsequently it is accounted for as an equity-accounted investee or as an available-for-sale financial asset depending on the level of influence retained.
Transactions eliminated on consolidationIntra-group balances and transactions and any unrealised income and expenses arising from intra-group transactions are eliminated in preparing the consolidated financial statements. Unrealised gains arising from transactions with equity-accounted investees are eliminated against the investment to the extent of the Group’s interest in the investee. Unrealised losses are eliminated in the same way as unrealised gains, but only to the extent that there is no evidence of impairment.
Accounting for acquisitions of non-controlling interestsThe Group applies IFRS 10: Consolidated and Separate Financial Statements (2008) in accounting for acquisitions of non-controlling interests.
Acquisitions of non-controlling interests are accounted for as transactions with owners in their capacity as owners and therefore no goodwill is recognised as a result of such transactions. The adjustments to non-controlling interests are based on a proportionate amount of the net assets of the subsidiary.
Property, plant and equipmentOwned assetsRecognition and measurementOwner-occupied buildings are initially recognised at cost and it is subsequently revalued to approximate fair value. When an item of property, plant and equipment is revalued any accumulated depreciation at the date of the revaluation is eliminated against the gross carrying amount of the asset and the net amount restated to the revalued amount of the asset.
Other items of property, plant and equipment are measured at historical cost less accumulated depreciation and accumulated impairment losses. The cost of replacing part of an item of property, plant and equipment is recognised in the carrying amount of the item if it is probable that the future economic benefit embodied within the part will flow to the Group and its cost can be measured reliably.
Where an item of property, plant and equipment is comprised of major components with different useful lives, the components are accounted for as separate items of property, plant and equipment.
DepreciationLand is not depreciated while buildings are depreciated on a straight-line basis over their estimated useful lives. Depreciation is provided on a straight-line basis over the estimated useful lives of the assets. Estimates of useful lives, residual values and methods of depreciation are reviewed annually. Any changes are accounted for prospectively as a change in accounting estimate. If the expected residual value of an asset is equal to or greater than its carrying value, depreciation on that asset is ceased. Depreciation is resumed when the expected residual value falls below the asset’s carrying value.
The gain or loss on disposal of an item of property, plant and equipment is determined by comparing the proceeds from disposal with the carrying amount of the property, plant and equipment, and is recognised net within other income/other expenses in profit or loss. When revalued assets are sold any related amount included in the revaluation reserve is transferred to retained earnings.
Reclassification to investment propertyWhen the use of a property changes from owner-occupied to investment property, the property is remeasured to fair value and reclassified as investment property. Property that is being constructed for future use as investment property is accounted for at fair value. Any gain arising on remeasurement is recognised in profit or loss to the extent the gain reverses a previous impairment loss on the specific property, with any remaining gain recognised in other comprehensive income and presented in the revaluation reserve in equity. Any loss is recognised in other comprehensive income and presented in the revaluation reserve in equity to the extent that an amount had previously been included in the revaluation reserve relating to the specific property, with any remaining loss recognised immediately in profit or loss.
noteS to the financial StatementSFOR THE YEAR ENDED 31 MARCH (CONTINUED)
54
Investment propertyInvestment property is property held either to earn rental income or for capital appreciation or for both, but not for resale in the ordinary course of business, use in the production or supply of goods or services or administrative purposes. Investment property is measured at fair value with any change therein recognised in profit or loss.
When the use of a property changes such that it is reclassified as property, plant and equipment, its fair value at the date of reclassification becomes its cost for subsequent accounting. Property interests held under operating leases are not treated as investment properties.
Costs include expenditure that is directly attributable to the acquisition of the investment property. The cost of self-constructed investment property includes the cost of materials and direct labour, any other costs directly attributable to bringing the investment property to a working condition for their intended use and capitalised borrowing costs.
Any gain or loss on the disposal of an investment property (calculated as the difference between the net proceeds from disposal and the carrying amount of the item) is recognised in profit or loss. When an investment property that was previously classified as property, plant and equipment is sold, any related amount included in the revaluation reserve is transferred to retained earnings.
Discontinued operationsA discontinued operation is a component of the Group’s business that represents a separate major line of business or geographical area of operations that has been disposed of or is held for sale or is a subsidiary acquired exclusively with a view to resale. Classification as a discontinued operation occurs upon disposal or when the operation meets the criteria to be classified as held for sale, if earlier. When an operation is classified as a discontinued operation the comparative statement of comprehensive income is re-presented as if the operation had been discontinued from the start of the comparative period.
Non-current assets held for saleNon-current assets (or disposal groups comprising assets and liabilities) that are expected to be recovered primarily through sale rather than through continuing use are classified as held for sale. Immediately before classification as held for sale the assets (or components of a disposal group) are remeasured in accordance with the Group’s accounting policies. Thereafter, generally the assets (or disposal group) are measured at the lower of their carrying amount and fair value less cost to sell. Any impairment loss on a disposal group is first allocated to goodwill and then to remaining assets and liabilities on a pro rata basis, except that no loss is allocated to inventories, financial assets, deferred tax assets and employee benefit assets, which continue to be measured in accordance with the Group’s accounting policies. Impairment losses on initial classification as held for sale and subsequent gains or losses on remeasurement are recognised in profit or loss. Gains are not recognised in excess of any cumulative impairment loss. Once classified as held for sale, intangible assets and property, plant and equipment are no longer amortised or depreciated.
Impairment
Non-derivative financial assetsA financial asset not classified as at fair value through profit or loss is assessed at each reporting date to determine whether there is objective evidence that it is impaired. A financial asset is impaired if there is objective evidence of impairment as a result of one or more events that occurred after the initial recognition of the asset, and that loss event(s) had an impact on the estimated future cash flows of that asset that can be estimated reliably.
Objective evidence that financial assets are impaired includes default or delinquency by a debtor, restructuring of an amount due to the Group on terms that the Group would not consider otherwise, indications that a debtor or issuer will enter bankruptcy, adverse changes in the payment status of borrowers or issuers, economic conditions that correlate with defaults or the disappearance of an active market for a security. In addition, for an investment in an equity security a significant or prolonged decline in its fair value below its cost is objective evidence of impairment.
Financial assets measured at amortised costThe Group considers evidence of impairment for financial assets measured at amortised cost (loans and receivables and held-to-maturity investment securities) at both a specific asset and collective level. All individually significant assets are assessed for specific impairment. Those found not to be specifically impaired are then collectively assessed for any impairment that has been incurred but not yet identified. Assets that are not individually significant are collectively assessed for impairment by grouping together assets with similar risk characteristics.
In assessing collective impairment the Group uses historical trends of the probability of default, the timing of recoveries and the amount of loss incurred, adjusted for management’s judgement as to whether current economic and credit conditions are such that the actual losses are likely to be greater or less than suggested by historical trends.
Seardel integrated annual report 201455

An impairment loss in respect of a financial asset measured at amortised cost is calculated as the difference between its carrying amount and the present value of the estimated future cash flows discounted at the asset’s original effective interest rate. Losses are recognised in profit or loss and reflected in an allowance account against loans and receivables or held-to-maturity investment securities. Interest on the impaired asset continues to be recognised. When an event occurring after the impairment was recognised causes the amount of impairment loss to decrease, the decrease in impairment loss is reversed through profit or loss.
Available-for-sale financial assetsImpairment losses on available-for-sale financial assets are recognised by reclassifying the losses accumulated in other reserve in equity to profit or loss. The cumulative loss that is reclassified from equity to profit or loss is the difference between the acquisition cost, net of any principal repayment and amortisation, and the current fair value, less any impairment loss recognised previously in profit or loss. Changes in cumulative impairment losses attributable to application of the effective interest method are reflected as a component of interest income. If, in a subsequent period, the fair value of an impaired available-for-sale debt security increases and the increase can be related objectively to an event occurring after the impairment loss was recognised, then the impairment loss is reversed, with the amount of the reversal recognised in profit or loss. However, any subsequent recovery in the fair value of an impaired available-for-sale equity security is recognised in other comprehensive income.
Non-financial assetsThe carrying amounts of the Group’s non-financial assets except for investment property, inventories and deferred tax assets, are reviewed at each reporting date to determine whether there is any indication of impairment. If any such indication exists, then the asset’s recoverable amount is estimated. Goodwill and indefinite-live intangible assets are tested annually for impairment. An impairment loss is recognised if the carrying amount of an asset or cash-generating unit (CGU) exceeds its recoverable amount.
The recoverable amount of an asset or CGU is the greater of its value in use and its fair value less costs to sell. In assessing value in use the estimated future cash flows are discounted to their present value using a pre-tax discount rate that reflects current market assessments of the time value of money and the risks specific to the asset or CGU. For the purpose of impairment testing assets are grouped together into the smallest group of assets that generates cash inflows from continuing use that are largely independent of the cash inflows of other assets or CGUs. Subject to an operating segment ceiling test, CGUs to which goodwill has been allocated are aggregated so that the level at which impairment testing is performed reflects the lowest level at which goodwill is monitored for internal reporting purposes. Goodwill acquired in a business combination is allocated to groups of CGUs that are expected to benefit from the synergies of the combination.
Impairment losses are recognised in profit or loss. Impairment losses recognised in respect of CGUs are allocated first to reduce the carrying amount of any goodwill allocated to the CGU (group of CGUs), and then to reduce the carrying amounts of the other assets in the CGU (group of CGUs) on a pro rata basis.
An impairment loss in respect of goodwill is not reversed. For other assets an impairment loss is reversed only to the extent that the asset’s carrying amount does not exceed the carrying amount that would have been determined, net of depreciation or amortisation, if no impairment loss had been recognised.
Finance income and expensesFinance income comprises interest income on funds invested (including available-for-sale financial assets), gains on the disposal of available-for-sale financial assets and changes in the fair value of financial assets at fair value through profit or loss that are recognised in profit or loss.
Interest income is recognised as it accrues in profit or loss, using the effective interest method.
Finance expenses comprise interest expense on borrowings, unwinding of the discount on provisions, dividends on preference shares classified as liabilities, changes in the fair value of financial assets at fair value through profit or loss and impairment losses recognised on financial assets that are recognised in profit or loss. All borrowing costs not capitalised in terms of IAS 23 are recognised in profit or loss using the effective interest method.
Income taxIncome tax comprises current and deferred tax. Income tax expense is recognised in profit or loss except to the extent that it relates to items recognised directly in equity, in which case it is recognised in equity or OCI.
Current tax is the expected tax payable on the taxable income for the year, using tax rates enacted or substantively enacted at the reporting date, and any adjustment to tax payable in respect of previous years.
noteS to the financial StatementSFOR THE YEAR ENDED 31 MARCH (CONTINUED)
56
Deferred tax is recognised in respect of temporary differences between the carrying amounts of assets and liabilities for financial reporting purposes and the amounts used for taxation purposes. Deferred tax is not recognised for the following temporary differences: the initial recognition of assets or liabilities in a transaction that is not a business combination and that affects neither accounting nor taxable profit or loss, and differences relating to investments in subsidiaries and jointly controlled entities to the extent that it is probable that they will not reverse in the foreseeable future. In addition, deferred tax is not recognised for taxable temporary differences arising on the initial recognition of goodwill. Deferred tax is measured at the tax rates that are expected to be applied to temporary differences when they reverse, based on the laws that have been enacted or substantively enacted by the reporting date. Deferred tax assets and liabilities are off-set if there is a legally enforceable right to off-set current tax liabilities and assets, and they relate to income taxes levied by the same tax authority on the same taxable entity, or on different tax entities, but they intend to settle current tax liabilities and assets on a net basis or their tax assets and liabilities will be realised simultaneously.
A deferred tax asset is recognised for unused tax losses, tax credits and deductible temporary differences, to the extent that it is probable that future taxable profits will be available against which they can be utilised. Deferred tax assets are reviewed at each reporting date and are reduced to the extent that it is no longer probable that the related tax benefit will be realised. Dividend withholding tax is a tax on shareholders receiving dividends and is applicable to all dividends declared on or after 1 April 2013. The company withholds dividend tax on behalf of its shareholders at a rate of 15% on dividends declared. Amounts withheld are not recognised as part of the company’s tax charge but rather as part of the dividend paid recognised directly in equity.
Where withholding tax is withheld on dividends received the dividend is recognised at the gross amount with the related withholding tax recognised as part of tax expense, unless it is otherwise reimbursable in which case it is recognised as an asset.
inventoryRaw materials and consumables, work-in-progress and finished goods are stated at the lower of cost and net realisable value. Net realisable value is the estimated selling price in the ordinary course of business, less the estimated costs of completion and selling expenses. Cost is determined on the first-in, first-out principle and includes direct material costs together with appropriate allocations of labour and overheads based on normal operating capacity.
ProvisionsProvisions are recognised when the Group has a present legal or constructive obligation as a result of past events, for which it is probable that an outflow of economic benefits will occur and where a reliable estimate can be made of the amount of the obligation. Where the effect of discounting is material provisions are determined by discounting the expected future cost. The discount rate used is a pre-tax rate that reflects current market assessments of the time value of money and, where appropriate, the risks specific to the liability. Provisions are reviewed at each reporting date and adjusted to reflect the current or best estimate.
Financial instrumentsInitial recognitionThe Group initially recognises loans and receivables on the date that they are originated. All other financial assets (including assets designated as at fair value through profit or loss) are recognised initially on the trade date, which is the date that the Group becomes a party to the contractual provisions of the instruments.
MeasurementFinancial instruments are initially measured at fair value, which includes transaction costs, except for instruments measured at fair value through profit or loss. Subsequent to initial recognition these instruments are measured as follows:
DerecognitionThe Group derecognises a financial asset when the contractual rights to the cash flows from the asset expire or it transfers the right to receive the contractual cash flows in a transaction in which substantially all the risks and rewards of ownership of the financial asset are transferred. Any interest in such transferred financial assets that is created or retained by the Group is recognised as a separate asset or liability.
InvestmentsListed investments classified as available-for-sale financial assets are carried at fair value, which is calculated by reference to stock exchange quoted selling prices at the close of business at the reporting date. Unlisted investments are shown at fair value unless their fair value cannot be reliably determined, in which case they are shown at cost less accumulated impairment losses. Gains and losses are recognised in OCI in other reserves except for impairment losses, which are expensed in profit or loss.
Investments that meet the criteria for classification as held-to-maturity financial assets are carried at amortised cost.
Seardel integrated annual report 201457

Trade, long-term and other receivablesTrade and other receivables originated by the Group are stated at amortised cost less impairment losses using the effective interest rate method (see accounting policy on impairment).
Cash and cash equivalentsCash and cash equivalents comprise cash balances and call deposits and are measured at amortised cost. Bank overdrafts that are payable on demand and form an integral part of the Group’s cash management are included as a component of cash and cash equivalents for the statement of cash flows.
Financial liabilities, trade and other payablesNon-derivative financial liabilities are recognised at amortised cost using the effective interest rate method, comprising original debt less principal payments and amortisations.
Derivative instrumentsDerivative instruments are measured at fair value. Changes in the fair value are recognised in profit or loss.
OffsetIn the instance that the Group has a legal right to apply an amount due from a third party against the amount due to a creditor, provided that there is an agreement among the two parties that clearly establishes the contractual right to set-off, and the Group intends either to settle on a net basis or to realise the asset and settle the liability simultaneously, the related amounts are off-set and the net amounts reported in the statement of financial position.
RevenueSale of goodsRevenue from the sale of goods in the course of ordinary activities are measured at the fair value of the consideration received or receivable, net of returns, trade discounts and volume rebates. Revenue is recognised when significant risks and rewards of ownership have been transferred to the customer, recovery of the consideration is probable, the associated costs and possible return of goods can be estimated reliably, there is no continuing management involvement with the goods, and the amount of revenue can be measured reliably. If it is probable that discounts will be granted and the amount can be measured reliably, then the discount is recognised as a reduction of revenue as the sales are recognised.
The timing of the transfer of risks and rewards varies depending on the individual terms of the sales agreement.
Lease incomeRevenues from finance leases are recognised using the effective yield method. Revenues from operating leases are recognised on a straight-line basis over the lease term.
Dividend incomeDividend income from investments is recognised when the right to receive payment is established.
earnings per shareBasic earnings per share is based on earnings attributable to shareholders and is calculated on the weighted average number of shares in issue during the financial year. Headline earnings per share is based on profit attributable to shareholders, excluding any non-trading capital items and the tax effect thereon, and is calculated as above. Diluted earnings per share is determined by adjusting the profit or loss attributable to ordinary shareholders and the weighted average number of ordinary shares outstanding for the effects of all dilutive potential ordinary shares.
These potentially dilutive shares relate to the options issued in terms of the share incentive scheme.
Foreign currency transactionsTransactions in foreign currencies are translated at the foreign exchange rate ruling at the transaction date. Monetary assets and liabilities denominated in foreign currencies are translated into South African Rand at rates of exchange ruling at the reporting date. Translation gains and losses, whether realised or unrealised, are taken to profit or loss.
The foreign currency gain or loss on monetary items is the difference between amortised cost in the functional currency at the beginning of the year, adjusted for effective interest rate and payments during the year, and amortised cost in foreign currency translated at the exchange rate at the end of the year.
noteS to the financial StatementSFOR THE YEAR ENDED 31 MARCH (CONTINUED)
58

LeasesFinance leasesLeases that transfer substantially all the risks and rewards of ownership of the underlying asset to the Group are classified as finance leases.
Assets acquired in terms of finance leases are capitalised at the lower of fair value and the present value of the minimum lease payments at inception of the lease, and depreciated over the estimated useful life of the asset. The capital element of future obligations under the leases is included as a liability in the statement of financial position. Lease payments are allocated using the effective interest rate method to determine the lease finance cost, which is charged against income over the lease period, and the capital repayment, which reduces the liability to the lessor.
The Group as lessorAmounts due from lessees under finance leases are recorded as receivables at the amount of the Group’s net investment in the leases. Finance lease income is allocated to accounting periods so as to reflect a constant periodic rate of return on the Group’s net investment outstanding in respect of the leases.
The Group enters into finance leasing arrangements for its copiers, faxes and point-of-sale equipment. All leases are denominated in South African Rands. The average term of finance leases entered into is four to five years.
Operating leases – The Group as lesseeLeases where the lessor retains the risks and rewards of ownership of the underlying asset are classified as operating leases. Payments made under operating leases are recognised in profit or loss on a straight-line basis over the period of the lease. The leased assets are not recognised in the Group’s statement of financial position.
employee benefitsDefined contribution plansObligations for contributions to defined contribution plans are expensed as the related service is provided. Prepaid contributions are recognised as an asset to the extent that a cash refund or a reduction in future payments is available.
Medical aidWhere the Group has an obligation to provide post-retirement medical aid benefits to employees the group recognises the costs of these benefits in the year in which the employees render the service.
Actuarial gains or losses in respect of the defined benefit medical plan are recognised directly in OCI in the year in which they arise. Past service costs are recognised as an expense on a straight-line basis over the average period until the benefits become vested.
Other long-term employee benefitsThe Group’s net obligation in respect of long-term employee benefits other than pension plans is the amount of future benefit that employees have earned in return for their service in the current and prior periods; that benefit is discounted to determine its present value and the fair value of any related assets is deducted. The discount rate is the yield at the reporting date on government bonds that have maturity dates approximating the terms of the Group’s obligations and that are denominated in the currency in which the benefits are expected to be paid. The calculation is performed using the projected unit credit method. Any actuarial gains and losses are recognised in profit or loss in the period in which they arise.
Termination benefitsTermination benefits are expensed at the earlier of when the Group can no longer withdraw the offer of those benefits and when the Group recognises costs for a restructuring. If benefits are not expected to be settled wholly within 12 months of the end of the reporting period, then they are discounted.
Short-term employee benefitsShort-term employee benefit obligations are measured on an undiscounted basis and are expensed as the related service is provided. A liability is recognised for the amount expected to be paid under short-term cash bonus or profit-sharing plans if the Group has a present legal or constructive obligation to pay this amount as a result of past service provided by the employee and the obligation can be estimated reliably.
Seardel integrated annual report 201459
Share-based payment transactionsThe grant date fair value of share-based payment awards granted to employees is recognised as an employee expense, with a corresponding increase in equity over the period that the employees become unconditionally entitled to the awards. The amount recognised as an expense is adjusted to reflect the number of awards for which the related service and non-market performance conditions are expected to be met, such that the amount ultimately recognised as an expense is based on the number of awards that meet the related service and non-market performance conditions at the vesting date. For share-based payment awards with non-vesting conditions the grant date fair value of the share-based payment is measured to reflect such conditions and there is no true-up for differences between expected and actual outcomes.
The fair value of the amount payable to employees in respect of share appreciation rights, which are settled in cash, is recognised as an expense with a corresponding increase in liabilities over the period that the employees become unconditionally entitled to payment. The liability is remeasured at each reporting date and at settlement date. Any changes in the fair value of the liability are recognised as personnel expenses in profit or loss.
Equity compensation benefits – granted after 7 November 2002The Group granted share options to certain employees under an employee share plan.
The fair value of the employee share options are measured using an actuarial binomial model. Measurement inputs include the share price on the measurement date, the exercise price of the instrument, expected volatility (based on an evaluation of the company’s historic volatility, particularly over the historic period commensurate with the expected term), expected term of the instruments (based on historical experience and general option holder behaviour), expected dividends and the risk-free interest rate (based on government bonds). Service and non-market performance conditions attached to the transactions are not taken into account in determining fair value.
The scheme is administered through a trust which acts as an agent of the sponsor, the sponsor being Seardel Investment Corporation Limited.
Consequently, the assets and liabilities of the trust are accounted for as assets and liabilities of the sponsor on the basis that the trust is acting as an agent of the sponsor.
Dividends to shareholdersDividends are accounted for in the period in which the dividends are declared.
Treasury sharesShares in the company held by Group entities are classified as treasury shares. These shares are treated as a deduction from the weighted average number of shares and the cost price of the shares is deducted from equity in the statement of changes in equity. Dividends received on treasury shares are eliminated on consolidation.
Segmental reportingThe Group follows the management approach to segmental reporting with segment financial information being disclosed as it is being used internally by the entity’s chief operating decision-maker (CODM) in order to assess performance and allocate resources.
Segments are determined on the basis of products and services offered.
Inter-segment pricing is determined on an arm’s length basis.
The segment report has been presented on page 64.
intangiblesIntangible assetsIntangible assets that are acquired by the Group and have finite useful lives are measured at cost less accumulated amortisation and accumulated impairment losses. Subsequent expenditure is capitalised only when it increases the future economic benefits embodied in the specific asset to which it relates. All other expenditure, including expenditure on internally generated goodwill and brands, is recognised in profit or loss as incurred. Intangible assets with indefinite useful lives are tested for impairment annually regardless of whether there is an impairment indicator.
The gain or loss arising from the derecognition of an intangible asset shall be determined as the difference between the net disposal proceeds, if any, and the carrying amount of the asset. It shall be recognised in profit or loss when the asset is derecognised.
noteS to the financial StatementSFOR THE YEAR ENDED 31 MARCH (CONTINUED)
60

Detail on each class of intangible assetElectronic programming guide slot is carried at cost less impairment. No amortisation is accounted as the useful life is indefinite.
Distribution rights represent multi-territory and multi-platform programming rights that the Group is able to sell on to other broadcasters.
Distribution rights are amortised over the products’ economic life cycle which is determined on a pro rata basis of the individual title’s total cost based on the territory and broadcast platform for which the distribution rights have been sold.
Programming under development are documentaries that are under production but not completed as yet, the useful life of this class of assets are based on revenue derived from the production.
Marketing-related intangible assets relate to trademarks, trade names and brand names for e.tv, eNCA, Yfm and Sasani. The useful life for this class of assets were applied as indefinite as it extended beyond the foreseeable horizon.
Customer-related intangible assets relate to customer contracts and the related relationships and non-contractual customer relationships. The useful life was estimated as between 2,7 years and 10 years.
Contract-based intangible assets relate to the broadcasting rights. No amortisation is accounted as the useful life is indefinite.
AmortisationAmortisation is recognised in profit or loss on a straight-line basis.
Amortisation methods, useful lives and residual values are reviewed at each reporting date and adjusted if appropriate.
Programming rightsProgramming rights acquired by the Group are initially measured at cost and are amortised over the number of licensed broadcasting runs. For features on first run, 70% of the cost is amortised and the remaining 30% over the balance of the licensed broadcasting runs. For genres other than features the cost is amortised on the first run. If, at the end of the licence period, the number of licensed broadcasting runs has not been fully utilised, a write-off is accounted for through profit or loss. Programming rights are tested on an annual basis for impairment.
Government grantsGovernment grants are recognised as other income when there is a reasonable assurance that the Group will comply with the relevant conditions attached to them and that the grant will be received.
export incentivesDuty credit certificates used to procure foreign goods serve to adjust the total cost of imported goods. Where these are not required for own import, they are sold and the resulting income is recognised as other income.
Borrowing costsBorrowing costs attributable to the acquisition, construction or production of a qualifying asset are capitalised.
Seardel integrated annual report 201461
2 uSe of JudgementS and eStimateSIn preparing these consolidated and separate financial statements management has made judgements, estimates and assumptions that affect the application of the Group’s accounting policies and the reported amounts of assets, liabilities, income and expenses. Actual results may differ from these estimates.
Estimates and underlying assumptions are reviewed on an ongoing basis. Revisions to estimates are recognised prospectively.
JudgementsInformation about judgements made in applying accounting policies that have the most significant effects on the amounts recognised in the consolidated financial statements is included in the following notes:Note 28 – consolidation: whether the Group has de facto control over an investee; Note 28 – consolidation: whether consideration forms part of debt or equity; andNote 29 – leases: leases classification.
assumptions and estimation uncertaintiesInformation about assumptions and estimation uncertainties that have a significant risk of resulting in a material adjustment in the year ending 31 March 2015 is included in the following notes:
Note 23 – measurement of defined benefit obligation: key actuarial assumptions;
Note 7 – recognition of deferred tax assets: availability of future taxable profit against which carry-forward tax losses can be used;
Note 5 – impairment test: key assumptions underlying recoverable amounts;
Note 12 – valuation of intangible asset;
Note 12 – assessment of useful lives and residual values; and
Note 27 – provisions.
measurement of fair valuesA number of the Group’s accounting policies and disclosures require the measurement of fair values, for both financial and non-financial assets and liabilities.
The Group has an established control framework with respect to the measurement of fair values that are reviewed on an ongoing basis. Review includes significant unobservable inputs and valuation adjustments. If third-party information, such as external property valuations, is used to measure fair values, then it’s assessed if the evidence obtained from the third parties support the conclusion that such valuations meet the requirements of IFRS, including the level in the fair value hierarchy in which such valuations should be classified.
Significant valuation issues are reported to the Group audit committee.
When measuring the fair value of an asset or a liability the Group uses market observable data as far as possible. Fair values are categorised into different levels in the fair value hierarchy based on the inputs used in the valuation techniques as follows:
– Level 1: quoted prices (unadjusted) in active markets for identical assets or liabilities
– Level 2: inputs other than quoted prices included in Level 1 that are observable for the asset or liability, either directly (i.e. prices) or indirectly (i.e. derived from prices)
– Level 3: inputs for the asset or liability that are not based on observable market data (unobservable inputs)
If inputs used to measure the fair value of an asset or a liability might be categorised in the different levels of the fair value hierarchy, then the fair value measurement is categorised in its entirety in the same level of the fair value hierarchy as the lowest level input that is significant to the entire measurement.
Further information about the assumptions made in measuring fair values is included in the following notes:
Note 39 – share-based payment arrangements;
Note 11 – investment property;
Note 10 – owner-occupied land; and
Note 24 – financial instruments.
noteS to the financial StatementSFOR THE YEAR ENDED 31 MARCH (CONTINUED)
62

3 operating profit Before impairmentS and reStructuring and retrenchment expenSeSThe following items have been taken into account in determining operating profit for continuing and discontinuing operations
before impairments and restructuring and retrenchment expenses:GROuP COmPany
2014R000’s
2013R000’s
2014R000’s
2013R000’s
incomeCompensation for property, plant and equipment that were impaired, lost or given up 347 – – – Dividends – unlisted investments 228 96 228 96
– subsidiary companies – – 7 164 – Export incentives – 3 471 – – Government grants 33 875 67 260 – – Finance lease income – 10 890 – – Foreign exchange gains – realised 12 898 6 572 – –
– unrealised 31 569 4 693 – – Litigation settlement* 38 703 – – – Rental income from investment property 71 547 47 280 – – Fair value adjustments to investment property 20 726 (2 161) – – Surplus on disposal of property, plant and equipment 3 888 2 099 – –
expenditureAmortisation 72 030 4 503 – – Bad debts – net recoveries and reversals of allowance account 8 751 3 161 – – Bank charges 4 928 4 865 – – Depreciation – buildings 4 326 2 712 – –
– plant and machinery 24 443 21 672 – – – equipment and fittings 59 710 9 964 – – – motor vehicles 3 314 1 679 – –
Total owned assets 91 793 36 027 – – Total leased assets 791 218 – – Total depreciation 92 584 36 245 – – Employment costs** 795 961 645 077 – – Loss on disposal of property, plant and equipment 31 707 1 012 – – Foreign exchange losses – realised 3 697 2 726 – –
– unrealised 27 382 8 629 – – Operating lease charges – property 36 991 17 169 – –
– equipment and vehicles 3 077 5 049 – – Technical and consulting fees 32 257 12 715 – – Write-down of inventory to net realisable value 12 244 26 355 – – Reversal of write-down of inventory to net realisable value (1 572) (6 014) – –
* Income as a result of settlement of various litigation proceedings and claims against former directors and officers of the
company and entities controlled by them.
** Includes contributions of R52,6 million (2013: R54,8 million) to medical, pension, provident and benefit funds.
These contributions are after a R8,1 million charge (2013: R7 million) in respect of post-employment medical benefits
relating to a defined benefit obligation and an IFRS 2 charge in respect of the share option scheme of R1,9 million
(2013: R6,5 million).
Seardel integrated annual report 201463

4 Segment reportOperating segments are reported in a manner consistent with the internal reporting provided to the chief operating decision
maker. The chief operating decision-maker, who is responsible for allocating resources and assessing performance of the
operating segments, has been identified as the board.
The clothing, textile and industrial segments derive their revenue from manufacturing activities. The branded product
distribution segment derives its revenue from the distribution of branded toys, electronics, stationery and clothing. The
property segment derives its revenue from property rental.
The media segment derives its revenue from broadcasting in free-to-air television stations.
noteS to the financial StatementSFOR THE YEAR ENDED 31 MARCH (CONTINUED)
Gross revenue
R’000
inter-segment revenue
R’000
external revenue
R’000
Operating profit/(loss)
before finance
costsR’000
Profit or loss for
the yearR’000
Segment assetsR’000
Segment liabilities
R’000
Capital expenditure
R’000
Capital expenditure
as part of business
combinationR’000
DepreciationR’000
amortisationR’000
Write down of inventory
R’000
Reversal of write down
of inventoryR’000
impairmentsR’000
Reversal of impairments
R’000
Restructuring and
retrenchment costsR’000
Revaluation of
investment properties
R’000
Gain on disposal of
property, plant and
equipmentR’000
Loss on disposal of
property, plant and
equipmentR’000
Share of profit/(loss)
of equity accounted
investmentsR’000
income tax (expense)/
incomeR’000
year ended 31 march 2014
Continued operations
Property 118 926 (47 379) 71 547 103 769 103 769 1 075 261 10 777 37 716 – (2 910) – – – – – – 20 726 62 – – –
Branded product distribution 957 545 (3 622) 953 923 37 359 25 995 550 763 174 271 9 911 1 286 (4 788) (1 381) (5 217) – – – 3 – 170 (174) – (11 364)
Media 1 223 603 – 1 223 603 241 194 30 890 8 386 116 5 922 121 206 262 1 379 440 (52 190) (67 743) – – – – – – 930 (13) (5 367) (83 979)
Textiles 736 920 (46 767) 690 153 21 990 21 990 478 092 218 251 14 787 – (12 164) – (1 931) – – – (2 242) – 11 (128) – –
Industrials 424 701 – 424 701 32 941 28 881 271 467 89 953 6 568 25 392 (9 596) – (95) – – – – – 25 (131) – (4 060)
Clothing 23 194 – 23 194 (5 151) (5 151) 23 255 674 137 – (925) – (1 000) 1 572 – – (243) – – (1) – –
Head office – – – 24 021 (4 860) 85 750 571 331 108 – (305) (1 177) – – – – – – (14) – – 18 133
Total continued operations 3 484 889 (97 768) 3 387 121 456 123 201 514 10 870 704 6 987 378 275 489 1 406 118 (82 878) (70 301) (8 243) 1 572 – – (2 482) 20 726 1 184 (447) (5 367) (81 270)
Discontinued operations
Clothing 604 457 – 604 457 (146 153) (159 901) 142 263 77 542 2 825 – (9 706) (1 729) (4 001) – (4 617) – (43 617) – 2 704 (31 260) – –
Total discontinued operations 604 457 – 604 457 (146 153) (159 901) 142 263 77 542 2 825 – (9 706) (1 729) (4 001) – (4 617) – (43 617) – 2 704 (31 260) – –
Total 4 089 346 (97 768) 3 991 578 309 970 41 613 11 012 967 7 064 920 278 314 1 406 118 (92 584) (72 030) (12 244) 1 572 (4 617) – (46 099) 20 726 3 888 (31 707) (5 367) (81 270)
year ended 31 march 2013*
Continued operations
Property 93 225 (45 944) 47 281 63 554 63 554 997 217 33 673 169 975 – (2 714) – – – – – (3) (2 161) 904 (214) – –
Branded product distribution 795 416 (2 460) 792 956 15 474 9 114 456 915 114 169 7 056 – (4 495) (2 000) (8 713) 1 463 (937) – (615) – 59 – – (6 360)
Media – – – – – – – – – – – – – – – – – – – – –
Textiles 689 207 (39 207) 650 000 31 362 31 362 473 773 258 459 22 229 – (8 616) – (912) – – 22 822 (721) – 93 (789) – –
Industrials 334 988 (6 350) 328 638 17 046 15 795 217 030 60 374 9 957 – (8 407) – (3) – – – 170 – 43 (9) – (1 251)
Clothing 26 649 – 26 649 (5 078) (5 078) 35 337 1 930 2 080 – (1 194) – – 4 551 – – (13) – – – – –
Head office – – – (13 733) (28 723) 38 554 520 002 294 – (317) (1 140) – – – – – – – – – 8 728
Total continued operations 1 939 485 (93 961) 1 845 524 108 625 86 024 2 218 826 988 607 211 591 – (25 743) (3 140) (9 628) 6 014 (937) 22 822 (1 182) (2 161) 1 099 (1 012) – 1 117
Discontinued operations
Clothing 667 962 – 667 962 (28 767) (45 173) 305 813 75 446 4 580 – (10 502) (1 363) (16 727) – – – (1 063) – 1 000 – – –
Total discontinued operations – – 667 962 (28 767) (45 173) 305 813 75 446 4 580 – (10 502) (1 363) (16 727) – – – (1 063) – 1 000 – – –
Total 2 607 447 (93 961) 2 513 486 79 858 40 851 2 524 639 1 064 053 216 171 – (36 245) (4 503) (26 355) 6 014 (937) 22 822 (2 245) (2 161) 2 099 (1 012) – 1 117
* Restated, refer to note 36.
64
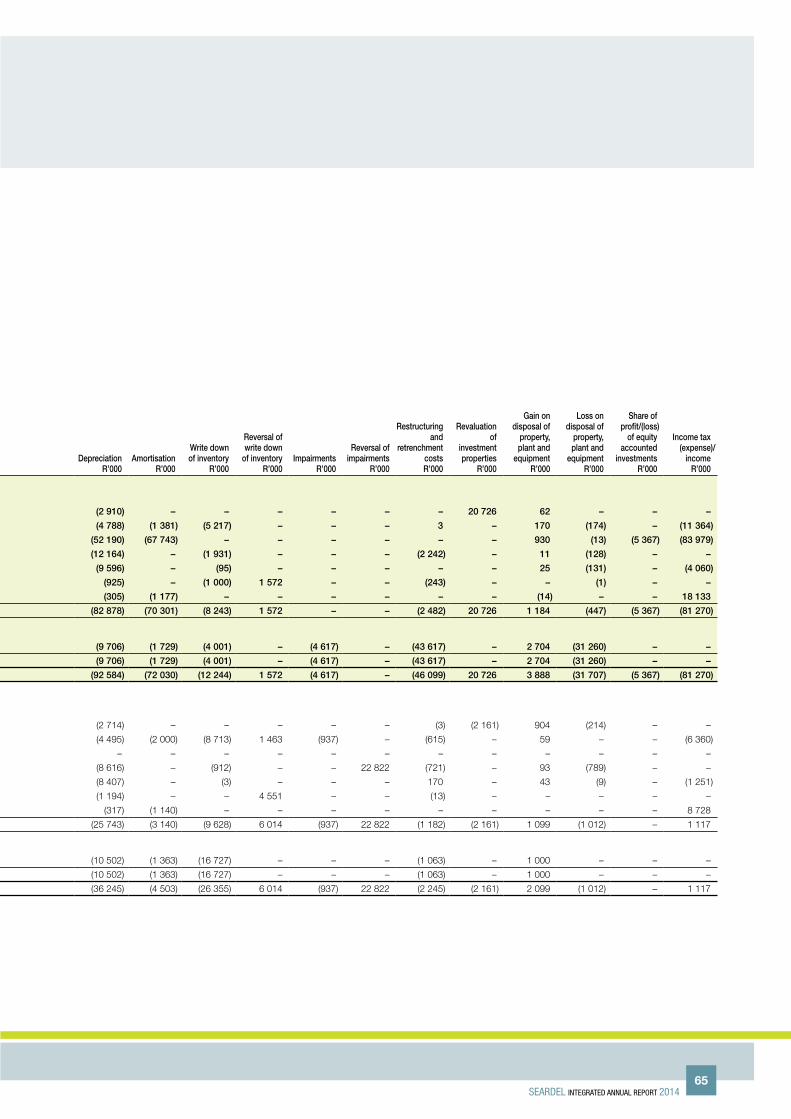
Gross revenue
R’000
inter-segment revenue
R’000
external revenue
R’000
Operating profit/(loss)
before finance
costsR’000
Profit or loss for
the yearR’000
Segment assetsR’000
Segment liabilities
R’000
Capital expenditure
R’000
Capital expenditure
as part of business
combinationR’000
DepreciationR’000
amortisationR’000
Write down of inventory
R’000
Reversal of write down
of inventoryR’000
impairmentsR’000
Reversal of impairments
R’000
Restructuring and
retrenchment costsR’000
Revaluation of
investment properties
R’000
Gain on disposal of
property, plant and
equipmentR’000
Loss on disposal of
property, plant and
equipmentR’000
Share of profit/(loss)
of equity accounted
investmentsR’000
income tax (expense)/
incomeR’000
year ended 31 march 2014
Continued operations
Property 118 926 (47 379) 71 547 103 769 103 769 1 075 261 10 777 37 716 – (2 910) – – – – – – 20 726 62 – – –
Branded product distribution 957 545 (3 622) 953 923 37 359 25 995 550 763 174 271 9 911 1 286 (4 788) (1 381) (5 217) – – – 3 – 170 (174) – (11 364)
Media 1 223 603 – 1 223 603 241 194 30 890 8 386 116 5 922 121 206 262 1 379 440 (52 190) (67 743) – – – – – – 930 (13) (5 367) (83 979)
Textiles 736 920 (46 767) 690 153 21 990 21 990 478 092 218 251 14 787 – (12 164) – (1 931) – – – (2 242) – 11 (128) – –
Industrials 424 701 – 424 701 32 941 28 881 271 467 89 953 6 568 25 392 (9 596) – (95) – – – – – 25 (131) – (4 060)
Clothing 23 194 – 23 194 (5 151) (5 151) 23 255 674 137 – (925) – (1 000) 1 572 – – (243) – – (1) – –
Head office – – – 24 021 (4 860) 85 750 571 331 108 – (305) (1 177) – – – – – – (14) – – 18 133
Total continued operations 3 484 889 (97 768) 3 387 121 456 123 201 514 10 870 704 6 987 378 275 489 1 406 118 (82 878) (70 301) (8 243) 1 572 – – (2 482) 20 726 1 184 (447) (5 367) (81 270)
Discontinued operations
Clothing 604 457 – 604 457 (146 153) (159 901) 142 263 77 542 2 825 – (9 706) (1 729) (4 001) – (4 617) – (43 617) – 2 704 (31 260) – –
Total discontinued operations 604 457 – 604 457 (146 153) (159 901) 142 263 77 542 2 825 – (9 706) (1 729) (4 001) – (4 617) – (43 617) – 2 704 (31 260) – –
Total 4 089 346 (97 768) 3 991 578 309 970 41 613 11 012 967 7 064 920 278 314 1 406 118 (92 584) (72 030) (12 244) 1 572 (4 617) – (46 099) 20 726 3 888 (31 707) (5 367) (81 270)
year ended 31 march 2013*
Continued operations
Property 93 225 (45 944) 47 281 63 554 63 554 997 217 33 673 169 975 – (2 714) – – – – – (3) (2 161) 904 (214) – –
Branded product distribution 795 416 (2 460) 792 956 15 474 9 114 456 915 114 169 7 056 – (4 495) (2 000) (8 713) 1 463 (937) – (615) – 59 – – (6 360)
Media – – – – – – – – – – – – – – – – – – – – –
Textiles 689 207 (39 207) 650 000 31 362 31 362 473 773 258 459 22 229 – (8 616) – (912) – – 22 822 (721) – 93 (789) – –
Industrials 334 988 (6 350) 328 638 17 046 15 795 217 030 60 374 9 957 – (8 407) – (3) – – – 170 – 43 (9) – (1 251)
Clothing 26 649 – 26 649 (5 078) (5 078) 35 337 1 930 2 080 – (1 194) – – 4 551 – – (13) – – – – –
Head office – – – (13 733) (28 723) 38 554 520 002 294 – (317) (1 140) – – – – – – – – – 8 728
Total continued operations 1 939 485 (93 961) 1 845 524 108 625 86 024 2 218 826 988 607 211 591 – (25 743) (3 140) (9 628) 6 014 (937) 22 822 (1 182) (2 161) 1 099 (1 012) – 1 117
Discontinued operations
Clothing 667 962 – 667 962 (28 767) (45 173) 305 813 75 446 4 580 – (10 502) (1 363) (16 727) – – – (1 063) – 1 000 – – –
Total discontinued operations – – 667 962 (28 767) (45 173) 305 813 75 446 4 580 – (10 502) (1 363) (16 727) – – – (1 063) – 1 000 – – –
Total 2 607 447 (93 961) 2 513 486 79 858 40 851 2 524 639 1 064 053 216 171 – (36 245) (4 503) (26 355) 6 014 (937) 22 822 (2 245) (2 161) 2 099 (1 012) – 1 117
* Restated, refer to note 36.
Seardel integrated annual report 201465
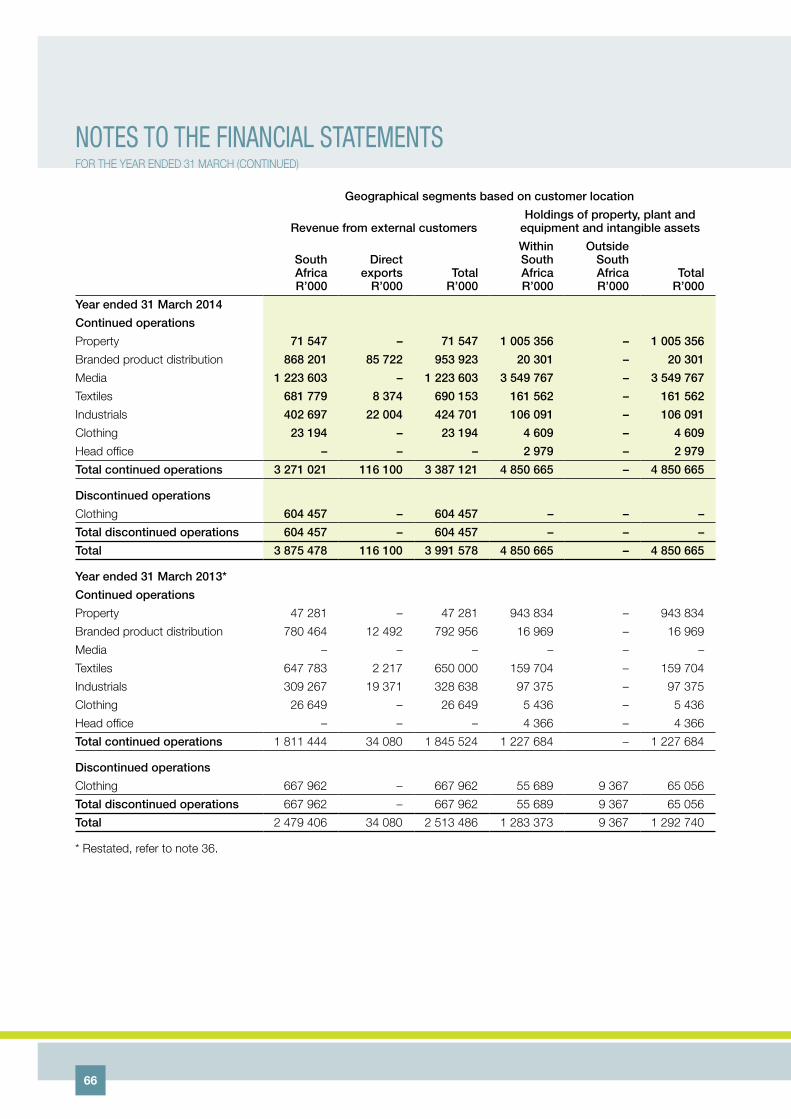
Geographical segments based on customer location
Revenue from external customersholdings of property, plant and
equipment and intangible assets
South africaR’000
Direct exports
R’000Total
R’000
Within South africaR’000
Outside South africaR’000
TotalR’000
year ended 31 march 2014
Continued operations
Property 71 547 – 71 547 1 005 356 – 1 005 356
Branded product distribution 868 201 85 722 953 923 20 301 – 20 301
Media 1 223 603 – 1 223 603 3 549 767 – 3 549 767
Textiles 681 779 8 374 690 153 161 562 – 161 562
Industrials 402 697 22 004 424 701 106 091 – 106 091
Clothing 23 194 – 23 194 4 609 – 4 609
Head office – – – 2 979 – 2 979
Total continued operations 3 271 021 116 100 3 387 121 4 850 665 – 4 850 665
Discontinued operations
Clothing 604 457 – 604 457 – – –
Total discontinued operations 604 457 – 604 457 – – –
Total 3 875 478 116 100 3 991 578 4 850 665 – 4 850 665
year ended 31 march 2013*
Continued operations
Property 47 281 – 47 281 943 834 – 943 834
Branded product distribution 780 464 12 492 792 956 16 969 – 16 969
Media – – – – – –
Textiles 647 783 2 217 650 000 159 704 – 159 704
Industrials 309 267 19 371 328 638 97 375 – 97 375
Clothing 26 649 – 26 649 5 436 – 5 436
Head office – – – 4 366 – 4 366
Total continued operations 1 811 444 34 080 1 845 524 1 227 684 – 1 227 684
Discontinued operations
Clothing 667 962 – 667 962 55 689 9 367 65 056
Total discontinued operations 667 962 – 667 962 55 689 9 367 65 056
Total 2 479 406 34 080 2 513 486 1 283 373 9 367 1 292 740
* Restated, refer to note 36.
noteS to the financial StatementSFOR THE YEAR ENDED 31 MARCH (CONTINUED)
66

5 net impairment reverSal/(impairment) of aSSetSGROuP COmPany
Reconciliation of carrying amount2014
R000’s2013
R000’s2014
R000’s2013
R000’s
The following impairments were recognised during the year:
Category of asset
Property, plant and equipment – 937 – –
Intangible assets 4 617 – – –
Interest in subsidiary company – – 245 413 –
Total 4 617 937 245 413 –
Included in discontinued operations (4 617) – – –
Impairments from continuing operations – 937 245 413 –
The following impairments were reversed during the year:
Category of asset
Property, plant and equipment – 22 822 – –
Total – 22 822 – –
Included in discontinued operations – – – –
Impairments reversed from continuing operations – 22 822 – –
– 21 885 (245 413) –
impairment testing The Group has performed impairment testing on:• all cash-generating units (CGUs)where there is an indication that theymaybe impaired or impairment should be
reversed;• allCGUsthatcontaingoodwill;and• intangibleassetswithindefiniteusefullives.
For the purposes of determining the CGUs of the Group, the guidelines as per IAS 36 were followed and the below considerations were given:• howtheGroupreportsitsfinancialmanagementaccounts;• howmanagementmakesday-to-dayoperationaldecisions;and• howmanagementmakesdecisionsaboutcontinuingordisposingoftheentity’sassets.
CGus where there is an indication that they may be impaired or impairment reversalThe recoverable amount of a CGU is determined based on a fair value less cost to sell, or value in use calculation as appropriate.
Value-in-use calculation use cash flow projections approved by management. These cash flow forecasts cover four years and the cash flows after the forecast period are extrapolated into the future over the useful life of the CGU using steady growth rates that are consistent with that of the industry and country.
In determining value in use projected cash flows are discounted using the entity’s weighted average cost of capital (WACC)adjusted for any risk that are not reflected in the underlying cash flows. WACC was calculated as 7,41% for the current period (2013: 9,05%).
Expected future cash flows are inherently uncertain and could materially change over time. They are significantly affected by a number of factors, including production estimates and economic factors such as commodity prices, discount rates, currency exchange rates and estimates of costs to produce. Management believes that any reasonably possible change in the key assumptions on which the recoverable amount is based would not cause the carrying amounts to exceed their recoverable amount.
Fair value has been determined by independent external valuers who have taken into account the current market conditions for the nature, age and condition of the assets involved.
The events and circumstances that led to the recognition of the impairment losses are as follows:Poor results and/or budgeted future results triggered an assessment of realisable value.
Seardel integrated annual report 201467

5 net impairment reverSal/(impairment) of aSSetS (continued)
The events and circumstances that led to the reversal of impairments are as follows:Internal restructuring as well as changes in the dynamics of the market in which certain businesses within the textile segment operate resulted in better than expected performances. Impairment testing of these plants resulted in the impairment losses recorded in previous reporting periods to be reversed.
impairment testing for CGus containing goodwillThere were three CGUs containing goodwill in the current period, none in the prior period.
Media investmentThe recoverable amount of this CGU was based on value in use, estimated using discounted cash flows.
The fair value measurement was categorised as a Level 3 fair value based on the inputs in the valuation technique used (see note 2).
The key assumptions used in the estimation of the recoverable amount are set out below. The values assigned to the key assumptions represented management’s assessment of future trends in the relevant industries and were based on historical data from both external and internal sources.
In percent 2014
Discount rate 14,67
Terminal value growth rate 4,50
Budgeted EBITDA growth rate (average of the next five years) 9,40
The above key assumptions were calculated by an independent, external valuator, BDO Corporate Finance, when the purchase prise allocation was performed for this Media investment.
Budgeted earnings before interest after tax was estimated taking into account past experience, adjusted as follows:• Revenuegrowthwasprojectedtakingintoaccounttheaveragegrowthlevelsexperienceoverthepastfouryears.• Depreciationandamortisationwereaddedbackandexpectedcapitalexpenditureweredeductedtoobtainfreecash
flow forecast.• Enterprisevaluesfromstart-upbusinesseswereexcludedandthevalueofthesebusinessweretakenaszeroasthere
is no reliable historical information to base the valuations on.
The estimated recoverable amount of the CGU exceeded its carrying amount by approximately R471,2 million. Management has identified that a reasonable possible change in two key assumptions could cause the carrying amount to exceed the recoverable amount. The following table shows the amount by which these two assumptions would need to change individually for the estimated recoverable amount to be equal to the carrying amount.
In percent 2014
Discount rate 0,80
Budgeted EBITDA growth rate (1,45)
Branded product distribution investmentThe recoverable amount of this CGU was based on value in use, estimated using discounted cash flows.
The fair value measurement was categorised as a Level 3 fair value based on the inputs in the valuation technique used (see note 2).
The key assumptions used in the estimation of the recoverable amount are set out below. The values assigned to the key assumptions represented management’s assessment of future trends in the relevant industries and were based on historical data from both external and internal sources.
In percent 2014
Discount rate 7,41
Terminal value growth rate 4,50
Budgeted EBITDA growth rate (average of the next five years) 6
noteS to the financial StatementSFOR THE YEAR ENDED 31 MARCH (CONTINUED)
68
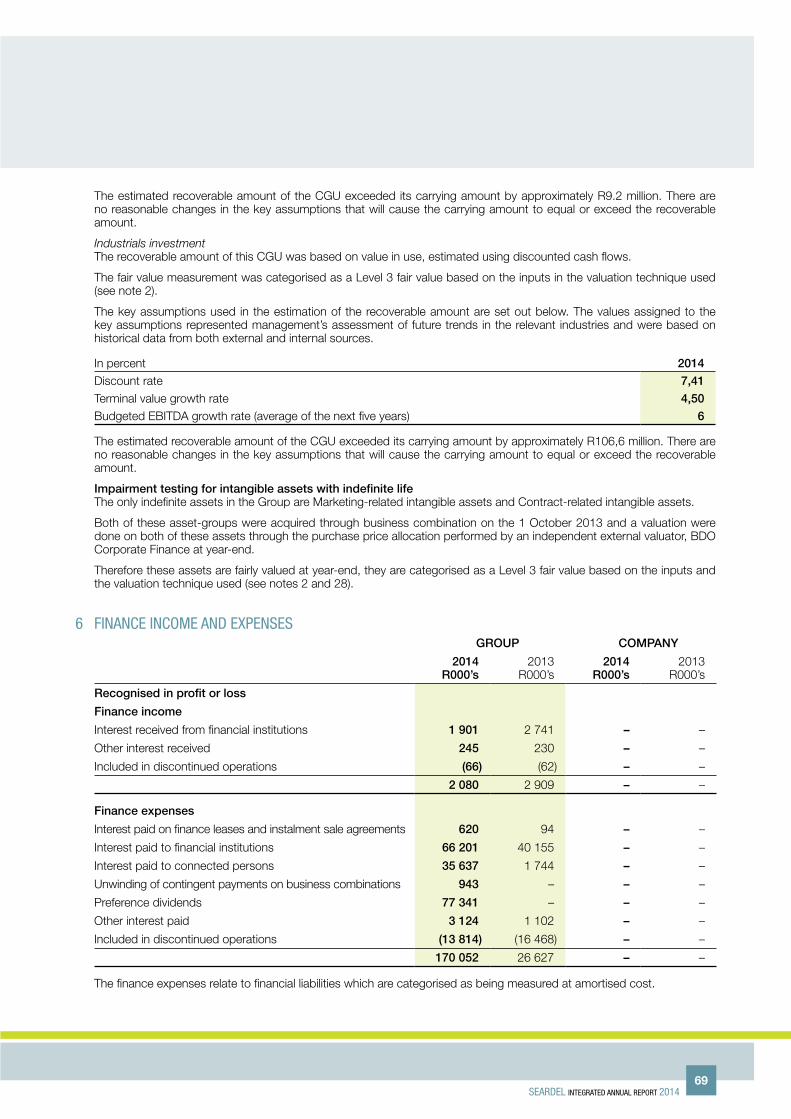
The estimated recoverable amount of the CGU exceeded its carrying amount by approximately R9.2 million. There are no reasonable changes in the key assumptions that will cause the carrying amount to equal or exceed the recoverable amount.
Industrials investmentThe recoverable amount of this CGU was based on value in use, estimated using discounted cash flows.
The fair value measurement was categorised as a Level 3 fair value based on the inputs in the valuation technique used (see note 2).
The key assumptions used in the estimation of the recoverable amount are set out below. The values assigned to the key assumptions represented management’s assessment of future trends in the relevant industries and were based on historical data from both external and internal sources.
In percent 2014
Discount rate 7,41
Terminal value growth rate 4,50
Budgeted EBITDA growth rate (average of the next five years) 6
The estimated recoverable amount of the CGU exceeded its carrying amount by approximately R106,6 million. There are no reasonable changes in the key assumptions that will cause the carrying amount to equal or exceed the recoverable amount.
impairment testing for intangible assets with indefinite lifeThe only indefinite assets in the Group are Marketing-related intangible assets and Contract-related intangible assets.
Both of these asset-groups were acquired through business combination on the 1 October 2013 and a valuation were done on both of these assets through the purchase price allocation performed by an independent external valuator, BDO Corporate Finance at year-end.
Therefore these assets are fairly valued at year-end, they are categorised as a Level 3 fair value based on the inputs and the valuation technique used (see notes 2 and 28).
6 finance income and expenSeSGROuP COmPany
2014R000’s
2013R000’s
2014R000’s
2013R000’s
Recognised in profit or loss
Finance income
Interest received from financial institutions 1 901 2 741 – –
Other interest received 245 230 – –
Included in discontinued operations (66) (62) – –
2 080 2 909 – –
Finance expenses
Interest paid on finance leases and instalment sale agreements 620 94 – –
Interest paid to financial institutions 66 201 40 155 – –
Interest paid to connected persons 35 637 1 744 – –
Unwinding of contingent payments on business combinations 943 – – –
Preference dividends 77 341 – – –
Other interest paid 3 124 1 102 – –
Included in discontinued operations (13 814) (16 468) – –
170 052 26 627 – –
The finance expenses relate to financial liabilities which are categorised as being measured at amortised cost.
Seardel integrated annual report 201469
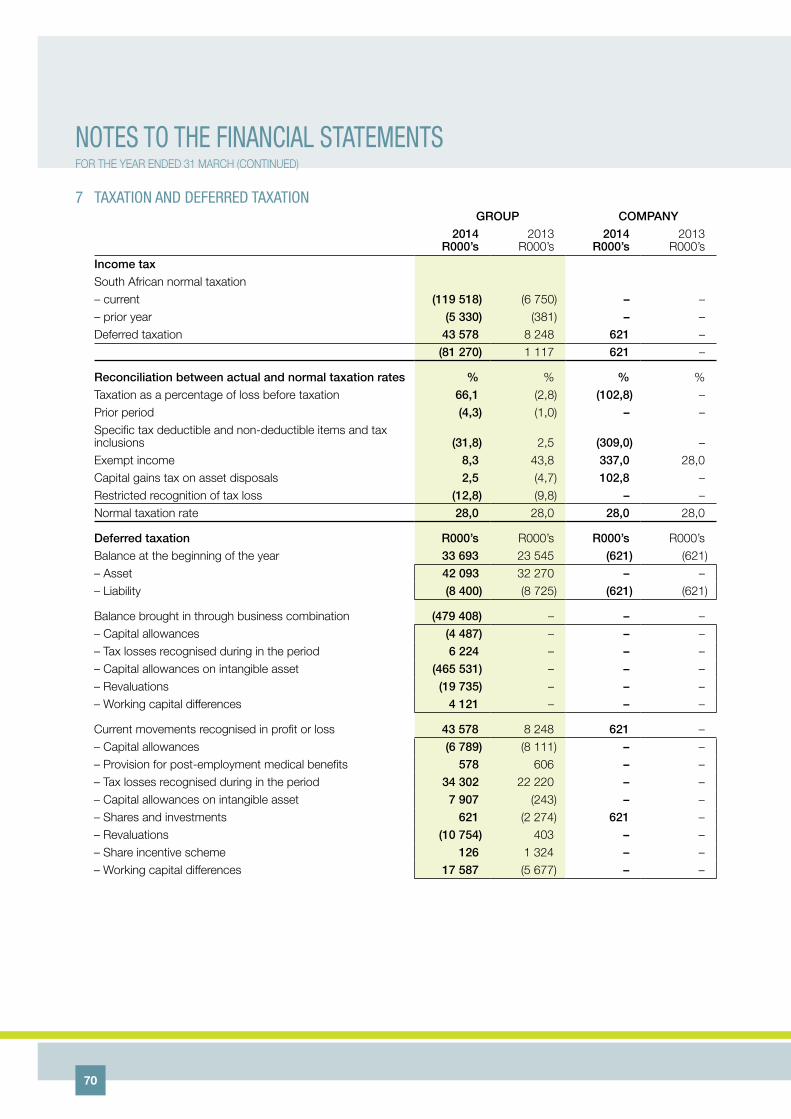
7 taxation and deferred taxation GROuP COmPany
2014R000’s
2013R000’s
2014R000’s
2013R000’s
income tax
South African normal taxation– current (119 518) (6 750) – – – prior year (5 330) (381) – – Deferred taxation 43 578 8 248 621 – (81 270) 1 117 621 –
Reconciliation between actual and normal taxation rates % % % %Taxation as a percentage of loss before taxation 66,1 (2,8) (102,8) – Prior period (4,3) (1,0) – – Specific tax deductible and non-deductible items and tax inclusions (31,8) 2,5 (309,0) – Exempt income 8,3 43,8 337,0 28,0 Capital gains tax on asset disposals 2,5 (4,7) 102,8 – Restricted recognition of tax loss (12,8) (9,8) – – Normal taxation rate 28,0 28,0 28,0 28,0
Deferred taxation R000’s R000’s R000’s R000’sBalance at the beginning of the year 33 693 23 545 (621) (621)– Asset 42 093 32 270 – – – Liability (8 400) (8 725) (621) (621)
Balance brought in through business combination (479 408) – – – – Capital allowances (4 487) – – – – Tax losses recognised during in the period 6 224 – – – – Capital allowances on intangible asset (465 531) – – – – Revaluations (19 735) – – – – Working capital differences 4 121 – – –
Current movements recognised in profit or loss 43 578 8 248 621 – – Capital allowances (6 789) (8 111) – – – Provision for post-employment medical benefits 578 606 – – – Tax losses recognised during in the period 34 302 22 220 – – – Capital allowances on intangible asset 7 907 (243) – – – Shares and investments 621 (2 274) 621 – – Revaluations (10 754) 403 – – – Share incentive scheme 126 1 324 – – – Working capital differences 17 587 (5 677) – –
noteS to the financial StatementSFOR THE YEAR ENDED 31 MARCH (CONTINUED)
70
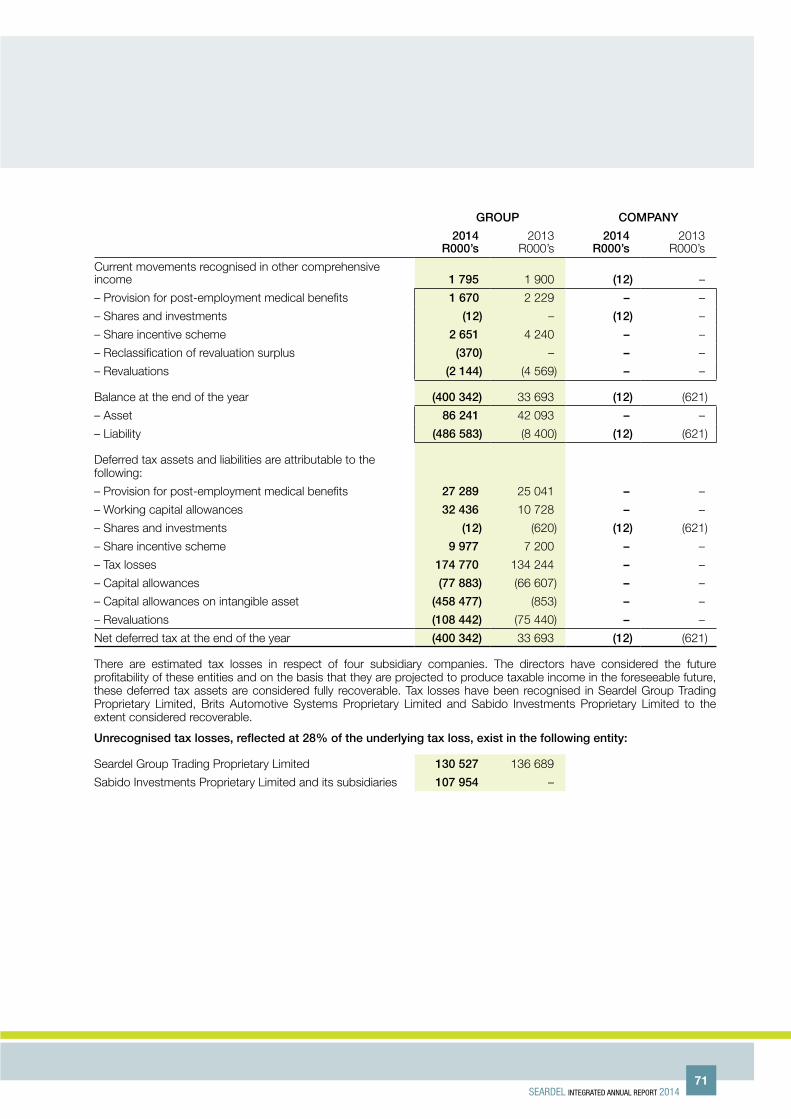
GROuP COmPany
2014R000’s
2013R000’s
2014R000’s
2013R000’s
Current movements recognised in other comprehensive income 1 795 1 900 (12) –
– Provision for post-employment medical benefits 1 670 2 229 – –
– Shares and investments (12) – (12) –
– Share incentive scheme 2 651 4 240 – –
– Reclassification of revaluation surplus (370) – – –
– Revaluations (2 144) (4 569) – –
Balance at the end of the year (400 342) 33 693 (12) (621)
– Asset 86 241 42 093 – –
– Liability (486 583) (8 400) (12) (621)
Deferred tax assets and liabilities are attributable to the following:
– Provision for post-employment medical benefits 27 289 25 041 – –
– Working capital allowances 32 436 10 728 – –
– Shares and investments (12) (620) (12) (621)
– Share incentive scheme 9 977 7 200 – –
– Tax losses 174 770 134 244 – –
– Capital allowances (77 883) (66 607) – –
– Capital allowances on intangible asset (458 477) (853) – –
– Revaluations (108 442) (75 440) – –
Net deferred tax at the end of the year (400 342) 33 693 (12) (621)
There are estimated tax losses in respect of four subsidiary companies. The directors have considered the future profitability of these entities and on the basis that they are projected to produce taxable income in the foreseeable future, these deferred tax assets are considered fully recoverable. Tax losses have been recognised in Seardel Group Trading Proprietary Limited, Brits Automotive Systems Proprietary Limited and Sabido Investments Proprietary Limited to the extent considered recoverable.
unrecognised tax losses, reflected at 28% of the underlying tax loss, exist in the following entity:
Seardel Group Trading Proprietary Limited 130 527 136 689
Sabido Investments Proprietary Limited and its subsidiaries 107 954 –
Seardel integrated annual report 201471

8 diScontinued operationSThe apparel manufacturing business has over the years been ravaged by the flood of cheap imports that have entered the market. To combat this the business has undertaken a number of restructuring initiatives to significantly reduce costs, improve trading margins and increase efficiencies. Despite these efforts the business has continued to make losses.
The directors have resolved to exit the Seardel Group’s apparel manufacturing business through the closure of its Western Cape and KwaZulu-Natal operations. Further to the notification of the proposed closures, and in an effort to protect local manufacturing capacity and the loss of over 2 000 jobs, Seardel sold the apparel manufacturing business to SACTWU. The sale consisted of all plant, equipment and inventory within the business, the effect of the sale on the financials noted below:
GROuP
Results of discontinued operations2014
R000’s2013
R000’s
Revenue 604 457 667 962
Operating loss before impairments and restructuring and retrenchment costs (66 659) (27 704)
Impairment of assets (4 617) –
Restructuring and retrenchment costs (43 617) (1 063)
Loss on sale of plant, equipment and inventory (31 260) –
Operating loss before finance costs (146 153) (28 767)
Finance income 66 62
Finance expenses (13 814) (16 468)
Loss before taxation (159 901) (45 173)
Income tax expense – –
Loss for the year from discontinued operations (159 901) (45 173)
effect of the sale of the apparel operations to SaCTWu on the financials
Book value of plant and equipment 43 204 –
Book value of inventory 95 644 –
Loss on sale (31 260) –
Purchase price 107 588 –
Loan advanced (30 957) –
Net receivable at year-end 76 631 –
Cash flows from/(used in) discontinued operations –
Net cash used in operating activities (41 305) (18 356)
Net cash from investing activities 7 061 (2 751)
net cash used in discontinued operations (34 244) (21 107)
The loss from discontinued operations is attributable entirely to equity holders of the parent.
noteS to the financial StatementSFOR THE YEAR ENDED 31 MARCH (CONTINUED)
72
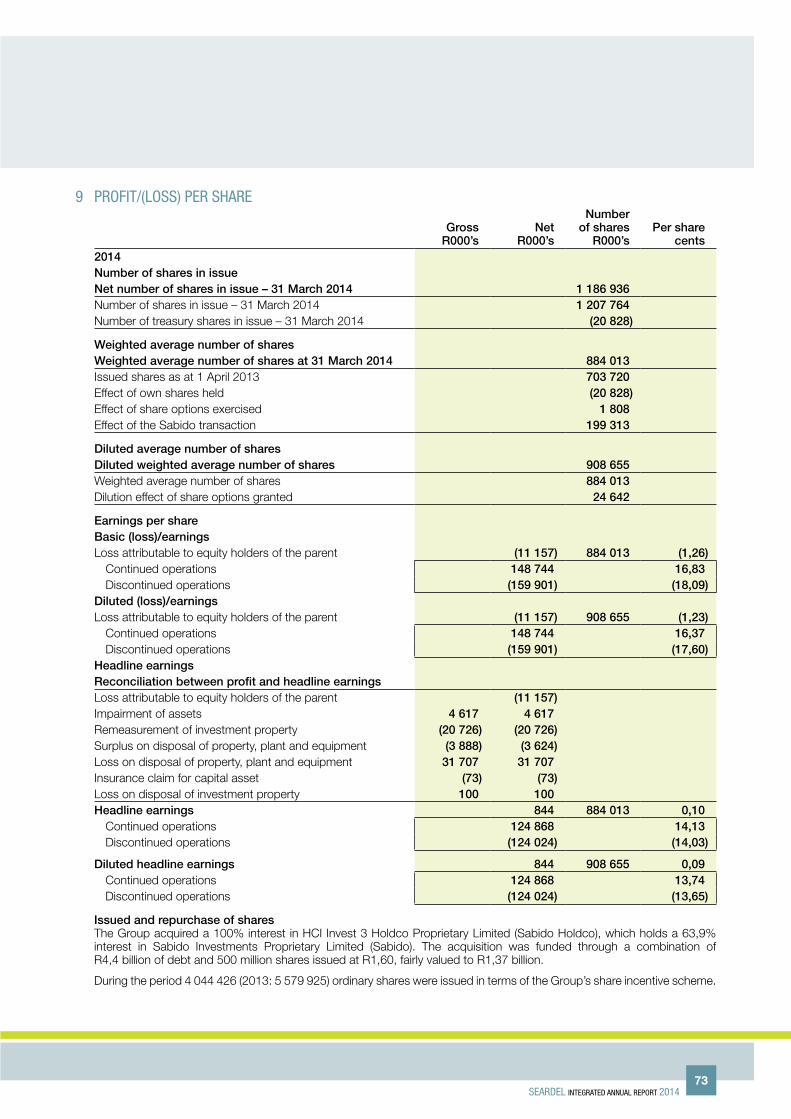
9 profit/(loSS) per Share
Gross
R000’snet
R000’s
numberof shares
R000’sPer share
cents2014number of shares in issuenet number of shares in issue – 31 march 2014 1 186 936 Number of shares in issue – 31 March 2014 1 207 764 Number of treasury shares in issue – 31 March 2014 (20 828)
Weighted average number of sharesWeighted average number of shares at 31 march 2014 884 013 Issued shares as at 1 April 2013 703 720 Effect of own shares held (20 828)Effect of share options exercised 1 808 Effect of the Sabido transaction 199 313
Diluted average number of sharesDiluted weighted average number of shares 908 655 Weighted average number of shares 884 013 Dilution effect of share options granted 24 642
earnings per shareBasic (loss)/earningsLoss attributable to equity holders of the parent (11 157) 884 013 (1,26)
Continued operations 148 744 16,83Discontinued operations (159 901) (18,09)
Diluted (loss)/earningsLoss attributable to equity holders of the parent (11 157) 908 655 (1,23)
Continued operations 148 744 16,37Discontinued operations (159 901) (17,60)
headline earningsReconciliation between profit and headline earningsLoss attributable to equity holders of the parent (11 157)Impairment of assets 4 617 4 617 Remeasurement of investment property (20 726) (20 726)Surplus on disposal of property, plant and equipment (3 888) (3 624)Loss on disposal of property, plant and equipment 31 707 31 707 Insurance claim for capital asset (73) (73)Loss on disposal of investment property 100 100 headline earnings 844 884 013 0,10
Continued operations 124 868 14,13Discontinued operations (124 024) (14,03)
Diluted headline earnings 844 908 655 0,09Continued operations 124 868 13,74Discontinued operations (124 024) (13,65)
issued and repurchase of shares The Group acquired a 100% interest in HCI Invest 3 Holdco Proprietary Limited (Sabido Holdco), which holds a 63,9% interest in Sabido Investments Proprietary Limited (Sabido). The acquisition was funded through a combination of R4,4 billion of debt and 500 million shares issued at R1,60, fairly valued to R1,37 billion.
During the period 4 044 426 (2013: 5 579 925) ordinary shares were issued in terms of the Group’s share incentive scheme.
Seardel integrated annual report 201473
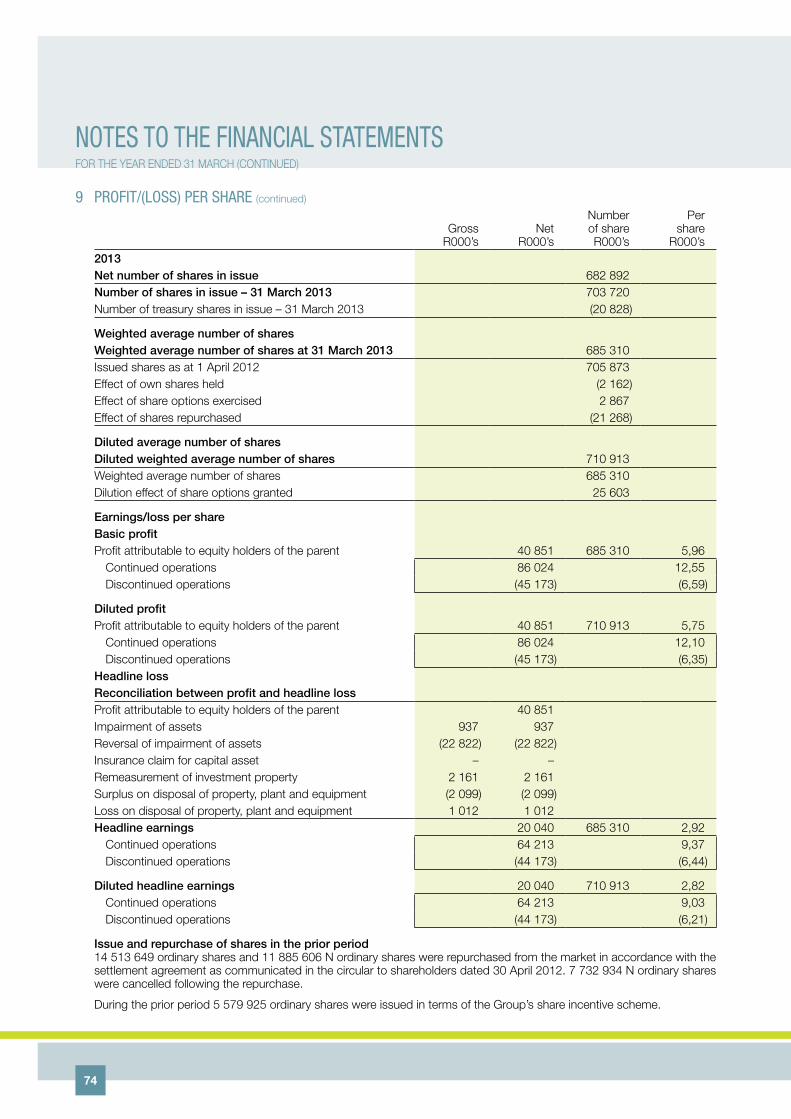
9 profit/(loSS) per Share (continued)
GrossR000’s
NetR000’s
Numberof shareR000’s
Pershare
R000’s2013net number of shares in issue 682 892 number of shares in issue – 31 march 2013 703 720 Number of treasury shares in issue – 31 March 2013 (20 828)
Weighted average number of sharesWeighted average number of shares at 31 march 2013 685 310 Issued shares as at 1 April 2012 705 873 Effect of own shares held (2 162)Effect of share options exercised 2 867 Effect of shares repurchased (21 268)
Diluted average number of sharesDiluted weighted average number of shares 710 913 Weighted average number of shares 685 310 Dilution effect of share options granted 25 603
earnings/loss per shareBasic profitProfit attributable to equity holders of the parent 40 851 685 310 5,96
Continued operations 86 024 12,55Discontinued operations (45 173) (6,59)
Diluted profitProfit attributable to equity holders of the parent 40 851 710 913 5,75
Continued operations 86 024 12,10Discontinued operations (45 173) (6,35)
headline lossReconciliation between profit and headline lossProfit attributable to equity holders of the parent 40 851 Impairment of assets 937 937 Reversal of impairment of assets (22 822) (22 822)Insurance claim for capital asset – – Remeasurement of investment property 2 161 2 161 Surplus on disposal of property, plant and equipment (2 099) (2 099)Loss on disposal of property, plant and equipment 1 012 1 012 headline earnings 20 040 685 310 2,92
Continued operations 64 213 9,37Discontinued operations (44 173) (6,44)
Diluted headline earnings 20 040 710 913 2,82Continued operations 64 213 9,03Discontinued operations (44 173) (6,21)
issue and repurchase of shares in the prior period14 513 649 ordinary shares and 11 885 606 N ordinary shares were repurchased from the market in accordance with the settlement agreement as communicated in the circular to shareholders dated 30 April 2012. 7 732 934 N ordinary shares were cancelled following the repurchase.
During the prior period 5 579 925 ordinary shares were issued in terms of the Group’s share incentive scheme.
noteS to the financial StatementSFOR THE YEAR ENDED 31 MARCH (CONTINUED)
74

10 property, plant and equipmentGROuP
Reconciliation of carrying amount Notes
Owner-occupied
propertiesat valuation
R000’s
Plant andmachinery
at cost R000’s
equipmentand fittings
at costR000’s
motor vehicles
at costR000’s
TotalR000’s
2014Cost/valuation at 31 march 2014 839 914 511 082 372 642 28 142 1 751 780 Opening balance 418 605 617 514 153 783 21 330 1 211 232 Additions 196 18 980 144 181 1 817 165 174 Acquisition through business combinations 28 504 196 10 621 144 900 11 826 671 543 Revaluations 18 429 – – – 18 429 Reclassification to investment property 11 (49 312) – – – (49 312)Reclassification to assets held for sale 18 (52 200) (551) – – (52 751)Disposals – (135 482) (70 222) (6 831) (212 535)accumulated depreciation and impairment at 31 march 2014 1 418 255 560 118 206 12 784 387 968 Opening balance – 327 377 114 968 14 406 456 751 Current period depreciation 4 326 24 829 59 712 3 717 92 584 Revaluations (2 908) – – – (2 908)Disposals and assets reclassified as held for sale – (96 646) (56 474) (5 339) (158 459)
Carrying value at 31 march 2014 838 496 255 522 254 436 15 358 1 363 812
Rate of (straight-line) depreciation 0 – 3,5% 4 – 7% 10 – 20% 20%Residual values 40 – 65% 0% 0% 20%
2013Cost/valuation at 31 march 2013 418 605 617 514 153 783 21 330 1 211 232 Opening balance 384 269 610 155 146 192 22 428 1 163 044 Additions 65 480 28 067 9 792 1 366 104 705 Revaluations 25 432 – – – 25 432 Reclassification to investment property (56 576) – – – (56 576)Disposals and assets reclassified as held for sale – (20 708) (2 201) (2 464) (25 373)accumulated depreciation and impairment at 31 march 2013 – 327 377 114 968 14 406 456 751 Opening balance – 347 809 105 875 14 312 467 996 Current year depreciation 2 712 21 691 9 964 1 878 36 245 Revaluations (2 626) – – – (2 626)Impairment – – 937 – 937 Reversal of impairment – (22 822) – – (22 822)Reclassification to investment property (86) – – – (86)Disposals and assets reclassified as held for sale – (19 301) (1 808) (1 784) (22 893)
Carrying value at 31 march 2013 418 605 290 137 38 815 6 924 754 481
Owner-occupied properties – cost less accumulated depreciationThe cost less accumulated depreciation of the owner-occupied properties is provided below. The allowed alternative method as described in IAS 16 is the revaluation model, which has been adopted by the Group.
GROuP2014
R000’s2013
R000’sCost 677 117 198 884 Accumulated depreciation 3 435 2 017 Carrying value 673 682 196 867
Reconciliation of cost of owner-occupied properties:Opening cost at the beginning of the year 198 884 176 246 Additions 196 65 480 Additions through business combination 504 196 –Disposals, transfers to investment property and assets reclassified as held for sale (26 159) (42 842)Closing cost at the end of the year 677 117 198 884
Seardel integrated annual report 201475

10 property, plant and equipment (continued)
Capitalised leased assets included in the above are: GROuP
Plant and machinery
R000’s
equipment and fittings
R000’s
motor vehicles
R000’sTotal
R000’s
2014
Cost 8 133 9 029 3 452 20 614
Accumulated depreciation 406 8 996 731 10 133
Carrying value at 31 march 2014 7 727 33 2 721 10 481
2013
Cost 131 8 993 1 337 10 461
Accumulated depreciation 50 8 993 328 9 371
Carrying value at 31 march 2013 81 – 1 009 1 090
impairment losses and subsequent reversal – plant and equipmentThe Group has performed impairment testing on all cash-generating units (CGUs) where there is an indication that they may be impaired. The recoverable amount of a CGU is determined based on a fair value less cost to sell, or value-in-use calculation as appropriate.
Value-in-use calculations use cash flow projections approved by management. These cash flow forecasts cover four years and the cash flows after the forecast period are extrapolated into the future over the useful life of the CGU using steady growth rates that are consistent with that of the industry and country.
In determining value in use projected cash flows are discounted using the entity’s weighted average cost of capital (WACC) adjusted for any risk that are not reflected in the underlying cash flows. WACC was calculated as 7,41% for the current period (2013: 9,5%).
Expected future cash flows are inherently uncertain and could materially change over time. They are significantly affected by a number of factors, including production estimates and economic factors such as commodity prices, discount rates, currency exchange rates and estimates of costs to produce. Management believes that any reasonably possible change in the key assumptions on which the recoverable amount is based would not cause the carrying amounts to exceed their recoverable amount.
Fair value has been determined by independent external valuers who have taken into account the current market conditions for the nature, age and condition of the assets involved.
Refer to note 5 for impairments and reversals.
noteS to the financial StatementSFOR THE YEAR ENDED 31 MARCH (CONTINUED)
76

measurement of fair value – owner-occupied propertiesFair value hierarchyThe fair value of owner-occupied property was determined by external, independent property valuers, having appropriate recognised professional qualifications and recent experience in the location and category of the property being valued. The independent valuers provide the fair value of the Group’s owner-occupied property portfolio on an annual basis. The valuation was done on 31 March 2014.
The fair value measurement of owner-occupied property of R838,5 million has been categorised as a Level 3 fair value based on the inputs to the valuation technique used (see note 2).
Level 3 fair valueThe following shows a reconciliation from the opening balances to the closing balances for Level 3 fair values:
R’000
Carrying value at 31 March 2013 418 605
Acquisitions and acquisitions through business combinations 504 392
Disposals, depreciation and reclassification to investment property and assets held for sale (105 838)
Revaluation straight through equity
– Changes in fair value 21 337
Carrying value at 31 March 2014 838 496
Valuation technique and significant unobservable inputs
valuation technique Significant unobservable inputs
interrelationship between key unobservable inputs and fair value measurements
Capitalisation of income: The valuation model considers the net operating income of the rent collected and dividing it by the capitalisation rate (investor’s rate of return), taking into account expected rental income and anticipated expenses for the next twelve months, the properties’ location, structure and rental-producing capacity of similar buildings in similar locations.
– Capitalisation rate– Occupation rate– Projected income
The estimated fair value would increase/(decrease) if:– capitalisation rate were higher
(lower) [see sensitivity analysis below];
– the occupancy rate were higher (lower); and
– projected income were higher (lower).
Sensitivity analysis on the fair value of owner-occupied buildingsThe capitalisation rates for the fair value of the properties were between 9% – 14,5%. The table below presents the sensitivity of the valuation on the carrying value of the owner-occupied property to changes in the capitalisation rate.
Carrying value
2014R’000
2013R’000
Increase of 1% in the capitalisation rate 780 958 385 888
Decrease of 1% in the capitalisation rate 908 237 457 558
Securitisation of assetsRefer to note 37 which relates to the securitisation pool for the benefit of the Group lenders.
Seardel integrated annual report 201477
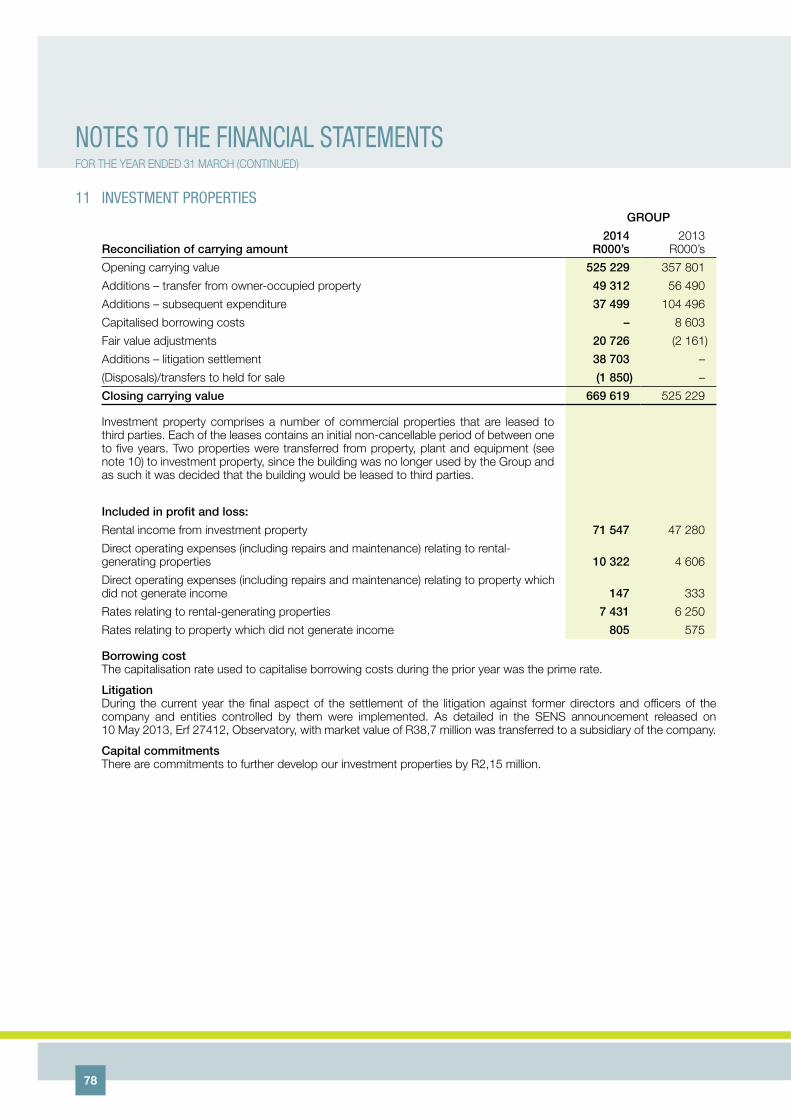
11 inveStment propertieSGROuP
Reconciliation of carrying amount2014
R000’s 2013
R000’s
Opening carrying value 525 229 357 801
Additions – transfer from owner-occupied property 49 312 56 490
Additions – subsequent expenditure 37 499 104 496
Capitalised borrowing costs – 8 603
Fair value adjustments 20 726 (2 161)
Additions – litigation settlement 38 703 –
(Disposals)/transfers to held for sale (1 850) –
Closing carrying value 669 619 525 229
Investment property comprises a number of commercial properties that are leased to third parties. Each of the leases contains an initial non-cancellable period of between one to five years. Two properties were transferred from property, plant and equipment (see note 10) to investment property, since the building was no longer used by the Group and as such it was decided that the building would be leased to third parties.
included in profit and loss:
Rental income from investment property 71 547 47 280
Direct operating expenses (including repairs and maintenance) relating to rental-generating properties 10 322 4 606
Direct operating expenses (including repairs and maintenance) relating to property which did not generate income 147 333
Rates relating to rental-generating properties 7 431 6 250
Rates relating to property which did not generate income 805 575
Borrowing costThe capitalisation rate used to capitalise borrowing costs during the prior year was the prime rate.
LitigationDuring the current year the final aspect of the settlement of the litigation against former directors and officers of the company and entities controlled by them were implemented. As detailed in the SENS announcement released on 10 May 2013, Erf 27412, Observatory, with market value of R38,7 million was transferred to a subsidiary of the company.
Capital commitmentsThere are commitments to further develop our investment properties by R2,15 million.
noteS to the financial StatementSFOR THE YEAR ENDED 31 MARCH (CONTINUED)
78

measurement of fair value – investment propertiesFair value hierarchyThe fair value of investment property was determined by external, independent property valuers, having appropriate recognised professional qualifications and recent experience in the location and category of the property being valued. The independent valuers provide the fair value of the Group’s investment property portfolio on an annual basis.
The fair value measurement of investment property of R670 million has been categorised as a Level 3 fair value based on the inputs to the valuation technique used (see note 2).
Level 3 fair valueThe following shows a reconciliation from the opening balances to the closing balances for Level 3 fair values:
R’000
Opening value at 31 March 2013 525 229
Acquisitions and reclassifications from property, plant and equipment 125 514
Reclassification to assets held for sale (1 850)
Gain included in “other income”
– Changes in fair value 20 726
Closing value at 31 March 2014 669 619
Valuation technique and significant unobservable inputs
valuation technique Significant unobservable inputs
interrelationship between key unobservable inputs and fair value measurements
Capitalisation of income: The valuation model considers the net operating income of the rent collected and dividing it by the capitalisation rate (investor’s rate of return), taking into account expected rental income and anticipated expenses for the next twelve months, the properties’ location, structure and rental-producing capacity of similar buildings in similar locations.
– Capitalisation rate
– Occupation rate
– Projected income
The estimated fair value would increase/(decrease) if:– capitalisation rate were higher
(lower) [see sensitivity analysis below];
– the occupancy rate were higher (lower); and
– projected income were higher (lower).
Sensitivity analysis on the fair value of investment buildingsThe capitalisation rates for the fair value of the properties were between 9% – 14,5%. The table below presents the sensitivity of the valuation on the carrying value of the investment property to changes in the capitalisation rate.
Carrying value
2014R’000
2013R’000
Increase of 1% in the capitalisation rate 612 081 483 487
Decrease of 1% in the capitalisation rate 738 946 575 481
Securitisation of assetsRefer to note 37 which relates to the securitisation pool for the benefit of the Group lenders.
Seardel integrated annual report 201479

12 intangiBle aSSetS
Notes
marketing-related
intangible assetsR000’s
Customer-related
intangible assetsR000’s
Contract-related
intangible assetsR000’s
SoftwareR000’s
LicencesR000’s
music libraries
R000’s
Programm-ing under develop-
mentR000’s
Website domainR000’s
electronic programming guide
R000’s
Distribution rights
R000’s Total
R000’s
Cost at 31 march 2014 1 938 758 435 902 128 197 5 919 11 499 1 474 74 633 97 2 353 294 366 2 893 198
Opening balance – – – 14 046 7 000 – – – – – 21 046
Assets acquired separately – – – 572 4 499 – – – – 70 570 75 641
Disposals and assets reclassified as held for sale – – – (8 699) – – – – – – (8 699)
Assets acquired through business combinations 28 1 938 758 435 902 128 197 – – 1 474 74 633 97 2 353 223 796 2 805 210
accumulated amortisation and impairment at 31 march 2014 – 40 048 – 3 387 4 834 73 3 867 – – 23 755 75 964
Opening balance – – – 4 563 3 453 – – – – – 8 016
Current period amortisation – 40 048 – 2 906 1 381 73 3 867 – – 23 755 72 030
Disposals and assets reclassified as held for sale – – – (8 699) – – – – – – (8 699)
Impairment losses recognised in profit and loss 5 – – – 4 617 – – – – – – 4 617
Carrying value at 31 march 2014 1 938 758 395 854 128 197 2 532 6 665 1 401 70 766 97 2 353 270 611 2 817 234
Nature of useful lives Indefinite Finite Indefinite Finite Finite Finite Finite Indefinite Indefinite Finite
Amortisation method n/a Straight line n/a Straight line Straight line Straight line Revenue- based
n/a n/a Revenue- based
Rate of amortisation n/a 37% – 10% n/a 20% Period of licence
10% Period of economic life
n/a n/a Period of economic life
Residual values 0% 0% 0% 0% 0% 0% 0% 0%
* Relates to software
Cost at 31 march 2013 – – – 14 046 7 000 – – – – – 21 046
Opening balance – – – 11 576 2 500 – – – – – 14 076
Assets acquired separately – – – 2 470 4 500 – – – – – 6 970
accumulated amortisation and impairment at 31 march 2013 – – – 4 563 3 453 – – – – – 8 016
Opening balance – – – 2 059 1 454 – – – – – 3 513
Current period amortisation – – – 2 504 1 999 – – – – – 4 503
Carrying value at 31 march 2013 – – – 9 483 3 547 – – – – – 13 030
The amortisation of intangible assets is included in the following line items in the statement of comprehensive income:
2014R000’s
2013R000’s
Cost of revenue – –
Distribution costs 953 1 454
Administrative and other expenses 71 077 3 049
72 030 4 503
noteS to the financial StatementSFOR THE YEAR ENDED 31 MARCH (CONTINUED)
80
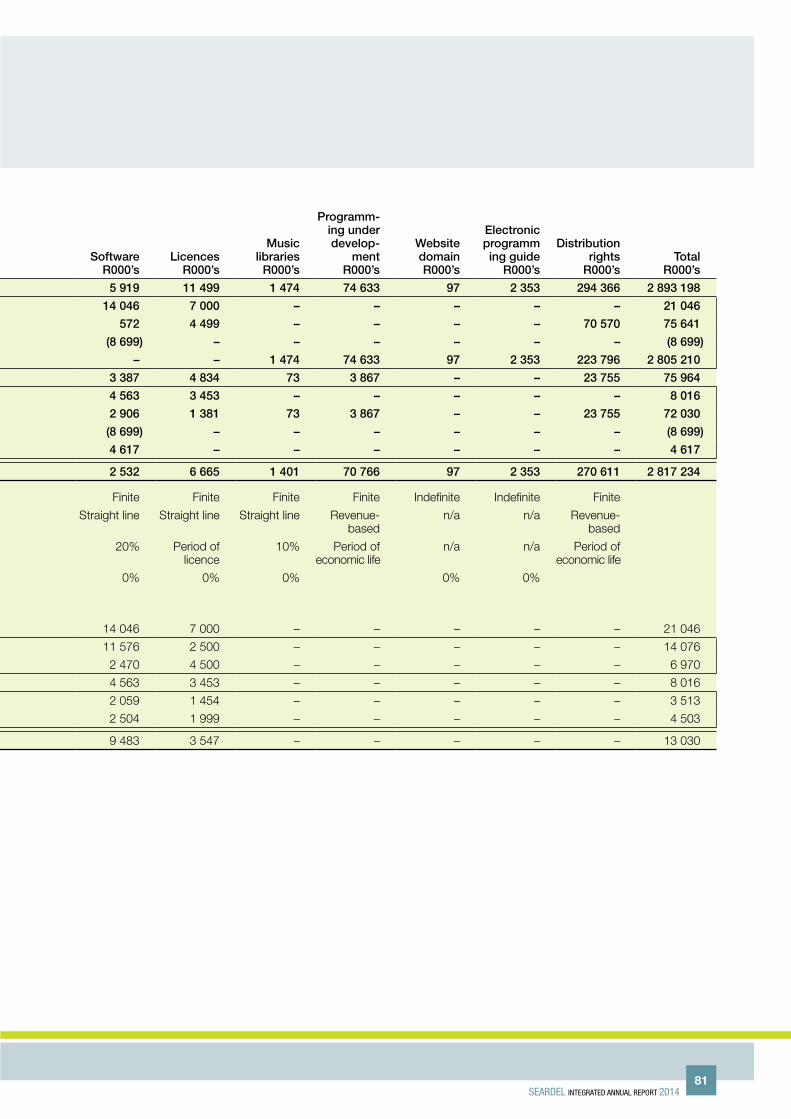
12 intangiBle aSSetS
Notes
marketing-related
intangible assetsR000’s
Customer-related
intangible assetsR000’s
Contract-related
intangible assetsR000’s
SoftwareR000’s
LicencesR000’s
music libraries
R000’s
Programm-ing under develop-
mentR000’s
Website domainR000’s
electronic programming guide
R000’s
Distribution rights
R000’s Total
R000’s
Cost at 31 march 2014 1 938 758 435 902 128 197 5 919 11 499 1 474 74 633 97 2 353 294 366 2 893 198
Opening balance – – – 14 046 7 000 – – – – – 21 046
Assets acquired separately – – – 572 4 499 – – – – 70 570 75 641
Disposals and assets reclassified as held for sale – – – (8 699) – – – – – – (8 699)
Assets acquired through business combinations 28 1 938 758 435 902 128 197 – – 1 474 74 633 97 2 353 223 796 2 805 210
accumulated amortisation and impairment at 31 march 2014 – 40 048 – 3 387 4 834 73 3 867 – – 23 755 75 964
Opening balance – – – 4 563 3 453 – – – – – 8 016
Current period amortisation – 40 048 – 2 906 1 381 73 3 867 – – 23 755 72 030
Disposals and assets reclassified as held for sale – – – (8 699) – – – – – – (8 699)
Impairment losses recognised in profit and loss 5 – – – 4 617 – – – – – – 4 617
Carrying value at 31 march 2014 1 938 758 395 854 128 197 2 532 6 665 1 401 70 766 97 2 353 270 611 2 817 234
Nature of useful lives Indefinite Finite Indefinite Finite Finite Finite Finite Indefinite Indefinite Finite
Amortisation method n/a Straight line n/a Straight line Straight line Straight line Revenue- based
n/a n/a Revenue- based
Rate of amortisation n/a 37% – 10% n/a 20% Period of licence
10% Period of economic life
n/a n/a Period of economic life
Residual values 0% 0% 0% 0% 0% 0% 0% 0%
* Relates to software
Cost at 31 march 2013 – – – 14 046 7 000 – – – – – 21 046
Opening balance – – – 11 576 2 500 – – – – – 14 076
Assets acquired separately – – – 2 470 4 500 – – – – – 6 970
accumulated amortisation and impairment at 31 march 2013 – – – 4 563 3 453 – – – – – 8 016
Opening balance – – – 2 059 1 454 – – – – – 3 513
Current period amortisation – – – 2 504 1 999 – – – – – 4 503
Carrying value at 31 march 2013 – – – 9 483 3 547 – – – – – 13 030
The amortisation of intangible assets is included in the following line items in the statement of comprehensive income:
2014R000’s
2013R000’s
Cost of revenue – –
Distribution costs 953 1 454
Administrative and other expenses 71 077 3 049
72 030 4 503
Seardel integrated annual report 201481

13 programming rightSReconciliation of carrying amount
Television programmes
Opening balanceR000’s
additions through
businesscombination*
R000’sadditions
R000’samortisation
R000’s
Closing balanceR000’s
International – 279 867 32 918 (69 746) 243 039 Local – 110 732 27 045 (98 134) 39 643
– 390 599 59 963 (167 880) 282 682
* Refer to note 28.
nature of useful lives and amortisation methodProgramming rights acquired by the Group are initially measured at cost and are amortised over the number of licensed broadcasting runs. For features on first run 70% of the cost is amortised and the remaining 30% over the balance of the licensed broadcasting runs. For genres other than features the cost is amortised on the first run.
14 intereSt in SuBSidiarieSCOmPany
2014R000’s
2013R000’s
Shares at cost, less impairment 2 271 407 1 150 005 Loans from subsidiary companies – (359 718)Loans to subsidiary companies 557 993 908 251
2 829 400 1 698 538
In the main these loans are subordinated, interest free and there are no fixed terms of repayment.
There is no management intention to recall these loans in the foreseeable future.
Securitisation of assetsRefer to note 37 which relates to the securitisation pool for the benefit of the Group lenders.
15 other inveStmentSGROuP COmPany
2014R000’s
2013R000’s
2014R000’s
2013R000’s
Business Partners Limited (unlisted) 3 329 3 329 – 3 329 Old Mutual (listed) 315 251 315 251
3 644 3 580 315 3 580
number of shares
Number of shares
number of shares
Number of shares
Business Partners Limited (unlisted) 605 220 605 220 – 605 220Old Mutual (listed) 8 900 8 900 8 900 8 900
Investments are classified as available for sale and are reconciled as follows:Opening balance 3 580 3 329 3 580 3 329 Acquisition – 251 – 251 Disposals – – (3 329) – Revaluations 64 – 64 – Closing balance 3 644 3 580 315 3 580
Securitisation of assets Refer to note 37 which relates to the securitisation pool for the benefit of the Group lenders.
noteS to the financial StatementSFOR THE YEAR ENDED 31 MARCH (CONTINUED)
82

16 equity-accounted inveSteeSGROuP COmPany
Reconciliation of investments in associates Note2014
R000’s 2013
R000’s 2014
R000’s 2013
R000’s
Interest in associates 132 698 – – –
Opening balance – – – –
Acquired through business combination 28 131 364 – – –
Increase in loans to associates 6 702 – – –
Losses for the year (5 367) – – –
Closing balance 132 698 – – –
The Group acquired a number of individual associates through a business acquisition.
List of investments in associates GROuP
name of company
Place ofbusiness/country of incorporation
Listed/Unlisted
2014 2013
% holding
Carrying amount
R000’s %
holding
Carrying amount
R000’s
Cape Town Film Studios Proprietary Limited South Africa Unlisted 42,5 45 240 – –
Dreamworld Management Company Proprietary Limited South Africa Unlisted 50,0 47 559 – –
Global Media Alliance Broadcasting Limited Ghana Unlisted 40,0 40 344 – –
Mindset TV Proprietary Limited South Africa Unlisted 49,9 (445) – –
Closing balance 132 698 – –
main business and operations of the associatesCape Town Film Studios Proprietary Limited is in the process of building sound stages and support buildings for the film industry in the Western Cape.
Dreamworld Management Company Proprietary Limited will develop residential accommodation in future, adjacent to the Cape Town Film Studio site.
Global Media Alliance Broadcasting Limited is a company incorporated in Ghana and has interests in television and radio broadcasting.
Mindset TV Proprietary Limited is a television channel which produced educational television programming.
The company’s subsidiary, Sabido Investments Proprietary Limited, has signed a surety and a cession of a loan receivable from Cape Town Film Studios Proprietary Limited in favour of Absa Bank Limited. The loan amounted to R63,7 million.
The company’s subsidiary, Sabido Investments Proprietary Limited, has signed surety and a cession of loan receivable from Dreamworld Management Company Proprietary Limited in favour Absa Bank Limited. The loan amounted to R10,3 million.
Seardel integrated annual report 201483
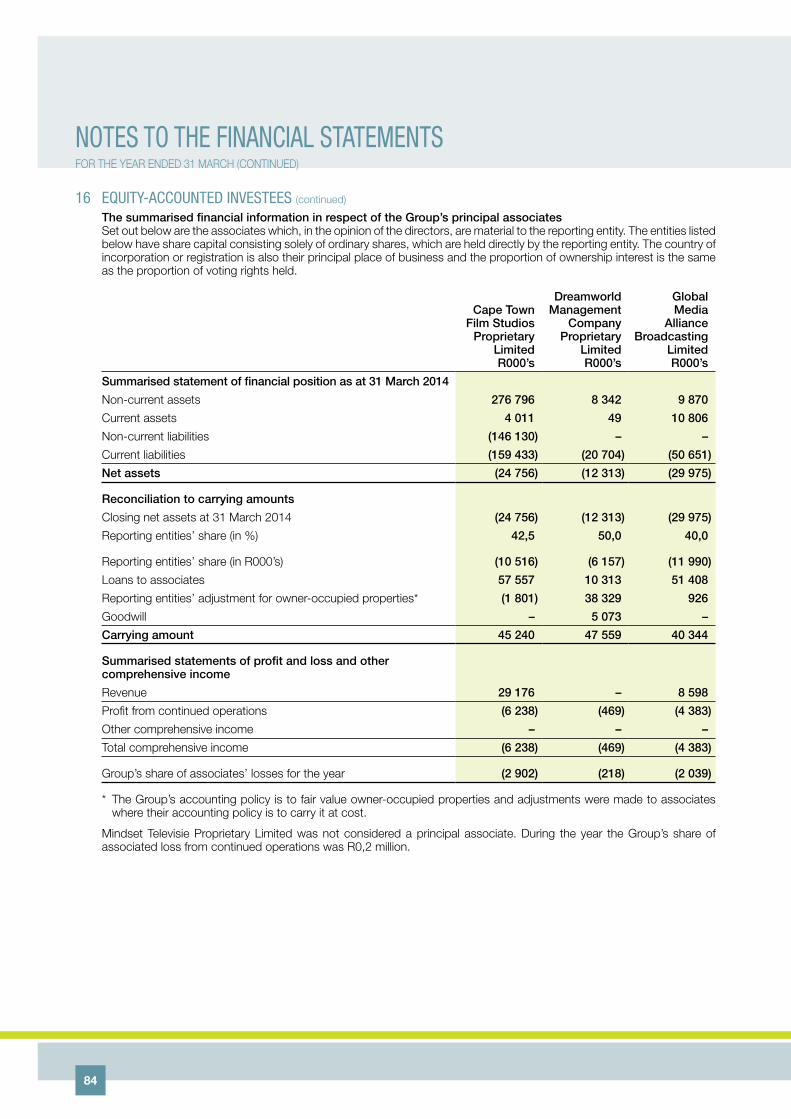
16 equity-accounted inveSteeS (continued)
The summarised financial information in respect of the Group’s principal associatesSet out below are the associates which, in the opinion of the directors, are material to the reporting entity. The entities listed below have share capital consisting solely of ordinary shares, which are held directly by the reporting entity. The country of incorporation or registration is also their principal place of business and the proportion of ownership interest is the same as the proportion of voting rights held.
Cape Town Film Studios
Proprietary Limited R000’s
Dreamworld management
Company Proprietary
Limited R000’s
Global media
alliance Broadcasting
Limited R000’s
Summarised statement of financial position as at 31 march 2014
Non-current assets 276 796 8 342 9 870
Current assets 4 011 49 10 806
Non-current liabilities (146 130) – –
Current liabilities (159 433) (20 704) (50 651)
net assets (24 756) (12 313) (29 975)
Reconciliation to carrying amounts
Closing net assets at 31 March 2014 (24 756) (12 313) (29 975)
Reporting entities’ share (in %) 42,5 50,0 40,0
Reporting entities’ share (in R000’s) (10 516) (6 157) (11 990)
Loans to associates 57 557 10 313 51 408
Reporting entities’ adjustment for owner-occupied properties* (1 801) 38 329 926
Goodwill – 5 073 –
Carrying amount 45 240 47 559 40 344
Summarised statements of profit and loss and other comprehensive income
Revenue 29 176 – 8 598
Profit from continued operations (6 238) (469) (4 383)
Other comprehensive income – – –
Total comprehensive income (6 238) (469) (4 383)
Group’s share of associates’ losses for the year (2 902) (218) (2 039)
* The Group’s accounting policy is to fair value owner-occupied properties and adjustments were made to associates where their accounting policy is to carry it at cost.
Mindset Televisie Proprietary Limited was not considered a principal associate. During the year the Group’s share of associated loss from continued operations was R0,2 million.
noteS to the financial StatementSFOR THE YEAR ENDED 31 MARCH (CONTINUED)
84
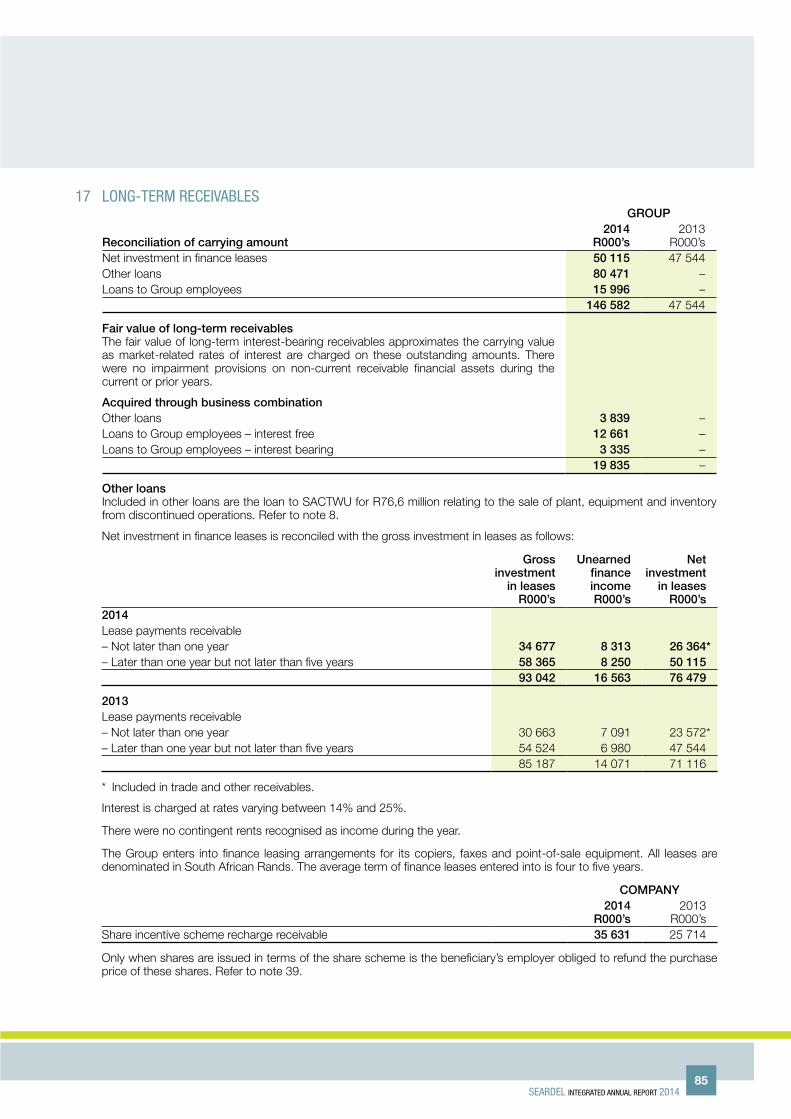
17 long-term receivaBleSGROuP
Reconciliation of carrying amount2014
R000’s 2013
R000’s Net investment in finance leases 50 115 47 544 Other loans 80 471 – Loans to Group employees 15 996 – 146 582 47 544
Fair value of long-term receivablesThe fair value of long-term interest-bearing receivables approximates the carrying value as market-related rates of interest are charged on these outstanding amounts. There were no impairment provisions on non-current receivable financial assets during the current or prior years.
acquired through business combinationOther loans 3 839 – Loans to Group employees – interest free 12 661 – Loans to Group employees – interest bearing 3 335 – 19 835 –
Other loansIncluded in other loans are the loan to SACTWU for R76,6 million relating to the sale of plant, equipment and inventory from discontinued operations. Refer to note 8.
Net investment in finance leases is reconciled with the gross investment in leases as follows:
Gross investment
in leasesR000’s
unearned finance incomeR000’s
net investment
in leasesR000’s
2014Lease payments receivable– Not later than one year 34 677 8 313 26 364* – Later than one year but not later than five years 58 365 8 250 50 115 93 042 16 563 76 479
2013Lease payments receivable– Not later than one year 30 663 7 091 23 572* – Later than one year but not later than five years 54 524 6 980 47 544 85 187 14 071 71 116
* Included in trade and other receivables.
Interest is charged at rates varying between 14% and 25%.
There were no contingent rents recognised as income during the year.
The Group enters into finance leasing arrangements for its copiers, faxes and point-of-sale equipment. All leases are denominated in South African Rands. The average term of finance leases entered into is four to five years.
COmPany2014
R000’s 2013
R000’s Share incentive scheme recharge receivable 35 631 25 714
Only when shares are issued in terms of the share scheme is the beneficiary’s employer obliged to refund the purchase price of these shares. Refer to note 39.
Seardel integrated annual report 201485
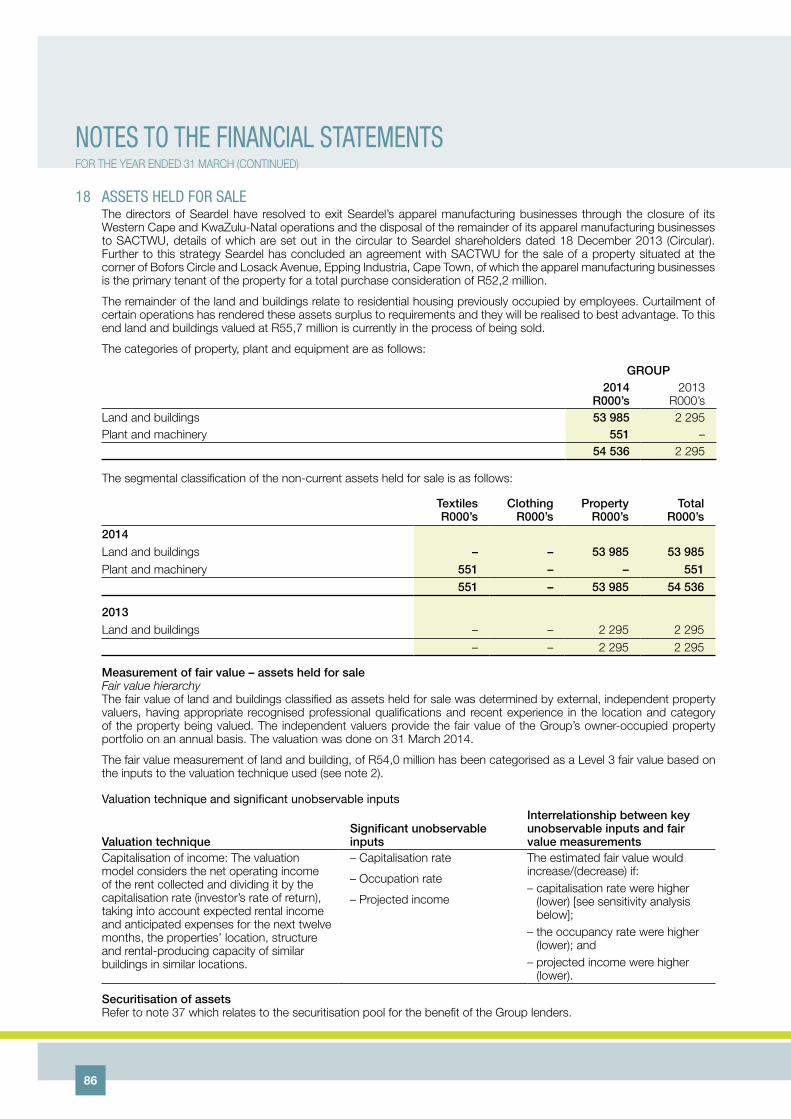
noteS to the financial StatementSFOR THE YEAR ENDED 31 MARCH (CONTINUED)
18 aSSetS held for SaleThe directors of Seardel have resolved to exit Seardel’s apparel manufacturing businesses through the closure of its Western Cape and KwaZulu-Natal operations and the disposal of the remainder of its apparel manufacturing businesses to SACTWU, details of which are set out in the circular to Seardel shareholders dated 18 December 2013 (Circular). Further to this strategy Seardel has concluded an agreement with SACTWU for the sale of a property situated at the corner of Bofors Circle and Losack Avenue, Epping Industria, Cape Town, of which the apparel manufacturing businesses is the primary tenant of the property for a total purchase consideration of R52,2 million.
The remainder of the land and buildings relate to residential housing previously occupied by employees. Curtailment of certain operations has rendered these assets surplus to requirements and they will be realised to best advantage. To this end land and buildings valued at R55,7 million is currently in the process of being sold.
The categories of property, plant and equipment are as follows:
GROuP2014
R000’s 2013
R000’s Land and buildings 53 985 2 295 Plant and machinery 551 – 54 536 2 295
The segmental classification of the non-current assets held for sale is as follows:
TextilesR000’s
ClothingR000’s
PropertyR000’s
TotalR000’s
2014
Land and buildings – – 53 985 53 985
Plant and machinery 551 – – 551
551 – 53 985 54 536
2013
Land and buildings – – 2 295 2 295 – – 2 295 2 295
measurement of fair value – assets held for saleFair value hierarchyThe fair value of land and buildings classified as assets held for sale was determined by external, independent property valuers, having appropriate recognised professional qualifications and recent experience in the location and category of the property being valued. The independent valuers provide the fair value of the Group’s owner-occupied property portfolio on an annual basis. The valuation was done on 31 March 2014.
The fair value measurement of land and building, of R54,0 million has been categorised as a Level 3 fair value based on the inputs to the valuation technique used (see note 2).
Valuation technique and significant unobservable inputs
valuation technique Significant unobservable inputs
interrelationship between key unobservable inputs and fair value measurements
Capitalisation of income: The valuation model considers the net operating income of the rent collected and dividing it by the capitalisation rate (investor’s rate of return), taking into account expected rental income and anticipated expenses for the next twelve months, the properties’ location, structure and rental-producing capacity of similar buildings in similar locations.
– Capitalisation rate
– Occupation rate
– Projected income
The estimated fair value would increase/(decrease) if:– capitalisation rate were higher
(lower) [see sensitivity analysis below];
– the occupancy rate were higher (lower); and
– projected income were higher (lower).
Securitisation of assetsRefer to note 37 which relates to the securitisation pool for the benefit of the Group lenders.
86
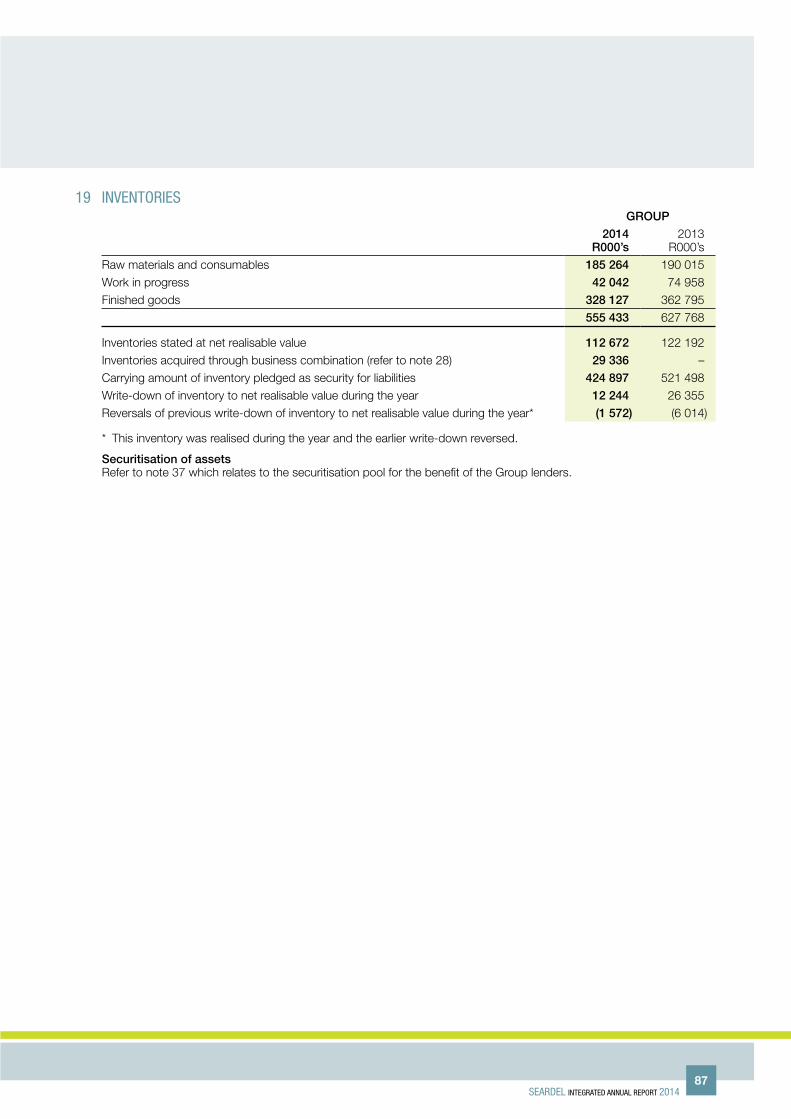
19 inventorieSGROuP
2014R000’s
2013R000’s
Raw materials and consumables 185 264 190 015 Work in progress 42 042 74 958 Finished goods 328 127 362 795 555 433 627 768
Inventories stated at net realisable value 112 672 122 192 Inventories acquired through business combination (refer to note 28) 29 336 –Carrying amount of inventory pledged as security for liabilities 424 897 521 498 Write-down of inventory to net realisable value during the year 12 244 26 355 Reversals of previous write-down of inventory to net realisable value during the year* (1 572) (6 014)
* This inventory was realised during the year and the earlier write-down reversed.
Securitisation of assetsRefer to note 37 which relates to the securitisation pool for the benefit of the Group lenders.
Seardel integrated annual report 201487

noteS to the financial StatementSFOR THE YEAR ENDED 31 MARCH (CONTINUED)
20 trade and other receivaBleSGROuP COmPany
Reconciliation of carrying value2014
R000’s 2013
R000’s 2014
R000’s 2013
R000’s
Trade receivables 790 311 408 955 – –
Lease receivables 26 364 23 572 – –
Other receivables 140 101 57 808 – –
Fair value of outstanding foreign exchange contracts 12 410 186 – –
Prepayments 55 564 14 267 – –
1 024 750 504 788 – –
Business acquisition
Trade and other receivables acquired through business combination refer to note 28 601 499 –
Other receivables
Included under other receivables are:
Income receivable from Production Incentive programme 33 875 39 456
Loans and receivables
Malik Investments Proprietary Limited 42 616 –
The loan arose on the sale of Viamedia Proprietary Limited and is secured by a deed of suretyship in favour of Sabido Investments Proprietary Limited, a subsidiary of the company. The loan bears interest at prime less 3% and is repayable in biannual instalments commencing on 1 April 2011 and the last instalment on 30 September 2015.
Cinecom LLC trading as 13 Films 5 324 –
The loan bears interest at 8,25% and has no terms of repayment.
TVPC Media Proprietary Limited 3 261 –
The loan bears interest at 0% and has no terms of repayment.
Lease-smoothing asset* 12 653 –
VAT 19 722 17 677
* Lease-smoothing asset of R7,9 million was included under trade receivables in 2013.
Securitisation of assetsRefer to note 37 which relates to the securitisation pool for the benefit of the Group lenders.
88

21 Stated capital/Share capital and Share premiumGROuP anD COmPany
2014R000’s
2013*R000’s
authorised
700 000 000 (2013: 700 000 000) ordinary shares of R0 each (2013: 25 cents each) – –
Each ordinary share has the right to 100 votes at general meetings
10 550 000 000 (2013: 200 000 000) N ordinary shares of R0 each (2013: 0,25 cent each) – –
Each N ordinary share has the right to one vote at general meetings.
issued stated capital
646 531 227 (2013: 642 486 801) ordinary shares of R0 each 322 089 311 816
Balance at the beginning of the year 642 486 801 (2013: 636 906 876) 311 816 304 261
Issued during the year: 4 044 426 (2013: 5 579 925) 10 273 7 555
561 233 077 (2013: 61 233 077) N ordinary shares of R0 each 1 370 340 340
Balance at the beginning of the year 61 233 077 (2013: 68 966 011) 340 359
Cancellation of shares during the year: 0 (2013: 7 732 934) – (19)
Issued during the year: 500 000 000 1 370 000 –
1 692 429 312 156
Reserved under options – see note 3963 500 000 ordinary shares of 0 cent each have been placed under the control of the directors, who are authorised to allot and issue all or any of such shares in accordance with the terms and conditions of The Seardel Long-Term Incentive Plan and any amendments thereto.
The remainder of the unissued shares are under the control of the directors until the next annual general meeting.
Stated capitalThe shareholders of the company have approved the conversion of the ordinary shares and N ordinary shares having a par value to ordinary shares and N ordinary shares having no par value at a general meeting of the company held on 8 August 2013. Share capital and share premium have therefore been restated to stated capital.
issue and repurchase of sharesCurrent periodThe Group acquired a 100% interest in HCI Invest 3 Holdco Proprietary Limited (Sabido Holdco), which holds a 63,9% interest in Sabido Investment (Pty) Ltd (Sabido). The acquisition was funded through a combination of R4,4 billion of debt and 500 million N ordinary shares issued at R1,60, fairly valued to R1,37 billion.
During the period 4 044 426 ordinary shares were issued in terms of the Group’s share incentive scheme.
Prior period14 513 649 ordinary shares and 11 885 606 N ordinary shares were repurchased from the market in accordance with the settlement agreement as communicated in the circular to shareholders dated 30 April 2012. 7 732 934 N ordinary shares were cancelled following the repurchase.
During the prior period 5 579 925 ordinary shares were issued in terms of the Group’s share incentive scheme.
Diluted weighted average number of sharesThe difference between the weighted average number of shares and the diluted weighted average number of shares are due to the impact of the unexercised options under the Group’s share incentive scheme.
* Restated, refer to note 36.
Seardel integrated annual report 201489

noteS to the financial StatementSFOR THE YEAR ENDED 31 MARCH (CONTINUED)
22 treaSury ShareSSeardel Investment Corporation Limited shares are held by:
GROuP
number of shares
2014R000’s
2013R000’s
2014000’s
2013000’s
Seardel Group Trading Proprietary Limited
Ordinary shares
Balance at the beginning and the end of the year 13 140 1 384 14 705 191
Share repurchases – 11 756 – 14 514
Balance at the end of the period 13 140 13 140 14 705 14 705
n Ordinary shares
Balance at the beginning and the end of the year 4 654 13 226 6 123 1 971
Share repurchases – 9 034 – 11 885
Cancellation of shares – (17 606) – (7 733)
Balance at the end of the year 4 654 4 654 6 123 6 123
Total at the end of the year 17 794 17 794 20 828 20 828
90

23 poSt-employment medical aid BenefitSGeneral description of planThe post-employment subsidy policy is summarised below:• Qualifyingmedicalschemememberswhojoinedthecompanybefore1July1996areeligiblefora50%retirement
subsidy of their total medical scheme contributions.• Dependantsofeligiblecontinuationmembersreceiveasubsidybeforeandafterthedeathoftheprincipalmember.• Ifamembereligible fora retirementsubsidydies inservice theirdependantsareeligible forasubsidyofmedical
scheme contributions as described above.
2014000’s
2013000’s
amounts recognised in the statement of comprehensive income:
Current service cost 444 482
Interest on the obligation 7 654 6 523
Total included in staff costs 8 098 7 005
Reconciliations in the net liability recognised in the statement of financial position are as follows:
Liability at the beginning of the year 89 433 79 307
Net expense recognised in profit or loss 8 098 7 005
Contributions from employer (6 036) (4 841)
Actuarial losses/(gains) recognised in other comprehensive income – changes from financial assumptions 5 965 7 962
Liability in the statement of financial position 97 460 89 433
Represented by
Liability due within 12 months 6 280 5 045
Liability due after 12 months 91 180 84 388
97 460 89 433
Present value of unfunded obligations 97 460 89 433
Fair value of plan assets – –
Recognised liability for defined benefit obligations 97 460 89 433
No reconciliation of the opening and closing balances of the plan assets is provided as there are no plan assets.
The net cumulative actuarial loss recognised in other comprehensive income (OCI) is R8,3 million.
The economic assumptions used in this valuation are based on market information as at the end of March 2014. At this date the duration of the liability was 12,2 years; and therefore a duration of 12 years was used to set the economic assumption.
Seardel integrated annual report 201491
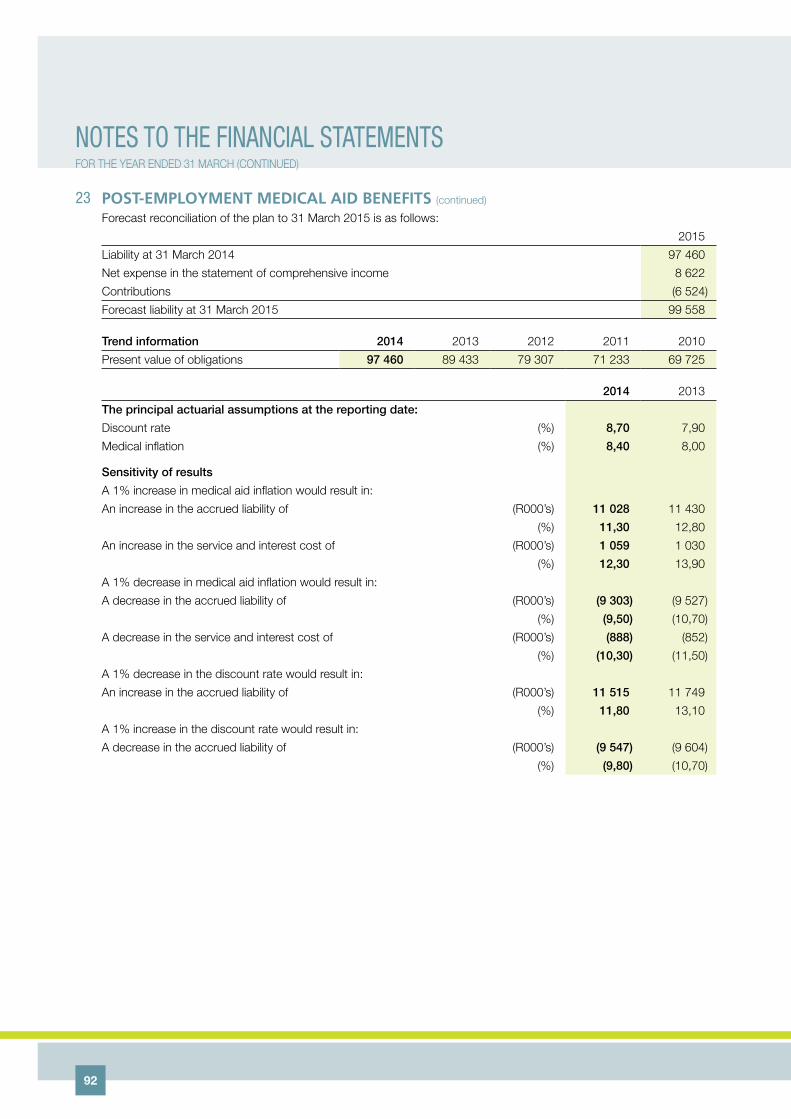
noteS to the financial StatementSFOR THE YEAR ENDED 31 MARCH (CONTINUED)
23 Post-emPloyment medical aid benefits (continued)
Forecast reconciliation of the plan to 31 March 2015 is as follows:
2015
Liability at 31 March 2014 97 460
Net expense in the statement of comprehensive income 8 622
Contributions (6 524)
Forecast liability at 31 March 2015 99 558
Trend information 2014 2013 2012 2011 2010
Present value of obligations 97 460 89 433 79 307 71 233 69 725
2014 2013
The principal actuarial assumptions at the reporting date:
Discount rate (%) 8,70 7,90
Medical inflation (%) 8,40 8,00
Sensitivity of results
A 1% increase in medical aid inflation would result in:
An increase in the accrued liability of (R000’s) 11 028 11 430
(%) 11,30 12,80
An increase in the service and interest cost of (R000’s) 1 059 1 030
(%) 12,30 13,90
A 1% decrease in medical aid inflation would result in:
A decrease in the accrued liability of (R000’s) (9 303) (9 527)
(%) (9,50) (10,70)
A decrease in the service and interest cost of (R000’s) (888) (852)
(%) (10,30) (11,50)
A 1% decrease in the discount rate would result in:
An increase in the accrued liability of (R000’s) 11 515 11 749
(%) 11,80 13,10
A 1% increase in the discount rate would result in:
A decrease in the accrued liability of (R000’s) (9 547) (9 604)
(%) (9,80) (10,70)
92

24 financial inStrumentSFinancial risk managementOverviewThe Group has exposure to the following risks from its use of financial instruments:• creditrisk;• liquidityrisk;and• marketrisk.
This note presents information about the Group’s exposure to each of the above risks, the Group’s objectives, policies and processes for measuring and managing risk, and the Group’s management of capital. Further quantitative disclosures are included throughout these consolidated and separate financial statements.
Risk management frameworkThe board of directors has overall responsibility for the establishment and oversight of the Group’s risk management framework. The board has established a risk committee, which is responsible for developing and monitoring the Group’s risk management policies. The committee reports regularly to the board of directors on its activities.
The Group’s risk management policies are established to identify and analyse the risks faced by the Group, to set appropriate risk limits and controls, and to monitor risks and adherence to limits. Risk management policies and systems are reviewed regularly to reflect changes in market conditions and the Group’s activities. The Group, through its training and management standards and procedures, aims to develop a disciplined and constructive control environment in which all employees understand their roles and obligations.
The Group audit committee oversees how management monitors compliance with the Group’s risk management policies and procedures, and reviews the adequacy of the risk management framework in relation to the risks faced by the Group. The Group audit committee is assisted in its oversight role by internal audit. Internal audit undertakes both regular and ad hoc reviews of risk management controls and procedures, the results of which are reported to the audit committee.
interest-bearing liabilities
Final repayment
dates
Average rate of
interest p.a.
GROuP COmPany
2014R000’s
2013R000’s
2014R000’s
2013R000’s
Secured
Instalment sale and finance lease agreements 2019 9 to 11 5 751 1 054 – –
Loans from financial institutions 2018 Prime -1,5% 369 402 – – –
375 153 1 054 – –
unsecured
SACTWU 2017 72% of prime 1 363 860 – – –
Hosken Treasury Proprietary Limited 2017 72% of prime 3 183 105 – – –
Deposit held for rentals 2021 Prime 4 508
Contingent payments relating to business combinations 2015 9,05 8 878 – – –
4 560 351 – – –
4 935 504 1 054 – –
Less current portion of interest-bearing liabilities (67 161) (298) – –
4 868 343 756 – –
Seardel integrated annual report 201493

noteS to the financial StatementSFOR THE YEAR ENDED 31 MARCH (CONTINUED)
24 financial instruments (continued)
Instalment sales and finance lease agreements are payable as follows:
PrincipalR000’s
interestR000’s
Grossinstalments
R000’s
2014
Less than one year 3 193 332 3 525
Between one and five years 2 558 306 2 864
5 751 638 6 389
2013
Less than one year 331 15 346
Between one and five years 723 124 847
1 054 139 1 193
Under the terms of the lease agreements no contingent rentals are payable. Finance leases are repayable in monthly instalments.
Financial risk managementForeign currency management: Operating subsidiaries undertake transactions denominated in foreign currencies and hence exposures to exchange rate fluctuations arise. Material exchange rate exposure on imported raw materials, trade debtors/creditors, foreign currency assets and liabilities and capital equipment is hedged through the use of forward exchange contracts. Trade exports are hedged using forward exchange contracts and customer foreign currency accounts. Forward exchange contracts (“FECs”) are not used for speculative purposes. FECs act as natural hedges and formal hedge accounting is not performed.
Interest rate management: The Group is exposed to interest rate risk as it borrows and places funds on the money market. This risk is managed by maintaining an appropriate mix of fixed and daily call placements with reputable financial institutions.
Credit risk management: Financial assets, which potentially subject the Group to concentrations of credit risk, consist principally of cash and cash equivalents, investments and receivables. A significant amount of the Group’s trade debt is in respect of sales to retailers, in particular Amic Trading Proprietary Limited (R40,4 million) (2013: R5,6 million), Woolworths Holdings Limited (R48,1 million) (2013: R60,5 million), Massmart Limited (R37,9 million) (2013: R30,4 million) and Edcon Limited (R21,4 million) (2013: R42,1 million). The risk on cash and cash equivalents is managed through dealing with established financial institutions with high credit standing.
The vast majority of trade debtors relate to sales made in the local market, with R810 million (99,2%) being denominated in South African Rands.
Trade receivables denominated in USD accounted for 0,4% (2013: 0,4%), and those in Eur accounted for 0,2% (2013; 0,2%).
Receivables are presented net of impairment provisions. The risk arising on trade receivables is managed through a Group policy on the granting of credit limits, continual review and monitoring of these limits. The company is jointly and severally liable in respect of third-party liabilities incurred by subsidiary companies.
Capital management: The Board’s policy is to maintain a strong capital base so as to maintain investor, creditor and market confidence and to sustain future development of the business. The capital base of the business is viewed as being the shareholder equity and non-current liabilities amounting to R9 516 857 million (2013: R1 554 248 million).
CollateralFinance lease receivable balances are secured over the electronic and office automation equipment leased. The Group does not hold any significant collateral other than electronic and office automation equipment securing finance lease receivable balances. The Group is not permitted to sell or repledge the collateral in the absence of default by the lessee.
During the period the Group did not obtain any assets by taking possession of any collateral held as security.
Repossessed electronic and office automation equipment is taken into stock and becomes available for lease or sale.
94

GROuP
Credit risk2014
R000’s2013
R000’s
allowances for credit losses
The movement in the allowance for impairment in respect of trade receivables during the period was as follows:
Opening balance 5 231 4 708
Written off as irrecoverable (2 356) (1 755)
Increased through business combinations 385 –
Disposal of subsidiary – –
Increase in allowance for impairment 1 610 4 492
Decrease in allowance for impairment (1 188) (2 214)
Closing balance 3 682 5 231
Past due or not impaired financial assets
The following analysis reflects the aging of trade receivables as at year-end which have exceeded their credit terms, but have not been impaired.
30+ days 397 –
60+ days 196 439
90+ days 6 802 6 207
120+ days 2 496 4 951
9 891 11 597
The following analysis reflects the aging and remaining value of trade receivables as at year-end which are considered to have been impaired and against which an impairment for non-recovery has already been made.
30+ days – –
60+ days – 47
90+ days 101 231
120+ days 2 933 3 027
3 034 3 305
In determining the impairments the Group considered, inter alia, disputes with customers, untraceable and slow payers, long overdue accounts and customers placed under liquidation. The Group holds no collateral as security against non-payment of any of the above-mentioned trade receivables, but does have credit guarantee insurance to protect against default. There has been no renegotiation of terms.
Cash flow and funding risk managementThis risk is managed through cash flow forecasts and ensures that adequate borrowing facilities are maintained. In terms of the memorandum of incorporation the Group’s borrowing powers are unlimited, but in terms of the securitisation agreement cannot raise further funds without permission.
Refer to note 30 for borrowing facilities.
Categories of financial assetsThe carrying amount of financial assets, which also represent the maximum credit exposure and reasonably approximate their fair values, are as follows:
Loans and receivables 1 244 448 522 438
Fair value through profit or loss (FECs) 12 410 186
Available for sale 3 644 3 580
1 260 502 526 204
Seardel integrated annual report 201495

noteS to the financial StatementSFOR THE YEAR ENDED 31 MARCH (CONTINUED)
24 financial inStrumentS (continued)
Reconciliation with line items presented in the statement of financial position:
Loans and receivables
R000’s
Fair value throughprofit or
lossR000’s
available for saleR000’s
non-financial
assetsR000’s
TotalR000’s
2014
Investments – – 3 644 – 3 644
Long-term receivables 146 582 – – – 146 582
Trade and other receivables 937 054 12 410 – 75 286 1 024 750
Cash and cash equivalents 160 812 – – – 160 812
1 244 448 12 410 3 644 75 286 1 335 788
2013
Investments – – 3 580 – 3 580
Long-term receivables 47 544 – – – 47 544
Trade and other receivables 472 657 186 – 31 945 504 788
Cash and cash equivalents 2 237 – – – 2 237
522 438 186 3 580 31 945 558 149
GROuP
2014R000’s
2013R000’s
Categories of financial liabilities
The carrying amount of financial liabilities, which also reasonably approximate their fair values are as follows:
Measured at amortised cost 6 309 789 964 203
6 309 789 964 203
96

Reconciliation with line items presented in the statement of financial position:
Fair value through profit or
lossR000’s
measured at amortised
costR000’s
non-financial liabilityR000’s
TotalR000’s
2014
Interest-bearing liabilities – non-current – 4 868 343 – 4 868 343
– current – 67 161 – 67 161
Trade and other payables 3 628 832 873 24 546 861 047
Bank overdrafts – 537 784 – 537 784
3 628 6 306 161 24 546 6 334 335
2013
Interest-bearing liabilities – non-current – 756 – 756
– current – 298 – 298
Trade and other payables 643 457 821 1 544 460 008
Bank overdrafts – 504 685 – 504 685
643 963 560 1 544 965 747
Seardel integrated annual report 201497

noteS to the financial StatementSFOR THE YEAR ENDED 31 MARCH (CONTINUED)
24 financial inStrumentS (continued)
maturity profile of financial instruments
Maturity profile of financial assets and liabilities at 31 March 2014 is summarised as follows:
R000’s0 – 12
months1 – 3
years3 – 5
yearsOver
5 years Total
2014
assets
Investments – 3 644 – – 3 644
Long-term receivables – 154 832 – – 154 832
Trade and other receivables 949 464 – – – 949 464
Cash and cash equivalents 160 812 – – – 160 812
Total financial assets 1 110 276 158 476 – – 1 268 752
Liabilities
Interest-bearing borrowings 67 161 4 868 343 – – 4 935 504
Trade and other payables 832 873 – – – 832 873
Bank overdrafts 537 784 – – – 537 784
Total financial liabilities – non-derivatives 1 437 818 4 868 343 – – 6 306 161
Trade and other payables 3 628 – – – 3 628
Total financial liabilities – derivatives 3 628 – – – 3 628
net financial (liabilities)/assets (331 170) (4 709 867) – – (5 041 037)
2013
assets
Investments – 3 580 – – 3 580
Long-term receivables – 54 524 – – 54 524
Trade and other receivables 472 843 – – – 472 843
Cash and cash equivalents 2 237 – – – 2 237
Total financial assets 475 080 58 104 – – 533 184
Liabilities
Interest-bearing borrowings 298 756 – – 1 054
Trade and other payables 457 821 – – – 457 821
Bank overdrafts 504 685 – – – 504 685
Total financial liabilities – non-derivatives 962 804 756 – – 963 560
Trade and other payables 643 – – – 643
Total financial liabilities – derivatives 643 – – – 643
net financial (liabilities)/assets (488 367) 57 348 – – (431 019)
98

Contractual undiscounted cash flows
R000’s0 – 12
months1 – 3
years3 – 5
yearsOver
5 years Total
2014
Liabilities – contractual undiscounted cash flows
Interest-bearing borrowings 397 605 5 516 806 – – 5 914 411
Trade and other payables 832 873 – – – 832 873
Bank overdrafts 556 819 – – – 556 819
Total financial liabilities – non-derivatives 1 787 297 5 516 806 – – 7 304 103
Trade and other payables 3 628 – – – 3 628
Total financial liabilities – derivatives 3 628 – – – 3 628
2013
Liabilities – contractual undiscounted cash flows
Interest-bearing borrowings 323 820 – – 1 144
Trade and other payables 457 821 – – – 457 821
Bank overdrafts 551 699 – – – 551 699
Total financial liabilities – non-derivatives 1 009 843 820 – – 1 010 664
Trade and other payables 643 – – – 643
Total financial liabilities – derivatives 643 – – – 643
Fair value of financial instrumentsThe fair value of short-term financial assets and liabilities approximate their carrying values as disclosed in the statement of financial position.
Fair value hierarchyThe table below analyses financial instruments carried at fair value, by valuation method. The different levels have been defined as follows:Level 1: quoted prices (unadjusted) in active markets for identical assets or liabilitiesLevel 2: inputs other than quoted prices included within Level 1 that are observable for the asset or liability, either directly
(i.e. as prices) or indirectly (i.e. derived from prices)Level 3: inputs for the asset or liability that are not based on observable market data (unobservable inputs)
Seardel integrated annual report 201499

noteS to the financial StatementSFOR THE YEAR ENDED 31 MARCH (CONTINUED)
24 financial inStrumentS (continued)
Carrying value Fair value
Notes
Loans and receivables
R000’s
Fair value through profit or
lossR000’s
available for saleR000’s
measured at
amortised cost
R000’sTotal
R000’sLevel 1R000’s
Level 2R000’s
Level 3R000’s
TotalR000’s
2014Financial assets measured at fair valueEquity securities 15 – – 3 644 – 3 644 315 3 329 – 3 644 Forward exchange contracts 20 – 12 410 – – 12 410 – 12 410 – 12 410
– 12 410 3 644 – 16 054 Financial assets not measured at fair valueLong-term receivables 17 146 582 – – – 146 582 Trade and other receivables 20 937 054 – – – 937 054Cash and cash equivalents 160 812 – – – 160 812 1 244 448 – – – 1 244 448Financial liabilities measured at fair valueForward exchange contracts 25 – (3 628) – – (3 628) – (3 628) – (3 628)
– (3 628) – – (3 628)Financial liabilities not measured at fair valueInstalment sale and finance lease agreements – – – (5 751) (5 751)Secured bank loans – – – (369 402) (369 402)Unsecured loans – – – (4 560 351) (4 560 351)Trade and other payables 25 – – – (832 873) (832 873)Bank overdrafts 30 – – – (537 784) (537 784)
– – – (6 306 161) (6 306 161)
2013Financial assets measured at fair valueEquity securities 15 – – 3 580 – 3 580 251 3 329 – 3 580 Forward exchange contracts 20 – 186 – – 186 – 186 – 186
– 186 3 580 – 3 766 Financial assets not measured at fair valueLong-term receivables 17 47 544 – – – 47 544 Trade and other receivables 20 472 657 – – – 472 657 Cash and cash equivalents 2 237 – – – 2 237 522 438 – – – 522 438 Financial liabilities measured at fair valueForward exchange contracts 25 – (643) – – (643) – (643) – (643)
– (643) – – (643)Financial liabilities not measured at fair valueInstalment sale and finance lease agreements – – – (1 054) (1 054) Secured bank loans – – – – – Unsecured loans – – – – – Trade and other payables 25 – – – (457 821) (457 821)Bank overdrafts 30 – – – (504 685) (504 685)
– – – (936 560) (936 560)
100

24 financial inStrumentS (continued)
Carrying value Fair value
Notes
Loans and receivables
R000’s
Fair value through profit or
lossR000’s
available for saleR000’s
measured at
amortised cost
R000’sTotal
R000’sLevel 1R000’s
Level 2R000’s
Level 3R000’s
TotalR000’s
2014Financial assets measured at fair valueEquity securities 15 – – 3 644 – 3 644 315 3 329 – 3 644 Forward exchange contracts 20 – 12 410 – – 12 410 – 12 410 – 12 410
– 12 410 3 644 – 16 054 Financial assets not measured at fair valueLong-term receivables 17 146 582 – – – 146 582 Trade and other receivables 20 937 054 – – – 937 054Cash and cash equivalents 160 812 – – – 160 812 1 244 448 – – – 1 244 448Financial liabilities measured at fair valueForward exchange contracts 25 – (3 628) – – (3 628) – (3 628) – (3 628)
– (3 628) – – (3 628)Financial liabilities not measured at fair valueInstalment sale and finance lease agreements – – – (5 751) (5 751)Secured bank loans – – – (369 402) (369 402)Unsecured loans – – – (4 560 351) (4 560 351)Trade and other payables 25 – – – (832 873) (832 873)Bank overdrafts 30 – – – (537 784) (537 784)
– – – (6 306 161) (6 306 161)
2013Financial assets measured at fair valueEquity securities 15 – – 3 580 – 3 580 251 3 329 – 3 580 Forward exchange contracts 20 – 186 – – 186 – 186 – 186
– 186 3 580 – 3 766 Financial assets not measured at fair valueLong-term receivables 17 47 544 – – – 47 544 Trade and other receivables 20 472 657 – – – 472 657 Cash and cash equivalents 2 237 – – – 2 237 522 438 – – – 522 438 Financial liabilities measured at fair valueForward exchange contracts 25 – (643) – – (643) – (643) – (643)
– (643) – – (643)Financial liabilities not measured at fair valueInstalment sale and finance lease agreements – – – (1 054) (1 054) Secured bank loans – – – – – Unsecured loans – – – – – Trade and other payables 25 – – – (457 821) (457 821)Bank overdrafts 30 – – – (504 685) (504 685)
– – – (936 560) (936 560)
Seardel integrated annual report 2014101
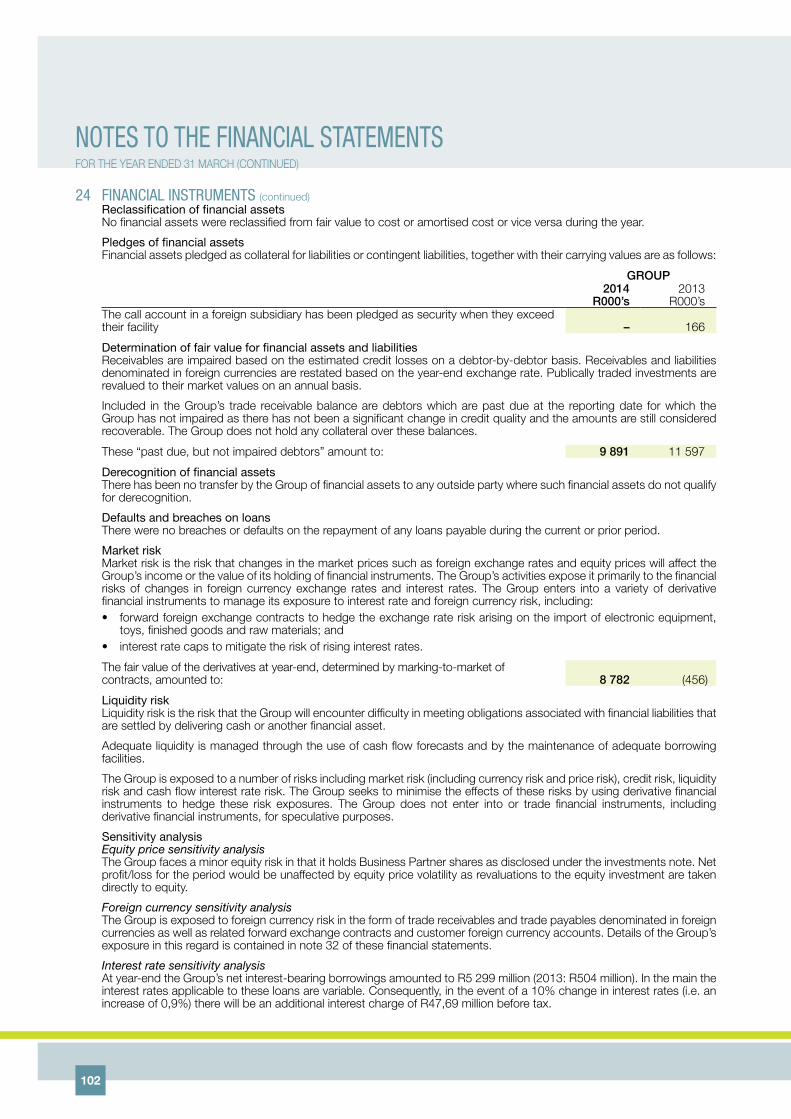
noteS to the financial StatementSFOR THE YEAR ENDED 31 MARCH (CONTINUED)
24 financial inStrumentS (continued)Reclassification of financial assetsNo financial assets were reclassified from fair value to cost or amortised cost or vice versa during the year.
Pledges of financial assetsFinancial assets pledged as collateral for liabilities or contingent liabilities, together with their carrying values are as follows:
GROuP2014
R000’s 2013
R000’s The call account in a foreign subsidiary has been pledged as security when they exceed their facility – 166
Determination of fair value for financial assets and liabilitiesReceivables are impaired based on the estimated credit losses on a debtor-by-debtor basis. Receivables and liabilities denominated in foreign currencies are restated based on the year-end exchange rate. Publically traded investments are revalued to their market values on an annual basis.
Included in the Group’s trade receivable balance are debtors which are past due at the reporting date for which the Group has not impaired as there has not been a significant change in credit quality and the amounts are still considered recoverable. The Group does not hold any collateral over these balances.
These “past due, but not impaired debtors” amount to: 9 891 11 597
Derecognition of financial assetsThere has been no transfer by the Group of financial assets to any outside party where such financial assets do not qualify for derecognition.
Defaults and breaches on loansThere were no breaches or defaults on the repayment of any loans payable during the current or prior period.
Market riskMarket risk is the risk that changes in the market prices such as foreign exchange rates and equity prices will affect the Group’s income or the value of its holding of financial instruments. The Group’s activities expose it primarily to the financial risks of changes in foreign currency exchange rates and interest rates. The Group enters into a variety of derivative financial instruments to manage its exposure to interest rate and foreign currency risk, including:• forwardforeignexchangecontractstohedgetheexchangerateriskarisingontheimportofelectronicequipment,
toys, finished goods and raw materials; and• interestratecapstomitigatetheriskofrisinginterestrates.
The fair value of the derivatives at year-end, determined by marking-to-market of contracts, amounted to: 8 782 (456)
Liquidity riskLiquidity risk is the risk that the Group will encounter difficulty in meeting obligations associated with financial liabilities that are settled by delivering cash or another financial asset.
Adequate liquidity is managed through the use of cash flow forecasts and by the maintenance of adequate borrowing facilities.
The Group is exposed to a number of risks including market risk (including currency risk and price risk), credit risk, liquidity risk and cash flow interest rate risk. The Group seeks to minimise the effects of these risks by using derivative financial instruments to hedge these risk exposures. The Group does not enter into or trade financial instruments, including derivative financial instruments, for speculative purposes.
Sensitivity analysisEquity price sensitivity analysisThe Group faces a minor equity risk in that it holds Business Partner shares as disclosed under the investments note. Net profit/loss for the period would be unaffected by equity price volatility as revaluations to the equity investment are taken directly to equity.
Foreign currency sensitivity analysisThe Group is exposed to foreign currency risk in the form of trade receivables and trade payables denominated in foreign currencies as well as related forward exchange contracts and customer foreign currency accounts. Details of the Group’s exposure in this regard is contained in note 32 of these financial statements.
Interest rate sensitivity analysisAt year-end the Group’s net interest-bearing borrowings amounted to R5 299 million (2013: R504 million). In the main the interest rates applicable to these loans are variable. Consequently, in the event of a 10% change in interest rates (i.e. an increase of 0,9%) there will be an additional interest charge of R47,69 million before tax.
102
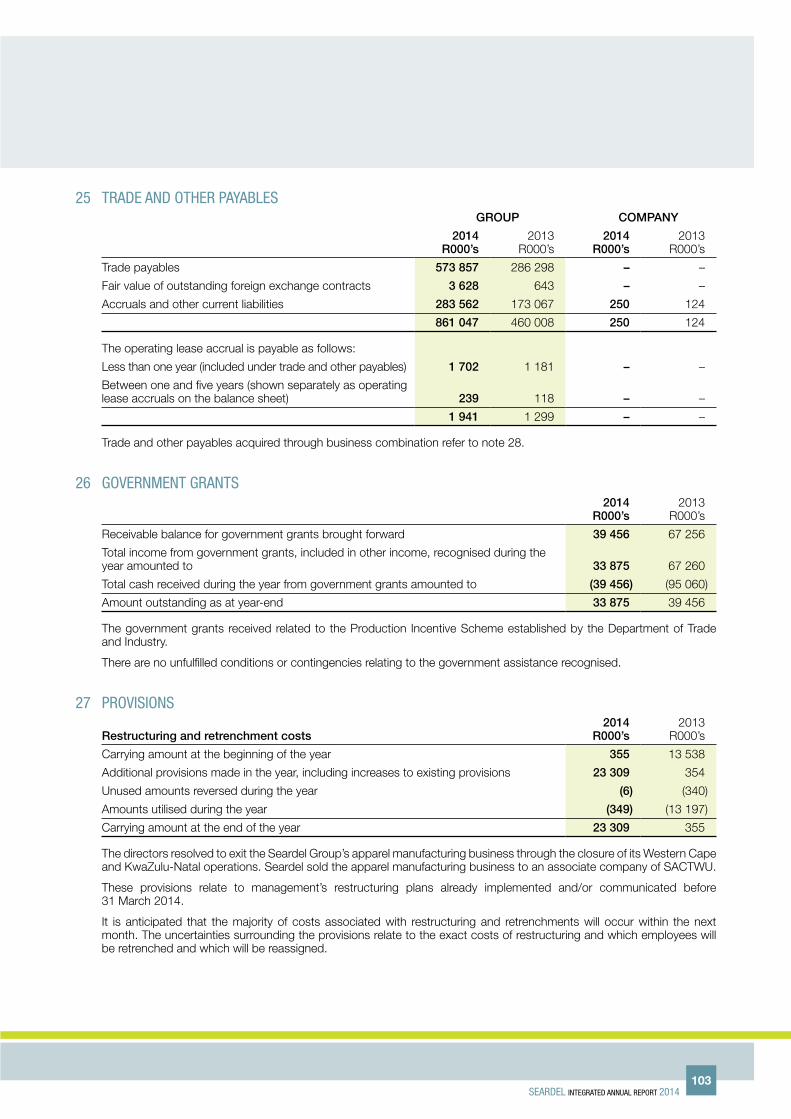
25 trade and other payaBleSGROuP COmPany
2014R000’s
2013R000’s
2014R000’s
2013R000’s
Trade payables 573 857 286 298 – –
Fair value of outstanding foreign exchange contracts 3 628 643 – –
Accruals and other current liabilities 283 562 173 067 250 124
861 047 460 008 250 124
The operating lease accrual is payable as follows:
Less than one year (included under trade and other payables) 1 702 1 181 – –
Between one and five years (shown separately as operating lease accruals on the balance sheet) 239 118 – –
1 941 1 299 – –
Trade and other payables acquired through business combination refer to note 28.
26 government grantS2014
R000’s 2013
R000’s
Receivable balance for government grants brought forward 39 456 67 256
Total income from government grants, included in other income, recognised during the year amounted to 33 875 67 260
Total cash received during the year from government grants amounted to (39 456) (95 060)
Amount outstanding as at year-end 33 875 39 456
The government grants received related to the Production Incentive Scheme established by the Department of Trade and Industry.
There are no unfulfilled conditions or contingencies relating to the government assistance recognised.
27 proviSionS
Restructuring and retrenchment costs2014
R000’s 2013
R000’s
Carrying amount at the beginning of the year 355 13 538
Additional provisions made in the year, including increases to existing provisions 23 309 354
Unused amounts reversed during the year (6) (340)
Amounts utilised during the year (349) (13 197)
Carrying amount at the end of the year 23 309 355
The directors resolved to exit the Seardel Group’s apparel manufacturing business through the closure of its Western Cape and KwaZulu-Natal operations. Seardel sold the apparel manufacturing business to an associate company of SACTWU.
These provisions relate to management’s restructuring plans already implemented and/or communicated before 31 March 2014.
It is anticipated that the majority of costs associated with restructuring and retrenchments will occur within the next month. The uncertainties surrounding the provisions relate to the exact costs of restructuring and which employees will be retrenched and which will be reassigned.
Seardel integrated annual report 2014103

28 BuSineSS comBinationSSubsidiaries acquired through the year
Subsidiary name
Acquisition date Segment
% voting interest
acquired Description
Revenue contri-
buted to the Group
R’000
Net profit/(loss)
contri-bution to
the GroupR’000
Revenue contri-
buted to the Group
had theacquisition
been effective
1 April 2013R’000
Net profit/(loss)
contri-bution to
the Group had the
acquisition been
effective 1 April 2013R’000
HCI Invest 3 Holdco (Sabido Holdco) – see below for more details
1 October 2013
Media 63,9% Investment in Sabido Investments Proprietary Limited (Sabido) which, in turn, is a media group with a variety of broadcasting, content and production businesses. 1 223 603 37 552 2 364 039 250 825
Clever Little Monkey Proprietary Limited
1 August 2013
Branded Product Distribution
100% Online furniture and decor shop.
2 898 (318) 2 898 (318) Custom Extrusion Proprietary Limited
1 July 2013 Industrial 100% Extrusion and weaving of polypropylene.
66 888 6 637 89 685 8 898 Strika Entertain-ment Proprietary Limited
1 December 2013
Media 70% Conceptualises and produces entertainment content based on charter licensing in both comic and animated environments. 8 800 (300) 24 200 (500)
Afrikaans Satelliet Televisie Proprietary Limited
1 October 2013
Media 80% Television channel which produced Afrikaans community-based television programming primarily aimed at the values-driven Afrikaans audience. 300 (2 600) 400 (2 900)
Detail on principle business acquisition during the yearAcquisition of HCI Invest 3 Holdco Proprietary Limited (Sabido Holdco)During the year Seardel acquired a 100% interest in Sabido Holdco, which holds a 63,9% interest in Sabido Investments Proprietary Limited (Sabido). The Group acquired 70% of Sabido Holdco on 1 October 2013 and the remaining 30% on 1 February 2014. The acquisition was funded by way of 500 million shares issued at R1,60, fairly valued to R1 370 million, and R4 436 million of interest-bearing debt. The equity was settled by the issue of R350 million N ordinary shares to HCI and 150 million N ordinary shares to SACTWU and the debt consisted of a R1 330 million loan from SACTWU and a R3 106 loan from HCI.
The ordinary shares in Sabido Holdco were sold to Seardel ex the right to receive any dividends which will be declared by the company, based on the dividend which it will receive from Sabido in May 2013 and November 2013. Both such dividends will accrue to HCI or its nominee. These dividends amounted to R71,8 million.
On 30 January 2014 the loan of R3 106 million from HCI was settled by the issue of 1 000 000 redeemable convertible preference shares of no par value by Sabido Holdco and which attracts a dividend equal to 72% of the prime rate. The preference shares were redeemed on 25 April 2014 on conclusion of the rights issue as described in note 38.
Consideration transferredThe following table summarises the consideration paid for the entities and the amount of the assets acquired and liabilities assumed recognised at the acquisition date:
noteS to the financial StatementSFOR THE YEAR ENDED 31 MARCH (CONTINUED)
104
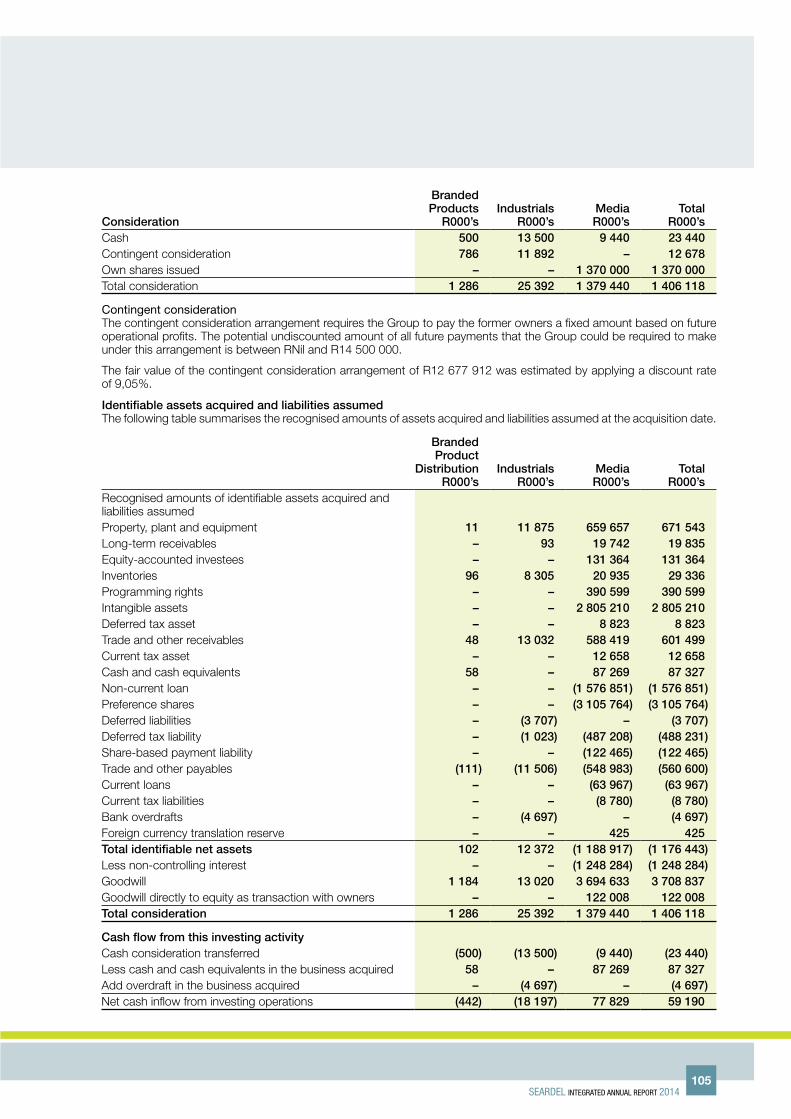
Consideration
Branded Products
R000’sindustrials
R000’smediaR000’s
TotalR000’s
Cash 500 13 500 9 440 23 440 Contingent consideration 786 11 892 – 12 678 Own shares issued – – 1 370 000 1 370 000 Total consideration 1 286 25 392 1 379 440 1 406 118
Contingent considerationThe contingent consideration arrangement requires the Group to pay the former owners a fixed amount based on future operational profits. The potential undiscounted amount of all future payments that the Group could be required to make under this arrangement is between RNil and R14 500 000.
The fair value of the contingent consideration arrangement of R12 677 912 was estimated by applying a discount rate of 9,05%.
identifiable assets acquired and liabilities assumedThe following table summarises the recognised amounts of assets acquired and liabilities assumed at the acquisition date.
Branded Product
Distribution R000’s
industrials R000’s
media R000’s
Total R000’s
Recognised amounts of identifiable assets acquired and liabilities assumedProperty, plant and equipment 11 11 875 659 657 671 543 Long-term receivables – 93 19 742 19 835 Equity-accounted investees – – 131 364 131 364 Inventories 96 8 305 20 935 29 336 Programming rights – – 390 599 390 599 Intangible assets – – 2 805 210 2 805 210 Deferred tax asset – – 8 823 8 823 Trade and other receivables 48 13 032 588 419 601 499 Current tax asset – – 12 658 12 658 Cash and cash equivalents 58 – 87 269 87 327 Non-current loan – – (1 576 851) (1 576 851) Preference shares – – (3 105 764) (3 105 764) Deferred liabilities – (3 707) – (3 707) Deferred tax liability – (1 023) (487 208) (488 231) Share-based payment liability – – (122 465) (122 465) Trade and other payables (111) (11 506) (548 983) (560 600) Current loans – – (63 967) (63 967) Current tax liabilities – – (8 780) (8 780) Bank overdrafts – (4 697) – (4 697) Foreign currency translation reserve – – 425 425 Total identifiable net assets 102 12 372 (1 188 917) (1 176 443) Less non-controlling interest – – (1 248 284) (1 248 284) Goodwill 1 184 13 020 3 694 633 3 708 837 Goodwill directly to equity as transaction with owners – – 122 008 122 008 Total consideration 1 286 25 392 1 379 440 1 406 118
Cash flow from this investing activityCash consideration transferred (500) (13 500) (9 440) (23 440) Less cash and cash equivalents in the business acquired 58 – 87 269 87 327 Add overdraft in the business acquired – (4 697) – (4 697) Net cash inflow from investing operations (442) (18 197) 77 829 59 190
Seardel integrated annual report 2014105

28 BuSineSS comBinationS (continued)
measurement of fair valuesThe valuation techniques used to measure the fair value of material assets acquired were as follows:
assets acquired valuation techniques
Owner-occupied properties
Capitalisation of income: The valuation model considers the net operating income of the rent collected and dividing it by the capitalisation rate (investor’s rate of return), taking into account expected rental income and anticipated expenses for the next twelve months, the properties’ location, structure and rental-producing capacity of similar buildings in similar locations.
Intangible assets Certain intangible assets were identified but were not considered to be separable from other intangible assets. An important exception to the individual recognition of intangible assets is the value of assembled workforce.
The following valuation techniques were used:
Marketing-related intangible assets: Relief from income methodThis valuation approach recognises that intangible assets have value in so far as use of these intangible assets give rise to an income stream. The value of these income streams are based on the income-producing capability of the intangible assets, with the net present value of these income streams aggregated to determine the current economic worth of the intangible asset.
Customer-related intangible assets: Income methodThis entails the identification, separation and quantification of the cash flows attributable to the contracts, the application of a contributory asset charge and brand charge, and the determination of the net present value of the resulting future cash flows by applying the discounted cash flow valuation methodology.
Broadcasting licences: Greenfield approachThis approach values the licence by calculating the value of a hypothetical start-up company that goes into business with no assets except the asset to be valued (the licence). The value of the licence can be considered as equal to the value of this hypothetical start-up company.
Assembly workforce: IFRS 3 states that an assembled workforce shall not be recognised as an intangible asset apart from goodwill.
GoodwillThe goodwill is attributable mainly to intangible assets that are either not separable or cannot be valued reliable as per IFRS 3. This includes non-competition agreements, customer lists, production backlog, lease agreements, employment contracts, databases, patented/unpatented technology, computer software, service or supply contracts, and service contracts.
noteS to the financial StatementSFOR THE YEAR ENDED 31 MARCH (CONTINUED)
106

29 leaSeSGROuP
nominal amount
2014R000’s
2013R000’s
Non-cancellable operating lease rentals are payable as follows:
Less than one year 43 285 9 360
Between one and five years 47 465 16 011
90 750 25 371
Non-cancellable operating lease rentals are receivable as follows:
Less than one year 90 127 56 258
Between one and five years 435 529 191 988
More than five years 206 382 4 266
732 038 252 512
No future sublease payments are expected to be received under non-cancellable subleases.
No contingent rentals were recognised as income in the period.
The Group leases a number of premises as distribution warehouses, factory and retail facilities, as well as office equipment, motor vehicles and fork lifts under operating leases.
30 BorroWing facilitieS2014
R000’s 2013
R000’s
Available facility 837 500 750 000
Net utilised (650 697) (609 157)
Unutilised balance 186 803 140 843
These facilities have been secured in terms of note 37.
Seardel integrated annual report 2014107

31 directorS’ emolumentS
Paid by a subsidiary companyName
SalaryR000’s
BonusR000’s
Retire-ment
and medical
contri-butionsR000’s
Shareoption
expenseR000’s
Directors’fees
R000’s
Otherbenefits
R000’s Total
R000’s
2014
executive directors***
S A Queen* (Chief Executive Officer) 3 345 – – 2 054 – – 5 399
A M Ntuli 841 71 157 – – – 1 069
G D T Wege 1 556 – 233 435 – – 2 224
D Duncan 2 394 – 291 293 – – 2 978
8 136 71 681 2 782 – – 11 670
non-executive directors
J Copelyn (Chairman)** – – – – 136 – 136
N N Lazarus (Deputy Chairman† – – – – 43 – 43
M H Ahmed – – – – 136 – 136
T G Govender** – – – – 97 – 97
R Watson – – – – 117 – 117
Y Shaik – – – – 157 – 157
– – – – 686 – 686
2013
executive directors***
S A Queen* (Chief Executive Officer) 3 149 1 186 – 2 252 – – 6 587
A M Ntuli 795 65 146 – – – 1 006
G D T Wege 1 446 603 217 547 – – 2 813
5 390 1 854 363 2 799 – – 10 406
non-executive directors
J Copelyn (Chairman)** – – – – 126 – 126
N N Lazarus (Deputy Chairman† – – – – 162 – 162
M H Ahmed – – – – 126 – 126
T G Govender** – – – – 90 – 90
R Watson – – – – 90 – 90
Y Shaik – – – – 109 – 109
– – – – 703 – 703
noteS to the financial StatementSFOR THE YEAR ENDED 31 MARCH (CONTINUED)
108

Additional disclosure in terms of the share options granted during the year:
Opening balance of share options
000’s
number of share options
awarded during
the year000’s
number of shares exercised
000’s
Closing balance of share options
000’s
Strike price
of share options
awardedR
exercised price of shares
exercisedR
2014
executive directors***
S A Queen* (Chief Executive Officer) 8 820 – – 8 820 – –
A M Ntuli – – – – – –
G D T Wege 3 523 – (750) 2 773 – 2,75
D Duncan 2 572 – (525) 2 047 – 2,75
non-executive directors
J Copelyn** (Chairman) – – – – – –
N N Lazarus† (Deputy Chairman) – – – – – –
M H Ahmed – – – – – –
T G Govender** – – – – – –
R Watson – – – – – –
Y Shaik – – – – – –
2013
executive directors***
S A Queen* (Chief Executive Officer) 8 744 2 173 (2 097) 8 820 1,10 1,40
A M Ntuli – – – – – –
G D T Wege 3 643 754 (874) 3 523 1,10 1,36
non-executive directors
J Copelyn** (Chairman) – – – – – –
N N Lazarus” (Deputy Chairman) – – – – – –
M H Ahmed – – – – – –
T G Govender** – – – – – –
R Watson – – – – – –
Y Shaik – – – – – –
* The remuneration of S A Queen is included in the managerial services provided by HCI referred to in note 34 Related parties.
** Ceded to HCI.*** There is no distinction made in the remuneration packages of executive directors for services as directors and services
for carrying on the business of the Group and/or subsidiary companies.† Resigned.
For the interest of directors in the company’s share capital please refer to the Analysis of Shareholders.
Directors’ interest in contracts is disclosed in note 34 Related parties.
Seardel integrated annual report 2014109
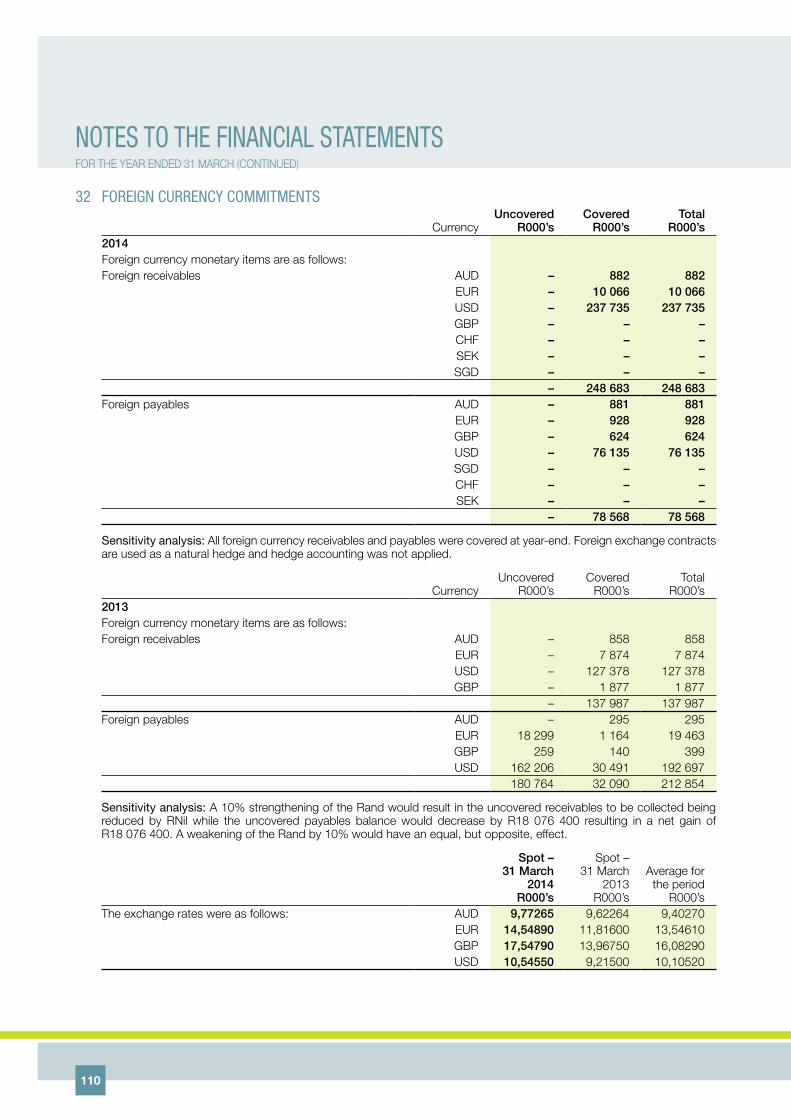
32 foreign currency commitmentS
Currencyuncovered
R000’sCovered R000’s
Total R000’s
2014Foreign currency monetary items are as follows:Foreign receivables AUD – 882 882 EUR – 10 066 10 066 USD – 237 735 237 735 GBP – – – CHF – – – SEK – – – SGD – – – – 248 683 248 683 Foreign payables AUD – 881 881
EUR – 928 928 GBP – 624 624 USD – 76 135 76 135
SGD – – – CHF – – –
SEK – – – – 78 568 78 568
Sensitivity analysis: All foreign currency receivables and payables were covered at year-end. Foreign exchange contracts are used as a natural hedge and hedge accounting was not applied.
CurrencyUncovered
R000’sCovered
R000’sTotal
R000’s2013Foreign currency monetary items are as follows:Foreign receivables AUD – 858 858 EUR – 7 874 7 874 USD – 127 378 127 378
GBP – 1 877 1 877 – 137 987 137 987 Foreign payables AUD – 295 295
EUR 18 299 1 164 19 463 GBP 259 140 399 USD 162 206 30 491 192 697 180 764 32 090 212 854
Sensitivity analysis: A 10% strengthening of the Rand would result in the uncovered receivables to be collected being reduced by RNil while the uncovered payables balance would decrease by R18 076 400 resulting in a net gain of R18 076 400. A weakening of the Rand by 10% would have an equal, but opposite, effect.
Spot – 31 march
2014R000’s
Spot – 31 March
2013R000’s
Average forthe period
R000’sThe exchange rates were as follows: AUD 9,77265 9,62264 9,40270 EUR 14,54890 11,81600 13,54610 GBP 17,54790 13,96750 16,08290 USD 10,54550 9,21500 10,10520
noteS to the financial StatementSFOR THE YEAR ENDED 31 MARCH (CONTINUED)
110

33 commitmentSCapital expenditure Contractual commitments
2014R000’s
2013R000’s
2014R000’s
2013R000’s
Investment property 37 499 104 496 2 152 20 265
Owner-occupied properties 196 65 480 168 000 –
Plant and equipment 164 978 39 225 14 578 117
Intangible assets 75 641 6 970 11 000 1 356
Business combinations 1 406 118 – 10 000 –
1 684 432 216 171 205 730 21 738
The capital commitments are expected to be incurred during the remainder of the current financial year.
34 related partieSTransactions between Group companies Transactions between Group companies: During the year, in the ordinary course of business, certain companies within the Group entered into transactions with one another. These intra-group transactions have been eliminated on consolidation.
Transactions with hosken Consolidated investments Limited (hCi) (ultimate holding company), entities in which hCi has an interest and SaCTWu (shareholder in Seardel)
Transaction values for the year ended 31 march
income/(expense)
Balance outstanding as at 31 march
Balance receivable/(owing)
2014R000’s
2013R000’s
2014R000’s
2013R000’s
SACTWU – disposal of apparel manufacturing operation – refer to note 8 (31 260) – 107 588 –
SACTWU – loan advance relating to the disposal of the apparel manufacturing operation – refer to note 8 (957) – (30 957) –
SACTWU – loan relating to the acquisition of Sabido Investments – refer to note 27 (33 138) – (1 363 860) –
HCI – preference shares relating to the acquisition of Sabido Investments – refer to note 27 (77 341) – (3 183 105) –
HCI – working capital loan advanced during the year (2 499) (1 744) – –
Loans and associated interest
Cape Town Film Studio (associate) – refer to note 15 – – 63 685 –
Dreamworld Management (associate) – refer to note 15 – – 10 313 –
Global Media Alliance (associate) – refer to note 15 – – 63 544 –
management fees paid
HCI – managerial and secretarial services (4 200) (4 342) (10 195) (8 692)
management fees received
Formex Industries – a subsidiary of HCI 1 296 (600) – –
Risk management to HCI 617 (142) – –
Seardel integrated annual report 2014111

34 related partieS (continued)
Disposal of apparel manufacturing operation to SaCTWuSeardel disposed of its South African apparel manufacturing operation and advanced on loan account an amount equal to the purchase price to SACTWU. The loan attracts interest at prime and will be repaid out of any cash payments or distributions receivable by SACTWU from Seardel or HCI.
acquisition of hCi invest 3 holdco Proprietary Limited (Sabido holdco)During the year Seardel purchased a 100% interest in Sabido Holdco, which holds 63,9% interest in Sabido Investments Proprietary Limited (Sabido). Sabido is the investment vehicle that houses e.tv, eSat.tv, Yfm and Sasani Studios. The Group acquired 70% of Sabido Holdco on 1 October 2013 and the remaining 30% on 1 February 2014.
The acquisition was funded by way of 500 million shares issued at R1,60, fairly valued to R1 370 million and R4 436 million of interest-bearing debt. The equity was settled by the issue of 350 million N ordinary shares to HCI and 150 million N ordinary shares to SACTWU and the debt consisted of a R1 330 million loan from SACTWU and a R3 106 million loan from HCI.
On 30 January 2014 the loan of R3 105 769 960 from HCI was settled by the issue of 1 000 000 redeemable convertible preference shares of no par value by Sabido Holdco and which attracts a dividend equal to 72% of prime rate. The preference shares were redeemed on 25 April 2014 on conclusion of the rights issue as described in note 37.
hCi working capital loanThe working capital loan from HCI attracted interest at prime.
Loans to associatesLoans to associates are disclosed as equity-accounted investees on the face of the statement of financial position.
Transactions with companies with common directorsTransaction values for the
year ended 31 marchincome/(expense)
Balance outstanding as at 31 march
Balance receivable/(owing)2014
R000’s2013
R000’s2014
R000’s2013
R000’sSale of goods and servicesZenzeleni Clothing – a company of which J Copelyn, K Govender and A Ntuli are directors 8 930 – 2 053 –
Remuneration of key management personnelKey management personnel are directors and those executives having authority and responsibility for planning, directing and controlling the activities of the Group. The remuneration (all short-term benefits) paid by the Group to its key management personnel is as follows:
2014R000’s
2013R000’s
Basic 29 676 34 739 Provident fund 2 297 2 312 Medical aid 591 495
32 564 37 546
A share incentive scheme has been implemented for key management personnel. See note 39 for further details.
The percentage of shares held by directors of the company and their related entities at the reporting date are disclosed in the Analysis of Shareholders report on page 125.
CompanyThe company’s holding company is Fulela Trade and Invest 81 (Pty) Ltd and its ultimate holding company is Hosken Consolidated Investments Limited.
Related parties: All subsidiaries qualify as related parties. All subsidiaries are listed on page 122.
The company receives administrative, management and accounting services from Seardel Group Trading (Pty) Ltd, which is a 100%-held subsidiary. There are no charges for these services.
35 contingencieSThere are no material contingencies at the date of signing this report.
noteS to the financial StatementSFOR THE YEAR ENDED 31 MARCH (CONTINUED)
112

36 change in comparativeSThe results of discontinued operations have been separately disclosed on the face of the statement of profit or loss and other comprehensive income. Where practical these results for the prior year have been restated.
The shareholders of the company have approved the conversion of the ordinary shares and N ordinary shares having a par value to ordinary shares and N ordinary shares having no par value at a general meeting of the company held on 8 August 2013. Share capital and share premium have therefore been restated to stated capital.
37 SecuritiSation of aSSetSThe security has been provided to a special purpose company (Seardel Security (Pty) Ltd), which has guaranteed the obligations of the Group companies in favour of the lenders and which, in turn, is indemnified by Group companies.
name of entity(Security grantor)
Security cession
Bond(Type, amount and subject-matter)
Nyenye Clothing Manufacturers (Pty) Ltd Yes None
Consolidated Textiles (Pty) Ltd Yes None
Val Hau et Cie (Pty) Ltd Yes None
Seartec Trading (Pty) Ltd Yes 1. General Notarial Bond, R60 million
Seartec Industries (Pty) Ltd Yes None
Seartec (Pty) Ltd Yes None
Seardel Number 16 (Pty) Ltd Yes None
Prima Toys & Leisure Group (Pty) Ltd Yes None
Gold Reef (Pty) Ltd Yes 1. General Notarial Bond, R30 million
Seardel Group Trading (Pty) Ltd Yes 1. General Notarial Bond, R1 billion, movable assets of Seardel Group Trading
2. Special Notarial Bond, R300 million, movable assets of Seardel Group Trading
3. Mortgage Bonds, R600 million, all immovable property owned by Seardel Group Trading
Frame Industrials Pty Ltd Yes 1. General Notarial Bond, R5 million, movable assets of Frame Industrials
2. Special Notarial Bond, R15 million, movable assets of Frame Industrials
Prima Toys & Leisure Trading (Pty) Ltd Yes 1. General Notarial Bond, R50 million, movable assets of Prima Trading
Seardel Investment Corporation Limited Yes None
noteSecurity cession means a security cession in terms of which the security grantor cedes to the security SPV in securitatem debiti all of such security grantor’s present and future rights and interest as security for the due, proper and timeous payment and performance in full of the security grantor’s obligations under the indemnity, on the terms of the written security cession signed on 21 November 2008 between the security spv and the security grantor.
Indemnity means an irrevocable and unconditional indemnity given by the security grantor to the security SPV, indemnifying the security SPV in respect of any claim or liability of the security SPV arising under the guarantees which the security spv has provided in respect of all monies and liabilities owing by the security grantor and other companies within the borrower group in connection with the banking facilities provided by the guaranteed parties to the borrower group and against any loss, damage, liability, costs or expenses of any nature which the security SPV may incur as a consequence of the occurrence of any event of default, on the terms of the written indemnity agreement signed on 21 November 2008 between the security SPV and the security grantor.
Seardel integrated annual report 2014113

37 SecuritiSation of aSSetS (continued)
The impact of the above on the figures disclosed in the statement of financial position is as follows:
Per statement
of financial position
R000’sSecuritised
R000’s
un-securitised
R000’s
Property, plant and equipment 1 363 812 610 529 753 283
Investment property 669 619 669 619 –
Intangible assets 2 817 234 9 197 2 808 037
Other investments 3 644 3 644 –
Equity-accounted investees 132 698 – 132 698
Long-term receivables 146 582 126 747 19 835
Inventories 555 433 522 376 33 057
Programming rights 282 682 – 282 682
Trade and other receivables 1 024 750 519 515 505 235
Non-current assets held for sale 54 536 54 536 –
38 poSt-year-end eventSSubsequent to year-end the authorised share capital of the company was increased from 200 million N shares to 10 550 million N shares of no par value to enable the company to undertake a rights offer to shareholders in terms of which each shareholder was given the right to subscribe for 258,93 new N shares for every 100 shares held. Pursuant to the rights offer 3 125 million new N shares were issued at R1,60 per rights offer share and R5 billion cash was raised. The proceeds of the rights offer was utilised to settle the preference share debt of Sabido Holdco to HCI totalling R3,1 billion and repaying the loan of Sabido Holdco to SACTWU totalling R1,3 billion. The remainder was utilised to reduce bank debts.
The company’s subsidiary, Sabido Investments Proprietary Limited (63,9% interest), acquired 100% of Crystal Brook Distribution Proprietary Limited and Longkloof Limited (which were 80% held by a subsidiary of Hosken Consolidated Investments Limited and 20% by Venfin Media Beleggings Proprietary Limited) for an aggregate purchase consideration of approximately R11 million and US$45 million respectively.
On 28 August 2014 the company announced its intention, subject to shareholder and regulatory approval, to separately list its non-media investments via a newly created investment holding company, Deneb Investments Proprietary Limited, on the securities exchange operated by the JSE Limited and the unbundling of the company’s interest in Deneb Investments Proprietary Limited to Seardel ordinary shareholders and N shareholders.
Ms N Jappie has been appointed as an independent non-executive director of the company with effect from 14 July 2014.
noteS to the financial StatementSFOR THE YEAR ENDED 31 MARCH (CONTINUED)
114

39 Share incentive Schemeequity settledThe Seardel Long-Term Incentive Trust was established on 17 February 2010. The Trustees of the Seardel Long-Term Incentive Trust executed the Seardel Long-Term Incentive Plan on 18 March 2010 to provide selected employees with the opportunity to acquire ordinary shares in Seardel Investment Corporation Limited, thereby ensuring that such employees are encouraged and motivated to pursue continued growth and profitability of Group companies.
During the financial year Nil ordinary options (2013: 10 159 672 ordinary shares) were allotted in terms of the Seardel Long-Term Incentive Plan.
The exercise of the options by the employees is subject to them meeting performance targets relating to the profitability of the relevant business unit or division or Group profitability, as well as the continued employment of the employee as at the date on which the option is exercised, in which case the employee may exercise:• upto10%oftheoptionsharesfromthefirstanniversaryoftheoptiondate• uptoafurther20%oftheoptionsharesfromthesecondanniversarydate• uptoafurther30%oftheoptionsharesfromthethirdanniversarydate;and• thebalance,namely40%oftheoptionshares,fromthefourthanniversarydate.
Options in issue are as follows:
Option holder Grant dateOptions
issued
Strike price(cents) vesting conditions
Life of option
S A Queen 31 March 2010 4 200 000 0 2 years’ profitability and continued employment 8 years
16 July 2010 693 000 42 2 years’ profitability and continued employment 8 years
4 July 2011 1 753 350 76 2 years’ profitability and continued employment 8 years
12 June 2012 2 173 335 110 2 years’ profitability and continued employment 8 years
Total for S A Queen 8 819 685
G D T Wege 31 March 2010 1 000 000 0 2 years’ profitability and continued employment 8 years
16 July 2010 288 750 42 2 years’ profitability and continued employment 8 years
4 July 2011 730 563 76 2 years’ profitability and continued employment 8 years
12 June 2012 753 655 110 2 years’ profitability and continued employment 8 years
Total for G D T Wege 2 772 968
D Duncan 31 March 2010 700 000 0 2 years’ profitability and continued employment 8 years
16 July 2010 202 125 42 2 years’ profitability and continued employment 8 years
4 July 2011 511 394 76 2 years’ profitability and continued employment 8 years
12 June 2012 633 889 110 2 years’ profitability and continued employment 8 years
Total for D Duncan 2 047 408
Other, not being directors 31 March 2010 8 000 000 0 2 years’ profitability and continued employment 8 years
16 July 2010 2 502 601 42 2 years’ profitability and continued employment 8 years
4 July 2011 4 780 656 76 2 years’ profitability and continued employment 8 years
12 June 2012 5 698 050 110 2 years’ profitability and continued employment 8 years
Total other 20 981 307 Total options in issue 34 621 368
Seardel integrated annual report 2014115

39 Share incentive Scheme (continued)
Reconciliation of movements in options:
2014 2013
number of options
Opening balance 43 819 982 41 594 266
Awarded during the period – 10 159 672
Exercised during the period (4 044 426) (5 579 925)
Lapsed/forfeited during the period (5 154 188) (2 354 031)
Closing balance 34 621 368 43 819 982
Number of options exercisable at year-end 13 125 315 6 031 875
Amount expensed during the year (included in employment costs) (Rand) 1 859 724 6 474 637
Value of shares issued during the year (Rand) 10 273 556 7 555 319
Weighted average share price of share options exercised during the year (Rand) 2,54 1,35
The weighted average remaining contractual life of all potentially exercisable options amounts to five years. In the event that all potentially exercisable options are exercised, an amount of R17 642 874 will be received by the Group.
valuation methodologyThe fair value of the options granted was determined as follows:
A stochastic model, based on the standard “binomial” options pricing model (which is mathematically consistent with the Black-Schöles-Merton model), but allows for the particular features of employee share options to be modelled realistically, was used.
The key principles of the Black-Schöles model are incorporated into this actuarial binomial model. They include:• risk-neutralvaluation;• theunderlyingsharepriceisassumedtofollowalog-normaldistributionofreturns;• stockreturnsareindependentlydistributed;• arisk-freereturncanbeearnedandisknowninadvance;• themarketisefficientandthusaninvestorcannotmakerisk-freeprofits;and• theunderlyingsharepricefollowsaMarkovprocess–i.e.wherethesharepricehasbeeninthepastdoesnothave
a bearing on where it will go in the future. All relevant information is contained in the share price at the grant date.
It follows then that if the actuarial binomial model is being used to value a call option that:• canonlybeexercisedonasingledate;• hasnoperformanceconditionsorvestingperiod;• hasaconstantvolatilityanddividendyieldthroughoutitslife;and• maynotbeforfeited,
then the value produced by the actuarial binomial model will be exactly equal to that produced by the Black-Schöles formula.
The inability of the Black-Schöles formula to value American options was remedied by Cox, Ross and Rubinstein who devised a binomial lattice technique for valuing share options using the underlying financial economic principles of Black, Schöles and Merton.
The binomial model has proved over time to be the most flexible, intuitive and popular approach to option pricing. It is based on the simplification that over a single period (of possibly very short duration) the underlying asset can only move from its current price to two possible levels.
Using the concept of hedging to replicate the option value at each step (using a combination of a risky and risk-free asset) it is possible to calculate the value of the option by working recursively backwards from the expiry of the option.
The lattice provides a tremendously flexible framework for valuing employee share options. This is because the possible share price at each point over the option lifetime is considered. The framework also allows for the division of the option lifetime into distinct periods – e.g. vesting period, closed period and eligible exercise period.
noteS to the financial StatementSFOR THE YEAR ENDED 31 MARCH (CONTINUED)
116
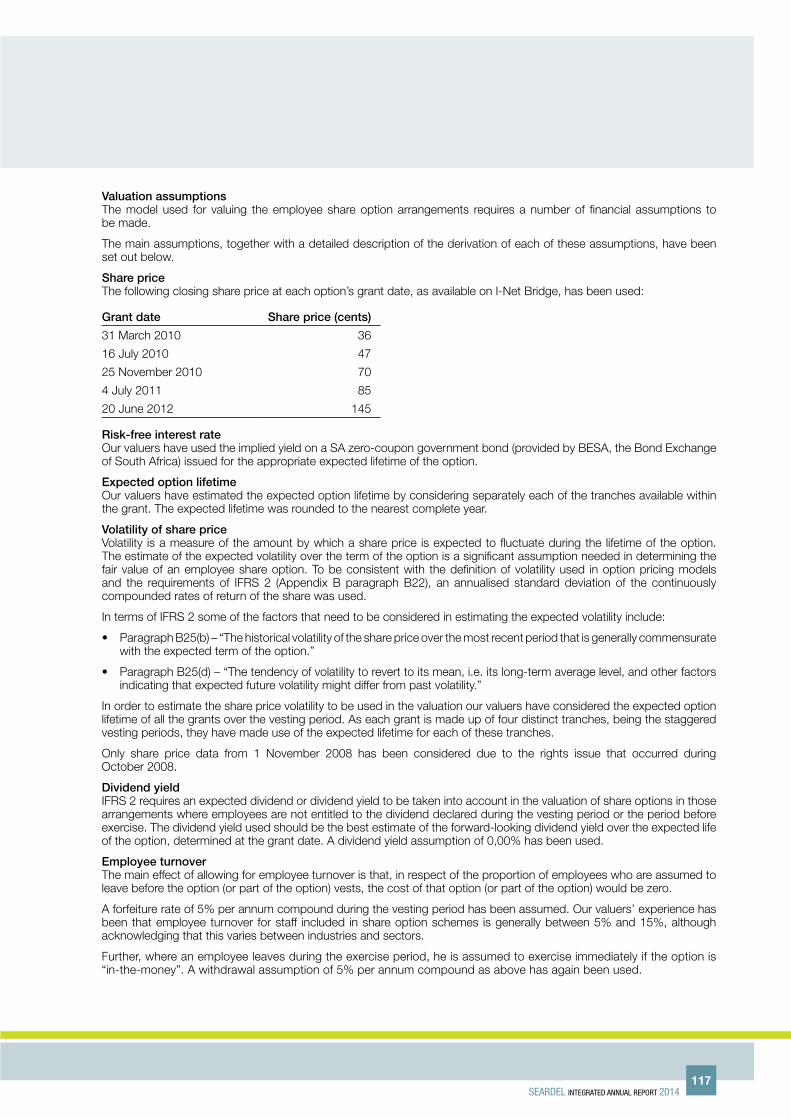
valuation assumptionsThe model used for valuing the employee share option arrangements requires a number of financial assumptions to be made.
The main assumptions, together with a detailed description of the derivation of each of these assumptions, have been set out below.
Share priceThe following closing share price at each option’s grant date, as available on I-Net Bridge, has been used:
Grant date Share price (cents)
31 March 2010 36
16 July 2010 47
25 November 2010 70
4 July 2011 85
20 June 2012 145
Risk-free interest rateOur valuers have used the implied yield on a SA zero-coupon government bond (provided by BESA, the Bond Exchange of South Africa) issued for the appropriate expected lifetime of the option.
expected option lifetimeOur valuers have estimated the expected option lifetime by considering separately each of the tranches available within the grant. The expected lifetime was rounded to the nearest complete year.
volatility of share priceVolatility is a measure of the amount by which a share price is expected to fluctuate during the lifetime of the option. The estimate of the expected volatility over the term of the option is a significant assumption needed in determining the fair value of an employee share option. To be consistent with the definition of volatility used in option pricing models and the requirements of IFRS 2 (Appendix B paragraph B22), an annualised standard deviation of the continuously compounded rates of return of the share was used.
In terms of IFRS 2 some of the factors that need to be considered in estimating the expected volatility include:
• ParagraphB25(b)–“Thehistoricalvolatilityofthesharepriceoverthemostrecentperiodthatisgenerallycommensuratewith the expected term of the option.”
• ParagraphB25(d)–“Thetendencyofvolatilitytoreverttoitsmean,i.e.itslong-termaveragelevel,andotherfactorsindicating that expected future volatility might differ from past volatility.”
In order to estimate the share price volatility to be used in the valuation our valuers have considered the expected option lifetime of all the grants over the vesting period. As each grant is made up of four distinct tranches, being the staggered vesting periods, they have made use of the expected lifetime for each of these tranches.
Only share price data from 1 November 2008 has been considered due to the rights issue that occurred during October 2008.
Dividend yieldIFRS 2 requires an expected dividend or dividend yield to be taken into account in the valuation of share options in those arrangements where employees are not entitled to the dividend declared during the vesting period or the period before exercise. The dividend yield used should be the best estimate of the forward-looking dividend yield over the expected life of the option, determined at the grant date. A dividend yield assumption of 0,00% has been used.
employee turnoverThe main effect of allowing for employee turnover is that, in respect of the proportion of employees who are assumed to leave before the option (or part of the option) vests, the cost of that option (or part of the option) would be zero.
A forfeiture rate of 5% per annum compound during the vesting period has been assumed. Our valuers’ experience has been that employee turnover for staff included in share option schemes is generally between 5% and 15%, although acknowledging that this varies between industries and sectors.
Further, where an employee leaves during the exercise period, he is assumed to exercise immediately if the option is “in-the-money”. A withdrawal assumption of 5% per annum compound as above has again been used.
Seardel integrated annual report 2014117
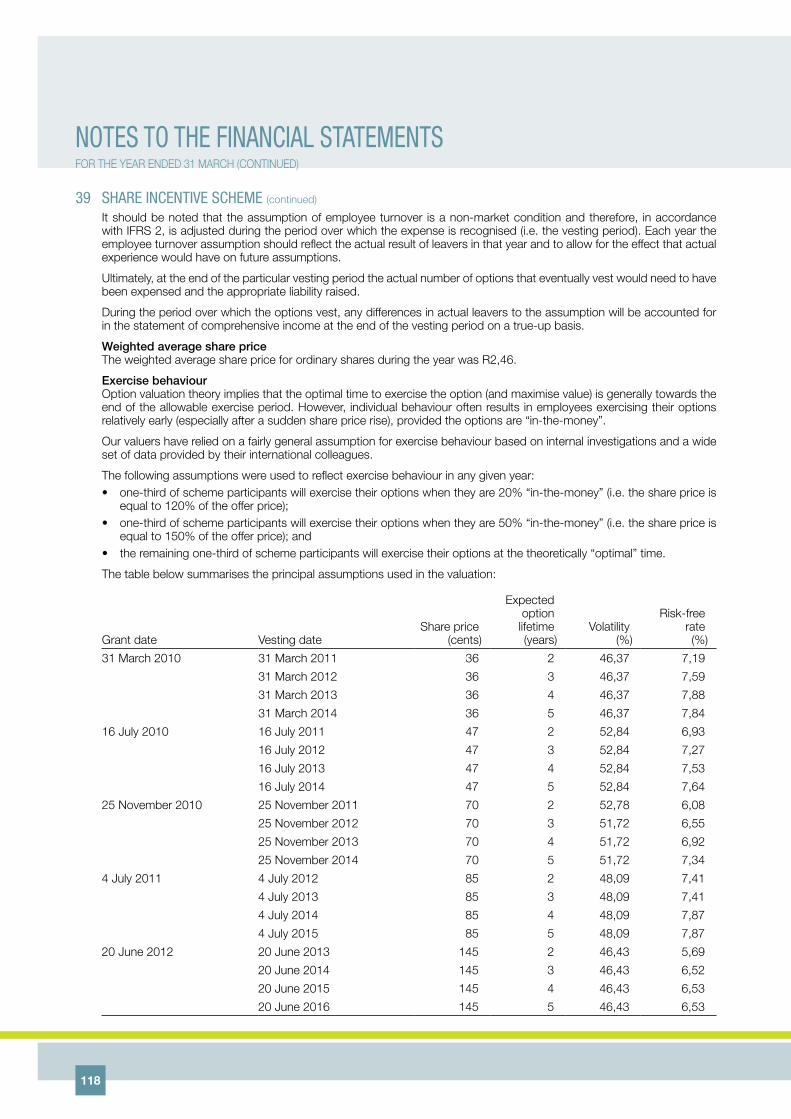
39 Share incentive Scheme (continued)
It should be noted that the assumption of employee turnover is a non-market condition and therefore, in accordance with IFRS 2, is adjusted during the period over which the expense is recognised (i.e. the vesting period). Each year the employee turnover assumption should reflect the actual result of leavers in that year and to allow for the effect that actual experience would have on future assumptions.
Ultimately, at the end of the particular vesting period the actual number of options that eventually vest would need to have been expensed and the appropriate liability raised.
During the period over which the options vest, any differences in actual leavers to the assumption will be accounted for in the statement of comprehensive income at the end of the vesting period on a true-up basis.
Weighted average share priceThe weighted average share price for ordinary shares during the year was R2,46.
exercise behaviourOption valuation theory implies that the optimal time to exercise the option (and maximise value) is generally towards the end of the allowable exercise period. However, individual behaviour often results in employees exercising their options relatively early (especially after a sudden share price rise), provided the options are “in-the-money”.
Our valuers have relied on a fairly general assumption for exercise behaviour based on internal investigations and a wide set of data provided by their international colleagues.
The following assumptions were used to reflect exercise behaviour in any given year:• one-thirdofschemeparticipantswillexercisetheiroptionswhentheyare20%“in-the-money”(i.e.thesharepriceis
equal to 120% of the offer price);• one-thirdofschemeparticipantswillexercisetheiroptionswhentheyare50%“in-the-money”(i.e.thesharepriceis
equal to 150% of the offer price); and• theremainingone-thirdofschemeparticipantswillexercisetheiroptionsatthetheoretically“optimal”time.
The table below summarises the principal assumptions used in the valuation:
Grant date Vesting dateShare price
(cents)
Expected option
lifetime (years)
Volatility (%)
Risk-free rate (%)
31 March 2010 31 March 2011 36 2 46,37 7,19
31 March 2012 36 3 46,37 7,59
31 March 2013 36 4 46,37 7,88
31 March 2014 36 5 46,37 7,84
16 July 2010 16 July 2011 47 2 52,84 6,93
16 July 2012 47 3 52,84 7,27
16 July 2013 47 4 52,84 7,53
16 July 2014 47 5 52,84 7,64
25 November 2010 25 November 2011 70 2 52,78 6,08
25 November 2012 70 3 51,72 6,55
25 November 2013 70 4 51,72 6,92
25 November 2014 70 5 51,72 7,34
4 July 2011 4 July 2012 85 2 48,09 7,41
4 July 2013 85 3 48,09 7,41
4 July 2014 85 4 48,09 7,87
4 July 2015 85 5 48,09 7,87
20 June 2012 20 June 2013 145 2 46,43 5,69
20 June 2014 145 3 46,43 6,52
20 June 2015 145 4 46,43 6,53
20 June 2016 145 5 46,43 6,53
noteS to the financial StatementSFOR THE YEAR ENDED 31 MARCH (CONTINUED)
118

valuation resultsCost per employee share option
Grant date Vesting date
Gross option price
(cents)
Gross option price as % of share price
(%)
Net option price(cents)
Net optionprice as % of share price
(%)31 March 2010 31 March 2011 36 100,0 36 100,0
31 March 2012 36 100,0 36 100,031 March 2013 36 100,0 36 100,031 March 2014 36 100,0 36 100,0
16 July 2010 16 July 2011 22 46,1 22 46,116 July 2012 25 52,5 25 52,516 July 2013 27 57,5 27 57,416 July 2014 28 60,3 28 59,4
25 November 2010 25 November 2011 33 46,7 33 46,725 November 2012 36 51,4 36 51,425 November 2013 40 56,7 40 56,725 November 2014 43 61,0 41 58,9
4 July 2011 4 July 2012 38 44,3 38 44,34 July 2013 42 49,8 42 49,84 July 2014 46 54,5 46 53,84 July 2015 50 58,4 47 54,8
20 June 2012 20 June 2013 69 47,6 69 47,620 June 2014 77 53,1 76 52,520 June 2015 83 57,0 78 53,620 June 2016 87 60,2 78 53,7
Cash settledDuring the year Seardel acquired a 100% interest in Sabido Holdco, which holds a 63,9% interest in Sabido Investment Proprietary Limited (Sabido). Sabido has a share incentive plan that provides selected employees with the opportunity to acquire ordinary shares in Sabido.
Options in issue are as follows:
2014number
of options
Weighted exercise price per
share option
(R)
Total value
(R)
Liability at year-end
(R)Other, not being directors 839 918 92,6 77 815 440 122 465 482
Reconciliation of movements in options:2014 2013
Opening balance – – Acquired through business combination 839 918 –Awarded during the period – – Exercised during the period – – Lapsed/forfeited during the period – – Closing balance 839 918 –
Total expenses of RNil (2013: RNil) related to these cash-settled share-based payment transactions were recognised in profit and loss during the year.
valuation methodologyThe fair value was determined using the information of the purchase price of the subsidiary at the date of acquisition.
Seardel integrated annual report 2014119
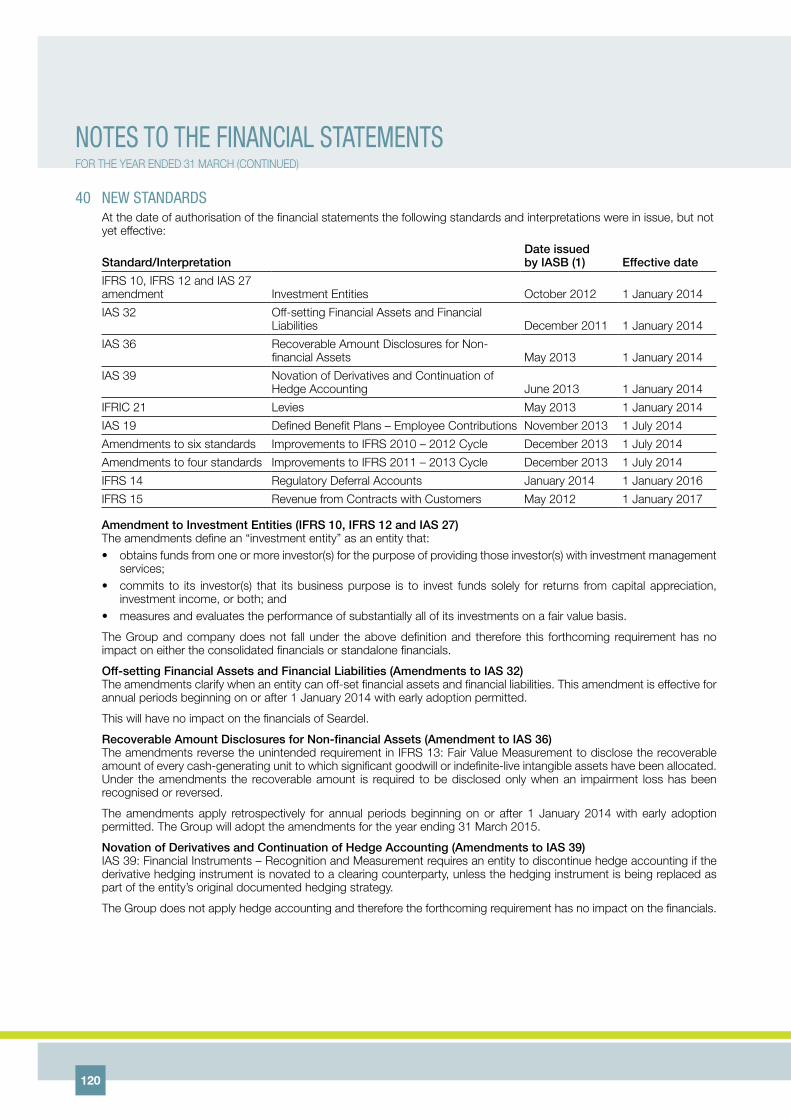
40 neW StandardSAt the date of authorisation of the financial statements the following standards and interpretations were in issue, but not yet effective:
Standard/interpretationDate issued by iaSB (1) effective date
IFRS 10, IFRS 12 and IAS 27 amendment Investment Entities October 2012 1 January 2014
IAS 32 Off-setting Financial Assets and Financial Liabilities December 2011 1 January 2014
IAS 36 Recoverable Amount Disclosures for Non-financial Assets May 2013 1 January 2014
IAS 39 Novation of Derivatives and Continuation of Hedge Accounting June 2013 1 January 2014
IFRIC 21 Levies May 2013 1 January 2014
IAS 19 Defined Benefit Plans – Employee Contributions November 2013 1 July 2014
Amendments to six standards Improvements to IFRS 2010 – 2012 Cycle December 2013 1 July 2014
Amendments to four standards Improvements to IFRS 2011 – 2013 Cycle December 2013 1 July 2014
IFRS 14 Regulatory Deferral Accounts January 2014 1 January 2016
IFRS 15 Revenue from Contracts with Customers May 2012 1 January 2017
amendment to investment entities (iFRS 10, iFRS 12 and iaS 27)The amendments define an “investment entity” as an entity that:• obtainsfundsfromoneormoreinvestor(s)forthepurposeofprovidingthoseinvestor(s)withinvestmentmanagement
services;• commits to its investor(s) that itsbusinesspurpose is to invest fundssolely for returns fromcapital appreciation,
investment income, or both; and• measuresandevaluatestheperformanceofsubstantiallyallofitsinvestmentsonafairvaluebasis.
The Group and company does not fall under the above definition and therefore this forthcoming requirement has no impact on either the consolidated financials or standalone financials.
Off-setting Financial assets and Financial Liabilities (amendments to iaS 32)The amendments clarify when an entity can off-set financial assets and financial liabilities. This amendment is effective for annual periods beginning on or after 1 January 2014 with early adoption permitted.
This will have no impact on the financials of Seardel.
Recoverable amount Disclosures for non-financial assets (amendment to iaS 36)The amendments reverse the unintended requirement in IFRS 13: Fair Value Measurement to disclose the recoverable amount of every cash-generating unit to which significant goodwill or indefinite-live intangible assets have been allocated. Under the amendments the recoverable amount is required to be disclosed only when an impairment loss has been recognised or reversed.
The amendments apply retrospectively for annual periods beginning on or after 1 January 2014 with early adoption permitted. The Group will adopt the amendments for the year ending 31 March 2015.
novation of Derivatives and Continuation of hedge accounting (amendments to iaS 39)IAS 39: Financial Instruments – Recognition and Measurement requires an entity to discontinue hedge accounting if the derivative hedging instrument is novated to a clearing counterparty, unless the hedging instrument is being replaced as part of the entity’s original documented hedging strategy.
The Group does not apply hedge accounting and therefore the forthcoming requirement has no impact on the financials.
noteS to the financial StatementSFOR THE YEAR ENDED 31 MARCH (CONTINUED)
120

Levies (iFRiC 21)Levies have become more common in recent years, with governments in a number of jurisdictions introducing levies to raise additional income. Current practice on how to account for these levies is mixed. IFRIC 21 provides guidance on accounting for levies in accordance with IAS 37: Provisions, Contingent Liabilities and Assets.
Defined Benefit Plans – employee Contributions (amendments to iaS 19)The amendments introduce relief that will reduce the complexity and burden of accounting for certain contributions from employees or third parties. Such contributions are eligible for practical expedient if they are:• setoutintheformaltermsoftheplan;• linkedtoservice;and• independentofthenumberofyearsofservice.
The above amendment will not have any material impact on the Group’s results.
Regulatory Deferral accounts (iFRS 14)IFRS 14 provides guidance on accounting for regulatory deferral account balances by first-time adopters of IFRS. To apply this standard the entity has to be rate-regulated, i.e. the establishment of prices that can be charged to its customers for goods and services is subject to oversight and/or approval by an authorised body.
Revenue from Contracts with Customers (iFRS 15)IFRS 15 establishes a five-step model that will apply to revenue earned from a contract with a customer (with limited exceptions), regardless of the type of revenue transaction or the industry. The standard’s requirements will also apply to the recognition and measurement of gains and losses on the sale of some non-financial assets that are not an output of the entity’s ordinary activities (e.g. sales of property, plant and equipment or intangibles).
The Group will adopt the standard in the first annual period beginning on or after the mandatory effective date (1 January 2015). The impact of the adoption of IFRS 15 has not yet been estimated.
Seardel integrated annual report 2014121
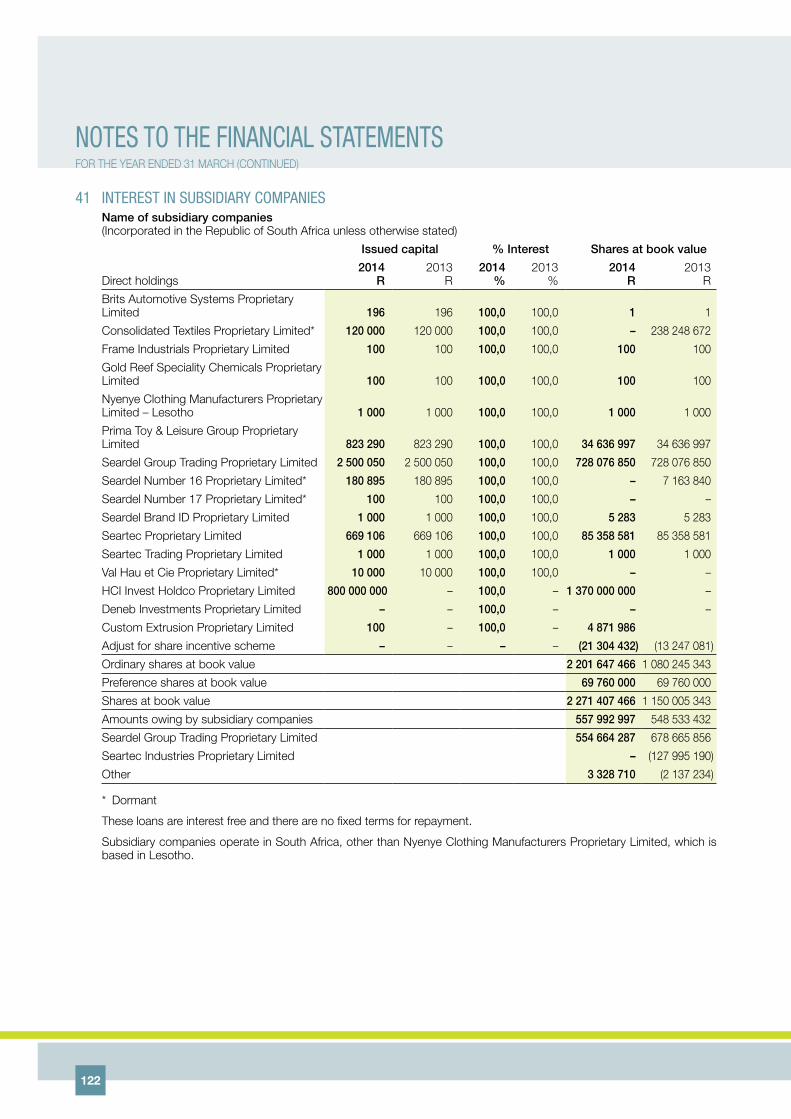
41 intereSt in SuBSidiary companieSname of subsidiary companies(Incorporated in the Republic of South Africa unless otherwise stated)
issued capital % interest Shares at book value
Direct holdings2014
R2013
R2014
%2013
%2014
R2013
R
Brits Automotive Systems Proprietary Limited 196 196 100,0 100,0 1 1
Consolidated Textiles Proprietary Limited* 120 000 120 000 100,0 100,0 – 238 248 672
Frame Industrials Proprietary Limited 100 100 100,0 100,0 100 100
Gold Reef Speciality Chemicals Proprietary Limited 100 100 100,0 100,0 100 100
Nyenye Clothing Manufacturers Proprietary Limited – Lesotho 1 000 1 000 100,0 100,0 1 000 1 000
Prima Toy & Leisure Group Proprietary Limited 823 290 823 290 100,0 100,0 34 636 997 34 636 997
Seardel Group Trading Proprietary Limited 2 500 050 2 500 050 100,0 100,0 728 076 850 728 076 850
Seardel Number 16 Proprietary Limited* 180 895 180 895 100,0 100,0 – 7 163 840
Seardel Number 17 Proprietary Limited* 100 100 100,0 100,0 – –
Seardel Brand ID Proprietary Limited 1 000 1 000 100,0 100,0 5 283 5 283
Seartec Proprietary Limited 669 106 669 106 100,0 100,0 85 358 581 85 358 581
Seartec Trading Proprietary Limited 1 000 1 000 100,0 100,0 1 000 1 000
Val Hau et Cie Proprietary Limited* 10 000 10 000 100,0 100,0 – –
HCI Invest Holdco Proprietary Limited 800 000 000 – 100,0 – 1 370 000 000 –
Deneb Investments Proprietary Limited – – 100,0 – – –
Custom Extrusion Proprietary Limited 100 – 100,0 – 4 871 986
Adjust for share incentive scheme – – – – (21 304 432) (13 247 081)
Ordinary shares at book value 2 201 647 466 1 080 245 343
Preference shares at book value 69 760 000 69 760 000
Shares at book value 2 271 407 466 1 150 005 343
Amounts owing by subsidiary companies 557 992 997 548 533 432
Seardel Group Trading Proprietary Limited 554 664 287 678 665 856
Seartec Industries Proprietary Limited – (127 995 190)
Other 3 328 710 (2 137 234)
* Dormant
These loans are interest free and there are no fixed terms for repayment.
Subsidiary companies operate in South Africa, other than Nyenye Clothing Manufacturers Proprietary Limited, which is based in Lesotho.
noteS to the financial StatementSFOR THE YEAR ENDED 31 MARCH (CONTINUED)
122

42 non-controlling intereStDuring the year Seardel acquired a 100% interest in Sabido Holdco, which holds a 63,9% (64,6% excluding treasury shares) interest in Sabido Investments Proprietary Limited (Sabido). The Group acquired 70% of Sabido Holdco on 1 October 2013 and the remaining 30% on 1 February 2014.
The following table summarises the information relating to each of the Group’s subsidiaries that has material non-controlling interest.
Sabido investments Proprietary Limited
2014 2013
non-controlling interest percentage 36,1% 0%
Non-current assets 3 884 285 –
Current assets 961 772 –
Non-current liabilities (909 193) –
Current liabilities (466 732) –
net assets 3 470 132 –
Less non-controlling interest in Sabido’s financials (1 482) –
net assets attributable to the shareholders of Sabido 3 468 650 –
Carrying amount of non-controlling interest 1 228 596 –
Add non-controlling interest in Sabido’s financials 1 482 –
Total carrying amount of non-controlling interest 1 230 078 –
Revenue 1 223 603 –
Profit for the year 180 612 –
Other comprehensive income for the year 2 431 –
Total comprehensive income 183 043 –
Profit allocated to non-controlling interest 52 770 –
Other comprehensive income allocated to non-controlling interest 861 –
Cash flows from operating activities 488 367 –
Cash flows from investment activities (214 574) –
Cash flows from financing activities (194 112) –
net increase/(decrease) in cash and cash equivalents 79 681 –
Seardel integrated annual report 2014123

Seartec: Sharp
124

Pursuant to the Listings Requirements of the JSE and to the best knowledge of the directors, after reasonable enquiry, the spread of shareholders at the reporting date was as follows:
2014 2013number
of share-holders %
number of shares %
Number of share-holders** %
Number of shares** %
Ordinary sharesNon-public 14 1,4 534 278 915 82,6 14 1,5 530 791 780 82,6 – Directors of the company
and subsidiaries 6 0,6 6 722 598 1,0 5 0,5 4 463 221 0,7 – Treasury shares 1 0,1 14 704 938 2,3 1 0,1 14 704 938 2,3 – Shareholders with more
than 10% holding* 2 0,2 510 634 821 79,0 2 0,2 509 734 821 79,3 – Non-director share scheme
participants 5 0,5 2 216 558 0,3 6 0,6 1 888 800 0,3 Public 1 003 98,6 112 250 312 17,4 920 98,5 111 695 021 17,4
1 017 100,0 646 529 227 100,0 934 100,0 642 486 801 100,0 N ordinary sharesNon-public 3 0,6 517 703 658 92,3 4 0,6 41 486 284 67,8 – Directors of the company
and subsidiaries – – – – – – – – – Treasury shares 1 0,2 6 123 306 1,1 1 0,2 6 123 306 10,0 – Shareholders with more
than 10% holding* 2 0,4 511 580 352 91,2 3 0,4 35 362 978 57,8 Public 508 99,4 43 378 499 7,7 638 99,4 19 746 793 32,2
511 100,0 561 082 157 100,0 642 100,0 61 233 077 100,0
* Includes indirect holdings held by directors via Fulela Trade Invest 81 (Pty) Ltd, Squirewood Investments 64 (Pty) Ltd and HCI Invest 6 Holdco (Pty) Ltd.
Directors’ interest in sharesAt the year-end the directors (including their family interests) were directly or indirectly interested in the company’s issued shares as follows:
2014 2013
Ordinary % n ordinary % Ordinary % N ordinary %
Direct 2 260 375 0,3 – – 873 750 0,1 – –
Indirect 30 425 950 4,7 642 293 0,1 25 683 711 4,0 535 691 0,9
There have been no material changes to the date of this report.
Details of directors’ beneficial direct and indirect interest in the ordinary and N ordinary shares are as follows:
Direct indirect
2014 2013 2014 2013
Ordinary n ordinary Ordinary N ordinary Ordinary n ordinary Ordinary N ordinary
S Queen – – – – 2 448 738 7 816 2 389 582 6 486
G Wege 1 123 750 – 873 750 – – – – –
D Duncan 1 136 625 – – – – – – –
A M Ntuli – – – – 1 419 32 1 220 28
Y Shaik – – – – – – 72 391 1 645
T Govender – – – – 1 117 071 25 333 730 443 16 594
J Copelyn – – – – 26 858 722 609 111 22 490 075 510 938
analySiS of ShareholderS
Seardel integrated annual report 2014125

Shareholders’ interest in sharesThe following are shareholders, other than directors, who own more than 5% of the company’s issued share capital per class of share:
2014 2013
Ordinary % n ordinary % Ordinary % N ordinary %
HCI Invest 6 Holdco (Pty) Ltd – – 500 000 000 89,1
Fulela Trade and Invest 81 (Pty) Ltd* 497 603 811 77,0 – – 497 603 811 77,4 – –
Ceejay Trust 32 778 542 5,1 5 536 334 1,0 32 778 542 5,1 5 536 334 9,0
36One Hedge Fund 15 873 242 2,5 8 471 0,0 22 101 527 3,4 4 739 530 7,7
SAACM – 36One Offshore Hedge Fund – – – – 3 198 714 0,5 5 595 791 9,1
Squirewood Investments 64 (Pty) Ltd* 13 031 010 2,0 11 580 352 2,1 12 131 010 1,9 11 580 352 18,9
SA Clothing & Textile Workers Union – 17 659 320 3,1 – 17 659 320 28,8
Executives and staff members of the Group, other than directors, held 4 190 013 ordinary and 4 371 N ordinary shares at
year end.
Shareholders and members of the public are advised that the register of interest of directors, executives, senior management
and other shareholders in the shares of the company is available upon request from the company secretary.
* Wholly-owned subsidiary of Hosken Consolidated Investments Limited.
analysis of shareholders
number ofshareholders
% of totalshareholders number of shares % of total shares
Seardel ordinary shares 2014 2013 2014 2013 2014 2013 2014 2013
1 – 1 000 536 529 53 60 126 632 118 320 – –
1 001 – 5 000 137 97 13 11 361 357 244 070 – –
5 001 – 50 000 208 136 21 15 4 220 190 2 965 171 1 –
50 001 – 100 000 41 38 4 4 3 285 634 3 084 575 – –
Over 100 000 95 86 9 10 638 535 414 636 074 665 99 100
1 017 886 100 100 646 529 227 642 486 801 100 100
2014%
2013%
Banks, investment, finance and nominee companies and trusts 95 96
Directors and staff 1 1
Individuals 3 3
Insurance companies and pension funds 0 0
analySiS of ShareholderS(CONTINUED)
126

number ofshareholders
% of totalshareholders
number of shares
% of total shares
Seardel N ordinary shares 2014 2013 2014 2013 2014 2013 2014 2013
1 – 1 000 226 317 44 50 82 741 113 237 – –
1 001 – 5 000 132 168 26 26 338 968 411 855 – 1
5 001 – 50 000 112 117 22 18 2 102 720 1 993 747 1 3
50 001 – 100 000 20 19 4 3 1 361 816 1 350 800 – 2
Over 100 000 21 21 4 3 557 195 912 57 363 438 99 94
511 642 100 100 561 082 157 61 233 077 100 100
2014%
2013%
Banks, investment, finance and nominee companies and trusts 99 87
Directors and staff 0 0
Individuals 1 13
Insurance companies and pension funds 0 0
The JSe Limited information – 31 march
2014 2013
Total number of shares traded (’000) Ordinary 39 565 18 705
N Ordinary 14 990 1 006
Total value of shares traded (R000’s) Ordinary 92 305 23 271
N Ordinary 42 687 1 242
Weighted average number of shares in issue (’000) Ordinary 629 590 627 780
N Ordinary 254 423 57 530
% of shares traded to weighted average number of issued shares Ordinary 6 3
N Ordinary 6 2
Seardel integrated annual report 2014127

notice of annual general meeting
(Incorporated in the Republic of South Africa) (Registration number 1968/011249/06)Ordinaryshares(sharecode:SER•ISIN:ZAE000029815)Nordinaryshares(sharecode:SRN•ISIN:ZAE000030144)(“Seardel” or “the company” or “the Group”)
NOTICE IS HEREBY GIVEN that the 45th annual general meeting of Seardel Investment Corporation Limited (“the company”) will be held at the offices of Hosken Consolidated Investments Limited Suite 801, 76 Regent Street, Sea Point 8005, Cape Town on 30 October 2014 at 10:00, at which the issues and resolutions set out in the agenda below will be considered and, if deemed fit, passed with or without modification.
general inStructionS and informationParticipants at the annual general meeting will be required to provide proof of identification to the reasonable satisfaction of the chairman of the annual general meeting and must accordingly provide a copy of their identity document, passport or driver’s licence at the annual general meeting for verification.
The board of directors of the company determined in accordance with section 59 of the Companies Act, 71 of 2008 (“the Companies Act”) that the record date for the purpose of determining which shareholders of the company were entitled to receive notice of the annual general meeting was 12 September 2014 and the record date for purposes of determining which shareholders of the company are entitled to participate in and vote at the annual general meeting is 17 October 2014. Accordingly, only shareholders who are registered in the register of shareholders of the company on 17 October 2014 will be entitled to participate in and vote at the annual general meeting.
All shareholders of ordinary and/or N ordinary shares in the company (“shares”) are entitled to attend, speak and vote at the annual general meeting. If you hold certificated shares (i.e. have not dematerialised your shares in the company) or are registered as an “own name” dematerialised shareholder (i.e. have specifically instructed your Central Securities Depository Participant (“CSDP”) to hold your shares in your own name on the company’s sub-register), then:
• youmayattendandvoteattheannualgeneralmeeting;alternatively
• youmayappointoneormoreproxies (whoneednotbeshareholdersof thecompany) torepresentyouat theannualgeneral meeting by completing the attached form of proxy and returning it to the office of the transfer secretaries, to be received by no later than 24 (twenty-four) hours prior to the time appointed for the holding of the meeting.
Please note that the company intends to make provision for shareholders of the company, or their proxies, to participate in the annual general meeting by way of electronic communication. Should you wish to participate in the annual general meeting by way of electronic communication as aforesaid, you are required to give notice of such proposed participation to the company at its registered office or at the office of the transfer secretaries by no later than 12:00 on Tuesday, 28 October 2014.
In order for the notice to be valid it must be accompanied by the following:
• iftheshareholderisanindividual,acertifiedcopyofhisidentitydocumentand/orpassport;
• if the shareholder is not an individual, a certified copy of the resolution adopted by the relevant entity authorisingthe representative to represent the shareholder at the annual general meeting and a certified copy of the authorised representative’s identity document and/or passport; and
• avalide-mailaddressand/orfacsimilenumberforthepurposeofreceivingnoticeofthemannerinwhichtheelectronicparticipation will be conducted.
128

Upon receipt of the aforesaid notice and documents the company shall notify you of the relevant details of the video-conference
facilities available in Durban and/or Johannesburg at which you can participate in the annual general meeting by way of
electronic communication.
Please note that if you own dematerialised shares (i.e. have replaced the paper share certificates representing the shares with
electronic records of ownership under the JSE Limited’s (“JSE”) electronic settlement system held through a CSDP or broker
(or their nominee)) and are not registered as an “own name” dematerialised shareholder, you are not a registered shareholder
of the company. Accordingly, in these circumstances, subject to the mandate between yourself and your CSDP or broker, as
the case may be:
• ifyouwishtoattendtheannualgeneralmeeting,youmustcontactyourCSDPorbroker,asthecasemaybe,andobtain
the relevant letter of representation from it; alternatively
• ifyouareunabletoattendtheannualgeneralmeetingbutwishtoberepresentedatthemeeting,youmustcontactyour
CSDP or broker, as the case may be, and furnish it with your voting instructions in respect of the annual general meeting
and/or request it to appoint a proxy. You must not complete the attached form of proxy. The instructions must be provided
in accordance with the mandate between yourself and your CSDP or broker, as the case may be, within the time period
required by your CSDP or broker, as the case may be. CSDPs, brokers or their nominees, as the case may be, recorded
in the company’s sub-register as holders of dematerialised shares held on behalf of an investor/beneficial owner should,
when authorised in terms of their mandate or instructed to do so by the person on behalf of whom they hold dematerialised
shares, vote by either appointing a duly authorised representative to attend and vote at the annual general meeting or
by completing the attached form of proxy in accordance with the instructions thereon and returning it to the office of the
company’s transfer secretaries to be received by not less than 24 (twenty-four) hours prior to the time appointed for the
holding of the meeting (excluding Saturdays, Sundays and public holidays).
On a poll the holders of ordinary shares of 25 cents each are entitled to 100 votes per ordinary share and the holders of
N ordinary shares of 0,25 cent each are entitled to one vote per N ordinary share.
Unless otherwise specifically provided below, for any of the ordinary resolutions to be adopted, more than 50% of the voting
rights exercised on each such ordinary resolution must be exercised in favour thereof. For any special resolutions to be
adopted, more than 75% of the voting rights exercised on each special resolution must be exercised in favour thereof.
The annual report to which this notice of annual general meeting is attached provides details of:
• thedirectorsandmanagementofthecompany,includingbriefCVsofthedirectorsnominatedforre-election,onpages 10
and 11;
• themajorshareholdersofthecompanyonpage 126;
• thedirectors’interestsinsecuritiesonpage 125;and
• thesharecapitalofthecompanyinnote 21andananalysisofshareholdersonpages 125to 127.
There are no material changes to the Group’s financial or trading position (other than as disclosed in the accompanying annual
report), nor are there any legal or arbitration proceedings that may materially affect the financial position of the Group between
31 March 2014 and the reporting date. The directors wish to draw your attention to the proposed separate listing of the
company’s non-media assets which is disclosed in the Directors’ Report on page 44.
The directors, namely John Copelyn, Stuart Queen, Mohamed Ahmed, Yunis Shaik, Amon Ntuli, Kevin Govender, Rachel Watson,
Gys Wege, David Duncan and Naziema Jappie, collectively and individually, accept full responsibility for the accuracy of the
information given and certify that to the best of their knowledge and belief there are no facts that have been omitted which
would make any statement false or misleading, and that all reasonable enquiries to ascertain such facts have been made, and
that the annual report and this notice provide all information required by law and the Listings Requirements of the JSE (“JSE
Listings Requirements”).
Seardel integrated annual report 2014129

purpoSeThe purpose of the annual general meeting is for the following business to be transacted and for the following special and ordinary resolutions to be proposed:
agenda1 To present the Financial Statements and Reports The consolidated audited financial statements of the company and its subsidiaries, including the external Auditors’, Audit
Committee’s and Directors’ Reports for the year ended 31 March 2014, have been distributed as required in terms of the company’s memorandum of incorporation (“MOI”) and the Companies Act, 71 of 2008 (“the Companies Act”), and will be presented to shareholders at the annual general meeting.
The complete set of the consolidated financial statements are set out on pages 38 to 123 of the document to which this notice of annual general meeting is attached. The Director’s Report is set out on page 43, and the Audit Committee Report is set out on pages 40 and 41 of the document to which this notice of annual general meeting is attached.
2 Ordinary resolutions 2.1 Re-election of Mr J A Copelyn as a non-executive director – ordinary resolution number 1 “Resolved that Mr J A Copelyn, who is required to retire in terms of the company’s MOI and who is eligible and has
offered himself for re-election, be and is hereby elected as a director.”
In terms of the company’s MOI at least one-third of the non-executive directors must retire each year and are eligible for re-election. The directors who shall retire shall be the longest-serving directors since their last election. The board has evaluated the past performance of Mr J A Copelyn and recommends his re-election. For CV details of Mr J A Copelyn, please see page 11.
2.2 Re-election of Mr K Govender as a non-executive director – ordinary resolution number 2 “Resolved that Mr K Govender, who is required to retire in terms of the company’s MOI and who is eligible and has
offered himself for re-election, be and is hereby elected as a director.”
In terms of the company’s MOI at least one-third of the non-executive directors must retire each year and are eligible for re-election. The directors who shall retire shall be the longest-serving directors since their last election. The board has evaluated the past performance of Mr K Govender and recommends his re-election. For CV details of Mr K Govender, please see page 11.
2.3 Election of Ms N Jappie as a non-executive director – ordinary resolution number 3 “Resolved that Ms N Jappie, who was appointed during the year by the board and is required to retire in terms of the
company’s MOI, be and is hereby elected as a director.”
The board has evaluated the past performance of Ms Jappie and recommends her re-election.
2.4 Appointment of audit committee – ordinary resolutions numbers 4, 5 and 6 “To appoint the following directors as members of the audit committee of the company for the ensuing year:
2.4.1 Mr M Ahmed;
2.4.2 Mrs N Jappie; and
2.4.3 Ms R Watson.”
The company, being a public listed company, must appoint an audit committee and the Companies Act requires that the members of such audit committee be appointed at each annual general meeting of a company. For CV details of the directors, please see pages 10 and 11. The members of the audit committee have been nominated by the board of directors for appointment as members of the company’s audit committee in terms of section 94(2) of the Companies Act. The board of directors has reviewed the proposed composition of the audit committee against the requirements of the Companies Act and the Regulations under the Companies Act and has confirmed that if all the individuals referred to above are elected, the committee will comply with the relevant requirements and have the necessary knowledge, skills and experience to enable it to perform its duties in terms of the Companies Act.
notice of annual general meeting(CONTINUED)
130
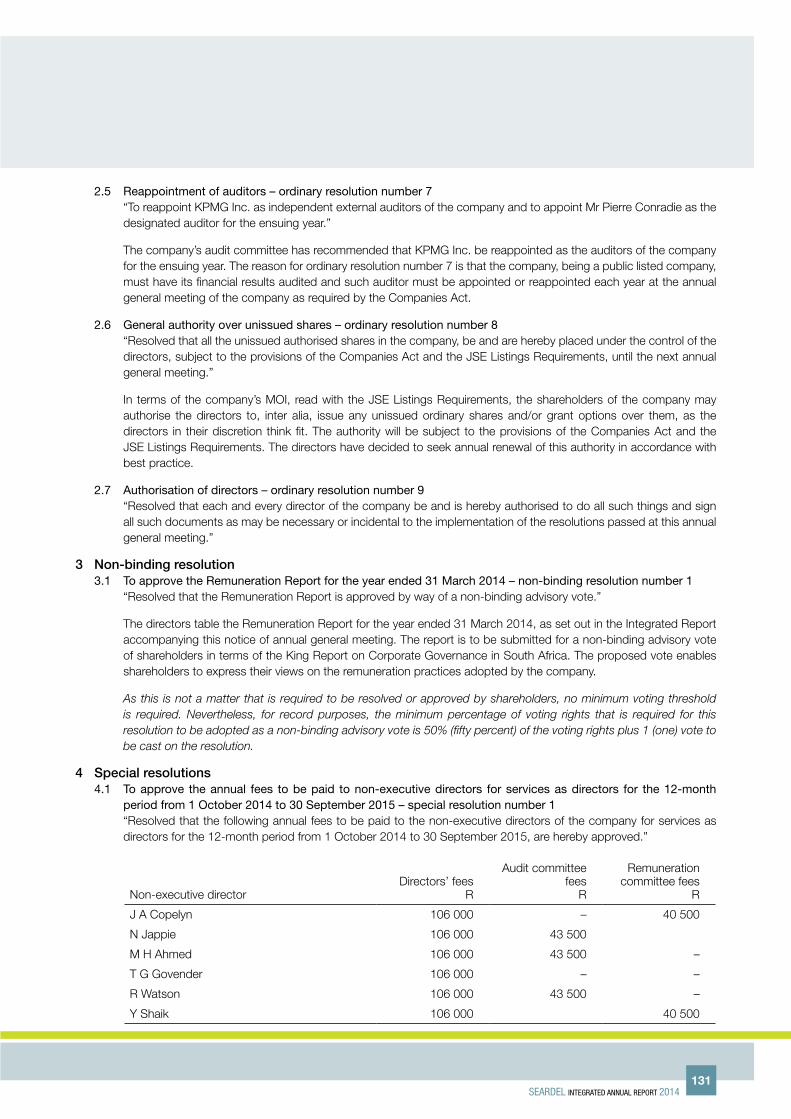
2.5 Reappointment of auditors – ordinary resolution number 7 “To reappoint KPMG Inc. as independent external auditors of the company and to appoint Mr Pierre Conradie as the
designated auditor for the ensuing year.”
The company’s audit committee has recommended that KPMG Inc. be reappointed as the auditors of the company for the ensuing year. The reason for ordinary resolution number 7 is that the company, being a public listed company, must have its financial results audited and such auditor must be appointed or reappointed each year at the annual general meeting of the company as required by the Companies Act.
2.6 General authority over unissued shares – ordinary resolution number 8 “Resolved that all the unissued authorised shares in the company, be and are hereby placed under the control of the
directors, subject to the provisions of the Companies Act and the JSE Listings Requirements, until the next annual general meeting.”
In terms of the company’s MOI, read with the JSE Listings Requirements, the shareholders of the company may authorise the directors to, inter alia, issue any unissued ordinary shares and/or grant options over them, as the directors in their discretion think fit. The authority will be subject to the provisions of the Companies Act and the JSE Listings Requirements. The directors have decided to seek annual renewal of this authority in accordance with best practice.
2.7 Authorisation of directors – ordinary resolution number 9 “Resolved that each and every director of the company be and is hereby authorised to do all such things and sign
all such documents as may be necessary or incidental to the implementation of the resolutions passed at this annual general meeting.”
3 non-binding resolution 3.1 To approve the Remuneration Report for the year ended 31 March 2014 – non-binding resolution number 1 “Resolved that the Remuneration Report is approved by way of a non-binding advisory vote.”
The directors table the Remuneration Report for the year ended 31 March 2014, as set out in the Integrated Report accompanying this notice of annual general meeting. The report is to be submitted for a non-binding advisory vote of shareholders in terms of the King Report on Corporate Governance in South Africa. The proposed vote enables shareholders to express their views on the remuneration practices adopted by the company.
As this is not a matter that is required to be resolved or approved by shareholders, no minimum voting threshold is required. Nevertheless, for record purposes, the minimum percentage of voting rights that is required for this resolution to be adopted as a non-binding advisory vote is 50% (fifty percent) of the voting rights plus 1 (one) vote to be cast on the resolution.
4 Special resolutions 4.1 To approve the annual fees to be paid to non-executive directors for services as directors for the 12-month
period from 1 October 2014 to 30 September 2015 – special resolution number 1 “Resolved that the following annual fees to be paid to the non-executive directors of the company for services as
directors for the 12-month period from 1 October 2014 to 30 September 2015, are hereby approved.”
Non-executive directorDirectors’ fees
R
Audit committee fees
R
Remuneration committee fees
R
J A Copelyn 106 000 – 40 500
N Jappie 106 000 43 500
M H Ahmed 106 000 43 500 –
T G Govender 106 000 – –
R Watson 106 000 43 500 –
Y Shaik 106 000 40 500
Seardel integrated annual report 2014131

The reason for this special resolution is to obtain the approval of shareholders by way of special resolution for the payment of remuneration to its non-executive directors in accordance with the requirements of the Companies Act. The effect of this special resolution, if passed, is that the company will be able to pay its non-executive directors for the services that they render to the company as directors without requiring further shareholder approval until the next annual general meeting.
4.2 General authority to issue shares for cash – special resolution number 2 “Resolved that the directors of the company be and are hereby authorised by way of a general authority to issue
(which shall for the purposes of the JSE Listings Requirements include the sale of treasury shares) for cash (as contemplated in the JSE Listings Requirements) all or any of the authorised but unissued shares in the capital of the company, including options over such shares, as and when they in their discretion deem fit, subject to the Companies Act, the MOI of the company and the JSE Listings Requirements as presently constituted and which may be amended from time to time, and provided that such issues for cash may not, in the aggregate, in any 1 (one) financial year, exceed 15% (fifteen percent) of the number of shares at the relevant class of shares issued prior to such issue.”
Additional requirements imposed by the JSE Listings Requirements
It is recorded that the company may only make an issue of shares for cash under the above general authority if the following JSE Listings Requirements are met:
• theshares,whicharethesubjectoftheissueforcash,mustbeofaclassalreadyinissue,orwherethisisnotthecase, must be limited to such equity securities or rights that are convertible into a class already in issue;
• thegeneralauthorityshallonlybevaliduntilthecompany’snextannualgeneralmeetingorfor15(fifteen)monthsfrom the date of passing of this ordinary resolution, whichever period is shorter;
• a paid press announcement will be published giving full details, including the number of shares issued, theaverage discount to the weighted average traded price of the shares over the 30 (thirty) days prior to the date that the price of the issue was agreed in writing between the company and party/ies subscribing for such shares and the expected effect on the net asset value per share, net tangible asset value per share, earnings per share and headline earnings per share at the time of any issue representing, on a cumulative basis within 1 (one) financial year, 5% (five percent) of the number of shares in issue prior to that issue;
• thatissuesintheaggregateinany1(one)financialyearmaynotinrespectof:
– ordinary shares exceed 95 592 187 representing 15% (fifteen percent) of the ordinary shares of the company, excluding treasury shares, taking into account the dilution effect of convertible equity securities and options in accordance with the JSE Listings Requirements; and
– N ordinary shares exceed 552 016 465 representing 15% (fifteen percent) of the N ordinary shares of the company, excluding treasury shares, taking into account the dilution effect of convertible equity securities and options in accordance with the JSE Listings Requirements;
• indeterminingthepriceatwhichanissueofsharesmaybemadeintermsofthisgeneralauthority,themaximumdiscount permitted will be 10% (ten percent) of the weighted average traded price on the JSE of those shares measured over the 30 (thirty) days prior to the date that the price of the issue is agreed to between the company and the party/ies subscribing for the shares; and
• any issuewillonlybemadeto“publicshareholders”asdefinedbytheJSEListingsRequirementsandnottorelated parties.
4.3 General authority to repurchase company shares – special resolution number 3 “Resolved that the company hereby approves, as a general approval contemplated in JSE Listings Requirement 5.72,
the acquisition by the company or any of its subsidiaries from time to time of the issued shares of the company, upon such terms and conditions and in such amounts as the directors of the company may from time to time determine,
notice of annual general meeting(CONTINUED)
132

but subject to the provisions of the Companies Act and the JSE Listings Requirements as presently constituted and which may be amended from time to time, and provided that:
• acquisitionsbythecompanyanditssubsidiariesofsharesinthecapitalofthecompanymaynot,intheaggregate,exceed in any one financial year 20% (twenty percent) (or 10% (ten percent) where such acquisitions relate to the acquisition by a subsidiary) of the company’s issued share capital of the class of the repurchased shares from the date of the grant of this general authority;
• anysuchacquisitionofsharesshallbeeffectedthroughtheorderbookoperatedbytheJSEtradingsystemanddone without any prior understanding or arrangement between the company and the counterparty (reported trades are prohibited);
• thecompany(oranysubsidiary)isauthorisedtodosointermsofitsMOI;
• thisgeneralauthorityshallonlybevaliduntilthecompany’snextannualgeneralmeeting,providedthatitshallnotextend beyond 15 (fifteen) months from the date of passing of this special resolution;
• indeterminingthepriceatwhichthecompany’ssharesareacquiredbythecompanyoritssubsidiariesintermsof this general authority, the maximum premium at which such shares may be acquired may not be greater than 10% (ten percent) above the weighted average of the market price at which such shares are traded on the JSE for the 5 (five) business days immediately preceding the date the repurchase transaction is effected;
• atanypoint in time, thecompanymayonlyappointoneagent toeffectany repurchase(s)on thecompany’sbehalf;
• thecompanyoritssubsidiariesmaynotrepurchasesharesduringaprohibitedperiodasdefinedinparagraph 3.67of the Listings Requirements of the JSE unless there is a repurchase programme in place and the dates and quantities of shares to be repurchased during the prohibited period are fixed and full details thereof have been disclosed in an announcement on SENS prior to commencement of the prohibited period;
• inthecaseofaderivative(ascontemplatedintheJSEListingsRequirements)thepriceofthederivativeshallbesubject to the limits set out in paragraph 5.84(a) of the JSE Listings Requirements; and
• apaidpressannouncementwillbepublishedassoonasthecompanyand/oritssubsidiarieshas/haveacquiredshares constituting, on a cumulative basis 3% (three percent) of the number of shares of the class of shares repurchased in issue at the time of granting of this general authority, and each time the company acquires a further 3% (three percent) of such shares thereafter, which announcement shall contain full details of such acquisitions.”
Statement by the board of directors of the company Pursuant to and in terms of the JSE Listings Requirements, the board of directors of the company hereby state that:
a) it is their intention to utilise the general authority to acquire shares in the company if at some future date the cash resources of the company are in excess of its requirements or there are good grounds for doing so. In this regard the directors will take account of, inter alia, an appropriate capitalisation structure for the company, the long-term cash needs of the company, and the interests of the company;
b) in determining the method by which the company intends to acquire its shares, the maximum number of shares to be acquired and the date on which such acquisition will take place, the directors of the company will only make the acquisition if at the time of the acquisition they are of the opinion that:
• thecompanyanditssubsidiarieswould,aftertherepurchase,beabletopaytheirdebtsastheybecomeduein the ordinary course of business for the next 12 (twelve) months after the date of this notice of the annual general meeting;
Seardel integrated annual report 2014133
• theconsolidatedassetsofthecompanyanditssubsidiaries,fairlyvaluedinaccordancewithInternationalFinancial Reporting Standards and recognised and measured in accordance with the accounting policies used in the latest audited financial statements, would, after the repurchase, be in excess of the consolidated liabilities of the company and its subsidiaries for the next 12 (twelve) months after the date of approval of this special resolution;
• theissuedsharecapitalandreservesofthecompanyanditssubsidiarieswould,aftertherepurchase,beadequate for the ordinary business purposes of the company or any acquiring subsidiary for the next 12 (twelve) months after the date of approval of this special resolution; and
• theworkingcapitalavailabletothecompanyanditssubsidiarieswould,aftertherepurchase,beadequatefor the ordinary business purposes for the next 12 (twelve) months after the date of approval of this special resolution; and
c) they will not make any repurchase until such time as the company’s sponsors have provided the JSE with a letter in relation to the working capital statement set out above (as required in terms of the JSE Listings Requirements).
Reason and effect of special resolution number 3 The reason for special resolution number 3 is to grant the company a general authority in terms of the JSE Listings
Requirements for the acquisition by the company, or any of its subsidiaries, of shares issued by the company, which authority shall be valid until the earlier of the next annual general meeting of the company, and the date that is 15 (fifteen) months from the date of this annual general meeting. The passing of this special resolution will have the effect of authorising the company or any of its subsidiaries to acquire shares issued by the company.
5 To transact such other business which may be transacted at an annual general meeting
By order of the board
hCi managerial Services Proprietary LimitedCompany Secretary
Cape Town18 September 2014
notice of annual general meeting(CONTINUED)
134

seardel investment corporation limited(Incorporated in the Republic of South Africa) (Registration number 1968/011249/06)Ordinary shares (share code: SER • ISIN: ZAE000029815) N ordinary shares (share code: SRN • ISIN: ZAE000030144)(“Seardel” or “the company” or “the Group”)
I/We,___________________________________________________________________________________________ (name in full)
of address _________________________________________________________________________________________________
being a registered holder of ____________ ordinary shares and _______________ N ordinary shares in the company, hereby appoint
1. _________________________________________________________________________________________ or failing him/her
2. _________________________________________________________________________________________ or failing him/her
3. _________________________________________________________________________________________ or failing him/her
the chairman of the meeting, as my/our proxy to vote for me/us and on my/our behalf at the annual general meeting of the company to be held at 10:00 on 30 October 2014 at the offices of HCI, Suite 801, 76 Regent Street, Sea Point 8005, Cape Town and at any adjournment thereof as follows:
agenda description for against abstain2 ordinary resolutions2.1 Election of director: Mr J Copelyn (ordinary resolution No. 1)2.2 Election of director: Mr K Govender (ordinary resolution No. 2)2.3 Election of director: Ms N Jappie (ordinary resolution No. 3)2.4.1 Appointment of audit committee member: Mr M Ahmed (ordinary resolution No. 4)2.4.2 Appointment of audit committee member: Ms N Jappie (ordinary resolution No. 5)2.4.3 Appointment of audit committee member: Ms R Watson (ordinary resolution No. 6)2.5 Appointment of auditor (ordinary resolution No. 7)2.6 General authority over unissued shares (ordinary resolution No. 8)2.7 General authorisation of directors to implement resolutions passed (ordinary resolution
No. 9)3 non-binding resolution3.1 To approve the Remuneration Report for the year ended 31 March 2014 (non-binding
resolution No. 1)4 special resolutions4.1 To approve annual fees to be paid to non-executive directors (special resolution No. 1)4.2 General authority to issue shares (special resolution No. 2)4.3 General authority to repurchase company shares (special resolution No. 3)
Indicate instructions to proxy by way of a cross in the space provided above (100 votes per ordinary share and one vote per N ordinary share).
Unless otherwise instructed my proxy may vote as he/she thinks fit.
Signed this __________________________________________ day of___________________________________________ 2014.
Signature ____________________________________________
Assisted by me (where applicable)
Please read the notes overleaf
form of proxy
1 A form of proxy is only to be completed by those shareholders who are:
• holdingsharesincertificatedform;or • recorded in the sub-register indematerialisedelectronic
form in “own name”.
2 If you have already dematerialised your shares through a Central Securities Depository Participant (“CSDP”) or broker, other than with “own name” registration, and wish to attend the annual general meeting, you must request your CSDP or broker to provide you with a letter of representation or you must instruct your CSDP or broker to vote by way of proxy on your behalf in terms of the agreement entered into by yourself and the CSDP or broker.
3 A shareholder entitled to attend and vote at the meeting is entitled to appoint an individual as a proxy, who need not be a shareholder of the company, to attend, participate in and vote at a shareholders’ meeting on the shareholder’s behalf, and may appoint more than one proxy to exercise voting rights attached to different securities held by the shareholder.
4 The proxy may delegate his/her authority to act on the shareholder’s behalf to another person, subject to any restriction set out in this proxy form.
5 Every person present and entitled to vote at the meeting as a shareholder or as a proxy or as a representative of a body corporate shall, on a show of hands, have one vote only, irrespective of the number of shares such a person holds or represents, but in the event of a poll, a shareholder shall be entitled to that proportion of the total votes in the company which aggregate amount of the nominal value of the shares held by such shareholder bears to the aggregate amount of the nominal value of all shares issued by the company.
6 Please insert the relevant number of shares/votes and indicate with an X in the appropriate spaces on the face thereof, how you wish your votes to be cast. If you return this form duly signed without specific directions, the proxy will vote or abstain from voting at his/her discretion.
7 A deletion of any printed details and the completion of any blank space/s need not be signed or initialled. Any alteration must be initialled.
8 The chairman of the annual general meeting shall be entitled to decline to accept the authority of the signatory under a power of attorney, or on behalf of a company, unless the power of attorney or authority is produced.
9 The signatory may insert the name of any person/s that the signatory wishes to appoint as his/her proxy, in the blank space/s provided for that purpose.
10 When there are joint holders of shares and if more than one such joint holder be present or represented, then the person whose name stands first in the register in respect of such shares or his/her proxy, as the case may be, shall alone be entitled to vote in respect thereof.
11 A minor should be assisted by his parents or legal guardian unless the relevant documents establishing his legal capacity are produced.
12 The completion and lodging of this proxy form will not preclude the signatory from attending the annual general meeting and
speaking and voting in person thereat to the exclusion of any proxy appointed in terms hereof should such signatory wish to do so.
13 A shareholder’s instructions must be indicated by the insertion of a cross, or where applicable, the relevant number of votes exercisable by the shareholder, in the appropriate box of this proxy form.
14 If the signatory does not indicate how he/she wishes to vote in the appropriate place/s on the face hereof in respect of the resolution, his/her proxy shall be entitled to vote as he/she deems fit in respect of the resolutions.
15 If the shareholding is not indicated on the proxy form, the proxy will be deemed to be authorised to vote the total shareholding.
16 The chairman of the general meeting may reject or accept any proxy form which is completed other than in accordance with these instructions, provided that he is satisfied as to the manner in which a shareholder wishes to vote.
17 The appointment of the proxy or proxies will be suspended at any time and to the extent that the shareholder chooses to act directly and in person in the exercise of any of the shareholder’s rights as a shareholder at the annual general meeting.
18 The appointment of your proxy is revocable unless you expressly state otherwise in this proxy form. As the appointment of the proxy is revocable, the shareholder may revoke the proxy appointment by (i) cancelling it in writing, or making a later inconsistent appointment of a proxy and (ii) delivering a copy of the revocation instrument to the proxy, and to the company. Please note the revocation of a proxy appointment constitutes a complete and final cancellation of the shareholder’s proxy’s authority to act on the shareholder’s behalf as of the later of (i) the date stated in the revocation instrument, if any, or (ii) the date on which the revocation instrument was delivered to the company and the proxy as aforesaid.
19 If the proxy form has been delivered to the company, as long as that appointment remains in effect, any notice that is required by the Companies Act or the company’s memorandum of incorporation to be delivered by the company to the shareholder will be delivered by the company to the shareholder or the shareholder’s proxy or proxies, if the shareholder has directed the company to do so in writing and paid a reasonable fee charged by the company for doing so.
20 The appointment of the proxy remains valid only until the end of the relevant meeting or any adjournment or postponement thereof or for a period of one year, whichever is shortest, unless it is revoked by the shareholder before then on the basis set out above.
21. Forms of proxy must be returned by the shareholders concerned to the registered office of the company or the transfer secretaries, Computershare Investor Services Proprietary Limited, Ground Floor, 70 Marshall Street, Johannesburg, 2001 (PO Box 61051, Marshalltown, 2107) so as to be received, for administrative purposes, by no later than 10:00 on 28 October 2014.
noteS to the proxy form

Seardel investment Corporation Limited
(“Seardel” or “the Group”)
The company’s shares are listed under the Consumer Goods – Personal and Household Goods Sector of the JSE Limited.
Registration number: 1968/011249/06 (Incorporated in the Republic of South Africa)
JSe share code: SER iSin: ZAE000029815
JSe share code: SRN iSin: ZAE000030144
Registered office: 1 Moorsom Avenue, cnr Bofors Circle and Moorsom Avenue, Epping Industria II 7460
PO Box 524, Eppindust 7475, South Africa
Directors: J A Copelyn* (Chairman), M H Ahmed*^ (Lead Independent Director), D Duncan, T G Govender*,
N Jappie*^, A M Ntuli, S A Queen (Chief Executive Officer), Y Shaik*, R Watson*^, G D T Wege
(Financial Director)
(* Non-executive ^ Independent)
Company secretary: HCI Managerial Services Proprietary Limited
Transfer secretaries: Computershare Investor Services Proprietary Limited, 70 Marshall Street, Johannesburg 2001
PO Box 61051, Marshalltown 2107
auditors: KPMG Inc.
Sponsors: Investec Bank Limited
corporate information

1 Moorsom Avenue,corner Bofors Circle and Moorsom Avenue
Epping Industria 2Cape Town 7460
Email: [email protected]: +27 21 505 5000Fax: +27 86 679 3866
www.seardel.co.za