integral communication, damage detection, and multiple ... library/research/oil-gas/natural...
TRANSCRIPT

INEEL/EXT-03-00070
Integral Communication, Damage Detection, and Multiple Sensor Application in Pipelines Field Work Proposal No: 4340-70 Idaho National Engineering and Environmental Laboratory Year Report - FY02 Robert A. Carrington, Karen A. Moore, John G. Richardson February 2003
Idaho National Engineering and Environmental Laboratory Bechtel BWXT Idaho, LLC

INEEL/EXT-03-00070
Integral Communication, Damage Detection, and Multiple Sensor Application in Pipelines
Field Work Proposal No: 4340-70 Idaho National Engineering and Environmental Laboratory
Year Report - FY02
Robert A. Carrington, Karen A. Moore, John G. Richardson
Program Sponsor National Energy Technology Laboratory
Natural Gas Infrastructure Reliability Program
Idaho National Engineering and Environmental Laboratory Fossil Energy Technologies Department
Idaho Falls, Idaho 83415
Prepared for the U.S. Department of Energy
Office of Fossil Energy Under DOE Idaho Operations Office
Contract DE-AC07-99ID13727
February 2003
i

DISCLAIMER
This information was prepared as an account of work sponsored by an agency of the U.S. Government. Neither the U.S. Government nor any agency thereof, nor any of their employees, makes any warranty, express or implied, or assumes any legal liability or responsibility for the accuracy, completeness, or usefulness of any information, apparatus, product, or process disclosed, or represents that its use would not infringe privately owned rights. References herein to any specific commercial product, process, or service by trade name, trademark, manufacturer, or otherwise, does not necessarily constitute or imply its endorsement, recommendation, or favoring by the U.S. Government or any agency thereof. The views and opinions of authors expressed herein do not necessarily state or reflect those of the U.S. Government or any agency thereof.
ii

SUMMARY
The objective of the project is to develop and demonstrate a new
technology that utilizes the electrical properties of thermally sprayed coatings, applied to either the interior or exterior wall of a pipeline, for near real time detection and location of damage and the transmission of that data to a central receiving station.
Significant progress was made in meeting FY02 project goals to: • Characterize the change in trace electrical resistivity as a function of
strain. • Model the detection algorithm and establish the correlation between
trace pattern, accuracy and variability of trace resistivity, and damage detection location resolution
• Develop a robust process for applying the traces • Characterize data communication along the traces.
Using sprayed conductive traces on natural gas pipelines for detection of plastic deformation was shown to be technically feasible and sufficiently rugged for field use. The magnitude of trace resistivity change as a function of strain has been found sufficient to allow detection and location of damage along a nominal 20-mile section of the pipeline with a location resolution of 1-2 pipe segments (40 – 80 ft.). Industrial support and regulatory support will be needed before commercialization can occur.
Specific accomplishments include: • The variability of the trace electrical resistance has been
characterized. This will allow modeling of the numerical system for damage detection to proceed.
• The causes of the variability are understood and efforts to minimize the variability have been undertaken. Reduced variability will increase damage detection location resolution.
• Methods of attaching wires to the traces for test measurements and interface to data transmission systems have been developed.
• The computer programs for logging strain and resistance measurements have been generated.
iii

iv

CONTENTS
SUMMARY................................................................................................................................................. iii
1. Introduction and Objective of the Work............................................................................................. 1
2. The Concept........................................................................................................................................ 1
3. FY 02 Goals........................................................................................................................................ 2
3.1 Goal 1– Characterize the change in trace electrical resistivity as a function of strain............. 2 3.1.1 Technology Basis .......................................................................................................... 2 3.1.2 Summary of Test Results............................................................................................... 3
3.2 Goal 2 - Model the detection algorithm and establish the correlation between trace pattern, accuracy and variability of trace resistivity, and damage detection location resolution .......... 9 3.2.1 Technology Basis .......................................................................................................... 9 3.2.2 Trace Patterns ................................................................................................................ 9
3.3 Goal 3 – Develop a Robust Process for Applying the Traces ................................................ 11
3.4 Goal 4 – Characterize Data Communications along the Traces............................................. 14
3.5 Goal 5 - Regulatory Acceptance ............................................................................................ 14
4. Other Accomplishments ................................................................................................................... 14
Appendix A
Spray Parameters for Nickel Aluminide Conductive Traces…………………………………………….A-1
FIGURES
Figure 1 Change of Resistance with Strain ............................................................................................ 4
Figure 2 Distribution of Strain in 3” Pipe Test Section ......................................................................... 6
Figure 3 Change in Resistance vs. Strain For Traces on the 3” Pipe test Section.................................. 7
Figure 4 Normalized resistance-per-foot values measured every two inches ........................................ 8
Figure 5 The variability of the values is less when measured over 6 inches. ......................................... 9
v

Figure 6 The pipe will have 4 sets of traces around the circumference................................................ 10
Figure 7 Cross Section of a coating...................................................................................................... 13
Figure 8 Histogram for analyzing porosity of cross section................................................................. 13
TABLES
Table 1 Deflection vs. Strain Data for Coupon #7............................................................................... 4
Table 2 The machine parameters ........................................................................................................ 5
Table 3 Specific resistance-per-ft values for the 8 coupons................................................................ 5
Table 4 Strain vs. Resistance of Traces on the 3" diameter pipe ......................................................... 6
Table 5 Proportionality of change in resistance to increasing strain..................................................... 7
Table 6 Resistance/ft values from specific data trace configurations ................................................. 10
Table A-1 Set Up for the Bond Coat and Insulating Layer ...................................................................A-3
Table A-2 Set Up for the Conductive Trace..........................................................................................A-4
vi

1. INTRODUCTION AND OBJECTIVE OF THE WORK
The technology described in this paper is one of the current portfolio projects developed by the Idaho National Engineering and Environmental Laboratory (INEEL) for pipeline damage detection and location. The work is sponsored by the National Energy Technology Laboratory’s Natural Gas Infrastructure Reliability Program. It specifically addresses the following issues raised by industry: • Damage to pipelines – The primary cause of pipeline accidents is damage by third party or natural
forces. Can technology be developed for detection and warning of third party intrusion? Can technology be developed for near real time damage detection and location?
• Pipeline integrity assessment – Related to the above, can a ‘smart pipe’ be developed where remote
sensing can be used to monitor pipeline integrity? Can the data gathered be used to support increase service life and/or to extend operating limits?
The current research, which addresses both the need for damage detection and pipeline integrity
monitoring, addresses the “smart pipe” concept identified as one of industry’s priority needs.
2. THE CONCEPT
The concept developed at the INEEL utilizes thermally sprayed conductive traces on the inside or
outside of the pipeline, which have the property of changing electrical resistivity as a function of strain. Application of multiple traces with unique resistance patterns along the pipeline allows detection and location of the damage.
When a metal alloy, in powder or wire form, is thermally sprayed onto the pipe wall, a heterogeneous porous solid results which consists of metal, metal oxides and randomly arranged voids. The thickness and width of the trace is controlled to form a thin conductive trace with closed voids. When an electric current is run through the porous trace it is constrained to travel through the metal in a tortuous pathway defined by a large number of individual metal particles and the particle interfaces. The resistance of the trace results from the electric current overcoming the bonds between these metal “splats”, the resistivity of the metal alloy, and by the presence of nonconductive voids and oxides. For damage detection and location the important characteristic of the trace is the resistance-per-ft. value, Rf. As the pipe/trace is placed under strain the arrangement of the voids and the shape of the voids in the porous solid making up the trace cause the electron path and resulting resistivity to change. If the strain causes the trace to compress, the path of the electrons becomes more compact and the resistance-per-ft. value, Rf, decreases. This is because the metal splats of the solid are now closer, the arrangement of voids and metal is changed and the void shapes are made smaller. If the strain causes the trace to extend, the path of the electrons becomes more tortuous and the resistance-per-ft. value, Rf increases. This is because the metal splats of the trace are now being pulled further apart, the arrangement of the voids and metal is changed and the void shapes are increasing in size. The change in Rf is the measurable behavior that can be used as an indicator that a pipe is being plastically deformed at a specific location. The ratio of the change in resistivity in parallel traces is used to identify the location of the damage.
1
3. FY 02 GOALS
The project had 4 main goals for FY02. 1. Characterize the change in trace electrical resistivity as a function of strain. 2. Model the detection algorithm and establish the correlation between trace pattern, accuracy and
variability of trace resistivity, and damage detection location resolution 3. Develop a robust process for applying the traces 4. Characterize data communication along the traces. A fifth goal, implicit in the project, is to support the process for regulatory acceptance of the technology.
To be useful to industry and accepted by the regulatory agency the technology must be simple, rugged and reliable. In this regard, the pipeline damage detection system must also meet the following practical requirements: 1. The electrical signal in the trace is measurable with minimal error. 2. The change in each signal is detectable and measurable. 3. Each ratio of signals is distinct with sufficient resolution for measurement.
3.1 Goal 1– Characterize the change in trace electrical resistivity as a function of strain
3.1.1 Technology Basis
The first goal of the damage detection system is to create and characterize an electrically conductive trace that will change significantly when the conductive trace and the pipe are placed in plastic deformation. Additionally, the proportional change, Kp, in the resistance–per–ft. value, Rf over the small region of deformation must be great enough to be detectable over the measurement section of the pipeline/trace, and be measurable with sufficient accuracy and resolution to allow determination of the location of the deformation.
For example, an 80 ft. pipe segment, an un-deformed pipe exhibits the resistance R0, where
R0 = Rf *80 ohms Equation 1 • R is the resistance-per-ft. value when the pipe is not under any strain f
• 80 is the length of the pipe segment in feet
If we assume L feet has been damaged (deformed), there will be a change in total segment resistance to a new resistance R1:
R1 = Rf * (80 ft. - L) + Rf *(1+Kp)* (L ft.) Equation 2
• Rf is the resistance-per-ft. value when the pipe is not under any strain • Rf *(1+Kp) is the resistance-per-ft. value when the pipe has been plastically deformed
a defined amount.
2
For a typical change in resistance per foot of 30%, then (1+Kp)* Rf would be 1.3 Rf . For a nominal Rf = 1 Ohm/foot and a 6 inch deformation length L the segment resistance can be calculated by Equation 2 to yield:
R1 = Rf * (80 ft. - L) + Rf *(1+Kp)* (L ft.) Equation 3 = 1.0 * (79.5 ft.) + (1.0 * 1.3 )* (0.5 ft.) = 80.15 Ohms (0.5 foot deformation, 30% change) The change in resistance due to the deformation damage is then Equation 3 minus Equation 1;
R1 – R0 = 80.15 – 80.0 Equation 4 = 0.15 Ohms
For any data to be meaningful, the resistance-per-ft. value Rf, and the proportional change in resistance for the specific trace must be known. To meet the FY02 goal, the objective was to determine the amount of change in resistance-per-foot when the conductive trace was deformed and estimate the proportion constant, K = 1 + Kp , which relates the change in plastic deformation and to a corresponding change in Rf.
The results from the data indicate that certain materials, such as nickel aluminide, in very thin layers, demonstrate a predictable pattern of change of resistance with increasing strain. Data has been collected from both denting pipe and by bending coupons and pipe. Results from denting the pipe were reported previously and attempts to bend an 8 inch diameter pipe were unsuccessful in producing enough strain for meaningful measurement. Results from bend tests on coupons and a smaller 3” pipe are reported in Section 3.1.2. 3.1.2 Summary of Test Results
The test objective of the tests were to quantify the relationship between strain and resistance for a variety of traces consisting of the same material composition but exhibiting different baseline resistances.
The traces were sprayed on 8 (1.5 inch by 6 inch by 0.125 inch) steel sample coupons. Bending
the flat plate to a set of predetermined distances while the other end of the coupon was attached to a fixed structure applied strain to the coupon. As the coupons were bent, the resistance on each trace was measured and recorded. The amount of strain was calculated by the amount of deflection. Test results were be tabulated into 8 sets of data, 1 for each coupon, relating measured resistance to strain. The overall change in resistance on the coupons was measured over a distance of 5.875 inches. The measured resistance values were then calculated to determine the change in resistance over a 1 inch distance. This value was normalized to the 8 baseline resistances and a proportionality relationship derived between normalized resistance-per-inch and strain. In these tests, the traces did not crack until reaching approximately 10,000 microstrain.
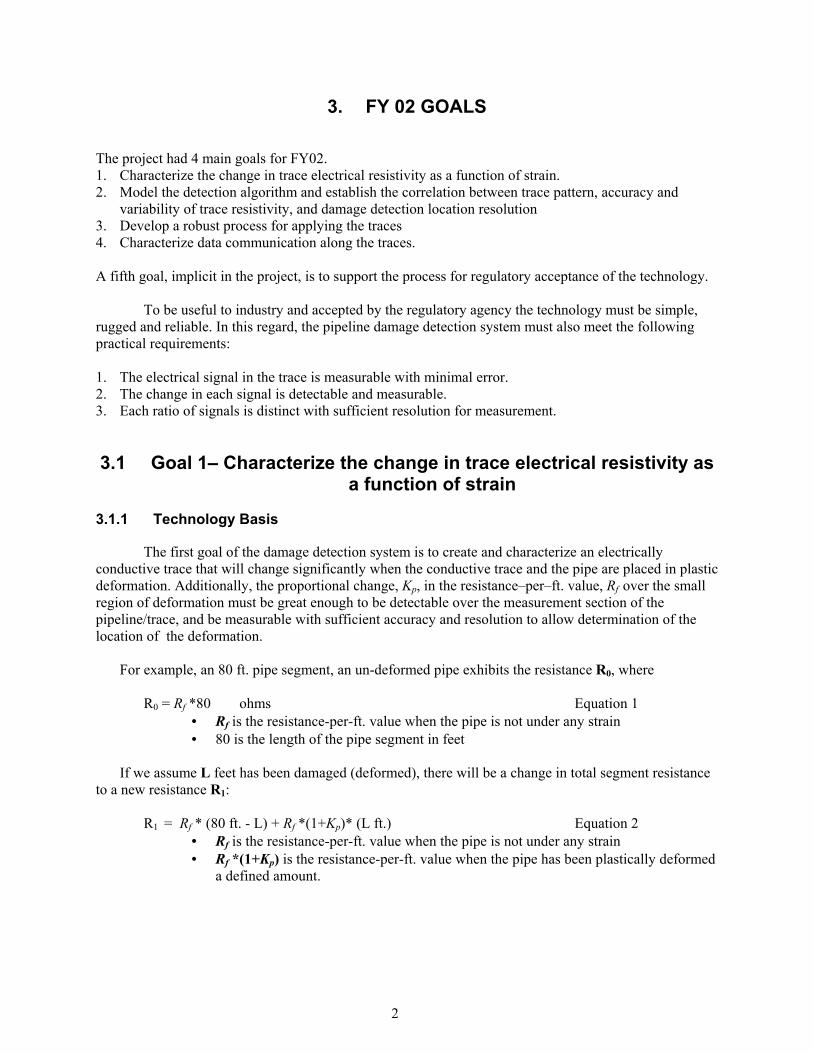
The data in Table 1 and Figure 1 were produced from a conductive nickel aluminide trace sprayed onto a flat plate. The conductive traces exhibit a range of characteristics such as porosity and oxide content show a difference in slope of the change of resistance with strain. Table 1 shows the data from one coupon. Figure 1 shows the results from all 8 coupons. Similar traces with the same dimensions and porosity made of copper did not show any change in resistance and the data is not shown. Each trace had a unique resistance-per-ft. value, Rf, which is produced by varying the machine parameters used while spraying the trace. The bending data was taken on 8 traces that each varied by speed, energy, oxides and thickness. A key to the machine parameters is given in Table 2 and specific resistance–per–ft., Rf, values are given in Table 3.
3
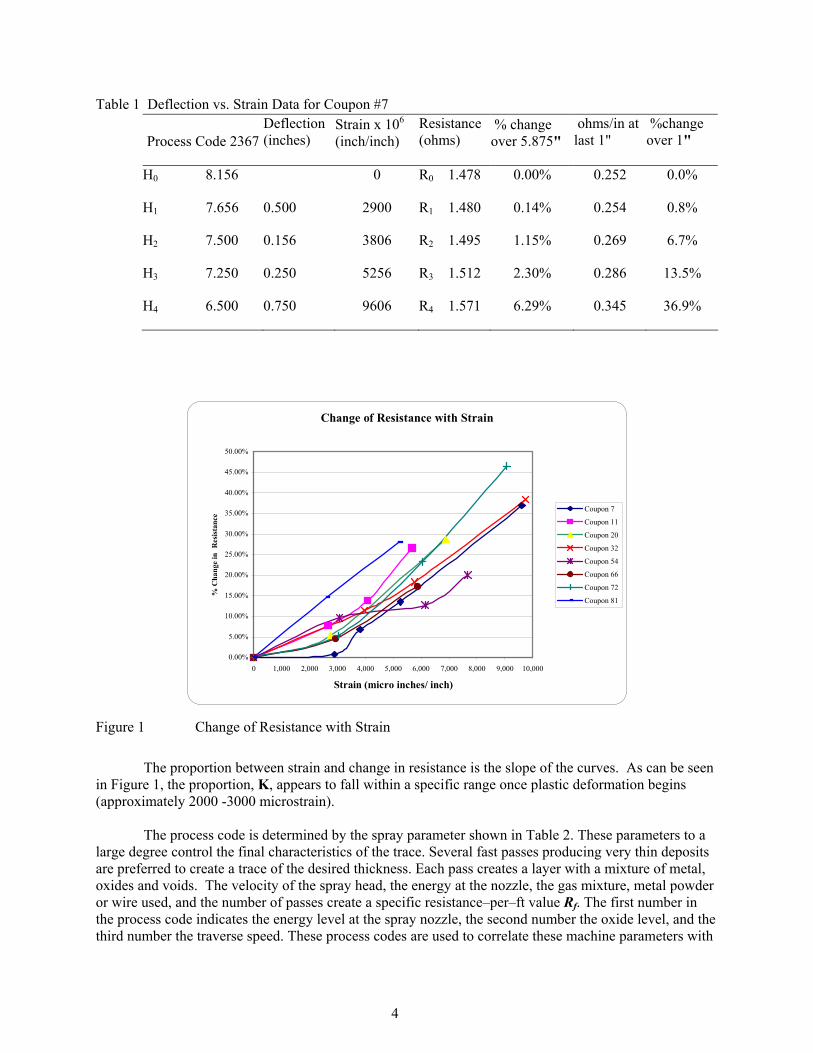
Table 1 Deflection vs. Strain Data for Coupon #7
Process Code 2367 Deflection (inches)
Strain x 10(inch/inch)
6 Resistance (ohms)
% change over 5.875"
ohms/in at last 1"
%change over 1"
H0 8.156 0 R0 1.478 0.00% 0.252 0.0%
H1 7.656 0.500 2900 R1 1.480 0.14% 0.254 0.8%
H2 7.500 0.156 3806 R2 1.495 1.15% 0.269 6.7%
H3 7.250 0.250 5256 R3 1.512 2.30% 0.286 13.5%
H4 6.500 0.750 9606 R4 1.571 6.29% 0.345 36.9%
Change of Resistance with Strain
0.00%
5.00%
10.00%
15.00%
20.00%
25.00%
30.00%
35.00%
40.00%
45.00%
50.00%
0 1,000 2,000 3,000 4,000 5,000 6,000 7,000 8,000 9,000 10,000
Strain (micro inches/ inch)
% C
hang
e in Re
sist
ance
Coupon 7
Coupon 11
Coupon 20
Coupon 32
Coupon 54
Coupon 66
Coupon 72
Coupon 81
Figure 1 Change of Resistance with Strain
The proportion between strain and change in resistance is the slope of the curves. As can be seen in Figure 1, the proportion, K, appears to fall within a specific range once plastic deformation begins (approximately 2000 -3000 microstrain).
The process code is determined by the spray parameter shown in Table 2. These parameters to a large degree control the final characteristics of the trace. Several fast passes producing very thin deposits are preferred to create a trace of the desired thickness. Each pass creates a layer with a mixture of metal, oxides and voids. The velocity of the spray head, the energy at the nozzle, the gas mixture, metal powder or wire used, and the number of passes create a specific resistance–per–ft value Rf. The first number in the process code indicates the energy level at the spray nozzle, the second number the oxide level, and the third number the traverse speed. These process codes are used to correlate these machine parameters with
4

the trace characteristics. This will increase the understanding of how machine parameters effect trace characteristics including the role that void distribution plays in controlling the change in resistance-per-length. Table 2 The machine parameters
High Energy 1 Low Energy 2 Fast Traverse 5 20 54 More Oxide 3 81 7 Less Oxide 4 Slow Traverse 6 11 32 72 66 Table 3 shows the correlation between these machine parameters and the reference resistance per
foot value Rf, Table 3 Specific resistance-per-ft values for the 8 coupons Resistance-per-foot values Rf (ohms/ft) Process Code Coupon 7 3.02 2367 Coupon 11 4.25 1457 Coupon 20 9.61 1357 Coupon 32 2.94 2457 Coupon 54 5.10 2357 Coupon 66 4.06 2467 Coupon 72 4.63 1467 Coupon 81 5.84 1367
Bend tests were also conducted on a 3 inch diameter 9 foot long pipe. The pipe was supported on
each end while weight was applied to the center. Data was only collected up to 6000 lbs because the bond strength of the alumina layer was too low to withstand higher tensile stress (7000 microstrain). There was a difference in performance between the alumina coating of the flat plate coupon. This is due to higher bond strength of the alumina on the flat plate and the 3 inch diameter pipe. The bond strength of any coating on a curved surface is less than when on a flat surface. This is particularly true when spraying alumina on to a small radius. Previous testing has shown the presence of high stresses within the alumina when on a curved surface. The velocity of the spraying was also noted to be very different between the thin flat plate and the 3 inch diameter pipe. The flat plate would heat up faster than a heavier pipe so the spraying process was done at a faster rate for the plate than the pipe
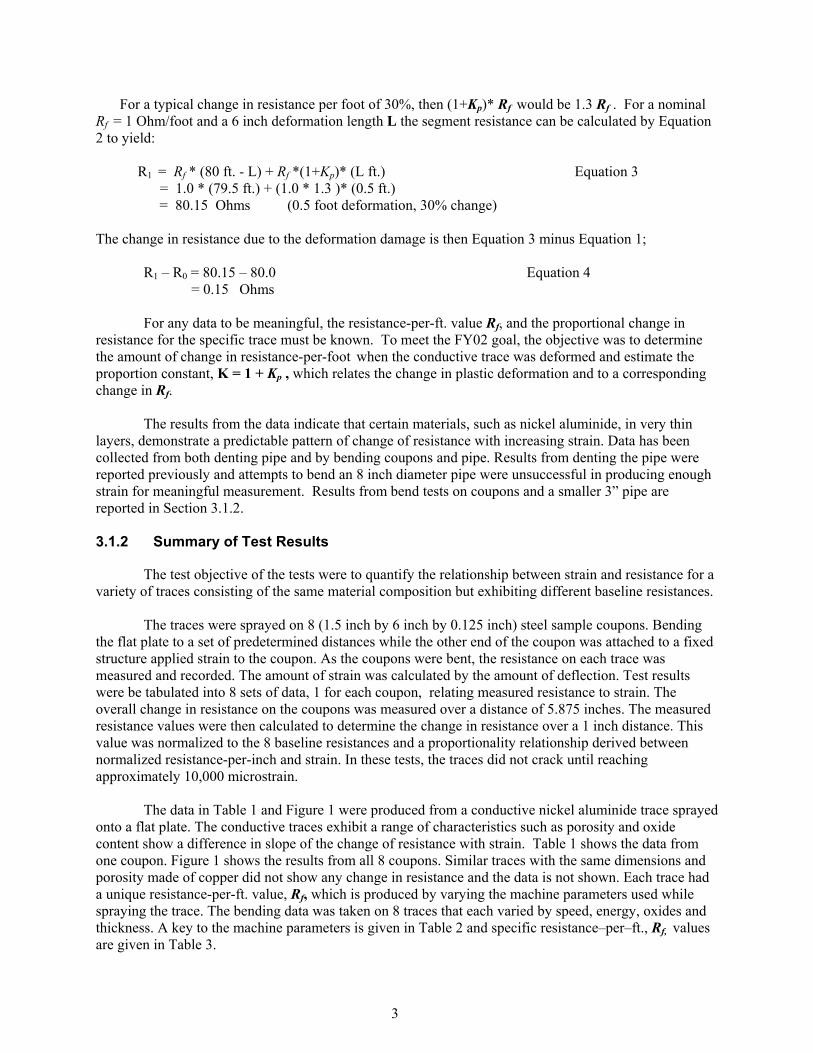
Table 4 shows the change in resistance of the trace on the 3”pipe up to 6000 microstrain. At higher loading the traces cracked at the point of greatest strain. The strain measurement was taken from strain gages approximately one foot from each on either side of the weight. The percentages given show the change in resistance over 8 ft. The change in resistance shown in Table 4 actually occurred over the1 or 2 ft where the local strain was occurring. There are two aspects to looking at the data. There is a percentage change and an absolute change. Both of these numbers are shown in the last rows of Table 4. The percentage change is important in determining the proportionality constant, K and issues of resolution of measurement, but it is the absolute value that will actually be measured by the data receiver.
5

Table 4 Strain vs. Resistance of Traces on the 3" diameter pipe Resistance (ohms)
Weight
Gage #3 Strain x106 Trace 1 Trace 2 Trace 3 Trace 4 Trace 5 Trace 6
no weight 12 17.5882 88.7720 68.5211 44.7989 46.6417 82.3073 1000 lbs -463 17.55131 88.3752 68.3132 44.6564 46.3533 81.9449 1900 lbs -875 17.39628 88.2660 68.2638 44.6491 46.3366 81.9634 3000 lbs -1395 17.39615 88.2314 68.2120 44.6033 46.2709 81.8198 4000 lbs -1818 17.37642 88.0829 68.0945 44.5505 46.2268 81.7444 5000 lbs -2578 17.37097 88.0008 68.0249 44.5180 46.1914 81.6751 6000 lbs -5641 17.3817 broken trace broken trace broken trace broken trace broken trace % total 0 12 0 0 0 0 0 0 1000 lbs -463 -0.2% -0.45% -0.30% -0.32% -0.62% -0.44% 2000 lbs -875 -1.1% -0.57% -0.38% -0.33% -0.65% -0.42% 3000 lbs -1395 -1.1% -0.61% -0.45% -0.44% -0.79% -0.59% 4000 lbs -1818 -1.2% -0.78% -0.62% -0.55% -0.89% -0.68% 5000 lbs -2578 -1.24% -0.87% -0.72% -0.63% -0.97% -0.77% Change in R .217 .771 .496 .281 .450 .632
The profile of the strain is shown in Figure 2 and the resulting change in trace resistance over the 3” pipe test section in Figure 3.
.
Distribution of strain
-6000-5500-5000-4500-4000-3500-3000-2500-2000-1500-1000-500
0500
1000
0 1 2 3 4 5 6 7
Length along the pipe
Mic
rost
rain
01000 lbs1900 lbs3000 lbs4000 lbs5000 lbs6000 lbsweight removed
Figure 2 Distribution of Strain in 3” Pipe Test Section
6

Change in Resistance vs Strain
-1.30%-1.20%-1.10%-1.00%-0.90%-0.80%-0.70%-0.60%-0.50%-0.40%-0.30%-0.20%-0.10%0.00%
0 500 1000 1500 2000 2500 3000
Strain
% c
hang
e in
resi
stan
ce Trace 1Trace 2Trace 3Trace 4Trace 5Trace 6
Figure 3 Change in Resistance vs. Strain For Traces on the 3” Pipe test Section
The change in resistance for a strain of 1800 to 2565, (% resistance change)/(change in strain), is shown in Table 5 to point out the range in proportionality. Based on measured resistance values Traces 2 through 6 have a very small range while Trace 1 is much lower value. If the traces could have been exposed to greater strain levels the slopes would be expected to increase based on the behavior observed on the flat plate coupons.
Table 5 Proportionality of change in resistance to increasing strain.
Slope of the lines in reference to change in resistance by strain Change in strain from 1818.4 to 2577.7 10^-6 in/in Trace 1 Trace 2 Trace 3 Trace 4 Trace5 Trace6
759.3 x 10^-6 40.81 121.80 133.95 95.51 100.01 110.87
A numerical model has been developed to analyze incoming resistance data to detect and locate
damage. For the signal to the receiver to be meaningful the resistance-per-foot value, Rf must have low variability. At this time the variability of the resistance is +/- 20% of the mean.
The variance in the resistance values is shown in Figure 4. These values were
measured on a 9 ft long pipe 3 inch diameter at intervals of every 2 inches. The 5 traces were individually sprayed next to each other.
7

Resistive Trace Results
0
0.2
0.4
0.6
0.8
1
1.2
1.4
1.6
1.8
21 5 9 13 17 21 25 29 33 37 41 45 49
Segment (2 inch increment)
Nor
mal
ized
resi
stan
ce Trace A resistance normalized toMean Value
Trace B resistance normalized toMean Value
Trace C resistance normalized toMean Value
Figure 4 Normalized resistance-per-foot values measured every two inches
These measurements were taken every 2 inches so that local variability could be seen. In Figure 5 the same values are shown when added together over a 6 inch length. The variability is seen to smooth out. The pipe that will be used for the testing at GTI will be 10 ft long segments welded to each other to create a 50 ft long test pipe. Of the six resistance-per-ft values that will be used it is expected that four of them will have a variability of only +/- 20% of the mean.
8

6 inch increments
0.4
0.6
0.8
1.0
1.2
1.4
1.6
0-0.5 1 1.5 2 2.5 3 3.5 4 4.5 5 5.5 6 6.5 7 7.5 8
Distance along the pipe
Nor
mal
ized
to th
e m
ean
ABC
Figure 5 The variability of the values is less when measured over 6 inches.
3.2 Goal 2 - Model the detection algorithm and establish the correlation between trace pattern, accuracy and variability of trace resistivity,
and damage detection location resolution
3.2.1 Technology Basis
Each set of conductive traces will consist of multiple parallel traces. The number of parallel traces is dependent on the accuracy to which the trace resistance can be applied and the detection location resolution required. It is expected that 4 - 5 traces will be required to detect and locate damage with a 1-2 pipe segment (40 –80 ft) resolution. The detection location capability is based on a unique relationship in the resistivity of the parallel traces in any given measurement segment and that that relationship is maintained in the resulting change in resistivity when the pipe/trace is placed under strain. A lookup table will be used to match the measured ratio or resistance change with the set of unique ratios cataloged for each pipe segment. This lookup table with labels has not yet been created. There are variances in resistance and change in resistance with strain that have been observed experimentally. See Table 5 from the 3 inch bend test. The amount of change of each trace is shown. At 2500 micro-strain the change in R varies from 95% to 122% for 5 of the traces over the length of the entire segment. This level of variance will be incorporated into the location model. 3.2.2 Trace Patterns
Based on the accuracy with which the traces can currently be applied, nominally six resistance per foot values { Rf 1, Rf 2, Rf 3, Rf 4, Rf 5, Rf 6, }will be created and arranged into patterns for a future field application. Each pipe segment (such as 80 ft) will have an assembly of 4 to 5 traces (A,B,C,D,E) at four locations around the pipe circumference as shown in Figure 6.
9

Figure 6 The pipe will have 4 sets of traces around the circumference.
The six values of unique resistance that make up the trace are shown in Table 6. The maximum
and minimum are shown. The values each have max and min boundaries with a set gap (10%) in between values.
Table 6 Resistance/ft values from specific data trace configurations
Minimum Mean Maximum Rf 1 .32 .4 .48 Rf 2 .65 .8 .96 Rf 3 1.2 1.5 1.8 Rf 4 2.4 3.0 3.6 Rf 5 5.76 6.2 7.04 Rf 6 10.8 12.0 13.2
A 20 mile pipeline will consist of 1320 segments if each segment is 80 ft long. The 1320 segments could be identified by just 4 traces for 12 unique ratios whose values are not even multiples of one another (123 = 1728 serial numbers) or 5 traces of six values for 8 unique ratios (84 = 4096 serial numbers). The system treats value1/value2 as a different ration than value2/value1. The segment length could be increased to 160 ft segments so only 660 patterns would be needed such as 4 traces on six values or 5 traces of four values. As each segment is increased in length the increase in total resistance of that trace becomes harder to detect but less combinations of patterns are needed so less distinct resistance-per-ft values, Rf are needed. These two constraints must be balanced. The FY02 goal was to form a model for deciding the number of traces. The model that was developed uses a subset of real numbers to define allowable combinations of nominal resistances, but does not yet account for variance or measurement error. The amount of variance in the traces over a one foot length is being analyzed with the requirements for a 20 mile long pipeline with 80 ft segments. This is the pattern that will be tested in the 50 ft pipe with 10 ft segments. It is anticipated that 5 traces will be used in order to evaluate the model software even though only 2 traces are needed for 5 segments.
10

In a field application, this arrangement must be balanced by the absolute accuracy and resolution of the receiver at the end of the 20 mile pipeline. Assuming there are 1320 segments making up the total signal and with Rf = 1 Ohm per foot, then if 1319 segments remain the same and the resistance of one 80 ft segment increases by 0.15 ohms (see Equation 4) the effect is a 0.15 Ohm change in an overall resistance of 1320 Ohms. This is a small change. More detailed calculations under these conditions accounting for range of scale, resolution, and signal averaging, and assuming shorter segments (40 feet instead of 80 feet) indicate a maximum segment measurement error of ± 5.3%. This is between two and four times less variance that the manufacturing variability of the segments themselves.
Each of the six resistance-per-foot values, (Rf 1, Rf 2, Rf 3, Rf 4, Rf 5, Rf 6) will be used in an arrangement that will create the unique ratios mentioned above. Each of these unique ratios will be given a label. An assembly set of 5 trace positions will be labeled (A,B,C,D,E). Using a lookup table, the resistance-per-ft value of segment under strained conditions will be determined. The ratio between positions A:B, B:C, C:D, and D:E will be calculated. Matching measured ratios to known ratios for each segment will allow unique identification of a deformed segment. The model of assessing the accuracy of locating the damage is still being developed.
3.3 Goal 3 – Develop a Robust Process for Applying the Traces
To develop the damage detection technology to the sufficient level of robustness, accuracy and
reliability is needed for field installation while the pipe is being welded and laid into the trench or mill installation while pipe is being fabricated. This technology will be successful when industry is prepared to demonstrate the technology on an actual flowing natural gas system. The FY02 goal was to assess the application equipment and process for its ability to be applied in the field.
To advance the feasibility of the damage detection technology the resistance-per-foot values, Rf
of the conductive traces must be:
• accurate to their assigned value of Rf • consistent along the length of the segment • rugged enough for field applications.
In FY02, a key part of Goal 3 was to refine the spray process and machine controls to eliminate
causes of variability and determine acceptance criteria on variability. The challenges in developing the spray process that were overcome include the selection of the appropriate bond coat for a wide variety of pipe conditions and spray controls that achieve the needed consistency in the resistance measurement.
In FY02 the accuracy was improved by design of specialized masking, improvement in masking materials, gas flow control, power level control, distance from the wall accuracy, accuracy of the angle of the position, traverse speed control, powder quality control, powder feed control, temperature feedback loop, and sealants on alumina.
The signal requirements of the data trace system are forcing developments in the thermal spray arena in the following areas:
Masking capabilities: INEEL's industrial partner ZCC has been improving the design and method of laying down the masking for the traces. The masking design has been changed to prevent damaging the edge of the trace as the mask is removed from the substrate by using carrier tape with low adhesive. The
11

masking material has been changed to metal to remove fibers from affecting the edge of the trace. The metal foil is cut from specially manufactured tool dies. Robotic control is used for a pressure roller applied onto the masked surface that increases the surface contact between the mask and the substrate.
Quality control of powders: Another area of improvement has been in materials. The variability in the size of powders and the amount of oxides present in the metal powder affects the consistency of the coating. A dialogue was set up with the powder manufacturers to modify how the powders were being inspected before shipment to ensure the correct range of powder diameters and the purity of the metallic powders. The flow of the powder through the assembly especially at the nozzle is considered a main cause of variability in the trace. A development task will be done in the future to investigate using wire feed instead of powder.
Fabrication specification: The fabrication specification is being used to clarify what aspects of the process are crucial to controlling the accuracy of the resistance trace. This document states the amount of energy at the nozzle of the spray device, the substrate temperature, the spray angle and velocity of the spray arm. All of these variables have had the controls tightened.
Bond strength: The initial metallic coating has been improved to increase the bond with the pipe surface. This surface is assumed to be corroded and dirty. The natural gas industry will not allow grit blasting to be used for surface preparation on the inside of pipes so wire brushing is used. The conductive metal layer has also been improved to resist disbonding from the insulated layer. The thinner each coating pass, the stronger the bond strength. The traverse speed has been increased and the number of passes increased. This also changes the porosity of the coatings.
To assure consistency of sprayed traces, the capability to consistently analyze the characteristics of a sprayed trace has been developed:
Figure 7 is a cross section of the sprayed trace from coupon 7 of the flat plate coupon. This image is used to calculate the actual porosity and oxide lever in each type of coating. This porosity corresponds with the spray process and machine settings that were used to create the resistance-per-ft value, R . Figure 8 is a histogram for evaluating the amount of porosity by analyzing the image. Each resistance-per-ft value R will be characterized by its porosity and machine parameters.
f
f ,
12

Figure 7 Cross Section of
00
200
400
600
800
1000
1200
Figure 8 Histogram for an
Figure 8 shows the distributioless than 100 are selected as void
Substrate
a coating.
100 200
alyzing porosity of cross section.
n of the image pixels along a scale of 256 shades of gray. Any shades s and any shades greater than 180 are selected as metal. Everything in
13
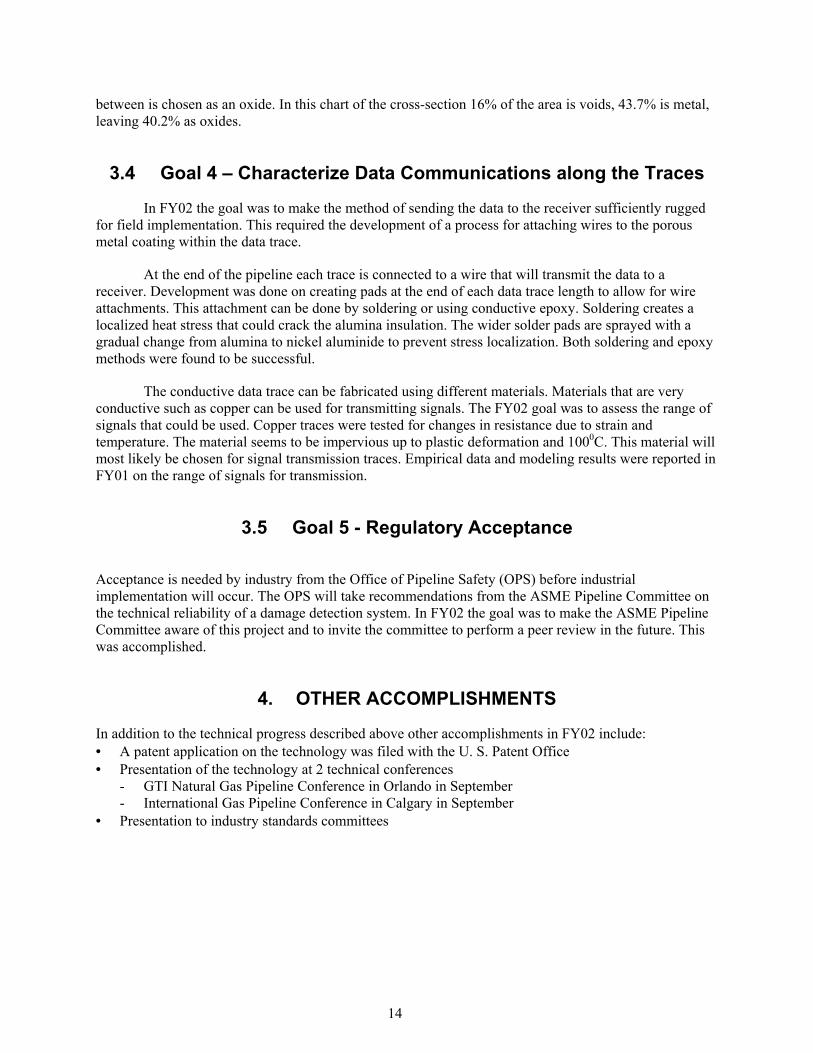
between is chosen as an oxide. In this chart of the cross-section 16% of the area is voids, 43.7% is metal, leaving 40.2% as oxides.
3.4 Goal 4 – Characterize Data Communications along the Traces
In FY02 the goal was to make the method of sending the data to the receiver sufficiently rugged for field implementation. This required the development of a process for attaching wires to the porous metal coating within the data trace.
At the end of the pipeline each trace is connected to a wire that will transmit the data to a receiver. Development was done on creating pads at the end of each data trace length to allow for wire attachments. This attachment can be done by soldering or using conductive epoxy. Soldering creates a localized heat stress that could crack the alumina insulation. The wider solder pads are sprayed with a gradual change from alumina to nickel aluminide to prevent stress localization. Both soldering and epoxy methods were found to be successful.
The conductive data trace can be fabricated using different materials. Materials that are very conductive such as copper can be used for transmitting signals. The FY02 goal was to assess the range of signals that could be used. Copper traces were tested for changes in resistance due to strain and temperature. The material seems to be impervious up to plastic deformation and 1000C. This material will most likely be chosen for signal transmission traces. Empirical data and modeling results were reported in FY01 on the range of signals for transmission.
3.5 Goal 5 - Regulatory Acceptance
Acceptance is needed by industry from the Office of Pipeline Safety (OPS) before industrial implementation will occur. The OPS will take recommendations from the ASME Pipeline Committee on the technical reliability of a damage detection system. In FY02 the goal was to make the ASME Pipeline Committee aware of this project and to invite the committee to perform a peer review in the future. This was accomplished.
4. OTHER ACCOMPLISHMENTS
In addition to the technical progress described above other accomplishments in FY02 include: • A patent application on the technology was filed with the U. S. Patent Office • Presentation of the technology at 2 technical conferences
- GTI Natural Gas Pipeline Conference in Orlando in September - International Gas Pipeline Conference in Calgary in September
• Presentation to industry standards committees
14

Appendix
Spray Parameters
for
Nickel Aluminide
Conductive Traces
A-1

A-2

Appendix A
Spray Parameters for Nickel Aluminide Conductive Traces
The suggested starting spray parameters are: Table A-1 Set Up for the Bond Coat and Insulating Layer Material Nickel Aluminum Alumina Gun Setup Gun Type Metco 3MB with air jets Metco 3MB/7MB/9MB Nozzle GH GH Powder Port Number 2 Number 2
Primary Argon Argon Supply Pressure (psi) 100 100 Flow (SCFH) 80 80 to 125 Secondary Hydrogen Hydrogen Supply Pressure 75 75 Flow (SCFH)1 15 15 Power Amperage (amperes) 500 500 Voltage (volts),1 65 65 Powder Feed Feeder Type PlasmaTechnic Twin 10C, Metco
3MP/4MP or Plasmadyne PlasmaTechnic Twin 10C, Metco 3MP/4MP or Plasmadyne
Powder Feeder Gas Argon Argon Carrier Flow (SCFH) 5.5 (37 on Metco meter) 5.5 (37 on Metco meter) Feed Rate (lb/hr) 8 5 Air Jets Configuration Parallel None Pressure (psi) 50 None Spray Distance (inches) 6 2.5 to 3.0
Gas
A-3

A-4
Table A-2 Set Up for the Conductive Trace Nozzle must be new and a lifetime of 100 hours must be monitored and conformance recorded. Materials Nickel Aluminum Gun Set Up Gun Type Metco 3MB/7MB/9MB Powder Port Number 2 Gas Primary Argon Supply Pressure (psi) 100 Flow (SCFH) 80 Secondary Hydrogen Supply Pressure (psi) 75 Flow (SCFH)1 15 Power Amperage (amperes) 500 Voltage (volts)1 65 Powder Feed Feeder Type Plasma Technic Twin 10C
Metco 3MP/4MP or Plasmadyne
Gas Argon Carrier Flow (SCFH) 5.5 or 37 on Metco Meter Feed Rate (lb/hr) 6 Air Jets Configuration None Spray Distance (inches) 6
1 Voltage is adjusted by varying the secondary gas +/- 7SCFH