integral-abutment bridges: problems and innovative ... · pdf fileintegral-abutment bridges:...
TRANSCRIPT

Integral-Abutment Bridges:Problems and Innovative Solutions UsingEPS Geofoam and Other Geosynthetics
Manhattan College Research Report No. CE/GE-00-2
by
John S. Horvath, Ph.D., P.E.Professor of Civil Engineering
Manhattan CollegeSchool of Engineering
Civil Engineering DepartmentBronx, New York, U.S.A.
May 2000

Integral-Abutment Bridges: Problems and Innovative Solutions Using EPS Geofoam and Other GeosyntheticsManhattan College Research Report No. CE/GE-00-2
ii
2000 by John S. Horvath.All rights reserved.
Prof. John S. Horvath, Ph.D., P.E.Manhattan College
Civil Engineering DepartmentBronx, New York 10471-4098
U.S.A.
e-mail: <[email protected]>
Limitations
The information contained in this document is the result of original research and is madeavailable solely as a contribution to the general state of civil engineering knowledge. As such,this document does not constitute a design manual or standard, and should not be interpreted,used or referred to as such. The author assumes no liability for the performance of any structureconstructed using the methodologies discussed in this document.
In addition, any reference, either direct or indirect, to a specific geosynthetic material orproduct is made solely for the purposes of the study documented in this report and does notconstitute an endorsement or promotion of that material or product by the author.
Distribution and Use
Authorization is hereby granted to copy, distribute and print this document without restrictionprovided that this document is copied, distributed and printed in its entirety, at no cost and usedfor individual reference purposes only. This document may not be sold or used in whole or inpart in any manner for commercial purposes of any type, including manufacturer's product ormarketing literature, without prior written consent of the copyright holder.
Printing
Those wishing to make a paper copy of this document are advised that it is formatted fordouble-sided printing. A gutter has been provided in the page formatting to allow space forbinding along the side if desired. It is suggested that the printer settings in Adobe Acrobat beset to "Print as image" for optimum readability.
References
This report plus several of the author's earlier reports in the Manhattan College CivilEngineering Department geotechnical engineering program (CE/GE) research report series areavailable in PDF format via the Internet at <web1.manhattan.edu/jhorvath/pubs.html>.

iii
Integral-Abutment Bridges: Problems and Innovative Solutions Using EPS Geofoam and Other GeosyntheticsManhattan College Research Report No. CE/GE-00-2
Contents
List of Figures...............................................................................................................................vii
List of Tables .................................................................................................................................xi
Executive SummaryBackground .................................................................................................................................. xiiiThe Problem..................................................................................................................................xivProposed Solutions........................................................................................................................xviThe Future .................................................................................................................................. xviii
Section 1 - Background and Overview of Study1.1 Introduction ................................................................................................................................11.2 Background
1.2.1 Soil-Structure Interaction1.2.1.1 Definition ................................................................................................................11.2.1.2 Application to Bridges ............................................................................................1
1.2.2 Integral-Abutment Bridges ...............................................................................................11.2.3 Geofoam ...........................................................................................................................2
1.3 Present Study1.3.1 Purpose and Objectives ....................................................................................................21.3.2 Scope ................................................................................................................................31.3.3 Organization of Report .....................................................................................................3
Section 2 - Soil-Structure Interaction and Bridges2.1 Overview ....................................................................................................................................52.2 Design for Temperature-Induced Soil-Structure Interaction
2.2.1 Conventional Bridges2.2.1.1 Concept and Details ................................................................................................62.2.1.2 Problems..................................................................................................................8
2.2.2 The Integral-Abutment Bridge Alternative and Related Concepts2.2.2.1 Introduction.............................................................................................................92.2.2.2 Concept ...................................................................................................................92.2.2.3 Problems................................................................................................................102.2.2.4 Potential Solutions: Present ..................................................................................132.2.2.5 Potential Solutions: Future....................................................................................15
Section 3 - Details and Results of Study3.1 Introduction ..............................................................................................................................193.2 Details of Study
3.2.1 Introduction and Overview.............................................................................................193.2.2 Overall Problem Details
3.2.2.1 Geometry...............................................................................................................193.2.2.2 Thermal Environment ...........................................................................................21
3.2.3 Abutment Backfill/Fill Variables Considered................................................................213.2.4 Numerical Analysis Details

Integral-Abutment Bridges: Problems and Innovative Solutions Using EPS Geofoam and Other GeosyntheticsManhattan College Research Report No. CE/GE-00-2
iv
3.2.4.1 Computer Software ...............................................................................................233.2.4.2 Solid Material Model Parameters .........................................................................243.2.4.3 Interface Model Parameters ..................................................................................273.2.4.4 Reinforcement Modeling ......................................................................................273.2.4.5 Bridge Superstructure Modeling...........................................................................293.2.4.6 Simulation of Construction and Thermal Load Application.................................29
3.3 Results and Discussion3.3.1 Plotting and Interpretation of Results
3.3.1.1 Introduction ...........................................................................................................303.3.1.2 Classical Earth Pressure Theory ...........................................................................313.3.1.3 Plot Axes ...............................................................................................................313.3.1.4 Comparison of Results ..........................................................................................32
3.3.2 Case 1: No Geofoam3.3.2.1 Introduction ...........................................................................................................333.3.2.2 End of Construction ..............................................................................................343.3.2.3 First Thermal Contraction Peak ............................................................................373.3.2.4 First Thermal Expansion Peak ..............................................................................393.3.2.5 End of First Thermal Cycle...................................................................................413.3.2.6 Fourth (Final) Thermal Expansion Peak...............................................................433.3.2.7 End of Fourth (Final) Thermal Cycle ...................................................................47
3.3.3 Case 2: Resilient EPS-Block Geofoam as a Compressible Inclusion3.3.3.1 Introduction ...........................................................................................................503.3.3.2 End of Construction (Case 2a) .............................................................................523.3.3.3 Discussion of Simplified Methods for REP-Wall Analysis..................................553.3.3.4 First Thermal Contraction Peak (Case 2a)............................................................573.3.3.5 First Thermal Expansion Peak (Case 2a)..............................................................603.3.3.6 End of First Thermal Cycle (Case 2a) ..................................................................623.3.3.7 Fourth (Final) Thermal Expansion Peak (Case 2a)...............................................663.3.3.8 End of Fourth (Final) Thermal Cycle (Case 2a) ...................................................683.3.3.9 End of Construction (Case 2b and Case 2a/2b Comparison)................................713.3.3.10 Simplified Analytical Method for the ZEP-Wall Concept..................................753.3.3.11 First Thermal Contraction Peak (Case 2b and Case 2a/2b Comparison)............793.3.3.12 First Thermal Expansion Peak (Case 2b and Case 2a/2b Comparison)..............823.3.3.13 End of First Thermal Cycle (Case 2b and Case 2a/2b Comparison) ..................843.3.3.14 Fourth (Final) Thermal Expansion Peak (Case 2b and Case 2a/2b
Comparison) ...............................................................................................................863.3.3.15 End of Fourth (Final) Thermal Cycle (Case 2b and Case 2a/2b Comparison) ...88
3.3.4 Case 2: Supplemental Analyses3.3.4.1 Introduction ...........................................................................................................903.3.4.2 Results at Maximum Thermal Contraction...........................................................913.3.4.3 Results at Maximum Thermal Expansion .............................................................953.3.4.4 Results at Ends of Thermal Cycles .......................................................................983.3.4.5 Conclusions.........................................................................................................101
3.3.5 Case 3: EPS-Block Geofoam as Lightweight Fill3.3.5.1 Introduction .........................................................................................................1013.3.5.2 End of Construction (Case 3a) ............................................................................1063.3.5.3 First Thermal Contraction Peak (Case 3a)..........................................................1083.3.5.4 First Thermal Expansion Peak (Case 3a)............................................................1093.3.5.5 End of First Thermal Cycle (Case 3a) ................................................................1103.3.5.6 Fourth (Final) Thermal Expansion Peak (Case 3a).............................................110

v
Integral-Abutment Bridges: Problems and Innovative Solutions Using EPS Geofoam and Other GeosyntheticsManhattan College Research Report No. CE/GE-00-2
3.3.5.7 End of Fourth (Final) Thermal Cycle (Case 3a) .................................................1123.3.5.8 End of Construction (Case 3b and Case 3a/3b Comparison)..............................1133.3.5.9 First Thermal Contraction Peak (Case 3b and Case 3a/3b Comparison)............1153.3.5.10 First Thermal Expansion Peak (Case 3b and Case 3a/3b Comparison)............1183.3.5.11 End of First Thermal Cycle (Case 3b and Case 3a/3b Comparison) ................1203.3.5.12 Fourth (Final) Thermal Expansion Peak (Case 3b and Case 3a/3b
Comparison) .............................................................................................................1233.3.5.13 End of Fourth (Final) Thermal Cycle (Case 3b and Case 3a/3b Comparison) 124
Section 4 - Conclusions and Recommendations4.1 Results from Present Study ....................................................................................................1254.2 Interim Suggestions for Practice ............................................................................................1284.3 Recommendations for Future Study.......................................................................................129
Section 5 - References ................................................................................................................131
Section 6 - Notation6.1 Definitions..............................................................................................................................1376.2 Constitutive Model Equations
6.2.1 Two-Dimensional Solid Elements................................................................................1396.2.2 One-Dimensional Interface Materials ..........................................................................139
Section 7 - Bibliography7.1 Miscellaneous Lateral Earth Pressure Studies .......................................................................1417.2 General Concept of Controlled Yielding ...............................................................................1437.3 Compressible-Inclusion Applications ....................................................................................1447.4 Integral-Abutment Bridges.....................................................................................................146
Appendix A - Reduced Earth Pressure (REP) Wall Analysis: Version 2.0A.1 Background ...........................................................................................................................149A.2 Model Derivation
A.2.1 Concept ........................................................................................................................149A.2.2 Theory
A.2.2.1 Compressible-Inclusion Stiffness.......................................................................150A.2.2.2 Soil Stiffness ......................................................................................................151A.2.2.3 Solution ..............................................................................................................152

Integral-Abutment Bridges: Problems and Innovative Solutions Using EPS Geofoam and Other GeosyntheticsManhattan College Research Report No. CE/GE-00-2
vi
This page intentionally left blank.
vii
Integral-Abutment Bridges: Problems and Innovative Solutions Using EPS Geofoam and Other GeosyntheticsManhattan College Research Report No. CE/GE-00-2
List of Figures
Figure ES.1. Conventional Bridge Design.................................................................................. xiiiFigure ES.2. Integral-Abutment Bridge Variations .....................................................................xivFigure ES.3. Thermally Induced IAB Abutment Movement ........................................................xvFigure ES.4. Settlement Trough and Void Development behind IAB Abutments ......................xviFigure ES.5. Proposed New IAB Design Alternatives.............................................................. xviii
Figure 2.1. Traditional Design Concept to Allow Thermally Induced Bridge-SuperstructureMovement ..................................................................................................................................6
Figure 2.2. Traditional Design Concept as Applied to Multi-Span Bridges...................................7Figure 2.3. Integral-Abutment Bridge Variations .........................................................................10Figure 2.4. Semi-Integral-Abutment Bridge .................................................................................10Figure 2.5. Thermally Induced IAB Abutment Movement...........................................................11Figure 2.6. Settlement and Void Development Adjacent to IAB Abutments ...............................13Figure 2.7. Compressible Inclusion Application with Integral-Abutment Bridges ......................15Figure 2.8. IAB Design Alternatives to Simultaneously Reduce Lateral Earth Pressures on
and Control Settlement Adjacent to Abutments......................................................................16
Figure 3.1. Overall Geometry and Thermal Assumptions of Problem Studied ............................20Figure 3.2. Normal versus Resilient Block-Molded EPS (density = 12 kg/m3 (0.75 lb/ft3)) ........22Figure 3.3. Finite Element Mesh Used for Present Study.............................................................24Figure 3.4. Isochronous Stress-Strain Curves for Resilient Block-Molded EPS (initial
molded density = 12 kg/m3 (0.75 lb/ft3)) .................................................................................26Figure 3.5. Approximate FEM Modeling of Geosynthetic Tensile Reinforcement .....................28Figure 3.6. Template for Lateral (Earth) Pressure Plots ...............................................................30Figure 3.7. Case 1b: FEM Mesh (partial). ....................................................................................34Figure 3.8. Case 1: Lateral Earth Pressures at End of Construction.............................................35Figure 3.9. Case 1a: Stress Levels at End of Construction...........................................................36Figure 3.10. Case 1: Lateral Earth Pressures at First Thermal Contraction Peak.........................37Figure 3.11. Case 1a: Stress Levels at First Thermal Contraction Peak.......................................38Figure 3.12. Case 1: Lateral Earth Pressures at First Thermal Expansion Peak...........................40Figure 3.13. Case 1a: Stress Levels at First Thermal Expansion Peak.........................................41Figure 3.14. Case 1: Lateral Earth Pressures at End of First Thermal Cycle ...............................42Figure 3.15. Case 1a: Stress Levels at End of First Thermal Cycle .............................................43Figure 3.16. Case 1a: Lateral Earth Pressures at Thermal Expansion Peaks................................44Figure 3.17. Case 1a: Stress Levels at Fourth Thermal Expansion Peak......................................45Figure 3.18. Case 1a: Comparison of Lateral Earth Pressures at Peak Conditions ......................46Figure 3.19. Case 1a: Comparison of Lateral Earth Pressures at Neutral Temperature ...............48Figure 3.20. Case 1a: Stress Levels at End of Fourth Thermal Cycle ..........................................49Figure 3.21. Case 2: FEM Mesh (partial) .....................................................................................50Figure 3.22. Case 2a: Lateral Pressures at End of Construction...................................................52Figure 3.23. Case 2aii: Stress Levels at End of Construction.......................................................53Figure 3.24. Case 2a: Horizontal Deformation of Geofoam Compressible Inclusion at End of
Construction ............................................................................................................................54Figure 3.25. Case 2a: Lateral Pressures at First Thermal Contraction Peak ................................58Figure 3.26. Case 2aii: Stress Levels at First Thermal Contraction Peak.....................................59

Integral-Abutment Bridges: Problems and Innovative Solutions Using EPS Geofoam and Other GeosyntheticsManhattan College Research Report No. CE/GE-00-2
viii
Figure 3.27. Case 2a: Horizontal Deformation of Geofoam Compressible Inclusion at FirstThermal Contraction Peak .......................................................................................................60
Figure 3.28. Case 2a: Lateral Pressures at First Thermal Expansion Peak...................................61Figure 3.29. Case 2aii: Stress Levels at First Thermal Expansion Peak.......................................62Figure 3.30. Case 2a: Horizontal Deformation of Geofoam Compressible Inclusion at First
Thermal Expansion Peak .........................................................................................................63Figure 3.31. Case 2a: Lateral Pressures at End of First Thermal Cycle .......................................64Figure 3.32. Case 2aii: Stress Levels at End of First Thermal Cycle ...........................................65Figure 3.33. Case 2a: Horizontal Deformation of Geofoam Compressible Inclusion at End of
First Thermal Cycle .................................................................................................................66Figure 3.34. Case 2a: Lateral Pressures at Fourth Thermal Expansion Peak ...............................67Figure 3.35. Case 2aii: Stress Levels at Fourth Thermal Expansion Peak ...................................68Figure 3.36. Case 2a: Horizontal Deformation of Geofoam Compressible Inclusion at Fourth
Thermal Expansion Peak .........................................................................................................69Figure 3.37. Case 2a: Lateral Pressures at End of Fourth Thermal Cycle....................................70Figure 3.38. Case 2aii: Stress Levels at End of Fourth Thermal Cycle........................................71Figure 3.39. Case 2a: Horizontal Deformation of Geofoam Compressible Inclusion at End of
Fourth Thermal Cycle..............................................................................................................72Figure 3.40. Case 2b: Lateral Pressures at End of Construction ..................................................73Figure 3.41. Case 2b: Horizontal Deformation of Geofoam Compressible Inclusion at End of
Construction.............................................................................................................................74Figure 3.42. Approximate ZEP-Wall Analysis Method: Model Concept.....................................75Figure 3.43. Approximate ZEP-Wall Analysis Method: Spring Stiffnesses ................................77Figure 3.44. Case 2b: Lateral Pressures at First Thermal Contraction Peak ................................80Figure 3.45. Case 2b: Horizontal Deformation of Geofoam Compressible Inclusion at First
Thermal Contraction Peak .......................................................................................................81Figure 3.46. Case 2b: Lateral Pressures at First Thermal Expansion Peak ..................................82Figure 3.47. Case 2b: Horizontal Deformation of Geofoam Compressible Inclusion at First
Thermal Expansion Peak .........................................................................................................83Figure 3.48. Case 2b: Lateral Pressures at End of First Thermal Cycle .......................................84Figure 3.49. Case 2b: Horizontal Deformation of Geofoam Compressible Inclusion at End of
First Thermal Cycle .................................................................................................................85Figure 3.50. Case 2b: Lateral Pressures at Fourth Thermal Expansion Peak ...............................86Figure 3.51. Case 2b: Horizontal Deformation of Geofoam Compressible Inclusion at Fourth
Thermal Expansion Peak .........................................................................................................87Figure 3.52. Case 2b: Lateral Pressures at End of Fourth Thermal Cycle....................................88Figure 3.53. Case 2b: Horizontal Deformation of Geofoam Compressible Inclusion at End of
Fourth Thermal Cycle..............................................................................................................89Figure 3.54. Case 2aii: Effect of FEM Model on Calculated Lateral Pressures at Thermal
Contraction Peaks ....................................................................................................................92Figure 3.55. Case 2bi: Effect of FEM Model on Calculated Lateral Pressures at Thermal
Contraction Peaks ....................................................................................................................93Figure 3.56. Case 2bii: Effect of FEM Model on Calculated Lateral Pressures at Thermal
Contraction Peaks ....................................................................................................................94Figure 3.57. Case 2aii: Effect of FEM Model on Calculated Lateral Pressures at Thermal
Expansion Peaks ......................................................................................................................95Figure 3.58. Case 2bi: Effect of FEM Model on Calculated Lateral Pressures at Thermal
Expansion Peaks ......................................................................................................................96Figure 3.59. Case 2bii: Effect of FEM Model on Calculated Lateral Pressures at Thermal
Expansion Peaks ......................................................................................................................97

ix
Integral-Abutment Bridges: Problems and Innovative Solutions Using EPS Geofoam and Other GeosyntheticsManhattan College Research Report No. CE/GE-00-2
Figure 3.60. Case 2aii: Effect of FEM Model on Calculated Lateral Pressures at Ends ofThermal Cycles........................................................................................................................98
Figure 3.61. Case 2bi: Effect of FEM Model on Calculated Lateral Pressures at Ends ofThermal Cycles........................................................................................................................99
Figure 3.62. Case 2bii: Effect of FEM Model on Calculated Lateral Pressures at Ends ofThermal Cycles......................................................................................................................100
Figure 3.63. Case 3ai: FEM Mesh (partial) ................................................................................102Figure 3.64. Case 3bi: FEM Mesh (partial) ................................................................................103Figure 3.65. Case 3aii: FEM Mesh (partial) ...............................................................................104Figure 3.66. Case 3bii: FEM Mesh (partial) ...............................................................................105Figure 3.67. Case 3a: Lateral Pressures at End of Construction.................................................107Figure 3.68. Case 3a: Lateral Pressures at First Thermal Contraction Peak ..............................108Figure 3.69. Case 3a: Lateral Pressures at First Thermal Expansion Peak.................................109Figure 3.70. Case 3a: Lateral Pressures at End of First Thermal Cycle .....................................110Figure 3.71. Case 3a: Lateral Pressures at Fourth Thermal Expansion Peak .............................111Figure 3.72. Case 3a: Lateral Pressures at End of Fourth Thermal Cycle..................................112Figure 3.73. Case 3b: Lateral Pressures at End of Construction ................................................113Figure 3.74. Case 3: Comparison of 3a/3b Results at End of Construction ...............................114Figure 3.75. Case 3b: Horizontal Deformation of Geofoam Compressible Inclusion at End of
Construction ..........................................................................................................................115Figure 3.76. Case 3b: Lateral Pressures at First Thermal Contraction Peak ..............................116Figure 3.77. Case 3: Comparison of 3a/3b Results at First Thermal Contraction Peak .............117Figure 3.78. Case 3b: Horizontal Deformation of Geofoam Compressible Inclusion at First
Thermal Contraction Peak.....................................................................................................118Figure 3.79. Case 3b: Lateral Pressures at First Thermal Expansion Peak ................................119Figure 3.80. Case 3: Comparison of 3a/3b Results at First Thermal Expansion Peak ...............120Figure 3.81. Case 3b: Horizontal Deformation of Geofoam Compressible Inclusion at First
Thermal Expansion Peak .......................................................................................................121Figure 3.82. Case 3b: Lateral Pressures at End of First Thermal Cycle.....................................122Figure 3.83. Case 3b: Lateral Pressures at Fourth Thermal Expansion Peak .............................123Figure 3.84. Case 3b: Lateral Pressures at End of Fourth Thermal Cycle..................................124
Figure 4.1. Comparison of Normalized Horizontal Resultant Forces for Various DesignAlternatives............................................................................................................................127
Figure A.1. Approximate REP-Wall Analysis Method: Spring Stiffnesses ...............................150

Integral-Abutment Bridges: Problems and Innovative Solutions Using EPS Geofoam and Other GeosyntheticsManhattan College Research Report No. CE/GE-00-2
x
This page intentionally left blank.

xi
Integral-Abutment Bridges: Problems and Innovative Solutions Using EPS Geofoam and Other GeosyntheticsManhattan College Research Report No. CE/GE-00-2
List of Tables
Table 3.1. Combinations of Primary Variables in Analyses Performed for Present Study ..........23Table 3.2. Hyperbolic Constitutive Model Parameters for 2-D (Solid) Element Materials .........26Table 3.3. Constitutive Model Parameters for 1-D (Interface) Elements .....................................27Table 3.4. Case 1a: Comparison of β Values for Unreinforced Soil Backfill/Fill .......................47Table 3.5. Comparison of Required Thickness of Compressible Inclusion, tci, to Achieve the
Active Earth Pressure State (REP-Wall Concept)...................................................................57Table 3.6. Comparison of Calculated Results for ZEP-Wall Analysis Methods..........................78
Table 4.1. Comparison of Normalized Horizontal Resultant Forces, β......................................126

Integral-Abutment Bridges: Problems and Innovative Solutions Using EPS Geofoam and Other GeosyntheticsManhattan College Research Report No. CE/GE-00-2
xii
This page intentionally left blank.

xiii
Integral-Abutment Bridges: Problems and Innovative Solutions Using EPS Geofoam and Other GeosyntheticsManhattan College Research Report No. CE/GE-00-2
EXECUTIVE SUMMARY
Background
The most common design concept for a road bridge traditionally consists of some type ofsuperstructure resting on an abutment at each end as shown in Figure ES.1. There may also beone or more intermediate piers but they are incidental to the focus of this report. Because ofnatural, seasonal variations in air temperature, the bridge superstructure will change intemperature and tend to change dimension in its longitudinal direction as shown in Figure ES.1.However, the supporting abutments are relatively insensitive to air temperature so remainspatially fixed year 'round. To accommodate the seasonal relative movement betweensuperstructure and abutments and prevent temperature-induced stresses from developing withinthe superstructure, the traditional solution has been to provide expansion joints and bearings ateach end of the superstructure as shown in Figure ES.1. These joints and bearings typically mustaccommodate movements of the order of several tens of millimetres (one inch).
Although the design shown in Figure ES.1 works well in concept, experience indicates that theexpansion joint/bearing detail can be a significant post-construction maintenance item and thusexpense during the in-service life of a bridge. Therefore, the concept was developed to physicallyand structurally connect the superstructure and abutments as shown in Figure ES.2 to create whatis referred to as an integral-abutment bridge (IAB). In doing so, the troublesome and costlyexpansion joint/bearing detail is eliminated. IABs have been used for roads since at least theearly 1930s in the U.S.A. However, they have seen more extensive use worldwide in recent yearsbecause of their economy of construction in a wide range of conditions. Over the years and indifferent countries IABs have also been called integral bridges, integral bridge abutments,jointless bridges, rigid-frame bridges and U-frame bridges. There is also a design variant calledthe semi-integral-abutment bridge.
Figure ES.1. Conventional Bridge Design
abutments
superstructure
expansion joints
primary direction ofthermally induced movement
bearings
����� ������

Integral-Abutment Bridges: Problems and Innovative Solutions Using EPS Geofoam and Other GeosyntheticsManhattan College Research Report No. CE/GE-00-2
xiv
The Problem
Although the IAB concept has proven to be economical in initial construction for a wide rangeof span lengths as well as technically successful in eliminating expansion joint/bearing problems,it is not problem free overall in service. In retrospect, this is not surprising and perhaps shouldhave been expected. This is because the IAB concept does nothing to fundamentally alter natureand physics and the tendency of a bridge superstructure to undergo seasonal temperature andconcomitant length changes. All that has changed are the details of how this movement occursand the fact that the problems that result from this movement are primarily geotechnical and notstructural in nature.
Because of the increased use of IABs, there is now greater awareness of and interest in theirpost-construction, in-service problems. Fundamentally, these problems are due to a complex soil-structure interaction mechanism involving relative movement between the bridge (morespecifically, its abutments) and adjacent retained soil. Because this movement is the result ofnatural, seasonal thermal variations, it is inherent in all IABs. Although these problems turn outto be primarily geotechnical in their cause, they can result in significant damage to structuralcomponents of the bridge. In addition, on the approach to an IAB there can be pavement ride-quality problems for motor vehicles due to development of the "bump at the end of the bridge".Overall, these post-construction problems, and the maintenance and/or remedial costs theygenerate, inflate the true life-cycle cost of an IAB. In essence, IABs still have maintenance costsas did their jointed predecessors. Only the nature of the maintenance has changed.
The primary cause of post-construction, in-service problems for IABs is shown in Figure ES.3.As the bridge superstructure goes through its seasonal length changes, it causes the structurallyconnected abutments to move away from the soil they retain in the winter and into the soil duringthe summer. The mode of abutment movement is primarily rotation about their bottom althoughthere is a component of translation (horizontal displacement) as well. As expected, the totalhorizontal displacements are greatest at the top of each abutment and can have a maximummagnitude of the order of several tens of millimetres (one inch).
Figure ES.2. Integral-Abutment Bridge Variations
(a)
(b)
approach slab

xv
Integral-Abutment Bridges: Problems and Innovative Solutions Using EPS Geofoam and Other GeosyntheticsManhattan College Research Report No. CE/GE-00-2
At the end of each annual thermal cycle, there is often a net movement of each abutment awayfrom the retained soil as shown in Figure ES.3. This net movement is exacerbated when thebridge superstructure is composed primarily of portland cement concrete (PCC) because PCCundergoes inherent post-construction shrinkage that causes the bridge superstructure to shortenpermanently and pull the abutments away from the retained soil in the process.
There are at least two important consequences of this annual thermal movement cycle of IABs.It appears that the first one was recognized at least as far back as the 1960s and is the largehorizontal earth stresses ("lateral earth pressures") that develop between the back of eachabutment and retained soil during the annual summer expansion of the superstructure. As eachabutment is rotated and translated into the soil mass that it retains these lateral earth pressurescan approach the theoretical passive state, especially along the upper portion of the abutmentwhere horizontal displacements are largest. This means that the horizontal resultant earth forceon each abutment can be more than an order of magnitude greater than that for which anabutment would typically be designed. This far exceeds any normal structural safety factors andthus can result in a structural failure of an abutment.
Recent (circa 1990s) research has indicated that this seasonal increase in lateral earth pressuresmay actually be a bigger problem than initially thought. The reason is related to the netmovement of the abutments away from the retained soil as shown in Figure ES.3. Theexplanation of the cause of this net movement (in addition to any post-constructionsuperstructure shrinkage) begins with the fact that a wedge-shaped portion of the retained soilmoves toward each abutment during the annual winter contraction of the bridge superstructureand concomitant movement of an abutment away from the soil. When the superstructure expandstowards its next summer maximum, this soil wedge does not return to its original position. Thisis due to the inherent non-linear behavior of soil and can thus occur with any type of soil and nomatter how properly it was placed during original construction. In any event, as a result of thissoil movement the summer lateral earth pressures tend to increase over time as the soilimmediately adjacent to each abutment becomes increasingly wedged in. Because each summer'slateral earth pressures are somewhat greater in magnitude than those from the preceding year it
Figure ES.3. Thermally Induced IAB Abutment Movement
summerposition
winterposition
final position at end ofannual temperature cycle
Note: Initial abutment position at start of annual temperature cycleshown by shaded area.
superstructure

Integral-Abutment Bridges: Problems and Innovative Solutions Using EPS Geofoam and Other GeosyntheticsManhattan College Research Report No. CE/GE-00-2
xvi
means that structural failure may take years to develop, a phenomenon that has been observed inpractice for other types of earth retaining structures where thermally induced cyclic movementsand soil wedging also occurs. Overall, this phenomenon of soil wedging and long-term buildupof lateral earth pressures is referred to as ratcheting. Given the relatively long (100-plus years)design lives of IABs, ratcheting behavior represents a potentially serious long-term source ofIAB problems, primarily structural failure of the abutments.
The second important consequence of the annual thermal cycle movement of IABs is alsorelated to the net inward movement of the abutments and has become fully appreciated onlyrecently circa the 1990s. This is the development of a settlement trough adjacent to eachabutment as shown in Figure ES.4. This settlement trough is the result of the above-describedsoil wedge slumping downward and toward the back of each abutment. The consequences of thissettlement depend on whether or not an approach slab was constructed as part of the bridge. Ifthere is no slab, there will be a difference in road surface elevation occurring over a shortdistance creating the classical "bump-at-the-end-of-the-bridge" condition. If there is a slab,initially it will span over the void created underneath it by the settled soil. However, with timeand traffic the slab will likely fail in flexure. The development of a settlement trough behind IABabutments has received much more interest than the lateral earth pressure problem in recentyears, apparently because settlement tends to develop and become problematic relatively soon (afew years at most) after an IAB is placed into service whereas the ratcheting buildup of lateralearth pressures might not create problems for decades. Note that even a very small magnitude ofsettlement beneath an approach slab will cause a void and result in the slab's losing contact withthe underlying ground.
Proposed Solutions
Because of the current extensive use of IABs, there is a critical need to develop improveddesigns to correct the behavioral deficiencies inherent in all IABs as they are designed currently.The study documented in this report used a conceptual framework for developing improved IABdesigns that was based on a fundamental understanding of knowledge gained from both
Figure ES.4. Settlement Trough and Void Development behind IAB Abutments
area of settlement andvoid development
(if approach slab used)
new ground surfacedue to long-term
abutment movement
long-term position of abutment

xvii
Integral-Abutment Bridges: Problems and Innovative Solutions Using EPS Geofoam and Other GeosyntheticsManhattan College Research Report No. CE/GE-00-2
conventional bridges as well as observed problems with IABs. The key concepts andconsiderations used in developing the solutions presented in this report are as follows:
• A bridge should be allowed to move freely with seasonal temperature variations to preventthe development of thermally induced forces within its components. With IABs, this meansthat both the superstructure and abutment should be allowed to move.
• The retained soil adjacent to a bridge abutment is not directly affected by seasonaltemperature variations. Therefore, it can and should remain spatially and temporally fixed toprevent pavement settlement on the approach embankment or void formation under approachslabs. With conventional bridges, the necessary soil fixity is provided by the abutments. WithIABs, the necessary fixity must be developed from within the retained soil itself as theabutments move seasonally and no longer provide this function. Because soil with a verticalslope is not inherently self stable, this suggests that geosynthetics could be useful.
• Relative movement between a bridge and adjacent ground should be accommodated in anorderly predictable manner. With conventional bridges, this is provided by expansion jointsand bearings. With IABs, no such detail exists with current designs so a new type ofexpansion joint should be developed. Leaving a void between IAB abutments and theretained soil as a de facto expansion joint is not considered an acceptable option. Experienceindicates that a void is difficult to construct routinely and reliably, and cannot be dependedon to remain for the life of the bridge.
• The seasonal increase in lateral earth pressures on IAB abutments and the related tendencyfor permanent long-term increases due to ratcheting behavior should be addressed. Althoughthis could be handled structurally by designing more-robust abutments this may not be themost economical solution. Other, more-innovative solutions may exist. Again, leaving a voidbetween IAB abutments and retained soil is not considered an acceptable option.
This report presents the results of a preliminary study conducted to investigate potential designalternatives that have as their primary component expanded polystyrene (EPS) geofoam. The useof other types of geosynthetics, principally geogrids and geotextiles as tensile reinforcement, insynergistic combination with EPS geofoam was also investigated. Although revised designstrategies that make use of geosynthetics will increase the construction cost of an IAB, theanticipated superior post-construction, in-service performance of such IABs should more thanmake up for the increase by reducing future maintenance and repair costs.
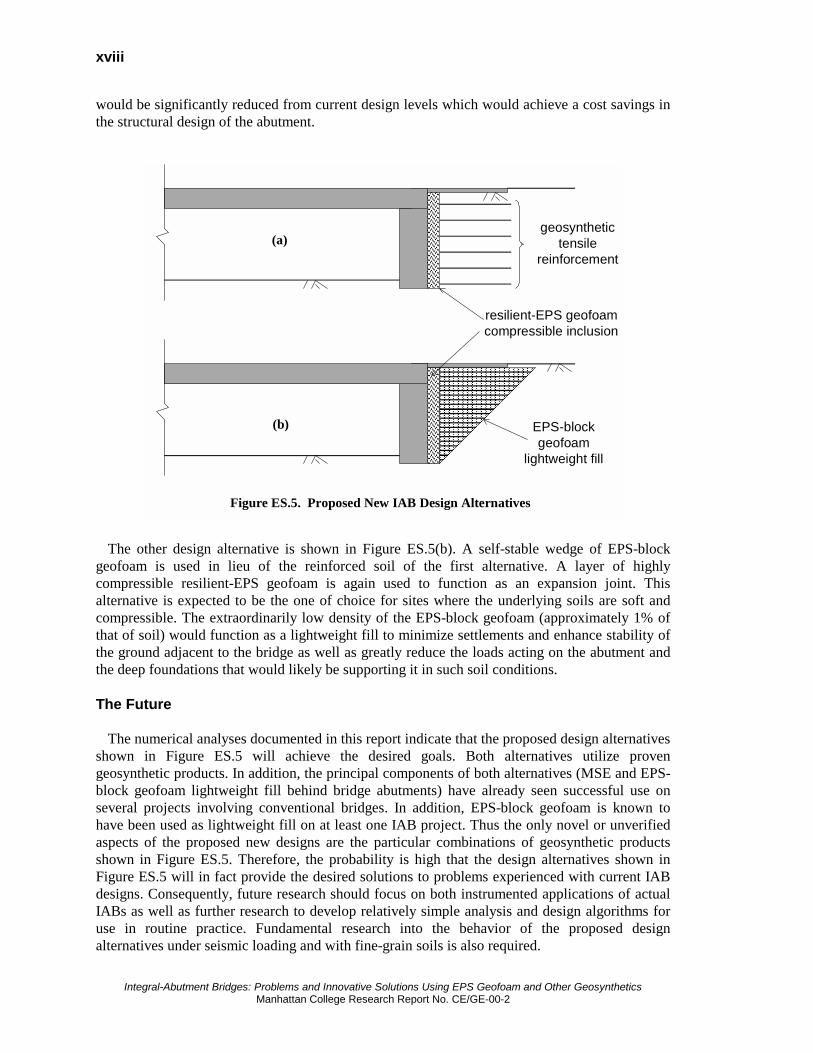
This report has identified two different designs that each appear to address all the issuesenumerated above. They are shown schematically in Figure ES.5. The one likely to be more costeffective in most applications is shown in Figure ES.5(a). It utilizes tensile reinforcement (likelygeogrid or geotextile) to create a mechanically stabilized earth (MSE) mass within the retainedsoil adjacent to each abutment. This will provide a soil mass that is inherently self-stable for thedesign life of the bridge. In addition, a resilient-EPS geofoam compressible inclusion would beused between the abutment and MSE mass. This inclusion is designed to be highly compressibleand thus functions as the desired expansion joint between IAB and retained soil. It will alsothermally insulate the retained soil and can be designed to serve as the always necessary drainagelayer. This inclusion simultaneously allows the reinforcement within the soil to function as wellas the abutments to move seasonally. Summer increases in lateral earth pressures would bereduced to relatively small magnitudes. Overall, lateral earth pressures acting on the abutments
Integral-Abutment Bridges: Problems and Innovative Solutions Using EPS Geofoam and Other GeosyntheticsManhattan College Research Report No. CE/GE-00-2
xviii
would be significantly reduced from current design levels which would achieve a cost savings inthe structural design of the abutment.
The other design alternative is shown in Figure ES.5(b). A self-stable wedge of EPS-blockgeofoam is used in lieu of the reinforced soil of the first alternative. A layer of highlycompressible resilient-EPS geofoam is again used to function as an expansion joint. Thisalternative is expected to be the one of choice for sites where the underlying soils are soft andcompressible. The extraordinarily low density of the EPS-block geofoam (approximately 1% ofthat of soil) would function as a lightweight fill to minimize settlements and enhance stability ofthe ground adjacent to the bridge as well as greatly reduce the loads acting on the abutment andthe deep foundations that would likely be supporting it in such soil conditions.
The Future
The numerical analyses documented in this report indicate that the proposed design alternativesshown in Figure ES.5 will achieve the desired goals. Both alternatives utilize provengeosynthetic products. In addition, the principal components of both alternatives (MSE and EPS-block geofoam lightweight fill behind bridge abutments) have already seen successful use onseveral projects involving conventional bridges. In addition, EPS-block geofoam is known tohave been used as lightweight fill on at least one IAB project. Thus the only novel or unverifiedaspects of the proposed new designs are the particular combinations of geosynthetic productsshown in Figure ES.5. Therefore, the probability is high that the design alternatives shown inFigure ES.5 will in fact provide the desired solutions to problems experienced with current IABdesigns. Consequently, future research should focus on both instrumented applications of actualIABs as well as further research to develop relatively simple analysis and design algorithms foruse in routine practice. Fundamental research into the behavior of the proposed designalternatives under seismic loading and with fine-grain soils is also required.
Figure ES.5. Proposed New IAB Design Alternatives
������������������������������������������������������������������������
resilient-EPS geofoamcompressible inclusion
(a)
(b)
geosynthetictensile
reinforcement
EPS-blockgeofoam
lightweight fill
��������������������������������������������������������������������������������������������������������������������������������������������������������������������������������������������������������������������������������������������������������������������������
���������������������������������������������������������������

1
Integral-Abutment Bridges: Problems and Innovative Solutions Using EPS Geofoam and Other GeosyntheticsManhattan College Research Report No. CE/GE-00-2
Section 1Background and Overview of Study
1.1 INTRODUCTION
This report documents a research study performed by Prof. John S. Horvath, Ph.D., P.E. of theManhattan College Civil Engineering Department. Background information concerning thegenesis and scope of this study is presented in this section of the report.
1.2 BACKGROUND
1.2.1 Soil-Structure Interaction
1.2.1.1 Definition. An important category of civil engineering problems that straddles theboundary between the specialties of geotechnical and structural engineering is the soil-structureinteraction (SSI) problem. SSI problems involve situations where a sufficiently accurate analysisof the forces within and displacements of some structure (building, bridge, etc.) must explicitlymodel the structure and adjacent ground acting together. Thus neither the structural norgeotechnical component of the problem can be satisfactorily analyzed as if the other were notpresent. This generally requires a single, combined analysis of both the structural andgeotechnical components of the problem although it is sometimes feasible to iteratively performseparate analyses of the structural and geotechnical components (Ulrich 1991). Note that SSIproblems are distinct from problems where the behavior of the structure and ground can beanalyzed, with sufficient accuracy for routine practice, as being independent of one another.
It is worth noting that some civil engineers restrict the use of the term soil-structure interactionto problems involving seismic loading. In the author's opinion, this narrower definition isneedlessly restrictive. The broader definition described above is adopted in this report.
1.2.1.2 Application to Bridges. Bridges are a type of structure for which SSI can often bean important analysis or design consideration. There are several different SSI mechanisms thataffect bridges. They are discussed in more detail in Section 2 of this report. Depending on thespecific project (type and span length of bridge, geologic conditions, geographic location), anyone these mechanisms can have a significant effect on the analysis or design of a bridge.
1.2.2 Integral-Abutment Bridges
A type of bridge that is used extensively in road applications in particular is the integral-abutment bridge (IAB). Depending on geographic location and time period, other terms such asintegral bridge, integral bridge abutments, jointless bridge, rigid-frame bridge or U-framebridge have been or are used to refer to this type of structure. Although IABs have apparentlybeen used since at least the early 1930s in the U.S.A. (Card and Carder 1993), the 1990s sawgrowing interest and use of this type of bridge worldwide.
The design details of IABs that are relevant to this study are discussed in Section 2 of thisreport. Also discussed in Section 2 is the fact that IABs involve a unique SSI issue that is notencountered with other types of bridges. This SSI issue has resulted in significant post-

Integral-Abutment Bridges: Problems and Innovative Solutions Using EPS Geofoam and Other GeosyntheticsManhattan College Research Report No. CE/GE-00-2
2
construction, in-service problems with the performance of IABs that was the motivating factorfor the study covered by this report.
1.2.3 Geofoam
On a separate but parallel track, the use of geofoam also saw a dramatic increase during the1990s although geofoam usage actually dates back at least to the early 1960s (Horvath 1995b).For those unfamiliar with the term or its correct definition, geofoam is the generic term appliedto any closed-cell foam material or product used in a geotechnical application. Geofoam is nowrecognized worldwide as a category or type of geosynthetic product in the same way as the moreconventional, planar types of geosynthetics (geogrids, geomembranes, geotextiles, etc.).
The greater awareness and use of geofoams throughout the 1990s has been accompanied bysignificant research into new and varied applications. This is especially true for expandedpolystyrene (EPS), a polymeric (plastic) foam which is the most commonly used geofoammaterial worldwide. One reason why EPS geofoam is the material of choice for recent geofoamresearch is that there is no other proven geofoam material that can match the cost effectivenessand range in geotechnically relevant properties of EPS. Therefore, EPS geofoam offers greatdiversity in the ways that it can function in the ground (Horvath 1995b).
This report presumes a basic working knowledge of both EPS geofoam as well as other typesof geosynthetics (primarily geogrids and geotextiles) used for tensile reinforcement. For thoseunfamiliar with either geofoam geosynthetic or reinforcement geosynthetics, the necessarybackground information can be found in Horvath (1995b) for geofoam and Koerner (1998) for allother types of geosynthetics.
1.3 PRESENT STUDY
1.3.1 Purpose and Objectives
As noted in Section 1.2.2, the use of IABs has not been without significant post-constructionin-service problems. This implies that there is an inherent defect in current IAB designs thatrequires correction. As a result, much of the geotechnical research interest in IABs throughoutthe 1990s has focused on developing preventive or remedial design strategies.
This same time period also saw significant research into numerous aspects of EPS geofoam toextend its traditional geosynthetic functions and applications. Therefore, it occurred to the authorthat a useful research project would be to combine these two areas of research to see if EPSgeofoam could be useful in overcoming some of the problems experienced with IABs. Althoughthe possible use of geofoams in general to eliminate or at least reduce problems with IABs hasbeen noted previously both by the author and others (Briaud et al. 1997; Carder and Card 1997;Horvath 1995b, 1996, 1998a), there is no published study known to the author that focuses on theuse of geofoam in this application and, more specifically, the different functional ways in whichgeofoam, specifically EPS geofoam, can potentially act beneficially. Therefore, it was felt thatsuch a study would be a useful contribution to the state of knowledge.
This study was conducted by the author as the principal and sole investigator. There was noexternal financial support for this study so the scope was determined solely by the author basedon an independent and objective assessment of IAB problems and the feasibility of potentialsolutions involving geosynthetics. In addition, there was no support or resources of any kindprovided for any part of this study by Manhattan College. This report was issued under theauspices of Manhattan College solely as a venue for publication. All resources necessary toproduce this report were provided by Horvath Engineering, P.C. of Scarsdale, New York, U.S.A.

3
Integral-Abutment Bridges: Problems and Innovative Solutions Using EPS Geofoam and Other GeosyntheticsManhattan College Research Report No. CE/GE-00-2
1.3.2 Scope
Because of the restrictions imposed by available resources, this study was limited to anumerical and theoretical investigation of one relatively simple, hypothetical problem thatincluded what were felt to be key components of a typical IAB with respect to the objectives ofthis study. Therefore, this study was not intended to provide final answers and comprehensivedesign guidelines for all IABs. However, it was felt that the results of this study would provideuseful preliminary conclusions and guidance for interim use in practice as an improvement overthe status quo. It was also believed that this study would serve as a logical precursor for more-detailed research that would include physical modeling using large-scale 1-g models and/or ageotechnical centrifuge as well as instrumented observations of actual IABs. Thus it is hoped thatthe results of this study will serve as both a catalyst and resource for improving the current stateof practice as well as future research.
1.3.3 Organization of Report
This report contains all published results of the study outlined in Section 1.3.2. In addition tothis introductory section, this report is organized as follows:
• Section 2 describes the phenomena and mechanisms of SSI problems for IABs.
• Section 3 presents and discusses the results of all analyses performed for the present study.
• Section 4 presents the conclusions drawn from the results of this study as well asrecommendations for future study.
• Section 5 contains a list of all references cited in this report.
• Section 6 contains a definition list of all notation used in this report.
• Section 7 contains a limited, selective bibliography of publications related to IABs as well asseveral other areas of lateral earth pressure theory and application that the author has foundof particular relevance or interest. The intention of this bibliography is to serve as a resourcefor future research by others.
• Appendix A contains the theoretical derivation of an improved analytical method for whatthe author terms the Reduced Earth Pressure (REP) Wall concept. The REP-Wall concept isrelated to certain behavioral aspects of IABs.

Integral-Abutment Bridges: Problems and Innovative Solutions Using EPS Geofoam and Other GeosyntheticsManhattan College Research Report No. CE/GE-00-2
4
This page intentionally left blank.

5
Integral-Abutment Bridges: Problems and Innovative Solutions Using EPS Geofoam and Other GeosyntheticsManhattan College Research Report No. CE/GE-00-2
Section 2Soil-Structure Interaction and Bridges
2.1 OVERVIEW
As noted in Section 1.2.1.2, the analysis and design of bridges often involves consideration ofone or more categories of SSI involving the bridge superstructure, the superstructure supportelements (abutments and intermediate piers, if any, and their foundations) and the groundsupporting the foundations of the abutments and piers. The SSI categories most commonlyencountered and considered in bridge-engineering practice are:
• total and differential settlement of the abutments and piers under gravity and live loads, andthe effect that differential settlements in particular have on the performance (both theServiceability Limit State (SLS) and Ultimate Limit State (ULS))1 of the bridgesuperstructure; and
• total and relative displacements of, as well as forces in, the various bridge components underseismic loading, usually as they relate to the ULS.
Note that wind-induced displacements of and forces within a bridge superstructure, which can beof significant importance, are usually not an SSI problem as the ground typically has relativelyless influence over how a bridge superstructure behaves under wind loading.
An additional SSI category, and the one of primary interest in this study, is thermal loading.Simply stated, the issue here is that a bridge superstructure is exposed to annual, seasonalvariations in air temperature that can be of the order of 50°C (90°F) or more in temperateclimates. The temperature of the structural elements that comprise the bridge superstructure will,more or less, reflect this variation. As a result, the bridge superstructure will, in the theoreticallimiting cases, either:
• freely expand and contract longitudinally to the maximum extent theoretically possible (ifunconstrained against movement) or
• develop the maximum theoretically possible thermally induced compression and tensionstresses within its members (if fully constrained against movement).
There can also be intermediate conditions of constraint in which the bridge superstructure willexperience some combination of thermally induced displacement and internal stresses.
On the other hand, although the ground that supports the bridge will see some near-surfaceseasonal temperature variation most soils and rocks do not change volume with temperature, atleast for the temperature ranges of interest with regard to bridges2. This means that, for all
1 For those unfamiliar with the limit states (failure) concepts of SLS and ULS for structures, SLS involvesissues that relate to the serviceability (intended use and maintenance) of the structure while ULS refers to aphysical collapse of all or part of the structure.2 This statement relates only to behavior of the dry soil-particle skeleton. Not considered here arephenomena such as frost heave, thaw settlement or swelling/shrinking which involve interaction between thesoil skeleton and ground water within the voids of the soil skeleton.

Integral-Abutment Bridges: Problems and Innovative Solutions Using EPS Geofoam and Other GeosyntheticsManhattan College Research Report No. CE/GE-00-2
6
practical purposes, the ground and the support it provides to the bridge foundations (abutmentsand intermediate piers if any) is spatially and temporally fixed with respect to any changes intemperature that occur to the ground.
This relatively dissimilar behavior under temperature changes between the thermally activebridge superstructure and thermally inactive ground is what creates a SSI problem for bridges.The conflict is that the bridge superstructure wants to deform with temperature; the ground doesnot; yet the two are linked together through the foundations so the bridge and ground must reactas one in some fashion. Thus the SSI challenge here is to find a way to accommodate thetendency of a bridge superstructure to move with temperature changes yet still provide asufficiently smooth transition to the adjacent ground which is relatively temperature stable. ThisSSI challenge as it applies to IABs was the focus of the study covered by this report.
2.2 DESIGN FOR TEMPERATURE-INDUCED SOIL-STRUCTURE INTERACTION
2.2.1 Conventional Bridges
2.2.1.1 Concept and Details. The traditional design concept used to address thetemperature-related SSI problem discussed in Section 2.1 is shown schematically in Figure 2.1for the basic case of a single-span bridge. Note that the details of the bridge superstructure areincidental to the discussion here.
The overall design philosophy on which this design concept is based is to make the bridgesuperstructure as unconstrained as practicable to minimize thermally induced loads fromdeveloping within the superstructure. However, the bridge abutments are spatially and temporallyfixed, at least as far as thermal issues are concerned. This means that longitudinal displacementof the superstructure (i.e. in the direction indicated in the figure) between the fixed abutmentsmust be accommodated. This is done by creating a physical gap, called an expansion joint, that isplaced between each end of the superstructure and its adjacent abutment as shown in Figure 2.1.Each abutment is then designed as a more or less conventional rigid retaining wall of either the
Figure 2.1. Traditional Design Concept to AllowThermally Induced Bridge-Superstructure Movement
abutments
superstructure
expansion joints
primary direction ofthermally induced displacement
bearings
������ �������

7
Integral-Abutment Bridges: Problems and Innovative Solutions Using EPS Geofoam and Other GeosyntheticsManhattan College Research Report No. CE/GE-00-2
gravity or cantilever type (modern alternatives using geosynthetics can also be used) to retain thesoil behind the abutment.
With regard to the horizontal soil stresses (referred to colloquially as lateral earth pressures)for which the abutments are designed, although the active earth pressure state within the retainedsoil is often assumed the author's opinion is that the normally consolidated at-rest state is moreappropriate because structural and geometric restraints imposed on abutments generally preventtheir movement. An allowance for additional compaction-induced lateral earth pressures shouldalways be made (Duncan et al. 1991) although this is not always done in practice.
To allow the bridge superstructure to move as freely as possible with respect to its abutments,structural bearings are placed between the superstructure and abutments as shown in Figure 2.1.The bearings typically rest on a ledge (bridge seat) that is formed into the top of the abutment asshown schematically in Figure 2.1. Traditionally, these bearings were constructed entirely ofmetal. Later designs utilized other materials as well to make the bearing as close to frictionless asany real material can be.
For the case of a bridge with multiple spans, there are typically additional intermediateexpansion joints placed between each adjacent pair of spans with bearings placed on the top ofeach intermediate pier and supporting each span as shown in Figure 2.2.
The expansion joints and bearings must accommodate all anticipated longitudinal displacementof the superstructure during the design life of the bridge which is often 100 years or more. Tounderstand the magnitude of this movement, it is useful to state here the basic solid mechanicsequation (Timoshenko and Gere 1972) defining the idealized limiting case of unconstrainedmovement of a solid structural element (called the free-bar solution) under thermal loading:
TLL o ∆⋅α⋅=∆ (2.1)
Figure 2.2. Traditional Design Concept as Applied to Multi-Span Bridges
expansion joints
bearings
����������
������������
��������
����������
pier

Integral-Abutment Bridges: Problems and Innovative Solutions Using EPS Geofoam and Other GeosyntheticsManhattan College Research Report No. CE/GE-00-2
8
where:Lo = original length of the structural element,α = coefficient of thermal expansion of the material comprising the structural element,∆L = change in length of the structural element and∆T = change in temperature of the structural element.
As information, the other limiting case is that of full constraint and no movement, and is calledthe fixed-bar solution. The governing equation is (Timoshenko and Gere 1972):
TEAP sss ∆⋅α⋅⋅= (2.2)
where:As = cross-sectional area of the structural element,Es = Young's modulus of the material comprising the structural element,Ps = temperature-induced force in the structural element and
the other parameters are as defined previously for Equation 2.1.
From a practical perspective with respect to bridges in general, the only real variables inEquation 2.1 are the bridge span length, Lo, and annual range in air temperature3, ∆T, at the siteof the bridge4 as the coefficients of thermal expansion for the most common bridge materials(steel and portland-cement concrete (PCC)) are of the same order of magnitude (Timoshenko andGere 1972).
To provide orders of magnitude for typical superstructure movements to aid in visualizing theissue at hand, a relatively short-span bridge (say 30 metres (100 feet) long) in a temperate climatemight have an annual (summer to winter or vice versa) superstructure length change of severaltens of millimetres (one inch). On the other hand, a long-span suspension or cable-stayed bridgein the same climate might have a range in superstructure length change of the order of severalhundred millimetres (one foot).
In view of the relatively large range in movements that must be accommodated with differentbridges, the detail for how the expansion joint gap is actually created is handled in differentways. For relatively short-span bridges, the presumption is that a vehicle tire can cross therelatively small gap of perhaps a few tens of millimetres (one inch) maximum without creatingexcessive discomfort to the occupants of the vehicle. Therefore, the edge of the abutment orsuperstructure road surface on either side of the gap typically has a hard, smooth, straight cornercreated by a special product developed for this purpose (traditionally metal but nowadayspossibly some type of hard plastic or rubber). In some cases, there may be a relativelycompressible, elastic joint filler used as part of the overall expansion joint detail. On the otherhand, the joints for long spans typically have an interlocking-steel-finger geometry to provide areasonably continuous and smooth traveling surface for vehicles yet accommodate the relativelylarge superstructure movements typical of such structures.
2.2.1.2 Problems. The traditional expansion joint/bearing system has been found to performmore or less as intended conceptually but at the cost of being a high maintenance item, especiallyfor relatively short-span bridges. The primary problem is the corrosion and other physical
3 It is assumed here for simplicity that the average temperature of the bridge superstructure is the same asthe air temperature which is not necessarily the case.4 Note that there is no one value for ∆T even at a given geographic location because different return periods(e.g. 10 year, 50 year, 100 year, etc.) of measured air temperatures could be chosen for design.

9
Integral-Abutment Bridges: Problems and Innovative Solutions Using EPS Geofoam and Other GeosyntheticsManhattan College Research Report No. CE/GE-00-2
deterioration of the bridge bearings that occurs with time5. Corrosion is exacerbated in areas withseasonal below-freezing air temperatures where salts of various composition are placed on theroad surface for pavement deicing purposes. These salts can be washed down onto the bearingswhere they accelerate corrosion and deterioration of the bearings. Thus bridge bearings,especially in some climates, require relatively expensive periodic maintenance, repair or evenreplacement to maintain their function.
The structural materials used to create the expansion joint itself also suffer physicaldeterioration and require periodic maintenance, repair or replacement due to the repetitive impactby vehicle tires. There can also be deterioration of any material used as a joint filler. In addition,there is the issue of how to accommodate subsequent pavement overlays on either side of theexpansion joint. Obviously the joint itself should not be paved over but adhering to this rule willresult in a local depression in the pavement surface at the expansion joint which remains at hisoriginal elevation.
2.2.2 The Integral-Abutment Bridge Alternative and Related Concepts
2.2.2.1 Introduction. The maintenance problems and costs associated with conventionaljointed bridges, especially for relatively short spans, has created an opportunity to develop more-economical alternative designs for this application. It is beyond the scope of this study to discussall the alternatives that have been or might be considered, both actual and theoretical. This studyfocuses only on IABs for the reasons discussed in Section 1.
2.2.2.2 Concept. Because the expansion joint/bearing detail is the primary point of weaknesswith conventional short-span bridge designs, it is no surprise that the basic element of IABs is toeliminate this detail entirely. This is done by creating a physical and structural connectionbetween the bridge superstructure and abutments as shown schematically in Figure 2.3(a). Thedetails of the structural connection between superstructure and abutments vary depending on thestructural materials (steel or reinforced PCC) used as well as preferences or policy of thedesigner or owning agency. In addition, the abutments may be supported on shallow foundations(spread footings) or deep foundations (driven piles or drilled shafts) depending on technicalneed. However, these details are not important for the purposes of this study and it is sufficient tovisualize an IAB simply as a rigid-frame structure that, from a behavioral and analyticalperspective, acts as a single structural element.
A reinforced PCC slab, generally called an approach slab, that is structurally connected to thebridge appears to be used quite often with IABs. This detail is also shown schematically inFigure 2.3(a). The function of the approach slab is to provide a smooth transition between theIAB and adjacent approach embankment. Various approach-slab designs are discussed in detailby Briaud et al. (1997).
Not considered in this study but noted here for the sake of completeness is a variation of theIAB concept that the author refers to as a semi-integral-abutment bridge (SIAB). Such astructure is shown schematically in Figure 2.4. In an SIAB, only the expansion joint is eliminatedby extending the bridge superstructure over the top of the abutment. The bearing between deckand abutment is still present. Bearing maintenance is presumably reduced with this type of designbecause surface water no longer has direct access to the bearing.
5 Bearing corrosion is often referred to as freezing which, in this context, has nothing to do directly with thephysical phenomenon of the liquid-to-solid phase change of water. Rather, in this context freezing meansthat the bearing components corrode and cease to move, and thus the bearing ceases to perform its intendedfunction of allowing relatively unrestrained displacement of the bridge superstructure.

Integral-Abutment Bridges: Problems and Innovative Solutions Using EPS Geofoam and Other GeosyntheticsManhattan College Research Report No. CE/GE-00-2
10
2.2.2.3 Problems. In retrospect, it is no surprise that post-construction, in-service problems(there are two major ones but they are related) have been experienced with IABs. The reason isthat the fundamental phenomenon of a bridge superstructure that is thermally active and incontact with the thermally inactive ground still exists. The use of an IAB does not and cannotchange nature nor alter the basic laws of physics. Rather, the use of IABs simply shifts thelocation of where the bridge-ground interaction takes place and, as a result, shifts the locations,
Figure 2.3. Integral-Abutment Bridge Variations
(a)
(b)
approach slab
Figure 2.4. Semi-Integral-Abutment Bridge
abutments
bearings
������� ������superstructure
11
Integral-Abutment Bridges: Problems and Innovative Solutions Using EPS Geofoam and Other GeosyntheticsManhattan College Research Report No. CE/GE-00-2
symptoms and underlying causes of the problems that develop. What is most noteworthy torecognize is that the root cause of problems has shifted from being primarily structural togeotechnical in nature. This is important to appreciate as it suggests that an efficient solutions tothe problems should likewise be primarily geotechnical and not structural.
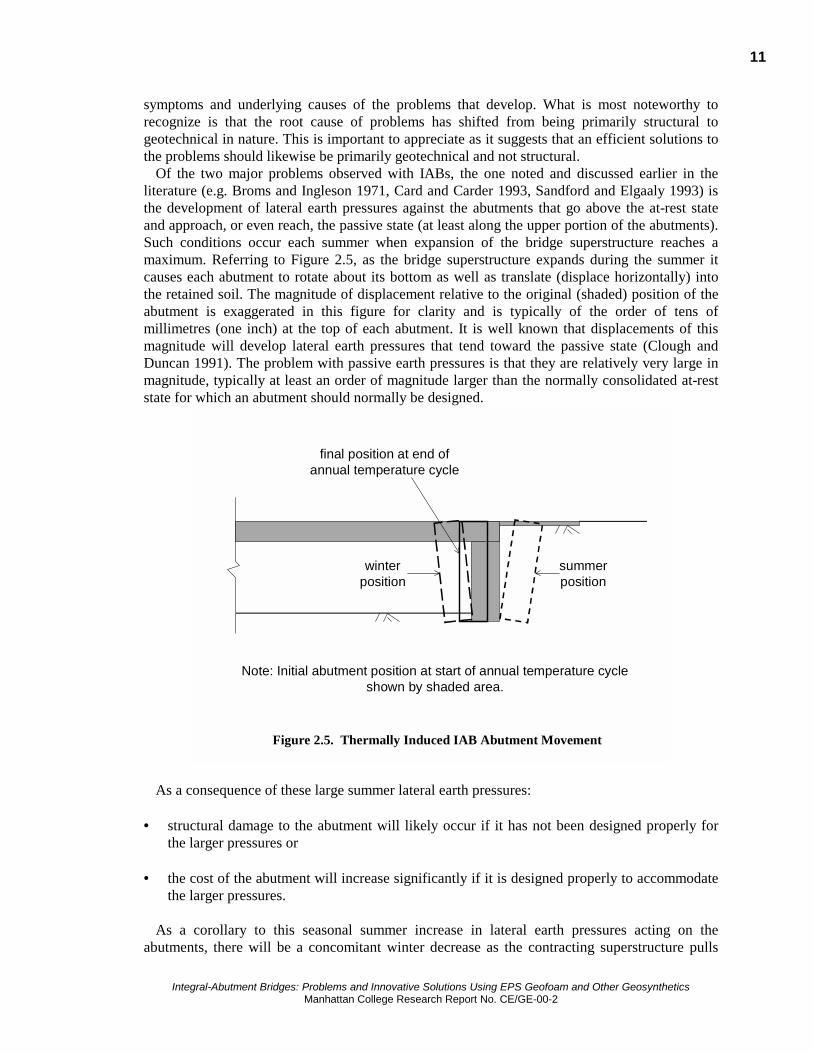
Of the two major problems observed with IABs, the one noted and discussed earlier in theliterature (e.g. Broms and Ingleson 1971, Card and Carder 1993, Sandford and Elgaaly 1993) isthe development of lateral earth pressures against the abutments that go above the at-rest stateand approach, or even reach, the passive state (at least along the upper portion of the abutments).Such conditions occur each summer when expansion of the bridge superstructure reaches amaximum. Referring to Figure 2.5, as the bridge superstructure expands during the summer itcauses each abutment to rotate about its bottom as well as translate (displace horizontally) intothe retained soil. The magnitude of displacement relative to the original (shaded) position of theabutment is exaggerated in this figure for clarity and is typically of the order of tens ofmillimetres (one inch) at the top of each abutment. It is well known that displacements of thismagnitude will develop lateral earth pressures that tend toward the passive state (Clough andDuncan 1991). The problem with passive earth pressures is that they are relatively very large inmagnitude, typically at least an order of magnitude larger than the normally consolidated at-reststate for which an abutment should normally be designed.
As a consequence of these large summer lateral earth pressures:
• structural damage to the abutment will likely occur if it has not been designed properly forthe larger pressures or
• the cost of the abutment will increase significantly if it is designed properly to accommodatethe larger pressures.
As a corollary to this seasonal summer increase in lateral earth pressures acting on theabutments, there will be a concomitant winter decrease as the contracting superstructure pulls
Figure 2.5. Thermally Induced IAB Abutment Movement
summerposition
winterposition
final position at end ofannual temperature cycle
Note: Initial abutment position at start of annual temperature cycleshown by shaded area.

Integral-Abutment Bridges: Problems and Innovative Solutions Using EPS Geofoam and Other GeosyntheticsManhattan College Research Report No. CE/GE-00-2
12
each abutment away from the retained soil, also as shown in Figure 2.5. As a result, the lateralearth pressures will tend to decrease to the active state. In at least one case in a cold climate, itwas found that the earth pressures dropped to zero as the retained soil behind the abutment frozeand the abutment pulled away leaving a gap (Broms and Ingleson 1971).
Although this problem of seasonal variations in lateral earth pressures has apparently beenrecognized for decades, recent research has refined the understanding of the nature and potentialseverity of this problem. Specifically, it is now appreciated that the higher summer pressures arenot constant during the life of an IAB but will tend to increase with time as seasonal cycles ofexpansion and contraction occur. The reason for this is that after each annual cycle of seasonalexpansion and contraction, an abutment does not return to exactly the same position it startedfrom. In most cases, there is a net movement of the abutment away from its initial position andthe retained soil as shown schematically in Figure 2.56. This is because soil is inherently non-linear and inelastic in its behavior. During winter contraction of the bridge, a wedge-shapedportion of the soil retained by each abutment moves downward and toward the abutment. As thetemperature warms up and an abutment moves toward the soil again the soil wedge does notreturn to its original position. As a result, a greater lateral earth pressure develops because thesoil effectively becomes wedged behind the abutment.
This general phenomenon of a buildup of lateral earth pressures due to cyclic thermalmovements of earth retaining structures is referred to as ratcheting behavior (England 1994,England and Dunstan 1994, England et al. 1995) and has been found to lead to eventual ULSfailure of earth retaining structures (England 1994). The overall concern here is that, because ofthe relatively long (100-plus years) design life of bridges, long-term problems could develop withmany if not most IABs as lateral earth pressures on their abutments build ("ratchet up") withtime. This could lead to SLS or even ULS failure decades after an IAB was constructed.
Recent research has also identified a second IAB problem that is essentially caused by thesame seasonal cycle of expansion and contraction of the bridge superstructure and theconcomitant cyclic displacement of the abutments. This is the development of a settlementtrough immediately behind each abutment. This is due largely to the progressive, cumulativeoutward and downward movement of soil wedges as described above. As a consequence of thissettlement, a void develops under the approach slab (if one was used) as shown schematically inFigure 2.6. If there is no approach slab, a noticeable sharp drop would occur on the pavementsurface of the approach embankment in the area immediately behind the abutment.
Although void development under approach slabs or settlement of the pavement surface is acommon problem with road bridges in general for a number of reasons unrelated to thermalmovement of IABs (Briaud et al. 1997), it is apparently a chronic, inherent problem with IABs inparticular. For example, Reid et al. (1998a, 1998b) noted that a survey of 140 IABs in the Stateof South Dakota in the U.S.A. found a void under virtually every approach slab. The void depthsranged from 13 mm (0.5 in) to 360 mm (14 in), and the voids extended as much as 3 m (10 ft)behind the abutment. The surface settlement that results in voids under approach slabs was alsofound in physical model testing, both in a geotechnical centrifuge (Ng et al. 1998) and a large-scale 1-g retaining wall test facility (Reeves and Filz 2000).
As noted by Reid et al. (1998b), the primary problem resulting from void development isphysical damage due to ULS structural failure of approach slabs. This is because the slabs areforced to span over the void, a function for which they are typically not designed. Note that avoid does not have to be very deep in order for it to produce damage to an approach slab. All thatis required is for the underside of the slab to lose contact with the ground surface.
6 Another factor that contributes to permanent abutment displacement for IABs with a PCC superstructure isthe inherent post-construction shrinkage of PCC.

13
Integral-Abutment Bridges: Problems and Innovative Solutions Using EPS Geofoam and Other GeosyntheticsManhattan College Research Report No. CE/GE-00-2
If there is no approach slab, the settlement of the paved road surface on the approachembankment produces the classic "bump at the end of the bridge" that causes discomfort tovehicle occupants and possible damage to both vehicles and pavement and is thus an SLS failurethat requires periodic pavement maintenance. The author has received personal communicationthat such pavement problems have indeed occurred with IABs without approach slabs.
The severity of void development/pavement settlement appears to be somewhat dependent onthe quality of the soil used to backfill/fill behind the abutment. Void development is apparentlyrelatively less if "high quality" material is used (this is generally interpreted to mean apredominantly coarse-grain soil that is relatively free of fine-grain particles) and placed in a well-compacted condition. This is consistent with general observations for all types of bridges asdiscussed by Briaud et al. (1997).
2.2.2.4 Potential Solutions: Present. The potential solutions to the IAB problemsdiscussed in Section 2.2.2.3 are still evolving. This is because the understanding that there arereally two problems to address (summer lateral earth pressure increases on abutments with long-term ratcheting buildup and surface settlement behind abutments) instead of just one (summerlateral earth pressures) have become more clearly identified, appreciated and conceptuallyunderstood only relatively recently during the 1990s. In fact, the evolutionary state of solvingIAB problems was the primary motivation to undertake the study covered by this report.
Not surprisingly, the solutions to IAB problems proposed initially focused on the summerincrease in lateral earth pressures on abutments simply because this problem was identifiedearlier. A purely structural approach is to shorten the height of each abutment considerably asshown conceptually in Figure 2.3(b). The abutments in this configuration can still be supportedon either shallow or deep foundations. Although the lateral earth pressures acting on theabutments will still increase every summer, the total resultant force and flexural stresses that theabutment must be designed for will be considerably less because the effective span length (i.e.the abutment height) is markedly reduced. As an observation, it would appear that the SIAB
Figure 2.6. Settlement and Void Development Adjacent to IAB Abutments
area of settlement andvoid development
new ground surfacedue to long-term
abutment movement
long-term position of abutment

Integral-Abutment Bridges: Problems and Innovative Solutions Using EPS Geofoam and Other GeosyntheticsManhattan College Research Report No. CE/GE-00-2
14
design shown in Figure 2.4 is a variation of this concept as only the ends of the bridge deckbearing against the ground are subjected to higher summer lateral earth pressures.
A more-geotechnical solution to dealing with the lateral earth pressure issue is to leave the full-height abutment as shown in Figure 2.3(a) but take preemptive measures so that the abutmentdoes not have to be designed for lateral earth pressures in excess of those for which a bridgeabutment is normally designed. The basic concept employed to achieve this is using what theauthor calls a compressible inclusion. In general, a compressible inclusion is any material placedin the ground (in any application, not just with IABs) that is significantly more compressible thanthe materials adjacent to it. Thus under a given magnitude of stress, the compressible inclusionwill always deform (typically the mode is one-dimensional compression) much more than theadjacent materials. This sacrificial deformation will generally result in an overall localizedreduction in stresses due to any one of several geotechnical mechanisms depending on theparticular application (Horvath 1995b, 1996, 1998a).
The concept of a compressible inclusion in geotechnical applications in general is not new. Ithas been used at least since early in the 20th century with pipes and culverts (referred tocollectively as underground conduits). In the original application of this concept, bales of hay orstraw were placed above a conduit as a compressible inclusion to compress and create verticalsoil arching that results in lower vertical stresses on the conduit (McCarthy 1988, Spangler andHandy 1982). In addition, cardboard void formers have been and are used in a variety ofapplications beneath structural (supported) slabs and behind earth retaining structures, especiallyin expansive-ground conditions. What is new in recent years with compressible inclusions is thesignificantly increased diversity of applications (Horvath 1995b, 1996, 1997, 1998a, 1998b) aswell as the use of materials that offer advantages over bales of hay/straw, cardboard and otherorganic materials in terms of predictability and controllability of behavior and durability in theground7. In particular, EPS geofoam has become the compressible inclusion material of choice inmany applications worldwide. However, other factors sometimes influence the decision as towhich material is used for a compressible inclusion. In particular, recycled tire fragments haveenjoyed favor at different times and geographic locations for political and legislative reasons aswell as their relatively low (often governmentally subsidized) cost. However, experience withtire fragments as a geotechnical fill material in general indicates that they can be variable incomposition; variable and unpredictable in their behavior; and environmentally problematic.
The specific manner in which a compressible inclusion is applied to IABs is shownconceptually in Figure 2.7. This is an extension of what the author terms the Reduced EarthPressure (REP) Wall concept for reducing lateral earth pressures due to gravity and live loadingon any type of rigid, non-yielding (non-moving) earth retaining structure (Horvath 1990, 1991a,1991b, 1995b). Depending on the specific material used and other design requirements, thethickness of the compressible inclusion in a direction perpendicular to the back of the abutmentcan be quite variable, ranging from tens of millimetres (a few inches) to hundreds of millimetres(a foot or more).
The most extensive and comprehensive formal research to date into the use of compressibleinclusions with IABs to reduce the summer increase in lateral earth pressures has been performedin the U.K. (Carder and Card 1997). In the U.S.A., most of the work to date has been morematerial-specific and focused on using recycled tire fragments (Humphrey et al. 1998, Reid et al.1998b).
7 Any organic material will, with time and the moisture that exists naturally in the ground, decomposeanaerobically. Some of the natural byproducts of anaerobic organic decomposition such as methane gas arepotentially hazardous because of their inherent toxic and explosive nature.

15
Integral-Abutment Bridges: Problems and Innovative Solutions Using EPS Geofoam and Other GeosyntheticsManhattan College Research Report No. CE/GE-00-2
Research to date indicates that an appropriate compressible inclusion can be effective inreducing the summer increase in lateral earth pressure on IAB abutments to acceptable levels butis ineffective in controlling settlement behind the abutment. This is because the highlycompressible nature of a compressible inclusion that is so desirable under summer expansion ofthe bridge superstructure becomes a detriment when winter contraction of the superstructureoccurs. As the superstructure contracts and pulls each abutment away from the retained soil, thecompressible inclusion is unable to restrain the soil from slumping outward (toward theabutment) and downward which results in surface settlement behind the abutment. This has beenobserved for an actual IAB where a compressible inclusion consisting of recycled tire fragmentswas used with an approach slab (Reid et al. 1998b). It has also been observed in large-scale 1-gphysical model testing where a compressible inclusion composed of resilient block-molded EPSgeofoam was used with a coarse-grain backfill (Reeves and Filz 2000). It is of relevance to notethat the presence of an inherently highly compressible inclusion may even exacerbate thesettlement problem behind IABs even as it solves the summer lateral earth pressure problem.
2.2.2.5 Potential Solutions: Future. Although the use of a compressible inclusion is ananswer to part of the overall IAB problems and thus a step in the right direction, a completesolution to all IAB problems needs to address both the lateral earth pressure and settlement issuessimultaneously. To develop a concept to achieve this, one needs to revisit the way a conventionaljointed bridge is designed as discussed in Section 2.2.1.1. In a conventional bridge, a relativelymassive, rigid and non-yielding abutment keeps the retained soil stable year 'round while thebridge superstructure is allowed to move relatively freely with temperature. Effectively, theabutment is part of the ground, not the bridge. The expansion joint/bearing detail provides for asmooth, deformable transition between the two components (superstructure and abutment/soil).
What changes, of course, with an IAB is that the abutment is now inherently a part of thebridge superstructure and not the ground. Thus it is clear that with an IAB:
• the retained soil must be kept stable year 'round while the structurally integral bridgesuperstructure/abutment is allowed to move and
Figure 2.7. Compressible Inclusion Application with Integral-Abutment Bridges
��������������������������������������������������������������� compressible
inclusion

Integral-Abutment Bridges: Problems and Innovative Solutions Using EPS Geofoam and Other GeosyntheticsManhattan College Research Report No. CE/GE-00-2
16
• there must be some design detail between the retained soil and superstructure/abutment toaccommodate the relative movement between the two components. This detail mustconceptually replace the expansion joint/bearing detail of a conventional bridge.
There are possibly several different design concepts that might be used to achieve these goals.Only two are considered in this study. The first design alternative is shown in Figure 2.8(a). Themass of retained soil can be kept stable by using geosynthetic tensile reinforcement (geogrid,geotextile or metallic elements) and building a mechanically stabilized earth (MSE) mass withinthe soil. In essence, the MSE mass becomes its own wall (called a mechanically stabilized earthwall, MSEW) although no facing panel would be used in this application as would be necessaryin conventional MSEW construction. If polymeric reinforcements were used with IABs (aswould be likely), one would just use a wrapped face.
As shown by Monley and Wu (1993), the MSE concept can be very effective in an applicationsimilar to that shown in Figure 2.8(a). To accommodate the movement between an IAB abutmentand adjacent MSE mass, some have suggested and used a physical gap of the order of 100 mm (4in) or more (Edgar et al. 1989, Reid et al. 1998a). Although such gaps appear to be effective intheir performance, at least in the short term (Reid et al. 1998a), they can be difficult to constructreliably and repeatedly (Edgar et al. 1989). This suggests that using a gap is not practicable inroutine practice from a constructability perspective.
Actually, the more-serious problem with leaving a gap is that there is no guarantee that it willnot become filled with soil or other material washed into it by infiltrating precipitation with time(the gap will serve as a de facto drainage layer behind the abutment), especially considering thelong (100-plus year) design life of bridges. Therefore, the author believes that a compressibleinclusion should always be used to provide the necessary joint filler between an IAB abutmentand adjacent MSE mass. This is an extension of what the author terms the Zero Earth Pressure(ZEP) Wall concept for virtually eliminating lateral earth pressures due to gravity and liveloading on any type of rigid, non-yielding earth retaining structure (Horvath 1990, 1991a, 1991b,
Figure 2.8. IAB Design Alternatives to Simultaneously ReduceLateral Earth Pressures on and Control Settlement Adjacent to Abutments
��������������������������������������������������������
compressibleinclusion
(a)
(b)
geosynthetictensile
reinforcement
EPS-blockgeofoam
θ
����������������������������������������������������������������������������������������������������������������������������������������������������������������������������������������������������������������������������������������������������������������������������������������������������������������������������������������

17
Integral-Abutment Bridges: Problems and Innovative Solutions Using EPS Geofoam and Other GeosyntheticsManhattan College Research Report No. CE/GE-00-2
1995b). Furthermore, the author believes that only a geofoam compressible inclusion (most likelycomposed of resilient block-molded EPS) offers the necessary reliability, predictability and easeof use for this application. A geofoam compressible inclusion can also be designed to bemultifunctional and cost effectively provide the necessary drainage behind the abutment as wellas year 'round thermal insulation of the MSE mass. The detrimental effect of high summertemperatures on the creep of polymeric geosynthetic tensile reinforcement such as geogrids andgeotextiles used as part of MSEW is perhaps not fully appreciated and considered in design(Murray and Farrar 1988, Segrestin and Jailloux 1988). During the winter, the geofoamcompressible inclusion would prevent seasonal freezing of both the abutment drainage systemand the retained soil.
The second design alternative is shown in Figure 2.8(b). A wedge-shaped mass of EPS-blockgeofoam can be used in a completely different function (role), that of lightweight fill. In thiscase, the geofoam mass is inherently self stable and creates what is called a geofoam wall.Therefore, as the abutment is pulled away from the geofoam by the contracting bridgesuperstructure in the winter no settlement behind the abutment would occur even though a gapbetween the back of the abutment and face of the geofoam mass would likely develop. Thisalternative is particularly attractive for sites underlain by soft, compressible soils. Theextraordinarily low density of the EPS blocks (only about 1% of the density of soil) wouldminimize settlements overall as well as significantly reduce loads on the abutments and theirfoundations, both directly and indirectly (e.g. the potential for lateral squeeze within the softunderlying soil, which can buckle a pile-supported abutment, would be greatly reduced).
Note that the EPS geofoam used in this case would not be the same as that used as thecompressible inclusion in Figure 2.8(a). The EPS geofoam in Figure 2.8(b) would have to besignificantly stiffer to be able to support the vertical stresses imposed on it without excessivedeformation. This highlights the fact that geofoam in general, and EPS geofoam in particular, canbe used for both "large strain" and "small strain" applications depending on the geofoam functionutilized in a given application (compressible inclusion and lightweight fill in this case). This alsohighlights the fact that there is no "universal" geofoam material or product. The appropriatematerial and product must be engineered and used in a given application.
The primary design issue with this second alternative of using EPS-block geofoam as alightweight fill is what angle θ (see Figure 2.8(b)) is desirable for the assumed planar interface8
between the geofoam wedge and soil. Theoretically, if θ equals the Mohr-Coulomb strengthparameter φ ("angle of internal friction")9 of the soil then the soil would exert no earth pressureon the geofoam mass and, therefore, no lateral earth pressure would be transmitted through thegeofoam mass to the abutment. An angle θ greater than φ would require a smaller volume ofgeofoam but, theoretically, result in some earth pressure being applied to the geofoam from thesoil and transmitted through the geofoam and onto the back of the abutment. Regardless of thevalue of θ used, a design question with the second design alternative shown in Figure 2.8(b) iswhether or not a gap is necessary between the face of the geofoam mass and the back of theabutment (or possibly even a compressible inclusion used between the two as with the firstdesign alternative using MSE shown in Figure 2.8(a)) to accommodate the movement betweenthe abutment and geofoam.
8 In reality, this interface is not planar but stepped because of the shape of the EPS blocks. However, thisinterface is generally assumed, with sufficient accuracy for practice, to be planar for analytical purposes.9 In this particular application, the angle φ is often referred to, especially in older literature, as the angle ofrepose of the soil.

Integral-Abutment Bridges: Problems and Innovative Solutions Using EPS Geofoam and Other GeosyntheticsManhattan College Research Report No. CE/GE-00-2
18
This page intentionally left blank.

19
Integral-Abutment Bridges: Problems and Innovative Solutions Using EPS Geofoam and Other GeosyntheticsManhattan College Research Report No. CE/GE-00-2
Section 3Details and Results of Study
3.1 INTRODUCTION
This section first describes the details of the analyses performed for the study covered by thisreport. The results of the analyses are then presented and the factual observations deduced fromthe results are discussed. The overall conclusions drawn from this study are presented separatelyin Section 4.
3.2 DETAILS OF STUDY
3.2.1 Introduction and Overview
This study was limited to theoretical work, primarily using numerical analysis of an arbitrarybut realistic problem of an IAB with a single span. This hypothetical bridge was subjected toseveral cycles of thermal change to induce movement and loads within the bridge superstructureand abutment. To focus on the effect of the thermal loading, the dead load of the bridgesuperstructure was ignored (the mass of the abutment was modeled however) and no live loadsfrom vehicles were included. In addition, other phenomena that might induce load in the bridge,such as long-term shrinkage of PCC members, were also omitted from consideration. The overalldetails of the assumed problem are discussed in detail in Section 3.2.2.
The primary focus of this study was evaluating the efficacy of using different materials orcombinations of materials as backfill/fill behind the abutment. To achieve this goal, 12 differentbackfill/fill designs were evaluated. A detailed discussion of the different designs is presented inSection 3.2.3.
The primary analytical tool utilized in this study was a continuum model of the key structuraland geotechnical components of the problem. The forces and displacements within thiscontinuum, and the estimated stresses and strains they produced, were calculated numericallyusing the finite element method (FEM) at various stages of simulated construction andsubsequent thermal loading. The details of the FEM mesh and input parameters used arediscussed in detail in Section 3.2.4.
Where possible and appropriate, hand-calculated theoretical results as well as the use ofpreviously published solutions and simplified analytical methods were also compared against theFEM results. The specific supplemental analyses performed are discussed on a case-by-case basistogether with the presentation and discussion of results in Section 3.3.
3.2.2 Overall Problem Details
3.2.2.1 Geometry. Figure 3.1 shows the assumed geometry of the overall structure. Values ofthe parameters in Equation 2.1, which defines the theoretical unconstrained movement of thebridge superstructure, were chosen so that the total change in length of the 50 m (164 ft) longsuperstructure under the full 60°C (108°F) temperature range assumed in this problem was 36mm (1.4 in) which was judged to be realistic. Assuming symmetric movement, this means thatthe theoretical maximum range of unrestrained displacement at each end of the superstructure

Integral-Abutment Bridges: Problems and Innovative Solutions Using EPS Geofoam and Other GeosyntheticsManhattan College Research Report No. CE/GE-00-2
20
and top of the adjacent abutment was 18 mm (0.7 in), or 9 mm (0.35 in) in either direction fromthe as-built neutral temperature position.
It is relevant to note that although the problem used in this study was hypothetical, broadguidance for the assumed overall geometry and bridge superstructure parameters was obtainedfrom an actual IAB, The Forks Bridge in the State of Maine U.S.A., that was the focus of adetailed geotechnical study by Sandford and Elgaaly (1993). That bridge had a span of 50.3 m(165 ft) and abutment height of approximately 7 m (23 ft). The primary structural components(both superstructure and abutment) were steel so that, from a structural perspective, the bridgelooked like a classical rigid steel frame with tapered members. However, the columns (legs) ofthe frame, which served as the primary structural elements of the abutment, were encased in PCCso gave the appearance of a traditional reinforced PCC abutment.
The ground underlying each abutment in the problem assumed for this study was taken to benon-yielding (rigid) for vertical displacement meaning that the abutments could not movedownward, i.e. settle. It also meant that the soil behind and in front of each abutment could notsettle although vertical compression within the soil masses could occur. However, the horizontalinterface between the bottom of each abutment and underlying rigid support layer was assumedto be frictional in nature so that horizontal displacement could occur. The same was true of theinterface between the soil on either side of the abutment and the underlying rigid base (mostgeotechnical FEM analyses assume either a perfectly fixed or free horizontal bottom boundarycondition).
The no-settlement boundary assumption may appear to be somewhat restrictive. However, thedesire here was to remove any influence of foundation behavior from the problem as this wouldcomplicate interpretation of the results. The desire in this study was to focus on interactionbetween abutments and adjacent ground. Furthermore, the no-settlement bottom boundarycondition is not totally unrealistic as it could occur in practice for an IAB with abutmentsfounded on rock.
Figure 3.1. Overall Geometry and Thermal Assumptions of Problem Studied
50 m (164 ft) 6 m(19.7 ft)
1 m (3.3 ft)
base non-yielding for vertical displacement butfrictional for horizontal displacement
Thermal assumptions:• neutral temperature at time of construction = +10C (+50F)• annual temperature variation from neutral temperature = +/- 30C (54F)
600 mm (2 ft)
1 m (3.3 ft)

21
Integral-Abutment Bridges: Problems and Innovative Solutions Using EPS Geofoam and Other GeosyntheticsManhattan College Research Report No. CE/GE-00-2
3.2.2.2 Thermal Environment. The assumptions regarding the thermal environment of thebridge were:
• The bridge was constructed at a neutral (force- and displacement-free) temperature of +10°C(+50°F).
• The annual air temperature range was 60°C (108°F), between a summer maximum of +40°C(+104°F) and winter minimum of -20°C (-4°F). This was judged to be representative ofconditions that might occur in many temperate climates during the 100-plus year design lifeof an IAB.
• The temperature of the bridge superstructure is at all times the same as the air temperature.
• Four complete cycles of temperature variation were applied, starting at the neutraltemperature and initially reducing to the first winter minimum. The number of cycles wasarbitrary but dictated largely by limitations of the computer software used.
3.2.3 Abutment Backfill/Fill Variables Considered
The primary goal of this study was to evaluate the effect of varying the material used tobackfill/fill behind the abutment of an IAB. The analyses performed were separated into threebroad cases as follows:
• Case 1. This case focused on three subcases that did not incorporate the use geofoam in anyway. A soil backfill/fill was assumed in all subcases with no other material between the backof the abutment and retained soil. The first subcase (Case 1a) was the basic, conventionalsolution of an unreinforced soil as shown conceptually in Figure 2.3(a). This subcaseprovided baseline results against which all other results obtained for this study werecompared and evaluated. Thus Case 1a served as the reference for judging the benefit(s), ifany, of using geosynthetics with IABs. Also included in Case 1 were two subcases (Case 1biand Case 1bii) in which horizontal layers of geosynthetic tensile reinforcement wereembedded within the retained soil. The two subcases differed solely in the type ofreinforcement, polymeric (Case 1bi) and metallic (Case 1bii), simulated to make a first-orderassessment of the effect of reinforcement stiffness on calculated results. Althoughgeosynthetic tensile reinforcement would not normally be used alone behind a relativelyrigid, non-yielding earth retaining structure such as a bridge abutment, these two subcaseswere included for the sake of completeness in the combination of problem variablesconsidered.
• Case 2. This case focused on the strategy for solving IAB problems that is based primarily onusing geofoam as a compressible inclusion between the abutment and retained soil. In eachof the five separate analyses (subcases) performed for Case 2 the geofoam was assumed to beresilient10 EPS-block geofoam. This is currently the most-efficient geofoam material to usewhenever maximum compressibility (technically a minimum Young's modulus) is desiredunder relatively low stress (< ~100 kPa (2 kips/ft2)) conditions. Figure 3.2 shows acomparison between normal and resilient block-molded EPS under strain-controlled,
10 Resilient EPS is the term currently preferred for what was formerly called elasticized or elastified EPS asit more accurately describes the behavior of the material.

Integral-Abutment Bridges: Problems and Innovative Solutions Using EPS Geofoam and Other GeosyntheticsManhattan College Research Report No. CE/GE-00-2
22
unconfined, axial compression11. The first group (Case 2a) of three analyses assumed the useof a compressible inclusion alone as shown in Figure 2.7. Collectively, the Case 2a analyses(referred to as cases 2ai, 2aii and 2aiii respectively) represent the solution to the IABproblem of increased summer lateral earth pressures that has already been proposed and usedto date as discussed in Section 2.2.2.4. The three Case 2a subcases differed only in thethickness of geofoam assumed to evaluate the sensitivity of results to the inclusion thickness.Also included in Case 2 was a group (Case 2b) of two subcases (2bi and 2bii) where theretained soil was assumed to be reinforced as shown conceptually in Figure 2.8(a). Thiscombination of a geofoam compressible inclusion plus MSE was one of the improved IABdesign concepts suggested by the author in Section 2.2.2.5. Note that only one compressibleinclusion thickness was considered in Case 2b to eliminate this parameter as a variable. Thetwo Case 2b subcases differed only in the type of geosynthetic tensile reinforcement that wasassumed within the retained soil. Polymeric (Case 2bi) and metallic (Case 2bii)reinforcement were considered separately to evaluate the effect of reinforcement stiffness.
11 A discussion of the process for manufacturing resilient EPS and its effect on stress-strain properties canbe found in Horvath (1995b) with summaries in Horvath (1997, 1998b).
Figure 3.2. Normal versus Resilient Block-Molded EPS(density = 12 kg/m3 (0.75 lb/ft3))
[data courtesy of GeoTech Systems Corporation]
Axial compressive strain (%)
0 10 20 30 40 50 60 70
Axi
al c
om
pre
ssiv
e s
tres
s (k
Pa
)
0
50
100
150
200
250
300
normal EPS
resilient EPS
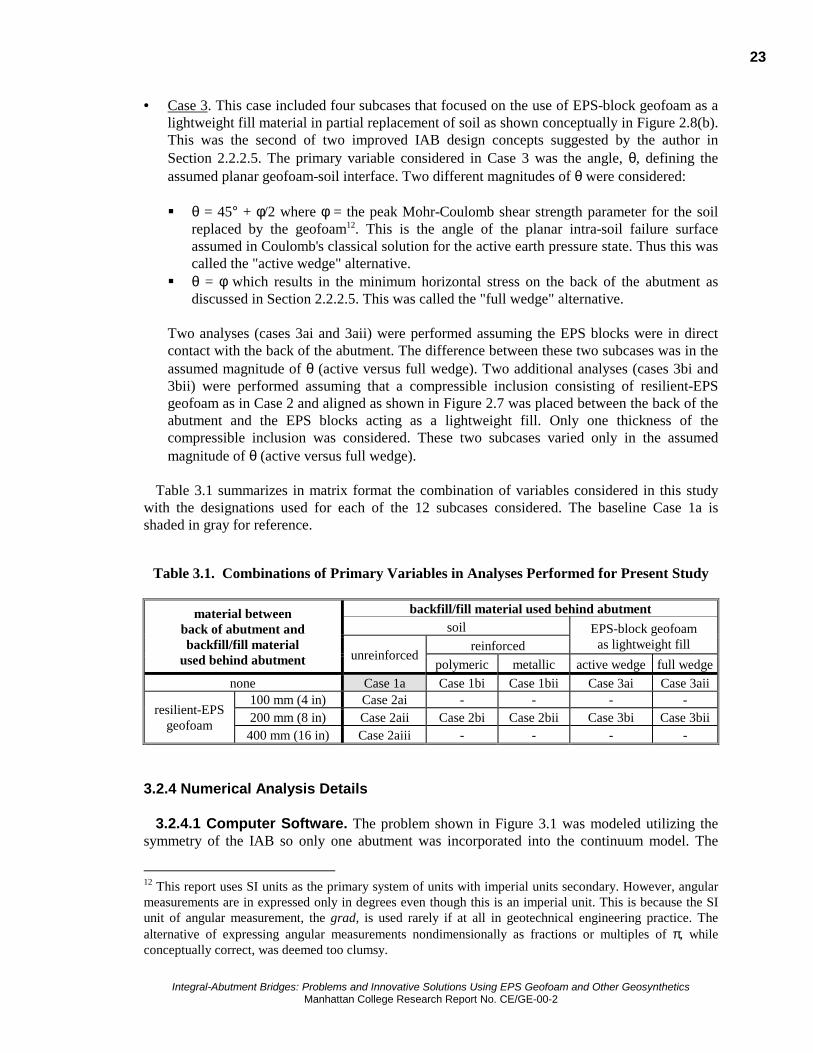
23
Integral-Abutment Bridges: Problems and Innovative Solutions Using EPS Geofoam and Other GeosyntheticsManhattan College Research Report No. CE/GE-00-2
• Case 3. This case included four subcases that focused on the use of EPS-block geofoam as alightweight fill material in partial replacement of soil as shown conceptually in Figure 2.8(b).This was the second of two improved IAB design concepts suggested by the author inSection 2.2.2.5. The primary variable considered in Case 3 was the angle, θ, defining theassumed planar geofoam-soil interface. Two different magnitudes of θ were considered:
! θ = 45° + φ/2 where φ = the peak Mohr-Coulomb shear strength parameter for the soilreplaced by the geofoam12. This is the angle of the planar intra-soil failure surfaceassumed in Coulomb's classical solution for the active earth pressure state. Thus this wascalled the "active wedge" alternative.
! θ = φ which results in the minimum horizontal stress on the back of the abutment asdiscussed in Section 2.2.2.5. This was called the "full wedge" alternative.
Two analyses (cases 3ai and 3aii) were performed assuming the EPS blocks were in directcontact with the back of the abutment. The difference between these two subcases was in theassumed magnitude of θ (active versus full wedge). Two additional analyses (cases 3bi and3bii) were performed assuming that a compressible inclusion consisting of resilient-EPSgeofoam as in Case 2 and aligned as shown in Figure 2.7 was placed between the back of theabutment and the EPS blocks acting as a lightweight fill. Only one thickness of thecompressible inclusion was considered. These two subcases varied only in the assumedmagnitude of θ (active versus full wedge).
Table 3.1 summarizes in matrix format the combination of variables considered in this studywith the designations used for each of the 12 subcases considered. The baseline Case 1a isshaded in gray for reference.
Table 3.1. Combinations of Primary Variables in Analyses Performed for Present Study
backfill/fill material used behind abutmentsoil
reinforcedEPS-block geofoam
as lightweight fill
material betweenback of abutment andbackfill/fill material
used behind abutment unreinforcedpolymeric metallic active wedge full wedge
none Case 1a Case 1bi Case 1bii Case 3ai Case 3aii100 mm (4 in) Case 2ai - - - -200 mm (8 in) Case 2aii Case 2bi Case 2bii Case 3bi Case 3bii
resilient-EPSgeofoam
400 mm (16 in) Case 2aiii - - - -
3.2.4 Numerical Analysis Details
3.2.4.1 Computer Software. The problem shown in Figure 3.1 was modeled utilizing thesymmetry of the IAB so only one abutment was incorporated into the continuum model. The
12 This report uses SI units as the primary system of units with imperial units secondary. However, angularmeasurements are in expressed only in degrees even though this is an imperial unit. This is because the SIunit of angular measurement, the grad, is used rarely if at all in geotechnical engineering practice. Thealternative of expressing angular measurements nondimensionally as fractions or multiples of π, whileconceptually correct, was deemed too clumsy.

Integral-Abutment Bridges: Problems and Innovative Solutions Using EPS Geofoam and Other GeosyntheticsManhattan College Research Report No. CE/GE-00-2
24
ground on either side of the abutment was modeled for a finite horizontal distance consideringrules of thumb established by others from more than 30 years of performing similar FEManalyses of earth retaining structures.
Due to the limitations of the computer software available for this study, only a two-dimensional, plane-strain model could be analyzed. The resulting model continuum of abutmentplus ground was then discretized for numerical solution using the FEM. The basic FEM meshused for all parts of this study is shown in Figure 3.3. Note that the vertical Y axis shown in thisfigure was required by the software used for this study for internal program purposes (inputpreparation, etc.). A new vertical z axis, also shown in Figure 3.3 and defined as having z = 0 atthe top of the abutment (Y = 6 metres), was actually used for all plots in this study.
The FEM software used for this study is named SSTIPNH . It is the author's proprietarymicrocomputer version of the mainframe program SSTIPN that was developed and subsequentlymodified over a period of many years first at the University of California at Berkeley and later atThe Virginia Polytechnic Institute and State University at Blacksburg under the overall directionof Prof. J. Michael Duncan. Although SSTIPNH does not have the graphical interfaces typical ofcurrent commercially available software, the analytical logic incorporated into SSTIPNH is stillrepresentative of the state of practice in such software.
3.2.4.2 Solid Material Model Parameters. Two-dimensional (2-D) "solid" finite elementswere used to model the materials comprising the abutment, soil and geofoam (if any). The onlyconstitutive model for solid material elements in SSTIPNH is the well known non-linearhyperbolic model although by appropriate choice of the model parameters either an elasto-plasticor linear-elastic material can also be simulated with this model.
spring elements simulating axial stiffness of bridge superstructure under thermal loading
Figure 3.3. Finite Element Mesh Used for Present Study
X axis0 5 10 15 20 25 30
Y a
xis
0
1
2
3
4
5
6
Note: Both axes scaled in metres (1 m = 0.305 ft).
abutment
boundary fixed against X-displacement only
boundary fixed against X-displacement only
1-D interface elements across bottom boundary
z axis

25
Integral-Abutment Bridges: Problems and Innovative Solutions Using EPS Geofoam and Other GeosyntheticsManhattan College Research Report No. CE/GE-00-2
It should be noted at the outset that the hyperbolic model has some significant shortcomingswith particular regard to modeling the way soil is loaded in the IAB problem. Specifically, cyclicloads are known to be an important aspect of soil behavior in IAB problems. An importantrheological aspect of cyclic soil loading is the accumulation of plastic (non-recoverable) strainsdue to the inherent hysteretic behavior of soil (England 1994, England and Dunstan 1994,England et al. 1995). The hyperbolic model does not do a good job of replicating hystereticbehavior. Therefore, from the beginning of this study it was known that certain aspects of theanticipated soil behavior would not be well modeled. However, it was felt that this would notdetract from the overall qualitative and quantitative correctness of the results of this study.
Only one type of soil was used for both sides of the abutment throughout the entire study. Anactual soil, one of those included in a study reported by Boscardin et al. (1990), was chosen. Thesoil was classified as SW and A-1-a(0) in the Unified Soil Classification System (USCS) andAmerican Association of State Highway and Transportation Officials (AASHTO) systemrespectively. From a practical perspective, this is about as good a soil as would be used as ageneral backfill and fill in actual highway earthwork. Parameters for the soil in a fairly loosecondition (85% relative compaction using the "Standard Proctor" compaction energy as thereference standard) were assumed. The peak value of the Mohr-Coulomb friction angle, φ, wasused and no correction in magnitude (typically a 10% increase) was made for the plane-strainconditions that existed in this problem simulated in this study.
The PCC comprising the abutment was assumed to have a compressive strength, 'cf , of 27600
kPa (4000 lb/in2). Linear-elastic behavior was assumed with a Young's modulus (approximately25 GN/m2 (3600 kips/in2)) that was consistent with empirical correlation to compressive strength.
The geofoam parameters varied depending on the way (function) in which the geofoam wasused, but in all cases the geofoam material was assumed to be EPS manufactured by the block-molding process. The resilient EPS used as a compressible inclusion for the Case 2 and Case 3banalyses was assumed to be made from EPS with an initial (molded) density13 of 12 kg/m3 (0.75lb/ft3) that increased 15% in magnitude to 13.8 kg/m3 (0.86 lb/ft3) due to the post-moldingresiliency (elasticization) process. Linear-elastic stress-strain behavior was assumed for theresilient EPS with a Young's modulus of 250 kN/m2 (5200 lb/ft2). This corresponds to the defacto standard rapid loading conditions used for EPS geofoam testing and normal compressivestresses up to approximately 75 kPa (1500 lb/ft2; see Figure 3-2) which was not expected to beexceeded in the analyses performed for this study. This modulus is conservative for thisapplication as creep of resilient-EPS geofoam of the density assumed in this study is relativelysignificant throughout all stress ranges (see Figure 3.4). As a result, the Young's modulus of thismaterial in an actual application would decrease significantly with time, of the order of 50% afterone year. The effect of creep on the behavior of a geofoam compressible inclusion adjacent to anearth retaining structure was explored by Murphy (1997).
EPS-block geofoam used as lightweight fill was assumed to have a density of 20 kg/m3 (1.25lb/ft3). It was assumed that normal stresses applied to and within the geofoam mass would bewithin the elastic-limit stress of the geofoam (approximately 50 kPa (1000 lb/ft2) in this case) forall analyses so creep would be expected to be negligible (Horvath 1995b). Therefore, linear-elastic behavior was assumed for the geofoam with a Young's modulus of 6000 kN/m2 (125kips/ft2) that was equal to the initial tangent Young's modulus of EPS-block geofoam of thisdensity based on empirical correlations given by Horvath (1995b).
13 Consistent with practice worldwide, in SI units geofoam density, with units of kilograms per cubic metre,as opposed to unit weight in Newtons per cubic metre is normally stated. However, in imperial unitsgeofoam unit weight, with units of pounds per cubic foot, is given as the equivalent even though density andunit weight are not strictly equivalent (although they are, of course, linearly related).

Integral-Abutment Bridges: Problems and Innovative Solutions Using EPS Geofoam and Other GeosyntheticsManhattan College Research Report No. CE/GE-00-2
26
Table 3.2 summarizes the specific values of the hyperbolic constitutive model parameters usedin this study for solid materials. The parameter notation for this constitutive model is consistentwith that appearing in the literature for many years. However, the relevant equations for thismodel are given in Section 6.2.1 for ease of reference and the sake of completeness.
Table 3.2. Hyperbolic Constitutive Model Parameters for 2-D (Solid) Element Materials
parametersmaterial γt
(N/m3)K n Rf Kb m
c(kN/m2)
φ1
(°)∆φ(°)
Ko
soil 19800 450 0.35 0.8 110 0.1 0 38 0 1.0PCC 23500 250000 0 0 119000 0 13800 0 0 0.18
resilient 140 2.5 0 0 0.83 0 100 0 0 0geofoam
normal 200 59 0 0 26 0 60 0 0 0.13
One comment is made concerning the coefficient of earth pressure at rest, Ko, for soil given inTable 3.2. An arbitrary value of this parameter (= 1.0), somewhat higher than the normallyconsolidated value (= 0.38), was chosen to reflect the lateral stresses locked into a layer of soilimmediately after simulated placement with compaction equipment. While this simpleapproximation does not begin to reflect the complexity of soil behavior during the compaction
Figure 3.4. Isochronous Stress-Strain Curves for Resilient Block-Molded EPS(initial molded density = 12 kg/m3 (0.75 lb/ft3))
[data courtesy of GeoTech Systems Corporation]
Axial compressive strain (%)
0 10 20 30 40 50 60
Axi
al c
om
pre
ssiv
e s
tre
ss (
kPa
)
0
20
40
60
80
100
10hours
100hours
1000hours
10000hours
rapid loading (from Figure 3.2)

27
Integral-Abutment Bridges: Problems and Innovative Solutions Using EPS Geofoam and Other GeosyntheticsManhattan College Research Report No. CE/GE-00-2
process (see, for example, Duncan et al. (1991) for a state-of-art discussion of this topic), it wasused to at least approximate, albeit in a crude way, the temporarily higher lateral stresses thatresult from the compaction process.
3.2.4.3 Interface Model Parameters. Interfaces between dissimilar materials can bemodeled in SSTIPNH using the familiar one-dimensional (1-D), zero-thickness elements that canhave hyperbolic, elasto-plastic or linear-elastic stress-strain behavior in shear. The particularinterface model incorporated into SSTIPNH allowed for shear stiffnesses that differ betweeninitial loading (Ksi) and unloading/reloading (Ksu).
To minimize the size and complexity of the FEM mesh, not all interfaces between dissimilarmaterials were modeled using interface elements. In general, interface elements were employedonly where it was judged beforehand that it was important to accommodate inter-materialslippage. This included both sides of the abutment and the horizontal surface across the entirebottom of the mesh where soil-on-soil (except for poured-in-place-PCC-on-soil beneath theabutment) contact was assumed (see Figure 3.3). In addition, whenever a compressible inclusionwas modeled (all parts of Case 2 plus cases 3bi and 3bii) the vertical interface between thecompressible inclusion and retained material (soil in Case 2 and EPS-block geofoam lightweightfill in Case 3b) 1-D interface elements were employed as well.
Table 3.3 summarizes the specific values of the interface element model parameters used inthis study. The values used were based on an assessment of realistic δ/φ ratios for the materialsinvolved as well as an assessment of the magnitude of displacement required to fully mobilizethe peak shear resistance under average values of normal stresses encountered in this problem.Relevant equations for the interface constitutive model are given in Section 6.2.2 for ease ofreference and the sake of completeness.
Table 3.3. Constitutive Model Parameters for 1-D (Interface) Elements
parametersmaterials in contact
Ks,i Ks,u n Rf Knca
(kN/m2)δ1
(°)∆δ(°)
soil-soil (also soil-geofoam) 1000 2000 0.5 0.9 100000000 0 38 0soil-poured PCC 3000 6000 0.5 0.9 100000000 0 34 0soil-formed PCC 800 1600 0.5 0.9 100000000 0 23 0
formed PCC-geofoam 300 600 1.0 1.0 100000000 0 18 0geofoam-geofoam 300 600 1.0 1.0 100000000 0 30 0
3.2.4.4 Reinforcement Modeling. The way in which the geosynthetic tensile reinforcementwas modeled in this study requires some discussion. The traditional method of incorporatingreinforcement into a FEM analysis is to model each layer of reinforcement explicitly, typicallyusing a chain of one-dimensional spring elements to simulate the reinforcement product (thespring stiffness represents the tensile stiffness of the reinforcement) with one-dimensionalinterface elements above and below the spring elements to simulate the shearing between thereinforcement and the soil on either side of it. Such modeling can be realistic and successful(Horvath 1991a, 1991b) but tedious to work with. In particular, this modeling methodology isinflexible when it comes to making any changes in reinforcement geometry during the course ofa study as it requires substantive revisions of the FEM mesh and input file each time.

Integral-Abutment Bridges: Problems and Innovative Solutions Using EPS Geofoam and Other GeosyntheticsManhattan College Research Report No. CE/GE-00-2
28
In analyses where it is necessary only to model the overall effect of reinforcement forstiffening a soil mass (as opposed to being able to replicate slippage or pullout of an individualreinforcement layer for example), a useful modeling technique was suggested and verified byEbeling et al. (1992). In their technique, the reinforced soil mass, shown conceptually in Figure3.5(a), is modeled as an unreinforced soil mass with a spring (linear and elastic in most practicalcases) connecting the soil elements at the horizontal limits of the reinforcement as shownconceptually in Figure 3.5(b). The stiffness of the spring is equal to ArEr/Lr, where Ar = totalcross-sectional area of the reinforcement, Er = Young's modulus of the reinforcement materialand Lr = overall length of the reinforced zone as shown in Figure 3.5. In actuality, several springsin parallel as opposed to one spring would be used to enhance the accuracy of this approximatetechnique, with the sum of the individual spring stiffnesses equaling the desired overall stiffness.
The utility of this modeling technique is that it is relatively easy to add, delete or modify thereinforcement spring elements so that various layouts and stiffnesses of reinforcement can bestudied easily. Most FEM software has a category of elements that can be used for this purpose.In the program SOILSTRUCT14 used by Ebeling et al. (1992), such an element is called anoverlay element. In the SSTIPNH program used for this study, it is called a nodal link. However,care must be taken in problems such as considered in this study when there are changes in thedirection of movement of reinforced soil masses. That is because geosynthetic reinforcements arepresumed to have zero stiffness when loaded in compression. Fortunately, SSTIPNH has aprovision wherein nodal links can be "turned off" at any given step in a simulation although thisdid not produce wholly satisfactory results as discussed in Section 3.3.
The two types of reinforcements considered in the various subcases of this study were broadlycategorized as polymeric (intended to represent as a group primarily geogrids but high-strengthgeotextiles as well) and metallic (intended to represent as a group steel strips and relatedproducts). It was assumed that one layer of reinforcement, where used, would be placed witheach soil layer (i.e. layer of 2-D elements in Figure 3.3) which would give a 500 mm (20 in)
14 This program has many attributes and capabilities in common with SSTIPNH that was used in this study.
Figure 3.5. Approximate FEM Modeling of Geosynthetic Tensile Reinforcement
(a)
soil massreinforcement layer(typical)
(b)
equivalentlinear-elastic spring
Lr
Lr
actual model

29
Integral-Abutment Bridges: Problems and Innovative Solutions Using EPS Geofoam and Other GeosyntheticsManhattan College Research Report No. CE/GE-00-2
vertical spacing between reinforcement layers. Referring to the FEM mesh in Figure 3.3, thelowest reinforcement layer was at a vertical (Y) axis coordinate of 0 and the uppermost was at Y= 5.5 m.
The assumed stiffness, ArEr/Lr, of each layer of reinforcement was 400 kN/m (27 kips/ft) forpolymeric reinforcement and 20000 kN/m (1400 kips/ft) for metallic reinforcement. It should bekept in mind that because of the plane-strain model used, each of these values (including theimperial-unit equivalents) is per the implied unit width (one metre) of the model and FEM mesh.
3.2.4.5 Bridge Superstructure Modeling. The bridge superstructure was modeled usingwhat are called bar elements in SSTIPNH. These are linear-elastic springs for analyticalpurposes. The superstructure was modeled using three bar elements that covered its assumed 1 m(3.3 ft) thickness as shown in Figure 3.3. Conceptually, the combined stiffnesses of these barelements represents the total longitudinal stiffness of the superstructure to a thermal-inducedlength change. From equations 2.1 and 2.2, it can be shown that the deck stiffness equals AsEs/Lo
where the parameters are as defined previously in Section 2.2.1.1. Here, Lo = 25 m (82 ft) whichis one half of the span length in the assumed problem geometry. Note that the actual areas, As, ofthe bar elements input were adjusted to reflect the fact that the bar elements in the FEM mesh(Figure 3.3) were only 5 m (16.4 ft) long. However, the overall stiffness AsEs/Lo was the same asthe actual problem which is all that was important.
3.2.4.6 Simulation of Construction and Thermal Load Application. Each of the 12analyses performed for this study as summarized in Table 3.1 began with no pre-existingelements in the mesh shown in Figure 3.3. Abutment construction was then simulated in 12 steps,including placement of the bridge superstructure as well. This was followed by backfilling/fillingon both sides of the abutment in 14 steps for a total of 26 construction steps. As noted in Section3.2.2.2, construction was assumed to occur at a neutral temperature of +10°C (+50°F).
After the construction simulation, thermal loading was simulated by applying a horizontalstress over the top 1 metre (3.3 feet) of the abutment where the bridge superstructure wasassumed to be connected to the abutment. The stress was applied in decrements or incrementsrepresenting temperature changes of 10°C (18°F). Thus an entire simulated annual temperaturecycle of 60°C (108°F) (from the neutral temperature of +10°C (+50°F); down to -20°C (-4°F);up to +40°C (+104°F); and back down to the neutral temperature) required 12 steps. This was notintended to explicitly reflect the number of months in a year. Rather, the number of cycles wasarrived at by happenstance as a result of dividing the total simulated temperature change of120°C (216°F) into relatively small increments of 10°C (18°F).
The magnitude of the thermal-induced horizontal stress applied in each thermal-load step wascalculated using Equation 2.2 and was 2400 kPa (50 kips/ft2). Note that at any given loadapplication step, the actual resultant force within the bridge superstructure is the sum of theapplied force (applied stress times 1 metre height) minus the total force in the bar elements usedto model the structure. Conceptually, then, the applied stress represents the potential for thermal-induced forces to develop in the bridge superstructure whereas the total stiffness of the barelements used to model the superstructure represents the ability of the superstructure to relievethermal forces by changing length.
For the reasons discussed in Section 3.2.4.4, care was taken to temporarily inactivate the nodallinks representing any soil reinforcements whenever the applied thermal load was such that ittended to push the abutment into the retained soil which would tend to induce compression in thereinforcements. Although this does not produce entirely correct results (not all levels ofreinforcement will necessarily shift from tension to compression at the same time) it was the bestapproximation that could be accommodated within the capabilities of the software used.

Integral-Abutment Bridges: Problems and Innovative Solutions Using EPS Geofoam and Other GeosyntheticsManhattan College Research Report No. CE/GE-00-2
30
3.3 RESULTS AND DISCUSSION
3.3.1 Plotting and Interpretation of Results
3.3.1.1 Introduction. Before proceeding with the presentation and evaluation of the resultsof the various numerical simulations performed for this study, it is useful to discuss variousdetails that are common to the numerous plots of lateral pressures15 acting on the abutment thatare contained in this report as well as interpretation of the results shown on these plots. Toillustrate these items, the basic template used to create these plots is shown in Figure 3.6.
3.3.1.2 Classical Earth Pressure Theory. The first item to discuss is the theoreticallateral earth pressures16 for various earth pressure states. These classical solutions, which are 15 Which may or may not be earth pressures depending on the material in contact with the abutment.16 In correct civil engineering terminology, the term pressure should only be used for a normal stress(normal force per unit area) exerted by a fluid (gas or liquid). In solid materials (or quasi-solids such assoil), a normal force per unit area should be called a stress. In addition, the term horizontal is more preciseand correct in civil engineering usage than lateral. However, the expression lateral earth pressure, not
Normalized lateral (earth) pressure, σh/patm
0.0 0.1 0.2 0.3 0.4 0.5
Nor
mal
ized
dep
th b
elow
top
of a
butm
ent,
z/H
0.0
0.1
0.2
0.3
0.4
0.5
0.6
0.7
0.8
0.9
1.0
Figure 3.6. Template for Lateral (Earth) Pressure Plots
at rest
active
passive

31
Integral-Abutment Bridges: Problems and Innovative Solutions Using EPS Geofoam and Other GeosyntheticsManhattan College Research Report No. CE/GE-00-2
easily obtained by manual calculation, are always useful reference conditions for any plot oflateral earth pressure. In particular, the following are shown in Figure 3.6:
• The normally consolidated (NC) at-rest state based on the well-known relationship
φ−= sin1oncK (3.1)
where Konc = the coefficient of lateral earth pressure at rest for the NC state. Equation 3.1resulted in Konc = 0.38 in this study.
• The horizontal component of earth pressure for the active state based on the "exact"solution17 given on Page 7.2-67 of Foundations and Earth Structures (1982) which resultedin a coefficient of active earth pressure, Ka, = 0.23 in this case.
• The horizontal component of earth pressure for the passive state based on the exact solution18
page 7.2-67 of Foundations and Earth Structures (1982) which resulted in a value of thecoefficient of passive earth pressure, Kp, = 9.9.
Note that in none of these cases was an empirical adjustment for compaction-induced stressesmade to the earth pressure diagrams shown in Figure 3.6 as suggested most recently by Duncanet al. (1991) and others before that.
3.3.1.3 Plot Axes. Next considered are the plot axes used. To enhance the generality of allplots (not just those for lateral pressures), for the vertical axis the depth variable, z, is normalizedby dividing it by the abutment height, H. For the horizontal axis, the lateral (earth) pressure, hσ ,
is normalized by dividing it by the atmospheric pressure, patm. Note that this does not imply thatatmospheric pressure per se influences lateral pressures. Atmospheric pressure is simply aconvenient stress parameter whose magnitude is well known or easily calculated in any system ofunits.
It is worth noting that lateral (earth) pressure plots are usually normalized by dividing hσ by
the product of the total soil unit weight, γt, and the "geotechnical" wall height19 (see, for example,
horizontal earth stress, has been used traditionally in geotechnical engineering. Although this reportadheres to this traditional colloquial terminology, the correct notation for normal stress, σ, is used, not theusual notation for pressure, p. Also, horizontal is used to indicate direction in all cases except when theterm lateral earth pressure is used.17 "Exact" in the sense that it was based on a curved intra-soil failure surface as opposed to the incorrectplanar surface assumed by Coulomb in his classical solution. As discussed by Tschebotarioff (1973), for themore-common case of positive relative soil-wall friction, as was assumed and verified by inspection ofcalculated results in this study, the difference in results between exact solutions (there are several) andCoulomb's solution is generally negligible in any practical context. That was confirmed here as thecalculated Coulomb value for Ka = 0.22.18 Exact theories for the passive state are also based on a curved intra-soil failure surface as opposed to theincorrect planar surface assumed by Coulomb. However, in the passive state Coulomb's theory is almostalways in error on the unconservative side and thus should never be used in practice.19 Geotechnical wall height is defined as the vertical distance from the base of a wall to the point where theretained soil contacts the back of a wall. This height, upon which lateral earth pressure theories andcalculations are based, may be less than the actual wall height in applications where some additional free-standing height (freeboard) must be provided for safety. However in this study the geotechnical and actualwall heights are the same as is typical for bridge abutments.

Integral-Abutment Bridges: Problems and Innovative Solutions Using EPS Geofoam and Other GeosyntheticsManhattan College Research Report No. CE/GE-00-2
32
Karpurapu and Bathurst (1992)), not atmospheric pressure as used in this study. However,because backfill/fill materials of different composition and widely varying unit weights wereconsidered in this study atmospheric pressure was used as the normalization parameter to preventany ambiguity or confusion.
3.3.1.4 Comparison of Results. The final issue to discuss is the methodology for theoverall interpretation and assessment of results. Because comparison of results between varioussubcases is a significant aspect of this study, a succinct and insightful methodology forcharacterizing results is of critical importance and deserving of careful consideration.
In terms of lateral (earth) pressures, the primary issue is the magnitude of pressures relative ornormalized to some reference value. In general,
∫σ=H
hh dzP0
(3.2)
where Ph = the horizontal resultant (earth) force acting on an earth retaining structure and theother terms have been defined previously.
Assuming a soil backfill/fill with all material parameters constant in magnitude with depth,Equation 3.2 can be extended to yield:
( ) ( ) ( )2
2
0 0 000
HKdzzKdzzKdzKdzKdz th
H H H
thtvoh
H
voh
H
h h
⋅γ⋅=γ⋅=⋅γ=σ=σ⋅=σ ∫ ∫ ∫∫∫ (3.3)
which, when rearranged, yields:
∫ σ⋅γ
=H
ht
h dzH
K0
2
2(3.4)
where:Kh = the coefficient of lateral earth pressure in general,
voσ = the effective vertical stress under gravity (overburden) conditions
and the other terms have been defined previously.
In a study performed by Karpurapu and Bathurst (1992), they found it convenient to:
• normalize results using the active earth pressure state (Ka) as the reference condition;• calculate Kh using Equation 3.4 and the FEM results for each case they analyzed; and• compare results based on dimensionless Kh/Ka ratios.
While this was effective for their purposes, an alternative approach was used in this study:
• The resultant force Ph, as opposed to the earth pressure coefficient Kh, was calculated usingEquation 3.2 for each subcase. This was to remove any ambiguity or error from dealing withbackfills/fills of different composition having different material unit weights.

33
Integral-Abutment Bridges: Problems and Innovative Solutions Using EPS Geofoam and Other GeosyntheticsManhattan College Research Report No. CE/GE-00-2
• The normally consolidated (NC) at-rest, not active, earth pressure state was used as thereference condition for normalization. The NC at-rest earth pressure state is the line in Figure3.6 labeled "at rest". It was felt that the at-rest state was a more representative baseline for arelatively rigid and non-yielding earth retaining structure such as a bridge abutment. Theresultant force, Ph, for this reference condition was given the special notation *
oP .
• A new dimensionless parameter, β, called the normalized horizontal resultant (earth) forcewas used to reflect the relative results between analysis subcases by defining
*o
h
P
P=β (3.5)
This means that β = 1 represents the baseline condition of the NC at-rest earth pressure state.
Conceptually, the approach used in this study to portray and compare lateral pressures achievesthe same goal as the approach used by Karpurapu and Bathurst (1992). It is simply more generaland better suited to the specific elements and requirements of this study.
Using the concept defined by Equation 3.5, it is of interest to note that the other classical earthpressure theories discussed in Section 3.3.1.2 and shown in Figure 3.6 yield values of β = 0.55and 24 for the active and passive states respectively.
It is important to note that both this study as well as that of Karpurapu and Bathurst (1992)focus only on the magnitudes of resultant forces applied to an earth retaining structure. The pointof application of the resultant force, which affects bending moments in and global stability of (ifit is free to move) the structure, is not considered. Therefore, care is required when interpretingthe results of this study as two different subcases might happen to produce the same value of βbut might not affect the abutment structurally in the same way due to different points ofapplication of the resultant forces.
3.3.2 Case 1: No Geofoam
3.3.2.1 Introduction. The primary focus of Case 1 was the baseline condition of traditionalIAB construction with an unreinforced soil backfill/fill and no geofoam (Case 1a). This baselinecondition yielded results against which all other results in this study were compared for theireffectiveness in addressing the most critical IAB problems, i.e. reducing lateral earth pressureson the abutment and settlement of the ground surface behind the abutment.
Also included in Case 1 were two other subcases (1bi and 1bii) in which tensile reinforcementwas embedded within the retained soil. The simulated zone of reinforcement is shown in Figure3.7. The length of the reinforcements, Lr, in both subcases was 3.9 m (12.8 ft). This resulted in areinforcement-length-to-wall-height ratio, Lr/H, = 0.65 which is within the range of typical valuesfor MSEW under gravity loads. It was assumed that this reinforcement length would be sufficientto make reinforcement pullout, which is not possible using the modeling technique described inSection 3.2.4.4 that was used in this study, unlikely under service load conditions.

Integral-Abutment Bridges: Problems and Innovative Solutions Using EPS Geofoam and Other GeosyntheticsManhattan College Research Report No. CE/GE-00-2
34
3.3.2.2 End of Construction. The lateral earth pressures acting on the back of the abutmentat the end of construction are shown in Figure 3.8. Note that this also represents the initialneutral temperature condition before the thermally induced forces are applied.
As might be expected, the baseline unreinforced soil subcase (Case 1a) essentially reflects theNC at-rest state (β = 0.99) with a slight increase in stress near the top of the abutment due toresidual compaction effects there (qualitatively similar to what would be predicted by the methodin Duncan et al. (1991) for example) and a slight decrease in stress near the bottom of theabutment. This localized reduction is due to the fact that during backfilling/filling, the abutmentexhibited a slight tendency to rotate clockwise about its top where it is effectively restrainedagainst movement by the bridge superstructure. The bottom of the abutment, which is restrainedonly by one metre of soil and friction along its base, moved approximately 2 mm (0.1 in) outward(toward the left in Figure 3.7). As a result, an early stage of horizontal arching in the mode of"rotation about top" was created within the retained soil (Handy 1985, Harrop-Williams 1989).The observed pressure distribution shown in Figure 3.8 is qualitatively consistent with resultsfrom both physical testing using 1-g models reported by Fang and Ishibashi (1986) as well astheoretical work by Harrop-Williams (1989).
As expected based on past work (Horvath 1990, 1991a, 1991b), the presence of geosynthetictensile reinforcement within the retained soil had little benefit (β = 0.92) in the case of thepolymeric reinforcement (Case 1bi) and only modest benefit (β = 0.82) in the case of the metallicreinforcement (Case 1bii) as the slight outward movement of the bottom of the abutment allowedthe lower levels of the relatively stiff metallic reinforcements to mobilize some tensile resistance.
Figure 3.7. Case 1b: FEM Mesh (partial)
X axis
0 5 10 15
Y a
xis
0
1
2
3
4
5
6
Note: Both axes scaled in metres (1 m = 0.305 ft).
abutmentlength of
reinforcements, Lr
reinforcement layer (typical)
superstructure

35
Integral-Abutment Bridges: Problems and Innovative Solutions Using EPS Geofoam and Other GeosyntheticsManhattan College Research Report No. CE/GE-00-2
Elaborating on a point implied in the preceding paragraphs, it has been known from thebeginning of modern soil mechanics that the classical triangular distributions of lateral earthpressure for the active and passive states (as shown in Figure 3.6 for example) are simplisticidealizations that are rarely if ever observed in practice. This is because horizontal displacementof an earth retaining structure does not cause simple soil wedges to develop and slide along theintra-soil failure surfaces assumed by classical theories. Such displacements actually mobilize acomplex pattern of arching that results in lateral earth pressure distributions that are moreparabolic in shape (Handy 1985, Harrop-Williams 1989). Even the basic at-rest state is morecomplex than normally assumed in practice with phenomena such as the existence of significantvertical shear stresses along the interface between the earth retaining structure and retained soil,even in the absence of horizontal movement of the wall (Duncan et al. 1990). Nevertheless, theclassical triangular distributions have remained in use up to the present as they are easy to workwith in terms of calculating pressures, resultant forces and points of resultant application, andproduce acceptable designs in routine practice for most earth retaining structures. It is for thisreason that the classical lateral earth pressure distributions for the active and at-rest states (andpassive state where appropriate) are shown in Figure 3.8 and many others throughout this report.
However, in a study such as this it is important to understand the actual, more complex lateralearth pressure distributions that develop. A useful tool for the purpose of gaining insight into thecalculated results of FEM analyses is to contour values of the dimensionless stress level, S,
Normalized lateral earth pressure, σh/patm
0.0 0.1 0.2 0.3 0.4 0.5
No
rma
lize
d d
epth
be
low
to
p o
f a
bu
tme
nt,
z/ H
0.0
0.1
0.2
0.3
0.4
0.5
0.6
0.7
0.8
0.9
1.0
Case 1a (baseline)Case 1biCase 1bii
Figure 3.8. Case 1:Lateral Earth Pressures at End of Construction
at rest
active

Integral-Abutment Bridges: Problems and Innovative Solutions Using EPS Geofoam and Other GeosyntheticsManhattan College Research Report No. CE/GE-00-2
36
within the soil. This is one of many quantities calculated by SSTIPNH and similar FEM software.Stress level at some point is defined as:
( )( ) f
S31
31
σ−σσ−σ
= (3.6)
where:( )31 σ−σ = calculated principal effective stress difference at that point and
( )f31 σ−σ = theoretical principal effective stress difference at failure at that point.
Essentially, this is the ratio of actual shear stress to that required to cause failure. For 2-D solidelements, stress level is typically calculated based on the average stress state existing at thegeometric centroid of an element.
Inspection of Equation 3.6 indicates that S = 0 defines the isotropic stress state; S = 1 soil"failure", i.e. full mobilization of shear strength; and 0 < S < 1 intermediate conditions. Thuscontours of stress levels equal to or approaching one indicate zones where soil failure occurs oris tending to occur. Furthermore, patterns formed by the stress level contours illustrate actual orpotential failure zones (or approximately one-dimensional failure surfaces if the contours areclosely spaced) within the soil. However, care is required to properly interpret contoured stresslevels in lateral earth pressure problems as there is nothing to distinguish a soil failure in theactive or passive state. Which is occurring will be clarified in the text of this report.
Figure 3.9. Case 1a: Stress Levels at End of Construction
Note: Both axes scaled in metres (1 m = 0.305 ft).
X axis
0 1 2 3 4 5 6 7 8 9 10 11 12 13 14 15
Y a
xis
0
1
2
3
4
5
60.0
0.20.1
0.3
0.4
0.5
abutment
0.50.40.30.20.1
superstructure

37
Integral-Abutment Bridges: Problems and Innovative Solutions Using EPS Geofoam and Other GeosyntheticsManhattan College Research Report No. CE/GE-00-2
A plot of the stress levels for Case 1a only20 at the end of construction is shown in Figure 3.9.Much of the retained soil is close to the NC at-rest state (S ≅ 0.4 for the soil parameters used inthis study) except for residual compaction effects near the surface (S = 0 for the as-compactedsoil in this study) and a slight increase in mobilized strength (S > 0.4) on both sides of theabutment near its bottom as a result of the slight outward movement in that area.
3.3.2.3 First Thermal Contraction Peak. The initial post-construction thermal loadsimulation consisted of a temperature reduction from the post-construction neutral temperature of+10°C (+50°F) to -20°C (-4°F) in three equal decrements of 10°C (18°F). This resulted in thefirst thermal contraction peak of the bridge. The lateral earth pressures corresponding to thiswould be expected to be minimum and approach the theoretical active state (β = 0.55 for the soilparameters assumed in this study). Thus the primary concern for this load case would not belateral earth pressures per se but the development of an active soil "wedge" that would have adownward component of displacement that would result in settlement of the ground surfaceimmediately behind the abutment.
20 Because of the approximate way in which geosynthetic tensile reinforcement was modeled in this study,stress-level contours within the reinforced soil mass for cases 1bi and 1bii were felt to be unreliable so arenot shown.
Normalized lateral earth pressure, σh/patm
0.0 0.1 0.2 0.3 0.4 0.5
Nor
ma
lize
d de
pth
be
low
top
of a
but
me
nt,
z/H
0.0
0.1
0.2
0.3
0.4
0.5
0.6
0.7
0.8
0.9
1.0
Case 1a (baseline)Case 1biCase 1bii
Figure 3.10. Case 1:Lateral Earth Pressures at First Thermal Contraction Peak
at rest
active

Integral-Abutment Bridges: Problems and Innovative Solutions Using EPS Geofoam and Other GeosyntheticsManhattan College Research Report No. CE/GE-00-2
38
The lateral earth pressures acting on the back of the abutment at this first thermal contractionpeak are shown in Figure 3.10. Addressing first the results for the baseline all-soil subcase (1a),the horizontal resultant earth force is reduced significantly (β = 0.68) from the post-constructionat-rest state (β = 0.99) but did not achieve the theoretical active state (β = 0.55). The reduction inlateral earth force is due to the fact that contraction of the bridge superstructure pulled the top ofthe abutment outward (toward the left in Figure 3.7) approximately 9 mm (0.4 in), which isexactly that expected based on theoretical calculations, with a slight (approximately 2 mm (0.1in)) additional outward translation of the bottom of the abutment. Thus the mode of abutmentdisplacement is primarily rotation about its bottom with a minor translation component. Thecalculated lateral earth pressure distribution shown in Figure 3.10 is qualitatively consistent withthat expected based on prior experimental and theoretical work into the mechanism of archingwhen the primary displacement mode is rotation about the bottom of an earth retaining structure(Fang and Ishibashi 1986, Harrop-Williams 1989).
The contoured stress levels for Case 1a are shown in Figure 3.11 and give further insight intowhat is occurring. A zone of active soil failure (S = 1) is clearly evident along the upper portionof the abutment due to the relatively large horizontal displacement (toward the left in the figure)in that area. The location of the theoretical planar failure surface for the classical Coulomb activestate is also shown in Figure 3.10 for information and broad comparison only.
The lateral earth pressures for the two subcases with reinforcement (1bi and 1bii) are alsoshown in Figure 3.10. For these subcases, β = 0.60 and 0.44 respectively. Thus each is less thanthe soil-only Case 1a (β = 0.68) indicating that the presence of the reinforcement is somewhat
Figure 3.11. Case 1a: Stress Levels at First Thermal Contraction Peak
Note: Both axes scaled in metres (1 m = 0.305 ft).
X axis
0 1 2 3 4 5 6 7 8 9 10 11 12 13 14 15
Y a
xis
0
1
2
3
4
5
6
0.5
0.50.6
0.6
0.50.7
0.7
0.4
0.80.9
0.3
1.0
0.6
abutment
0.60.40.2
superstructure
theoretical failure plane foractive earth pressure state (Coulomb theory)

39
Integral-Abutment Bridges: Problems and Innovative Solutions Using EPS Geofoam and Other GeosyntheticsManhattan College Research Report No. CE/GE-00-2
effective in further reducing lateral earth pressures. This is because the outward movement of theabutment, especially its upper part, allows the reinforcements to strain in tension and developtheir intended load carrying capacity. Along the upper portion of the abutment, the horizontaldisplacement is sufficient for the reinforcement to support all soil loads, especially for the stiffermetallic reinforcements. This suggests that there would likely be some physical separation (gap)between the back of the abutment and reinforced soil mass, assuming the reinforcement wasconstructed with a wrapped face to contain the soil. In the absence of wrapping, soil particleswould tend to fall into this gap. However, the 1-D interface elements in SSTIPNH that are usedalong the vertical abutment-soil interface are not numerically reliable in tension for calculatingthe exact magnitude of this separation although the calculated results indicated some separationdeveloped.
The settlement of the ground surface immediately behind the abutment is small, approximately6 mm (0.2 in) for Case 1a and somewhat less for the two subcases with reinforcement. This isconsistent with what would be expected based on research by Monley and Wu (1993).
For all three Case 1 subcases there was indication of a slight (of the order of 1 mm) net upwardmovement of the abutment out of the ground. Whether this was simply a happenstance peculiarto the numerical model used in this study or an actual behavioral characteristic of IABs is notknown at this time. If such behavior does indeed occur in actual IABs (it would likely be highlydependent on the type of foundation used among other variables) the combination of upwardmovement of the abutment and downward movement of the soil immediately behind it wouldexacerbate the observed problem of void development beneath approach slabs or, in the absenceof an approach slab, settlement of the pavement surface behind the abutment.
3.3.2.4 First Thermal Expansion Peak. After the first thermal contraction peak, six equalload increments of 10°C (18°F) each were applied to bring the structure to +40°C (+104°F) andits first thermal expansion peak. As discussed in Section 2.2.2.3, the primary concern when thisthermal condition occurs is that lateral earth pressures could approach or even equal the passivestate, at least along a portion of the abutment.
The calculated lateral earth pressures at the first thermal expansion peak are shown in Figure3.12 together with the theoretical active, normally consolidated at-rest and passive states. Theresults in Figure 3.12 indicate that the calculated lateral earth pressures are above the at-rest stateover most of the abutment height but approach the passive state only near the top of the abutmentwhere horizontal displacements are the largest. Overall, β = 1.5, 1.4 and 1.3 for cases 1a, 1bi and1bii respectively. These are all above the theoretical at-rest state (β = 1) but well below thetheoretical full passive state (β = 24).
The increase in β is not surprising as the thermally induced expansion of the bridgesuperstructure pushed the top of the abutment approximately 20 mm (0.8 in) toward the retainedsoil relative to the first contraction peak. This is an approximately 10 mm (0.4 in) net inwardmovement from the initial post-construction position of the abutment top and approximately themaximum expected based on theoretical considerations. This indicates that, from a practicalperspective, the retained soil effectively offers no resistance to the tendency of an IABsuperstructure to expand thermally and maintain a thermal-stress-free condition. The bottom ofthe abutment also moved approximately 5 mm (0.1 in) inward toward the retained soil whichreturned it roughly to its post-construction position. It was of interest to note that this first cycleof superstructure expansion caused the top of the abutment to move further slightly upward andout of the ground, continuing the trend noted previously.
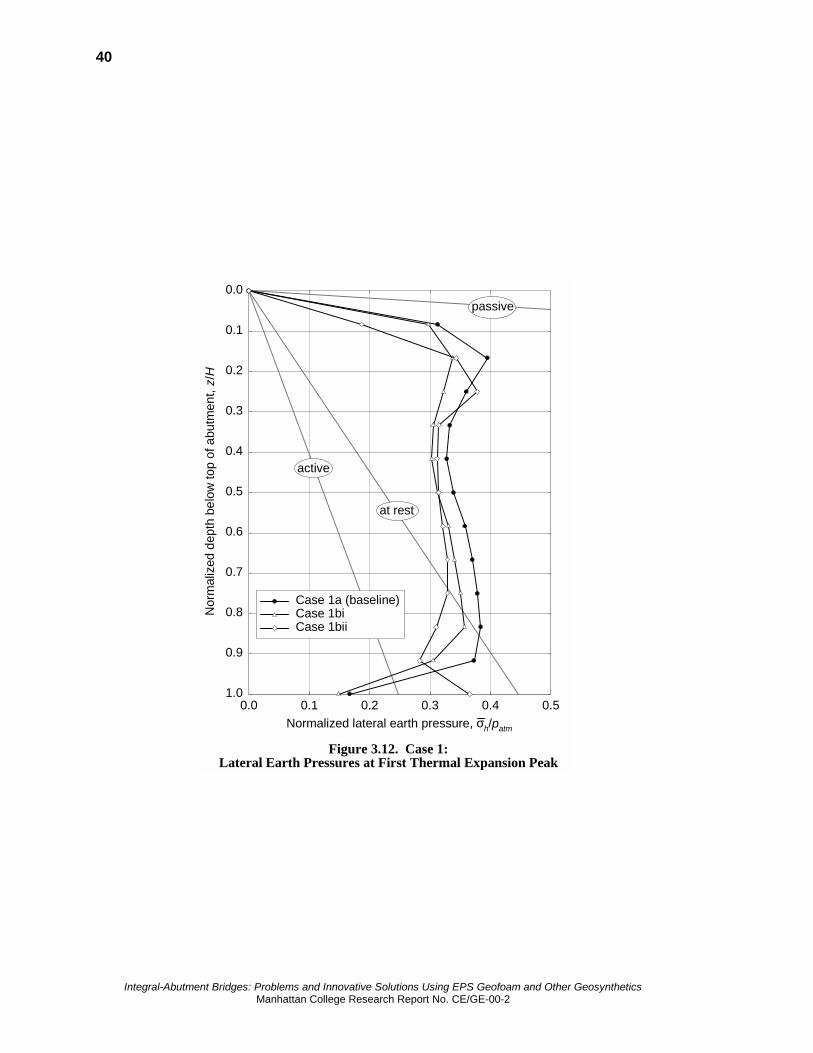
Integral-Abutment Bridges: Problems and Innovative Solutions Using EPS Geofoam and Other GeosyntheticsManhattan College Research Report No. CE/GE-00-2
40
Normalized lateral earth pressure, σh/patm
0.0 0.1 0.2 0.3 0.4 0.5
Nor
mal
ized
dep
th b
elo
w top
of a
butm
ent,
z/H
0.0
0.1
0.2
0.3
0.4
0.5
0.6
0.7
0.8
0.9
1.0
Case 1a (baseline)Case 1biCase 1bii
Figure 3.12. Case 1:Lateral Earth Pressures at First Thermal Expansion Peak
at rest
active
passive

41
Integral-Abutment Bridges: Problems and Innovative Solutions Using EPS Geofoam and Other GeosyntheticsManhattan College Research Report No. CE/GE-00-2
The stress-level contours for Case 1a are shown in Figure 3.13 and illustrate the complexdevelopments reflected in Figure 3.12. Along the upper portion of the abutment, stress reversalhas occurred so the horizontal stresses exceed the vertical and the soil is tending toward a passivefailure (S = 1). With increasing depth, stress reversal is still developing so the stresses tendtoward isotropic (S = 0). Finally, near the bottom the vertical stresses still exceed the horizontaland conditions are close to the NC at-rest state (S ≅ 0.4). The location of the theoretical planarfailure surface for the classical Coulomb passive state is also shown in Figure 3.13 for broadcomparison only.
3.3.2.5 End of First Thermal Cycle. After the first thermal expansion peak, three loaddecrements of 10°C (18°F) each were applied to bring the structure back down to its neutraltemperature of +10°C (+50°F) and complete one full thermal cycle. The calculated lateral earthpressures for this condition are shown in Figure 3.14. The results for Case 1bii with metallicreinforcement are not shown as they were of questionable accuracy based on visual inspection ofthe plotted results. This suggests that the procedure of activating and deactivating the nodal-linkelements, which model the geosynthetic reinforcement, depending on the loading step to preventcompressive forces from developing within the reinforcements is not totally successful inmeeting its intended objectives, at least for this particular analysis. Also shown in Figure 3.14 forcomparative purposes are the end-of-construction results for the baseline Case 1a (the end-of-construction results for Case 1bi were similar) and the usual theoretical earth pressure states.
Figure 3.13. Case 1a: Stress Levels at First Thermal Expansion Peak
Note: Both axes scaled in metres (1 m = 0.305 ft).
X axis
0 1 2 3 4 5 6 7 8 9 10 11 12 13 14 15
Y a
xis
0
1
2
3
4
5
6
0.2
0.2
0.10.1
0.1
0.20.2
0.3 0.3
0.4
0.4
0.3
0.30.40.50.60.70.8
0.5
0.1
abutment
0.40.2
superstructure
theoretical failure plane forpassive earth pressure state (Coulomb theory)

Integral-Abutment Bridges: Problems and Innovative Solutions Using EPS Geofoam and Other GeosyntheticsManhattan College Research Report No. CE/GE-00-2
42
Overall, after one complete thermal cycle the horizontal resultant forces were actually slightlylower compared to the end of construction (Case 1a decreased marginally from β = 0.99 to 0.98,Case 1bi slightly from β = 0.92 to 0.86) although this is somewhat misleading as there was anoticeable redistribution of the lateral earth pressures. The slight reductions in resultant forcewere due solely to the fact that the bottom of the abutment moved a few millimetres outward (5mm (0.2 in) for Case 1a) from its original position and relieved pressures locally near the bottomof the abutment. On the other hand, even though the top of the abutment returned to its post-construction position lateral earth pressures remained somewhat above their post-constructionmagnitudes in that area suggesting a tendency to build lateral earth pressures, at least along theupper portion of the abutment adjacent to the superstructure, due to thermal cycling.
The stress-level contours for Case 1a are shown in Figure 3.15 and illustrate the very complexconditions reflected in Figure 3.14. At the top of the abutment, stress reversal has occurred suchthat horizontal stresses still exceed the vertical and the soil is tending toward a passive failure (S= 1) even though the top of the abutment has essentially returned to its as-built position. Slightlybelow that, stress reversal is still developing so the stresses tend toward isotropic (S = 0). At apoint that is approximately mid-height of the abutment, the vertical stresses still exceed thehorizontal and conditions are close to the NC at-rest state (S ≅ 0.4). Then at the very bottom ofthe abutment the stress levels increase again but this time reflecting the net outward movement of
Normalized lateral earth pressure, σh/patm
0.0 0.1 0.2 0.3 0.4 0.5
No
rmal
ize
d d
ep
th b
elo
w t
op
of
ab
utm
en
t, z
/ H
0.0
0.1
0.2
0.3
0.4
0.5
0.6
0.7
0.8
0.9
1.0
Case 1aCase 1biCase 1a (end of construction)
Figure 3.14. Case 1:Lateral Earth Pressures at End of First Thermal Cycle
at rest
active
passive

43
Integral-Abutment Bridges: Problems and Innovative Solutions Using EPS Geofoam and Other GeosyntheticsManhattan College Research Report No. CE/GE-00-2
the bottom of the abutment and the localized development of the active state. Consistent withthis, the stress levels along the outside face of the abutment are increasing toward a passivefailure (S = 1).
The complexity of the stress patterns within the soil are even more apparent when Figure 3.15is compared to Figure 3.9 which shows the stress levels at the end of construction and beginningof the first thermal cycle. Although the bridge is at the neutral temperature in both figures, thetendency for even one thermal cycle to lock in higher lateral earth pressures near the top of theabutment where the horizontal displacement range is greatest is quite evident.
The entire abutment continued to move upward as it had from the very first thermal-loadapplication. At this point, the abutment was approximately 1 mm (0.04 in) higher than its post-construction position. Again, whether this reflects only some aspect peculiar to this numericalmodel or an actual behavioral pattern of IABs is not known at this time.
3.3.2.6 Fourth (Final) Thermal Expansion Peak. After the first full thermal cycle,additional load decrements and increments of 10°C (18°F) each were applied to bring thestructure down to -20°C (-4°F), up to +40°C (+104°F) and back to the neutral temperaturethrough three complete thermal cycles. The results for these intermediate loadings were judgednot to be significant for the objectives of this report so are neither presented nor discussedfurther. The next load of interest was judged to be toward the end of the fourth (and final in thisstudy) thermal cycle when the fourth and final thermal expansion peak was reached. The primaryinterest here was to see if there was a net buildup of lateral earth pressures with loading cyclesfor the critical summer expansion condition.
Figure 3.15. Case 1a: Stress Levels at End of First Thermal Cycle
Note: Both axes scaled in metres (1 m = 0.305 ft).
X axis
0 1 2 3 4 5 6 7 8 9 10 11 12 13 14 15
Y a
xis
0
1
2
3
4
5
60.1
0.20.2
0.2
0.30.3
0.4
0.4
0.30.40.1
0.5
0.5
0.70.60.5
0.60.7
abutment
0.60.60.40.2
superstructure

Integral-Abutment Bridges: Problems and Innovative Solutions Using EPS Geofoam and Other GeosyntheticsManhattan College Research Report No. CE/GE-00-2
44
The calculated lateral earth pressures for this load are shown in Figure 3.16 for Case 1a only.The results for Case 1bi with polymeric reinforcement were of questionable accuracy and thosefor Case 1bii with metallic reinforcement were clearly incorrect. Again, this was believed due tothe approximate way in which the reinforcement stiffness was modeled during load cycles thatwould tend to produce compression in the reinforcements. Also shown in Figure 3.16 forcomparative purposes are the results of the first expansion peak for Case 1a and the usualtheoretical earth pressure states.
Overall, from the first to the fourth cycles there was a buildup of lateral earth pressure withinthe lower half of the abutment, the result of net inward movement of this portion of the abutment.As a result, the value of β for the baseline Case 1a went from 1.5 (first peak) to 1.8 (fourth peak).The contoured stress levels are shown in Figure 3.17 and reflect the trend toward a localizedpassive failure along the upper portion of the abutment.
As discussed in Section 2.2.2.3, the issue of and problems resulting from increased lateral earthpressures during annual thermal expansion of an IAB superstructure have been recognized sinceat least the 1960s. Therefore, it is not surprising that some instrumentation and observation ofactual IABs have been made and lateral earth pressure design procedures derived from theseobservations. At this point, it is of interest to compare the calculated results obtained in thisstudy to some of these other observations and design methods. Figure 3.18 shows the following:
Normalized lateral earth pressure, σh/patm
0.0 0.1 0.2 0.3 0.4 0.5 0.6 0.7
No
rmal
ize
d d
ep
th b
elo
w t
op
of
ab
utm
en
t, z
/ H
0.0
0.1
0.2
0.3
0.4
0.5
0.6
0.7
0.8
0.9
1.0
4th cycle1st cycle
Figure 3.16. Case 1a:Lateral Earth Pressures at Thermal Expansion Peaks
at rest
active
passive

45
Integral-Abutment Bridges: Problems and Innovative Solutions Using EPS Geofoam and Other GeosyntheticsManhattan College Research Report No. CE/GE-00-2
Figure 3.17. Case 1a: Stress Levels at Fourth Thermal Expansion Peak
Note: Both axes scaled in metres (1 m = 0.305 ft).
X axis
0 1 2 3 4 5 6 7 8 9 10 11 12 13 14 15
Y a
xis
0
1
2
3
4
5
6
0.2
0.2
0.1
0.1
0.20.2
0.3 0.3
0.4
0.4
0.3
0.3
0.4
0.40.50.60.70.80.9
0.1
0.3
abutment
0.20.2
superstructure
theoretical failure plane forpassive earth pressure state (Coulomb theory)

Integral-Abutment Bridges: Problems and Innovative Solutions Using EPS Geofoam and Other GeosyntheticsManhattan College Research Report No. CE/GE-00-2
46
• The results calculated in this study for the fourth and final thermal peak of baseline Case 1a.
• A trend of observations from The Forks Bridge studied by Sandford and Elgaaly (1993). Asdiscussed in Section 3.2.2.1, the hypothetical bridge used in this study is loosely patternedafter this actual IAB. Although the somewhat different variables between The Forks Bridgeand the one assumed in this study preclude a direct comparison of results, there are sufficientsimilarities to at least infer a trend from the results observed for The Forks Bridge. Asbackground information, the trend shown in Figure 3.18 for The Forks Bridge reflects datafor the third summer expansion peak experienced by that structure. At that point in time, thebridge had experienced a maximum seasonal temperature variation of approximately 48°C(86°F). This compares to the 60°C (108°F) maximum variation assumed in this study.
• Maximum lateral earth pressure design envelopes proposed by Broms and Ingleson (1971)and a slightly modified version of it as used by the State of Maine Department ofTransportation (DOT) circa 1986 (Sandford and Elgaaly 1993). In each method, the lateral
Normalized lateral earth pressure, σh/patm
0.0 0.3 0.6 0.9 1.2 1.5 1.8
Nor
ma
lize
d de
pth
be
low
top
of a
but
me
nt,
z/H
0.0
0.1
0.2
0.3
0.4
0.5
0.6
0.7
0.8
0.9
1.0
calculated (present study)observed (The Forks Bridge)design (Broms & Ingleson)design (Maine DOT ca. 1986)
Figure 3.18. Case 1a:Comparison of Lateral Earth Pressures at Peak Conditions

47
Integral-Abutment Bridges: Problems and Innovative Solutions Using EPS Geofoam and Other GeosyntheticsManhattan College Research Report No. CE/GE-00-2
earth pressure is assumed to peak at the theoretical Rankine21 passive state at a relative depthof H/3 below the top of the abutment. The only difference between the methods is that theoriginal Broms and Ingleson method assumed that below the peak, the lateral earth pressuresdecreased to the theoretical Rankine active state. On the other hand, the 1986 Maine DOTdesign envelope assumed a decrease to the normally consolidated at-rest state.
As can be seen, the observed trend inferred from the measured results for The Forks Bridgegiven by Sandford and Elgaaly (1993) shows remarkable similarity to the calculated results forCase 1a in the present study. Both the Broms and Ingleson and 1986 Maine DOT designenvelopes appear to give conservative results overall. However, it should be kept in mind thatthese design envelopes are presumably intended to cover a 100-plus year design life (whichimplies 100-plus load cycles) of an IAB whereas both the calculated and observed results are forfar fewer load cycles and, therefore, a far shorter period of time. In addition, both designenvelopes are significantly less conservative than using the theoretical passive pressure over thefull height of the abutment. This can be seen in Table 3.4 using the concept of normalizedhorizontal resultant earth force, β, that was developed for use in this study.
Table 3.4. Case 1a: Comparison of ββββ Values for Unreinforced Soil Backfill/Fill
method ββββcalculated (baseline Case 1a - 4th cycle expansion peak) 1.8
Broms and Ingleson (1971) 4.1simplified design envelopes
State of Maine DOT (1986) 4.8theoretical (full passive from "exact" theory) 24
With regard to displacements, the entire abutment continued to move upward as it had from thevery first load application. At this point the abutment was approximately 5 mm (0.2 in) higherthan its post-construction position. No importance is placed on this calculated result untilobservation of actual IABs and/or realistic physical modeling (e.g. in a geotechnical centrifuge)at least qualitatively confirms or refutes this behavior.
3.3.2.7 End of Fourth (Final) Thermal Cycle. The thermal loading simulation for Case 1ended with the application of three additional load decrements to complete four full cycles ofthermally induced contraction and expansion and return the problem to the +10°C (+50°F)neutral condition it started from after construction. The final distribution of calculated lateralearth pressures is shown in Figure 3.19, again for Case 1a only as the results from both Case 1bsubcases were clearly in error. For comparison, also shown are the pressures immediately afterconstruction as well as after one full thermal load cycle.
21 Theoretically, the classical Rankine solutions for lateral earth pressures in the active and passive statesshould never be used in earth retaining structure problems. This is because Rankine's solutions weredeveloped assuming free-field conditions so that complementary planar failure surfaces could developwithout interference from the presence of an earth retaining structure. However, most geotechnicalengineers (practitioners and academicians alike) routinely ignore this fact and use Rankine's solutions inearth retaining structure problems. The fact that Rankine's solutions yield the same numerical results asCoulomb's solutions (a "true" retaining wall solution) with a zero soil-wall friction angle, δ, further adds tothe confusion.

Integral-Abutment Bridges: Problems and Innovative Solutions Using EPS Geofoam and Other GeosyntheticsManhattan College Research Report No. CE/GE-00-2
48
Normalized lateral earth pressure, σh/patm
0.0 0.1 0.2 0.3 0.4 0.5 0.6
Nor
mal
ized
dep
th b
elow
top
of a
butm
ent,
z/H
0.0
0.1
0.2
0.3
0.4
0.5
0.6
0.7
0.8
0.9
1.0
after four thermal cyclesafter one thermal cycleend of construction
Figure 3.19. Case 1a:Comparison of Lateral Earth Pressures at Neutral Temperature
at rest
active
passivesuperstructure

49
Integral-Abutment Bridges: Problems and Innovative Solutions Using EPS Geofoam and Other GeosyntheticsManhattan College Research Report No. CE/GE-00-2
As can be seen in this figure, after four thermal cycles lateral earth pressures increased overmost of the abutment compared to earlier stages, including continued development of a peak nearthe top is where it appears the soil has become wedged behind the relatively stiff superstructure.The contoured stress levels in Figure 3.20 clearly show the development of relatively largelateral earth pressures near the top of the abutment that approach the passive state (S = 1).Overall, β went from 0.99 before any thermal loading to 1.3 after four thermal cycles indicating anet increase of resultant earth force of approximately 30% from the end of construction.
With regard to displacements, at the top of the abutment there was a residual net horizontalmovement of approximately 4 mm (0.2 in) into the retained soil (toward the right in Figure 3.20)compared to the initial post-construction position. This is the opposite of what has often beenobserved in practice where the abutment permanently moves away from the retained soil asshown qualitatively in figures 2.5 and 2.6. This may have been at least partially due to the factthat long-term shrinkage of PCC members was not simulated in this study. Another factor may bethe inability of the hyperbolic soil model used to properly model the hysteretic soil behaviorunder cyclic loading and/or the tendency of the soil retained by the abutment to slump downwardwith each thermal contraction cycle. The bottom of the abutment had no net movement,essentially returning to its initial post-construction location.
The top of the abutment exhibited a net upward movement of approximately 4 mm (0.2 in) andthe surface of the soil immediately behind the abutment had a net settlement of 3 mm (0.1 in) fora total difference in elevation (which would appear as a void under an approach slab or pavementsettlement in the absence of a slab) of approximately 7 mm (0.3 in). While at the lower end of themagnitude of voids actually measured in practice, the qualitative development of a void wasnonetheless observed.
Figure 3.20. Case 1a: Stress Levels at End of Fourth Thermal Cycle
Note: Both axes scaled in metres (1 m = 0.305 ft).
X axis
0 1 2 3 4 5 6 7 8 9 10 11 12 13 14 15
Y a
xis
0
1
2
3
4
5
6
0.20.2
0.2
0.3 0.3
0.4
0.4
0.10.1 0.10.30.40.50.70.6
0.4
0.80.70.6
0.4
0.3
0.60.5
abutment
0.20.4
superstructure

Integral-Abutment Bridges: Problems and Innovative Solutions Using EPS Geofoam and Other GeosyntheticsManhattan College Research Report No. CE/GE-00-2
50
3.3.3 Case 2: Resilient EPS-Block Geofoam as a Compressible Inclusion
3.3.3.1 Introduction. The primary focus of Case 2 was evaluating the benefit(s) of using aresilient-EPS geofoam compressible inclusion behind the abutment as shown in Figure 3.21.Note that the inclusion was intentionally extended to the ground surface. As noted by Murphy(1997), it is generally desirable to use a compressible inclusion for as much of a wall's height asis practicable to derive maximum benefit from the use of the inclusion. However, in practice it issometimes necessary to terminate the compressible inclusion short of the surface to allow for aroad pavement, etc. In the case of an IAB, it was assumed that the area immediately behind theabutment would be spanned by an approach slab which would allow the compressible inclusionto be extended to the surface.
There were two groups of analyses performed for Case 2, cases 2a and 2b. Case 2a consisted ofthree subcases (2ai, 2aii and 2aiii) to evaluate the effect of the compressible inclusion thickness,tci, on the results. The assumed thicknesses were 100 mm (4 in), 200 mm (8 in) and 400 mm (16in) respectively. These reflect dimensionless thickness-to-wall-height ratios, tci/H, of 0.017, 0.033and 0.067 respectively. These values are within the range typically used in earth retainingstructure applications for a compressible inclusion material with a Young's modulus as assumedin this study (Karpurapu and Bathurst 1992).
Note, however, that in the FEM analyses the actual width of the elements that comprised thecompressible inclusion was fixed at 400 mm (16 in) for all Case 2a analyses as shown to scale inFigure 3.21 to avoid having to revise the FEM mesh for each change in compressible inclusionthickness. The desired variation in inclusion thickness was simulated by varying the Young'smodulus of the geofoam material. This makes use of the fact that a parameter more insightful
Figure 3.21. Case 2: FEM Mesh (partial)
X axis
0 5 10 15
Y a
xis
0
1
2
3
4
5
6
Note: Both axes scaled in metres (1 m = 0.305 ft).
abutmentlength of reinforcements,
Lr
reinforcement layer (typical)[Case 2b analyses only]resilient-EPS geofoam
compressible inclusion
superstructure

51
Integral-Abutment Bridges: Problems and Innovative Solutions Using EPS Geofoam and Other GeosyntheticsManhattan College Research Report No. CE/GE-00-2
than either the Young's modulus of the inclusion material or the inclusion thickness takenindividually is the stiffness of the inclusion. This stiffness is defined as Eci/tci, the ratio of theYoung's modulus of the inclusion material to its thickness. This stiffness parameter hasdimensions of force per length cubed, better interpreted as force per unit length (an equivalentspring stiffness) per unit area. Thus to simulate a 100 mm (4 in) thick inclusion, for example,within the actual 400 mm (16 in) width of the elements the actual value of Eci (reflected in thevalues of K and Kb in Table 3.2) was multiplied by four.
While the stiffness ratio, Eci/tci, is a useful parameter it is even more useful to define adimensionless stiffness parameter. As discussed in Section 3.3.1, dimensionless parameters canbe powerful tools for portraying results provided they incorporate the key individual parametersthat affect a particular problem. For compressible inclusions used behind earth retainingstructures, the key parameters of interest are the Young's modulus and thickness of thecompressible inclusion, and geotechnical height of the wall. Therefore, the author proposes usinga dimensionless parameter, λ, called normalized compressible inclusion stiffness defined as
atmci
ci
pt
HE
⋅⋅=λ (3.7)
where all terms are as defined previously. Note that atmospheric pressure is used here solely as atool to non-dimensionalize the parameter and has no physical significance per se.
For the three subcases performed for Case 2a, λ = 149, 74 and 37 for inclusion thicknesses of100 mm (4 in), 200 mm (8 in) and 400 mm (16 in) respectively. Thus the interpretation of λ isthat the smaller its magnitude the more compressible the inclusion. The limiting conditions ofincompressibility (perfect rigidity) and infinite compressibility (perfect compressibility) are seenas λ = ∞ and λ = 0 respectively. Hopefully, use of the λ parameter will facilitate comparison inthe future between compressible inclusions constructed of different materials and thicknessesand applied to earth retaining structures of different types and heights.
Case 2b consisted of two subcases (2bi and 2bii) in which tensile reinforcement was embeddedwithin the retained soil as shown in Figure 3.21 in addition to using a compressible inclusion.Conceptually, the Case 2b analyses were a combination of Case 1b (reinforced soil only) andCase 2a (geofoam compressible inclusion only) to investigate the author's hypothesis thatsynergistic results would derive from the combination of these two already proven concepts. Thetwo Case 2b subcases differed only in the reinforcement stiffness assumed, polymeric andmetallic respectively. The compressible inclusion thickness was fixed at 200 mm (8 in) to focuson the effect of the reinforcement. The length, Lr, of the reinforcements in both subcases was 4.0m (13.1 ft). This was slightly (100 mm (4 in)) longer than that assumed in Case 1b due to thegeometry of the FEM mesh used. However, the overall stiffness of the nodal-link elements usedto simulate the reinforcements was kept the same as in Case 1b. The reinforcement length to wallheight ratio, Lr/H, = 0.67 which again is within the range of typical values for MSEW and wasassumed to be sufficient so that reinforcement pullout would not occur.
The various stages of the analyses at which the calculated Case 2 results were evaluated are thesame as used previously for Case 1 and discussed in the following sections. However, for clarityseparate presentations are made for cases 2a and 2b. Comparisons between the Case 2a and Case2b results are contained within the Case 2b sections.
Note that in all Case 2 plots of lateral pressure22 acting on the abutment the values for thehorizontal component of the theoretical active state were assumed to be the same as for Case 1.
22 Technically not earth pressures as it is the geofoam compressible inclusion, not soil, that is in directcontact with the back of the abutment.

Integral-Abutment Bridges: Problems and Innovative Solutions Using EPS Geofoam and Other GeosyntheticsManhattan College Research Report No. CE/GE-00-2
52
Strictly speaking, this is not correct as the friction angle between the abutment and retainedmaterial was not the same due to the presence of the geofoam compressible inclusion. However,choosing the correct friction angle for the Case 2 analyses is complicated by the fact that thefriction angles assumed for the soil-geofoam and geofoam-abutment interfaces were different.Consequently, the author chose to use the same results as for Case 1 as being acceptably correctfor the purposes of this report.
3.3.3.2 End of Construction (Case 2a). The first set of results examined is at thecompletion of the simulated construction of the bridge and associated earthwork. The calculatedlateral pressures acting on the back of the abutment are shown in Figure 3.22. Also shown forabsolute comparative purposes are the theoretical active and normally consolidated at-rest statepressures for a soil backfill/fill (from Case 1) as well as the calculated results from the baselineCase 1a. Note that the theoretical at-rest state (β = 1) represents an idealized, perfectly rigidinclusion (λ = ∞) as does Case 1a (β = 0.99) for all practical purposes although the lateralpressure distributions are somewhat different. Also, a vertical line drawn through zeronormalized lateral pressure (the left vertical axis in Figure 3.22) represents an infinitelycompressible inclusion (λ = 0).
Normalized lateral pressure, σh/patm
0.0 0.1 0.2 0.3 0.4 0.5
Nor
ma
lize
d d
ep
th b
elo
w to
p o
f a
butm
en
t, z
/ H
0.0
0.1
0.2
0.3
0.4
0.5
0.6
0.7
0.8
0.9
1.0
Case 2ai (λ = 149)Case 2aii (λ = 74)Case 2aiii (λ = 37)Case 1a (baseline - λ ≅ ∞)
Figure 3.22. Case 2a:Lateral Pressures at End of Construction
active at rest
λ = 0 λ = ∞
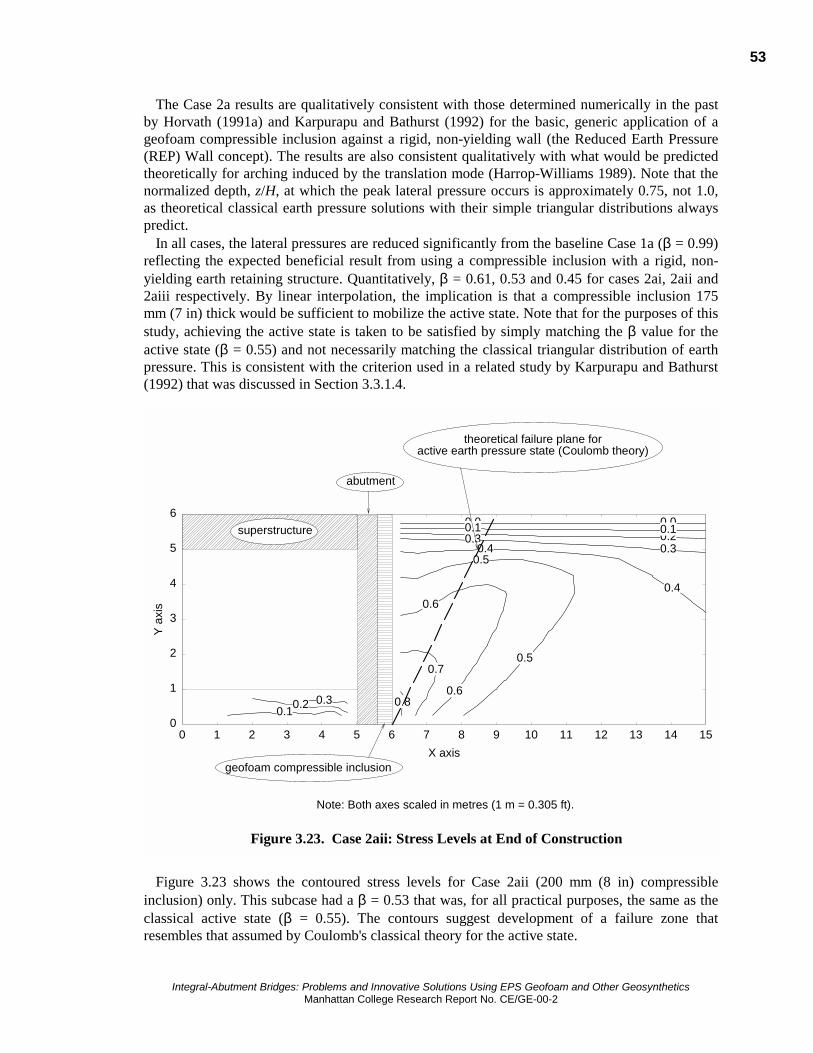
53
Integral-Abutment Bridges: Problems and Innovative Solutions Using EPS Geofoam and Other GeosyntheticsManhattan College Research Report No. CE/GE-00-2
The Case 2a results are qualitatively consistent with those determined numerically in the pastby Horvath (1991a) and Karpurapu and Bathurst (1992) for the basic, generic application of ageofoam compressible inclusion against a rigid, non-yielding wall (the Reduced Earth Pressure(REP) Wall concept). The results are also consistent qualitatively with what would be predictedtheoretically for arching induced by the translation mode (Harrop-Williams 1989). Note that thenormalized depth, z/H, at which the peak lateral pressure occurs is approximately 0.75, not 1.0,as theoretical classical earth pressure solutions with their simple triangular distributions alwayspredict.
In all cases, the lateral pressures are reduced significantly from the baseline Case 1a (β = 0.99)reflecting the expected beneficial result from using a compressible inclusion with a rigid, non-yielding earth retaining structure. Quantitatively, β = 0.61, 0.53 and 0.45 for cases 2ai, 2aii and2aiii respectively. By linear interpolation, the implication is that a compressible inclusion 175mm (7 in) thick would be sufficient to mobilize the active state. Note that for the purposes of thisstudy, achieving the active state is taken to be satisfied by simply matching the β value for theactive state (β = 0.55) and not necessarily matching the classical triangular distribution of earthpressure. This is consistent with the criterion used in a related study by Karpurapu and Bathurst(1992) that was discussed in Section 3.3.1.4.
Figure 3.23 shows the contoured stress levels for Case 2aii (200 mm (8 in) compressibleinclusion) only. This subcase had a β = 0.53 that was, for all practical purposes, the same as theclassical active state (β = 0.55). The contours suggest development of a failure zone thatresembles that assumed by Coulomb's classical theory for the active state.
Figure 3.23. Case 2aii: Stress Levels at End of Construction
Note: Both axes scaled in metres (1 m = 0.305 ft).
X axis
0 1 2 3 4 5 6 7 8 9 10 11 12 13 14 15
Y a
xis
0
1
2
3
4
5
60.0 0.00.2 0.20.1 0.10.3
0.30.4
0.4
0.5
0.5
0.6
0.6
0.7
0.8
abutment
geofoam compressible inclusion
0.30.20.1
theoretical failure plane foractive earth pressure state (Coulomb theory)
superstructure

Integral-Abutment Bridges: Problems and Innovative Solutions Using EPS Geofoam and Other GeosyntheticsManhattan College Research Report No. CE/GE-00-2
54
Whenever a compressible inclusion is used, it is of interest to investigate both the pattern andmagnitude of deformation (horizontal in this application) of the compressible inclusion. Asshown in Figure 3.24, there are two dimensionless interpretations of this. Figure 3.24(a) showsthe horizontal normal strain, εh, within the geofoam. As can be seen, strain decreases withincreasing thickness of the inclusion. However, the magnitude of horizontal compression (straintimes inclusion thickness), ∆ci, increases with increasing geofoam thickness, ranging from 10 mm(0.4 in) to 29 mm (1.1 in). In all cases the strain is well within the limits of the material23 andconsistent with the stress-strain range over which the chosen Young's modulus of the geofoam isapplicable (see figures 3.2 and 3.4).
Figure 3.24(b) shows the horizontal compression of the geofoam normalized to abutmentheight, expressed as a percent (the decimal form could be used alternatively). This ratio increases
23 Compressive strains up to approximately 50% in the long term are generally considered to be anacceptable working range for EPS geofoam (either normal or resilient) in compressible inclusionapplications. The reason for this approximate upper strain limit is that as compressive strains approach 60 to70%, the stress required to compress the EPS further begins to increase rapidly and non-linearly whichreduces the effectiveness of the material as a compressible inclusion (see Figure 3.2).
εh (%)
0 2 4 6 8 10
No
rmal
ized
dep
th b
elo
w to
p o
f ab
utm
ent,
z/ H
0.0
0.1
0.2
0.3
0.4
0.5
0.6
0.7
0.8
0.9
1.0
Case 2aiCase 2aiiCase 2aiii
Figure 3.24. Case 2a: Horizontal Deformation ofGeofoam Compressible Inclusion at End of Construction
∆ci/H (%)
0.0 0.1 0.2 0.3 0.4 0.5
0.0
0.1
0.2
0.3
0.4
0.5
0.6
0.7
0.8
0.9
1.0
Case 2aiCase 2aiiCase 2aiii
(a) (b)

55
Integral-Abutment Bridges: Problems and Innovative Solutions Using EPS Geofoam and Other GeosyntheticsManhattan College Research Report No. CE/GE-00-2
with increasing inclusion thickness. This plot is of interest as it allows comparison with the(∆s/H)a ratios discussed in the following section that deals with alternative calculation methods.
Regardless of the parameter chosen, the deformation patterns of the compressible inclusionreflect the lateral pressure distributions shown in Figure 3.22. This is to be expected as thegeofoam that comprises the compressible inclusion in this study has linear stress-strain behaviorwithin the stress range in this problem.
3.3.3.3 Discussion of Simplified Methods for REP-Wall Analysis. Using a geofoamcompressible inclusion with a rigid, non-yielding earth retaining structure in what is called theReduced Earth Pressure (REP) Wall concept is one geofoam application for which analyticalmethods other than a FEM numerical analysis have been developed. This is because the broadapplicability of the REP-Wall concept makes simplified analytical methods very attractive foruse in practice.
The abutment of an IAB with a compressible inclusion at the end of construction and prior toany post-construction thermal loading is an example of a REP-Wall application. Thus beforecontinuing with a discussion of the results of this study, it is of interest to digress and compareresults obtained from simpler, alternative analytical methods with the rigorous results from theFEM analyses performed for this study.
First considered are chart solutions developed by Karpurapu and Bathurst (1992). Using eitherFigure 9 or 11 in their paper and assuming a compressible inclusion with a Young's modulus =250 kN/m2 (5200 lb/ft2) to match the resilient-EPS geofoam modeled in this study, acompressible inclusion approximately 150 mm (6 in) thick would be required to mobilize theactive earth pressure state. The agreement with the 175 mm (7 in) thickness inferred from theFEM analyses performed for this study is very good. However, it should be noted that Karpurapuand Bathurst used the same soil parameters as in this study (from the work of Boscardin et al.(1990)). Thus the agreement may reflect the fact that the same soil was assumed in both thepresent study and that of Karpurapu and Bathurst. Nevertheless, the agreement is reassuring.
It is also of interest to explore a simple manual calculation method (referred to herein asVersion 1.1) suggested by the author (Horvath 1997, 1998b) that is a modified version of aprocedure suggested originally (referred to herein as Version 1.0) by Partos and Kazaniwsky(1987). The general equation for this method is:
( )thh
ascici K
HEt
γ⋅∆⋅
=/
(3.8)
where:Khh = the horizontal component of the coefficient of lateral earth pressure,(∆s/H)a = dimensionless ratio of minimum horizontal displacement, ∆s, of soil to geotechnical
wall height, H, necessary to achieve the active earth pressure stateand the other terms were defined previously.
For historical interest, Version 1.0 of Equation 3.8 suggested by Partos and Kazaniwsky (1987)assumed Khh = Konc, the coefficient of lateral earth pressure at rest for the normally consolidatedcondition, which results in the following equation:
( )tonc
ascici K
HEt
γ⋅∆⋅
=/
(3.9)

Integral-Abutment Bridges: Problems and Innovative Solutions Using EPS Geofoam and Other GeosyntheticsManhattan College Research Report No. CE/GE-00-2
56
The author believes assuming Khh = Konc is conceptually incorrect for the reasons discussed inHorvath (1987, 1988b). This led to development of the author's Version 1.1, first published inHorvath (1987, 1988b), in which Khh = (Ka ⋅ cos δ) was assumed where Ka = the active earthpressure coefficient from either exact or Coulomb (but never Rankine) theory and δ = the soil-geofoam friction angle. This results in the following equation for the author's Version 1.1:
( )ta
ascici K
HEt
γ⋅δ⋅∆⋅
=cos
/(3.10)
It is of interest to note that Partos and Kazaniwsky's Version 1.0 produces a significantlysmaller value for tci than the author's Version 1.1. Nevertheless, Partos and Kazaniwsky's boldand innovative actual project use of geofoam in the early 1980s for what is now known as theREP-Wall concept was successful in achieving the desired goal due both to their arbitraryincrease, based on engineering judgement, of the tci actually used (Partos and Kazaniwsky 1987)as well as the subsequent creep of the geofoam material (Murphy 1997).
The primary element of subjectivity when using Equation 3.8 in general is the value chosen for(∆s/H)a. Guidance can be obtained from a number of sources with Clough and Duncan (1991)being typical and the reference used by the author for this study. Using their value of (∆s/H)a =0.002 for medium-dense sand (which implies that a displacement of 12 mm (0.5 in) is necessaryto mobilize the active state for the IAB problem considered in this study) and the author'sVersion 1.1 (Equation 3.10), the calculated value of the required geofoam thickness, tci, = 140mm (5.5 in). This is in fair agreement with the results inferred from the FEM analyses for thisstudy (tci = 175 mm (7 in)) but, more importantly, unconservative. Note that using Version 1.0 ofPartos and Kazaniwsky (Equation 3.9), the required geofoam thickness, tci, = 66 mm (2.6 in)which is in even poorer agreement with the FEM results and more unconservative.
As an aside, the assumed value of (∆s/H)a = 0.002 = 0.2% can be compared to the FEM resultsplotted in Figure 3.24(b). Note that it is consistent with a result intermediate (tci = 175 mm (7 in))between cases 2ai and 2aii (200 mm (4 in) and 200 mm (8 in), respectively) which is the inferredthickness of geofoam necessary to mobilize the active earth force in this problem.
Returning to the discussion of simplified analytical methods, it is clear that the author's currentVersion 1.1 (Equation 3.10) should be improved. It is of interest to note that both versions 1.0and 1.1 are based on the assumption from classical earth pressure theories that the maximumlateral earth pressure, whether for the at-rest state (Version 1.0) or active state (Version 1.1),occurs at z/H = 1.0. This is based on the assumption that the distribution of the horizontalcomponent of lateral earth pressure always has the classical triangular distribution. The resultsobtained in this study as well as numerous other studies involving theoretical work based onarching concepts, numerical analyses and physical testing consistently show that the actualdistribution of lateral (earth) pressures is curved and qualitatively identical to those shown inFigure 3.22. The only variation observed between different studies is the depth at which the peakpressure occurs. This appears to be dependent on the boundary condition imposed at the bottom,i.e. perfectly smooth, perfectly fixed or some intermediate case such as the frictional boundaryused in this study.
Because the frictional boundary used in this study is believed to be realistic, to develop animproved Version 1.2 of this methodology a lateral stress peak at z/H = 0.75 which is consistentwith that shown in Figure 3.22 is used. The resulting equation is:
( )ta
ascici K
HEt
γ⋅δ⋅⋅∆⋅
=cos75.0
/(3.11)

57
Integral-Abutment Bridges: Problems and Innovative Solutions Using EPS Geofoam and Other GeosyntheticsManhattan College Research Report No. CE/GE-00-2
Using this equation, the calculated required compressible inclusion thickness for the problemconsidered in this study increases to 185 mm (7.3 in) which is in much better agreement with theresults (175 mm (7 in)) inferred from the FEM analyses performed for this study. Therefore, theauthor suggests that the procedure suggested previously in Horvath (1997, 1998b) be modifiedand Equation 3.11 used in lieu of Equation 3.10. Table 3.5 summarizes the results presented inthe foregoing paragraphs.
Table 3.5. Comparison of Required Thickness of Compressible Inclusion, tci, toAchieve the Active Earth Pressure State (REP-Wall Concept)
analytical method tci, mm (inches)inferred from FEM analysis (present study) 175 (7)
charts based on parametric FEM analyses (Karpurapu and Bathurst 1992) 150 (6)Version 1.0 (Partos and Kazaniwsky 1987) 66 (2.6)
Version 1.1 (Horvath 1997, 1998b) 140 (5.5)simplified analytical methodVersions 1.2 and 2.0 (Horvath, present study) 185 (7.3)
The latest Version 1.2 of this simplified REP-Wall analysis appears to yield reasonablyaccurate results and can be used in routine practice. The advantage of this method over the chartscontained in Karpurapu and Bathurst (1992) is that it can be used with any type of soil by usingthe appropriate value for (∆s/H)a from a reference such as Clough and Duncan (1991).
As a final comment, the above sequence of theoretical development ending with Equation 3.11is based on equating the assumed maximum lateral (earth) pressure with the stiffness of thecompressible inclusion. It is of interest to note that an alternative path of theoretical developmentcan be based on using horizontal resultant forces and the dimensionless β parameter that wasintroduced in Section 3.3.1.4. Such a resultant force approach is used subsequently in Section3.3.3.10 to develop a simplified analytical method for the Zero Earth Pressure (ZEP) Wallproblem involving both a compressible inclusion and tensile reinforcement. Applying a resultant-force approach to the REP-Wall problem produces a result identical to Equation 3.11. Derivationof this resultant-based alternative, which the author calls Version 2.0 of simplified REP-Wallanalysis, is presented in Appendix A of this report. The benefit of using Version 2.0 in lieu of theVersion 1.X methods discussed in this section is that Version 2.0 provides a unified conceptualapproach with the ZEP-Wall analytical method presented subsequently in Section 3.3.3.10.
3.3.3.4 First Thermal Contraction Peak (Case 2a). Returning now to the presentationand discussion of FEM analyses performed for the present study, the lateral pressures at the firstthermal contraction peak are shown in Figure 3.25. Corresponding results from the baseline Case1a are shown together with the theoretical pressures. Modest additional reductions overall fromthe end of construction condition occur (β = 0.46 to 0.37 with increasing inclusion thickness),especially along the upper portion of the abutment where pressures drop to zero and a smallseparation between the abutment and geofoam was calculated. This is due to the fact thatcontraction of the superstructure pulled the top of the abutment outward approximately 9 mm(0.4 in) as expected from theoretical calculations. As in Case 1, the mode of abutmentdisplacement during thermal contraction is primarily rotation about its bottom with a smalltranslation component. Additional shear strength mobilization within the retained soil from theend of construction condition occurs as depicted by the contoured stress levels shown in Figure3.26 for Case 2aii only.

Integral-Abutment Bridges: Problems and Innovative Solutions Using EPS Geofoam and Other GeosyntheticsManhattan College Research Report No. CE/GE-00-2
58
Normalized lateral pressure, σh/patm
0.0 0.1 0.2 0.3 0.4 0.5
No
rmal
ize
d d
ep
th b
elo
w t
op
of
ab
utm
en
t, z
/ H
0.0
0.1
0.2
0.3
0.4
0.5
0.6
0.7
0.8
0.9
1.0
Case 2aiCase 2aiiCase 2aiiiCase 1a
Figure 3.25. Case 2a:Lateral Pressures at First Thermal Contraction Peak
active at rest

59
Integral-Abutment Bridges: Problems and Innovative Solutions Using EPS Geofoam and Other GeosyntheticsManhattan College Research Report No. CE/GE-00-2
Figure 3.26. Case 2aii: Stress Levels at First Thermal Contraction Peak
Note: Both axes scaled in metres (1 m = 0.305 ft).
X axis
0 1 2 3 4 5 6 7 8 9 10 11 12 13 14 15
Y a
xis
0
1
2
3
4
5
6
0.40.6
0.6
0.8
0.8
0.4
0.8
abutment
geofoam compressible inclusion
0.60.40.2
theoretical failure plane foractive earth pressure state (Coulomb theory)
superstructure

Integral-Abutment Bridges: Problems and Innovative Solutions Using EPS Geofoam and Other GeosyntheticsManhattan College Research Report No. CE/GE-00-2
60
Horizontal deformation of the compressible inclusion is shown in Figure 3.27. Notsurprisingly, the compressible inclusion expanded somewhat from the end of construction(Figure 3.24), especially along the upper portion of the abutment.
The settlement of the ground surface immediately behind the abutment was small(approximately 2 mm (0.1 in)) for all Case 2a subcases. This is less than that calculated in Case1. For all three Case 2a subcases there was again indication of a slight (of the order of 1 mm) netupward movement of the abutment out of the ground as calculated in Case 1.
3.3.3.5 First Thermal Expansion Peak (Case 2a). The calculated lateral pressures at thefirst thermal expansion peak are shown in Figure 3.28 together with the results from the baselineCase 1a and the theoretical active, normally consolidated at-rest and passive states. Note in thisfigure that the lateral pressures acting on the abutment can realistically be, and in fact arecalculated to be, non-zero at the ground surface. This is because the geofoam compressibleinclusion, not soil, is in contact with the abutment. Because resilient-EPS geofoam is a solidmaterial with inherent, stress-independent material strength (cohesion in the context of the Mohr-Coulomb failure criterion), it has strength even when the total stress is zero (as it is at thesurface). This is not the case with a particulate material such as soil.
εh (%)
0 2 4 6 8 10
No
rmal
ized
dep
th b
elow
top
of a
butm
ent
, z/
H
0.0
0.1
0.2
0.3
0.4
0.5
0.6
0.7
0.8
0.9
1.0
Case 2aiCase 2aiiCase 2aiii
Figure 3.27. Case 2a: Horizontal Deformation of GeofoamCompressible Inclusion at First Thermal Contraction Peak
∆ci/H (%)
0.0 0.1 0.2 0.3 0.4 0.5
0.0
0.1
0.2
0.3
0.4
0.5
0.6
0.7
0.8
0.9
1.0
Case 2aiCase 2aiiCase 2aiii
(a) (b)

61
Integral-Abutment Bridges: Problems and Innovative Solutions Using EPS Geofoam and Other GeosyntheticsManhattan College Research Report No. CE/GE-00-2
Overall, the normalized horizontal resultant forces are β = 0.94, 0.76 and 0.58 for cases 2ai,2aii and 2aiii respectively. They are all below the theoretical at-rest value (β = 1) and well belowthe Case 1a baseline value (β = 1.5) indicating that the geofoam compressible inclusion is quiteeffective in its primary intended purpose. However, the values of β are somewhat misleading asthe distributions of lateral pressures are significantly different than earlier load steps, beingnearly uniformly distributed with depth. This suggests a complex pattern of earth pressure stateswithin the retained soil which is reflected in the contoured stress levels shown in Figure 3.29 forCase 2aii (chosen as being representative). Near the top of the abutment, stress reversals haveoccurred with horizontal stresses exceeding vertical and stress levels increasing toward a passivefailure (S = 1). This is not surprising as the thermally induced expansion of the superstructurepushed the top of the abutment approximately 10 mm (0.4 in) inward from its initial post-construction position, the same as in the Case 1 analyses and the maximum expected based ontheoretical considerations. Mid-height along the abutment stresses are close to the NC at-reststate (S ≅ 0.4). Toward the bottom of the abutment, pressures actually decrease toward the activestate (S = 1) and the increased stress levels in this area reflect this. This tendency toward theactive state occurs even though the bottom of the abutment moved inward toward the retainedsoil and returned approximately to its post-construction position. This apparent contradiction in
Normalized lateral pressure, σh/patm
0.0 0.1 0.2 0.3 0.4 0.5
Nor
ma
lize
d de
pth
be
low
top
of a
but
me
nt,
z/H
0.0
0.1
0.2
0.3
0.4
0.5
0.6
0.7
0.8
0.9
1.0
Case 2aiCase 2aiiCase 2aiiiCase 1a
Figure 3.28. Case 2a:Lateral Pressures at First Thermal Expansion Peak
at rest
active
passive

Integral-Abutment Bridges: Problems and Innovative Solutions Using EPS Geofoam and Other GeosyntheticsManhattan College Research Report No. CE/GE-00-2
62
behavior occurred because compression of the compressible inclusion allowed simultaneousinward movement of the abutment and outward movement of the retained soil.
The patterns of deformation within the compressible inclusion are shown in Figure 3.30 andqualitatively reflect the lateral pressures shown in Figure 3.28. Although not apparent fromFigure 3.30, it is of interest to note that virtually all horizontal movement of the abutment as aresult of thermal expansion of the bridge superstructure was accommodated by compressionwithin the geofoam. Very little horizontal movement along the vertical geofoam-soil interfaceoccurred and what little that did was concentrated near the top of the abutment.
Also of interest is that this first peak of thermal expansion caused the top of the abutment tofurther move slightly upward and out of the ground, continuing the trend noted previously.
3.3.3.6 End of First Thermal Cycle (Case 2a). The calculated lateral pressures atcompletion of the first full thermal cycle are shown in Figure 3.31. The corresponding resultsfrom the baseline Case 1a as well as the usual theoretical pressures are shown also for absolutecomparison purposes. Overall, the resultant forces increased somewhat from the end ofconstruction, with β = 0.66, 0.57 and 0.46 for subcases 2ai, 2aii and 2aiii respectively. However,the resultant forces are still substantially less than the baseline Case 1a (β = 0.98). The resultsindicate that, even though the geofoam material in this study was perfectly elastic, the soil is notso there was some net lateral pressure increase as the soil did not return to exactly the sameposition as immediately after construction even though the abutment had essentially returned tothe same horizontal position it had occupied after construction.
Figure 3.29. Case 2aii: Stress Levels at First Thermal Expansion Peak
Note: Both axes scaled in metres (1 m = 0.305 ft).
X axis
0 1 2 3 4 5 6 7 8 9 10 11 12 13 14 15
Y a
xis
0
1
2
3
4
5
6
0.2 0.2
0.4
0.4
0.20.20.4
0.6
abutment
geofoam compressible inclusion
0.20.10.1
superstructure

63
Integral-Abutment Bridges: Problems and Innovative Solutions Using EPS Geofoam and Other GeosyntheticsManhattan College Research Report No. CE/GE-00-2
εh (%)
0 2 4 6 8 10 12
No
rmal
ize
d d
ep
th b
elo
w t
op
of
ab
utm
en
t, z
/ H
0.0
0.1
0.2
0.3
0.4
0.5
0.6
0.7
0.8
0.9
1.0
Case 2aiCase 2aiiCase 2aiii
Figure 3.30. Case 2a: Horizontal Deformation of GeofoamCompressible Inclusion at First Thermal Expansion Peak
∆ci/H (%)
0.0 0.1 0.2 0.3 0.4 0.5 0.6
0.0
0.1
0.2
0.3
0.4
0.5
0.6
0.7
0.8
0.9
1.0
(a) (b)
see (a)for legend

Integral-Abutment Bridges: Problems and Innovative Solutions Using EPS Geofoam and Other GeosyntheticsManhattan College Research Report No. CE/GE-00-2
64
Normalized lateral pressure, σh/patm
0.0 0.1 0.2 0.3 0.4 0.5
Nor
ma
lize
d de
pth
be
low
top
of a
but
me
nt, z
/ H
0.0
0.1
0.2
0.3
0.4
0.5
0.6
0.7
0.8
0.9
1.0
Case 2aiCase 2aiiCase 2aiiiCase 1a
Figure 3.31. Case 2a:Lateral Pressures at End of First Thermal Cycle
at rest
active
passive
superstructure

65
Integral-Abutment Bridges: Problems and Innovative Solutions Using EPS Geofoam and Other GeosyntheticsManhattan College Research Report No. CE/GE-00-2
Comparing Figure 3.31 to Figure 3.22 (end of construction), it is apparent that the majority ofthe increase in the overall resultant force after one full thermal cycle is due to an accumulation oflateral pressures along the upper portion of the abutment, behind the bridge superstructure. Thisis more clearly understood from the stress-level contours, for Case 2aii only as before, shown inFigure 3.32. Once again, the stress conditions are quite complex. Only at the very top of theabutment do stresses even approach the isotropic condition (S = 0). Below that, vertical stressesremain larger than the horizontal. The tendency toward an active failure (S = 1) toward thebottom of the abutment is evident.
The patterns of horizontal deformation within the compressible inclusion are shown in Figure3.33.
3.3.3.7 Fourth (Final) Thermal Expansion Peak (Case 2a). The calculated lateralpressures for this load are shown in Figure 3.34. It is interesting to note that in each of the threesubcases they are almost uniform in magnitude with depth. The corresponding results from thebaseline Case 1a as well as the usual theoretical pressures are shown also for absolutecomparison purposes. Overall, the resultant forces increased somewhat from the first cycle, withβ = 1.0, 0.79 and 0.62 for subcases 2ai, 2aii and 2aiii respectively. This suggests that there is atendency to increase lateral pressures with load cycling even when a linear-elastic compressibleinclusion is used. However, the resultant forces are still substantially less than those for thefourth thermal peak of the baseline Case 1a (β = 1.8).
Figure 3.32. Case 2aii: Stress Levels at End of First Thermal Cycle
Note: Both axes scaled in metres (1 m = 0.305 ft).
X axis
0 1 2 3 4 5 6 7 8 9 10 11 12 13 14 15
Y a
xis
0
1
2
3
4
5
60.1
0.20.30.30.4
0.4
0.5
0.5
0.6
0.6
0.2
0.7
abutment
geofoam compressible inclusion
0.40.2
superstructure

Integral-Abutment Bridges: Problems and Innovative Solutions Using EPS Geofoam and Other GeosyntheticsManhattan College Research Report No. CE/GE-00-2
66
εh (%)
0 2 4 6 8 10
No
rmal
ized
dep
th b
elow
top
of a
butm
ent
, z/
H
0.0
0.1
0.2
0.3
0.4
0.5
0.6
0.7
0.8
0.9
1.0
Case 2aiCase 2aiiCase 2aiii
Figure 3.33. Case 2a: Horizontal Deformation of GeofoamCompressible Inclusion at End of First Thermal Cycle
∆ci/H (%)
0.0 0.1 0.2 0.3 0.4 0.5
0.0
0.1
0.2
0.3
0.4
0.5
0.6
0.7
0.8
0.9
1.0
Case 2aiCase 2aiiCase 2aiii
(a) (b)

67
Integral-Abutment Bridges: Problems and Innovative Solutions Using EPS Geofoam and Other GeosyntheticsManhattan College Research Report No. CE/GE-00-2
Normalized lateral pressure, σh/patm
0.0 0.1 0.2 0.3 0.4 0.5 0.6 0.7
No
rmal
ized
dep
th b
elow
top
of a
butm
ent
, z/
H
0.0
0.1
0.2
0.3
0.4
0.5
0.6
0.7
0.8
0.9
1.0
Case 2aiCase 2aiiCase 2aiiiCase 1a
Figure 3.34. Case 2a:Lateral Pressures at Fourth Thermal Expansion Peak
at rest
active
passive

Integral-Abutment Bridges: Problems and Innovative Solutions Using EPS Geofoam and Other GeosyntheticsManhattan College Research Report No. CE/GE-00-2
68
The contoured stress levels are shown in Figure 3.35. They are complex with some notabledifferences compared to those observed after one thermal cycle (Figure 3.32). In particular, at theupper portion of the abutment there is a reversal in stresses so that horizontal exceed vertical andthe stress level is increasing toward a passive failure (S = 1). This means that even with acompressible inclusion larger horizontal stresses are becoming locked in even after just fourthermal cycles. With increasing depth behind the abutment, the stress level drops to the isotropiccondition (S = 0) and then increases again but with the vertical stresses larger than the horizontal.The tendency toward an active failure (S = 1) toward the bottom of the abutment is evident.
The patterns of horizontal deformation within the compressible inclusion are shown in Figure3.36.
3.3.3.8 End of Fourth (Final) Thermal Cycle (Case 2a). The final distribution ofcalculated lateral pressures is shown in Figure 3.37 together with the corresponding results fromthe baseline Case 1a as well as the usual theoretical pressures for absolute comparison purposes.Overall, the resultant forces were essentially unchanged compared to those at the end of one fullthermal cycle, with β = 0.65, 0.56 and 0.49 for subcases 2ai, 2aii and 2aiii, respectively.Interestingly, these represent almost insignificant increases overall from the end of construction.However, the distribution of lateral pressures is noticeably different compared to the end ofconstruction (Figure 3.22). There has been a redistribution of lateral pressures with an increase inpressures near the upper portion of the abutment just behind the bridge superstructure that iscompensated by decreases in pressure with depth.
Figure 3.35. Case 2aii: Stress Levels at Fourth Thermal Expansion Peak
Note: Both axes scaled in metres (1 m = 0.305 ft).
X axis
0 1 2 3 4 5 6 7 8 9 10 11 12 13 14 15
Y a
xis
0
1
2
3
4
5
6
0.20.3
0.4
0.20.10.1
0.30.4
0.4
0.5
0.5
0.6
abutment
geofoam compressible inclusion
0.20.4
0.2
superstructure

69
Integral-Abutment Bridges: Problems and Innovative Solutions Using EPS Geofoam and Other GeosyntheticsManhattan College Research Report No. CE/GE-00-2
εh (%)
0 2 4 6 8 10 12
Nor
ma
lize
d d
ep
th b
elo
w to
p o
f a
butm
en
t, z
/ H
0.0
0.1
0.2
0.3
0.4
0.5
0.6
0.7
0.8
0.9
1.0
Case 2aiCase 2aiiCase 2aiii
Figure 3.36. Case 2a: Horizontal Deformation of GeofoamCompressible Inclusion at Fourth Thermal Expansion Peak
∆ci/H (%)
0.0 0.1 0.2 0.3 0.4 0.5 0.6
0.0
0.1
0.2
0.3
0.4
0.5
0.6
0.7
0.8
0.9
1.0
(a) (b)
see (a)for legend

Integral-Abutment Bridges: Problems and Innovative Solutions Using EPS Geofoam and Other GeosyntheticsManhattan College Research Report No. CE/GE-00-2
70
Normalized lateral pressure, σh/patm
0.0 0.1 0.2 0.3 0.4 0.5 0.6
Nor
ma
lize
d de
pth
be
low
top
of a
but
me
nt, z
/ H
0.0
0.1
0.2
0.3
0.4
0.5
0.6
0.7
0.8
0.9
1.0
Case 2aiCase 2aiiCase 2aiiiCase 1a
Figure 3.37. Case 2a:Lateral Pressures at End of Fourth Thermal Cycle
at rest
active
passive
superstructure

71
Integral-Abutment Bridges: Problems and Innovative Solutions Using EPS Geofoam and Other GeosyntheticsManhattan College Research Report No. CE/GE-00-2
The redistribution of lateral pressures is more clearly understood from the stress-levelcontours, for Case 2aii only as before, shown in Figure 3.38. As at the end of the first thermalcycle (Figure 3.32), the stress conditions are complex. Only at the very top of the abutment dostresses even approach the isotropic condition (S = 0). Below that, vertical stresses remain largerthan the horizontal. The tendency toward an active failure (S = 1) toward the bottom of theabutment is evident.
With regard to displacements, at the top of the abutment there was no net horizontal movementrelative to the end of construction position. The abutment exhibited a net upward movement ofapproximately 5 mm (0.2 in) but the surface of the soil immediately behind the abutment had nonet settlement for a total difference in level (which would appear as a void under an approachslab or pavement settlement in the absence of a slab) of approximately 5 mm (0.2 in). Dependingon the subcase, the bottom of the abutment had a net outward movement (toward the left inFigure 3.21) that ranged from zero for Case 2aiii to 6 mm (0.2 in) for Case 2ai. The finaldistribution of deformations within the compression inclusion is shown in Figure 3.39.
3.3.3.9 End of Construction (Case 2b and Case 2a/2b Comparison). The first set ofresults examined is at the completion of the simulated construction of the bridge and associatedearthwork. The calculated lateral pressures are shown in Figure 3.40. Also shown in this figurefor relative comparison are the calculated results from Case 2aii (a geofoam compressibleinclusion of identical thickness but without reinforcement) and for absolute comparison are thetheoretical active and at-rest state pressures for a soil backfill/fill (from Case 1).
Figure 3.38. Case 2aii: Stress Levels at End of Fourth Thermal Cycle
Note: Both axes scaled in metres (1 m = 0.305 ft).
X axis
0 1 2 3 4 5 6 7 8 9 10 11 12 13 14 15
Y a
xis
0
1
2
3
4
5
6
0.2 0.20.1
0.3 0.30.4
0.4
0.5
0.5
0.6
0.6
0.2
0.7
abutment
geofoam compressible inclusion
0.80.60.4
superstructure

Integral-Abutment Bridges: Problems and Innovative Solutions Using EPS Geofoam and Other GeosyntheticsManhattan College Research Report No. CE/GE-00-2
72
εh (%)
0 2 4 6 8 10
Nor
ma
lize
d d
ep
th b
elo
w to
p o
f a
butm
en
t, z
/ H
0.0
0.1
0.2
0.3
0.4
0.5
0.6
0.7
0.8
0.9
1.0
Case 2aiCase 2aiiCase 2aiii
Figure 3.39. Case 2a: Horizontal Deformation of GeofoamCompressible Inclusion at End of Fourth Thermal Cycle
∆ci/H (%)
0.0 0.1 0.2 0.3 0.4 0.5
0.0
0.1
0.2
0.3
0.4
0.5
0.6
0.7
0.8
0.9
1.0
Case 2aiCase 2aiiCase 2aiii
(a) (b)
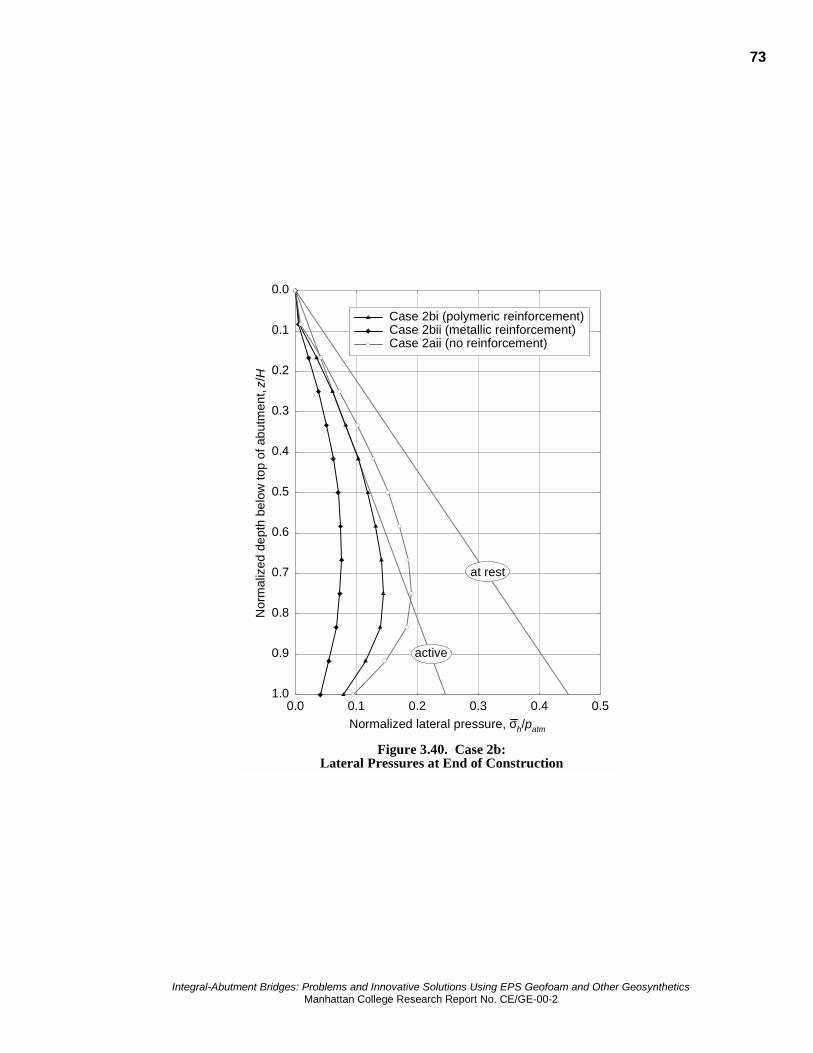
73
Integral-Abutment Bridges: Problems and Innovative Solutions Using EPS Geofoam and Other GeosyntheticsManhattan College Research Report No. CE/GE-00-2
Normalized lateral pressure, σh/patm
0.0 0.1 0.2 0.3 0.4 0.5
Nor
mal
ized
de
pth
be
low
top
of
abu
tmen
t, z
/ H
0.0
0.1
0.2
0.3
0.4
0.5
0.6
0.7
0.8
0.9
1.0
Case 2bi (polymeric reinforcement)Case 2bii (metallic reinforcement)Case 2aii (no reinforcement)
Figure 3.40. Case 2b:Lateral Pressures at End of Construction
active
at rest

Integral-Abutment Bridges: Problems and Innovative Solutions Using EPS Geofoam and Other GeosyntheticsManhattan College Research Report No. CE/GE-00-2
74
It is of interest to note that the results shown in Figure 3.40 are qualitatively consistent withthose determined by the author for the problem of a geofoam compressible inclusion plus tensilereinforcement behind a generic rigid, non-yielding wall (Horvath 1991a). In that earlier study, thereinforcement was modeled explicitly and in detail in accordance with the usual practice forFEM modeling of geosynthetically reinforced soil masses. This qualitative agreement betweenthe results in Horvath (1991a) and Figure 3.40 supports the use in the present study of thesimpler procedure for modeling the gross effects of geosynthetic tensile reinforcement.
In both Case 2b subcases, the lateral pressures are reduced from the reference geofoam-compressible-inclusion-only Case 2aii (β = 0.53) reflecting the expected benefit of usinggeosynthetic tensile reinforcement to stiffen the retained soil as it deforms horizontally againstthe compressible inclusion. Quantitatively, β = 0.42 and 0.23 for cases 2bi (polymericreinforcement) and 2bii (metallic reinforcement) respectively. Although the baseline Case 1alateral earth pressures are not shown in Figure 3.40, recall β = 0.99 for that case so there is asignificant reduction in horizontal resultant force compared to using soil backfill/fill alone.
Stress levels were not contoured for any Case 2b analyses. A decision was made beforehandthat, due to the approximate technique used to model the reinforcement, stress levels within the2-D finite elements representing the reinforced soil mass did not reflect actual conditions.
The deformation pattern within the geofoam compressible inclusion is shown in Figure 3.41.Strains are well within the operational range of the assumed resilient-EPS geofoam material.
εh (%)
0 2 4 6 8 10
Nor
mal
ized
de
pth
be
low
to
p o
f ab
utm
ent,
z/ H
0.0
0.1
0.2
0.3
0.4
0.5
0.6
0.7
0.8
0.9
1.0
Case 2biCase 2biiCase 2aii
Figure 3.41. Case 2b: Horizontal Deformation ofGeofoam Compressible Inclusion at End of Construction
∆ci/H (%)
0.0 0.1 0.2 0.3 0.4 0.5
0.0
0.1
0.2
0.3
0.4
0.5
0.6
0.7
0.8
0.9
1.0
Case 2biCase 2biiCase 2aii
(a) (b)

75
Integral-Abutment Bridges: Problems and Innovative Solutions Using EPS Geofoam and Other GeosyntheticsManhattan College Research Report No. CE/GE-00-2
3.3.3.10 Simplified Analytical Method for the ZEP-Wall Concept. As noted in Section2.2.2.5, using a geofoam compressible inclusion in synergistic combination with tensilereinforcement adjacent to a rigid, non-yielding earth retaining structure is called the Zero EarthPressure (ZEP) Wall concept24. The Case 2b analysis of an IAB abutment at the end ofconstruction and prior to any post-construction thermal loading that was discussed in thepreceding section can be viewed as an example application of this concept.
As with the REP-Wall concept that was discussed in detail in Section 3.3.3.3, there is a widerange of potential applications of the ZEP-Wall design concept (Horvath 1995b, 1996, 1998a). Inrecognition of this, the author previously presented a working hypothesis for an approximatemanual calculation method for ZEP-Wall analysis (Horvath 1997, 1998b). The utility of such amethod is that it would allow use of the ZEP-Wall concept in routine practice without resortingto the computational effort required by a FEM analysis. Thus it is of interest to digress from thecontinued discussion of results for the Case 2b analyses and compare the numerical resultsobtained in the present study to the author's approximate method for ZEP-Wall analysis. Theauthor's originally proposed method (referred to herein as Version 1.0) is outlined here not onlyfor the sake of completeness but to present and discuss modifications developed subsequent to itspublication. These modifications (referred to herein as Version 2.0) were also developed by theauthor with the intention of further simplifying and improving the methodology.
The conceptual framework of the author's simplified methods for ZEP-Wall analysis isillustrated in Figure 3.42. The actual problem solved is shown in Figure 3.42(a) and the model inFigure 3.42(b). The model is based on the assumption that the key behavioral issues toincorporate are the horizontal load-deformation behavior of both the geofoam compressibleinclusion and MSE mass (the earth retaining structure is assumed to be both rigid and non-
24 This term derives from the fact that, with an appropriate combination of compressible inclusion andreinforcement, the lateral pressures acting on an earth retaining structure can be as close to zero asrealistically possible. The concept was first identified by the author in Horvath (1990, 1991a).
Figure 3.42. Approximate ZEP-Wall Analysis Method: Model Concept
(a) (b)
�������������������������������������������������������������������������������������������������������������������������
������������������������������������������������������������������������������������������������������������������������������������������������������������������������������������������������������
��������������������������������������������������������������������������������������������������������������������������������������������������������������������������������������������������������������������������������������������������
earthretainingstructure
geofoamreinforced soil(MSE) mass
wallgeofoam“spring”
reinforced soil(MSE) “spring”
actual problem model

Integral-Abutment Bridges: Problems and Innovative Solutions Using EPS Geofoam and Other GeosyntheticsManhattan College Research Report No. CE/GE-00-2
76
yielding). Each problem component is modeled as a single spring (not necessarily linear) for thispurpose. This implies that only resultant forces are considered, not distributions of lateralpressures. Clearly, these two springs act in parallel and the unique solution to this problemoccurs when the force within and displacement of each spring are equal.
Conceptually and qualitatively, the problem and model are very simple. What remains to bedone is to define:
• the limiting force-displacement boundary conditions for each spring and
• the spring behavior, linear or nonlinear, between the boundary conditions.
The primary difficulty in application lies in quantifying the spring stiffnesses. There is also theinherent approximation that the behavior of the geofoam compressible inclusion and MSE masscan be reasonably modeled by single values of horizontal resultant force and horizontaldisplacement. The latter assumption is especially approximate as can be seen from the calculatedpattern of horizontal deformation of the geofoam compressible inclusion (the deformation patternof the MSE mass would have to be qualitatively identical) shown in Figure 3.41. Nevertheless,certain approximations are inevitable if the methodology is to be kept relatively simple.
The geofoam compressible inclusion spring is relatively easy to quantify as the stress-strain-time behavior of the resilient-EPS geofoam that would typically be used for ZEP-Wallapplications is satisfactorily known and predictable as shown in figures 3.2 and 3.4. Oneboundary condition is that the geofoam spring force is initially zero when the geofoam is placedin the ground and its horizontal compression is zero. The spring force increases as the geofoam iscompressed by the lateral earth pressure from the MSE mass. Thus the other boundary conditionis simply the maximum compression the geofoam compressible inclusion can tolerate. Forpractical applications this can assumed to be limitless as illustrated subsequently.
The reinforced soil (MSE) spring is more difficult to quantify. One boundary condition is whenthe MSE spring is fully compressed as would occur if the MSE mass were perfectly confined bya rigid, non-yielding wall in the absence of a compressible inclusion. Under such a condition theforce within the spring (which represents the horizontal resultant earth force, Ph) is at itsmaximum value, Ph(MAX). If the MSE spring is allowed to expand horizontally to some magnitudeof displacement, ∆ = ∆MSE, the spring force is zero as the reinforcements are fully mobilized withrespect to strain necessary to carry all the earth load. This is essentially what happens in a free-standing MSE wall (MSEW). A remaining issue is how the load-deformation behavior of theMSE mass varies between these two limiting conditions, i.e. linearly or non-linearly.
The unique solution to the problem (defined as Ph = 'hP , ∆ = ∆') occurs when horizontal
compression of the geofoam compressible inclusion equals the horizontal expansion of the MSEmass, and the horizontal resultant force is the same for both. This is illustrated in Figure 3.43.The following comments are made with regard to understanding this figure:
• The MSE spring is assumed for simplicity and in the absence of more-definitive knowledgeto be linear. It is most likely curved concave upward (as shown qualitatively) as unreinforcedsoil exhibits such curved behavior. Currently available information suggests that theassumption of linearity produces more conservative results compared to the presumed curvedbehavior shown.
• The geofoam compressible inclusion spring can be linear as shown in the figure or curveddepending on the specific material and product used. In the present study, the resilient-EPSgeofoam assumed was linear as shown in figures 3.2 and 3.4.

77
Integral-Abutment Bridges: Problems and Innovative Solutions Using EPS Geofoam and Other GeosyntheticsManhattan College Research Report No. CE/GE-00-2
• In the original Version 1.0 of the proposed method (Horvath 1997, 1998b), the vertical axisin a figure equivalent to Figure 3.43 was the parameter of lateral pressure, not resultant force.The assumed distribution of lateral pressure was a complex trapezoidal-shaped diagram thatwas found to be unwieldy to construct in practice because it required assumptions as to theparticular compaction equipment that would be used during earthwork operations. In themodified Version 2.0 presented for the first time in this report, the vertical axis has beenchanged to the horizontal resultant (earth) force, Ph. In addition, it is assumed that themaximum value of Ph, Ph(MAX), is equal to that in the normally consolidated at-rest state. Thismeans that Ph(MAX) =
*oP . Thus it is possible to use the normalized horizontal resultant (earth)
force, β (= Ph/*
oP ), as a variable as shown in Figure 3.43.
• For calculating the horizontal resultant force in the spring representing the geofoamcompressible inclusion, it was assumed that the average horizontal strain of the geofoam istwo-thirds of the maximum value. This was based on the results of the present study as wellas other, similar unpublished analyses by the author which always showed the curveddeformation patterns shown in Figure 3.41.
• The magnitude of ∆MSE was taken to be the maximum that would be expected for an MSEW,∆MSEW. In the absence of more definitive information, ∆MSEW can be estimated using empiricalrelationships, used previously in Version 1.0 of this method, that were developed fromMSEW research and observation. Specifically, for polymeric reinforcement ∆MSEW = H/75and for metallic reinforcement ∆MSEW = H/250. These relationships assume a reinforcementlength to wall height ratio, Lr/H, = 0.7 which was judged to be sufficiently close to the Lr/H =0.67 used in this study so that no correction was made. These empirical relationships yieldedvalues of ∆MSEW = 80 mm (3.1 in) and 24 mm (0.94 in) for the polymeric and metallicreinforcements respectively.
Figure 3.43. Approximate ZEP-Wall Analysis Method: Spring Stiffnesses
∆
β
∆MSE = ∆MSEW
1
reinforced soil (MSE) mass(possible behavior)
resilient-EPS geofoamcompressible inclusion
β’
∆’
reinforced soil (MSE) mass(assumed behavior)
00

Integral-Abutment Bridges: Problems and Innovative Solutions Using EPS Geofoam and Other GeosyntheticsManhattan College Research Report No. CE/GE-00-2
78
• The slopes of the two lines shown in Figure 3.43 that define the load-deformation behaviorof the MSE mass and geofoam compressible inclusion springs are the spring stiffnesses forthe model shown in Figure 3.42(b). These spring stiffnesses are equal to (1/∆MSEW)
and ( ) ( )[ ]*3/2 ocici PtHE ⋅⋅⋅⋅ for the MSE mass and geofoam compressible inclusion
respectively.
• Using these spring stiffnesses, the following simple algebraic equations can be written todefine the force-displacement relationships of the lines shown in Figure 3.43 representing thebehavior of the MSE mass and geofoam compressible inclusion:
∆
∆−=βMSEW
MSE 1 (3.12a)
*3
2
oci
cigeofoam
Pt
HE
⋅⋅∆⋅⋅
=β (3.12b)
• Solution to the problem consists of equating equations 3.12a and 3.12b to solve for either β =β' or ∆ = ∆' as shown graphically in Figure 3.43.
• If a lateral pressure distribution is desired for structural analysis of the earth retainingstructure, for simplicity the resultant force Ph (= β'⋅ *
oP ) can be distributed as a stress over the
face of the earth retaining structure using a classical triangular distribution even though thelikely distribution is curved as shown in Figure 3.40. Using a triangular lateral pressuredistribution means that the resultant force would be applied at a height of H/3 above thebottom of the earth retaining structure.
The above procedure was applied using the variables of this study. The calculated results areshown in Table 3.6. As can be seen, the current Version 2.0 of the author's simplified methodyields results in this case that are significantly greater than the FEM numerical results which isan error on the conservative side. However, given the tremendous difference in level of effortrequired between the two methods and the lack of any other alternatives the current version ofthe author's simplified method is believed to be useful in practice.
Table 3.6. Comparison of Calculated Results for ZEP-Wall Analysis Methods
ββββtype of reinforcement author’s simplified method
(Version 2.0)FEM
polymeric 0.75 0.42metallic 0.47 0.23
It is of interest to note that the conservatism of the author's simplified analytical method can bereduced by using a less-conservative estimate of the Young's modulus of the geofoamcompressible inclusion. For example, in the present study a modulus of 250 kN/m2 (5200 lb/ft2)was assumed. This corresponds to the rapid-loading curve shown in Figure 3.4. Some allowance
79
Integral-Abutment Bridges: Problems and Innovative Solutions Using EPS Geofoam and Other GeosyntheticsManhattan College Research Report No. CE/GE-00-2
could be made for the fact that backfilling/filling behind an abutment would take some time inactuality. If a modulus corresponding to say 100 hours (approximately four days) load durationwere chosen, a modulus of 150 kN/m2 (3100 lb/ft2) could be used. This would reduce thecalculated β values to 0.64 and 0.35 for the polymeric and metallic reinforcements respectively.Of course the FEM results using the lower modulus value would be less also but the point is stillthat the author's simplified method should always be used with a realistic estimate of geofoammodulus which, in this type of problem, could allow for some material creep.
Nevertheless, there is clearly room for improvement of the simplified analytical methodologydeveloped by the author. Further modifications to and improvement of this method should focuson developing and implementing empirical relationships for:
• estimating ∆MSEW and ∆MSE. It would be particularly useful if more-detailed relationships forestimating ∆MSEW could be developed that explicitly incorporate key parameters such asreinforcement and soil stiffnesses. At present, using a single empirical relationship for alltypes of polymeric reinforcement with no regard for type of reinforcement or soil; verticalspacing of reinforcement layers; and other key details likely produces a significant degree ofconservatism for many applications.
• approximating the possible curved relationship for a reinforced soil mass between β = 1 andβ = 0 in Figure 3.43.
• approximating the curved distribution of lateral pressures in lieu of resorting to thetraditional but incorrect triangular distribution.
3.3.3.11 First Thermal Contraction Peak (Case 2b and Case 2a/2b Comparison).The lateral pressures at the first thermal contraction peak are shown in Figure 3.44.Corresponding results from the reference Case 2aii without reinforcement are shown togetherwith the usual theoretical pressures. Significant additional reductions in the overall lateralpressures from the end of construction condition occurred (β = 0.28 and 0.09 for the polymericand metallic reinforcements respectively), especially along the upper portion of the abutmentwhere pressures dropped to zero and a small separation between the abutment and geofoam wascalculated. This is due to the fact that contraction of the bridge superstructure pulled the top ofthe abutment outward approximately 9 mm (0.4 in) as expected from theoretical calculations. Asin Case 1, the mode of abutment displacement during thermal contraction is primarily rotationabout its bottom with a small translation component. Overall, the use of reinforcement provided asignificant benefit compared to Case 2aii (compressible inclusion alone, β = 0.42) and thebaseline Case 1a (no geosynthetics, β = 0.68).
Horizontal deformations of the geofoam compressible inclusion are shown in Figure 3.45. Asexpected, the inclusion expanded from the end of construction (Figure 3.41), especially along theupper portion of the abutment. Note also that compression of the inclusion exists even along theupper portion of the abutment where the back of the abutment separated from the inclusion andno lateral pressure against the abutment exists. This is possible because the geofoam is a truesolid material with an inherent, stress-independent shear strength (unlike soil) and thus able topartially support the soil by itself and compress as a result.
An important observation is that the calculated settlement of the ground surface immediatelybehind the abutment was approximately zero for both Case 2b subcases which is less than any ofthe preceding Case 1 and Case 2a subcases. For both Case 2b subcases there was again indicationof a slight (of the order of 1 mm) net upward movement of the abutment out of the ground ascalculated for the preceding Case 1a and Case 2a subcases.

Integral-Abutment Bridges: Problems and Innovative Solutions Using EPS Geofoam and Other GeosyntheticsManhattan College Research Report No. CE/GE-00-2
80
Normalized lateral pressure, σh/patm
0.0 0.1 0.2 0.3 0.4 0.5
Nor
mal
ized
de
pth
be
low
top
of
abu
tmen
t, z
/ H
0.0
0.1
0.2
0.3
0.4
0.5
0.6
0.7
0.8
0.9
1.0
Case 2bi (polymeric reinforcement)Case 2bii (metallic reinforcement)Case 2aii (no reinforcement)
Figure 3.44. Case 2b:Lateral Pressures at First Thermal Contraction Peak
active
at rest

81
Integral-Abutment Bridges: Problems and Innovative Solutions Using EPS Geofoam and Other GeosyntheticsManhattan College Research Report No. CE/GE-00-2
εh (%)
0 2 4 6 8 10
No
rmal
ized
dep
th b
elow
top
of a
butm
ent
, z/
H
0.0
0.1
0.2
0.3
0.4
0.5
0.6
0.7
0.8
0.9
1.0
Case 2biCase 2biiCase 2aii
Figure 3.45. Case 2b: Horizontal Deformation of GeofoamCompressible Inclusion at First Thermal Contraction Peak
∆ci/H (%)
0.0 0.1 0.2 0.3 0.4 0.5
0.0
0.1
0.2
0.3
0.4
0.5
0.6
0.7
0.8
0.9
1.0
Case 2biCase 2biiCase 2aii
(a) (b)

Integral-Abutment Bridges: Problems and Innovative Solutions Using EPS Geofoam and Other GeosyntheticsManhattan College Research Report No. CE/GE-00-2
82
3.3.3.12 First Thermal Expansion Peak (Case 2b and Case 2a/2b Comparison).The calculated lateral pressures at the first thermal expansion peak are shown in Figure 3.46together with the results from the reference Case 2aii and the theoretical active, normallyconsolidated at-rest and passive states. Overall, the normalized horizontal resultant forces are β =0.59 and 0.44 for the polymeric (Case 2bi) and metallic (Case 2bii) reinforcements respectively.These are below the reference Case 2aii without reinforcement (β = 0.76) and well below theCase 1a baseline value (β = 1.5) suggesting that the use of reinforcement together with thegeofoam compressible inclusion has some benefit (at least along the lower two thirds of theabutment) even though reinforcement alone would have no theoretical benefit when a reinforcedsoil mass is loaded in compression parallel to the orientation of the reinforcements.
The patterns of deformation within the compressible inclusion are shown in Figure 3.47.Although not apparent from the figure, most of the horizontal movement of the abutment (amaximum of approximately 10 mm (0.4 in) at the top) was accommodated by compression withinthe geofoam. Very little horizontal movement of the geofoam-soil interface occurred and whatlittle did occur was limited to the area near the top of the abutment. In addition, the groundsurface immediately behind the abutment rose upward approximately 2 mm (0.1 in) relative to itsposition immediately after construction and prior to any thermal loading.
Normalized lateral pressure, σh/patm
0.0 0.1 0.2 0.3 0.4 0.5
Nor
ma
lize
d d
ep
th b
elo
w to
p o
f a
butm
en
t, z
/ H
0.0
0.1
0.2
0.3
0.4
0.5
0.6
0.7
0.8
0.9
1.0
Case 2biCase 2biiCase 2aii
Figure 3.46. Case 2b:Lateral Pressures at First Thermal Eexpansion Peak
active
at rest
passive

83
Integral-Abutment Bridges: Problems and Innovative Solutions Using EPS Geofoam and Other GeosyntheticsManhattan College Research Report No. CE/GE-00-2
εh (%)
0 2 4 6 8 10
No
rmal
ize
d d
ep
th b
elo
w t
op
of
ab
utm
en
t, z
/ H
0.0
0.1
0.2
0.3
0.4
0.5
0.6
0.7
0.8
0.9
1.0
2bi2bii2aii
Figure 3.47. Case 2b: Horizontal Deformation of GeofoamCompressible Inclusion at First Thermal Expansion Peak
∆ci/H (%)
0.0 0.1 0.2 0.3 0.4 0.5
0.0
0.1
0.2
0.3
0.4
0.5
0.6
0.7
0.8
0.9
1.0
(a) (b)
see (a)for legend

Integral-Abutment Bridges: Problems and Innovative Solutions Using EPS Geofoam and Other GeosyntheticsManhattan College Research Report No. CE/GE-00-2
84
3.3.3.13 End of First Thermal Cycle (Case 2b and Case 2a/2b Comparison). Thecalculated lateral pressures at the end of the first full cycle of thermal loading are shown inFigure 3.48 together with the results from the reference Case 2aii and all three theoretical states.Overall, the normalized horizontal resultant forces are β = 0.41 and 0.23 for the polymeric (Case2bi) and metallic (Case 2bii) reinforcements respectively. These are essentially the same valuesobtained immediately after construction (Figure 3.40).
However, comparing resultant forces alone is deceptive in this case as there is a noticeabledifference in the distribution of lateral pressures before any thermal loads are applied (Figure3.40) and after one full thermal cycle (Figure 3.48) even though the resultant forces are the same.The buildup of lateral pressures near the top of the abutment after one thermal-load cycle isnoteworthy as is the fact that the presence of the reinforcement apparently has no effect in thisregard as the Case 2b (with reinforcement) and Case 2aii (no reinforcement) lateral pressures areessentially the same near the upper portion of the abutment as is apparent in Figure 3.48.
The patterns of horizontal deformation within the compressible inclusion are shown in Figure3.49.
Normalized lateral pressure, σh/patm
0.0 0.1 0.2 0.3 0.4 0.5
Nor
ma
lize
d d
ep
th b
elo
w to
p o
f a
butm
en
t, z
/ H
0.0
0.1
0.2
0.3
0.4
0.5
0.6
0.7
0.8
0.9
1.0
Case 2biCase 2biiCase 2aii
Figure 3.48. Case 2b:Lateral Pressures at End of First Thermal Cycle
active
at rest
passive

85
Integral-Abutment Bridges: Problems and Innovative Solutions Using EPS Geofoam and Other GeosyntheticsManhattan College Research Report No. CE/GE-00-2
εh (%)
0 2 4 6 8 10
No
rmal
ized
dep
th b
elo
w to
p o
f ab
utm
ent,
z/ H
0.0
0.1
0.2
0.3
0.4
0.5
0.6
0.7
0.8
0.9
1.0
2bi2bii2aii
Figure 3.49. Case 2b: Horizontal Deformation of GeofoamCompressible Inclusion at End of First Thermal Cycle
∆ci/H (%)
0.0 0.1 0.2 0.3 0.4 0.5
0.0
0.1
0.2
0.3
0.4
0.5
0.6
0.7
0.8
0.9
1.0
Case 2biCase 2biiCase 2aii
(a) (b)

Integral-Abutment Bridges: Problems and Innovative Solutions Using EPS Geofoam and Other GeosyntheticsManhattan College Research Report No. CE/GE-00-2
86
3.3.3.14 Fourth (Final) Thermal Expansion Peak (Case 2b and Case 2a/2bComparison). The calculated lateral pressures at the fourth and final thermal expansion peakare shown in Figure 3.50 together with the results from the reference Case 2aii and all threetheoretical states. Overall, the normalized horizontal resultant forces are β = 0.62 and 0.41 forthe polymeric (Case 2bi) and metallic (Case 2bii) reinforcements respectively. These areessentially the same values obtained at the first expansion peak (Figure 3.46) and with a similardistribution of lateral pressures, i.e. roughly uniform in magnitude with depth.
The results for Case 2bii with metallic reinforcement were judged to be somewhat questionablebecause the distribution of lateral pressures exhibited some qualitative differences from Case 2bias well as a somewhat erratic pattern. As discussed in Section 3.3.2.5, this may reflect anaccumulation of problems with the way in which the nodal-link elements used to model thereinforcements were activated and deactivated during thermal cycling in an attempt to preventthe reinforcements from acting in compression during thermal expansion load applications.
The patterns of horizontal deformation within the compressible inclusion are shown in Figure3.51. It is of interest to note that the ground surface immediately behind the abutment roseupward relative to its as-built position, especially for the metallic reinforcement case whereapproximately 10 mm (0.4 in) of net upward movement was calculated.
Normalized lateral pressure, σh/patm
0.0 0.1 0.2 0.3 0.4 0.5
No
rma
lize
d d
ep
th b
elo
w t
op
of
ab
utm
en
t, z/
H
0.0
0.1
0.2
0.3
0.4
0.5
0.6
0.7
0.8
0.9
1.0
Case 2biCase 2biiCase 2aii
Figure 3.50. Case 2b:Lateral Pressures at Fourth Thermal Expansion Peak
active
at rest
passive

87
Integral-Abutment Bridges: Problems and Innovative Solutions Using EPS Geofoam and Other GeosyntheticsManhattan College Research Report No. CE/GE-00-2
εh (%)
0 2 4 6 8 10 12
Nor
ma
lize
d d
ep
th b
elo
w to
p o
f a
butm
en
t, z
/ H
0.0
0.1
0.2
0.3
0.4
0.5
0.6
0.7
0.8
0.9
1.0
2bi2bii2aii
Figure 3.51. Case 2b: Horizontal Deformation of GeofoamCompressible Inclusion at Fourth Thermal Expansion Peak
∆ci/H (%)
0.0 0.1 0.2 0.3 0.4 0.5 0.6
0.0
0.1
0.2
0.3
0.4
0.5
0.6
0.7
0.8
0.9
1.0
2bi2bii2aii
(a) (b)

Integral-Abutment Bridges: Problems and Innovative Solutions Using EPS Geofoam and Other GeosyntheticsManhattan College Research Report No. CE/GE-00-2
88
3.3.3.15 End of Fourth (Final) Thermal Cycle (Case 2b and Case 2a/2bComparison). The final distribution of calculated lateral pressures after four thermal cycles isshown in Figure 3.52 together with the corresponding results from the reference Case 2aii and allthree theoretical states. Overall, the normalized horizontal resultant forces are β = 0.40 and 0.15for the polymeric (Case 2bi) and metallic (Case 2bii) reinforcements respectively.
The resultant force for Case 2bi (polymeric reinforcement) is essentially the same as at the endof construction. However, the distribution of lateral pressures is noticeably different between theend of construction (Figure 3.40) and the end of the fourth thermal cycle (Figure 3.52). There hasbeen a redistribution of lateral pressures with an increase in pressures near the upper portion ofthe abutment just behind the superstructure that is compensated by decreases in pressure withdepth. This is the same trend that was noted previously in Section 3.3.3.13 after just one thermalcycle. Qualitatively, this overall behavior is the same as that calculated previously for Case 2aiiwithout reinforcement.
Normalized lateral pressure, σh/patm
0.0 0.1 0.2 0.3 0.4 0.5
Nor
ma
lize
d de
pth
be
low
top
of a
but
me
nt,
z/H
0.0
0.1
0.2
0.3
0.4
0.5
0.6
0.7
0.8
0.9
1.0
Case 2biCase 2biiCase 2aii
Figure 3.52. Case 2b:Lateral Pressures at End of Fourth Thermal Cycle
active
at rest
passive

89
Integral-Abutment Bridges: Problems and Innovative Solutions Using EPS Geofoam and Other GeosyntheticsManhattan College Research Report No. CE/GE-00-2
The calculated result (β = 0.15) for Case 2bii (metallic reinforcement) is less than that at boththe end of construction and after one complete thermal-load cycle (β = 0.23 in both cases). Thisfact together with the qualitatively different and somewhat erratic distribution of lateral pressuresfor this subcase suggests that there may have been problems with the model used and numericalsolution. Hence the results for this subcase are considered questionable.
With regard to displacements, at the top of the abutment there was no residual net horizontalmovement relative to the end of construction position. The top of the abutment exhibited a netupward movement of 4 to 5 mm (0.2 in). The surface of the soil immediately behind theabutment also moved upward relative to its as-built position. The calculated magnitude ofmovement was only about 1 mm (0.04 in) for Case 2bi (polymeric reinforcement) butapproximately 8 mm (0.3 in) for Case 2bii (metallic reinforcement). The latter results areconsidered questionable in view of possible modeling problems for this subcase.
Depending on the subcase, the bottom of the abutment had a net outward (toward the left inFigure 3.21) movement of approximately 3 to 4 mm (0.1 in). The final distributions ofdeformation within the geofoam compression inclusion are shown in Figure 3.53.
εh (%)
0 2 4 6 8 10
No
rmal
ized
dep
th b
elow
top
of a
butm
ent
, z/ H
0.0
0.1
0.2
0.3
0.4
0.5
0.6
0.7
0.8
0.9
1.0
2bi2bii2aii
Figure 3.53. Case 2b: Horizontal Deformation of GeofoamCompressible Inclusion at End of Fourth Thermal Cycle
∆ci/H (%)
0.0 0.1 0.2 0.3 0.4 0.5
0.0
0.1
0.2
0.3
0.4
0.5
0.6
0.7
0.8
0.9
1.0
2bi2bii2aii
(a) (b)

Integral-Abutment Bridges: Problems and Innovative Solutions Using EPS Geofoam and Other GeosyntheticsManhattan College Research Report No. CE/GE-00-2
90
3.3.4 Case 2: Supplemental Analyses
3.3.4.1 Introduction. A series of supplemental analyses was also performed as part of Case2. These supplemental analyses were not part of the original scope of work that was developed atthe beginning of this study. The need for these additional analyses became apparent only after theoriginal Case 2 analyses were performed and analyzed.
The reason for the supplemental analyses was based on the unanticipated result of a physicalseparation between the geofoam compressible inclusion and the upper portion of the back of theabutment during thermal contraction loading when the bridge superstructure pulled the top of theabutment away from the retained soil. Essentially, the geofoam compressible inclusion acted as avertical cantilever wall supporting the upper portion of retained soil. Referring to Figure 3.21,this could occur because:
• The 2-D solid elements comprising the geofoam compressible inclusion were fully connectedso that the geofoam effectively acted as a continuous vertical wall 6 m (20 ft) high.
• The geofoam was modeled as an elastic solid with stress-independent strength (cohesionwithin the context of the Mohr-Coulomb failure criterion) so could carry load without limit.
• A continuous vertical column of 1-D interface elements was used between the back of theabutment and compressible inclusion. These elements allow tension in a direction normal(perpendicular) to the element and concomitant separation to occur although the calculatedmagnitude of separation is of questionable accuracy.
The author's opinion is that such behavior as calculated in the original Case 2 analyses is notrealistic. This is primarily because:
• The resilient-EPS geofoam products used in compressible inclusion applications typicallycome in panel-shaped pieces that are of the order of 1200 mm (4 ft) square. Although panelsare butted against adjacent ones as they are placed, they is always a physical discontinuitybetween panels. Thus there is no structural continuity to provide flexural resistance as wasimplied by the model used in this study. Therefore, in the particular problem examined forthis study it would be physically impossible for an actual geofoam compressible inclusion toact as a continuous cantilever wall 6 m (20 ft) high.
• Resilient-EPS geofoam panels used as a compressible inclusion behind an earth retainingstructure are often lightly glued25 to the exposed face of the earth retaining structure (back ofthe abutment in this case) so that they stay in place prior to backfilling/filling. Thus in anactual application it is unlikely that the geofoam compressible inclusion would physicallyseparate from the abutment as the abutment moved outward during thermal contractioncycles. If anything, the geofoam panels would tend to move with the abutment and physicallypull away from the retained soil.
Thus the conclusion reached after analyzing the original Case 2 analyses was that because theFEM model used originally did not reflect the way most geofoam compressible inclusions arecurrently installed using products that are currently available, certain behavior that deviated from
25 In practice, the type of glue used must be selected with care so as not to dissolve or otherwise attack the
EPS.

91
Integral-Abutment Bridges: Problems and Innovative Solutions Using EPS Geofoam and Other GeosyntheticsManhattan College Research Report No. CE/GE-00-2
that which would likely occur in reality was calculated. Because this erroneous behavior couldhave an impact on overall results and conclusions drawn from these results, a series of additional,supplemental analyses was performed. In these supplemental analyses (only cases 2aii, 2bi and2bii for the 200 mm (8 in) compressible inclusion with no reinforcement, polymericreinforcement and metallic reinforcement respectively were rerun), the geofoam compressibleinclusion was assumed to be perfectly attached to the back of the abutment. This was felt toovercome the most serious defect of the original model wherein separation between abutmentand geofoam could occur.
One might wonder why this revised model was not used originally as it better reflects reality.There are several reasons:
• The original model was used intentionally to keep things as simple and generic as possible.There is no reason conceptually why relatively long, continuous panels of EPS geofoamcould not be used and left unattached to the abutment. There are, in fact, EPS block molds inuse worldwide that produce EPS blocks 6 m (20 ft) long.
• The author was unaware of any prior FEM analyses of a geofoam compressible inclusionwith IABs. Thus the result of calculating separation between abutment and geofoamcompressible inclusion was not anticipated.
• For both absolute and relative comparison purposes, it is desirable to have calculatedhorizontal stresses (lateral pressures) directly at the back of the abutment. Use of 1-Dinterface elements along the back of the abutment directly provides the desired calculatedresults at that location. If the interface elements are fixed to the back of the abutment (tosimulate gluing the geofoam panels to the abutment), no slippage can occur and theircalculated results are meaningless. As a result, the closest calculated horizontal stresses arefor the first column of 2-D solid elements adjacent to (and to the right for the particular meshused in this study) the interface elements. In the problem studied, this column of 2-Delements is the geofoam compressible inclusion. Because solid-element stresses are alwaysan average value calculated at the geometric centroid of the element, they are not exactly thesame as those acting along the interface (back of the abutment in this case).
The comparison between results from the original and supplemental analyses is presented inthe following sections. Comparisons were made only at loading intervals that were judged to besignificant from the perspective of evaluating the sensitivity of calculated results to the FEMmodel details used.
3.3.4.2 Results at Maximum Thermal Contraction. The first set of comparisons are atthe maxima of thermal contraction. Both the first and fourth (final) contraction peaks wereevaluated. Note that in the prior assessments of both the Case 1 (Section 3.3.2) and original Case2 (Section 3.3.3) results only the first thermal contraction peak was discussed. This is becausethermal contraction of IABs is of relatively less interest geotechnically compared to the thermalexpansion and the full-cycle results. However, because of the calculated tendency of theabutment to physically separate from the retained soil it was judged of interest to examine boththe first and fourth contraction peaks to see if there was any difference in results.
The first subcase examined is Case 2aii which is the reference case of a geofoam compressibleinclusion without tensile reinforcement within the retained soil. Figure 3.54 shows the calculatedlateral pressures acting on the abutment for both the original and revised analyses as well as thetheoretical active state. Note that the plotted lateral pressures for the revised analyses are actually

Integral-Abutment Bridges: Problems and Innovative Solutions Using EPS Geofoam and Other GeosyntheticsManhattan College Research Report No. CE/GE-00-2
92
the average horizontal stress within the 2-D elements modeling the geofoam compressibleinclusion and are 200 mm (8 in) away from the actual abutment-geofoam interface. Thus thecomparison with the original results, which used the stresses from the 1-D interface elements atthe actual interface, is not quite exact but is as close as can be in this study. Nevertheless, theresults in Figure 3.54 indicate good agreement between both the original and revised analyses, aswell as agreement between results from the first and fourth contraction peaks.
These results suggest that:
• The calculated lateral pressures acting on the back of the abutment are not significantlyinfluenced by the assumed interface (frictional versus fixed) between the abutment andgeofoam compressible inclusion.
• There is no significant change in calculated lateral pressures between the first and fourthcontraction peaks.
Normalized lateral pressure, σh/patm
0.0 0.1 0.2 0.3
No
rmal
ized
dep
th b
elow
top
of a
butm
ent
, z/
H
0.0
0.1
0.2
0.3
0.4
0.5
0.6
0.7
0.8
0.9
1.0
revised analysis/1st peakoriginal analysis/1st peakrevised analysis/4th peakoriginal analysis/4th peak
Figure 3.54. Case 2aii: Effect of FEM Model on CalculatedLateral Pressures at Thermal Contraction Peaks
active

93
Integral-Abutment Bridges: Problems and Innovative Solutions Using EPS Geofoam and Other GeosyntheticsManhattan College Research Report No. CE/GE-00-2
However, the latter conclusion may be influenced by inherent limitations of the analyticalsoftware used for this study. Specifically, the revised analyses indicated that a physicalseparation (gap) of the order of several millimetres between the geofoam compressible inclusionand retained soil occurs near the top of the abutment at thermal contraction peaks. This is notunexpected as in the original analyses a similar gap was calculated between the back of theabutment and the geofoam compressible inclusion. This suggests that in an actual IAB the soil inthat region would tend to fail and slough downward to fill the gap. This would lead to both aprogressive buildup of lateral pressures due to progressive soil wedging as well as surfacesettlement immediately behind the abutment (the latter was actually observed in large-scale 1-gmodel testing by Reeves and Filz (2000)). This probable behavior is not well modeled by the 1-Dinterface elements and constitutive soil model used for the 2-D elements in this study. Thus theeffects of actual behavior may not have been adequately approximated in this study.
Figures 3.55 and 3.56 show the calculated lateral pressures acting on the back of the abutmentfor Case 2bi (polymeric reinforcement) and Case 2bii (metallic reinforcement) respectively.Again, results for both the original and revised analyses are shown together with the theoreticalactive state.
Normalized lateral pressure, σh/patm
0.0 0.1 0.2 0.3
No
rmal
ize
d d
ep
th b
elo
w t
op
of
ab
utm
en
t, z
/ H
0.0
0.1
0.2
0.3
0.4
0.5
0.6
0.7
0.8
0.9
1.0
revised analysis/1st peakoriginal analysis/1st peakrevised analysis/4th peakoriginal analysis/4th peak
Figure 3.55. Case 2bi: Effect of FEM Model on CalculatedLateral Pressures at Thermal Contraction Peaks
active

Integral-Abutment Bridges: Problems and Innovative Solutions Using EPS Geofoam and Other GeosyntheticsManhattan College Research Report No. CE/GE-00-2
94
These results with tensile reinforcement are qualitatively similar to those observed for Case2aii without reinforcement. Specifically:
• There is generally excellent agreement between each set of original and revised analyses interms of lateral earth pressures acting on the back of the abutment.
• For a given type of reinforcement, there is relatively no difference in lateral earth pressuresbetween the first and fourth contraction peaks.
• For the revised analyses, a gap of the order of several millimetres between the geofoamcompressible inclusion and retained soil was calculated for both types of reinforcement andfor both contraction peaks. Note that in this case, in an actual application this would notnecessarily result in the soil slumping down to fill the gap. This is because the geosyntheticreinforcement could be designed to include a wrapped face (a benefit of using polymericproducts) that would prevent this sloughing from occurring.
Normalized lateral pressure, σh/patm
0.0 0.1 0.2 0.3
No
rmal
ize
d d
ep
th b
elo
w t
op
of
ab
utm
en
t, z
/ H
0.0
0.1
0.2
0.3
0.4
0.5
0.6
0.7
0.8
0.9
1.0
revised analysis/1st peakoriginal analysis/1st peakrevised analysis/4th peakoriginal analysis/4th peak
Figure 3.56. Case 2bii: Effect of FEM Model on CalculatedLateral Pressures at Thermal Contraction Peaks
active

95
Integral-Abutment Bridges: Problems and Innovative Solutions Using EPS Geofoam and Other GeosyntheticsManhattan College Research Report No. CE/GE-00-2
3.3.4.3 Results at Maximum Thermal Expansion. The next set of comparisons was formaximum thermal expansion. Again, the results at both the first and fourth (final) peaks wereevaluated.
The lateral pressures acting on the back of the abutment are shown in figures 3.57 through 3.59inclusive for Case 2aii (no reinforcement), Case 2bi (polymeric reinforcement) and Case 2bii(metallic reinforcement) respectively. Calculated results from both the original and revisedanalyses are shown together with the theoretical active, at-rest and passive states. The results arequalitatively consistent as a group in that the revised analyses produced results always somewhatlower (as gauged by values of the dimensionless horizontal resultant force, β) than those fromthe original analyses. This is different than what was observed for the maximum contractionconditions. The reason for this is unknown.
Normalized lateral pressure, σh/patm
0.0 0.1 0.2 0.3 0.4 0.5 0.6 0.7
Nor
ma
lize
d de
pth
be
low
top
of a
but
me
nt, z
/ H
0.0
0.1
0.2
0.3
0.4
0.5
0.6
0.7
0.8
0.9
1.0
revised analysis/1st peakoriginal analysis/1st peakrevised analysis/4th peakoriginal analysis/4th peak
Figure 3.57. Case 2aii: Effect of FEM Model on CalculatedLateral Pressures at Thermal Expansion Peaks
at rest
active
passive

Integral-Abutment Bridges: Problems and Innovative Solutions Using EPS Geofoam and Other GeosyntheticsManhattan College Research Report No. CE/GE-00-2
96
Normalized lateral pressure, σh/patm
0.0 0.1 0.2 0.3 0.4 0.5
No
rmal
ize
d d
ep
th b
elo
w t
op
of
ab
utm
en
t, z
/ H
0.0
0.1
0.2
0.3
0.4
0.5
0.6
0.7
0.8
0.9
1.0
revised analysis/1st peakoriginal analysis/1st peakrevised analysis/4th peakoriginal analysis/4th peak
Figure 3.58. Case 2bi: Effect of FEM Model on CalculatedLateral Pressures at Thermal Expansion Peaks
active
at rest
passive

97
Integral-Abutment Bridges: Problems and Innovative Solutions Using EPS Geofoam and Other GeosyntheticsManhattan College Research Report No. CE/GE-00-2
Normalized lateral pressure, σh/patm
0.0 0.1 0.2 0.3 0.4 0.5
Nor
ma
lize
d d
ep
th b
elo
w to
p o
f a
butm
en
t, z
/ H
0.0
0.1
0.2
0.3
0.4
0.5
0.6
0.7
0.8
0.9
1.0
revised analysis/1st peakoriginal analysis/4th peakrevised analysis/4th peakoriginal analysis/4th peak
Figure 3.59. Case 2bii: Effect of FEM Model on CalculatedLateral Pressures at Thermal Expansion Peaks
active
at rest
passive

Integral-Abutment Bridges: Problems and Innovative Solutions Using EPS Geofoam and Other GeosyntheticsManhattan College Research Report No. CE/GE-00-2
98
3.3.4.4 Results at Ends of Thermal Cycles. The final set of comparisons was for theneutral temperature condition that corresponds to complete cycles of thermal loading. Again,both the first and fourth (final) cycle results were evaluated.
The lateral pressures acting on the back of the abutment are shown in figures 3.60 through 3.62inclusive for Case 2aii (no reinforcement), Case 2bi (polymeric reinforcement) and Case 2bii(metallic reinforcement) respectively. Calculated results from both the original and revisedanalyses are shown together with the theoretical active, at-rest and passive states. As with thethermal contraction maxima, the results from the revised analyses agree well with those from theoriginal analyses although less so for Case 2bii with the metallic reinforcement. This may be dueto errors with the way in which the reinforcement was modeled in this study.
Normalized lateral pressure, σh/patm
0.0 0.1 0.2 0.3 0.4 0.5 0.6
No
rmal
ize
d d
ep
th b
elo
w t
op
of
ab
utm
en
t, z
/ H
0.0
0.1
0.2
0.3
0.4
0.5
0.6
0.7
0.8
0.9
1.0
revised analysis/1st cycleoriginal analysis/1st cyclerevised analysis/4th cycleoriginal analysis/4th cycle
Figure 3.60. Case 2aii: Effect of FEM Model on CalculatedLateral Pressures at Ends of Thermal Cycles
at rest
active
passive

99
Integral-Abutment Bridges: Problems and Innovative Solutions Using EPS Geofoam and Other GeosyntheticsManhattan College Research Report No. CE/GE-00-2
Normalized lateral pressure, σh/patm
0.0 0.1 0.2 0.3 0.4 0.5
No
rmal
ized
dep
th b
elo
w to
p o
f ab
utm
ent,
z/ H
0.0
0.1
0.2
0.3
0.4
0.5
0.6
0.7
0.8
0.9
1.0
revised analysis/1st cycleoriginal analysis/1st cyclerevised analysis/4th cycleoriginal analysis/4th cycle
Figure 3.61. Case 2bi: Effect of FEM Model on CalculatedLateral Pressures at Ends of Thermal Cycles
active
at rest
passive

Integral-Abutment Bridges: Problems and Innovative Solutions Using EPS Geofoam and Other GeosyntheticsManhattan College Research Report No. CE/GE-00-2
100
Normalized lateral pressure, σh/patm
0.0 0.1 0.2 0.3 0.4 0.5
Nor
ma
lize
d d
ep
th b
elo
w to
p o
f a
butm
en
t, z
/ H
0.0
0.1
0.2
0.3
0.4
0.5
0.6
0.7
0.8
0.9
1.0
revised analysis/1st cycleoriginal analysis/1st cyclerevised analysis/4th cycleoriginal analysis/4th cycle
Figure 3.62. Case 2bii: Effect of FEM Model on CalculatedLateral Pressures at Ends of Thermal Cycles
active
at rest
passive

101
Integral-Abutment Bridges: Problems and Innovative Solutions Using EPS Geofoam and Other GeosyntheticsManhattan College Research Report No. CE/GE-00-2
3.3.4.5 Conclusions. Comparing the original and revised Case 2 analyses overall, theconclusions drawn are:
• It is always important to model the actual physical relationship between the abutment andgeofoam compressible inclusion as close to reality as possible. This relationship can varydepending on the specific geofoam material and product as well as construction details used.
• The overall lateral pressures are relatively insensitive to the two different models used forthe abutment-geofoam compressible inclusion interface in the particular problem consideredin this study.
• Horizontal displacements of the retained soil near the top of the abutment appear to besignificantly affected by how the abutment, geofoam compressible inclusion and soilinteract. The potential for gaps developing between these components and soil sloughing intothese gaps has a significant effect on the recommendations made for practice as discussed indetail in Section 4 of this report.
3.3.5 Case 3: EPS-Block Geofoam as Lightweight Fill
3.3.5.1 Introduction. The primary focus of Case 3 was evaluating the benefit(s) of partialreplacement of the retained soil with EPS-block geofoam acting as a lightweight fill. Two groupsof analyses, Case 3a and Case 3b, were investigated, with two subcases (3ai and 3aii, 3bi and3bii respectively) within each group for a total of four design alternatives investigated in Case 3.
The common element between all four subcases was that an assemblage of EPS blocks wasassumed to be placed behind the abutment as shown conceptually in Figure 2.8(b). The onlydifference between the Case 3a and Case 3b analyses was in Case 3a the EPS blocks wereassumed to be placed in direct contact with the back of the abutment. In Case 3b, a geofoamcompressible inclusion composed of 200 mm (8 in) of resilient EPS was placed between the backof the abutment and the relatively stiffer "normal" EPS-block geofoam used as lightweight fill tosee if this minor design variation had any significant effect on the calculated results. Therationale for using a geofoam compressible inclusion here is that EPS-block geofoam used aslightweight fill typically has mechanical (stress-strain-time) properties roughly equivalent to amedium-stiff clay. Consequently, during thermal expansion cycles of an IAB the lateral pressuresacting on the EPS blocks might be sufficiently large so as to exceed the elastic-limit stress of theEPS and cause immediate plastic (non-recoverable) deformation as well as possibly excessivecreep deformation. Thus a compressible inclusion composed of more-compressible EPS geofoammight be useful for preventing this.
Based on the experiences with the Case 2 analyses, all Case 3b analyses with a geofoamcompressible inclusion were performed assuming the inclusion was physically attached to theback of the abutment. This decision was not as straightforward as it may seem. Although thismodels what would typically be done in current practice with currently available geofoammaterials and products, and should predict any separation that may occur between the twodifferent types of geofoam (resilient EPS comprising the compressible inclusion and normal EPSfill) during thermal contraction, the lateral pressures acting on the back of the abutment aresomewhat less accurate because the average horizontal stress within the compressible inclusion(as opposed to the normal stresses in the 1-D interface elements) must be used for this purpose.However, it was judged better overall to use the revised FEM model with the geofoamcompressible inclusion attached to the abutment to better capture any separation effects duringthermal contraction. Note that the vertical interface between the geofoam compressible inclusion

Integral-Abutment Bridges: Problems and Innovative Solutions Using EPS Geofoam and Other GeosyntheticsManhattan College Research Report No. CE/GE-00-2
102
and geofoam lightweight fill was retained as a 1-D element frictional interface using theparameters in Table 3.3.
Within each group (Case 3a and Case 3b) of analyses, the only difference between analyses(Case 3ai versus Case 3aii, Case 3bi versus Case 3bii) was the relative size of the triangularwedge of EPS blocks. Specifically, the variable was the assumed magnitude of the angle θ (seeFigure 2.8(b)) formed by the geofoam lightweight fill-retained soil interface:
• Subcases 3ai and 3bi were called the "active wedge" alternatives that assumed only thetheoretical Coulomb active wedge of soil was replaced. The angle, θ, that the planar intra-soil Coulomb failure surface makes with the horizontal is 45° + φ/2 = 64° in this study. Thetheoretical Coulomb failure plane together with the actual mesh elements that were assumedto be composed of EPS-block geofoam lightweight fill are shown in Figure 3.63 (for Case3ai) and Figure 3.64 (for Case 3bi).
• Subcases 3aii and 3bii were called the "full wedge" alternatives that assumed θ = φ = 38°(i.e. the "angle of repose") based on the rationale, discussed in detail in Section 2.2.2.5, thatthe lateral earth pressure from the retained soil transmitted through the assemblage of EPSblocks to the abutment would be zero. The plane defined by this angle together with theactual mesh elements that were assumed to be composed of geofoam are shown in Figure3.65 (Case 3aii) and Figure 3.66 (Case 3bii).
Figure 3.63. Case 3ai: FEM Mesh (partial)
X axis
0 5 10 15
Y a
xis
0
1
2
3
4
5
6
Note: Both axes scaled in metres (1 m = 0.305 ft).
abutment
theoretical Coulomb failure plane foractive earth pressure state
cross-hatched elements modeled asEPS-block geofoam lightweight fill
superstructure

103
Integral-Abutment Bridges: Problems and Innovative Solutions Using EPS Geofoam and Other GeosyntheticsManhattan College Research Report No. CE/GE-00-2
Figure 3.64. Case 3bi: FEM Mesh (partial)
X axis
0 5 10 15
Y a
xis
0
1
2
3
4
5
6
Note: Both axes scaled in metres (1 m = 0.305 ft).
abutment
theoretical Coulomb failure plane foractive earth pressure state
cross-hatched elements modeled asEPS-block geofoam lightweight fill
superstructure
resilient-EPS geofoamcompressible inclusion

Integral-Abutment Bridges: Problems and Innovative Solutions Using EPS Geofoam and Other GeosyntheticsManhattan College Research Report No. CE/GE-00-2
104
Figure 3.65. Case 3aii: FEM Mesh (partial)
X axis
0 5 10 15
Y a
xis
0
1
2
3
4
5
6
Note: Both axes scaled in metres (1 m = 0.305 ft).
theoretical plane for angle of repose
superstructure
abutment
cross-hatched elements modeled asEPS-block geofoam lightweight fill

105
Integral-Abutment Bridges: Problems and Innovative Solutions Using EPS Geofoam and Other GeosyntheticsManhattan College Research Report No. CE/GE-00-2
Figure 3.66. Case 3bii: FEM Mesh (partial)
X axis
0 5 10 15
Y a
xis
0
1
2
3
4
5
6
Note: Both axes scaled in metres (1 m = 0.305 ft).
abutment
cross-hatched elements modeled asEPS-block geofoam lightweight fill
superstructure
resilient-EPS geofoamcompressible inclusion
theoretical plane for angle of repose

Integral-Abutment Bridges: Problems and Innovative Solutions Using EPS Geofoam and Other GeosyntheticsManhattan College Research Report No. CE/GE-00-2
106
It is of interest to note that the stepped interface between the simulated EPS block lightweightfill and retained soil shown in figures 3.63 to 3.66 is actually a realistic approximation of whatwould occur in practice. This is due to the geometry of EPS blocks which have thicknesses(vertical (Y-axis) dimension in these figures) that typically range from 500 mm (20 in) to 1000mm (40 in) which is similar to the 500 mm (20 in) vertical dimension of the FEM elements usedin this study. Note also that the interfaces between the EPS blocks and retained soil wereassumed to be perfectly rough, i.e. no 1-D interface elements were used at these interfaces andthe 2-D solid elements for the adjacent EPS blocks and soil had full connectivity at the commonnodes. This was done primarily to keep the FEM mesh reasonably simple and was judged to be asuitable approximation in these analyses.
The various stages of the analyses at which the calculated Case 3 results were evaluated are thesame as used previously for cases 1 and 2, and are discussed in the following sections. As forCase 2, separate presentations are made for cases 3a and 3b. Comparisons between cases 3a and3b results are contained within the Case 3b sections.
Note that in all Case 3 plots of lateral pressure the values for the horizontal component of thetheoretical active, normally consolidated at-rest and passive states were assumed to be the sameas for Case 1. This was done to show a comparison to the baseline case of an all-soil backfill/fillretained by the abutment.
3.3.5.2 End of Construction (Case 3a). The first set of results examined is at thecompletion of the simulated construction of the bridge and associated earthwork. The calculatedlateral pressures acting on the back of the abutment are shown in Figure 3.67. Also shown in thisfigure for absolute comparative purposes are the theoretical active and normally consolidated at-rest state pressures for a soil backfill/fill (from Case 1) as well as the calculated results from thebaseline Case 1a.
In both cases, the lateral pressures are reduced significantly from the baseline Case 1a (β =0.99) reflecting the expected beneficial result from the use of the very low density EPS-blockgeofoam backfill/fill which has a density approximately 1% of that of soil. Quantitatively, β =0.56 and 0.30 for cases 3ai (active wedge) and 3aii (full wedge) respectively.
However, the results for the full-wedge Case 3aii were unexpectedly high in magnitude. This isbased on a comparison to the theoretical lateral pressure magnitude and distribution (shown as adashed line in Figure 3.67) that would be expected based on the current state of practice whichassumes:
• A normally consolidated at-rest lateral earth pressure exists within the upper 500 mm of soilthat is in direct contact with the back of the abutment.
• The vertical effective overburden stress from the 500 mm of soil sitting on top of the EPSblocks (9.9 kPa in this case) creates a uniformly distributed lateral pressure within the zonewhere the EPS blocks are in contact within the back of the abutment. The magnitude of thisuniform stress is typically taken to be one-tenth of the soil overburden stress orapproximately 1 kPa in this case.
• The lateral pressure from the geofoam itself is very small in magnitude and negligible.
• With reference to the geometry shown in Figure 3.65, the soil to the right of the geofoammass transmits no lateral earth pressure through the EPS blocks to the wall because the soil istheoretically self stable at its angle of repose.

107
Integral-Abutment Bridges: Problems and Innovative Solutions Using EPS Geofoam and Other GeosyntheticsManhattan College Research Report No. CE/GE-00-2
For these assumptions applied to the problem used in this study, β = 0.05 which is considerablyless in magnitude than the β = 0.30 calculated.
The author's opinion is that the calculated FEM results are too high compared to what wouldactually occur in practice. This is based on several reasons:
• Actual construction practice differs in several important ways from the modeling used in theFEM analyses performed for this study. In particular, for simplicity a given layer of elementsconsisting of both EPS blocks and soil was placed horizontally across the entire mesh (seefigures 3.3 and 3.65) in a given step of simulated construction. Thus each element in a givenlayer was perfectly tight against adjacent ones which had the effect of wedging horizontalstresses into the system (exacerbated to some extent by the assumed Ko = 1 within the soilelements at time of placement to simulate compaction effects). In practice, because the soiland EPS blocks would be placed separately horizontal stress relief would occur as each layerof material was placed.
• There is no convenient way in a FEM analysis to simulate the small gaps that will often existbetween EPS blocks as they are placed. Such gaps also contribute to horizontal stress relief.
0.0 0.1 0.2 0.3 0.4 0.5
Nor
mal
ized
de
pth
be
low
top
of
abu
tmen
t, z
/ H
0.0
0.1
0.2
0.3
0.4
0.5
0.6
0.7
0.8
0.9
1.0
Case 3aiCase 3aii (calculated)Case 3aii (theoretical)Case 1a
Figure 3.67. Case 3a:Lateral Pressures at End of Construction
at restactive
Normalized lateral pressure, σh/patm

Integral-Abutment Bridges: Problems and Innovative Solutions Using EPS Geofoam and Other GeosyntheticsManhattan College Research Report No. CE/GE-00-2
108
• Observations of actual EPS-block geofoam fills and structures support the theoretical lateralpressure diagram shown by the dashed line in Figure 3.67 (Horvath 1995b).
Despite the presumed errors in the calculated FEM results, the model used for this study wasjudged to be the best that could be used with a reasonable level of computational effort.Therefore, it was decided to proceed with the assessment of the Case 3 results based on theassumption that the results would at least provide insight into the relative changes that occurduring thermal loading. However, it is clear that future numerical modeling of this and similarproblems needs to address the issue of simulating construction more rigorously.
3.3.5.3 First Thermal Contraction Peak (Case 3a). The lateral pressures at the firstthermal contraction peak are shown in Figure 3.68. Corresponding results from the baseline Case1a are shown together with the theoretical pressures. Significant reductions overall from the endof construction condition occur (β = 0.33 and 0.12 for the active and full wedges respectively),especially along the upper portion of the abutment where pressures drop to zero and a smallseparation between the abutment and geofoam was calculated. This is due to the fact thatcontraction of the bridge superstructure pulled the top of the abutment outward approximately 9mm (0.4 in) as expected from theoretical calculations.
0.0 0.1 0.2 0.3 0.4 0.5
Nor
mal
ized
de
pth
be
low
top
of
abu
tmen
t, z
/ H
0.0
0.1
0.2
0.3
0.4
0.5
0.6
0.7
0.8
0.9
1.0
Case 3aiCase 3aiiCase 1a
Figure 3.68. Case 3a:Lateral Pressures at First Thermal Contraction Peak
at rest
active
Normalized lateral pressure, σh/patm

109
Integral-Abutment Bridges: Problems and Innovative Solutions Using EPS Geofoam and Other GeosyntheticsManhattan College Research Report No. CE/GE-00-2
The settlement of the ground surface immediately behind the abutment was small(approximately 3 mm (0.1 in)) for both Case 2a subcases.
3.3.5.4 First Thermal Expansion Peak (Case 3a). The calculated lateral earth pressuresat the first thermal expansion peak are shown in Figure 3.69 together with the results from thebaseline Case 1a and the theoretical active, normally consolidated at-rest and passive states.Overall, the normalized horizontal resultant forces are β = 0.90 and 0.56 for cases 3ai and 3aiirespectively. These are well below the Case 1a baseline value (β = 1.5) indicating that the EPSblocks are quite effective in reducing lateral pressures even in the compressive loading inducedby thermal expansion of the bridge superstructure.
As noted in Section 3.3.5.1, a concern when using EPS-block geofoam as lightweight fill withIABs is that the lateral pressures not exceed the elastic-limit stress of the EPS which is the defacto maximum allowable stress under service loads. The elastic limit stress for the 20 kg/m3
(1.25 lb/ft3) EPS assumed in this study is approximately 50 kPa (1000 lb/ft2) which would be alateral pressure, atmh p/σ , = 0.5. Referring to Figure 3.69, the calculated lateral pressures for
both the active wedge (Case 3ai) and full wedge (Case 3aii) subcases are well below this value.
0.0 0.1 0.2 0.3 0.4 0.5
No
rmal
ized
dep
th b
elo
w to
p o
f ab
utm
ent,
z/ H
0.0
0.1
0.2
0.3
0.4
0.5
0.6
0.7
0.8
0.9
1.0
Case 3aiCase 3aiiCase 1a
Figure 3.69. Case 3a:Lateral Pressures at First Thermal Expansion Peak
at restactive
Normalized lateral pressure, σh/patm
passive

Integral-Abutment Bridges: Problems and Innovative Solutions Using EPS Geofoam and Other GeosyntheticsManhattan College Research Report No. CE/GE-00-2
110
3.3.5.5 End of First Thermal Cycle (Case 3a). The calculated lateral pressures atcompletion of the first full thermal cycle are shown in Figure 3.70. The corresponding resultsfrom the baseline Case 1a as well as the usual theoretical pressures are shown also for absolutecomparison purposes. Overall, the resultant forces, β, = 0.57 and 0.32 for subcases 3ai and 3aiirespectively which are approximately the same as at the end of construction.
3.3.5.6 Fourth (Final) Thermal Expansion Peak (Case 3a). The calculated lateralpressures for this load are shown in Figure 3.71. The corresponding results from the baselineCase 1a as well as the usual theoretical pressures are shown also for absolute comparisonpurposes. The normalized resultant force, β, = 1.15 and 0.66 for subcases 3ai and 3aiirespectively which are 28% and 18% greater respectively than at the first thermal expansionpeak. However the lateral pressures are still significantly less than those for the baseline Case 1a(β = 1.8 at the fourth peak). Note that the lateral stresses for the active-wedge case (3ai) exceedthe elastic-limit stress of the EPS-block geofoam ( atmh p/σ = 0.5) at the bottom of the abutment.
0.0 0.1 0.2 0.3 0.4 0.5
No
rmal
ize
d d
ep
th b
elo
w t
op
of
ab
utm
en
t, z
/ H
0.0
0.1
0.2
0.3
0.4
0.5
0.6
0.7
0.8
0.9
1.0
Case 3aiCase 3aiiCase 1a
Figure 3.70. Case 3a:Lateral Pressures at End of First Thermal Cycle
at restactive
Normalized lateral pressure, σh/patm
passive

111
Integral-Abutment Bridges: Problems and Innovative Solutions Using EPS Geofoam and Other GeosyntheticsManhattan College Research Report No. CE/GE-00-2
0.0 0.1 0.2 0.3 0.4 0.5 0.6 0.7
No
rmal
ized
dep
th b
elo
w to
p o
f ab
utm
ent,
z/ H
0.0
0.1
0.2
0.3
0.4
0.5
0.6
0.7
0.8
0.9
1.0
Case 3aiCase 3aiiCase 1a
Figure 3.71. Case 3a:Lateral Pressures at Fourth Thermal Expansion Peak
at rest
active
Normalized lateral pressure, σh/patm
passive

Integral-Abutment Bridges: Problems and Innovative Solutions Using EPS Geofoam and Other GeosyntheticsManhattan College Research Report No. CE/GE-00-2
112
3.3.5.7 End of Fourth (Final) Thermal Cycle (Case 3a). The final distribution ofcalculated lateral pressures is shown in Figure 3.72. The corresponding results from the baselineCase 1a as well as the usual theoretical pressures are also shown for absolute comparisonpurposes. The normalized resultant forces, β, = 0.78 and 0.33 for subcases 3ai and 3aiirespectively which are 39% and 10% greater respectively than at the end of construction.However, the lateral pressures are still significantly less than those for the baseline Case 1a (β =1.3 after four thermal cycles).
With regard to displacements, the behavior of the two subcases (3ai and 3aii) was the same forall practical purposes. At the top of the abutment, there was essentially no net horizontalmovement compared to the initial post-construction position. The bottom of the abutment movedoutward 3 mm (0.1 in) relative its initial post-construction location.
With regard to vertical displacements, the top of the abutment exhibited a net upwardmovement of approximately 6 mm (0.2 in) while the surface of the soil immediately behind theabutment also had a net upward movement of 3 mm (0.1 in).
0.0 0.1 0.2 0.3 0.4 0.5 0.6
Nor
mal
ized
de
pth
be
low
top
of
abu
tmen
t, z
/ H
0.0
0.1
0.2
0.3
0.4
0.5
0.6
0.7
0.8
0.9
1.0
Case 3aiCase 3aiiCase 1a
Figure 3.72. Case 3a:Lateral Pressures at End of Fourth Thermal Cycle
at rest
active
Normalized lateral pressure, σh/patm
passive

113
Integral-Abutment Bridges: Problems and Innovative Solutions Using EPS Geofoam and Other GeosyntheticsManhattan College Research Report No. CE/GE-00-2
3.3.5.8 End of Construction (Case 3b and Case 3a/3b Comparison). The first set ofresults examined is at the completion of the simulated construction of the bridge and associatedearthwork. The calculated lateral pressures acting on the back of the abutment for Case 3b with ageofoam compressible inclusion between the back of the abutment and the EPS-geofoam blocksare shown in Figure 3.73. Note that the calculated results shown for the Case 3b subcases areactually the stresses within the compressible inclusion, not along the back of the abutment, forthe reasons discussed in sections 3.3.4.1 and 3.3.4.2. Also shown in this figure for absolutecomparative purposes are the theoretical active and normally consolidated at-rest state pressuresfor a soil backfill/fill (from Case 1) as well as the calculated results from the baseline Case 1a.
In both Case 3b subcases the horizontal resultant forces are reduced significantly (byapproximately 40%) from the corresponding Case 3a subcases where no compressible inclusionwas used (β = 0.33 and 0.17 for cases 3bi and 3bii respectively). This reduction can be seengraphically in Figure 3.74 where the results for comparable conditions with and without thecompressible inclusion are shown for the active wedge (Figure 3.74(a)) and full wedge (Figure3.74(b)). As can be seen, most of the resultant force reduction due to the use of the compressibleinclusion is the result of lateral pressure reduction near the bottom of the abutment.
0.0 0.1 0.2 0.3 0.4 0.5
Nor
ma
lize
d de
pth
be
low
top
of a
but
me
nt,
z/H
0.0
0.1
0.2
0.3
0.4
0.5
0.6
0.7
0.8
0.9
1.0
Case 3biCase 3biiCase 1a
Figure 3.73. Case 3b:Lateral Pressures at End of Construction
at rest
active
Normalized lateral pressure, σh/patm

Integral-Abutment Bridges: Problems and Innovative Solutions Using EPS Geofoam and Other GeosyntheticsManhattan College Research Report No. CE/GE-00-2
114
0.0 0.1 0.2 0.3
0.0
0.1
0.2
0.3
0.4
0.5
0.6
0.7
0.8
0.9
1.0
Case 3biCase 3ai
Figure 3.74. Case 3: Comparison of 3a/3b Resultsat End of Construction
0.0 0.1 0.2 0.3
0.0
0.1
0.2
0.3
0.4
0.5
0.6
0.7
0.8
0.9
1.0
Case 3biiCase 3aii
(a) (b)
Normalized lateral pressure, σh/patm
active wedge full wedge
Nor
mal
ized
de
pth
be
low
top
of
abu
tmen
t, z
/ H

115
Integral-Abutment Bridges: Problems and Innovative Solutions Using EPS Geofoam and Other GeosyntheticsManhattan College Research Report No. CE/GE-00-2
The patterns and magnitudes of compressive strain and displacement within the geofoamcompressible inclusion are shown in Figure 3.75. They are both qualitatively and quantitativelydifferent than those for an all-soil backfill under comparable loading (Figure 3.24). Thedeformation patterns in Figure 3.75 are both more uniform with depth and smaller in magnitudethan for the all-soil cases considered in the various Case 2 problems.
3.3.5.9 First Thermal Contraction Peak (Case 3b and Case 3a/3b Comparison).The lateral pressures on the back of the abutment for Case 3b at the first thermal contraction peakare shown in Figure 3.76. Also shown in this figure for absolute comparative purposes are thetheoretical active and normally consolidated at-rest state pressures for a soil backfill/fill (fromCase 1) as well as the calculated results from the baseline Case 1a.
In both Case 3b subcases the resultant forces are reduced significantly (by 50% or more) fromthe corresponding Case 3a subcases where no compressible inclusion was used (β = 0.22 and0.06 for cases 3bi and 3bii respectively). The reduction can be seen graphically in Figure 3.77where the results for comparable conditions with and without the compressible inclusion areshown for the active wedge (Figure 3.77(a)) and full wedge (Figure 3.77(b)). As can be seen inthis figure, essentially all of the lateral stress reduction provided by the compressible inclusionoccurs near the bottom of the abutment as it did for the end-of-construction condition.
εh (%)
0 2 4 6 8 10
0.0
0.1
0.2
0.3
0.4
0.5
0.6
0.7
0.8
0.9
1.0
Case 3biCase 3bii
Figure 3.75. Case 3b: Horizontal Deformation of GeofoamCompressible Inclusion at End of Construction
∆ci/H (%)
0.0 0.1 0.2 0.3 0.4 0.5
0.0
0.1
0.2
0.3
0.4
0.5
0.6
0.7
0.8
0.9
1.0
Case 3biCase 3bii
(a) (b)
Nor
mal
ized
de
pth
be
low
top
of
abu
tmen
t, z
/ H

Integral-Abutment Bridges: Problems and Innovative Solutions Using EPS Geofoam and Other GeosyntheticsManhattan College Research Report No. CE/GE-00-2
116
0.0 0.1 0.2 0.3 0.4 0.5
Nor
mal
ized
de
pth
be
low
top
of
abu
tmen
t, z
/ H
0.0
0.1
0.2
0.3
0.4
0.5
0.6
0.7
0.8
0.9
1.0
Case 3biCase 3biiCase 1a
Figure 3.76. Case 3b:Lateral Pressures at First Thermal Contraction Peak
at rest
active
Normalized lateral pressure, σh/patm

117
Integral-Abutment Bridges: Problems and Innovative Solutions Using EPS Geofoam and Other GeosyntheticsManhattan College Research Report No. CE/GE-00-2
0.0 0.1 0.2 0.3
0.0
0.1
0.2
0.3
0.4
0.5
0.6
0.7
0.8
0.9
1.0
Case 3biCase 3ai
Figure 3.77. Case 3: Comparison of 3a/3b Resultsat First Thermal Contraction Peak
0.0 0.1 0.2 0.3
0.0
0.1
0.2
0.3
0.4
0.5
0.6
0.7
0.8
0.9
1.0
Case 3biiCase 3aii
(a) (b)
Normalized lateral pressure, σh/patm
active wedge full wedge
Nor
ma
lize
d d
ep
th b
elo
w to
p o
f a
butm
en
t, z
/ H

Integral-Abutment Bridges: Problems and Innovative Solutions Using EPS Geofoam and Other GeosyntheticsManhattan College Research Report No. CE/GE-00-2
118
The patterns and magnitudes of compressive strain and displacement within the compressibleinclusion are shown in Figure 3.78. They are both qualitatively and quantitatively different thanthose for an all-soil backfill under comparable loading (Figure 3.27). The deformation pattern isboth more uniform with depth and smaller in magnitude than for the all-soil cases considered inthe various Case 2 problems.
The settlement of the ground surface immediately behind the abutment was approximately zerofor both Case 3b subcases. In addition, there was no indication of upward movement of theabutment as observed for other cases.
3.3.5.10 First Thermal Expansion Peak (Case 3b and Case 3a/3b Comparison).The lateral pressures on the back of the abutment for Case 3b at the first thermal expansion peakare shown in Figure 3.79. Also shown in this figure for absolute comparative purposes are thetheoretical active, normally consolidated at-rest and passive state pressures for a soil backfill/fill(from Case 1) as well as the calculated results from the baseline Case 1a.
εh (%)
0 2 4 6 8 10
0.0
0.1
0.2
0.3
0.4
0.5
0.6
0.7
0.8
0.9
1.0
Case 3biCase 3bii
Figure 3.78. Case 3b: Horizontal Deformation of GeofoamCompressible Inclusion at First Thermal Contraction Peak
∆ci/H (%)
0.0 0.1 0.2 0.3 0.4 0.5
0.0
0.1
0.2
0.3
0.4
0.5
0.6
0.7
0.8
0.9
1.0
Case 3biCase 3bii
(a) (b)
Nor
mal
ized
de
pth
be
low
top
of
abu
tmen
t, z
/ H

119
Integral-Abutment Bridges: Problems and Innovative Solutions Using EPS Geofoam and Other GeosyntheticsManhattan College Research Report No. CE/GE-00-2
In both Case 3b subcases the resultant forces are reduced significantly (by approximately 50%)from the corresponding Case 3a subcases where no compressible inclusion was used (β = 0.46and 0.29 for cases 3bi and 3bii respectively). The reduction can be seen graphically in Figure3.80 where the results for comparable conditions with and without the compressible inclusion areshown for the active wedge (Figure 3.80(a)) and full wedge (Figure 3.80(b)). Note that here thebenefit of using a compressible inclusion occurs over the full height of the abutment, not justtowards its bottom as was observed both after construction and at the first thermal contractionpeak.
As noted previously in Section 3.3.5.4 for Case 3a, one concern when using EPS-blockgeofoam as lightweight fill with IABs is that the maximum compressive stresses in any directionnot exceed the elastic-limit stress of the EPS which is essentially the maximum allowable stressunder service loads. Although not shown in Figure 3.79, the elastic-limit stress for the 20 kg/m3
(1.25 lb/ft3) EPS assumed in this study would be approximately 50 kPa (1000 lb/ft2) which wouldbe a normalized lateral pressure, atmh p/σ , = 0.5. As can be seen in Figure 3.79, the calculated
lateral pressures for both the active (Case 3bi) and full (Case 3bii) wedge subcases are well lessthan this value.
0.0 0.1 0.2 0.3 0.4 0.5
No
rma
lize
d d
epth
be
low
to
p o
f a
bu
tme
nt,
z/ H
0.0
0.1
0.2
0.3
0.4
0.5
0.6
0.7
0.8
0.9
1.0
Case 3biCase 3biiCase 1a
Figure 3.79. Case 3b:Lateral Pressures at First Thermal Expansion Peak
at rest
active
Normalized lateral pressure, σh/patm
passive
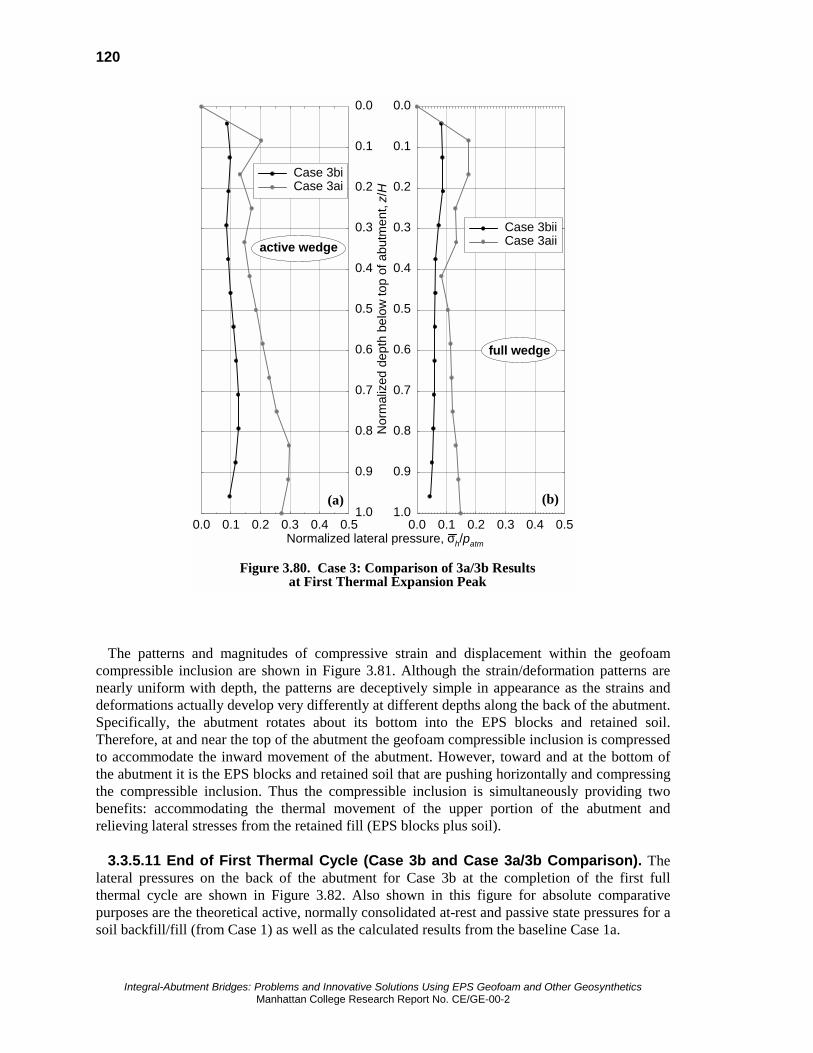
Integral-Abutment Bridges: Problems and Innovative Solutions Using EPS Geofoam and Other GeosyntheticsManhattan College Research Report No. CE/GE-00-2
120
The patterns and magnitudes of compressive strain and displacement within the geofoamcompressible inclusion are shown in Figure 3.81. Although the strain/deformation patterns arenearly uniform with depth, the patterns are deceptively simple in appearance as the strains anddeformations actually develop very differently at different depths along the back of the abutment.Specifically, the abutment rotates about its bottom into the EPS blocks and retained soil.Therefore, at and near the top of the abutment the geofoam compressible inclusion is compressedto accommodate the inward movement of the abutment. However, toward and at the bottom ofthe abutment it is the EPS blocks and retained soil that are pushing horizontally and compressingthe compressible inclusion. Thus the compressible inclusion is simultaneously providing twobenefits: accommodating the thermal movement of the upper portion of the abutment andrelieving lateral stresses from the retained fill (EPS blocks plus soil).
3.3.5.11 End of First Thermal Cycle (Case 3b and Case 3a/3b Comparison). Thelateral pressures on the back of the abutment for Case 3b at the completion of the first fullthermal cycle are shown in Figure 3.82. Also shown in this figure for absolute comparativepurposes are the theoretical active, normally consolidated at-rest and passive state pressures for asoil backfill/fill (from Case 1) as well as the calculated results from the baseline Case 1a.
0.0 0.1 0.2 0.3 0.4 0.5
0.0
0.1
0.2
0.3
0.4
0.5
0.6
0.7
0.8
0.9
1.0
Case 3biCase 3ai
Figure 3.80. Case 3: Comparison of 3a/3b Resultsat First Thermal Expansion Peak
0.0 0.1 0.2 0.3 0.4 0.5
0.0
0.1
0.2
0.3
0.4
0.5
0.6
0.7
0.8
0.9
1.0
Case 3biiCase 3aii
(a) (b)
Normalized lateral pressure, σh/patm
active wedge
full wedge
No
rmal
ize
d d
ep
th b
elo
w t
op
of
ab
utm
en
t, z
/ H

121
Integral-Abutment Bridges: Problems and Innovative Solutions Using EPS Geofoam and Other GeosyntheticsManhattan College Research Report No. CE/GE-00-2
εh (%)
0 2 4 6 8 10
0.0
0.1
0.2
0.3
0.4
0.5
0.6
0.7
0.8
0.9
1.0
3bi3bii
Figure 3.81. Case 3b: Horizontal Deformation of GeofoamCompressible Inclusion at First Thermal Expansion Peak
∆ci/H (%)
0.0 0.1 0.2 0.3 0.4 0.5
0.0
0.1
0.2
0.3
0.4
0.5
0.6
0.7
0.8
0.9
1.0
Case 3biCase 3bii
(a) (b)
No
rmal
ize
d d
ep
th b
elo
w t
op
of
ab
utm
en
t, z
/ H

Integral-Abutment Bridges: Problems and Innovative Solutions Using EPS Geofoam and Other GeosyntheticsManhattan College Research Report No. CE/GE-00-2
122
0.0 0.1 0.2 0.3 0.4 0.5
Nor
mal
ized
dep
th b
elow
top
of a
butm
ent,
z/H
0.0
0.1
0.2
0.3
0.4
0.5
0.6
0.7
0.8
0.9
1.0
Case 3biCase 3biiCase 1a
Figure 3.82. Case 3b:Lateral Pressures at End of First Thermal Cycle
at restactive
Normalized lateral pressure, σh/patm
passive

123
Integral-Abutment Bridges: Problems and Innovative Solutions Using EPS Geofoam and Other GeosyntheticsManhattan College Research Report No. CE/GE-00-2
In both Case 3b subcases the resultant forces returned to those that existed at the end ofconstruction (β = 0.33 and 0.17 for cases 3bi and 3bii respectively). By comparison, both Case3a subcases (without the compressible inclusion) were not only significantly larger in magnitudethan the Case 3b subcases but also exhibited slight increases in resultant forces after onecomplete thermal cycle.
3.3.5.12 Fourth (Final) Thermal Expansion Peak (Case 3b and Case 3a/3bComparison). The lateral pressures on the back of the abutment for Case 3b at the fourth andfinal thermal expansion peak are shown in Figure 3.83. Also shown in this figure for absolutecomparative purposes are the theoretical active, normally consolidated at-rest and passive statepressures for a soil backfill/fill (from Case 1) as well as the calculated results from the baselineCase 1a.
In both Case 3b subcases the resultant forces were essentially the same as at the first thermalexpansion peak (β = 0.45 and 0.28 for cases 3bi and 3bii respectively). By comparison, bothCase 3a subcases (without the compressible inclusion) exhibited significant increases in resultantforces between the first and fourth thermal expansion peaks, and were significantly larger inmagnitude than the corresponding Case 3b subcases.
0.0 0.1 0.2 0.3 0.4 0.5
Nor
ma
lize
d de
pth
be
low
top
of a
but
me
nt,
z/H
0.0
0.1
0.2
0.3
0.4
0.5
0.6
0.7
0.8
0.9
1.0
Case 3biCase 3biiCase 1a
Figure 3.83. Case 3b:Lateral Pressures at Fourth Thermal Expansion Peak
at rest
active
Normalized lateral pressure, σh/patm
passive

Integral-Abutment Bridges: Problems and Innovative Solutions Using EPS Geofoam and Other GeosyntheticsManhattan College Research Report No. CE/GE-00-2
124
3.3.5.13 End of Fourth (Final) Thermal Cycle (Case 3b and Case 3a/3bComparison). The lateral pressures on the back of the abutment for Case 3b at the end of thefourth and final thermal cycle are shown in Figure 3.84. Also shown in this figure for absolutecomparative purposes are the theoretical active, normally consolidated at-rest and passive statepressures for a soil backfill/fill (from Case 1) as well as the calculated results from the baselineCase 1a.
In both Case 3b subcases the resultant forces were essentially the same as at the end of both thefirst thermal cycle as well as end of construction (β = 0.33 and 0.17 for cases 3bi and 3biirespectively). By comparison, both Case 3a subcases (without the compressible inclusion) werenot only significantly larger in magnitude than the corresponding Case 3b subcases but exhibitedincreases in resultant forces between the end of construction and completion of four thermalcycles.
With regard to surface displacements, both the abutment and adjacent ground surface wereessentially at the same level (i.e. no net settlement or heave) as at the end of construction.
0.0 0.1 0.2 0.3 0.4 0.5 0.6
No
rmal
ize
d d
ep
th b
elo
w t
op
of
ab
utm
en
t, z
/ H
0.0
0.1
0.2
0.3
0.4
0.5
0.6
0.7
0.8
0.9
1.0
Case 3biCase 3biiCase 1a
Figure 3.84. Case 3b:Lateral Pressures at End of Fourth Thermal Cycle
at rest
active
Normalized lateral pressure, σh/patm
passive

125
Integral-Abutment Bridges: Problems and Innovative Solutions Using EPS Geofoam and Other GeosyntheticsManhattan College Research Report No. CE/GE-00-2
Section 4Conclusions and Recommendations
4.1 RESULTS FROM PRESENT STUDY
The broad goal of this study was to evaluate the efficacy of geosynthetics in eliminating or atleast reducing several significant chronic problems exhibited by IABs:
• increases in lateral earth pressures on the abutments during seasonal summer expansion ofthe bridge superstructure;
• incremental, permanent buildup (ratcheting) of lateral earth pressures on the abutments as aresult of annual thermal cycles of the bridge superstructure; and
• permanent settlement of the ground surface adjacent to the abutments as a result of annualthermal cycles of the bridge superstructure which will produce voids under approach slabs orsettlement of the pavement surface on approach embankments.
An assessment of the various alternatives studied should take into account each of these issues.Clearly, however, control of lateral pressures acting on the abutments of IABs is the predominantissue so is used to provide an initial assessment of alternatives.
The relative efficiency of the alternatives considered in this study in addressing the lateral-pressure problem can be most easily compared by using the parameter of normalized horizontalresultant force, β. This comparison is facilitated by assembling the β values previously presentedin Section 3 in tabular form as shown in Table 4.1. The values are given for each of the key loadstages discussed in detail in Section 3. The baseline Case 1a is highlighted as this is the de factoreference standard for the other 11 alternatives. The values of β obtained using classical earthpressure theories for the active, normally consolidated at-rest and passive states are also noted atthe bottom of Table 4.1 for comparative purposes.
Although 12 different alternatives were evaluated for this study, they can effectively begrouped into four categories of design strategies that would likely be considered in practice:
• Unreinforced soil backfill/fill (Case 1a). This is the current practice and baseline case.
• Geofoam compressible inclusion with unreinforced soil backfill/fill (Case 2a). This is theREP-Wall concept.
• Geofoam compressible inclusion with reinforced soil backfill/fill (Case 2b). This is the ZEP-Wall concept. It is likely that most applications in practice would use some type of face-wrapped polymeric reinforcement (geogrid or geotextile) which was Case 2bi in this study.
• Geofoam lightweight fill with a geofoam compressible inclusion (Case 3b). The full-wedgealternative, which was Case 3bii in this study, appears to be the more desirable.
Figure 4.1 shows the variation of β with load cycle for each of these four categories.

Integral-Abutment Bridges: Problems and Innovative Solutions Using EPS Geofoam and Other GeosyntheticsManhattan College Research Report No. CE/GE-00-2
126
Table 4.1. Comparison of Normalized Horizontal Resultant Forces, ββββ
normalized horizontal resultant force, ββββthermal condition
maximumcontraction
neutralmaximumexpansion
analysis case
1st
cycle4th
cycleend of
construction1st
cycle4th
cycle1st
cycle4th
cycle
1a unreinforced soil (baseline) 0.68 - 0.99 0.98 1.3 1.5 1.81bi polymeric 0.60 - 0.92 0.86 ? 1.4 ?1bii
reinforced soilmetallic 0.44 - 0.82 ? ? 1.3 ?
2ai 100 mm (4 in) 0.46 - 0.61 0.66 0.65 0.94 1.0
2aii 200 mm (8 in)0.42
(0.40)0.44
(0.38)0.53(-)
0.57(0.50)
0.56(0.50)
0.76(0.66)
0.79(0.63)
2aiii
geofoamcompressible
inclusion400 mm (16 in) 0.37 - 0.45 0.46 0.49 0.58 0.62
2bi polymeric0.28
(0.28)0.24
(0.26)0.42(-)
0.41(0.40)
0.40(0.38)
0.59(0.55)
0.62(0.52)
2bii
200 mm (8 in) geofoamcompressible inclusion
+ reinforcement metallic0.09
(0.09)0.03
(0.05)0.23(-)
0.23(0.20)
0.15(0.12)
0.44(0.37)
0.41(0.28)
3ai active 0.33 - 0.56 0.57 0.78 0.90 1.153aii
geofoam wedge aslightweight fill full 0.12 - 0.30 0.32 0.33 0.56 0.66
3bi active 0.22 - 0.33 0.33 0.33 0.46 0.453bii
geofoam fill wedge +200 mm (8 in) inclusion full 0.06 - 0.17 0.17 0.17 0.29 0.28
Notes
1. For reference, β = 0.55, 1.0 and 24 for the theoretical active, normally consolidated at-rest and passivestates respectively for an unreinforced soil backfill/fill.
2. All cases:• An entry of "-" indicates that β was not calculated for this combination of variables.• An entry of "?" indicates that the calculated result was omitted intentionally due to suspected error
due to the approximate way in which the reinforcement was modeled in this study.
3. Case 2:• Values not in parentheses are for the original analyses with a frictional interface between the
geofoam compressible inclusion and back of the abutment.• Values in parentheses are for the supplemental analyses with a fixed interface between the
geofoam compressible inclusion and back of the abutment.
4. Case 3:• All Case 3b analyses assumed a fixed interface between the geofoam compressible inclusion and
back of the abutment.

127
Integral-Abutment Bridges: Problems and Innovative Solutions Using EPS Geofoam and Other GeosyntheticsManhattan College Research Report No. CE/GE-00-2
Load cycle
0 1 2 3 4
Nor
ma
lize
d ho
rizo
nta
l re
sulta
nt
(ea
rth
) fo
rce
, β
0.0
0.5
1.0
1.5
2.0
Figure 4.1. Comparison of Normalized HorizontalResultant Forces for Various Design Alternatives
unreinforced soil(baseline - Case 1a)
REP Wall (Case 2aii)
ZEP Wall (Case 2bi)
lightweight fill + compressible inclusion(Case 3bii)
NC at-rest state
active state

Integral-Abutment Bridges: Problems and Innovative Solutions Using EPS Geofoam and Other GeosyntheticsManhattan College Research Report No. CE/GE-00-2
128
However, with regard to the settlement problem it appears that only two of these fouralternatives are effective at controlling settlements adjacent to the abutment:
• the ZEP Wall (Case 2bi) in which the synergistic combination of a face-wrapped reinforcedsoil mass plus resilient-EPS compressible inclusion effectively stiffens the soil againstsettlement. This is consistent with the findings of earlier independent research by Monleyand Wu (1993).
• the use of a full wedge of EPS-block geofoam lightweight fill with a resilient-EPS geofoamcompressible inclusion (Case 3bii). This is consistent with almost 30 years of experiencewith this material as a lightweight fill in which it has been found to be inherently self stable.
With reference to Figure 4.1, it is of interest to note that these two alternatives also produce thelowest horizontal forces on the abutment as well.
4.2 INTERIM SUGGESTIONS FOR PRACTICE
Overall, the results of this study confirm the author's original hypothesis that an effective, long-term design solution to integral abutment bridge problems must contain two complementaryelements:
• a highly compressible filler (compressible inclusion) placed between the back of theabutment and backfill/fill material to:! accommodate the seasonal thermal movements of the structurally monolithic bridge
superstructure and abutments,! reduce lateral pressures on the abutments under summer expansion of the superstructure
and! prevent the long-term ratcheting upward of lateral pressures on the abutments in general;
and
• an inherently self-stable fill mass behind the abutment to prevent the development of asettlement trough adjacent to the top of the abutment that can lead to failure of approachslabs or development of the "bump at the end of the bridge" on the approach embankment.
Of the alternatives considered in this study, there appear to be two viable means to achievethese goals simultaneously:
• the REP-Wall concept which uses a resilient-EPS geofoam compressible inclusion plus face-wrapped tensile reinforcement (most likely a geogrid or geotextile) of the soil backfill/fill or
• a full triangular wedge of EPS-block geofoam as lightweight fill with a resilient-EPSgeofoam compressible inclusion between the EPS blocks and abutment.
The selection should be based on both technical and cost considerations. It is likely that theREP-Wall alternative will be the more economical in general and should be evaluated first fortechnical acceptability on a given project. It is likely that the wedge of EPS-block geofoam fillwould be more expensive but more desirable for sites underlain with soft, compressible soilswhere it is necessary to limit global settlement and prevent deep-seated rotational failure of the

129
Integral-Abutment Bridges: Problems and Innovative Solutions Using EPS Geofoam and Other GeosyntheticsManhattan College Research Report No. CE/GE-00-2
approach embankment as well as limit lateral squeeze of the underlying soft soil which can causebuckling of deep foundations supporting the abutments.
It is worth noting that the geofoam compressible inclusion in both cases can easily be designedto be multi-functional and act as a thermally insulated chimney drain for ground water controlbehind the abutment in addition to serving its primary function as a compressible inclusion(Horvath 1995a, 1995b).
4.3 RECOMMENDATIONS FOR FUTURE STUDY
There is a high degree of confidence in the concepts developed for this study because theyutilize well-proven geosynthetic products in basic ways in which they are already known to besuccessful in practice. Nevertheless, good engineering practice dictates that these conceptsshould be validated by a comprehensive program consisting of physical testing as well asobservation of instrumented IABs that utilize either of the two designs suggested in Section 4.2.Both large-scale 1-g and small-scale centrifuge testing have proven to be viable physical testingmethodologies for IABs and there is no reason why both could not be utilized in future studies.
Development of reliable numerical models that better capture the hysteretic, ratchetingbehavior of soil should also be investigated, developed if necessary and calibrated using theresults of both the physical testing and case history observations. These numerical models,incorporated into appropriate finite-element or finite-difference computer software, should beused to develop simplified analytical methods that could be used in routine practice to determinethe required stiffness of the geofoam compressible inclusion and tensile reinforcement (whereused).
In the longer term, there are several additional geotechnical issues that should be studied. Thisincludes basic study of the fundamental behavior of IABs incorporating the suggested designstrategies discussed in Section 4.2 under seismic load and when fine-grain soils are used as abackfill/fill material. These studies should build on earlier work by Bathurst and Alfaro (1996)and Inglis et al. (1996) involving seismic loading with reinforced soil masses and EPS-geofoamcompressible inclusions respectively, as well as the existing body of work (Aytekin et al. 1993,Aytekin 1997, Brookes et al. 1995, Carder et al. 1980, Clayton et al. 1991, O'Connor and Taylor1994, Symons et al. 1989) involving fine-grain soil and earth retaining structures.

Integral-Abutment Bridges: Problems and Innovative Solutions Using EPS Geofoam and Other GeosyntheticsManhattan College Research Report No. CE/GE-00-2
130
This page intentionally left blank.

131
Integral-Abutment Bridges: Problems and Innovative Solutions Using EPS Geofoam and Other GeosyntheticsManhattan College Research Report No. CE/GE-00-2
Section 5References
Aytekin, M., Wray, W. K. and Vallabhan, C. V. G. (1993). "Transmitted swelling pressures onretaining structures", Unsaturated Soils, S. L. Houston and W. K. Wray (eds.), American Societyof Civil Engineers, New York, N.Y., U.S.A., pp. 32-43.
Aytekin, M. (1997). "Numerical modeling of EPS geofoam used with swelling soil", Geotextilesand Geomembranes, Elsevier Science Ltd., London, U.K., Vol. 15, Nos. 1-3, pp. 133-146.
Bathurst, R. J. and Alfaro, M. C. (1996). "Review of seismic design, analysis and performance ofgeosynthetic reinforced walls, slopes and embankments", Proceedings of the Third InternationalSymposium on Earth Reinforcement (IS-Kyushu ’96), Fukuoka, Kyushu, Japan.
Boscardin, M. D., Selig, E. T., Lin, R.-S. and Yang, G.-R. (1990). "Hyperbolic parameters forcompacted soil", Journal of Geotechnical Engineering, American Society of Civil Engineers,New York, N.Y., U.S.A., Vol. 116, No. 1, pp. 88-104.
Briaud, J.-L., James, R. W. and Hoffman, S. B. (1997). "Settlement of bridge approaches (thebump at the end of the bridge)", Synthesis of Highway Practice 234, National Academy Press,Washington, D.C., U.S.A., 75 pp.
Broms, B. B. and Ingleson, I. (1971). "Earth pressure against the abutments of a rigid framebridge", Géotechnique, The Institution of Civil Engineers, London, U.K., Vol. 21, No. 1, pp. 15-28.
Brookes, A. H., Carder, D. R. and Darley, P. (1995). "Earth pressures against an experimentalretaining wall backfilled with Lias clay", TRL Report 152, Transport Research Laboratory,Crowthorne, Berkshire, U.K.
Card, G. B. and Carder, D. R. (1993). "A literature review of the geotechnical aspects of thedesign of integral bridge abutments", Project Report 52, Transport Research Laboratory,Crowthorne, Berkshire, U.K.
Carder, D. R. and Card, G. B. (1997). "Innovative structural backfills to integral bridgeabutments", Project Report 290, Transport Research Laboratory, Crowthorne, Berkshire, U.K.
Carder, D. R., Murray, R. T. and Krawczyk, J. V. (1980). "Earth pressures against anexperimental retaining wall backfilled with silty clay", Laboratory Report 946, Transport andRoad Research Laboratory, Crowthorne, Berkshire, U.K.
Clayton, C. R. I., Symons, I. F. and Hiedra-Cobo, J. C. (1991). "The pressure of clay backfillagainst retaining structures", Canadian Geotechnical Journal, Vol. 28, No. 2, pp. 282-297.

Integral-Abutment Bridges: Problems and Innovative Solutions Using EPS Geofoam and Other GeosyntheticsManhattan College Research Report No. CE/GE-00-2
132
Clough, G. W. and Duncan, J. M. (1991). "Earth pressures", Chapter 6 in FoundationEngineering Handbook, H.-Y. Fang (ed.), Van Nostrand Reinhold, New York, N.Y., U.S.A., 2nd
edition.
Duncan, J. M., Clough, G. W. and Ebeling, R. M. (1990). "Behavior and design of gravity earthretaining structures", Design and Performance of Earth Retaining Structures, P. C. Lambe and L.A. Hansen (eds.), American Society of Civil Engineers, New York, N.Y., U.S.A., pp. 251-277.
Duncan, J. M., Williams, G. W., Sehn, A. L. and Seed, R. B. (1991). "Estimating earth pressuresdue to compaction", Journal of the Geotechnical Engineering Division, American Society ofCivil Engineers, New York, N.Y., U.S.A., Vol. 117, No. 12, pp. 1833-1847.
Ebeling, R. M., Peters, J. F. and Mosher, R. L. (1992). "Finite element analysis of slopes withlayer reinforcement", Stability and Performance of Slopes and Embankments-II, R. B. Seed andR. W. Boulanger (eds.), American Society of Civil Engineers, New York, N.Y., U.S.A., pp.1427-1443.
Edgar, T. V., Puckett, J. A. and D'Spain, R. B. (1989). "Effects of geotextiles on lateral pressureand deformation in highway embankments", Geotextiles and Geomembranes, Elsevier ScienceLtd., London, U.K., Vol. 8, No. 4, pp. 275-292.
England, G. L. (1994). "The performance and behaviour of biological filter walls as affected bycyclic temperature changes", Serviceability of Earth Retaining Structures, R. J. Finno (ed.),American Society of Civil Engineers, New York, N.Y., U.S.A., pp. 57-76.
England, G. L. and Dunstan, T. (1994). "Shakedown solutions for soil containing structures asinfluenced by cyclic temperatures - integral bridge and biological filter", Proceedings of theThird International Conference on Structural Engineering, Singapore.
England, G. L., Dunstan, T., Tsang, C. M., Mihajlovic, N. and Bazaz, J. B. (1995). "Ratchetingflow of granular materials", Static and Dynamic Properties of Gravelly Soils, M. D. Evans andR. J. Fragaszy (eds.), American Society of Civil Engineers, New York, N.Y., U.S.A., pp. 64-76.
Fang, Y.-S. and Ishibashi, I. (1985). "Static earth pressures with various wall movements",Journal of the Geotechnical Engineering Division, American Society of Civil Engineers, NewYork, N.Y., U.S.A., Vol. 112, No. 3, pp. 317-333.
"Foundations and earth structures" (1982). U. S. Navy Design Manual 7.2, U.S. GovernmentPrinting Office, Washington, D.C., U.S.A.
Handy, R. L. (1985). "The arch in soil arching", Journal of the Geotechnical EngineeringDivision, American Society of Civil Engineers, New York, N.Y., U.S.A., Vol. 111, No. 3, pp.302-318.
Harrop-Williams, K. O. (1989). "Geostatic wall pressures", Journal of the GeotechnicalEngineering Division, American Society of Civil Engineers, New York, N.Y., U.S.A., Vol. 115,No. 9, pp. 1321-1325.

133
Integral-Abutment Bridges: Problems and Innovative Solutions Using EPS Geofoam and Other GeosyntheticsManhattan College Research Report No. CE/GE-00-2
Horvath, J. S. (1990). "The use of geosynthetics to reduce lateral earth pressures on rigid walls;phase I: concept evaluation", Research Report No. CE/GE-90-2, Manhattan College, CivilEngineering Department, Bronx, N.Y., U.S.A.
Horvath, J. S. (1991a). "Using geosynthetics to reduce earth loads on rigid retaining structures",Proceedings - Geosynthetics '91, Industrial Fabrics Association International, St. Paul, Minn.,U.S.A., pp. 409-424.
Horvath, J. S. (1991b). "Using geosynthetics to reduce surcharge-induced stresses on rigid earthretaining structures", Transportation Research Record No. 1330, Transportation Research Board,Washington, D.C., U.S.A., pp. 47-53.
Horvath, J. S. (1995a). "Geoinclusion : a new, multi-functional geocomposite", GeotechnicalFabrics Report, Industrial Fabrics Association International, St. Paul, Minn., U.S.A., Vol. 13,No. 2, pp. 8-9.
Horvath, J. S. (1995b). "Geofoam geosynthetic", Horvath Engineering, P.C., Scarsdale, N.Y.,U.S.A.
Horvath, J. S. (1996). "The compressible inclusion function of EPS geofoam: an overview”,Proceedings; International Symposium on EPS Construction Method (EPS Tokyo '96), EPSConstruction Method Development Organization, Tokyo, Japan, pp. 71-81.
Horvath, J. S. (1997). "The compressible inclusion function of EPS geofoam", Geotextiles andGeomembranes, Elsevier Science Ltd., London, U.K., Vol. 15, Nos. 1-3, pp. 77-120.
Horvath, J. S. (1998a). "The compressible-inclusion function of EPS geofoam: an overview ofconcepts, applications, and products", Research Report No. CE/GE-98-1, Manhattan College,Civil Engineering Department, Bronx, N.Y., U.S.A.
Horvath, J. S. (1998b). "The compressible-inclusion function of EPS geofoam: analysis anddesign methodologies", Research Report No. CE/GE-98-2, Manhattan College, Civil EngineeringDepartment, Bronx, N.Y., U.S.A.
Humphrey, D. N., Whetten, N., Weaver, J., Recker, K. and Cosgrove, T. A. (1998). "Tire shredsas lightweight fill for embankments and retaining walls", Recycled Materials in GeotechnicalApplications, C. Viupulanandan and D. J. Elton (eds.), American Society of Civil Engineers,Reston, Va., U.S.A., pp. 51-65.
Inglis, D., Macleod, G., Naesgaard, E. and Zergoun, M. (1996). "Basement wall with seismicearth pressures and novel expanded polystyrene foam buffer layer", Proceedings of the 10th
Annual Symposium, Vancouver Geotechnical Society, Vancouver, B.C., Canada.
Karpurapu, R. and Bathurst, R. J. (1992). "Numerical investigation of controlled yielding of soilretaining wall structures", Geotextiles and Geomembranes, Elsevier Science Publishers Ltd.,London, U.K., Vol. 11, No. 2, pp. 115-131.
Koerner, R. M. (1998). "Designing with geosynthetics", Prentice Hall, Upper Saddle River, N.J.,U.S.A., 4th edition.

Integral-Abutment Bridges: Problems and Innovative Solutions Using EPS Geofoam and Other GeosyntheticsManhattan College Research Report No. CE/GE-00-2
134
McCarthy, D. F. (1988). "Essentials of soil mechanics and foundations: basic geotechnics",Prentice Hall, Englewood Cliffs, N. J., U.S.A., 3rd edition, 614 pp.
Monley, G. J. and Wu, J. T. H. (1993). "Tensile reinforcement effects on bridge-approachsettlement", Journal of Geotechnical Engineering, American Society of Civil Engineers, NewYork, N.Y., U.S.A., Vol. 119, No. 4, pp. 749-762.
Murphy, G. (1997). "The influence of geofoam creep on the performance of a compressibleinclusion", Geotextiles and Geomembranes, Elsevier Science Ltd., London, U.K., Vol. 15, Nos.1-3, pp. 121-131.
Murray, R. T. and Farrar, D. M. (1988). "Temperature distribution in reinforced soil retainingwalls", Geotextiles and Geomembranes, Elsevier Science Publishers Ltd., London, U.K., Vol. 7,Nos. 1 & 2, pp. 33-50.
Ng, C. W. W., Springman, S. and Norrish, A. R. M. (1998). "Centrifuge modeling of spread-baseintegral bridge abutments", Journal of Geotechnical and Geoenvironmental Engineering,American Society of Civil Engineers, Reston, Va., U.S.A., Vol. 124, No. 5, pp. 376-388.
O'Connor, K. and Taylor, R. N. (1994). "The swelling pressure of compacted clayey fill", ProjectReport 72, Transport Research Laboratory, Crowthorne, Berkshire, U.K.
Partos, A. M. and Kazaniwsky, P. M. (1987). "Geoboard reduces lateral earth pressures",Proceedings - Geosynthetics '87, Industrial Fabrics Association International, St. Paul, Minn.,U.S.A., pp. 628-639.
Reeves, J. N. and Filz, G. M. (2000). "Earth force reduction by a synthetic compressibleinclusion", report of research sponsored by GeoTech Systems Corporation and Virginia's Centerfor Innovative Technology, Virginia Tech, Department of Civil Engineering, Blacksburg, Va.,U.S.A., 57 pp.
Reid, R. A., Soupir, S. P. and Schaefer, V. R. (1998a). "Use of fabric reinforced soil walls forintegral abutment bridge end treatment", Proceedings of the Sixth International Conference onGeosynthetics, R. K. Rowe (ed.), Industrial Fabrics Association International, Roseville, Minn.,U.S.A., pp. 573-576.
Reid, R. A., Soupir, S. P. and Schaefer, V. R. (1998b). "Mitigation of void development underbridge approach slabs using rubber tire chips", Recycled Materials in Geotechnical Applications,C. Viupulanandan and D. J. Elton (eds.), American Society of Civil Engineers, Reston, Va.,U.S.A., pp. 37-50.
Sandford, T. C. and Elgaaly, M. (1993). "Skew effects on backfill pressures at frame bridgeabutments", Transportation Research Record No. 1415, National Academy Press, Washington,D.C., U.S.A., pp. 1-11.
Segrestin, P. and Jailloux, J.-M. (1988). "Temperature in soils and its effect on the aging ofsynthetic materials", Geotextiles and Geomembranes, Elsevier Science Publishers Ltd., London,U.K., Vol. 7, Nos. 1 & 2, pp. 51-69.
135
Integral-Abutment Bridges: Problems and Innovative Solutions Using EPS Geofoam and Other GeosyntheticsManhattan College Research Report No. CE/GE-00-2
Spangler, M. G. and Handy, R. L. (1982). "Soil engineering", Harper & Row, New York, N,Y.,U.S.A., 4th edition.
Symons, I. F., Clayton, C. R. I., and Darley, P. (1989). "Earth pressures against an experimentalretaining wall backfilled with heavy clay", Research Report 192, Transport and Road ResearchLaboratory, Crowthorne, Berkshire, U.K.
Timoshenko, S. P. and Gere, J. M. (1972). "Mechanics of materials", D. Van Nostrand Co., NewYork, N.Y., U.S.A.
Tscebotarioff, G. P. (1973). "Foundations, retaining and earth structures", McGraw-Hill, NewYork, N.Y., U.S.A., 2nd edition.
Ulrich, E. J. (1991). "Subgrade reaction in mat foundation design", Concrete International,American Concrete Institute, Detroit, Mich. U.S.A., April, pp. 41-50.

Integral-Abutment Bridges: Problems and Innovative Solutions Using EPS Geofoam and Other GeosyntheticsManhattan College Research Report No. CE/GE-00-2
136
This page intentionally left blank.

137
Integral-Abutment Bridges: Problems and Innovative Solutions Using EPS Geofoam and Other GeosyntheticsManhattan College Research Report No. CE/GE-00-2
Section 6Notation
6.1 DEFINITIONS
Ar = cross-sectional area of geosynthetic tensile reinforcementAs = cross-sectional area of bridge superstructure or a structural element in general
B = bulk modulus of a solid materialc = Mohr-Coulomb shear-strength parameter (cohesion)
ca = Mohr-Coulomb shear-strength parameter (adhesion) at interface of dissimilar materials
Eci = Young's modulus of compressible inclusion material or productEr = Young's modulus of geosynthetic tensile reinforcementEs = Young's modulus of bridge superstructure or a structural material in generalEti = initial tangent Young's modulus (hyperbolic constitutive model parameter for a solid
material)Et = tangent Young's modulus (hyperbolic constitutive model parameter for a solid material)
'cf = unconfined compressive strength of Portland-cement concrete
H = geotechnical height of a bridge abutment or earth retaining structure in general
K = hyperbolic constitutive model parameter for a solid material
Ka = coefficient of lateral earth pressure for the active stateKb = hyperbolic constitutive model parameter for a solid materialKh = coefficient of lateral earth pressure (general)Khh = horizontal component of the coefficient of lateral earth pressure, Kh
Kn = interface constitutive model parameterKni = interface constitutive model parameterKo = coefficient of lateral earth pressure for the at-rest stateKonc = coefficient of lateral earth pressure at rest, Ko, for the normally consolidated caseKp = coefficient of lateral earth pressure for the passive stateKs,i = interface constitutive model parameterKsi = interface constitutive model parameterKs,u = interface constitutive model parameterKsu = interface constitutive model parameterKtn = interface constitutive model parameterKtsi = interface constitutive model parameterKtsu = interface constitutive model parameter
Lo = original length of bridge superstructure or a structural element in generalLr = embedded length of geosynthetic tensile reinforcement/length of reinforced zone

Integral-Abutment Bridges: Problems and Innovative Solutions Using EPS Geofoam and Other GeosyntheticsManhattan College Research Report No. CE/GE-00-2
138
m = hyperbolic constitutive model parameter for a solid materialn = hyperbolic constitutive model parameter for a solid material
patm = atmospheric pressurePah = horizontal resultant (earth) force, Ph, for the active statePh = horizontal resultant (earth) force
'hP = horizontal resultant (earth) force, Ph, mobilized in ZEP-Wall applications
Ph(MAX) = maximum horizontal resultant (earth) force, Ph*
oP = reference horizontal earth force, Ph, for the normally consolidated at-rest state
Ps = force in a structural element
Rf = hyperbolic constitutive model parameter for a solid material
S = stress level
tci = thickness of compressible inclusion
X = horizontal axis for the FEM mesh
Y = vertical axis for the FEM mesh
z = depth relative to top of abutment
α = coefficient of thermal expansion of a solid material
β = normalized horizontal resultant (earth) forceβ' = normalized horizontal resultant (earth) force, β, mobilized in ZEP-Wall applicationsβa = normalized horizontal resultant (earth) force, β, at the active state
δ = Mohr-Coulomb strength parameter (friction angle) at interface of dissimilar materialsδ1 = δ at a normal stress of one atmosphere∆ = horizontal displacement (general)∆' = horizontal displacement, ∆, of the compressible inclusion-reinforced soil mass interface in
ZEP-Wall applications∆ci = horizontal compression of compressible inclusion∆MSE = horizontal displacement, ∆, of a reinforced soil mass necessary to fully mobilize
reinforcements∆MSEW = maximum free-field horizontal displacement, ∆, of a mechanically stabilized earth wall∆s = horizontal displacement of retained soil mass(∆s/H)a = minimum normalized horizontal displacement, ∆s, of soil necessary to achieve the
active earth pressure state∆sa = minimum horizontal displacement, ∆s, of retained soil mass necessary to mobilize the active
earth pressure state∆L = change in length of bridge superstructure or a structural element in general∆T = change in temperature of bridge superstructure or a structural element in general∆δ = change in δ for a ten-fold change in atmospheric pressure∆φ = change in φ for a ten-fold change in atmospheric pressure

139
Integral-Abutment Bridges: Problems and Innovative Solutions Using EPS Geofoam and Other GeosyntheticsManhattan College Research Report No. CE/GE-00-2
εh = horizontal strain of compressible inclusion
φ = Mohr-Coulomb strength parameter (angle of internal friction; a.k.a. "angle of repose" of soil)φ1 = φ at a confining stress of one atmosphere
γt = total unit weight of a materialγw = unit weight of water
λ = normalized compressible inclusion stiffness
σ = normal stress (general)
hσ = effective horizontal earth stress ("lateral earth pressure")
voσ = effective vertical stress under gravity (overburden) conditions
nσ = normal effective stress at an interface between dissimilar materials
1σ = major principal effective stress
3σ = minor principal effective stress
( )f31 σ−σ = principal effective stress difference (deviatoric stress) at failure
θ = angle of assumed planar interface between EPS-block geofoam lightweight fill and soil
τ = shear stress at interface between dissimilar materials
6.2 CONSTITUTIVE MODEL EQUATIONS
6.2.1 Two-Dimensional Solid Elements
n
atmatmti p
pKE
σ⋅⋅= 3 (6.1)
( ) ( )( ) ( )
2
3
31
sin2cos2
sin11
φ⋅σ⋅+φ⋅⋅
σ−σ⋅φ−⋅−⋅=
c
REE f
tit (6.2)
σ⋅⋅φ∆−φ=φatmp
3101 log (6.3)
m
atmatmb p
pKB
σ⋅⋅= 3 (6.4)
6.2.2 One-Dimensional Interface Elements
initial loading/reloading in shear:n
atm
nwissi p
KK
σ⋅γ⋅= , (6.5a)

Integral-Abutment Bridges: Problems and Innovative Solutions Using EPS Geofoam and Other GeosyntheticsManhattan College Research Report No. CE/GE-00-2
140
( )( )
2
tan1
δ⋅σ
τ⋅−⋅=
n
fsitsi
RKK (6.5b)
unloading in shear:n
atm
nwussu p
KK
σ⋅γ⋅= , (6.6a)
( )( )
2
tan1
δ⋅σ
τ⋅−⋅=
n
fsutsi
RKK (6.6b)
σ⋅⋅δ∆−δ=δatm
n
p101 log (6.7)
normal compressive loading:
σ⋅γ⋅==
atm
nwnnitn p
KKK (6.8)
normal tensile loading: Ktn is reduced to a small value

141
Integral-Abutment Bridges: Problems and Innovative Solutions Using EPS Geofoam and Other GeosyntheticsManhattan College Research Report No. CE/GE-00-2
Section 7Bibliography
7.1 MISCELLANEOUS LATERAL EARTH PRESSURE STUDIES
Aytekin, M., Wray, W. K., and Vallabhan, C. V. G., "Transmitted swelling pressures on retainingstructures", Unsaturated Soils, S. L. Houston and W. K. Wray (eds.), American Society of CivilEngineers, New York, N.Y., U.S.A., 1993, pp. 32-43.
Bathurst, R. J., "Instrumentation of geogrid reinforced soil walls", preprint paper No. 90-0453,Transportation Research Board 69th Annual Meeting, Washington, D.C., U.S.A., January 1990.
Brookes, A. H., Carder, D. R. and Darley, P., "Earth pressures against an experimental retainingwall backfilled with Lias clay", TRL Report 152, Transport Research Laboratory, Crowthorne,Berkshire, U.K., 1995.
Carder, D. R., Murray, R. T. and Krawczyk, J. V., "Earth pressures against an experimentalretaining wall backfilled with silty clay", Laboratory Report 946, Transport and Road ResearchLaboratory, Crowthorne, Berkshire, U.K., 1980.
Carder, D. R., Pocock, R. G. and Murray, R. T., "Experimental retaining wall facility - lateralstress measurements with sand backfill", Laboratory Report 766, Transport and Road ResearchLaboratory, Crowthorne, Berkshire U.K., 1977.
Clayton, C. R. I., Symons, I. F. and Hiedra-Cobo, J. C., "The pressure of clay backfill againstretaining structures", Canadian Geotechnical Journal, Vol. 28, No. 2, 1991, pp. 282-297.
Day, R. W., discussion of "Estimating earth pressures due to compaction" by J. M. Duncan, G.W. Williams, A. L. Sehn and R. B. Seed, Journal of the Geotechnical Engineering Division,American Society of Civil Engineers, New York, N.Y., U.S.A., Vol. 119, No. 7, 1993, pp. 1162.
Duncan, J. M., Clough, G. W. and Ebeling, R. M., "Behavior and design of gravity earthretaining structures", Design and Performance of Earth Retaining Structures, P. C. Lambe and L.A. Hansen (eds.), American Society of Civil Engineers, New York, N.Y., U.S.A., 1990, pp. 251-277.
Duncan, J. M. and Seed, R. B., "Compaction-induced earth pressures under Ko-conditions",Journal of the Geotechnical Engineering Division, American Society of Civil Engineers, NewYork, N.Y., U.S.A., Vol. 112, No. 1, 1986, pp. 1-22.
Duncan, J. M., Williams, G. W., Sehn, A. L. and Seed, R. B., "Estimating earth pressures due tocompaction", Journal of the Geotechnical Engineering Division, American Society of CivilEngineers, New York, N.Y., U.S.A., Vol. 117, No. 12, 1991, pp. 1833-1847.

Integral-Abutment Bridges: Problems and Innovative Solutions Using EPS Geofoam and Other GeosyntheticsManhattan College Research Report No. CE/GE-00-2
142
Duncan, J. M., Williams, G. W., Sehn, A. L. and Seed, R. B., closure to "Estimating earthpressures due to compaction", Journal of the Geotechnical Engineering Division, AmericanSociety of Civil Engineers, New York, N.Y., U.S.A., Vol. 119, No. 7, 1993, pp. 1172-1177.
Fang, Y.-S. and Ishibashi, I., "Static earth pressures with various wall movements", Journal ofthe Geotechnical Engineering Division, American Society of Civil Engineers, New York, N.Y.,U.S.A., Vol. 112, No. 3, 1985, pp. 317-333.
Filz, G. M. and Duncan, J. M., "An experimental and analytic study of earth loads on rigidretaining walls", research report, The Virginia Polytechnic Institute and State University,Department of Civil Engineering, Blacksburg, Va., U.S.A., 1992.
Filz, G. M. and Duncan, J. M., "Earth pressures due to compaction: comparison of theory withlaboratory and field behavior", Transportation Research Record No. 1526, TransportationResearch Board, Washington, D.C., U.S.A., 1996, pp. 28-37.
Ghaly, A., discussion of "Estimating earth pressures due to compaction" by J. M. Duncan, G. W.Williams, A. L. Sehn and R. B. Seed, Journal of the Geotechnical Engineering Division,American Society of Civil Engineers, New York, N.Y., U.S.A., Vol. 119, No. 7, 1993, pp. 1162-1165.
Handy, R. L., "The arch in soil arching", Journal of the Geotechnical Engineering Division,American Society of Civil Engineers, New York, N.Y., U.S.A., Vol. 111, No. 3, 1985, pp. 302-318.
Harrop-Williams, K. O., "Geostatic wall pressures", Journal of the Geotechnical EngineeringDivision, American Society of Civil Engineers, New York, N.Y., U.S.A., Vol. 115, No. 9, 1989,pp. 1321-1325.
Ishihara, K. and Duncan, J. M., "At-rest and compaction-induced earth pressures of moist soils",research report, The Virginia Polytechnic Institute and State University, Department of CivilEngineering, Blacksburg, Va., U.S.A., 1993.
Mesri, G. and Hayat, T. M., discussion of "Estimating earth pressures due to compaction" by J.M. Duncan, G. W. Williams, A. L. Sehn and R. B. Seed, Journal of the GeotechnicalEngineering Division, American Society of Civil Engineers, New York, N.Y., U.S.A., Vol. 119,No. 7, 1993, pp. 1165-1168.
Mesri, G., Hayat, T. M. and Shahien, M., discussion of "Estimating earth pressures due tocompaction" by J. M. Duncan, G. W. Williams, A. L. Sehn and R. B. Seed, Journal of theGeotechnical Engineering Division, American Society of Civil Engineers, New York, N.Y.,U.S.A., Vol. 119, No. 7, 1993, pp. 1168-1171.
O'Connor, K. and Taylor, R. N., "The swelling pressure of compacted clayey fill", Project Report72, Transport Research Laboratory, Crowthorne, Berkshire, U.K., 1994.
Peck, R. B., discussion of "Estimating earth pressures due to compaction" by J. M. Duncan, G.W. Williams, A. L. Sehn and R. B. Seed, Journal of the Geotechnical Engineering Division,American Society of Civil Engineers, New York, N.Y., U.S.A., Vol. 119, No. 7, 1993, pp. 1171-1172.

143
Integral-Abutment Bridges: Problems and Innovative Solutions Using EPS Geofoam and Other GeosyntheticsManhattan College Research Report No. CE/GE-00-2
Sehn, A. L. and Duncan, J. M., "Experimental study of earth pressures on retaining structures",research report, The Virginia Polytechnic Institute and State University, Department of CivilEngineering, Blacksburg, Va., U.S.A., 1990.
Symons, I. F. and Clayton, C. R. I., "Earth pressures on backfilled retaining walls", GroundEngineering, Thomas Telford Ltd., London, U.K., April 1992, pp. 26-34.
Symons, I. F., Clayton, C. R. I., and Darley, P., "Earth pressures against an experimentalretaining wall backfilled with heavy clay", Research Report 192, Transport and Road ResearchLaboratory, Crowthorne, Berkshire, U.K., 1989.
Yeh, S.-T. and Su, C. K., "EPS flow fill and structure fill for bridge abutment backfill", ReportNo. CDOT-R-SM-95-15, Colorado Department of Transportation, Denver, Colo., U.S.A., 1995,17 pp.
7.2 GENERAL CONCEPT OF CONTROLLED YIELDING
Ahmad, F., supplemental comments to "Influence of lateral boundary movements on earthpressure" by K. Z. Andrawes, A. McGown and F. Ahmad, Performance of Reinforced SoilStructures, A. McGown, K. Yeo, and K. Z. Andrawes (eds.), Thomas Telford Ltd., London,U.K., 1991, p. 381.
Andrawes, K. Z, supplemental comments to "Application of boundary yielding concept to fullscale reinforced and unreinforced soil walls" by K. Z. Andrawes, K. H. Loke, K. C. Yeo and R.T. Murray, Performance of Reinforced Soil Structures, A. McGown, K. Yeo, and K. Z.Andrawes (eds.), Thomas Telford Ltd., London, U.K., 1991, p. 93.
Andrawes, K. Z., Loke, K. H. and Murray, R. T., "The behaviour of reinforced soil wallsconstructed by different techniques", Grouting, Soil Improvement and Geosynthetics, R. H.Borden, R. D. Holtz, and I. Juran (eds.), American Society of Civil Engineers, New York, N.Y.,U.S.A., 1992, pp. 1237-1248.
Andrawes, K. Z., Loke, K. H., Yeo, K. C. and Murray, R. T., "Application of boundary yieldingconcept to full scale reinforced and unreinforced soil walls", Performance of Reinforced SoilStructures, A. McGown, K. Yeo, and K. Z. Andrawes (eds.), Thomas Telford Ltd., London,U.K., 1991, pp. 79-83.
Andrawes, K. Z., McGown, A. and Ahmad, F., "Influence of lateral boundary movements onearth pressure", Performance of Reinforced Soil Structures, A. McGown, K. Yeo, and K. Z.Andrawes (eds.), Thomas Telford Ltd., London, U.K., 1991, pp. 359-364.
Andrawes, K. Z., Yeo, K. C. and Loke, K. H., "Behaviour of geogrid reinforced soil wallssubjected to lateral boundary yielding", Retaining Structures, C. R. I. Clayton (ed.), ThomasTelford Ltd., London, U.K., 1993, pp. 549-558.
McGown, A., Andrawes, K. Z. and Murray, R. T., "Controlled yielding of the lateral boundariesof soil retaining structures", Geosynthetics for Soil Improvement, R. D. Holtz (ed.), AmericanSociety of Civil Engineers, New York, N.Y., U.S.A., 1988, pp. 193-210.

Integral-Abutment Bridges: Problems and Innovative Solutions Using EPS Geofoam and Other GeosyntheticsManhattan College Research Report No. CE/GE-00-2
144
McGown, A., Murray, R. T. and Andrawes, K. Z., "Influence of wall yielding on lateral stressesin unreinforced and reinforced fills", Research Report 113, Transport and Road ResearchLaboratory, Crowthorne, Berkshire, U.K., 1987.
Murray, R. T. and Farrar, D. M., "Reduction in lateral forces in retaining walls by controlledyielding", Project Report 242, Transport Research Laboratory, Crowthorne, Berkshire, U.K.,1997, 30 pp.
7.3 COMPRESSIBLE-INCLUSION APPLICATIONS
Aytekin, M., "Use of geofoam with expansive soil", Proceedings of the Second InternationalConference in Civil Engineering on Computer Applications, Research and Practice- ICCE-96,Vol. 2, University of Bahrain, Bahrain, 1996, pp. 541-546.
Aytekin, M., "Numerical modeling of EPS geofoam used with swelling soil", Geotextiles andGeomembranes, Elsevier Science Ltd., London, U.K., Vol. 15, Nos. 1-3, 1997, pp. 133-146.
Ebeling, R. M., Peters, J. F. and Mosher, R. L., "Finite element analysis of slopes with layerreinforcement", Stability and Performance of Slopes and Embankments-II, R. B. Seed and R. W.Boulanger (eds.), American Society of Civil Engineers, New York, N.Y., U.S.A., 1992, pp. 1427-1443.
Ebeling, R. M., Peters, J. F. and Mosher, R. L., "The role of non-linear deformation in the designof a reinforced soil berm at Red River u-frame lock no. 1", International Journal for Numericaland Analytical Methods in Geomechanics, Vol. 21, 1997, pp. 756-787.
Edgar, T. V., Puckett, J. A. and D'Spain, R. B., "Effects of geotextiles on lateral pressure anddeformation in highway embankments", Geotextiles and Geomembranes, Elsevier Science Ltd.,London, U.K., Vol. 8, No. 4, 1989, pp. 275-292.
Horvath, J. S., "The use of geosynthetics to reduce lateral earth pressures on rigid walls; phaseI: concept evaluation", Research Report No. CE/GE-90-2, Manhattan College, Civil EngineeringDepartment, Bronx, N.Y., U.S.A., 1990.
Horvath, J. S., "Using geosynthetics to reduce surcharge-induced stresses on rigid earth retainingstructures", preprint paper No. 910096, Transportation Research Board 70th Annual Meeting,Washington, D.C., U.S.A., January 1991.
Horvath, J. S., "Using geosynthetics to reduce earth loads on rigid retaining structures",Proceedings - Geosynthetics '91, Industrial Fabrics Association International, St. Paul, Minn.,U.S.A., 1991, pp. 409-424.
Horvath, J. S., "Developments in thick-geosynthetics technology: 1991 update", Research ReportNo. CE/GE-91-1, Manhattan College, Civil Engineering Department, Bronx, N.Y., U.S.A., 1991.
Horvath, J. S., "Using geosynthetics to reduce surcharge-induced stresses on rigid earth retainingstructures", Transportation Research Record No. 1330, Transportation Research Board,Washington, D.C., U.S.A., 1991, pp. 47-53.

145
Integral-Abutment Bridges: Problems and Innovative Solutions Using EPS Geofoam and Other GeosyntheticsManhattan College Research Report No. CE/GE-00-2
Horvath, J. S., discussion of "Tensile reinforcement effects on bridge-approach settlement" by G.J. Monley and J. T. H. Wu, Journal of Geotechnical Engineering, American Society of CivilEngineers, New York, N.Y., U.S.A., Vol. 121, No. 1, 1995, pp. 93-94.
Horvath, J. S., "Geofoam geosynthetic", Horvath Engineering, P.C., Scarsdale, N.Y., U.S.A.,1995.
Horvath, J. S., "The compressible inclusion function of EPS geofoam: an overview",Proceedings; International Symposium on EPS Construction Method (EPS Tokyo '96), EPSConstruction Method Development Organization, Tokyo, Japan, 1996, pp. 71-81.
Horvath, J. S., discussion of "Numerical study of parameters influencing the response of flexibleretaining walls" by H. H. Vaziri, Canadian Geotechnical Journal, Vol. 34, No. 1, 1997, p. 166.
Horvath, J. S., "The compressible inclusion function of EPS geofoam", Geotextiles andGeomembranes, Elsevier Science Ltd., London, U.K., Vol. 15, Nos. 1-3, 1997, pp. 77-120.
Horvath, J. S., discussion of "Analyses of active earth pressure against rigid retaining wallsubjected to different modes of movement" by H. Matsuzawa and H. Hazarika, Soils andFoundations, Japanese Geotechnical Society, Tokyo, Japan, Vol. 37, No. 4, 1997, p. 133.
Horvath, J. S., "The compressible-inclusion function of EPS geofoam: an overview of concepts,applications, and products", Research Report No. CE/GE-98-1, Manhattan College, CivilEngineering Department, Bronx, N.Y., U.S.A., 1998.
Horvath, J. S., "The compressible-inclusion function of EPS geofoam: analysis and designmethodologies", Research Report No. CE/GE-98-2, Manhattan College, Civil EngineeringDepartment, Bronx, N.Y., U.S.A., 1998.
Karpurapu, R. and Bathurst, R. J., "Numerical investigation of controlled yielding of soilretaining wall structures", Geotextiles and Geomembranes, Elsevier Science Publishers Ltd.,London, U.K., Vol. 11, No. 2, 1992, pp. 115-131.
Monley, G. J. and Wu, J. T. H., "Tensile reinforcement effects on bridge-approach settlement",Journal of Geotechnical Engineering, American Society of Civil Engineers, New York, N.Y.,U.S.A., Vol. 119, No. 4, 1993, pp. 749-762.
Monley, G. J. and Wu, J. T. H., closure to "Tensile reinforcement effects on bridge-approachsettlement", Journal of Geotechnical Engineering, American Society of Civil Engineers, NewYork, N.Y., U.S.A., Vol. 121, No. 1, 1995, pp. 96-97.
Murphy, G., "The influence of geofoam creep on the performance of a compressible inclusion",Geotextiles and Geomembranes, Elsevier Science Ltd., London, U.K., Vol. 15, Nos. 1-3, 1997,pp. 121-131.
Partos, A. M. and Kazaniwsky, P. M., "Geoboard reduces lateral earth pressures", Proceedings -Geosynthetics '87, Industrial Fabrics Association International, St. Paul, Minn., U.S.A., 1987, pp.628-639.

Integral-Abutment Bridges: Problems and Innovative Solutions Using EPS Geofoam and Other GeosyntheticsManhattan College Research Report No. CE/GE-00-2
146
Reeves, J. N. and Filz, G. M., "Earth force reduction by a synthetic compressible inclusion",report of research sponsored by GeoTech Systems Corporation and Virginia's Center forInnovative Technology, Virginia Tech, Department of Civil Engineering, Blacksburg, Va.,U.S.A., January 2000, 57 pp.
Rehnman, S. E. and Broms, B. B., "Lateral pressures on basement wall; results from full-scaletests", Proceedings of the Fifth European Conference on Soil Mechanics and FoundationEngineering, 1972, pp. 189-197.
Vaziri, H. H., closure to "Numerical study of parameters influencing the response of flexibleretaining walls", Canadian Geotechnical Journal, Vol. 34, No. 1, 1997, p. 167.
7.4 INTEGRAL-ABUTMENT BRIDGES
Bellin, J., "Bridge end panels on jointless bridges", Oregon Department of Transportation,Bridge Section, Salem, Ore., 1994, 2 pp.
Broms, B. B. and Ingleson, I., "Earth pressure against the abutments of a rigid frame bridge",Géotechnique, Vol. 21, No. 1, 1971, pp. 15-28.
Burke, M. P., "Bridge approach pavements, integral bridges, and cycle-control joints",Transportation Research Record No. 1113, Transportation Research Board, Washington, D.C.,U.S.A., 1987, pp. 54-65.
Burke, M. P., "Integral bridges", Transportation Research Record No. 1275, TransportationResearch Board, Washington, D.C., U.S.A., 1990, pp. 53-61.
Burke, M. P., "Semi-integral bridge: a concept whose time has come?", Proceedings of theHenderson Colloquium - Towards Joint-Free Bridge Decks, International Association for Bridgeand Structural Engineering, Pembroke College of Cambridge University, Cambridge, U.K., 1993.
Burke, M. P., "Integral bridges: attributes and limitations", Transportation Research Record No.1393, Transportation Research Board, Washington, D.C., U.S.A., 1993, pp. 1-8.
Cabrera, F. M. Y., "Italian joint free bridge decks", Proceedings of the Henderson Colloquium -Towards Joint-Free Bridge Decks, International Association for Bridge and StructuralEngineering, Pembroke College of Cambridge University, Cambridge, U.K., 1993.
Card, G. B. and Carder, D. R., "A literature review of the geotechnical aspects of the design ofintegral bridge abutments", Project Report 52, Transport Research Laboratory, Crowthorne,Berkshire, U.K., 1993.
Carder, D. R. and Card, G. B., "Innovative structural backfills to integral bridge abutments",Project Report 290, Transport Research Laboratory, Crowthorne, Berkshire, U.K., 1997.
Darley, P. and Carder, D. R., "Consultation document on suitability tests for stress absorbinglayers behind integral bridge abutments", Project Report 328, Transport Research Laboratory,Crowthorne, Berkshire, U.K., 1998.

147
Integral-Abutment Bridges: Problems and Innovative Solutions Using EPS Geofoam and Other GeosyntheticsManhattan College Research Report No. CE/GE-00-2
Darley, P., Carder, D. R. and Alderman, G. H., "Seasonal thermal effects on the shallowabutment of an integral bridge in Glasgow", Project Report 178, Transport Research Laboratory,Crowthorne, Berkshire, U.K., 1995.
Darley, P., Carder, D. R. and Barker, K. J., "Seasonal thermal effects over three years on theshallow abutment of an integral bridge in Glasgow", Project Report 344, Transport ResearchLaboratory, Crowthorne, Berkshire, U.K., 1998, 22 pp.
Emerson, M., "Bridge temperatures estimated from the shade temperature", TRRL Report 696,Transport and Road Research Laboratory, Crowthorne, Berkshire, U.K., 1976.
England, G. L., "The performance and behaviour of biological filter walls as affected by cyclictemperature changes", Serviceability of Earth Retaining Structures, R. J. Finno (ed.), AmericanSociety of Civil Engineers, New York, N.Y., U.S.A., 1994, pp. 57-76.
England, G. L. and Dunstan, T., "Shakedown solutions for soil containing structures asinfluenced by cyclic temperatures - integral bridge and biological filter", Proceedings of theThird International Conference on Structural Engineering, Singapore, 1994.
England, G. L., Dunstan, T., Tsang, C. M., Mihajlovic, N. and Bazaz, J. B., "Ratcheting flow ofgranular materials", Static and Dynamic Properties of Gravelly Soils, M. D. Evans and R. J.Fragaszy (eds.), American Society of Civil Engineers, New York, N.Y., U.S.A., 1995, pp. 64-76.
Greimann, L. F., Abendroth, R. E., Johnson, D. E. and Ebner, P. B., "Pile design and tests forintegral abutment bridges", report to Iowa Department of Transportation Project HR-273, IowaDepartment of Transportation, Ames, Ia., U.S.A., 1987, 302 pp.
Hambly, E. C., "Integral bridge abutment details in practice and theory", Technical PaperPA2138/92, Transport and Road Research Laboratory, Crowthorne, Berkshire, U.K., 1992.
Hearn, G., "Faulted pavements at bridge abutments", Colorado Transportation InstituteSynthesis, University of Colorado, Boulder, Colo., U.S.A., 1995, 181 pp.
Humphrey, D. N., Whetten, N., Weaver, J., Recker, K. and Cosgrove, T. A., "Tire shreds aslightweight fill for embankments and retaining walls", Recycled Materials in GeotechnicalApplications, C. Viupulanandan and D. J. Elton (eds.), American Society of Civil Engineers,Reston, Va., U.S.A., 1998, pp. 51-65.
Ng, C. W. W., "Cyclic loading of a sand behind a spread-base integral bridge abutment", TRLData Report IV & V, Transport Research Laboratory, Crowthorne, Berkshire, U.K., 1995.
Ng, C., Springman, S. and Norrish, A., "Soil-structure interaction of spread-base integral bridgeabutments", Soils and Foundations, Japanese Geotechnical Society, Tokyo, Japan, Vol. 38, No.1, 1998, pp. 145-162.
Ng, C. W. W., Springman, S. and Norrish, A. R. M., "Centrifuge modeling of spread-baseintegral bridge abutments", Journal of Geotechnical and Geoenvironmental Engineering,American Society of Civil Engineers, Reston, Va., U.S.A., Vol. 124, No. 5, 1998, pp. 376-388.

Integral-Abutment Bridges: Problems and Innovative Solutions Using EPS Geofoam and Other GeosyntheticsManhattan College Research Report No. CE/GE-00-2
148
Norrish, A. R. M., "Cyclic loading of cohesiveless soil behind bridge abutment", Ph.D. thesis,Cambridge University, Cambridge, U.K., 1998.
Porter, J. C., Morvant, M. J. and Moon, R. J., "Back to the future for abutment design", ConcreteInternational, Vol. 14, June 1992, pp. 29-35.
Reid, R. A., Soupir, S. P. and Schaefer, V. R., "Use of fabric reinforced soil walls for integralabutment bridge end treatment", Proceedings of the Sixth International Conference onGeosynthetics, R. K. Rowe (ed.), Industrial Fabrics Association International, Roseville, Minn.,U.S.A., 1998, pp. 573-576.
Reid, R. A., Soupir, S. P. and Schaefer, V. R., "Mitigation of void development under bridgeapproach slabs using rubber tire chips", Recycled Materials in Geotechnical Applications, C.Viupulanandan and D. J. Elton (eds.), American Society of Civil Engineers, Reston, Va., U.S.A.,1998, pp. 37-50.
Sandford, T. C. and Elgaaly, M., "Skew effects on backfill pressures at frame bridge abutments",Transportation Research Record No. 1415, National Academy Press, Washington, D.C., U.S.A.,1993, pp. 1-11.
Schaefer, V. R. and Koch, J. C., "Void development under bridge approaches", Report No.SD90-03, South Dakota Department of Transportation, Pierre, S.D., U.S.A., 1992, 147 pp.
Springman, S. M., Norrish, A. R. M. and Ng, C. W. W., "Cyclic loading of sand behind integralbridge abutments", Project Report 146, Transport Research Laboratory, Crowthorne, Berkshire,U.K., 1996.
Wasserman, E. P., "Jointless bridges", Engineering Journal, Vol. 24, No. 3, 1987, pp. 93-100.

149
Integral-Abutment Bridges: Problems and Innovative Solutions Using EPS Geofoam and Other GeosyntheticsManhattan College Research Report No. CE/GE-00-2
Appendix AReduced Earth Pressure (REP) Wall Analysis: Version 2.0
A.1 BACKGROUND
As discussed in Section 3.3.3.3, a simplified analytical model was developed for solving theREP-Wall problem where a compressible inclusion (not limited to geofoam) is placed between arigid, non-yielding earth retaining structure and its retained soil. The conceptual basis for thismodel involves using the maximum lateral earth pressure. Version 1.0 of this model was firstdeveloped by Partos and Kazaniwsky (1987) based on the normally consolidated at-rest earthpressure at the base of the structure and culminated with author's Version 1.2 suggested in thispresent study based on the active state at a depth of three-quarters of the geotechnical height ofthe structure.
Although Version 1.2 produced results that were in good agreement with the numerical resultsof the present study (see Table 3.5), an alternative conceptual basis for deriving a model was feltto be desirable. This alternative basis, referred to as Version 2.0, involves using the horizontalresultant earth force or, more specifically, the normalized horizontal resultant earth force, β,instead of lateral earth pressure. The reason for preferring this alternative was to provide a modelwhose conceptual basis was the same as that for the simplified analytical model for the ZEP-Wallproblem that was developed in Section 3.3.3.10. It was felt to be better for both the long-termdevelopment of simplified analytical models for REP- and ZEP-Wall problems as well as end-user understanding of such models to have a unified conceptual basis for model development.
A.2 MODEL DERIVATION
A.2.1 Concept
The model concept for Version 2.0 of the simplified analytical method for the REP-Wallproblem is basically the same as that shown in Figure 3.42 for the ZEP-Wall problem with theobvious difference that the retained soil is unreinforced. As a result, the spring stiffnesses for theREP-Wall problem as shown in Figure A.1 have a very different qualitative relationship thanthose for the ZEP-Wall problem (see Figure 3.43). Most importantly, this means there is a uniquesolution to the REP-Wall problem, i.e. a single value of compressible inclusion thickness, tci, thatis required to achieve the minimum lateral pressure (assumed to be the horizontal component ofthe active earth pressure state). The required value of tci is obtained by equating the equivalentmodel spring stiffnesses of the compressible inclusion and soil at the desired solution point of β= βa and ∆ = ∆a which correspond to the active state. This is developed in the following section.
Note that the existence of a unique solution to the REP-Wall problem is significantly differentthan for the ZEP-Wall problem where there is no unique solution. As can be seen in Figure 3.43,there are, theoretically, an infinite number of combinations of compressible inclusion thicknessand reinforcement stiffness that could be chosen to produce a normalized horizontal resultantforce, β, between one and zero. Note also that it is theoretically impossible to achieve a conditionof no horizontal force (β = 0) in reality as there is no perfectly compressible inclusion norinfinitely rigid reinforcement. However, it is possible to achieve a value of β that is very close tozero for all practical purposes using realistic combinations of compressible-inclusion andreinforcement stiffness (Horvath 1991a).

Integral-Abutment Bridges: Problems and Innovative Solutions Using EPS Geofoam and Other GeosyntheticsManhattan College Research Report No. CE/GE-00-2
150
A.2.2 Theory
A.2.2.1 Compressible-Inclusion Stiffness. Assuming one-dimensional compressionconditions exist within the compressible inclusion (reasonable for most materials used for thispurpose)
hcih E ε⋅=σ (A.1)
whereEci = Young's modulus of the compressible-inclusion material,εh = horizontal normal strain of the compressible inclusion and
hσ = horizontal normal stress within the compressible inclusion.
Based on the results presented in Section 3.3.3.2 and Figure 3.24 in particular, the averagestrain within the compressible inclusion is assumed to be two-thirds of the maximum value.Therefore, εh in Equation A.1 is taken to be
ci
cih t⋅
∆⋅=ε3
2(A.2)
wheretci = thickness of the compressible inclusion and∆ci = horizontal compression of the compressible inclusion.
Combining equations A.1 and A.2 produces the average stress within the compressibleinclusion:
Figure A.1. Approximate REP-Wall Analysis Method: Spring Stiffnesses
∆
β
∆a
1 resilient-EPS geofoamcompressible inclusion
βa
retained soil
00

151
Integral-Abutment Bridges: Problems and Innovative Solutions Using EPS Geofoam and Other GeosyntheticsManhattan College Research Report No. CE/GE-00-2
ci
cicih t
E
⋅∆⋅⋅=σ
3
2(A.3)
The horizontal resultant force, Ph, is
ci
cicihh t
HEHP
⋅⋅∆⋅⋅=⋅σ=
3
2(A.4)
The normalized horizontal resultant force, β, is
** 3
2
oci
cici
o
h
Pt
HE
P
P
⋅⋅⋅∆⋅⋅==β (A.5)
The special case of Equation A.5 for the normalized horizontal resultant force, βa, at the activestate (∆ci = ∆a) is
*3
2
oci
acia
Pt
HE
⋅⋅⋅∆⋅⋅=β (A.6)
A.2.2.2 Soil Stiffness. Referring to Figure A.1, the equation of the line that is assumed todefine the soil behavior between β = 1 and β = βa is
∆∆⋅β+
∆∆−==β
a
s
a
s
o
h
P
P1
*(A.7)
where ∆s = horizontal displacement of the retained soil.But
*o
aha
P
P=β (A.8)
where Pah = horizontal component of the active earth pressure force. Using the classicaltriangular distribution of the active earth pressure shown in Figure 3.6 and used throughout thisreport
2cos5.0 HKP taah ⋅γ⋅δ⋅⋅= (A.9)
whereH = the geotechnical height of the earth retaining structure,Ka = the coefficient of active earth pressure from either Coulomb or exact theory,δ = the soil-compressible inclusion interface friction angle andγt = total unit weight of the retained soil.
Combining equations A.7 through A.9 yields

Integral-Abutment Bridges: Problems and Innovative Solutions Using EPS Geofoam and Other GeosyntheticsManhattan College Research Report No. CE/GE-00-2
152
∆∆⋅
⋅γ⋅δ⋅⋅+
∆∆−=β
a
s
o
ta
a
s
P
HK*
2cos5.01 (A.10)
The special case of Equation A.10 for the normalized horizontal resultant force, βa, at theactive state (∆s = ∆a) is
⋅γ⋅δ⋅⋅=β
*
2cos5.0
o
taa
P
HK(A.11)
A.2.2.3 Solution. The solution is obtained by equating equations A.6 and A.11 whichproduces
*
2
*
cos5.0
3
2
o
ta
oci
aci
P
HK
Pt
HE ⋅γ⋅δ⋅⋅=
⋅⋅⋅∆⋅⋅
(A.12)
Recognizing that
( ) HH asa ⋅∆=∆ / (A.13)
where (∆s/H)a is the minimum normalized horizontal displacement of the soil mass necessary tomobilize the active earth pressure state, then simplifying and rearranging to solve for the requiredthickness of the compressible inclusion, tci, yields the desired final result:
( )ta
ascici K
HEt
γ⋅δ⋅⋅∆⋅
=cos75.0
/(A.14)
Note that Equation A.14 is the same as Equation 3.11 for Version 1.2 of the simplified REP-Wallanalysis method.