intangibles and national income measurement: measuring a scientific revolution leonard nakamura...
TRANSCRIPT

Intangibles and National Income Measurement:
Measuring a scientific revolution
Leonard NakamuraFederal Reserve Bank of Philadelphia*
*reflects solely my opinions and not those of the Federal Reserve System

In social sciences, the ruling paradigm may depend on institutions
• Invisible Hand or Creative Destruction• Humans have always been creative• But creativity was only a small proportion of
investment and wealth– Private investments in new product development have
risen substantially since the late 1970s
• Does it now change the paradigm of economics?– Does economics need or have a paradigm?

Talk outline
• A scientific revolution?– Economists are uncomfortable with this notion
• Measuring the U.S. rise in investment in intangibles (new product creation)
• Are US economic choices sustainable?

A scientific revolution in economics?
• John Hicks on “revolutions” in economics, 1976:– “Our special concern [in economics] is with the fact of
the present world; but before we can study the present, it is already past.
– In order that we should be able to say useful things about what is happening, before it is too late, we must select, even select quite violently.
– We must concentrate our attention, and hope that we have concentrated it in the right place.”
Issues in a scientific revolution
• According to Thomas Kuhn, a scientific revolution is a change in paradigm:– What is to be studied?– How do we define the objects of interest? – How are they to be measured?– What theory is relevant?
• Along some dimensions the new theories and measurement may be worse than those replaced
The old theory and practice: the invisible hand
• Solid welfare theory:– Perfect competition good, monopoly bad
• Price and quantity well-defined (Hicks)
• Progress is exogenous rather than endogenous (Solow)
• Inputs equal outputs (Perfect competition)
• Investments are rival and tangible: private value equals social value (Fisher)

New theory: creative destruction
• Theory and practice unsatisfactory along several dimensions– Welfare theory unclear (intellectual property rights theory and
practice remain controversial)– Price impact of new products depends on measurement of
consumer surplus (controversial)– Endogenous productivity growth (predicts accelerating growth)– Monopolistic competition, quality ladders, etc.: markups (inputs
may not equal outputs)– R&D investments are risky: many fail (complicates accounting)– Intellectual property is nonrival: private and social valuations
typically diverge (require two national accounts?)

Intangibles make income and product hard to measure
• Measuring inflation and output growth more difficult
• How to deflate intangible investment– Probably can’t deflate it from the output side, need to
deflate it from the input side• How to depreciate intangible investment?
– Depreciation rate very hard to measure– Many investments fail (should these be written off?)
• Measuring nominal investment– Expensing of intangibles in corporate accounts makes
measuring the size of this investment difficult
Interaction between theory and practice
• If intangible investment and intellectual property are relatively unimportant, it is easier to ignore the knotty theoretical and empirical difficulties associated with the theory and empirics of creative destruction.
• Collecting data, even crude data, that shows these investments are rising as a proportion of expenditures forces us to confront the possibility of an economics without the invisible hand.
On the timing of the “revolution”
• Intangibles became much more important as a consequence of the rise of the personal computer (1977 to 1984)
• Software investment became much more important
• R&D: small firms became much more R&D intensive

Computer hardware investment (relative to GDP) took off around 1976 when the microprocessor came of age, stabilizing in 1984
0.0%
0.2%
0.4%
0.6%
0.8%
1.0%
1.2%
59 61 63 65 67 69 71 73 75 77 79 81 83 85 87 89 91 93 95 97 99 01 03 05
Per
cen
t o
f G
DP
computer investment to GDP
Computer hardware as nominal percent of US gross domestic product
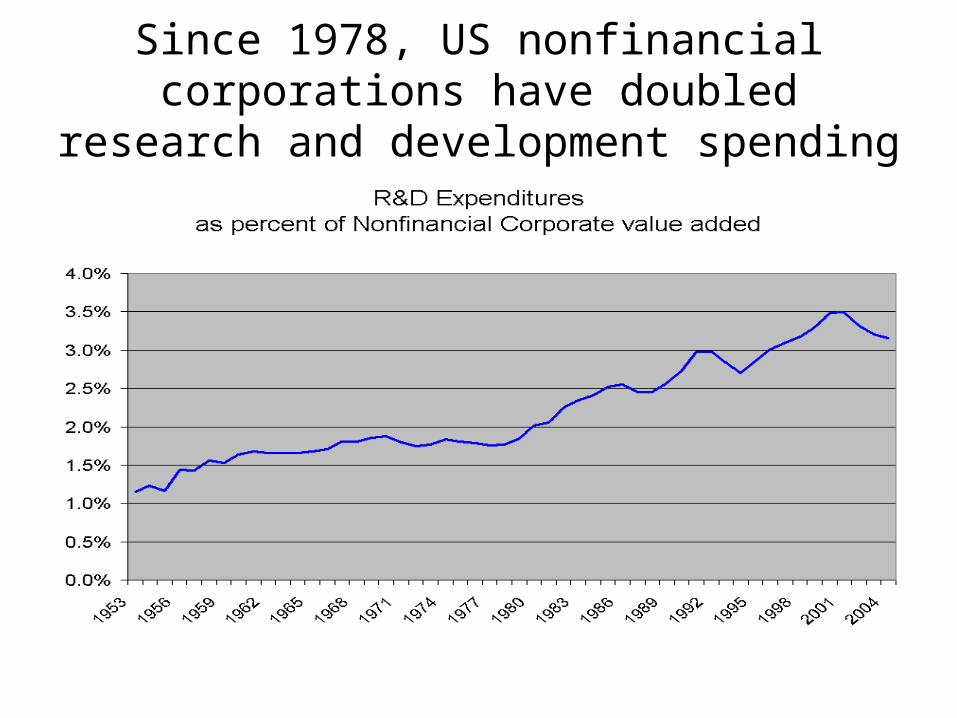
Since 1978, US nonfinancial corporations have doubled research and development
spending

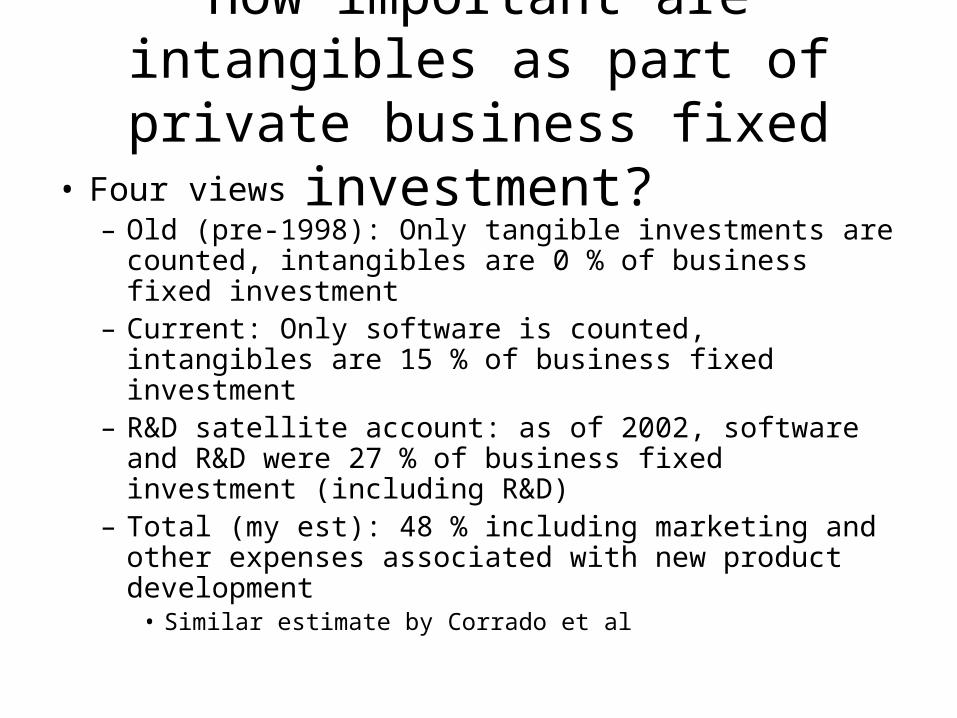
How important are intangibles as part of private business fixed
investment?• Four views
– Old (pre-1998): Only tangible investments are counted, intangibles are 0 % of business fixed investment
– Current: Only software is counted, intangibles are 15 % of business fixed investment
– R&D satellite account: as of 2002, software and R&D were 27 % of business fixed investment (including R&D)
– Total (my est): 48 % including marketing and other expenses associated with new product development
• Similar estimate by Corrado et al

Four views of US Private Business Investment: View 1Old Definition -- Excludes SoftwareInvestment near post-war low
5.0%
7.0%
9.0%
11.0%
13.0%
15.0%
17.0%
19.0%
1953
1955
1957
1959
1961
1963
1965
1967
1969
1971
1973
1975
1977
1979
1981
1983
1985
1987
1989
1991
1993
1995
1997
1999
2001
2003
2005
2007
Nominal Investment relative to Nominal GDP
per
cen
t o
f G
DP
Tangible ex software

Four views of US Private Business Investment:View 2 Current Official Definition
Investment Near Postwar Average
5.0%
7.0%
9.0%
11.0%
13.0%
15.0%
17.0%
19.0%
1953
1955
1957
1959
1961
1963
1965
1967
1969
1971
1973
1975
1977
1979
1981
1983
1985
1987
1989
1991
1993
1995
1997
1999
2001
2003
2005
2007
Nominal Investment relative to Nominal GDP
per
cen
t o
f G
DP
Tangible ex software Private Nonres

Four views of US Private Business Investment:View 3 With Private R&D from Satellite Account
Investment above Pre-1977
5.0%
7.0%
9.0%
11.0%
13.0%
15.0%
17.0%
19.0%
1953
1955
1957
1959
1961
1963
1965
1967
1969
1971
1973
1975
1977
1979
1981
1983
1985
1987
1989
1991
1993
1995
1997
1999
2001
2003
2005
2007
Nominal Investment relative to Nominal GDP
per
cen
t o
f G
DP
Tangible ex software Private Nonres Priv NR Plus R&D

Four views of US Private Business InvestmentView 4: All Intangibles Included
Investment Near Postwar High (Excluding Internet Bubble)
5.0%
7.0%
9.0%
11.0%
13.0%
15.0%
17.0%
19.0%
1953
1955
1957
1959
1961
1963
1965
1967
1969
1971
1973
1975
1977
1979
1981
1983
1985
1987
1989
1991
1993
1995
1997
1999
2001
2003
2005
2007
Nominal Investment relative to Nominal GDP
per
cen
t o
f G
DP
Total Tangible ex software Private Nonres Priv NR Plus R&D

Has US Business investment been falling or rising over time?
• Answer depends on how important intangibles are– Including software and business R&D implies
rising investment
• Rising investment would suggest rising US wealth
• And wealth has been rising!

Beginning in 1979, wealth rose relative to income
2.800
3.000
3.200
3.400
3.600
3.800
4.000
4.200
4.400
4.600
4.800
59 60 61 62 63 64 65 66 67 68 69 70 71 72 73 74 75 76 77 78 79 80 81 82 83 84 85 86 87 88 89 90 91 92 93 94 95 96 97 98 99 00 01 02 03 04 05 06 07
networth/gdp
Household wealth has increased
• And it hasn’t been high levels of measured personal saving
• Indeed, measured consumption has risen relative to gross domestic product
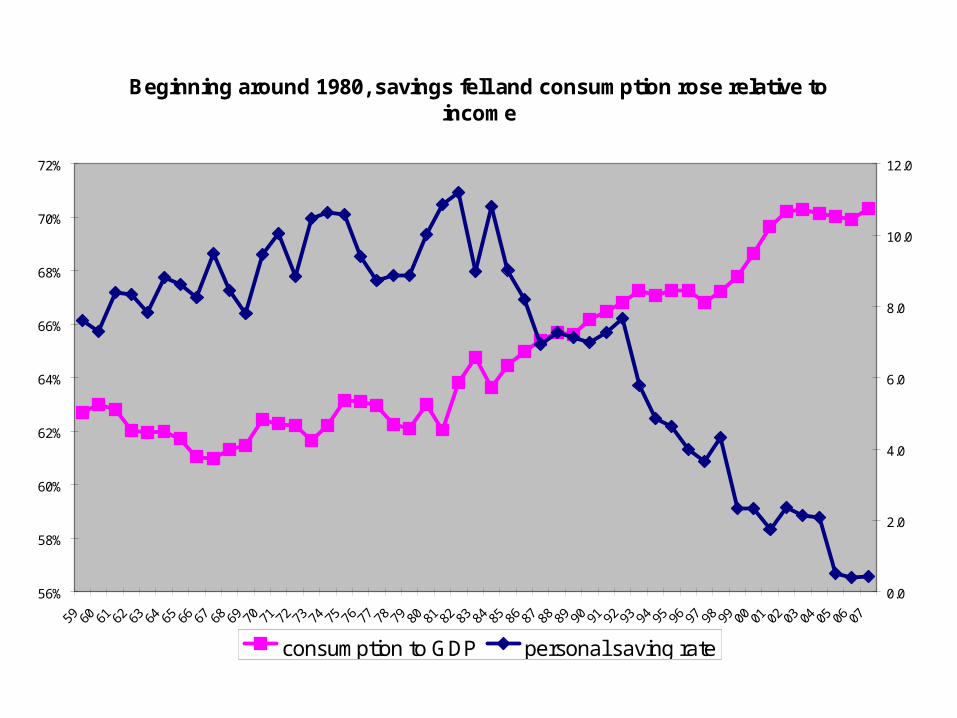
Beginning around 1980, savings fell and consumption rose relative to income
56%
58%
60%
62%
64%
66%
68%
70%
72%
59 60 61 62 63 64 65 66 67 68 69 70 71 72 73 74 75 76 77 78 79 80 81 82 83 84 85 86 87 88 89 90 91 92 93 94 95 96 97 98 99 00 01 02 03 04 05 06 07
0.0
2.0
4.0
6.0
8.0
10.0
12.0
consumption to GDP personal saving rate
Summary
• In NIA, we are measuring about ¼ of intangibles • With R&D satellite, we are measuring close to
half of intangibles (but only through 2002)• This substantially improves our understanding of
business fixed investment• Ignoring intangible investment produces a
different view of US investment, one that helps explain rising US wealth
• Also makes creative destruction more central to US economy