insurance motor insurance 2.0 w - the digital … motor insurance is on the brink of dramatic change...
TRANSCRIPT
BLUEPAPER
����������������� ������������ ���������������������������� ����� ��� ����� ����������������������������������������� ��������������� ������ � �������
������������������������������ ���������������������������������������� ��������� ��� ������ ���� ���������������� ������� ������� ���� �� ����� ���
!� ����"������������������#��������������������������������� �����!� ����"������ ���� ��������� ������������ �������������� ������������ ����������������������
��� ���������������������������$����������!� ����"������ ���� ����������� �������������� �!� ����"������ ���� ���������������������� �����#������ ����������
�������������������� � �� ������������ �������� �������������������� ���������� ������������������������ �������
%�&�����������������������'(�"����������� ������ ����� ���������� �������������������������� ����������������� �������������������$���������")*�+",� ��� �����
�������������������������$����������������������� ����������� ��������� ������������� ���� ������������������
Insurance
Motor Insurance 2.0
We see a significant part of the ~$200bn market value of the global motor
insurance industry at risk, under the cumulative effect of a broad range of
disruptive trends: car technology, new mobility, availability of data,
digitisation, regulation and world economics.
BLUEPAPER
MORGAN STANLEY CONTRIBUTORS
EUROPEAN INSURANCE
Jon Hocking1
,-(�.+����/+".
%00�12�3014'1523
6���7��#��8�� ��������������
Xinmei Wang, CFA1
,-(�.+����/+".
%00�12�3014'9:;:
<����=���8�� ��������������
Janet Demir, CFA1
,-(�.+����/+".
%00�12�3014'0244
6�����)�� 8�� ��������������
Nadine Van Der Meulen, CFA1
,-(�.+����/+".
%00�12�3014';905
������>���)� �!����8�� �������������
Fulin Liang, CFA1
,-(�.+��""?���.,
%00�12�3;33'90;0
����/���8�� ��������������
Jonathan Denham1
,-(�.+��""?���.,
%00�12�3014'5449
6��������)�����8�� ��������������
US P&C INSURANCE
Kai Pan2
,-(�.+����/+".
%9�191�3;9':399
@��A��8!� ���"���������
Chai Gohil2
,-(�.+��""?���.,
%9�191�3;9'9392
������������8�� ��������������
CHINA INSURANCE
Jenny Jiang, CFA3
,-(�.+����/+".
%:41�1:0:'3941
6�����6���8�� �������������
SOUTH KOREA INSURANCE
Sara Lee6
,-(�.+����/+".
%:1�1�5BB'0:5;
"� ��7"�/��8�� ��������������
JAPAN INSURANCE
Hideyasu Ban4
,-(�.+����/+".
%:9�5�;:5;'4092
7����������8�� �����������������
AUSTRALIA INSURANCE
Daniel P Toohey5
,-(�.+����/+".
%;9�1�B332'9594
)����.�����8�� ��������������
Matt Dunger5
,-(�.+��""?���.,
%;9�1�B332'99:3
!����)���� 8�� ��������������
US AUTOS & SHARED MOBILITY
Adam Jonas, CFA2
,-(�.+����/+".
%9�191�3;9'931;
�����6����8�� ��������������
EUROPEAN AUTOS & SHARED MOBILITY
Harald Hendrikse1
,-(�.+����/+".
%00�12�3014';102
7� ���7��� #��8�� ��������������
Victoria Greer1
,-(�.+����/+".
%00�12�3014'3B00
>��� ��� �� 8�� �������������
9�!� ����"������C��������� ���������%1�!� ����"������C�����//�5�!� ����"����������/����%0�!� ����"������!(���"��� ���������/����%4�!� ����"���������� ���/����%;�!� ����"������C��������� �����������"����� ����%
%�&�����������������������'(�"����������� ������ ����� ���������� �������������������������� ����������������� �������������������$���������")*�+",� ��� �������������������������������$����������������������� ����������� ��������� ������������� ���� ������������������
Contributors
BLUEPAPER
BOSTON CONSULTING GROUP CONTRIBUTORS
AUSTRALIA
Andrew Dyer
%;9�1�B515�4;00
��� ���� ��8�������
BELGIUM
Annik Penders
%51�1�1:B�21�;1
����� �����#8�������
CANADA
Ian Frost
%9�591�BB5�5523
� ������8�������
CHINA
Tjun Tang
%:41�1B93�:19;
������$��8�������
FRANCE
Benoît Macé
%55�9�0293�99;4
����������8�������
Jean-Christophe Gard
%55�9�0293�9954
�� ��$���'�� ������8�������
GERMANY
Christopher Freese
%0B�52�1::3�9955
� ������� ������ 8�������
IBERIA
Miguel Abecasis
%549�19�5190�:0;
������������8�������
INDIA
Alpesh Shah
%B9�11�;30B�320B�
����������8�������
ITALY
Davide Corradi
%5B�21�;44BB�1;4
�� ��������8�������
Emanuele Costa
%5B�21�;44BB�0B2
�������������8�������
JAPAN
Yasushi Sasaki
%:9�5�4199�2;32
����#�������8�������
LATIN AMERICA
Flavio Magalhaes
%44�99�520;�B92:
�������������8�������
MEXICO
Max Pulido
%41�44�5;21�4:91
�������D8�������
MIDDLE EAST
Peter Vayanos
%B39�0�00:2�42:
������������ 8�������
NETHERLANDSFrans Blom
%59�12�40:�4:52
����� ���8�������
Tijsbert Creemers
%59�12�40:�4:39
� ���� ���$��� �8�������
NORDICS
Thorsten Brackert
%04�33�51�5099
� ��#� ����� ����8�������
POLAND
Franek Hutten-Czapski
%0:�11�:12�5;52
�������E���#�� ���#8�������
SOUTH AFRICA
Adam Saga Ikdal
%13�99�104�9;;2
#�������8�������
SOUTH KOREA
Hyungjune Hwang
%:1�1�5BB�1�424
�����������$���8�������
SOUTHEAST ASIA
Boriwat Pinpradab
%;;�1�;;3�529:
��� ������� ���8�������
SWITZERLAND
Pia Tischhauser
%09�00�5::�:39;�
��������� ���8�������
UNITED KINGDOM
Miguel Ortiz
%00�3B2:�332B1B
� �E�����8�������
Ofir Eyal
%00�123�345�4;45
������ 8�������
Dominic Saunders
%00�123�345�;9B9�
������ �������8�������
UNITED STATES
Ian Frost
%9�591�BB5�5523
� ������8�������
Michael Shanahan
%9�;93�B35�9503
��������������8�������

BLUEPAPER
�
Motor Insurance is on the Brink of Dramatic Change
���������
=���� ��������� ����������� ����� ������������� �����������
����� ������� �� ��������F32G���������� #������1202
0%
20%
40%
60%
80%
100%
2015 2030 2040
Motor premium split in 7 modeled countries
Personal Commercial
"�� ��H�!� ����"������ ���� ��������������
��������
!��� �� ����������������������������:2G������������ ���� '
#�������1202
24
221
93
28 22 42
8 12
133
384
13 20 14 6 6
74
251
6 11 8 3 0
100
200
300
400
500
UK US China Germany France Japan Australia
Motor premium (USD bn)
Current Limited disruption (2040) Heavy disruption (2040)
"�� ��H�!� ����"������ ���� ���������������
���������
.���� ����������� ���� ������������#����������������� ������'���� � ��������������������� ���� ���� ��������������������������
����������������������� �����I����������������������� � ���������� ������������������� ���� �
New World Old World
Insurer
Underwriting
Data Analytics
Balance
Sheet
Customer
relationship
Admin Disruptor
Insurer Balance
Sheet Admin
Underwriting
Data Analytics
Customer
relationship
"�� ��H�!� ����"������ ���� ��������������
���������
,�������� ���� � ���������������������� ������� ������������
��������� ������������ ��������������� ����� ����������
Partnership play
Adjacency play
Digital Play
"�� ��H�!� ����"������ ���� ��������������
��������
=����������������� ���� ���������������� �F12G���������� #�����
1212�J��������� ���� �����K�'���� ���������������� ����������� ��'
�������� � ��������������� ���� ��� ����
"�� ��H�!� ����"������ ���� ��������������

BLUEPAPER
������������������� � �
downwards pressure on the size of the car parc due to adoption of
shared mobility.
2) In our Heavy disruption scenario, a combination of technologi-
cal, regulatory and social factors accelerate the reduction of
market size in mature markets, reducing it by 18-60% by 2030
and 54-84% by 2040. We see solid social and economic arguments
for governments seeking to speed adoption rates of safer technology
through speed control measures, scrappage schemes and other leg-
islation. Furthermore, new mobility companies are strongly incentiv-
ised to catalyse these changes by rolling out fleets of shared, autono-
mous vehicles.
3) Even greater reductions in personal lines insurance markets,
as a high proportion of the risk pool shifts to commercial insur-
ance. The shift from personal lines to commercial lines (from a
~80/20 personal vs. commercial in 2015 to ~50/50 by 2030, and
~30/70 by 2040), implies a personal motor market in mature econo-
mies that is 35-60% smaller in 2030 than today in nominal terms.
Furthermore, collision avoidance technology will be covered by man-
ufacturers, and OEMs by product liability insurance, while new
mobility businesses will bulk buy fleet insurance.
4) Progressive shift of future growth towards emerging mar-
kets. Emerging markets motor insurance premiums are likely to con-
tinue to grow - albeit below the trend rate. We still forecast robust
growth in markets such as China, which will grow from ~13% of the
global motor market at present, to ~20% by 2025.
5) The traditional motor insurance model may be heavily dis-
rupted by non-traditional players with access to proprietary
driver data, superior analytics capabilities, and direct customer
access. Sophisticated counterparties (such as shared mobility fleet
owners) will not only own the data but are likely to perform their
own analytics, making it challenging for insurers to address the grow-
ing commercial lines market. Furthermore, we see a credible threat
that tech giants, OEMs (original equipment manufacturers) and, to a
Elevator Pitch: Mapping Disruption in MotorWe see a significant part of the ~$200bn market value of the
global motor insurance industry at risk, under the cumulative
effect of a broad range of disruptive trends: car technology, new
mobility, availability of data, digitisation, regulation and world
economics. When combined these disruptive forces may lead to
steep revenue declines in mature markets (e.g. our modelling sug-
gests Japan 2040 premiums could be 84% lower than 2015 in a Heavy
disruption scenario), a fundamental move away from personal lines
to commercial lines (e.g. a personal motor market in mature econo-
mies that is up to 35-67% smaller in 2030 than today), a radical shift
of future growth to emerging markets and the likely entry of disrupt-
ive players.
In light of the combined threat of these dynamics, incremental
change is not an option - insurers must adapt rapidly or become
increasingly marginalised.
Our work seeks to map out in high definition how the market evolves
over time as it transitions to a future state in which much safer, and
eventually autonomous vehicles dominate the car parc and shared
mobility solutions are widely adopted in urban areas.
In order to better understand how the next 5-10 years and beyond
look we have conducted an extensive global consumer survey,
in-depth industry interviews and detailed proprietary market model-
ling by country.
Our key findings:
1) Decreasing motor insurance risk pool in mature economies. In
the short-to-medium term, despite some resilience, market growth
will progressively slow down (e.g. we estimate UK growth 17% lower
than the 10-year trend by 2025). In the long term, the risk pool is
reduced dramatically, leading to a reduction of overall market size in
mature markets of 15-72% by 2040 in nominal terms in our 'Limited
disruption' scenario. The two main drivers are (i) an accelerating
reduction in accident frequency due to adoption of collision avoid-
ance and speed management technology, and (ii) slower, but material
9

BLUEPAPER
�
foundations for success in the future state. Each motor insurer
should be fundamentally reconsidering all aspects of its operating
model (including product and business mix, underwriting capabili-
ties, distribution channels, cost structure, and acquisition strategy).
8) Broadly, we see three, non-exclusive strategic plays. A 'Digital
play' involves leveraging technology throughout the value chain to
exchange data and engage with consumers, optimise the cost of risk
and achieve superior cost efficiency. This model requires insurers to
collect and use data in a more integrated way across functions -
underwriting, servicing and claims - that are currently siloed in most
insurers. Under a 'Partnership play' insurers may turn to strategic
partners (e.g. OEMs, data aggregators, digital service providers) to
secure access to data and customers and/or complement their range
of services. An 'Adjacency play' is also possible where insurers look
to mobility-related adjacencies in order to replace lost revenues and
fuel future growth. Choice of strategy will depend on size, global
reach and business mix.
lesser extent, telcos could corner a significant (and profitable) share
of the remaining personal lines market. This is further supported by
our consumer survey, which shows that nearly 50% of today's young
driver population would be prepared to purchase motor insurance
from non-traditional players.
6) Ultimately, insurers face the risk of becoming pure capital
providers. Without ownership of the customer and with the erosion
of their traditional advantage in the data and analytics necessary to
price risk, and manage claims and fraud, insurers face being margina-
lised. In aggregate we think that a significant part of ~$200bn of mar-
ket cap associated with motor insurance is at risk, with UK insurers
most at risk, while Continental European and South Korean insurers
are relatively less impacted.
7) We feel that on the whole there is a false sense of security in
the market. Whilst significant pain may not be felt in the immediate
future, the next few years will be crucial for motor insurers to lay the
BLUEPAPER
������������������� � �
4 Motor Insurance is on the Brink of Dramatic Change
5 Elevator Pitch: Mapping Disruption in Motor
8 Executive Summary
18 Key Trends Impacting the Motor Insurance Market
36 Global Consumer Survey
51 Implications for Insurers - Assessing the Value at Risk
62 Deep Dive: Potential Disruptive Competitors
76 Call to Action and Strategic Plays
92 Appendix 1: Global Motor Model Methodology
96 Appendix 2: Global Motor Model Detailed Output
108 Appendix 3: Consumer Survey Methodology
109 Appendix 4: Stocks Included in Market Cap at Risk Calculation
Contents
BLUEPAPER
�
���������
!��� �1�2H������ ������� ������������������� ����
1) Bottom up country model x 7
Methodology 2) Consumer survey in 11 countries
3) 45 global interviews with insurers, OEMs and tech providers
Key trends
Implications 2 scenarios: Limited Disruption vs Heavy Disruption
Strategic Plays
* Please see Appendix 4 for a full list of companies included in the calculation.
Source: Morgan Stanley Research, BCG analysis
Significant part of $200bn value at risk globally*
Operating Model
Innovative technology 0
2
4
6
8
1 4
Frequency
down
0
1
2
1 4
Severity
up
Rise of non-traditional
players
Growth from Emerging
Markets Decreased market size
Shift from personal to
commercial
Digital Play Partnership Play Adjacency Play
Alternative Mobility Data Digitisation Regulation World economics
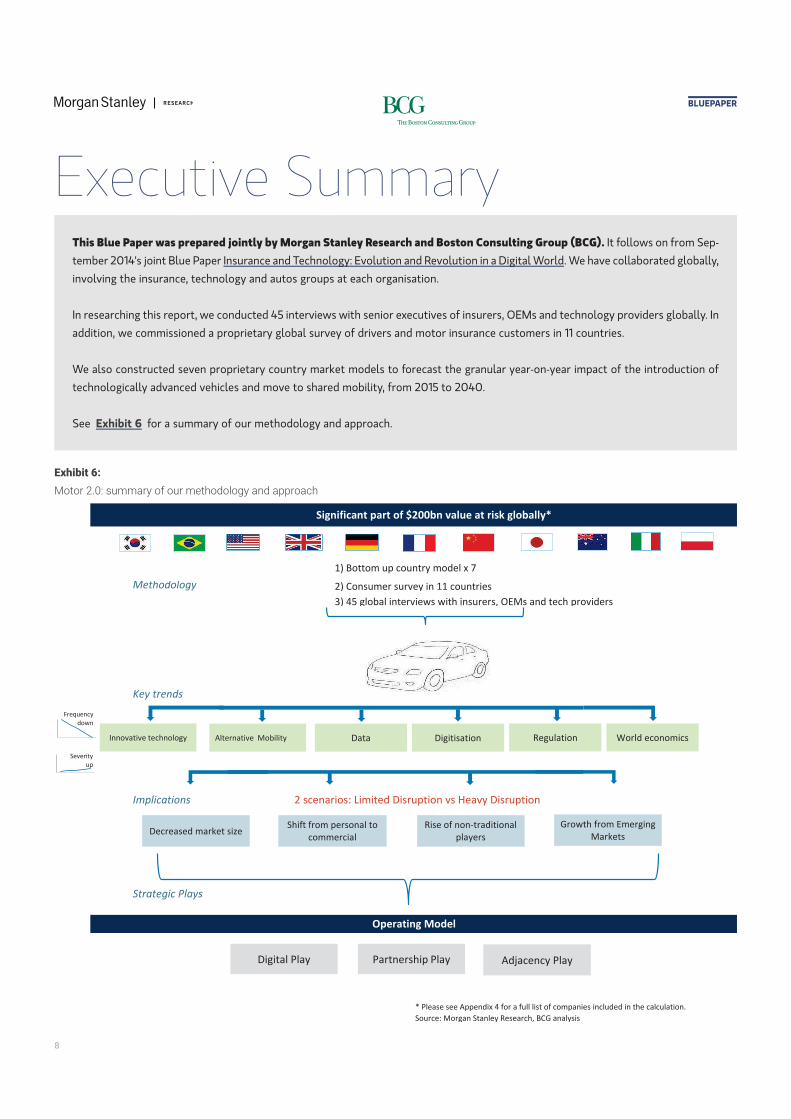
Executive Summary This Blue Paper was prepared jointly by Morgan Stanley Research and Boston Consulting Group (BCG). It follows on from Sep-
tember 2014's joint Blue Paper Insurance and Technology: Evolution and Revolution in a Digital World. We have collaborated globally,
involving the insurance, technology and autos groups at each organisation.
In researching this report, we conducted 45 interviews with senior executives of insurers, OEMs and technology providers globally. In
addition, we commissioned a proprietary global survey of drivers and motor insurance customers in 11 countries.
We also constructed seven proprietary country market models to forecast the granular year-on-year impact of the introduction of
technologically advanced vehicles and move to shared mobility, from 2015 to 2040.
See Exhibit 6 for a summary of our methodology and approach.
BLUEPAPER
������������������� � �
ures, deployment of driverless cars and new insurance coverage
requirements, ownership of data etc.
6) World economics, leading to the ongoing shift of car parc growth
to emerging markets.
When combined, these various disruptive forces could have a materi-
al impact on the market and re-shape the competitive landscape in a
shorter time frame than many insurers may expect. In this report we
have sized this combined impact.
Highlights from our global consumer
survey
Our proprietary global consumer survey - which we conducted in 11
countries around the world – supports these trends and provides
some fascinating insights.
From car ownership to car usage
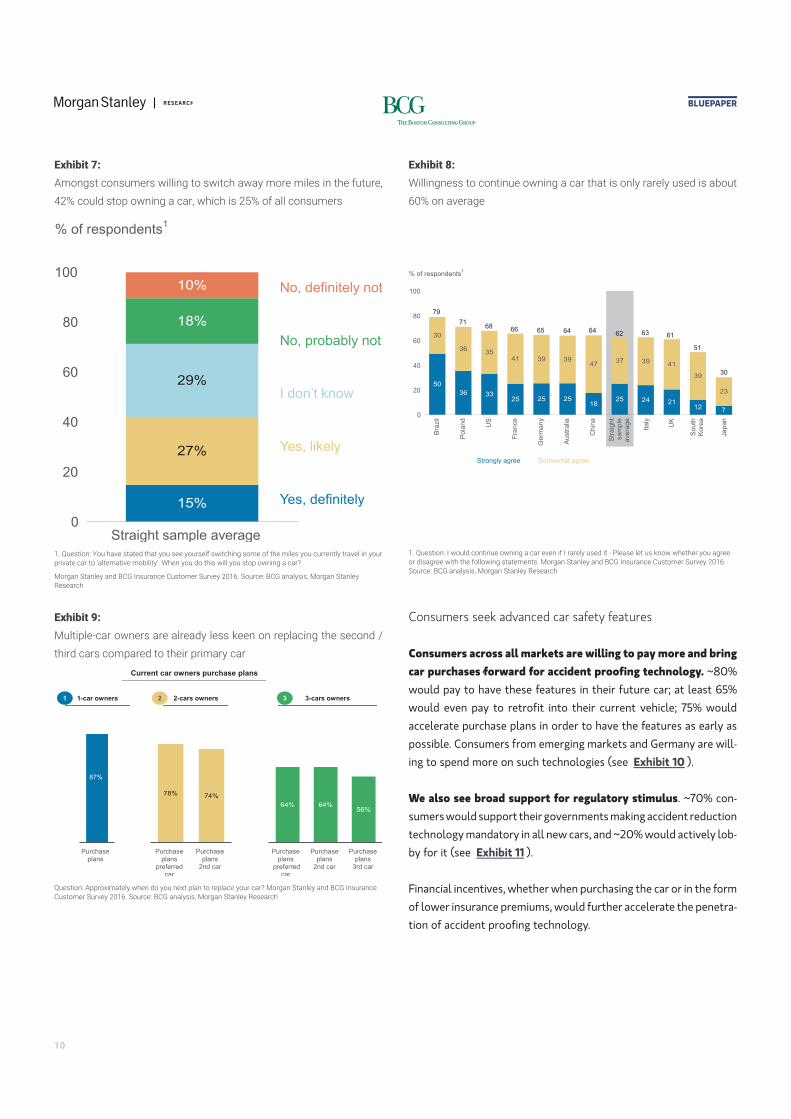
Although car ownership remains strongly valued by >90% of
respondents across all markets, ages, income levels and residen-
tial areas, consumers are increasingly considering foregoing car
ownership should convenient, price effective alternatives become
available. Only 60% of consumers would keep owning a car they
rarely use, and 25% would be ready to stop owning a car given their
likely shift to alternative mobility (see Exhibit 7 - Exhibit 8 ).We
believe that the shift is likely to show initially as a reduction in the
number of cars per household, as multiple-car owners are already
less keen on replacing second and third cars compared to their prima-
ry car (see Exhibit 9 ).
We also expect to see a gradual shift of private miles to public
transportation and shared miles, and a gradual reduction in
miles traveled per private vehicle per year.
False sense of security
We believe there is a false sense of security in the motor insur-
ance market - in our view the market is ripe for disruption by new
entrants, the personal motor market could shrink by up to
35-67% by 2030 in mature countries, and a significant part of the
~$200bn of market capitalisation globally could be at risk.
Six underlying trends
There are several underlying trends converging on the industry: car
technology, new mobility, availability of data, digitisation, regulation,
and world economics:
1) Innovation in technology, not only within the car, from collision
avoidance features through to fully driverless vehicles, but also
external technologies, which could lead to better accident analysis
and safer driving through tighter speed control.
2) Rise of alternative mobility models. For example, ride-hailing,
ride-sharing and car-sharing, which are gaining traction in urban cen-
ters with consumers increasingly switching part of their private miles
to alternatives, foregoing car ownership and building multimodal
journeys.
3) Availability of data, including the ongoing penetration of con-
nected cars and the development of new sources of data, both pro-
prietary and publicly available.
4) Digitisation, fundamentally changing the way in which customers
interact with car-related data and services, and forcing insurers to
integrate themselves into an increasingly digital mobility ecosystem.
5) Regulation, both at regional and local levels, which may slow
down or accelerate key developments in motor insurance. For exam-
ple, mass adoption of car safety features and speed control meas-
1
BLUEPAPER
��
���������
��������������� ���������������������� ���������������� ��
01G��������������������� ���������14G������������� ��
% of respondents1
15%
27%
29%
18%
10%100
80
60
40
20
0 Straight sample average
No, definitely not
No, probably not
Yes, definitely
Yes, likely
9��-������H�+������������������������������� ���������������������������������� ������ ��������� �� ������� ����L��� �����������L��=������������������������������������ M
!� ����"������������������ ������������ �"� ����129;��"�� ��H�������������!� ����"������ ���� ��
���������
=���������������������������� ������������ � ���������������
;2G������� ����
% of respondents1
50
36 3325 25 25
1825 24 21
12
30
3635
41 39 3947
37 39 41
39
23
7
100
80
60
40
20
0
Japan
South
K
ore
a
Chin
a
UK
Italy
Str
aig
ht
sam
ple
avera
ge
Austr
alia
Germ
any
Fra
nce
US
Pola
nd
Bra
zil
Strongly agree Somewhat agree
30
51
64 61 63 62 64 65 66
68 71
79
9��-������H�������������������������� ���������� � ����������'�A�����������#���������� ������� ���� ����� ������������������������������!� ����"������������������ ������������ �"� ����129;��"�� ��H�������������!� ����"������ ���� ��
���������
!����'�� ����� ��� ��� ���������#������� ������������������*
�� ���� ������� ��������� �� �� ���� �
Current car owners purchase plans
78% 74%
64% 64%56%
1-car owners 2-cars owners 3-cars owners
Purchase plans
Purchase plans
2nd car
Purchase plans
preferred car
Purchase plans
preferred car
Purchase plans
2nd car
Purchase plans
3rd car
87%
1 2 3
-������H���� �D��������������������D��������� ��������� ��� M�!� ����"������������������ ������������ �"� ����129;��"�� ��H�������������!� ����"������ ���� ��
Consumers seek advanced car safety features
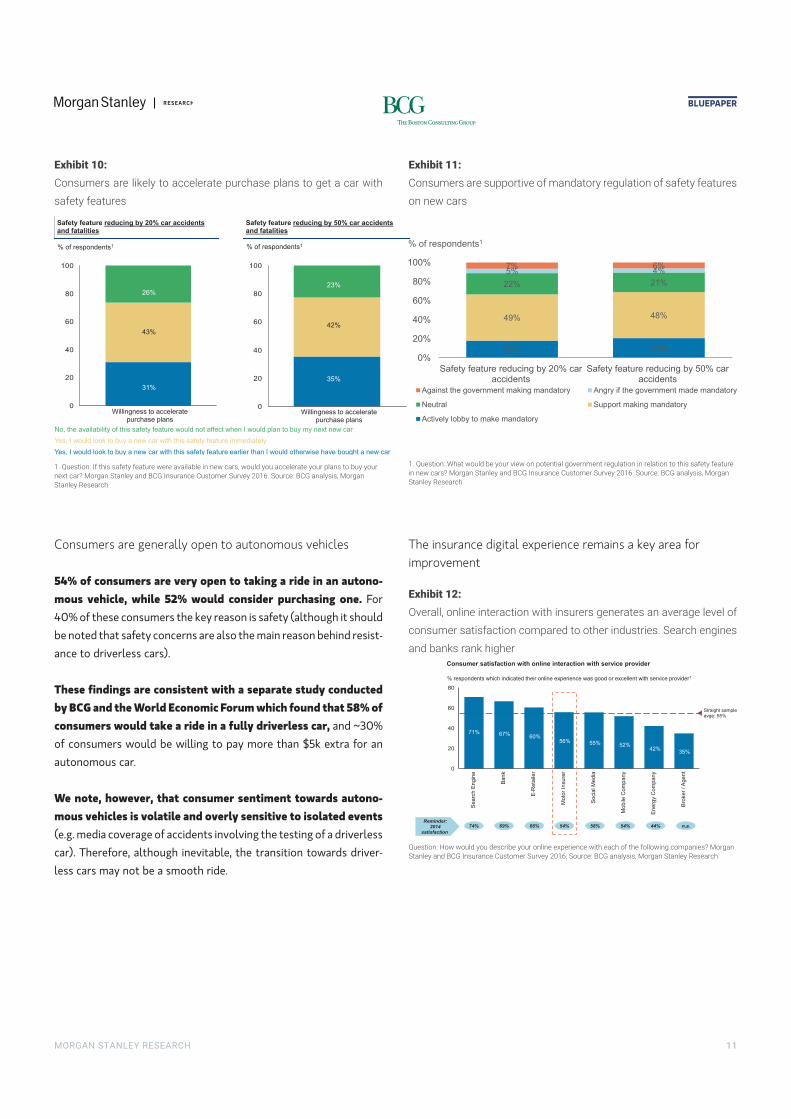
Consumers across all markets are willing to pay more and bring
car purchases forward for accident proofing technology. ~80%
would pay to have these features in their future car; at least 65%
would even pay to retrofit into their current vehicle; 75% would
accelerate purchase plans in order to have the features as early as
possible. Consumers from emerging markets and Germany are will-
ing to spend more on such technologies (see Exhibit 10 ).
We also see broad support for regulatory stimulus. ~70% con-
sumers would support their governments making accident reduction
technology mandatory in all new cars, and ~20% would actively lob-
by for it (see Exhibit 11 ).
Financial incentives, whether when purchasing the car or in the form
of lower insurance premiums, would further accelerate the penetra-
tion of accident proofing technology.
BLUEPAPER
������������������� � ��
���������
������� ��� ��#����������� ������ ���������������������� ����
������������ ���
Safety feature reducing by 20% car accidents and fatalities
Safety feature reducing by 50% car accidents and fatalities
% of respondents1 % of respondents1
0
20
40
60
80
100
43%
26%
31%
Willingness to accelerate purchase plans
0
20
40
60
80
100
42%
23%
35%
Willingness to accelerate purchase plans
Yes, I would look to buy a new car with this safety feature immediately
No, the availability of this safety feature would not affect when I would plan to buy my next new car
Yes, I would look to buy a new car with this safety feature earlier than I would otherwise have bought a new car
9��-������H�������������������� ���� ����������������� ����������������� ������� ���������������� ���D���� M�!� ����"������������������ ������������ �"� ����129;��"�� ��H�������������!� ����"������ ���� ��
��������
������� ��� ������� �������������� �� ����������������������� ��
��������� �
18% 21%
49% 48%
22% 21%
5% 4% 7% 6%
0%
20%
40%
60%
80%
100%
Safety feature reducing by 20% caraccidents
Safety feature reducing by 50% caraccidents
% of respondents1
Against the government making mandatory Angry if the government made mandatory
Neutral Support making mandatory
Actively lobby to make mandatory
9��-������H�=��������������� �������������������� ������ ���������� ������������������������� ���������� �M�!� ����"������������������ ������������ �"� ����129;��"�� ��H�������������!� ����"������ ���� ��
Consumers are generally open to autonomous vehicles
54% of consumers are very open to taking a ride in an autono-
mous vehicle, while 52% would consider purchasing one. For
40% of these consumers the key reason is safety (although it should
be noted that safety concerns are also the main reason behind resist-
ance to driverless cars).
These findings are consistent with a separate study conducted
by BCG and the World Economic Forum which found that 58% of
consumers would take a ride in a fully driverless car, and ~30%
of consumers would be willing to pay more than $5k extra for an
autonomous car.
We note, however, that consumer sentiment towards autono-
mous vehicles is volatile and overly sensitive to isolated events
(e.g. media coverage of accidents involving the testing of a driverless
car). Therefore, although inevitable, the transition towards driver-
less cars may not be a smooth ride.
The insurance digital experience remains a key area for
improvement
���������
?�� ����������� ������������� � ������ ����������� ����������
������� ����������������� ���������� ������ ����"�� ���������
�������#�� ��#�����
Consumer satisfaction with online interaction with service provider
% respondents which indicated their online experience was good or excellent with service provider1
0
20
40
60
80B
roker
/ A
gent
Searc
h E
ngin
e
Socia
l M
edia
E-R
eta
iler
Energ
y C
om
pany
Mobile
Com
pany
Bank
Moto
r In
sure
r
Reminder:
2014
satisfaction
74% 69% 66% 54% 58% 54% 44% n.a.
Straight sample avge: 55%
35%
71%
55% 60%
42% 52%
67%
56%
-������H�7���������������� ������ �������D�� ������������������������������������M�!� ����"������������������ ������������ �"� ����129;I�"�� ��H�������������!� ����"������ ���� ��
BLUEPAPER
�
1) Decreasing motor insurance market size in mature economies,
we estimate by 15-72% by 2040 in nominal terms (in a Limited disrup-
tion scenario), driven by downward pressures on the size of the car
parc and reduced accident frequency.
2) Shift from personal lines to commercial lines (from a ~80/20
personal vs. commercial in 2015 to ~50/50 by 2030 and ~30/70 by
2040), implying a personal motor market in mature markets that is
up to 35-67% smaller than today in nominal terms in 2030.
3) Rise of non-traditional players, building an underwriting advan-
tage in data, analytics, digital capabilities and direct customer access
to take significant (and profitable) share of the remaining personal
motor market from incumbent insurers.
4) Progressive shift of future growth towards emerging mar-
kets, starting with China.
1. Downwards pressure on insurance market size (both short
and long term)
In a Limited disruption scenario we expect the total insurance
market size in mature economies to shrink by ~15-72% by 2040.
In the short term, despite some resilience, market growth will
progressively slow down relative to trend. For example, in the UK
by 2025 we forecast premiums could be 17% lower than if premiums
had continued to grow at same average rate as for the past 10 years
(1.9%). There are two main drivers of this slowdown: (i) a downward
pressure on car volumes driven by the stabilisation then slight
decrease of the car parc due to consumer adoption of shared mobility
solutions, and (ii) a reduction in accident frequency due to the adop-
tion of collision reduction and speed management technology, which
will push claims down and lower prices.
Accident severity evolution is less clear. Although there may be an
overall increase in severity as more expensive car parts lead to higher
repair costs per collision, this is counterbalanced by lower bodily
injury claims as the average speed per collision is likely to fall.
When forecasting market size, we believe that there is too much
focus on the end state of fully autonomous (Level 5) vehicles.
Level 1 and 2 cars (which are already on sale) are significantly safer
than predecessors, which is likely to have an immediate impact on
claims patterns. On a 5-10 year view, it is these features, and the
potential for connected cars and other external technologies to ena-
ble stricter speed controls, that will materially impact the risk pool.
When compared to our 2014 consumer survey, insurers appear
to have improved their digital experience, but consumers are
still dissatisfied past the acquisition phase. 56% of consumers
rate their online experience with insurers as good or excellent (a 2
point increase vs our 2014 survey), although insurers are still ranked
in the middle of other online service providers (see Exhibit 12 ).
We find that consumers prefer online and remote (mail/phone)
channels over face-to-face across all of the motor insurance val-
ue chain. Consumer adoption is higher for mobile and tablet apps
than web portals, but the overall digital customer experience
remains one of the most frequently mentioned pain points.
60% consumers using only indirect (intermediated) channels
would consider purchasing directly from insurers with a better
online offering. Improving the digital experience would not only
improve customer acquisition and engagement but also unlock effi-
ciency gains, especially in policy changes and claims processing,
where the share of human interactions and online dissatisfaction
remain the highest.
Consumers (especially younger drivers) ready to turn to non-
traditional players
55% of consumers are willing to purchase insurance from a non-
traditional player. When asked to select across a variety of non-tra-
ditional players, 40% of customers would consider purchasing
motor insurance from OEMs, more than 10 points ahead of tech
giants or telcos. This may be because OEMS are already a part of the
insurance customer journey for 9% of customers, especially in
research (12% of consumers) and purchase (14%). Developed mar-
kets, especially Japan, Italy and the US, lead the pack.
As expected, young drivers are even more willing to purchase
from non-traditional players; however, this segment would prefer
to purchase from a start-up than from an OEM or a tech giant.
Four key implications for the future of
motor insurance
We expect that the above trends will have four main implications for
the future of motor insurance:

BLUEPAPER
������������������� � �
In the short term, the decrease in total claims could lead to a
boost to profitability in markets where premiums do not fall as
quickly as claims. For example, regulatory constraints, price opacity
and low levels of competition can lead to stickier pricing in selected
markets. In the medium term, we expect the overall profit pool to
decline in line with reduced risks.
We have also considered a Heavy disruption scenario, in which a
combination of technological, regulatory and social factors acceler-
ate the transformation of the motor insurance market of mature
economies, reducing it by 18-60% by 2030 and 54-84% by 2040.
Heavy disruption scenario
We see the following factors as plausible drivers of an accelerated impact on the market:
1) Voluntary retro-fitting of safety features into older vehicles driving even faster penetration of collision-reduction technology
and reduction in accident frequency.
2) Regulatory stimulus (e.g. government scrappage schemes) further increasing the rate at which collision reduction technology per-
meates the market.
3) The early introduction of shared, driverless, electric vehicles (especially in urban areas) further propelling a feedback loop of
safer cars and lower pollution, which leads to faster introduction of newer cars. New mobility players have a strong economic incentive
to roll out shared, driverless fleets as removing drivers could materially improve their profitability.
In Exhibit 13 we show the relative size of the various country mar-
kets we have modeled in the base case or 'Limited disruption' scenar-
io and the 'Heavy disruption' scenario. We think premiums will
decrease substantially across all of the mature markets that we have
modeled.
���������
!��� ���� ������ ������� ��������� �������������� ��H��������
�� �1202�������������������L/����L�����L7����L��� ����������� �
��������� �������� �����������
6
74
251
6 11 8 3 12
133
384
13 20 14 6 24
221
93
28 22 42
8 0
50
100
150
200
250
300
350
400
450
UK US China Germany France Japan Australia
Motor premium (USD bn)
Current Limited disruption (2040) Heavy disruption (2040)
�� ����� ������� ���+94�� ����������� �������(")�������<� ��������59*91*1294���� ������� ��'����� ������� �������(")�������<� ��������1;*2B*129;�"�� ��H�!� ����"������ ���� �����������������������
BLUEPAPER
��
2. Shift from personal lines to commercial lines
We expect commercial lines to progressively replace personal
lines, as a result of two factors.
First, increasing usage of shared mobility solutions leads to a
rise in the number of fleets and commercial vehicles (which is
magnified in terms of premium impact given higher utilisation, or
miles per vehicle, for shared vehicles versus private vehicles). In our
base case (Limited disruption) scenario, we model for commercial
lines to represent 49% of market premiums by 2030, and 67% by
2040 compared with 17% at present across the seven markets that
we model. We see immediate challenges for personal lines motor
where volumes are likely to decline, a trend masked at the aggregate
level by commercial lines growth.
Second, the risk pool will shift towards product liability, as vehi-
cles rather than drivers progressively become the main source of
accidents.
3. Disruptive threat from non-traditional players
As the value of insurers’ proprietary data and traditional expert-
ise diminishes, the traditional motor insurance model is likely to
be heavily disrupted. We see a number of non-traditional entrants
whose capabilities allow them to extract value from the market.
Indeed, a number of the innovations we are already seeing have been
driven by other players: for example, OEMs developing tailored prod-
ucts for their drivers, parts manufacturers mapping the roads, and
telematics providers delivering value-add propositions to the digital
customer.
We expect data to become a major point of contention in the
years to come. Traditional insurers may very well find themselves
forced to pay to access driving data unless they can secure it directly
through much stronger customer relationships. Moreover, sophisti-
cated counterparties such as shared mobility fleet owners will not
only own the data but are likely to perform their own analytics – dra-
matically reducing the value proposition of an insurer.
Furthermore, we think that a number of innovative models
could emerge to dislodge incumbents from the most attractive
risks.
Three components are essential to building an underwriting and pric-
ing advantage to 'cherry-pick' attractive customers:
• Access to driver data, e.g. from connected cars and smartphones,
which can be used to price motor risk as, or potentially more, accu-
rately as using historical claims data
• Superior analytics capabilities combining private data with public
data sources
• Direct customer access
In this report we have outlined a credible scenario where each of
three types of organisations could take 4-9% of selected markets by
2020: Tech giants, OEMs and, to a lesser extent, Telcos.
Three plausible types of insurance disruptor
Tech giants: a player such as Google, Facebook, Apple or Amazon for instance could push targeted, highly customised insurance
offers to customers via their smartphones. Selection, underwriting and pricing would leverage customer data from the use of naviga-
tion services and apps, such as Google Maps and Waze.
OEMs: car manufacturers could push tailored insurance offers to connected car drivers via the car dashboard. Pricing would be
informed by driving data collected from the car, with analytics possibly sourced from partners.
Telcos: telecom companies could leverage their direct access to smartphone customers, along with the customer data they collect
– partnering with third parties for pricing and underwriting.
BLUEPAPER
������������������� � ��
Value at Risk
When combined, we believe that these developments represent an
imminent threat to incumbents and could put a significant part of
~$200bn of market value at risk (see Appendix 4 for companies
included in the sample).
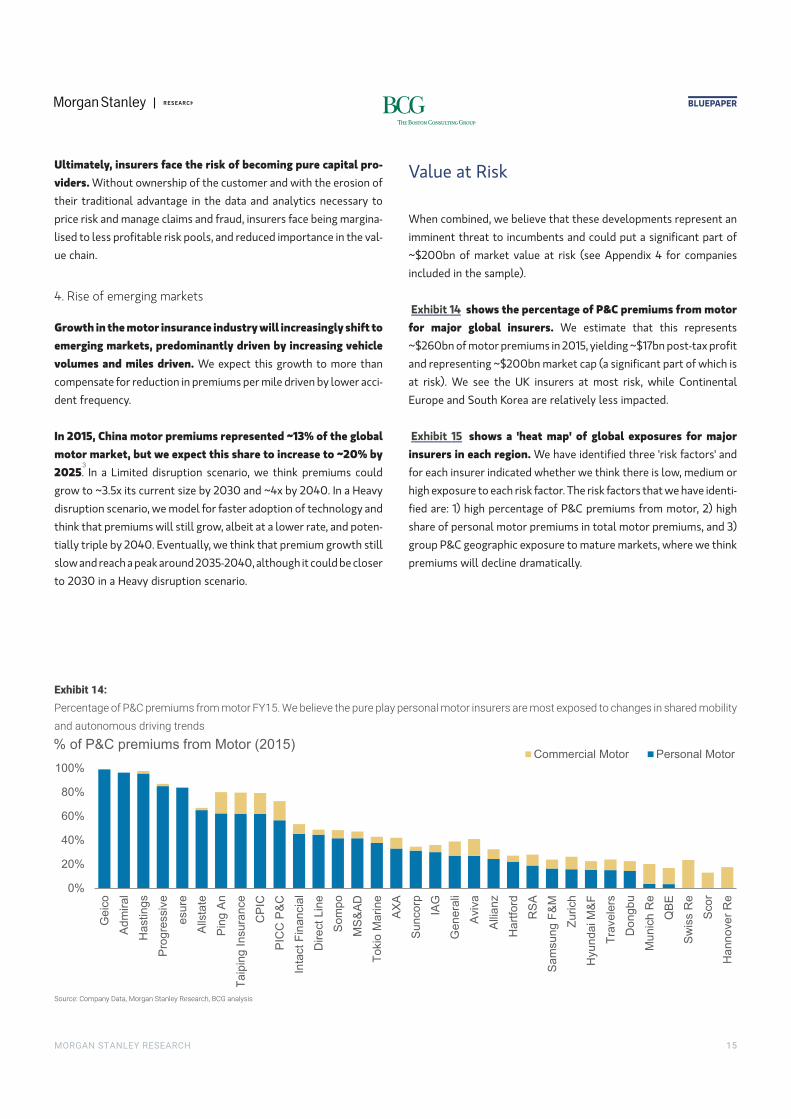
Exhibit 14 shows the percentage of P&C premiums from motor
for major global insurers. We estimate that this represents
~$260bn of motor premiums in 2015, yielding ~$17bn post-tax profit
and representing ~$200bn market cap (a significant part of which is
at risk). We see the UK insurers at most risk, while Continental
Europe and South Korea are relatively less impacted.
Exhibit 15 shows a 'heat map' of global exposures for major
insurers in each region. We have identified three 'risk factors' and
for each insurer indicated whether we think there is low, medium or
high exposure to each risk factor. The risk factors that we have identi-
fied are: 1) high percentage of P&C premiums from motor, 2) high
share of personal motor premiums in total motor premiums, and 3)
group P&C geographic exposure to mature markets, where we think
premiums will decline dramatically.
��������
A� �����������AC��� ������� ������� ��+94��=�������������� �������� ��������� ���� � ��� ��������D���������������������� ��������
���������������� ����� ����
0%
20%
40%
60%
80%
100%
Geic
o
Adm
iral
Ha
sting
s
Pro
gre
ssiv
e
esure
Alls
tate
Pin
g A
n
Taip
ing I
nsura
nce
CP
IC
PIC
C P
&C
Inta
ct
Fin
ancia
l
Dire
ct
Lin
e
Som
po
MS
&A
D
Tokio
Ma
rine
AX
A
Suncorp
IAG
Gen
era
li
Aviv
a
Alli
an
z
Ha
rtfo
rd
RS
A
Sam
sun
g F
&M
Zuri
ch
Hyun
dai M
&F
Tra
vele
rs
Do
ngb
u
Mu
nic
h R
e
QB
E
Sw
iss R
e
Sco
r
Ha
nno
ve
r R
e
% of P&C premiums from Motor (2015) Commercial Motor Personal Motor
"�� ��H���������)�����!� ����"������ ���� ��������������
Ultimately, insurers face the risk of becoming pure capital pro-
viders. Without ownership of the customer and with the erosion of
their traditional advantage in the data and analytics necessary to
price risk and manage claims and fraud, insurers face being margina-
lised to less profitable risk pools, and reduced importance in the val-
ue chain.
4. Rise of emerging markets
Growth in the motor insurance industry will increasingly shift to
emerging markets, predominantly driven by increasing vehicle
volumes and miles driven. We expect this growth to more than
compensate for reduction in premiums per mile driven by lower acci-
dent frequency.
In 2015, China motor premiums represented ~13% of the global
motor market, but we expect this share to increase to ~20% by
2025. In a Limited disruption scenario, we think premiums could
grow to ~3.5x its current size by 2030 and ~4x by 2040. In a Heavy
disruption scenario, we model for faster adoption of technology and
think that premiums will still grow, albeit at a lower rate, and poten-
tially triple by 2040. Eventually, we think that premium growth still
slow and reach a peak around 2035-2040, although it could be closer
to 2030 in a Heavy disruption scenario.
5

BLUEPAPER
��
���������
=�������N�����������������������D���� �������������� � ������� �������������� �#������ ������������������'������������������������
�D���� ������� ��������� ������������ �������������������� ��������D���� ������� #���������������� �������������������D�����
Large share of premiums from motor Writes more personal motor
Geographic exposure to markets with
declining premiums
UK
Admiral
Aviva
Direct Line
RSA
esure
Hastings
Europe
AXA
Allianz
Generali
Zurich
Swiss Re
Munich Re
Hannover Re
Scor
North America
Geico
Allstate
Progressive
Travelers
Intact Financial
Hartford
Australia
IAG
Suncorp
QBE
Japan
Tokio Marine
Sompo
MS&AD
South Korea
Samsung F&M
Dongbu
Hyundai M&F
China
PICC P&C
Ping An
CPIC
Taiping Insurance
Key
Low exposure <25% P&C GWP from motor >75% motor premiums are personal >50% premiums in growth markets
Medium exposure 25-50% GWP from motor 25-75% motor premiums are personal 25-50% premiums in growth markets
High exposure >50% GWP from motor <25% motor premiums are personal <25% premiums in growth markets
9K�/� ������ ������ ������� ������� H�O14G�����D���� ���14'42G��������D���� ���P42G������D���� ���1K�= ������ ���� ��������� H����� �������34G�������� �� ������� ��� ����� ��������� �����������D��'�� ���14'34G��������D���� ���O14G�����D���� ���5K����� ������D���� ������� #������� ��������#�� ��������������'������#���������AC���D���� ��������������������������������������� ������������� ���'������������� �� �������"�� ��H�!� ����"������ ���� ��������������
BLUEPAPER
������������������� � ��
Insurers must adapt - we consider three
strategic plays
Although certain insurers are anticipating change, we think that
the industry as a whole is underestimating the extent and timing
of disruption. Whilst significant pain may not be felt in the short
term, the next few years will be crucial for motor insurers to lay the
foundations for success in the future state. Indeed there are many
opportunities for insurers to prepare for this disruption – in the form
of new offers, access to new data, improved customer experience,
and digital distribution.
In the face of such disruption, we believe that incremental
change is not an option: insurers must adapt. Each motor insurer
should fundamentally reconsider all aspects of its operating model
(including product and business mix, underwriting capabilities, distri-
bution channels, cost structure, and acquisition strategy) as well as
the potential response of competitors.
Broadly, we see three, non-exclusive strategic plays:
1) Digital play: By leveraging technology throughout the value
chain, insurers will be able to fulfill modern consumers’ expectations
regarding an end-to-end digital value proposition, improve data cap-
ture, analytics and risk management capabilities and achieve superior
cost efficiency. We believe this is a necessary step in order to remain
competitive. It is not, however, an easy change, requiring significant
investment in capabilities, e.g. to transform the level of customer
engagement, collect new data from multiple sources and use it in an
integrated way across the organisation. We see the current organisa-
tional structure of insurance companies – with separate underwrit-
ing, servicing and claims functions – as a major impediment to this
model.
2) Partnership play: To keep growing revenues within the motor
insurance value chain and defend against potential disruptors, insur-
ers may turn to strategic partners to secure access to data and cus-
tomers or complement their range of coverage-related services (e.g.
to cover journeys across multiple mobility solutions). OEMs, new
mobility players, telematics manufacturers and telcos are the most
likely partners, although others will emerge. As most potential part-
ners compete on a regional or global scale, local insurers may be
increasingly challenged to develop an attractive value proposition
for them, which may lead to a progressive globalisation of the motor
insurance market.
3) Adjacency play: Insurers may also look to expand into mobility
related adjacencies in order to increase consumer engagement, col-
lect more data, replace lost revenues and fuel future growth. Such
moves could include expanding into adjacencies such as car safety
features, car repairs, services related to roadside assistance, new
mobility solutions, and products covering new risks such as cyber.
Choice of strategy will depend on size,
global reach and business mix
We believe that the choice of strategy and timing of execution
will depend on an insurer's size, global reach and business mix.
Large insurers will be better positioned to make the investments
required to keep pace with technology. Global insurers are more like-
ly to be able to form partnerships with disruptors than local players.
Insurers focused on personal lines or reliant on an agent network
may feel the pressure to adapt their model earlier or more drastically.
Players with a predominantly young and / or urban customer base
may be affected sooner - this is particularly so in markets such as the
UK and US where there is a record of rapid digital adoption. There is
no standardised approach, and the path to the future state is unlikely
to be linear.