insulated*catalytic*converter* with*phase5change*material* … · 2017-04-20 · – pcm amount –...
TRANSCRIPT

Insulated Catalytic Converter with Phase-Change Material under Real-world Driving
ConditionsRohil Daya ([email protected]),
John Hoard ([email protected])Sreedhar Chanda ([email protected])
Maneet Singh ([email protected])
8th April 2016

Introduction• A fundamental aspect of automotive exhaust emissions is that they
mostly occur in the first 100 seconds of engine operation, when the converter is below light-off temperature
• Therefore, reducing cold-start exhaust emissions is the primary focus of industry emissions control development efforts [Mondt]
• Several techniques to reduce converter light-off time exist in literature, and some of them have been introduced in production vehicles with a degree of success [Gulati et al.]
• However, nearly all of them compromise on engine performance and/or fuel economy
• An important alternative in this regard is the Vacuum Insulated Catalytic Converter (VICC)
4/20/16
2

• This technology uses vacuum insulation, metal bellows, radiation shieldsand phase-change material (PCM) to keep the converter above light-offtemperature following long periods of cold-soak
• The VICC was originally developed at the National Renewable EnergyLaboratory (NREL). Analysis by NREL and Benteler Automotive[Burch et al.] demonstrated the heat retention capacity of the VICC, withNMHC and CO emissions reductions of 66% and 65% respectively
3
4/20/16
Introduction

• In this research, a VICC-type converter has been modeled and simulated in GT-Suite
• The model accounted for all the key heat transfer effects in the exhaust system
• The vehicle aftertreatment model was replicated for a conventional TWC converter (CC), and simulated for conventional and hybrid electric vehicles
• For each vehicle, drive cycle simulations were followed by soak simulations of differing times. An experiment was conducted to calculate tailpipe flow during vehicle soak, and the results from this were used as model inputs
• To examine the real-world benefits of the converter, driving data was obtained from the National Renewable Energy Laboratory (NREL), and a MATLAB code was developed to statistically analyze 23,156 drive cycles 4
4/20/16
Introduction

• The VICC was simulated on standard drive cycles to develop a correlation between melt time of the phase-change material (PCM), average drive cycle speed and acceleration
• This correlation was used to predict the probability that the PCM will melt in a given real-world driving cycle
• The MATLAB code was also used to calculate soak time probability and a conservative re-solidification time probability
• Finally, FTP emission results were weighted with the soak time probabilities. This analysis showed that in real-world driving conditions, the VICC is expected reduce cold-start CO and HC emissions by 26% and 48% respectively
5
4/20/16
Introduction

Overview• The VICC stores heat energy and adds insulation
– Keeps catalyst above 350°C up to 13 hours• But, added thermal mass means slower light off if you get fully cold• Conventional and hybrid vehicles modeled• Real world drive cycles analyzed
– Real soak times are short enough the catalyst will almost always be warm at start
– Significant real-world emission reductions are possible
6
4/20/16

Cold-Start Converter Modeling
7
4/20/16

8
4/20/16
Cold-Start Converter Modeling

Aftertreatment GT-Power Model
9
4/20/16

HEV-Aftertreatment GT-Power Model
4/20/16
10

Details of GT-Power modeling and data sources are in backup slides
4/20/16
11

Prep-Cycle Simulation Results-Speed Profile• First, a conventional vehicle with steady-state maps representative of a
2015 Ford Taurus (with a 3.5 L naturally aspirated engine) was simulated for an FTP drive cycle (without the hot soak)
• It was observed that one FTP cycle was not enough to completely melt the PCM. Therefore, a FTP+HWFET prep-cycle was used
4/20/16
12

Prep-Cycle Simulation Results-Engine Out• The figure shows the engine-out exhaust flow rates and temperatures.
These values can be directly calculated using engine-maps once the engine speed and load are known for a given vehicle speed
4/20/16
13
Spark Retard Effect

Prep-Cycle Simulation Results-Wall Temperature – First Brick
(One-Inch Front Centre)
4/20/16
14
Front Brick

Prep-Cycle Simulation Results-Wall Temperature – Second Brick
(One-Inch Rear Centre)
4/20/16
15
Second Brick
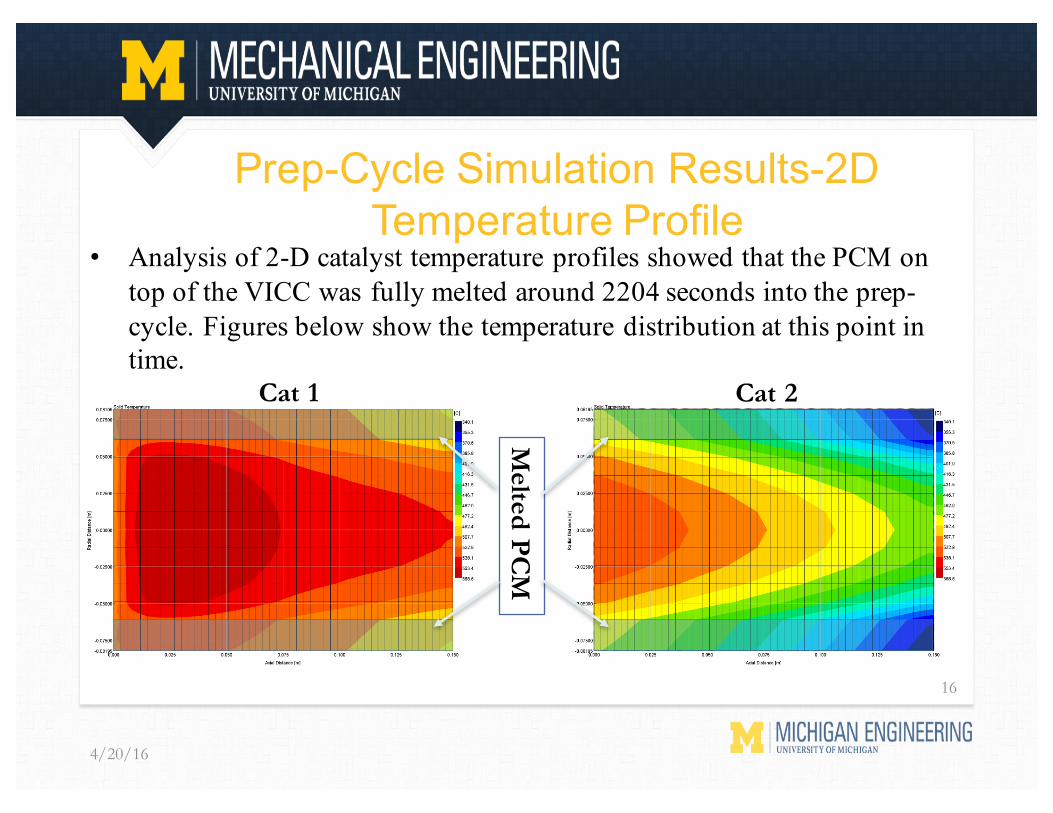
Prep-Cycle Simulation Results-2D Temperature Profile
• Analysis of 2-D catalyst temperature profiles showed that the PCM on top of the VICC was fully melted around 2204 seconds into the prep-cycle. Figures below show the temperature distribution at this point in time.
4/20/16
16
Cat 1 Cat 2
Melted PC
M

Soak Simulation Results-Wall Temperature (One-Inch Front Centre, Front Brick)
4/20/16
17
• Following prep-cycle simulations, the GT-Suite model was simulated for different periods of vehicle soak (3 hours, 6 hours, etc.). Following this, emissions were compared with a CC over the first bag of FTP
VICC is nearly isothermal during soak
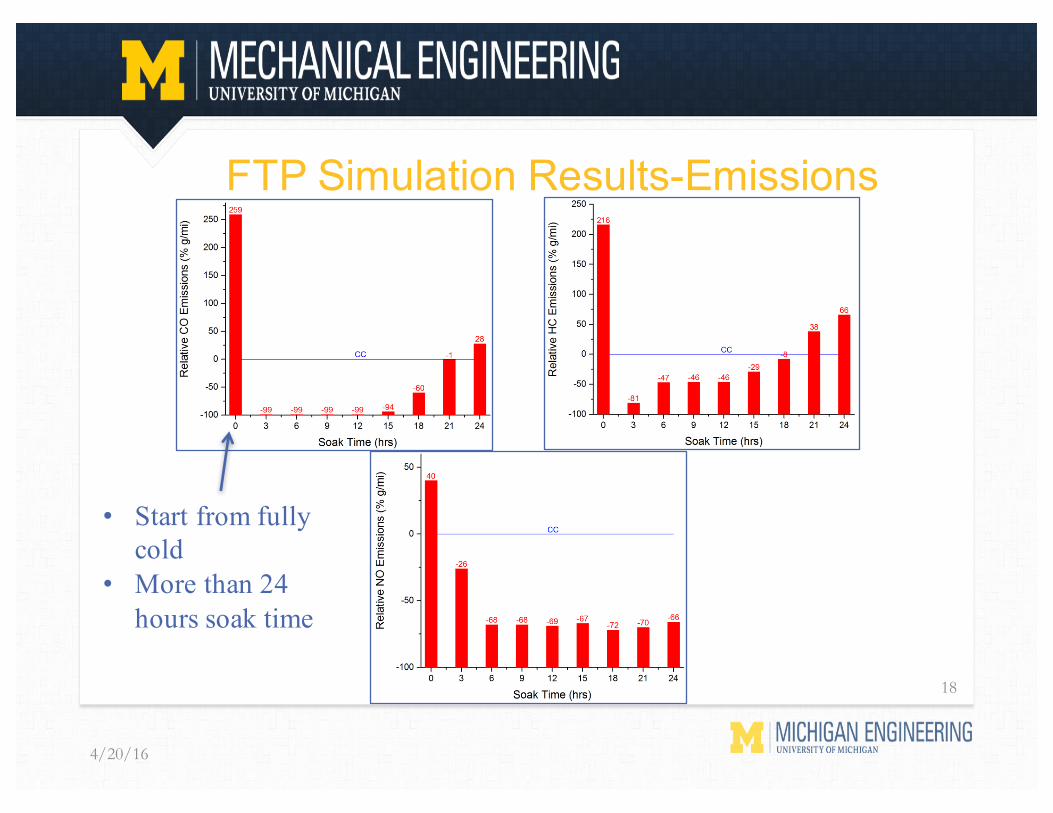
FTP Simulation Results-Emissions
4/20/16
18
• Start from fully cold
• More than 24 hours soak time

HEV Prep-Cycle Simulation Results-Engine State
4/20/16
19

HEV Prep-Cycle Simulation Results-Wall Temperature
(One-Inch Front Centre)
4/20/16
20
Front Brick

HEV Prep-Cycle Simulation Results-Wall Temperature
(One-Inch Rear Centre)
4/20/16
21
Second Brick

HEV Prep-Cycle Simulation Results-2D Temperature Profile
• Analysis of 2-D catalyst temperature profiles showed that the PCM on top of the VICC was fully melted around 2324 seconds into the prep-cycle. Figures below show the temperature distribution at this point in time
4/20/16
Cat 1
22
Cat 2
Melted PC
M

HEV FTP Simulation Results-Emissions
4/20/16
23
Start from Fully cold

• In order to analyze the usefulness of the VICC in the real-world, driving data was obtained from the National Renewable Energy Laboratory (NREL) through their light-duty Transportation Secure Database Center
• The two most recent surveys were conducted in California and Atlanta, in 2012 and 2011 respectively. These two datasets were used for all analyses. NREL had processed all the driving data into real-world speed vs time “drive cycles”
• The real-world research was split in two directions. First, two random (but distinct) drive cycles were selected from the Atlanta dataset, and simulated using GT-Suite. This would give a representation of the how the VICC would compare to a CC in a real-world sample
• Second, a MATLAB code was developed to statistically analyze all 23,156 cycles for information like soak time distribution, PCM melt and re-solidification probability 24
Real-World Simulation Results
4/20/16

First Real-World Drive Cycle-Speed Profile
4/20/16
25

First Real-World Drive Cycle-Emissions
4/20/16
26
Start from Fully cold
• Short cycles do not melt the PCM
• Modeled as fully cold
• See below for probability of this

Second Real-World Drive Cycle-Speed Profile
4/20/16
27

Second Real-World Drive Cycle-Emissions
4/20/16
28
Start from Fully cold

• To perform detailed statistical analysis of the data, a MATLAB code was developed
• First, information regarding soak times was desired. To do this, soak times were split into hourly ranges (0-1 hour, 1-2 hours etc.) after filtering out soaks less than 300 seconds. This was an arbitrary threshold chosen to differentiate between soak and idle periods. To compare the number of soaks in each range, a soak time probability was defined as follows:
𝑆𝑜𝑎𝑘 𝑇𝑖𝑚𝑒 𝑃𝑟𝑜𝑏𝑎𝑏𝑖𝑙𝑖𝑡𝑦 𝑅1 − 𝑅2 = 56789 :;<=>? 6@ A76BC DEFDG56789 :;<=>? 6@ A76BC
where R1 and R2 represent the two limits of the soak-time range (For eg. R1 = 0 and R2 = 1 for 0-1 hour soak). Using this equation, probability vs soak time range plots were obtained for the Atlanta and California datasets
29
Statistical Analysis of Real World Data
4/20/16

Soak Time Probability-Atlanta
4/20/16
30
• Approximately 99% of the time soak is less than 10 hours
• Thus, <1% of starts are fully cold!

Soak Time Probability-California
4/20/16
31

Compare cooling rate versus likely soak time
4/20/16
32

Weighted FTP Emissions
4/20/16
Weighted First Bag FTP CO [% g/mi] HC [% g/mi] NO [% g/mi]
-26 -48 11
• As can be seen from the figures, more than 50% of soaks were less than one hour long. The remaining soaks were mostly distributed from 1-11 hours, with very few long soaks
• These probabilities were then multiplied with the FTP emission results for a conventional vehicle. Thus, relative emissions after a 3-hour soak were multiplied with soak time probabilities between 1-2, 2-3 and 3-4 hours (6-hour soak with 4-5, 5-6, 6-7 hours etc.)
• The resulting numbers are shown below. This represents a conservative estimate of the predicted cold-start emissions improvements from the VICC
33

4/20/16
• An important question to ask in any real-world driving cycle is: What is the probability that the PCM will melt early enough in a given driving cycle to allow the VICC to fully utilize its heat retention capacity?
• Information regarding this melt time (and/or the probability of melting) would represent substantial evidence with which to judge this advanced insulation technology
• NREL dataset consisted of only speed and acceleration vs time data • It was hypothesized that there exists a direct relationship between vehicle
speed, vehicle acceleration and PCM melt time• While driving at higher speeds or accelerations, more exhaust gas energy
is available for the PCM to absorb (indirectly via the catalyst brick) and use for melting
34
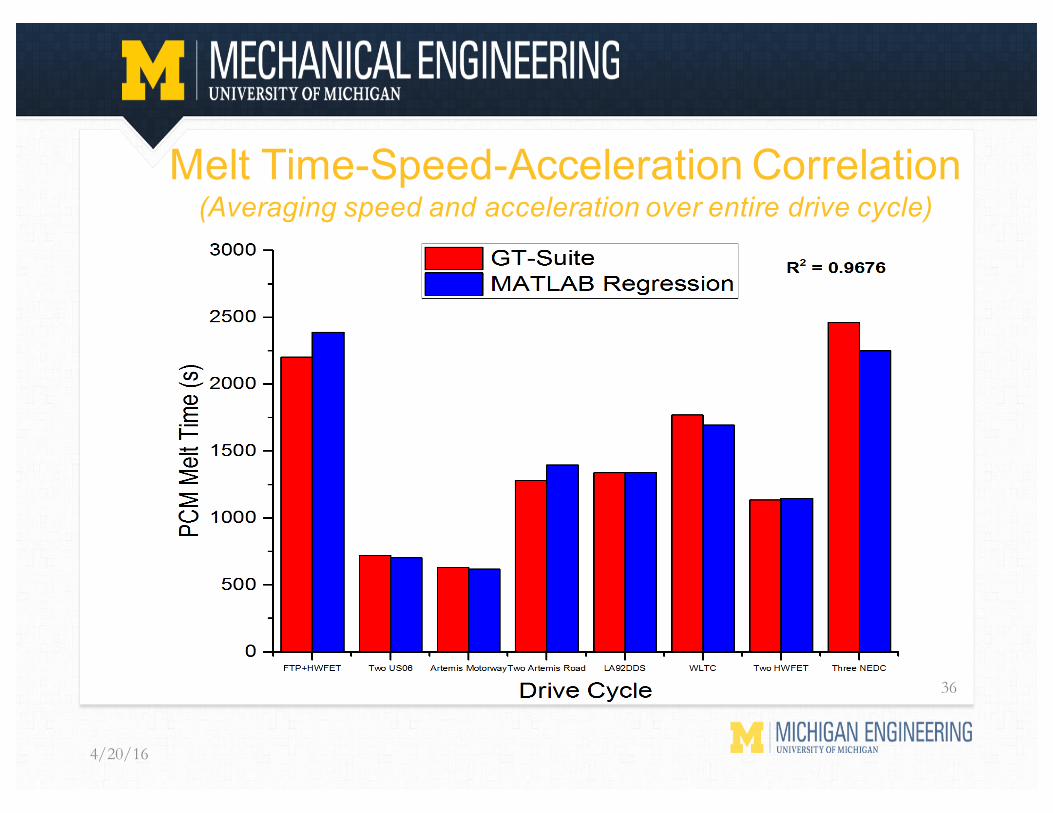
Melt Time-Speed-Acceleration Correlation(Averaging speed and acceleration over entire drive cycle)

Melt Time-Speed-Acceleration Correlation(Averaging speed and acceleration over entire drive cycle)
• In order to obtain the relationship between PCM melt time, vehicle speed and vehicle (positive) acceleration, various different standard drive cycles were simulated using the VICC vehicle-aftertreatment model in GT-Suite
• 𝑇𝑚𝑒𝑙𝑡 = 3635.3 − 46.6 ∗ 𝑆 − 1305.4 ∗ 𝐴 + 40.7105 ∗ 𝑆 ∗ 𝐴 −0.1654 ∗ 𝑆2 − 691.6258 ∗ 𝐴2
Where Tmelt = Time for PCM to melt in secondsS = Average drive cycle speed in mphA = Average positive drive cycle acceleration in mph/s• Comparison plot of GT-Suite simulation melt time and MATLAB
regression melt time are shown on the next slide
4/20/16
35
Melt Time-Speed-Acceleration Correlation(Averaging speed and acceleration over entire drive cycle)
4/20/16
36

Melting and Re-Solidification Probability
4/20/16
Atlanta California WeightedMelt Time Probability 0.42 0.38 0.40Max Re-Solidification Probability (if melted in first drive cycle) 0.45 0.46 0.45
• The statistical equation was used to obtain a probability that the PCM will melt in the first drive cycle – assuming it was fully cold at the start(conservative assumption)
• If it did, the probability that there is a soak of 6-hours (PCM solidification time) or more in the rest of the drive cycle was estimated, and defined as maximum re-solidification probability
• All of these analyses can be extended further to examine how much of the PCM latent heat will be available for heat retention purposes at a given point in a real-world driving cycle
37

• This work was a brief modeling study• Many possible design alternatives were not explored• VICC variables
– PCM amount – heat storage versus light off thermal mass– PCM and brick geometry
• Smaller diameter, longer bricks give higher heat transfer to PCM• Ceramic brick mat mounts reduce heat flow between catalyst and PCM – longer melt times but less effect on
warm up for a fully-cold system• PCM could be offset from bricks – leave front of brick uncovered to improve fully-cold light off
• Fast light off engine strategies– We simply assumed 100°C increase for 100 seconds. Other strategies are obviously
possible.
• Vehicle, engine, and catalyst models are fairly crude• EPA offers credits for real-world benefits. VICC can reduce real-world
emissions by keeping the catalyst warm for almost all starts.
4/20/16
38
Discussion

• The VICC greatly extends catalyst cooling time• Thermal mass of the PCM makes fully-cold start emission higher, but this
is a relatively unlikely event in real world driving• Cold start emissions for most starts will be greatly reduced• Following 12-hour soak simulations, the FTP first bag CO, HC and NO
emissions improved by 99%, 46% and 69% respectively. Similarly high improvements were seen for hybrid vehicles.
• For real-world drive cycle simulations, noticeable improvements in emissions were seen following vehicle soaks of 2-hours or more
• Using soak time distributions, the FTP emissions were weighted, and gave CO and HC improvements of 26% and 48% respectively
4/20/16
39
Conclusions

References• Adamczyk, A. A., C. P. Hubbard, F. Ament, S. H. Oh, M. J. Brady, and M. C. Yee. Experimental and
modeling evaluations of a vacuum-insulated catalytic converter. No. 1999-01-3678. SAE Technical Paper, 1999
• Burch, Steven D., Matthew A. Keyser, Thomas F. Potter, and David K. Benson. Thermal analysis and testing of a vacuum insulated catalytic converter. No. 941998. SAE Technical Paper, 1994.
• Burch, Steven D., Thomas F. Potter, Matthew A. Keyser, Michael J. Brady, and Kenton F. Michaels. Reducing cold-start emissions by catalytic converter thermal management. No. 950409. SAE Technical Paper, 1995.
• Burch, Steven D., Matthew A. Keyser, Chris P. Colucci, Thomas F. Potter, David K. Benson, and John P. Biel. Applications and benefits of catalytic converter thermal management. No. 961134. SAE Technical Paper, 1996.
• Burch, Steven D., and John P. Biel. SULEV and “Off-Cycle” Emissions Benefits of a Vacuum-Insulated Catalytic Converter. No. 1999-01-0461. SAE Technical Paper, 1999.
• Burch, Steven D., Richard C. Parish, and Matthew A. Keyser. Thermal management of batteries using a Variable-Conductance Insulation (VCI) enclosure. No. NREL/TP--473-7783; CONF-950729--5. National Renewable Energy Lab., Golden, CO (United States), 1995.
• Chen, David KS. A numerical model for thermal problems in exhaust systems. No. 931070. SAE Technical Paper, 1993.
• Daya, R., Hoard, J., Chanda, S., and Singh, M., "Vehicle and Drive Cycle Simulation of a Vacuum Insulated Catalytic Converter," SAE Technical Paper 2016-01-0967, 2016, doi:10.4271/2016-01-0967.
40
4/20/16

References• Gulati, Suresh T., Lisa F. Jones, Michael J. Brady, Ron Baker, Barry Kessler, Mike Zammit, Benny
Snider, and Sivanandi Rajadurai. Advanced three-way converter system for high temperature exhaust aftertreatment. No. 970265. SAE Technical Paper, 1997.
• Hartsock, Dale L., Ernest D. Stiles, William C. Bable, and John V. Kranig. Analytical and experimental evaluation of a thermally insulated automotive exhaust system. No. 940312. SAE Technical Paper, 1994.
• Holder, R., M. Bollig, D. R. Anderson, and J. K. Hochmuth. "A discussion on transport phenomena and three-way kinetics of monolithic converters.“ Chemical Engineering Science 61, no. 24 (2006): 8010-8027.
• Hosoi, Akihito, Atsushi Morita, and Naoto Suzuki. "Thermal Analysis of the Exhaust Line Focused on the Cool-Down Process." SAE International Journal of Engines 7, no. 1 (2014): 32-42.
• Karwa, Manoj K., Frederick B. Hill, John P. Biel, and Mark Crocker. Integration of engine controls, exhaust components and advanced catalytic converters for ULEV and SULEV applications. No. 2001-01-3664. SAE Technical Paper, 2001.
• Korin, E., R. Reshef, D. Tshernichovesky, and E. Sher. Improving cold-start functioning of catalytic converters by using phase-change materials. No. 980671. SAE Technical Paper, 1998.
• Lamberg, Piia, Reijo Lehtiniemi, and Anna-Maria Henell."Numerical and experimental investigation of melting and freezing processes in phase change material storage." International Journal of Thermal Sciences 43, no.3 (2004): 277-287.
• Mondt, J. R. "Adapting the heat and mass transfer analogy to model performance of automotive catalytic converters." Journal of engineering for gas turbines and power 109, no. 2 (1987): 200-206.
41
4/20/16

References• Ramanathan, Karthik, and Chander Shekhar Sharma. "Kinetic parameters estimation for three way
catalyst modeling." Industrial & Engineering Chemistry Research 50, no. 17 (2011): 9960-9979.• Risueño, E., A. Faik, J. Rodríguez-Aseguinolaza, P.Blanco-Rodríguez, A. Gil, M. Tello, and B.
D’Aguanno. Mg-Zn-Al Eutectic Alloys as Phase Change Material for Latent Heat Thermal Energy Storage. Energy Procedia 69 (2015): 1006-1013
• Shayler, Paul J., D. J. Hayden, and T. Ma. Exhaust system heat transfer and catalytic converter performance. No. 1999-01-0453. SAE Technical Paper, 1999.
• U.S. Environmental Protection Agency (EPA), 1993 "Federal Test Procedure Review Project:PreliminaryTechnical Report," EPA 420-R-93-007, May 1993. 140
• Weilenmann, Martin, Jean-Yves Favez, and Robert Alvarez. "Cold-start emissions of modern passenger cars at different low ambient temperatures and their evolution over vehicle legislation categories." Atmospheric environment 43, no. 15 (2009): 2419-2429.
• Wendland, Daniel W., Philip L. Sorrell, and John E. Kreucher. Sources of monolith catalytic converter pressure loss. No. 912372. SAE Technical Paper, 1991.
• Wendland, Daniel W. Automobile exhaust-system steady-state heat transfer. No. 931085. SAE Technical Paper, 1993.
• Zhao, Y., and D. E. Winterbone. A study of warm-up processes in SI engine exhaust systems. No. 931094. SAE Technical Paper, 1993.
42
4/20/16

Backup Slides
4/20/16
43

Cold-Start Converter Modeling
44
4/20/16

45
4/20/16
Cold-Start Converter Modeling

Aftertreatment GT-Power Model
46
4/20/16
• The dimensions of the stainless-steel pipe and cone elements were determined through careful measurement of the prototype converter
• Additionally, the thermal properties of the vacuum layer were considered to be extremely low (thermal mass~1e-7 J/m3-K), but not zero for model stability considerations
• Due to the non-uniformity of the outer layers in the prototype, an equivalent average thickness was calculated for the model
• Refer to published SAE Paper [Daya et al.] for exact dimensional specifications used in GT model
4/20/16
47
VICC Design Modeling(Sections I and III)

• Section-II consisted of two metallic substrates arranged in series. The substrates were surrounded by two outer layers comprising of stainless steel and phase-change material (PCM)
• The PCM used for the present simulation was a Magnesium-Zinc-Aluminum (Mg-Zn-Al) metal eutectic alloy
• The density and specific heat of the PCM were evaluated using individual element properties and mass fractions, and the thermal conductivity was taken from a 2015 reference [Risueño et al.]
4/20/16
48
VICC Design Modeling (Section II)
Species Eutectic Mass Fraction
Eutectic Mole Fraction
Magnesium 0.49 0.70
Zinc 0.48 0.26
Aluminum 0.03 0.04

• The latent heat capacity of the PCM was incorporated into the specific heat using the effective heat capacity method [Lamberg et al.]
• Some properties of Section-II of the VICC are listed below
4/20/16
49
VICC Design Modeling (Section II)

• Material Used for VICC substrates: Stainless Steel (0.05 mm thickness) with Alumina washcoat (0.03 mm thickness)
• Conventional Converter (CC) modeled (for comparative studies) identically to VICC without the outer vacuum and PCM layers.
• CC substrate changed from Stainless Steel to Cordierite (0.15 mm thickness). Intumescent mat (XPE AV-2 with 0.58 cm thickness) placed above CC (thermal properties obtained directly from Unifrax)
4/20/16
50
VICC Design Modeling (Section II)

• Metallic bellows were not modeled explicitly due to their complex geometry. Instead, the reduction in conduction heat loss was modeled using a “no-conduction” orifice between the pipe and cone elements
• The dimensional change of the phase-change material (PCM) on melting/solidification is not considered
• The thermal properties of the PCM were assumed to undergo a step change during melting/solidification
• The copper foil radiation shield was modeled implicitly as a reduction in the surface emissivity of the stainless-steel above which it was present (by 95%)
4/20/16
51
VICC Design Modeling Assumptions

• Heat transfer from the external surfaces of the system takes place by convection and radiation; the combined rate to the surface of an element with an external surface area of A is:
where Fv is the grey body view factor and ε is the surface emissivity• The product εFv was taken as 0.59 from well- know SAE reference
[Shayler et al.]• External Heat Transfer Coefficient above Pipe and Cone Elements
determined using same referenceℎ𝑜 = 10 + 0.42 ∗ 𝑉𝑠
where Vs is vehicle speed in kph
Note: Text in red indicates model updates AFTER SAE paper submission
4/20/16
52
Aftertreatment Heat Transfer Modeling (Exhaust Pipes and VICC Cones)

• The heat transfer through the catalyst substrate wall was modeled using a 2-D conduction object that considered both axial and radial conduction in the substrate
• Radial Distance Discretization Multiplier (RDDM) = 1.0 (equidistant)
4/20/16
53
Aftertreatment Heat Transfer Modeling (VICC Substrates)
No. of Radial Sub-Volumes 10No. of Axial Sub-Volumes 50

• Outer Layers above both substratesà Stainless Steel, PCM, Stainless Steel, Vacuum Hydride Insulation
• In GT-SUITE, 2-D Conductionà Lumping of Outer Layers (they are working on fix for v2017 after they learnt about this issue)
• Fix for our modelà Vacuum Layer modeled implicitly as a reduction in external heat transfer coefficient above both substrates
ℎ𝑜 =1
𝐸𝑥𝑡𝑒𝑟𝑛𝑎𝑙 ℎ 𝑟𝑒𝑑𝑢𝑐𝑡𝑖𝑜𝑛 𝑓𝑎𝑐𝑡𝑜𝑟 ∗ (10 + 0.42 ∗ 𝑉𝑠)
4/20/16
54
Aftertreatment Heat Transfer Modeling (VICC Substrates)
Calibrated using 1999 VICC experimental temperature data

• A sample template was used to model the three-way catalyst (TWC) reaction mechanism [TWC_Ramanathan_and_Sharma]
4/20/16
55
Reaction Mechanism Modeling (VICC Substrates)
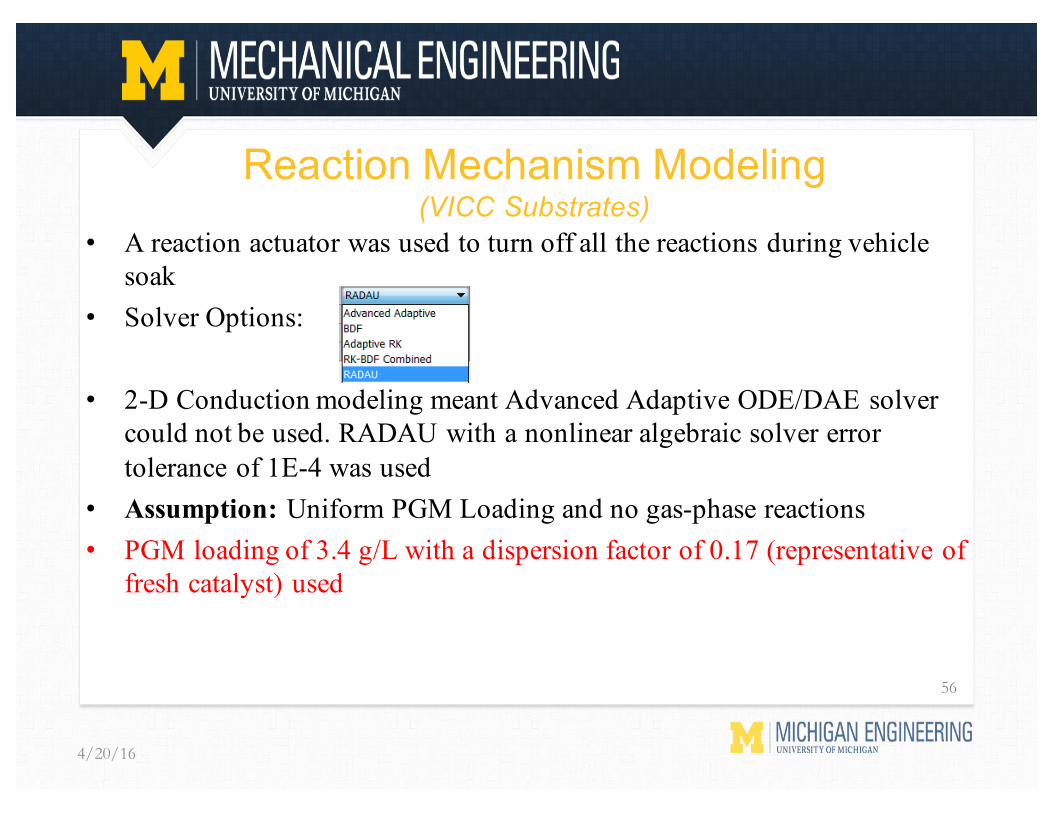
• A reaction actuator was used to turn off all the reactions during vehicle soak
• Solver Options:
• 2-D Conduction modeling meant Advanced Adaptive ODE/DAE solver could not be used. RADAU with a nonlinear algebraic solver error tolerance of 1E-4 was used
• Assumption: Uniform PGM Loading and no gas-phase reactions• PGM loading of 3.4 g/L with a dispersion factor of 0.17 (representative of
fresh catalyst) used
4/20/16
56
Reaction Mechanism Modeling (VICC Substrates)

• Assumption: Plug flow at catalyst inlet and fully-developed laminar flow inside both substrates (constant Nusselt number along the length of the brick)
• No friction or heat transfer multipliers used due to lack of experimental data
• Flow Solver Recommended for Aftertreatment Models: Quasi-Steady• Thermal Solver: Transient• Real-Gas option used with Redlich-Kwong Equation of State:
• Time-marching scheme: Explicit Runge-Kutta (5th order accurate)• Time-step for flow, temperature and RLT calculations: 0.1 s
4/20/16
57
Flow Modeling and Solver Characteristics

Vehicle-Aftertreatment GT-Power Model
58
4/20/16

• Steady-state engine-out speed-load maps obtained from an automotive OEM
• Influence of spark retard modeled as 100°C temperature increase for 100 seconds
• 3-sets of maps for different engine displacements: 2 L, 3.5 L & 6.2 L• Maps included: Engine-out CO, HC and NO, exhaust-gas temperatures
and exhaust flow rates• Information from OEM about other species: CO2 (~14.6%), O2 (0.4-
0.8%) and H2O (~13.5% including humidity)• Lack of exact O2 data meant not all maps could be used with good
lambda control (lack of good control compromises emission results)
4/20/16
59
Engine-State Modeling

• Engine-out O2 estimatedà Control system used to calculate stoich O2from reaction equation balance
where yi refers to mole fraction of species i , ci refers to mass fraction of species i and MW refers to Molecular Weight in g/mol. Species coefficients represent number of moles of O2 needed to completely oxidize/reduce one mole of the exhaust species• Observation: 3.5 L maps did best in terms of lambda window
oscillations. Thus, these maps were used for all analysis
4/20/16
60
Engine-State Modeling

• Engine-Out CO2 and H2O were fixed at 14.6% (by vol.) and 13.5% (by vol.) respectively
• Engine-out HC was composed of 80% (by volume) propylene (representative of fast HC) and 20% propane (representative of slow HC)
• The mole fraction of hydrogen was assumed to be 1/3rd the mole fraction of CO due to unavailability of engine-out H2 data
• NOx out of the engine was assumed to consist only of NO
4/20/16
61
Engine-State Modeling Assumptions
Vehicle-Aftertreatment GT-Power Model
4/20/16
62

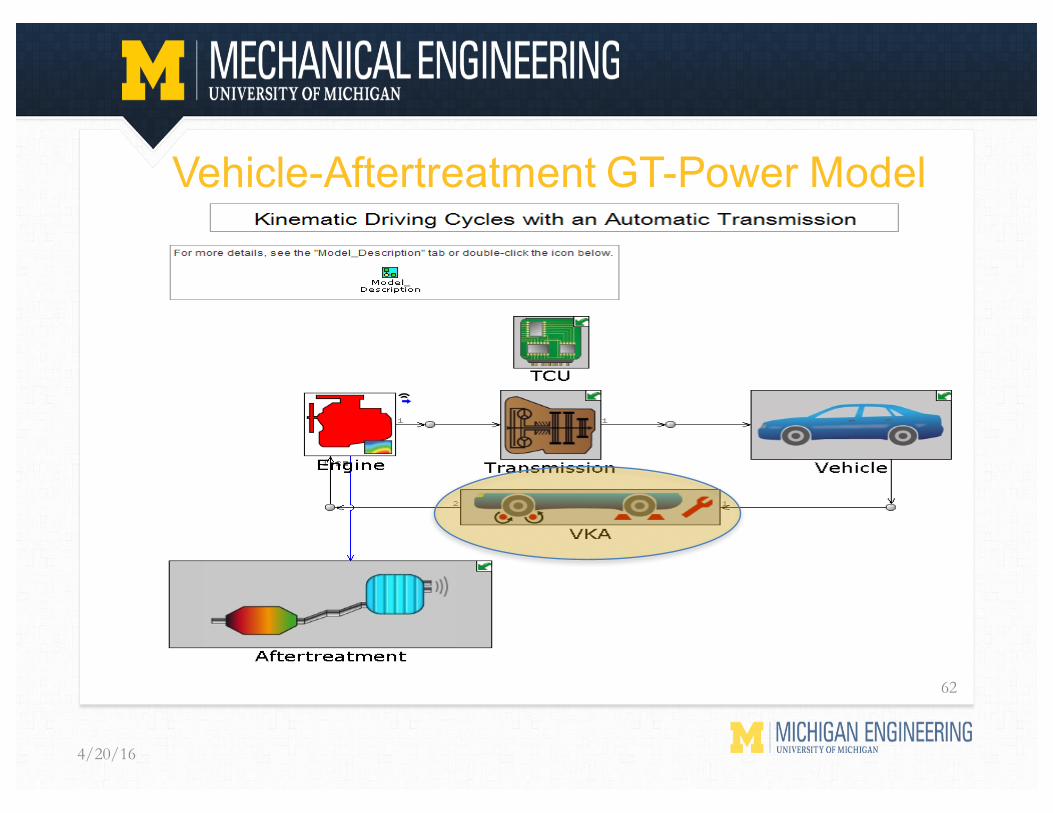
• In simulations of vehicles for driving cycle fuel economy and emissions, it is sometimes convenient to directly impose the state (typically speed) of a node on the driveline
• For an energy balance to be satisfied at all times, this requires allowing a source or sink of power, and the torque or force associated with this source, to “float” and be solved for by this simulation
• In GT-Suite, the term kinematic analysis is used to describe these types of simulations
• The drive cycle speed (in km/hr) was imposed using the vehicle kinematic analysis (VKA) object. This imposed speed was used to evaluate the engine speed and brake torque, and therefore estimate the engine-out emissions and exhaust gas temperature using emissions and temperature maps
4/20/16
63
Vehicle Kinematic Analysis (VKA) Object Modeling
Vehicle-Aftertreatment GT-Power Model
64
4/20/16

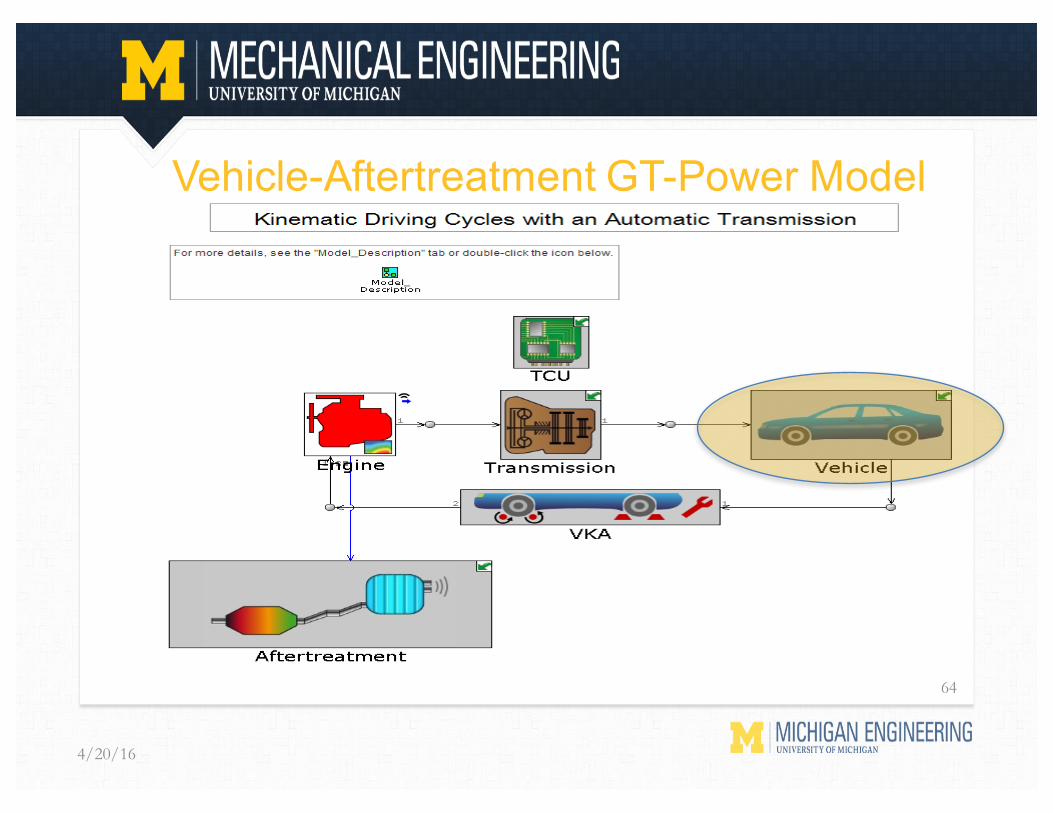
• Vehicle specifications representative of a D-class passenger car (3.5 L naturally aspirated engine) were used.
4/20/16
65
Vehicle Object Modeling
Vehicle-Aftertreatment GT-Power Model
4/20/16
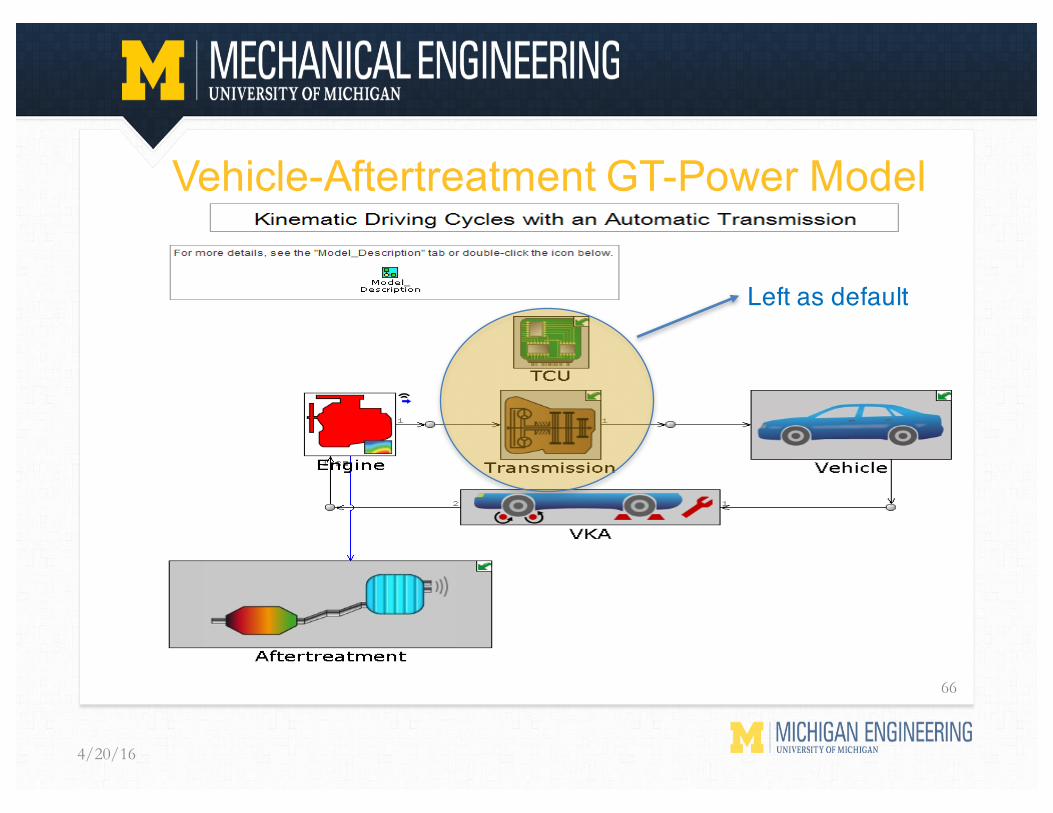
Left as default
66

HEV-Aftertreatment GT-Power Model
4/20/16
67

HEV-Aftertreatment GT-Power Model
4/20/16
68
• To examine the benefits of the VICC on a HEV, a dynamic power-split HEV-aftertreatment model was constructed using GT-Suite.
• The engine and vehicle components were modified in a manner similar to the conventional vehicle model. The vehicle used for hybrid simulations was a 2013 Infiniti M35h with an engine displacement of 3.5L. Some specifications of the vehicle are shown below.
• During soak a temperature gradient exists between the engine and the exhaust tailpipe
• This gradient sets up a mass flow of air through natural convection from the tailpipe to the engine, a process known as thermosiphon effect
• This flow was measured on two vehicles• Results of this test were not only useful as inputs for our model
simulations, but can also be used for other exhaust flow and heat transfer investigations
4/20/16
69
Exhaust System Air Flow Experiment

• Experimental Setup: The measurement system used to quantify the exhaust flow rate of tested vehicles was a Sensidyne Gilibrator-2 flow meter. The exhaust flow was passed through the flow meter using custom connectionsThe flow meter was connected to the exhaust tailpipe of a vehicle using stainless-steel clamps, a rubber housing and a plastic reducer. The experimental setup is shown below
4/20/16
70
Exhaust System Air Flow Experiment

• Experimental Results:
4/20/16
71
Engine Speed (RPM)
Manifold Air Flow Rate (g/s)
Relative Throttle
Position (%)
Idle Operation 800 2.55 1.96
Soak 0 0.39 3.92
Exhaust System Air Flow Experiment

• Experimental Results: This flow rate was used in a GT-Suite vehicle-aftertreatment model with a conventional converter and simulated for 3-hours of vehicle soak (following an FTP prep-cycle simulation).Figure below shows temperature plot. It was concluded that the thermosiphon flow did not have a significant influence on converter cooldown.
4/20/16
72
Exhaust System Air Flow Experiment
• The vacuum-insulation and PCM outer layers were successfully able to keep the converter above 350°C for at least 12 hours of vehicle soak
• Due to the high thermal mass of the PCM, the VICC was noticeably slower in reaching light-off temperatures, and this led to increased baseline cold-start emissions on all drive cycles, ambient conditions and vehicle types
• Following 12 hours of vehicle soak, CO, HC and NOx emissions improved by 92%, 61% and 84% respectively over the first bag of the FTP
• For all simulated drive cycles, CO and HC emissions were reduced significantly following 12-hour vehicle soaks
4/20/16
73
Key Conclusions from SAE Paper

• As long as the VICC remained above light-off temperature following vehicle soak, the benefits in emissions were identical for a range of ambient temperatures. Following 24-hours of vehicle soak, the VICC did relatively worse for lower ambient temperatures
• The heat retention capacity of the VICC led to higher emissions reductions for HEVs compared to conventional vehicles following 12-hour vehicle soaks. Thus, HEVs represent an attractive application for this advanced emission control technology
4/20/16
74
Key Conclusions from SAE Paper