instruments and methods used for measuring spectral light intensities by photography
TRANSCRIPT

INSTRUMENT SECTIONINSTRUMENTS AND METHODS USED FOR MEASURING
SPECTRAL LIGHT INTENSITIES BY PHOTOGRAPHY*
By GEORGE R. HARRISON
CONTENTSPage
I. Introduction ........ 268If. The General Principles of Photographic Photometry. 270
1. Characteristics of Photographic Emulsions . .271a. The Characteristic Curve .271b. Variation of the Characteristic Curve with Type of Emulsion ............ 274c. Variation of Emulsion Characteristics with Wave Length .275
2. Photometry . ....................................................... 277a. Homochromatic Spectrophotometry. 277b. Heterochromatic Spectrophotometry .279
III. General Apparatus and Methods . . .2801. Spectrographic Outfits .. 280
a. The Spectrograph .280b. Grating Mountings .282c. Illumination of Spectrograph Slit .283d. Plate Holders and Cassettes .283
2. Timing of Exposures .. 2843. Sources of Light for Calibration .. 2854. Methods of Varying Intensity for Producing Calibration Curves . .287
a. Neutral Methods .................................................... 287b. Selective Methods .................................................. 288
5. Standard Sources ............................... 290a. Continuous Sources ................................................ 290b. Line Sources ....................................................... 293c. Corrections for Dispersion and Line Breadth ........... ................ 294
6. Development................................ 295a. Developers........................................................ 295
b. The Eberhard Effect ................... 296c. Treatment after Development ....................... 297d. The 'Brush Effect ................ ,., .,.,,.,.297
7. Densitometers and Microphotometers ...................... 297a. General........................................................... 297b. Thermoelectric Microphotometers .................................... 299c. Photoelectric Microphotometers ...................................... 301d. Microphotometers of Other Types ..................................... 303e. The Microphotometry of Spectrum Plates ............... .............. 303
IV. Special Methods of Photographic Photometry . . .............................. 3061. Methods for Calibrating with a Single Exposure ............. ............... 306
a. General............................................... ..... 306
* A summary prepared at the request of the Editors.
267

268 GEORGE R. HARRISON [J.O.S.A. & R.S.I., 19
- Pageb. Step Weakeners .............................. 306c. The Wedge Method ............................ 306d. Intensity Distribution from Coarse Gratings . ................ 307e. Line Intensity Distribution ......................... 307
2. Limiting Density Methods . ..................................... 307a. The Outline Wedge Method ........................ 307b. The Coarse Grating method ......................... 308
3. Methods Primarily for Use in Absorption or Reflection Measurements. (SpecialHomochromatic Methods) ......................................... 308
a. The Hilger Sector Photometer ....................................... 308b. Lewis' Sector Photometer .......................................... 308c. Jones' Method ......................................... 308d. Other Methods .......................................... 309
V. Special Spectral Regions ............................. 3091. The Infrared ......................................... 3092. The Visible ........................................... 3093. The Ultraviolet ......................................... 3104. The Schumann Region ......................................... 3105. The X-ray Region .......................................... 311
VI. Conclusion............................................................... 311
I. INTRODUCTION
With the growing importance of precise measures of light intensity,particularly in spectroscopy, increased attention is being paid to thedevelopment of apparatus and procedure designed to make determina-tions of intensity accurate, convenient, and rapid. Three objectivemethods, which may be designated respectively the radiometric, thephotoelectric, and the photographic, are available. Each one of thesehas certain advantages, and it is the purpose of the present article todiscuss the type of investigation in which the photographic methodis most useful, comparing critically the various types of photographicspectrophotometry which have been proposed.
For the direct comparison of spectral lines of sufficient intensity fromconstant sources the thermopile or thermocouple is most convenient,for its response is definite, and is proportional to the incident lightintensity at all wave lengths. It can be made as sensitive as the Nicholsradiometer, the bolometer, or the radiomicrometer,l which are the mostimportant of the other sensitive radiation meters which give a responseindependent of the wave length of the light being measured, and it isthe most easily handled. Some one of these is always the court of lastresort in measuring spectral light intensities, for when in hetero-chromatic photometry a photographic or a photoelectric instrument isused, it must be standardized by reference to some non-selective device.The thermo-relay of Moll and Burger2 has greatly increased the use-
PHOTOGRAPHIC PHOTOMETRY
fulness of the vacuum thermo-element. Radiometers, however, aregenerally usable only with spectrometers of low resolving power. Theirdirect use in spectrophotometry is indicated when simple spectra fromconstant sources of great intensity are to be measured.
The photoelectric cell has been greatly improved in recent years, andis convenient for many problems involving measures of intensity.Cells can be obtained which are sensitive to any portion of the spectrumbetween 2000 A and 10,000 A, although no single cell is competentfor that entire range. The dependence of the response on wave lengthremains the greatest drawback to the use of the photoelectric cell forspectrophotometry. The high sensitivity which is attainable, especiallywhen use is made of vacuum tube amplifiers, and the practically in-stantaneous response, make the cell very useful for homochromaticphotometry employed in various problems; as for instance, the de-termination of transmission or reflection factors of materials at variouswave lengths.'
By far the most generally applicable method in spectrophotometryis that in which the photographic emulsion is the sensitive medium,its response being calibrated by means of the photoelectric cellor thermo-couple, and standardized in terms of the thermocouple or other non-selective radiometer. By calibration I mean the determination of thedependence of response upon intensity at individual wave lengths inthe spectrum; standardization refers to the determination of the varia-tion of this dependence with wave length. In addition the degree ofresponse of the emulsion must be measured by means of a densitometeror microphotometer which generally contains a thermocouple or photo-electric cell as the sensitive element. The chief advantages of the photo-graphic method are, (1) the emulsion acts as a recording medium, giving.a permanent fixed response to a large number of simultaneously in-cident intensities, (2) it acts as an integrating medium, summing up thetotal energy falling on it at a particular spot, and (3) it furnishes thesensitivity not available in the photoelectric cell or the thermopile.
Whenever high resolving power, or low light intensity, or a variablelight source, or dozens of simultaneous readings are involved, the in-vestigator is generally wise to use the photographic method. It stilllabors somewhat under a cloud because of the large number of photo-graphic investigations performed in the past without adequate control.Nevertheless, the modern emulsion, if properly handled, is an extremelytrustworthy and useful scientific tool.
November, 19291 269
GEORGE R. HARRISON [J.O.S.A. & R.S.I., 19
I shall discuss the general principles of photographic photometryfirst, and afterwards the various approximations and simplificationsapplicable to special problems. Four references to general discussionsof the subject may be given at this point. Ornstein, director of thephysical laboratory at Utrecht, where many of the chief developmentsand applications of photographic photometry have been made in thepast few years, has summarized in two papers the methods used andthe results obtained in his institute.4 Dorgelo has written a similarsummary.5 Dobson, Griffiths, and Harrison, in England, have pub-lished a book on the subject,6 but its chief emphasis is laid on the wedgemethods.*
II. THE GENERAL PRINCIPLES OF PHOTOGRAPHIC PHOTOM)ETRY
For many years it was believed that the photographic emulsioncould be used only as a qualitative measuring instrument, for inpractice it was found that apparently identical emulsions affected byidentical light intensities would yield responses varying many percent.This undoubtedly arose from the large number of variable factors in-volved. It is now known that the best modern emulsions when properlyhandled give results reproducible to less than 3%, and as a large num-ber of measurements of the same quantity can quickly be made,final values with a probable error smaller than 1% can be obtainedby the photographic method.
When a photographic emulsion has been exposed to an incidentbeam of light, developed, washed, fixed, and dried, the consequentblackening is influenced by a multitude of factors. The chief of theseare the intensity of the light I, the time of exposure I, the wave lengthof the light X, the character of the emulsion, the kind of developer used,and the time, temperature, and character of development. Severalminor causes of variation, including the temperature of the plate at thetime of exposure, the rate of drying, and the geometrical position of theimage on the plate, can be neglected for the time being.
The degree of blackening of the plate is generally measured by passinga beam of light through it, and determining the reduction in in-tensity of this beam. If we represent the incident intensity by i, (todistinguish it from the intensity I which originally produced the black-ening), and the transmitted intensity by i', then i/i' is called theopacity, 0, of the plate, and logloO = d, the density. It is usually more
* I am greatly indebted to Dr. K. K. Darrow for valuable criticism and advice in preparingthe present article.
270

PHOTOGRAPHIC PHOTOMETRY
convenient to work with densities than with opacities, since they givesimpler curves when plotted against the other variables.
In order to represent the curve connecting the different variableswhich control the emulsion response, at least a nine-dimensional figurewould be required. Fortunately it is possible to keep a large number ofthese variables constant during any experiment. The density d andintensity I are fundamentally involved, as is the wave length X.* Wethus are chiefly interested in a curve in three-dimensional space con-necting density, intensity, and wave length, if we can keep the time ofexposure, the character of the emulsion, and the development constant.
In certain cases there is no need for direct comparison of light in-tensities associated with different wave lengths; where the variable Xdoes not enter we shall refer to the process as homochromatic. Whereintensities in different spectral regions must be compared we shall speakof heterochromatic spectrophotometry.
What may be termed the fundamental principle of photographicphotometry is that each plate or film must be individually calibrated,and standardized as well if the problem is one of heterochromaticphotometry. In fact, for the most accurate work, several portions ofevery plate should be calibrated and standardized. Improvements inphotographic methods have not enabled us to dispense with theseprecautions; rather they have afforded us more convenient ways oftaking them.
Much work has been done on the form of the analytic functionrelating the different variables mentioned above.7 This does not con-cern us here, since in practical work the numerous constants of theequation would have to be determined anew for each individual plate,and by using null methods we can achieve the desired result withoutknowing the equation. However certain qualitative relations betweenthe variables are available to guide us in selecting the best workingconditions, and these will now be discussed.
1. Characteristics of Photographic Emulsions. a. The CharacteristicCurve. The photographic plate as ordinarily used commercially isusually exposed to white light for a small fraction of a minute. A largeliterature has grown up on the characteristics of emulsions under theseconditions, but as yet little has been done on their behavior when ex-posed to monochromatic light.
* It is possible to use a constant density value, as is done in one type of wedge methoddescribed below; this however is only an apparent suppression of the variable.
November, 1929] 271

GEORGE R. HARRISON [J.O.S.A. & R.S.I., 19
To show the relation between the variables light intensity and blacken-ing of the emulsion, when all other factors are kept constant, it is bestto plot the density d against the logarithm of the intensity I, logiol.
The curve is usually of the general type of those shown in Fig. 1.Often curves are plotted with the axis of abscissae marked logloE.The symbol E stands for the exposure, which is. defined as the productIt. In the experiments from which such curves are derived, I is generallykept constant and t is varied. Evidently such a curve is equivalentto one formed by plotting d against log t, and is apt to be misleadingfor the purposes of exact photometry, since different pairs of valuesof I and t may produce different values of density even though theproduct It remains the same. This is described as the failure of the
~~~~~~~tO7 3/
FIG. 1. Characteristic curves obtained with monochromatic light on typical emulsions of (a)low speed and high contrast, and (b) high speed and low contrast.
reciprocity law. Accordingly we will refer to curves of d against log t
as H & D curves,8 after Hurter and Driffield, who first plotted them,and to curves of d against log I as "characteristic curves." The use oflog E as the independent variable is to be discouraged in spectral workexcept possibly in cases where the reciprocity law has been definitelyverified over the whole range of conditions used. For spectrophoto-metric purposes characteristic curves should be determined for eachwave length to be measured, by interpolation if necessary. In caseswhere light of mixed colors is used, the calibration curves must be madewith light of the same quality as that being studied, to avoid errorsdue to the photographic Purkinje effect.9
The central portion of the type of curve shown in Fig. 1 is often a
straight line which can be represented by the equation d ylogl-l
272

PHOTOGRAPHIC PHOTOMETRY
where y, the slope of this line, is called the contrast, and n, its intercepton the log I axis when extended, is a measure of the inertia. Where bothI and are varied the relation of these to d can be represented by acharacteristic surface, as shown in Fig. 2. The flat portion of this curvein three-dimensional space can be represented by the relation d=,ylogI t-n, which can also be written d= log I+ptylogt-n. Thesymbol p stands for what is known as Schwarzschild's constant ; inthe case illustrated it has approximately the value 0.55. It is not safe,however, to assume p to be a constant for any particular emulsion,as has been shown by Abney and others." In some emulsions p is
FIG. 2. Graph in three dimensions showing a family of characteristic curves (d-log I) anda family of H. & D. curves (d -log t) for a typical emulsion. The contrast is 1.2, but from thed-log t curves the apparent contrast is only 0.66, making the value of Schwarzschild's p 0.55.This factor is not quite constant, however. Large errors would result from calibrating such an emul-sion by varying the time of exposure instead of the intensity unless the values of p were accuratelydetermined, and this is not usually worth while.
nearly equal to 1 under conditions in which a practical density canbe built up in a few seconds; for extreme values of I or I it is apt todiffer considerably. For our purpose the following facts need emphasis:(1) It is not safe to consider p equal to 1 (i.e. to assume the reciprocitylaw), or to a constant (i.e. apply Schwarzschild's correction) withoutfirst determining it under the prevailing circumstances, a process whichas a rule is not worth the trouble; and hence it is usually best to calibrateby varying I directly; (2) Under certain circumstances it is legitimateto calibrate plates with a time of exposure different from that whichis to be applied in the measurements. With certain emulsion-developer
November, 1929] 273

24GEORGE R. HARRISON
combinations the ratio of the two times of exposure may be made asgreat as 10 or 100, but the legitimacy of this must be ascertained byactual test. Where very long times of exposure are necessary in measur-ing low intensities, as in work on the Raman effect, one may wish touse factors as great as 1000 or more, but it is in precisely such casesthat the failure of the reciprocity law is apt to be most serious.2
Returning to Fig. 1: The upper part of the curve, called the"shoulder," is known as the over-exposure region, and although the simpleequation given above no longer applies, this region can still be usedfor photometry; similarly the "toe" or under-exposure region is useful.In both of these extreme regions, however, the accuracy of the resultsis somewhat reduced. It should be emphasized that whatever theform of the curve connecting some chosen function of the blackeningwith a function of the intensity producing this, one may use it to de-termine unknown intensities by interpolation, but the more closelyit approaches a straight line of unit slope the more convenient and ac-curate will the process be.
b. Variation of the Characteristic Curve with Type of Emulsion.Emulsions can be roughly classified as slow, medium, and fast, accord-ing as the inertia is large, medium, or small. Similarly they are de-scribed has having high, medium, or low contrast, depending on thevalue of y. Contrast and speed ( = 10/n) generally vary in an inversemanner, so that a fast plate usually has low contrast and vice versa.High speed is generally given by plates with large grain size, which inturn decreases resolving power and increases the tendency to fog.This fog, which is a more or less even blackening of the plate on de-velopment even where no light has touched it, is a great drawbackin photometry, as it decreases the sensitivity of measurement andintroduces new errors which must be corrected for in ways which areas yet rather uncertain.
Certain types of plates are made with mixtures or successive coatingsof two or more simple emulsions, which result in characteristic curveswhich may show an abrupt change of contrast near the middle of whatwould normally be the straight portion. This property is often ad-vantageous for commercial photography for it gives increased speedwith reater blackening for weak exposures, and greater contrast forstrong exposures. Such emulsions can be used for photographic photo-metry, but they are undesirable because of the added uncertaintyintroduced in determining the exact course of the more complicatedcharacteristic curve with a limited number of experimental points.
274 [J.O.S.A. & R.S.I. 19

PHOTOGRAPHIC PHOTOMETRY
Speed ratings stated by manufacturers ordinarily apply to whitelight, but give a rough indication of the qualities to be expected inthe plate when used for spectrum work. Fast plates are generallyto be chosen when weak lines are to be photographed, or when weakand strong lines are to be made to appear with about the same density.The "latitude" of such a plate (the intensity range on the graph coveredby the straight line portion) is long; this is an advantage, which,however, is generally nullified by the effect of the increased backgroundand fog densities. A slow plate is to be chosen where high resolvingpower is needed, or where weak lines, background, and fog are to beeliminated, or where high contrast is desired for other reasons.
Plates of medium speed, such as the Eastman 36 or Seed 23, are themost suitable for general photometric purposes. They give the desiredbalance between latitude, contrast, lack of fog, and speed. It is some-times stated that the greatest accuracy is obtained by having the con-trast as high as possible, as this gives a large density range for a smallintensity range, and makes an apparently great difference Ad betweentwo close lines differing in intensity by Al. As in many other inter-polation processes, however, the 450 curve of unit contrast can be shownto give the greatest accuracy when all the necessary steps are taken intoaccount.
c. Variation of Emulsion Characteristics with Wave Length. The termsensitivity as applied to the photographic plate is very indefinite. Anapparently sensible definition would be "the ratio of density produced tolight intensity producing it" but this ratio varies greatly with eithervariable. Nevertheless it is desirable to adopt some measurable quan-tity to characterize the response of a plate to light of various wavelengths, and we may use this ratio for that purpose, imperfect as it is.It becomes somewhat more definite if we take as the measure of sen-sitivity the reciprocal of the intensity required to produce unit densityin a given time. The type of curve obtained for an ordinary emulsionwhen this definition of sensitivity is made is displayed in Fig. 3. Hadanother density been chosen as standard this curve would appear some-what different.
The spectral sensitivity characteristics of the ordiary emulsion maybe described briefly as follows: In the blue green, the emulsion is veryinsensitive. The sensitivity rises rapidly as the wave length is diminishedreaching a maximum in the ultraviolet near 3600A (and not in thevisible near 4800A as one might expect from a casual interpretationof the data published by most plate manufacturers). Further on, it
November, 1929] 275

GEORGE R. HARRISON
diminishes slowly as far as the neighborhood of 3000A, where it oftenrises slightly again as far as 2500A, and then makes a rapid descent,falling to very low values at 2000 A. Various methods have been used to
FIG. 3. The solid curve shows the variation of sensitivity (defined here as the reciprocal ofthe light intensity required to produce unit density in a given time) with wave length for an ordinaryemulsion under conditions such as are frequently met with in photometry. The dotted line showsroughly the course of the sensitivity curve obtained by inspection of the usual wedge photographsshowing the sensitivities of photographic materials. The difference between the two is due to thefactthat the latter curve has not been corrected for the absorption by the glasss in the neutral wedgeand in the lamp Used in making the photograph, nor for the variation of light intensity with wavelength.
change the general character of this curve, and especially to extend itbeyond its usual limits. These include staining of the emulsion, decreaseof the amount of gelatine in the emulsion, and coating of plates withfluorescent substances. The International Critical Tables, 5, and thecatalogs of manufacturers present wedge photographs showing roughly
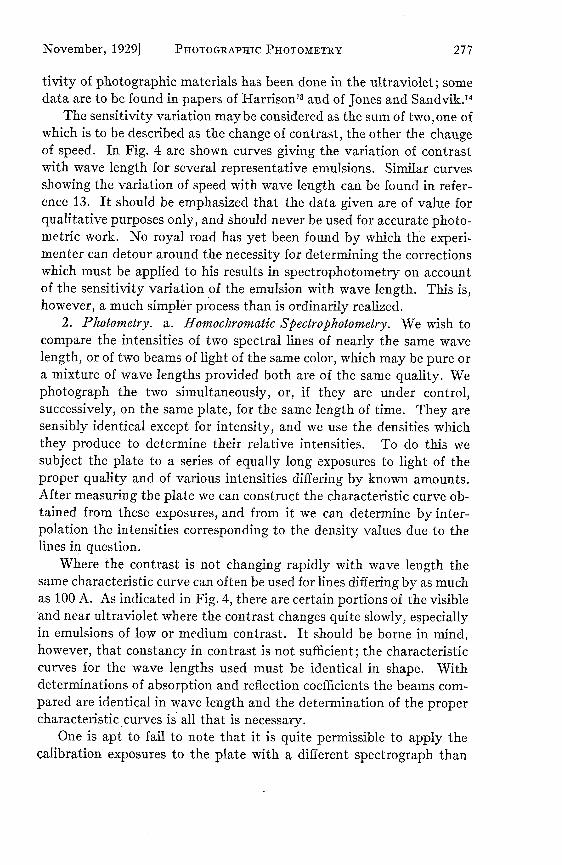
FIG. 4. Curves showing the variation of contrast with wave length for threetypical emulsions, respectively slow, mnedium, and fast.
the sensitivity characteristics which the more important specialemulsions display in the visible and infrared regions. These photographsare generally misleading below 4800A. Very little work on the sensi-
[J.O.S.A. & R.S.I. 19276
PHOTOGRAPHIC PHOTOMETRY
tivity of photographic materials has been done in the ultraviolet; somedata are to be found in papers of Harrison 3 and of Jones and Sandvik. 4
The sensitivity variation maybe considered as the sum of two,one ofwhich is to be described as the change of contrast, the other the changeof speed. In Fig. 4 are shown curves giving the variation of contrastwith wave length for several representative emulsions. Similar curvesshowing the variation of speed with wave length can be found in refer-ence 13. It should be emphasized that the data given are of value forqualitative purposes only, and should never be used for accurate photo-metric work. No royal road has yet been found by which the experi-menter can detour around the necessity for determining the correctionswhich must be applied to his results in spectrophotometry on accountof the sensitivity variation of the emulsion with wave length. This is,however, a much simpler process than is ordinarily realized.
2. Photometry. a. Homochromatic Spectrophotometry. We wish tocompare the intensities of two spectral lines of nearly the same wavelength, or of two beams of light of the same color, which may be pure ora mixture of wave lengths provided both are of the same quality. Wephotograph the two simultaneously, or, if they are under control,successively, on the same plate, for the same length of time. They aresensibly identical except for intensity, and we use the densities whichthey produce to determine their relative intensities. To do this wesubject the plate to a series of equally long exposures to light of theproper quality and of various intensities differing by known amounts.After measuring the plate we can construct the characteristic curve ob-tained from these exposures, and from it we can determine by inter-polation the intensities corresponding to the density values due to thelines in question.
Where the contrast is not changing rapidly with wave length thesame characteristic curve can often be used for lines differing by as muchas 100 A. As indicated in Fig. 4, there are certain portions of the visibleand near ultraviolet where the contrast changes quite slowly, especiallyin emulsions of low or medium contrast. It should be borne in mind,however, that constancy in contrast is not sufficient; the characteristiccurves for the wave lengths used must be identical in shape. Withdeterminations of absorption and reflection coefficients the beams com-pared are identical in wave length and the determination of the propercharacteristic curves is all that is necessary.
One is apt to fail to note that it is quite permissible to apply thecalibration exposures to the plate with a different spectrograph than
November, 1929] 277

GEORGE R. HARRISON [J.O.S.A. & R.S.I., 19
that used for the spectra to be measured. Also, as in several methods tobe discussed below, the unknown lines can be made to impress their owncalibration exposures on the plate. But intermittent calibration expo-sures must not be used when the source to be measured is constant,or vice versa.
Where spectral lines are to be compared it frequently happens thatthe spectrogram shows a continuous background (apart from that dueto fog) superposed on the lines. The density measured over the lines isthen that due to the sum of the intensities of line and background, andthe density of the background must be measured near the line. Thisand the density over the line are to be converted into intensities bymeans of the characteristic curve, and the background intensity is thendirectly subtracted. When the background intensity is larger thanabout ten per cent of that of the line the errors of photometry increaserapidly as it increases, especially if the background correction is at allvariable. In the case of calibration exposures the background canusually be ignored, and in any case should not be subtracted from theline intensities since its effect is present in all of the densities used in anamount proportional to the intensity of the exposure, and it has theproper wave length (provided of course it is not due to general scatteringin the spectrograph system, when it must be eliminated.) But it is de-sirable, on account of the Eberhard effect discussed below, to have thecalibrations of approximately the same size and shape as the unknownlines (see Fig. 5), as in some cases where a strong background exists itmay produce errors from this cause. However, the error in this case isdue to the presence of the background near the line rather than underit, and it can usually be removed by the interposition of screens.
b. Heterocliromatic Spectrophotometry. In any particular piece ofheterochromatic photometry it is neither necessary nor sufficient todetermine the variation of emulsion sensitivity with wave length separ-ately, since what is wanted is the variation in what may be termed thetotal or over-all transmission sensitivity of the spectrographic outfit.This will be influenced not only by the variation of emulsion sensitivity,but by the variation with wave length of the transmission or reflectionof the prism or grating used to produce the spectrum; by the contollingapertures of the system for different wave lengths; by the dispersionvariation of the spectrograph; by the characteristics of any lenses in thesystem; by the astigmatism of the system, and by several other factors.While all but the first remain sensibly constant from one experiment tothe next, it is generally convenient to lump them all together by using
278
PHOTOGRAPHIC PHOTOMETRY
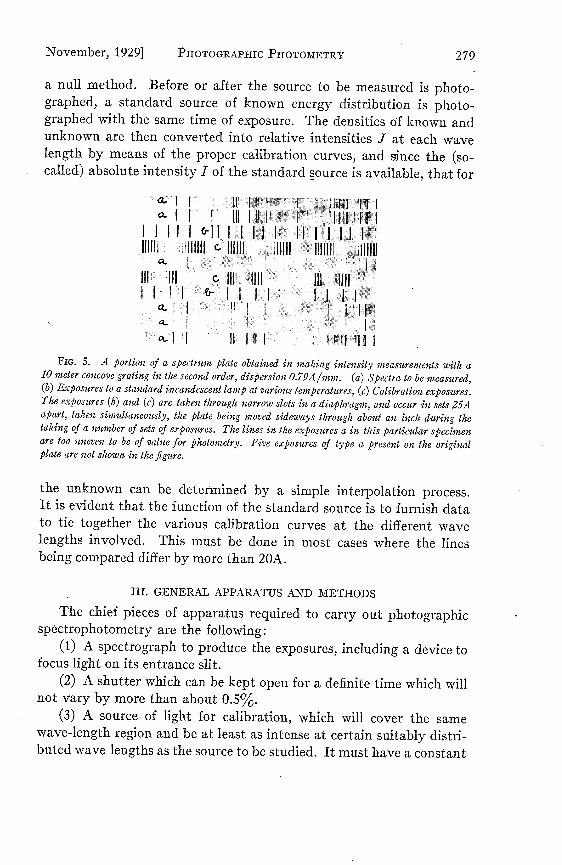
a null method. Before or after the source to be measured is photo-graphed, a standard source of known energy distribution is photo-graphed with the same time of exposure. The densities of known andunknown are then converted into relative intensities J at each wavelength by means of the proper calibration curves, and since the (so-called) absolute intensity I of the standard source is available, that for
lulL 11111 c hl 111 L 111
' I I I I I11
FIG. 5. A portion of a spectrum plate obtained in making intensity easurements with a10 meter concave grating in the second order, dispersion 0.79A /mmi. (a) Spectra to be measured,(b) Exposures to a standard incandescent lamp at various temperatures, (c) Calibration exposures.The exposures (b) and (c) are taken through narrow slots in a diaphragm, and occur in sets 25Aapart, taken simultaneously, the plate being moved sideways through about an inch during thetaking of a number of sets of exposures. The lines in the exposures a in this particular specimenare too uneven to be of value for photometry. Five exposures of type a present on the originalplate are not shown in the figure.
the unknown can be determined by a simple interpolation process.It is evident that the function of the standard source is to furnish datato tie together the various calibration curves at the different wavelengths involved. This must be done in most cases where the linesbeing compared differ by more than 20A.
III. GENERAL APPARATUS AND METHODS
The chief pieces of apparatus required to carry out photographicspectrophotometry are the following:
(1) A spectrograph to produce the exposures, including a device tofocus light on its entrance slit.
(2) A shutter which can be kept open for a definite time which willnot vary by more than about 0.5%.
(3) A source of light for calibration, which will cover the samewave-length region and be at least as intense at certain suitably distri-buted wave lengths as the source to be studied. It must have a constant
November, 1929] 279

GEORGE R. HARRSION [J.O.S.A. & R.S.I., 19
average value in time, and the same intermittency characteristics asthe unknown source.
(4) A means of varying the intensity of this source at each wavelength by a known amount. So called neutral methods vary the in-tensity by the same amount at all wave lengths; this is convenient, butnot necessary.
(5) A standard source of known energy distribution covering thesame wave-length range as the source to be studied. (This is not neededfor homochromatic photometry).
(6) A controllable and even means of developing, fixing, washing,
and drying plates or films. Reproducibility is desirable but not nec-essary.
(7) A densitometer or microphotometer for measuring the blackeningof the plates.
Each of these requirements will now be discussed in detail.1. Spectrographic Outfits. a. The Spectrograph. The choice of the
spectrograph to be used will depend greatly on the type of work to beundertaken. Both prism and grating instruments are satisfactory;any spectrum that can be produced can be measured photographically.Where extremely weak light sources are to be measured prism instru-ments are preferable, since their light transmitting power is so highthat one may work with short exposures, which is very desirable in pho-tometric work. Exposure times between 10 seconds and 100 secondsare the most convenient, but by no means requisite; one cannot fixdefinite limits, since exposures of less than 10-5 seconds and longerthan a week may be perfectly measurable.
The most valuable single item in photographic photometry is thespace on an individual plate, so it is desirable to use low dispersion for
the sake of accuracy and economy of effort. On the other hand, highdispersion reduces the intensity of the continuous background relativelyto that of the lines, and this is highly desirable. The compromise to beselected depends entirely on the character of the work. For intensitymeasurements in complex spectra such as titanium or vanadium Ihave used the second order of a 10 meter concave grating, with a dis-persion of 0.73 A per mm. Here the separation of close lines and the re-duction of background are the most important. requirements. For lesscomplex spectra like those of calcium and copper the first order of a 21foot concave grating of 15,000 lines to the inch is very satisfactory,
with a dispersion of about 2.57 A per mm. For spectra as simple as
zinc, cadmium, and silver the first order of a one meter grating of dis-
280
PHOTOGRAPHIC PHOTOMETRY
persion about 16 A per mm is suitable. Much work has been done onthe alkali metals and helium with prism apparatus, the dispersionvarying from 10 to 50 A per mm in the visible to values four to tentimes as great in the ultraviolet.
For absorptionor reflection work where a continuous spectrum isdesired it is practically essential to use a prism instrument, unlessspecial precautions are taken. Scattered light is much stronger with agrating than with a good prism, and becomes notably intense when acontinuous spectrum is used. The overlapping of orders in certainregions is often a drawback of the grating, although it can be controlledby suitable filters.
In connection with the question of the dispersion to be chosen, it isgenerally necessary to use a fairly wide slit for line spectrum work, inorder to have flat-topped lines to measure. Otherwise, where lines ofdifferent shapes must be compared, it is necessary to make a largenumber of density measurements to determine the shape of each line,the resulting intensities being integrated to give the total intensity.If, however, the slit is so wide that the image contains every portionof the line superposed on every other part, there will be a flat top; and asingle intensity value obtained from the height of the flat top will beproportional to the total intensity of the line. The necessary slit widthis somewhat more than that of the widest line being measured (in thecase of symmetrical lines a width one-half as great would do). Theflat-topped portion of the line should be wide enough to cover thelight beam of the microphotometer. The objections to still furtherwidening of the slit are that the continuous background is increasedrelatively to the lines, and resolving power is lost.
For many methods of photometry an astigmatic spectrograph is adecided advantage; for others a stimatic optical system is required.Often the type of photometric method to be used will be decided by theproperties of the spectrograph system available. Evenness of illumina-tion along a spectrum line is a prime requisite, and astigmatism aids insecuring it.
The spectrograph should produce straight rather than curved spec-trum lines. Each line to be measured should be at least 3 mm long ifpossible, as the effect of graininess and other irregularities in theemulsion is apt to be noted where a shorter length is used.
Mountings of the Littrow type are often undesirable for photometricwork unless the lens can be slightly tilted to avoid reflection of the lightfrom the surfaces of the lens back on to the plate. Scattered and reflected
November, 1929] 281
GEORGE R. HARRISON [J.O.S.A. & R.S.I., 19
light must be held to a minimum. Requirements for special spectralregions will be mentioned below.
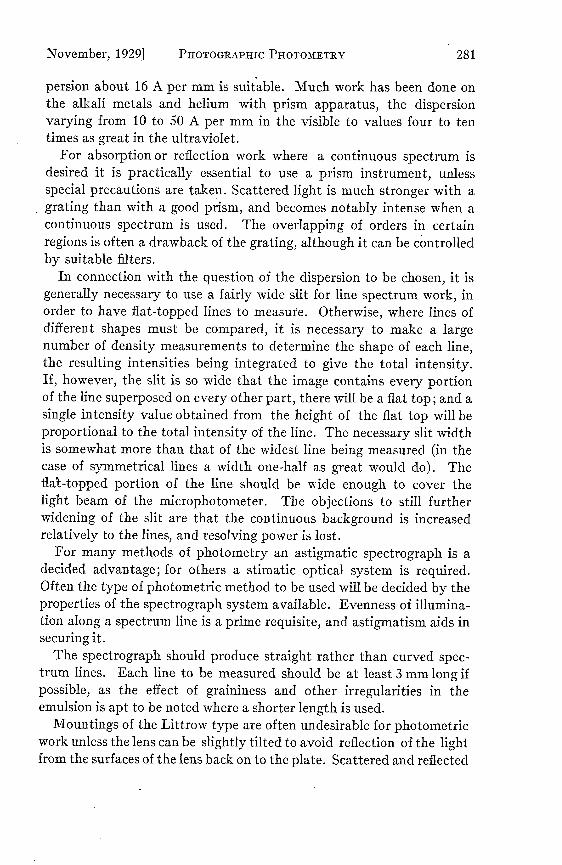
b. Grating Mountings. Where a concave grating is used, a modifica-tion of the Paschen mounting is probably most suitable for generalphotometry. The Rowland and Eagle5 mountings suffer from the disad-vantage that only a limited region of the spectrum can be photographedat one exposure, so that lines differing greatly in wave length cannot bedirectly compared. When a stigmatic spectrum is required the Wads-worth mounting is excellent.6 This cuts the dispersion in half, but in-creases the brightness of the spectrum, especially in the higher orders.It is probably the best high dispersion mounting for use with a neutralwedge or a step-weakener, when these must be placed at the slit.
FiG. 6. A convenient type of grating nountisng for use in intensity work,suitable for gratings of any radius from one to ten meters or more.
In the Paschen-type mounting the slit, grating, and focal plane arefixed and one can distribute plates practically continuously along thespectrum. Fig. 6 shows a mounting of this type as used in the Stanfordlaboratory, 10 meter, 21 ft., and 1 meter gratings having been mountedin this manner. As many as twelve cassettes are frequently usedsimultaneously, enabling one to compare numerous lines in a largespectrum range under identical conditions of excitation. A still bettermounting would be a double one of the type shown in Fig. 6, so thatorders on both sides of the central image could be used simultaneously.The cassettes on the right hand side could then be arranged to cover thegaps in the spectrum between those on the left, as ordinarily the con-struction of the cassettes requires that a space one-fourth to one-third
282

PHOTOGRAPHIC PHOTOMETRY
the length of a plate be left between adjacent plates. With largegratings it is seldom possible to find a room of sufficient size to housesuch a double mounting, however.
Any mounting of high dispersion where only a single plate can beexposed at a time will be found very wasteful of effort, and it is ofcourse impossible to compare widely separated spectral regions directlywith such a mounting, except where orders happen to overlap suitably.
c. Illumination of the Spectrograph Slit. As most methods of photogra-phic photometry require the insertion of light weakeners in the beambefore it enters the slit of the spectrograph, it is necessary to focus thelight on the slit by means of a lens or mirror. It is generally desirablethat a magnified image of the source be used to increase the uniformityof illumination of a fairly long slit, and to allow easier control of aflickering source. Ordinarily magifications of four to ten-fold are useful.Care should be taken that the effective aperture of the lens or mirrorbe slightly greater than the controling aperture of the spectrograph.
As the standard lamp and the source being studied must be sub-stituted for one another and photographed under identical conditions,care must be taken that they are placed in identical positions in frontof the lens. Otherwise, especially in the case of a lens with appreciablechromatic aberration, the ratio of the amounts of light entering the slitfrom the two sources may depend on wave length, and large errors mayensue. For this reason it is desirable to use a corrected lens so that asmall error in placing one or the other of the sources will produce onlya second order disturbance. Very excellent quartz-fluorite and quartz-rocksalt objectives of 25 mm aperture and 250 mm focus can now be ob-tained, the focal length in some cases varying not more than a fewmillimeters over the whole visible and ultraviolet regions. A focallength of between 150 and 300 mm is most useful.
Mirrors cause no chromatic difficulties, but they are very wasteful oflight in the ultraviolet and are more cumbersome to handle. Theirastigmatic properties are frequently useful in producing more uniformillumination of the slit. Silicon, chromium, and nickel are good mater-ials for mirrors to be used with ultraviolet light; silver is very poor forthe purpose.
d. Plate Holders and Cassettes. Any commercial spectrograph can beused for intensity work; but when apparatus is being designed or modi-fied for this particular use, certain features should be incorporatedwhich often are not possessed by apparatus designed chiefly for deter-minlations of wave length. We bend every effort towards getting as
November, 1929] 283

284 GEORGE R. HARRISON [J.O.S.A. & R.S.I., 19
many records of den'sities on a single plate as we possibly can, knowing
that once these are converted en bloc into values of intensity the action
of the plate may be forgotten. Plates which are large enough for only
two or three spectrum photographs are wasteful of effort. At least
fifteen spectrum photographs can be obtained on 4 X 10 inch plates, a
standard size in which almost any emulsion can be obtained. In the
Stanford laboratory eight spectrographs, ranging from a 10 meter con-
cave grating to a small quartz prism outfit have been rebuilt, when
necessary, to carry this standard size of plate. Much time is thereby
saved, as the same plate can be subjected to successive exposures for
calibration or other purposes in different instruments. In any case,
the plates used should be as large as is convenient.Any ordinary type of plateholder can be used, but the cassette in
which the plateholder is held may well contain certain special features.
Thus two complete sets of calibration exposures at all the necessary
wave lengths can be impressed in the space usually required for a single
spectrum by a method which has recently been described in this jour-
nal, 7 whereas ordinary methods would involve the use of two whole
plates to give the same data. Fig. 5 shows a portion of a typical plate.
Where optical wedges or step-weakeners are used in the focal plane
it is often necessary to have long spectral lines, broken up into sections
of different density. The proper changes in cassettes to make them
suitable for these cases are obvious.2. The Timing of Exposures. A stopwatch and hand-operated
shutter are satisfactory for exposures of not less than 20 seconds when
calibrating. For exposures to the spectrum under measurement and to
the standard lamp exactness of timing is not required, provided that
the exposures to all parts of the spectrum are begun and ended simul-
taneously. For routine laboratory work a clock delivering an electric
impulse every second is most desirable. This can be constructed if
necessary from almost any cheap type of pendulum clock, the period
(and the time keeping qualities) of this being altered by substitution
of a shorter or longer pendulum to make the period approximately one
or two seconds. The pendulum is made to close an electric circuit every
second in the usual manner, and operates a magnetic shutter on the
spectrograph whenever a key is held closed. A very poor clock if pro-
perly handled can be made to give impulses uniform to less than 0.1
second, which is good enough for exposures of 10 seconds or over.
In the case of exposures much greater than 10 seconds it is convenient
to have an electric counting device which will close a key at the end of a
- -

PHOTOGRAPHIC PHOTOMETRY
predetermined time. Such arrangements are in very common use now,and need no detailed description. A convenient type is made from aratchet wheel having 100 teeth, this being driven forward one tooth at atime by the action of a spring which is released once each second by animpulse from the clock. It is desirable that the spring rather than themagnetic impulse should turn the wheel, while some simple deviceshould be provided to prevent more than one tooth passing the pawlat a time. Pins placed around the periphery of the wheel can be in-serted in suitable holes to close a contact so that exposures between 1and 100 seconds can be automatically made.
The electromagnetic shutter in the spectrograph can be of any typewith positive action, but in general it should be mounted behind the slitrather than in front, so that adjustment of the light beam or of filterscan be made conveniently. An iris type shutter of fairly large apertureis very convenient. The self-setting type should be used, and can bereadily operated by the clapper of an ordinary electric door bell with thevibrating arrangement disconnected.
3. Sources of Light for Calibration. The source of light being measuredneed not be absolutely steady. But if it is an ordinary arc, it should bekept as steady as possible, and the calibration source should be very con-stant; while if it is a spark, the calibration and standardization sourcesshould be uniform and controlled spark discharges of the same type, orconstant sources made intermittent in the same degree.17a It is necessarythat the calibration source should cover the same wave-length rangeas the source being studied, delivering light of frequencies in theneighborhood of those in the latter, although not necessarily exactly thesame; that it should show no intermittency different from that of thesource being studied; and that it should remain constant in averageintensity. The last requirement is only essential when a number ofsuccessive calibration exposures are required; where all are taken simul-taneously as with the wedge or step-weakener (see below) a source ofvariable intensity can be used, and in this case it is generally desirableto use the source being studied itself as the calibrating source. It is ofcourse not necessary to know the intensity distribution in the calibrat-ing source.
In the visible and infrared regions an incandescent lamp run from astorage battery makes a most convenient source for calibration. Such alamp with a quartz window can be used in the ultraviolet, although theintensity is usually rather low below 3000A unless the calibrating isbeing done in a low dispersion instrument. When continuous sources
November, 1929] 285

GEORGE R. HARRISON [J.O.S.A. & R.S.I., 19
are being used for calibrating plates exposed to line sources it is desir-able to produce artificial lines on the plate by means of diaphragms, asin Fig. 6, to reduce errors due to the Eberhard effect.
In the region 4350-2400A the mercury arc 8 in quartz makes a con-venient calibration source, when operated from a storage battery withreactance and resistance in series. Great care should be taken to ensurethat the arc attain a final steady state, as there is apt to be a tendencyfor a drift in intensity. If both voltage across and current through thearc remain constant, so also does its radiation, except for very slowchanges in the transparency of the quartz envelope. But in order tocontrol current and voltage separately it is necessary to be able tocontrol the ventilation of the arc.
Although the mercury lines are fairly widely separated, they are sospaced that calibration curves for the range given above can be readilyinterpolated for any desired wave length. As the contrast and shape ofthe curve are all that are desired, and as these change rather slowly inthe region referred to, calibration curves interpolated every one or twohundred angstroms are sufficient. With very high dispersion outfits allthe calibration curves on a single platewill generally be found to appearthe same, except in the regions near 5000A and 2500A.
When an intermittent source such as the spark or a discharge tube runon ac is being studied, the most convenient calibration source is gener-ally either the unknown or a source like it having a constant averageintensity in time, but with the same intermittent characteristics. Aspark between rotating wheel electrodes9 20 can be made to fulfil thisrequirement; its constancy can be watched by focusing its total radia-tion on a thermocouple connected to a galvanometer. Care should betaken that the calibration spark and spark being studied have thesame number of discharges per cycle; this can be checked by observa-tion with a shaking or rotating mirror. A change in tone of the sparkduring an exposure is undesirable, as it is the sign of a change indischarge frequency and in intensity. Unless it is fed by a motor-gen-erator set run from a constant supply the spark transformer voltageshould be regulated.
Below 2400A a hydrogen discharge tube run on steady dc is probablythe most convenient calibration source, and it provides a good contin-uous background extending far into the ultraviolet.28a Special control ofpressure and other conditions is required to insure steadiness. Steadysparks can also be used in this region.
286

PHOTOGRAPHIC PHOTOMETRY
4. Methods of Varying Intensity for Producing Calibration Curves.These may be classified as neutral and selective methods. The formerhave the advantage that the transmission values at all wave lengthscan be determined by making measurements with any mixture of wavelengths, while the latter must be calibrated near every wave length atwhich they will be used.
a. Neutral Methods. (1) Diaphragms. If in the optical system there isa beam of light having the same cross-section for each of the constituentwave lengths, and uniformly intense over that cross-section, diaphragmsof different apertures can be introduced to cut down the light by knownamounts, provided always that the spectrograph does not vary intransmission from point to point of its aperture. This is one of thesimplest methods, but the conditions are very difficult to fulfil accur-ately; especially with gratings, where the diffracting surface may beuneven in reflection. With prism-lens combinations radial sectordiaphragms are generally better than zonal diaphragms.
(2) Perforated Screens.20b These are in reality diaphragms, so con-structed that the foregoing requirements do not hold. Each small holein the screen acts as a diaphragm, and the transmission of the screencan be measured or in rare cases computed. Certain simple precautionsmust be observed in the use of screens to avoid errors due to diffrac-tion. I have discussed these at length in a recent paper.2 ' The screensare not additive unless they are rocked. Woven wire screens are ingeneral more uniform than those made by punching holes in metalsheets.
(3) Variable Slit Width. When continuous sources are used forcalibration it is often convenient to vary the intensity by changingthe slit width.22 Usually only four or five values of intensity can beobtained in this way for a single set of lamp conditions. By changingthe brightness of the source four or five new points can be obtained,and the two setsjoined togetherwheretheyoverlap,to give a continuouscurve.
(4) "Rasters."22 These are ingeniously constructed diaphragmsarranged to combine the advantages of the wire screen and the step-weakener. They appear to be truly neutral, but can be used only in astigmatic mounting, unless a special type of astigmatic mountingdescribed by Frerichs is available; and this latter can only be used forone plate at a time. Under such circumstances they appear to be equalin value to the step-weakener, but care must-be taken to see that theyare uniformly illuminated.
November, 1929] 287

GEORGE R. HARRISON [J.O.S.A. & R.S.I., 19
(5) Rotating Sectored Disks.24 In most work these had better beavoided, as they produce intermittent exposures and vary not theintensity but the time of exposure, thus introducing both intermittencyand reciprocity errors. In homochromatic photometry they are fre-quently used in certain special methods later to be described, but theconditions are there so chosen that the two sources of error apparentlytend to partially cancel. This is not true in most cases, however.
(6) Variation of Time of Exposure. In cases where the reciprocitylaw holds it is legitimate to use H. & D. curves to determine the charac-teristic curves of the emulsion. This method has been much abused inthe past, however, and any investigation in which it is employed andnot specifically verified is open to suspicion. If one takes a smallamount of trouble at the start, it is thereafter easier and quicker to varythe intensity than the time; and since in any case the intensity must bevaried in order to test the reciprocity law, the apparent advantages ofvarying the time become scarcely noticeable. The method is one for theexpert rather than for the beginner, and the former seldom uses it.
(7) Adoption of TheoreticalLine Ratios. The ratios of the intensities ofspectral lines in multiplets are known to be atomic properties and often'have simple integral values. In a quintet multiplet, for example, wemay have twelve lines fairly uniformly distributed over an intensityrange of several hundred. In the case of multiplets which have beenfound experimentally to have normal intensities there is no reasonwhy these lines should not be used for producing calibration curves.It is necessary, however, to choose narrow multiplets which have asingle or several very close upper states, (unless the conditions of ex-citation are definitely known) and to be sure that no self-reversal ispresent. This last condition is often very difficult to fulfil, and themethod should not be used except in connection with a more accurateone for quantitative work.
b. Selective Methods. (1) "Neutral" Filters. It seems a contradictionin terms to include "neutral" filters under this heading, but the factremains that even the best materials are neutral over limited spectralranges only, and it is necessary in any particular case to prove thisneutrality, in doing which one often loses much of the advantage of themethod. Very good approximations can be found for portions of thevisible, but the commercial neutral gray glass or gelatine filters areapt to vary more than 5% in transmission in a comparatively limitedrange. Platinum sputtered on quartz25 has been found to be fairly
288

PHOTOGRAPHIC PHOTOMETRY
nearly neutral through much of the visible and ultraviolet. Professor
Ornstein informs me that in his institute antimony has lately beenfound to be superior to platinum; it is evaporated in vacuum and con-
densed upon very clean quartz plates. All of these materials should
have their transmission measured at various wave lengths, and thenecessary correction factors should always be applied. Filters are
superior to wire screens in that they need not be rocked, can be fash-
ioned into wedges and step-weakeners, and entail no diffraction errors.They are generally not so uniform as screens, however, and sometimesintroduce refraction errors; for commercial filters of glass are often
slightly thinner at one edge than the other, causing a prism effect whichmay throw the light slightly off the slit. Also changes in focus differingfor different wave lengths may occur when filters are set across thebeam if they are fairly thick.
(2) Polarizers. Crossed Nicol Prisms can be used in the visible, or
Foucoult prisms in the ultraviolet, the intensity of the light trans-mitted varying in either case with the angle of rotation of the prisms.
One is justified in suspecting that they may introduce appreciable errors
due to the polarization of the light, since the reflecting power of a
mirror or concave grating depends on the polarization of the incidentlight. They are much more commonly used in visual than in photo-graphic methods, and possess few advantages for the latter.
(3) Non-Neutral Filters.26 Often it is desirable to weaken one color
of the calibrating light relative to another in order to approximatemore closely the intensity distribution of the unknown source. Selectivefilters are useful for this purpose, and are no more difficult to calibratefor transmission than the so called neutral filters. The catalog of
Wratten Filters published by the Eastman Kodak Co. and the lists offilters given in Vol. 5 of the I. C. T. are very useful for the selection ofproper filters for this purpose.
(4) Theoretical Line Shapes. Ornstein and Minnaert27 have made
use of the shapes of spectral lines produced by a spectrograph to givethe density-intensity relations of certain uncalibrated plates. Thismethod could be extended in various ways, and is very useful undercertain circumstances, but must be used with circumspection.
(5) Variation of Temperature of a Source. Laws relating the bright-ness of a radiator to its absolute temperature can be used for producingcalibration marks, but the method is rather indirect and cumbersome.
289November, 1929]

GEORGE R. HARRISON [J.O.S.A. & R.S.I., 19
(6) Special Methods. These include wedges, step-weakeners, coarseruled gratings, selective reflection, etc. The more important ones willbe discussed below in connection with the special photometric methodsin which they are involved.
5. Standard Sources. a. Continuous Sources. The black body isthe source of which the intensity distribution is most accuratelyknown. It can be used directly as a standard, or indirectly by calibratingfrom it secondary standards such as an incandescent ribbon or spiralof tungsten. The energy distribution from a black body is given byPlanck's Law. For values of XT greater than 3000 (X being evaluatedin cm) the simpler approximation form known as Wien's Law is ade-quate for our purposes, viz:28 IdX = Ca- 5 ehv1TdX. This can be writtenin the form log 1 0 1=26-5 logoX-antilog (7.7939-logioX-log 1oT)which is somewhat more convenient for use in computations on a calcu-lating machine. Tables of certain black body emission values are givenin Vol. 5 of the I.C.T.
In practice black body radiation is simulated closely enough by radi-ation from a small hole in a heated enclosure of almost any material ofsufficiently high melting point, or from narrow slots in carbon rods ortubes. Frerichs21 describes a black body formed of a hollow carbon tubewith central plug heated in a platinum resistance furnace to 1400'A.In the Stanford laboratory a six mm graphite rod about 20 cm long isheated in a partial vacuum to a temperature of 2200-2800'A by acurrent of 200-300 amperes from a 10 kw step-down transformer. Thelight used is taken from a notch 1 mm wide by 3 mm deep and 3 cmlong, and passes out through the quartz window Q waxed to the water-cooled metallic jacket surrounding the filament as shown in Fig. 7. Asingle rod lasts a number of hours, and can be replaced in a few minutes.The temperature is measured by means of an optical pyrometer. Acorrection of about 20° must be applied to the observed temperature toallow for absorption of light by the window; its exact amount can bedetermined by inserting another similar window in the beam.3 0
Dorgelo3l describes other types of black body.If a black body is not available one may use the radiation from
tungsten, carbon, or other filaments, applying corrections for the de-parture from black body conditions. If the temperature of such aradiator is measured with an optical pyrometer of the disappearing fila-ment type,32 the so-called brightness temperature T at a certain wavelength (generally 6650A in the red) is obtained. For several materialswe know the relation between this and the colo) lemperatiu T which
290

PHOTOGRAPHIC PHOTOMETRY
FIG. 7. A convenient black bodyfurnacefor use as an intensity distribution standard through-out the visible and into the ultraviolet as far as 2600A. Q quartz window through which light fromthe slit S in the filament F emerges. A 10 kw transformer, terminal voltage 10 volts, sends a currentoffrom 200 to 300 amperes from M to N. The top T is waxed to the base B with soft laboratorywax, and is exhausted to afew mm pressure through P. Some water vapor sweats through the brassjacket (which should preferably be made of copper) but this is largely taken up by the graphitecylinder G which gets red hot. The 1/4 inch filament F can be run for a number of hours at tem-peratures up to 2800'A, but is most useful when run at about 2500'A. A constant stream of waterpasses through the cooling system by means of the pipes marked W. A new filament can be insertedin a few moments when one burns out.
FIG. 8. Graph showing the relation of the color temperature of a tungsten strip to its bright-ness temperature as measured with an optical pyrometer with red filter (brightness match at wavelength 6650A). The energy distribution of the light from the strip in the visible region can thenbe calculated from Wien's law, substituting for T in that formula the value of T obtained fromthis curve.
November, 1929] 291

GEORGE R. HARRISON [J.O.S.A. & R.S.I., 19
is the temperature of a black body having the same energy distributionover the visible spectrum range. Fig. 8 shows the relation between colortemperature and brightness temperature for tungsten, the data beingtaken from that of the Nela Laboratory workers33 and Zwikker.34 It isthus possible to use a tungsten filament as a standard source, the
energy distribution being computed directly from Wien's Law with T,substituted in place of the true temperature. This is probably the mostconvenient source for routine use in the visible.
A standard type of lamp for this purpose is that containing a tungstenribbon approximately 1 mm wide and 25 mm long, taking about 20amps at 5 volts. This can be run with great constancy from a bank ofsay six 6 volt storage batteries in parallel. Such lamps, calibrated forcolor temperature in terms of current through the filament, can beobtained from either the Bureau of Standards or the Nela ResearchLaboratory. In the range 4500-3600A a correction to the energy dis-tribution curves should be made on account of the selective trans-mission of the glass envelope. This transmission can be measured forvarious wave lengths in a spectro-radiometer. 3 0
Such lamps can be fitted with a quartz window,35 or indeed with acomplete fused quartz bulb. Those of the latter type supplied by thePhilips Glowlamp Works, Eindhoven, Holland, are designed to beburned in an inverted position, so that the evaporating tungsten, beingcarried upward by the convection currents in the gas contained in thelamp, will be deposited where it will do no harm. Their usefulness in theultraviolet below 3600A is somewhat limited by the paucity of dataon the emission characteristics of tungsten in this region. Even up towave lengths as long as 4500 a small emissivity cortection is desirable,which is, however, in the opposite direction to that required for thevarying transmission when a glass envelope is used. Lamps with quartzwindows can be readily compared with a black body by photographicphotometry, and all emissivity and transmission errors can be elimi-nated by a single correction at each wave length. v. Alphen36 notesthat the use of light from the center of a tungsten spiral has advantagesin the ultraviolet, as the internal reflections apparently compensate forthe deviations from Wien's Law caused by the emissivity variation oftungsten in this region.
In certain cases it is desirable to determine the actual energy dis-tribution from an incandescent source by means of a thermoelectricdevice. The double monochromator of van Cittert3 7 is most convenient
292

PHOTOGRAPHIC PHOTOMETRY
in such cases, as no parts need be moved except an adjustable slit. Forthe highest accuracy it should be provided with color-corrected lensesto avoid changes in aperture with wave length. An ordinary singleprism monochromator will serve, provided the complete aperture of thesystem is not used so that the effective aperture can be kept constantby means of external diaphragms while the lenses are being refocusedfor various wave lengths. The fixed-prism type 8 sometimes has ad-vantages over the movable-prism type38 where the losses of light byreflection may be very great in certain regions; commercial quartzmonochromators are obtainable, however, which avoid this difficulty.39
Vacuum thermo elements of very high sensitivity and quick action,of the new type designed by Moll and Burger,' can be obtained com-mercially; in glass, uviol glass, or quartz envelopes permanently evacu-ated, or in envelopes provided with a fluorite window, which require theuse of a pump. When used in connection with a thermo-relay' theirsensitivity is limited only by the effect of the Brownian movement onthe galvanometer. These, when used in conjunction with a good mono-chromator of large aperture leave little to be desired for standardizinglamp sources.
As the energy distribution at the light source is what is required, it isnecessary to correct for the transmission of the monochromator, whichwhen used in this way is termed a spectro-radiometer. Several ways ofmeasuring the transmission of this at various wave lengths are avail-able,38"17 of which those involving the use of another monochromatorand a photoelectric cell are probable the simplest. The use of any fixedarm monochromator with a thermocouple directly in front of the mainspectrograph, in the manner described by Dorgelo40 for the van Cittertinstrument, is permissible and avoids measurement of the transmissionof the monochromator, provided that the aperture of the beam strikingthe thermoelement and entering the spectrograph is kept constant.
Various other continuous sources whose energy distributions havebeen determined under certain conditions are listed by Dorgelo,8 buttheir usefulness is limited to certain special cases.
b. Line Sources. Where available, constant continuous sources aremost desirable for standardization except in certain cases of use withgrating spectrographs where scattering of light causes trouble. Theirspectra can be blocked off by means of diaphragms to give artificiallines, as was shown in Fig. 5. In the ultraviolet region the radiationfrom most materials at temperatures obtainable in the laboratory is too
November, 1929] 293

GEORGE R. HARRISON
weak for use with high dispersion equipment below about 3000A,(2300A has been reached with low dispersion prisms), and it is necessaryto turn to line sources for standardization purposes. None with knownintensity distribution is at present available, so this must be measuredin each case with a spectro-radiometer in the manner described under 5a.
Practically the only source which has been used in this way up to thepresent is the quartz mercury arc.4' It possesses relatively few lines andthese are of great strength, and it can be controlled in such a mannerthat it will be very steady. The lines are on the average close enoughtogether so that two or three can generally be impressed on each plateeven with high dispersion apparatus, and they are far enough apart sothat they can be resolved with a small prism monochromator. Eachindividual arc must be separately measured, and the measurementsmust be repeated for each set of running conditions. 8 For this reasonone or two definite sets of conditions are generally chosen for allstandardization work in a given laboratory.
As the arc warms up its terminal voltage rises and the current throughit decreases. The relative value of these two quantities depends on thearc temperature, so it is necessary to provide a means of varying theventilation of the arc to control this. The methods of controlling mer-cury arcs are described in detail in the articles cited. The mercuryspectrum is useful for standardization only between 4360A and about2500A, since the lines at longer and shorter wave lengths are too widelyspaced or too weak to be of general use.
There seems to be no doubt that cadmium arcs42 or arcs of othermetals could be used to supplement the mercury arc, while hydrogendischarge tubes carrying high currents can be used in the ultraviolet andextreme ultraviolet. There is a great need for further sources to be usedas standards of energy distribution; any constant continuous or linesource which can be run under controlled conditions and which is ofsufficient intensity for measurements with the spectro-radiometer canbe made to serve.
c. Dispersion Corrections. If we have two practically monochromaticlines of the same shape produced by a spectrograph and the spectro-graph slit is widened sufficiently they will have flat tops and equalbreadths, provided the spectrograph has uniform dispersion, or if it hasa "true" variation in dispersion such as that caused by the varyingdispersion of a prism, which can have no effect on monochromatic lines.But if, as is the case in many instruments, the photographic plate is
294 fi.O.S.A. & R.S.I. 19

PHOTOGRAPHIC PHOTOMETRY
struck at different angles by beams of different wave lengths, or if thespectrograph produces larger images of the slit with long wave lengthsthan with shorter ones, say, there will be a difference in the breadths ofthe two lines, and a width correction must be applied before the heightsof the lines can be considered proportional to their areas. Now if weconsider two regions of width dX taken from a continuous source, thesame effects would be observed, but in addition an effect would occurbecause of the overlapping of neighboring slit images, this varying withthe "true" dispersion. Hence if we compare an unknown line sourcewith a continuous standard source, or vice versa, part of the effect ofthe "apparent" ("true" plus "false") dispersion variation will cancel out,while the effect due to the "true" dispersion variation will not. Thus inthe case of a grating mounted in the Paschen manner the dispersionvariation is caused by the change of angle at which the light strikes theplate, and by changing focal distance ("false" dispersion variation) andno dispersion correction need be made, even when line and continuoussources are being compared. But in the case of a prism instrument itappears that it is necessary to distinguish between the "true" and the"false" dispersion variation present, and to correct for the first of theserather than for the "apparent" variation of dispersion. The same resultcan of course be achieved by correcting for "apparent" variation ofdispersion, and then applying a correction for changing line breadths.In the Fery spectrograph or in the ordinary quartz prism instrument alarge amount of "false" dispersion variation is usually present due tothe variation of the focal lengths of the lenses with wave length, and tothe curvature of the focal plane. The separation of these two effects isnot difficult, but appears to be often overlooked. In any photometricinvestigation the possible necessity for corrections of this sort, due todifferences between the source being studied and the standard source,should be carefully gone into.
6. Development. a. Developers. Either plates or films can be usedsatisfactorily for photometry, but plates are somewhat more con-venient to handle, and can be used in most cases, since very exactfocusing is not required for intensity measurements, and it is seldomnecessary to curve the emulsion except with low dispersion apparatus.It is desirable to use no part of a plate within half an inch of any edge,and where possible, to cut plates from those larger than needed, as theemulsion is apt to be more uniform in the center of any given coatedarea. Seasoned plates which have been stored on edge in a cool placegive best results.
November, 1929] 295

26GEORGE R. HARRISON [J.O.S.A. & R.S.I., 19
The choice of developer is rather important, since very uniform de-velopment without staining of the emulsion is wanted. The two de-velopers which seem to be in most common use for photometry are elon(or metol)-hydrochinon, and rodinal (1 part to 20 parts water). A goodformula for the former is:
Distilled water 10 Elon (or metol) 14 gSodium Sulphite 212 gHydrochinon 56 g
Potassium Bromide 150 gSodium Carbonate 300 g
This can be mixed in large quantities and will keep a number of monthsin stoppered bottles. When used it is to be diluted with two parts ofdistilled water to one of developer. At a temperature of 18C the properdevelopment time for this formula is about five minutes. The rodinaldeveloper need only be mixed with water at the time of use. Developerssuch as pyro and glycin should be avoided.
b. The Eberhard Effect. If a plate be uniformly exposed to light ofmoderate intensity, and a small area be then given an additional heavyexposure, on development a region of abnormally lowered density willbe noted around the dense portion. This is due to what is known as theEberkard effect, and is caused by the fact that when a heavily exposedarea of emulsion is being developed a large quantity of soluble bromideis set free which acts as a restrainer and slows up the development ofsurrounding regions. Numerous devices have been proposed to reducethis effect, the most useful being (1) Selection of a developer producingsmall Eberhard effect (elon-hydrochinon and rodinal are good in thisrespect); (2) Use of moderately complete development, stopping onlywhen appreciable fog appears; (3) Constant positive agitation of thedeveloper to distribute the reaction products more uniformly over theemulsion; (4) Use on the emulsion of exposed regions all of approxi-mately the same shape and of uniform distribution. The last conditionis of course difficult of exact realization, but it can be approached, asmentioned above, by breaking up a standard continuous spectrum intoartificial lines when comparing it with a line spectrum.
Dobson, Griffith and Harrison6 describe various methods of producinguniform development, their plunger developing apparatus or themechanical rocking and brushing outfit of Bloch and Horton43 being
296
PHOTOGRAPHIC PHOTOMETRY
probably the most satisfactory. If the plates are constantly brushedduring development44 and the other precautions listed are taken verylittle trouble due to Eberhard effect is found. In the design of de-
veloping machines the important point is that turbulent motion is re-quired rather than streamline flow, no matter how rapid.
c. Treatment after Development. In fixing, washing and drying platesthe usual precautions observed in ordinary photography are sufficient.A good hardener should be used to prevent marring of the emulsion;formulas for these are given by manufacturers in practically all boxes
of photographic material. After washing, the plates should be carefullyswabbed on both sides a number of times (with a tuft of wet cotton, or
better, the palm of the hand) to remove the "bloom," and then rinsedin distilled water so that no drying marks or dust spots will remain.Slow drying is preferable to the use of a fan.
It is a common misapprehension that when a number of plates which
contain spectral lines which are to be compared have been exposed
simultaneously, great care must be taken that they all be given thesame development. As a matter of fact the plates may of differentemulsions and may be given entirely different treatment on develop-ment. This is because each plate is separately reduced to intens ties,the exposures to the standard source furnishing the bases for com-parison.
d. The "Brush Effect." Reference is sometimes made in the literature
to the statements that the latent image may change fairly rapidly afterexposure, so that two exposures on the same plate should not be com-
pared if one is made immediately before development while the otherhas been made at some previous time. Careful experiments46 haveindicated that no such effect exists, except possibly within two or threeseconds after exposure. It is a good plan, however, to take unknown,standardization, and calibration exposures as near together in time aspossible, since variations in humidity, temperature, etc. can un-doubtedly affect the characteristics of the emulsion to some extent.
7. Densitometers and Microphotometers. a. General. After the variousexposures have produced their records on the plate these must
be measured by having their densities compared so that thecorresponding intensities can be determined. Many designs of micro-
photometer have been suggested for this purpose, but only objectivetypes will be discussed here. Subjective microphotometers in which
the eye is used as a balancing instrument have been brought to a
297November, 1929]
GEORGE R. HARRISON
high degree of development, but for measuring photographic plates theyhave been practically entirely displaced by those using the thermo-electric or photoelectric methods. They can be used where the ac-curacy of a single reading need not be over 5%, but are fatiguing andslow compared to the newer methods. Various types of visual micro-photometer are described in Kayser's Handbuch, and by Dorgelo inhis review of photometric methods. For the measurement of extremelyhigh densities their use is sometimes necessary, and an instrumentespecially designed for this purpose has been described by Jones.46a
Practically all microphotometers except those of the null type can beused either with a telescope to measure deflections directly or with arecording device which impresses a record of these on photographicpaper or plates. The latter device is of great service in determining lineshapes or the general contour of spectra, and as much of this type ofwork has been done in the past most of the commercial instruments aredesigned primarily for automatic recording. The opinion appears to beprevalent that a "self-registering microphotometer" is far superior toany instrument which can be read directly. That this is not true for alltypes of work will appear on consideration of the fact that in manycases flat topped lines can be used, and a single reading will give itstotal intensity. The recording feature is in fact undesirable for mostwork on multiplet intensities; this is shown in an amusing manner bythe action of one investigator who, in order to avoid the delay of develop-ing, drying, and measuring the record, stuck pins into the scale of therecorder to mark the maximum excursions of the galvanometer beam.Direct reading with the telescope has the advantage that (1) parts ofthe spectrum which need not be measured can be quickly passed over,(2) development and drying of records is avoided, (3) zero drift, if itexist, can be controlled more easily, (4) greater accuracy is obtained,since a 1000 mm scale can be read directly with the telescope (exceptpossibly in the case of string electrometers), whereas the record isgenerally only 120 to 200 mm wide, and must be measured later in anycase with a traveling microscope or comparator. We are of courseassuming that the deflecting instrument is sufficiently stable to makethis accuracy worth while. Often over half the time of measurement ofa plate can be saved where direct reading is used. For this reason thosecontemplating line intensity determinations should arrange, wherepossible, to have their microphotometers equipped to read deflectionsdirectly, in addition to the recording feature.
298 [J.O.S.A. & R.S.I. 19
November, 19291 PHOTOGRAPHIC PHOTOMETRY 299
The outstanding commercial instruments are the photoelectricmicrophotometers made by Kr-ass (Koch-Goos type) and by Zeiss(modified Koch), and the thermoelectric instrument (Moll) made byKipp and Zonen, which has recently been greatly improved.
All microphotometers of the ordinary type possess a number of com-mon features. Light from a constant source, almost always an in-candescent lamp, is focused by a lens on a slit. In certain cases this
slit is almost in contact with the emulsion being measured; in others,an image of the slit is thrown by a second lens on the emulsion. (Some-
times an image of the lamp filament is thrown directly on the emulsion,but this greatly reduces the resolving power of the instrument, and maycause errors due to scattered light.) After passing through the emulsionthe light is focused by another lens on a device in which radiant energy
produces or controls electrical energy, generally a thermocouple orphotoelectric cell. This is connected to and produces deflections in a
galvanometer or electrometer.The parts needed are: (1) A steady source of moderate intensity
emitting any wave lengths to which the sensitive instrument responds,(2) A means of passing a beam of light from this through a small areaof the plate, generally about 3 mm by 0.1 mm or less, (3) a light sensi-
tive instrument of uniform and quick response which is unaffected byexternal disturbances, (4) a sensitive current measuring device of shortperiod, (5) a method of holding the plate or film and moving it acrossthe light beam, with a means of observing the plate while this is beingdone, if possible, (6) a shutter to turn the light beam on and off.
A close race for popularity has been run in the past fifteen yearsbetween thermoelectric and photoelectric microphotometers. For sometime the thermoelectric instruments were in more common use, butthe improvement of the photoelectric cell and of vacuum tube ampli-fiers has caused a growing trend toward the other type. Its advantagesare higher sensitivity, quicker response, and greater ease of insulationfrom external disturbances; its disadvantages have previously been in-stability and fatigue, which are now being overcome.
b. Thermoelectric Microphotometers. I have discussed the micro-photometer question somewhat in a previous paper,47 although moderndevelopments have been so rapid that this is out of date. The Mollmicrophotometer is the best known type, and for many years was theonly one manufactured commercially. Its popularity is largely due tothe great sensitivity and quick action of the Moll vacuum thermo-
GEORGE R. HARRISON [J.O.S.A. & R.S.I., 19
element and to the short period and stability of the Moll galvanometer.It is somewhat inconvenient to use for line intensity work since theplate is in a difficult position to observe while running through thespectrum. This general objection applies to any instrument with ahorizontal optical system except those of the projection type describedbelow. Other thermoelectric instruments have been described byvarious writers.4 8
Where an image of the illuminated slit is thrown on the plate caremust be taken that the lens used is achromatic in both the visible andthe short infrared, as the main portion of the energy used is in the range0.7-1.5u, and if all of the light is not in accurate focus the resolvingpower will be cut down unless a contact slit is used.47 This is one ad-vantage of the photoelectric instrument, which generally responds to anarrow band of light in the blue and violet regions only. The densityvalues given by the two types of instrument for a given line will ofcourse be very different, since the transmission and scattering of lightby silver changes greatly with wave length. For this reason any givenplate should be completely measured with a single instrument. Chang-ing the lamp brightness to vary the sensitivity of the instrument bymore than a small amount is generally not legitimate with the thermo-electric apparatus, due to the change in effective color of the light beamwith temperature.
Vacuum thermocouples can be obtained commercially which reactin less than a second, and bismuth-silver or other types of thermocouplesor thermopiles which require a few seconds to give maximum responsecan be built in the laboratory. 49 They are used in conjunction with alow resistance high sensitivity galvanometer, of period preferably lessthan six seconds. For direct reading this length of time is generallyneeded to reset on another line and to record data; for self-registeringinstruments it is somewhat long, as an hour or more would be requiredto trace the record of a 10 inch plate, too great speed causing errors dueto galvanometer lag. The newest Moll instruments have been speededup greatly in this respect, but they are still somewhat slower than thephotoelectric cell instruments using a string electrometer, where theperiod is extremely short and a whole plate can be recorded in from fiveto ten minutes.
A radiomicrometer can be constructed in the laboratory which willserve as a very sensitive recording instrument, obviating the use of athermocouple and galvanometer. A densitometer has been described
300

PHOTOGRAPHIC PHOTOMETRY
utilizing this device."0 It is to be recommended only where economy ofcost is the chief object, as the optical system required, though simple, iscumbersome to handle.
A combination comparator-microphotometer is often useful, and onewhich has given good results for some time in the Stanford laboratoryhas been described recently.5'
c. Pkotolectric Microphotometers. The photoelectric cell is much moresensitive and quicker in response than the thermopile or the vacuumthermoelement, especially when used with an electrometer of shortperiod. The string electrometer lends itself admirably to recordingwork, since its period is extremely short, but it is rather unsatisfactoryfor direct reading since the scale is so limited. Linear scale deflectionsare not required in any microphotometer, since absolute densities arenot being determined. What is wanted is some single-valued func-tion of the density and intensity which can be conveniently used for,interpolation. The quadrant electrometer as ordinarily used has arather long period, and it is somewhat more satisfactory to use a highresistance galvanometer of short period, with a vacuum tube amplifierif necessary.
Photoelectric cells of the gas-filled type are from ten to twenty timesas sensitive as the vacuum type, but are subject to fatigue when run atvoltages anywhere in the neighborhood of the flash point. This fatiguecan usually be greatly decreased by running the cell on a very low volt-age, with a resulting decrease of sensitivity, of course.
The various precautions which must be used in the handling of suchcells, and the electrical circuits used with them, can be obtained fromthe references to articles dealing with photoelectric microphotometers.52The potassium hydride cell is in most common use for this purpose,although some of the new dielectric-treated cells53 may be considerablybetter in certain respects.
In the original Koch microphotometer, which was the progenitor ofpractically all of the modern types, the photoelectric cell was useddirectly as the thermocouple is now, with of course proper differences incircuit. Kochssa introduced an ingenious method of compensating forlamp variations by using a second photoelectric cell as a leak across thefirst instead of the usual fixed leak. This was fed from the microphoto-meter lamp, and flucatuations in the latter were largely nullified.Whether compensation is used or not a cell makes a good and simplevariable leak.
November, 1929] 301
32GEORGE R. HARRISON [J.O.S.A. & R.S.I., 19
Baker54 has described a method of using the photoelectric cell in sucha way that the effects of variations in the voltage applied to the cell areeliminated. Dobson55 designed a null photoelectric instrument elimi-nating errors due to both battery voltage and lamp variations, in whichall densities could be measured with equal accuracy. Such null instru-ments are extremely precise, but there are disadvantages in having tomake a balance and then read the setting of the instrument as well.
It appears that a most desirable microphotometer could be construc-ted on the principle of the projection lantern. A large image of theplate being measured could be thrown on a screen in the usual way, anda small portion of the light in the projected beam could be allowed topenetrate the screen through an adjustable slit, and made to fall on asensitive instrument. The thermoelement is not sensitive enough forthis purpose, and it was not until the newer photoelectric cell amplifiercircuits were developed that it was thought advisable to try such amethod. Recently Hesthal and the writer" have constructed such adevice, and in its preliminary stages it has fulfilled all expectations. Theprojection lamp is run from a storage battery for constancy. The circuitdescribed by Wynn-Williams and others5 7 consisting of a balancedbridge containing two vacuum tubes gives about 5000-fold amplifica-tion, so that the two photoelectric cells connected in the Koch mannercan be run on 6 volts, which gives ample sensitivity and makes fatiguenegligible. The slit in the screen is about 5 cm long and is adjustable inwidth, giving extremely high or low resolving power as desired. Thelight passing through the slit strikes a lens 6 cm in diameter, and isbrought to a partial focus on the main photoelectric cell.
A high resistance galvanometer of moderate sensitivity and shortperiod is used, and its deflections are read by the method described bySmith.58 This optical arrangement is far superior to the usual ground-glass scale, lamp-filament image method, and is much easier on theeyes than the telescope and scale. Modifications are now in progressdesigned to make the instrument read intensities instead of densitiesdirectly from a given plate, and a complete description will be postponeduntil these are perfected.
In utilizing the projection principle this instrument is somewhat likethat of Koch and Goos,52 manufactured by KrUss. That, however, beingportable, is necessarily on a small scale, and there are numerous ad-vantages in using large lenses of long focus in such an apparatus, assmall variations in the thickness of the plate, etc. make less difference.
302

PHOTOGRAPHIC PHOTOMETRY
The advantage of being able to sit in a comfortable position and see onthe screen a large area of the plate around that portion being measured,while an easily followed index moves quickly to a number representingthe density of the line being measured, can be appreciated by thosehaving experience with the tedious work of densitometering. Smallirregularities in the plate or emulsion, which are represented as spectrallines by the registering type of microphotometer, are made evident tothe eye, and identification of real spectral lines is greatly facilitated. Awave-length scale printed on rubber can be stretched along the screenwhen desired, and adjusted for dispersion variations.
d. Other Types of Microphotometer. The selenium and thalofide cellshave occasionally been used in microphotometers.59 These, especiallythe former, show a considerable lag in response, and their sensitivity de-pends on their previous history. They appear to possess no advantages-for this particular type of work not possessed by the thermoelement orthe photoelectric cell.
Abe66 has devised a wedge microphotometer, in which the spectrumto be measured is placed over a slit through which a beam of lightpasses, and an optical wedge is placed between it and another photo-graphic plate. Upper plate and wedge are moved slowly along by amotor, each wave length on the lower spectrogram being photographedon the upper plate through various parts of the wedge. The record isthen cut with ferrocyanide and a definite outline is obtained represent-ing the density distribution in the original plate. It is of course neces-sary to use one of the ordinary methods to reduce these densities tointensities.
e. The Microphotometry of Spectrum Plates. Each reading of themicrophotometer consists of a determination of the ratio of the de-flection through the clear plate to that through a dense portion. Ideallyany portion of the clear plate would give the same deflection whenplaced over the slit; actually a variation is usually found due to changesin fog, in the emulsion, and in the glass or celluloid backing the emul-sion. Eberhard effect may also produce a variation in the clear readings.The approximation which seems to give the best practical results is tochoose one particular spot on the plate which seems quite uniform andclear as the standard position for making the "clear reading," and toreturn always to it. The deflection of the instrument obtained throughthis clear spot will be referred to as the "100 reading," for the reasonthat the work of reduction is greatly simplified if the microphotometer
November, 1929] 303

GEORGE R. HARRISON [J.O.S.A. & R.S.I., 19
light is adjusted in intensity to give a deflection of exactly 100 cm here.Variations in lamp brightness can then be observed and compensatedfor by repeated returns to this spot. With a good instrument the 100reading need not be checked oftener than every five or ten minutesafter a steady state has been reached. The rheostat used to control thelamp brightness should have very positive contacts. An easily con-trolled rheostat is made by stretching a single Nichrome wire along oneside of the control table and providing a clamp contact to slide along it.All connections to storage batteries, rheostat, and lamp should besoldered where possible.
The zero deflection of the instrument should be frequently tested tocompensate for drift. With most instruments ten or fifteen minutes ofuse is required before a steady state is reached. The zero need be testedno oftener than the 100 deflection after this is attained, provided, in thecase of thermo-electric outfits, that the circuit is well insulated fromair currents.
The shutter for producing the zero should be so placed in the opticalsystem that it will not interfere with the field of view, and will not causean error by giving a false zero. This generally indicates that it shouldbe placed somewhere in the beam before it strikes the plate, so thatstray light which affects the sensitive device during readings will con-tinue to affect it while the zero is being taken. Shutters immediately infront of the photoelectric cell are to be avoided for this reason; this isstill more true when thermoelements are being used, since in additionto this effect the shutter may emit radiation which causes a false de-flection.
After the 100 deflection has been adjusted, readings are taken throughthe lines, and if any continuous background exists, on one or both sidesof each line. Usually when running through a spectrum the backgroundis found sufficiently uniform so that background readings need only betaken for every ten or fifteen lines. The ratio 100 reading line/readingthen gives the opacity of the line, and the common logarithm of thisgives the density.
We need not plot d-log I curves to reduce the data, since any simplefunction of density and intensity will do. If clear and zero readings areconstant, we may plot log G against log I of the equivalent calibrationexposure, where G is the galvanometer deflection through the calibrationline. This gives a curve similar to the characteristic curve, but inverted,as in Fig. 9. By plotting on double log paper the galvanometer de-
304r

PHOTOGRAPHIC PHOTOMETRY
flections directly against the transmissions of the devices used to varythe intensity in making the calibration exposures, we can read inten-sities directly from the curve by interpolating the galvanometer de-flections for the unknown lines. This can also be done for the back-grounds, and the background intensities may then be subtracteddirectly. A similar process is gone through for the standardizationexposures, but in addition to getting their intensities J from the plate,on the basis of the calibration curves of that plate, we already know
j . 4. . .... I'll, . .- .
,0
600 r
their true intensities 1. A curv~Inent relating mang towv egh o agof 10 or s Anstos o ec sid tof eac cbato curv iste
each unkow lned hrteristi curve te aluge for aclne deis hemth icrpited yorJ the ruclitin alures fgabingt the ameo asios o alcrs of eac plateen fxosres all dulae woihich aer had thisame texi-tensitie to sand ar sore Thi h lns produigclanmtrdfectsGad can be read o ecly
standariaton exosros but inc prie it isc calirtioncvei thenalche unknonardizatiom exposure nThe aue fori byc meanes fthen
calibration curves, and to use the resulting average I values in thereduction.
November, 1929] 305

36GEORGE R. HARRISON
The actual errors of using the microphotometer are generally lessthan 2%, most of this being caused by difficulties of setting. Readingson the same setting generally agree to 0.5% with a good instrument.Variation in the emulsion and development are likely to be from 3 to 5%but these quickly compensate one another when a fair number of de-terminations of a single quantity are averaged. Much larger errors areintroduced by the presence of a variable background of intensitygreater than 10% of the line intensity.
The procedure outlined above applies equally well to the reduction ofphotographically recorded microphotometer records, except that hereit is less easy to apply the methods of simplification which can beused when the clear and zero readings are controlled.
IV. SPECIAL METHODS OF PHOTOGRAPHIC PHOTOMETRY
1. Methods for Calibrating with a Single Exposure. a. General. Itis obvious that much time would be saved if, instead of taking fromfour to twenty calibration exposures, these could all be taken at once.This is especially true if the time of exposure is longer than a fewminutes; in certain work, as with the Raman effect, where the exposuresmay be a week or more in length, such a method is a necessity. Witha stigmatic spectrograph having a fairly long slit, this can be given avariable width along its length when calibrations are made with a con-tinuous source, the resulting spectrum consisting of several long bandsof known difference in intensity.
b. Step-weakeners. The same end can be attained somewhat moreconveniently by placing in front of a fairly long slit of the usual typea step-weakener, made by building up steps of decreasing transmissionby superposing layers of (more or less) neutral material. Plates ofquartz coated with antimony or platinum in steps of different densitiesshould be useful throughout the visible and ultraviolet. Or an image ofthe step-weakener can be thrown on the slit by an extra lens. Neutralitycan be obtained by using step-diaphragms ("Rasters") of the types usedby Hansen and by Frerichs.60 With all these methods it is necessaryto see that the step-weakener is uniformly illuminated.
c. The Wedge Method. The optical wedge may be considered as astep-weakener with an infinite number of steps of infinitesimal width.It can be used wherever the step-weakener is usable, which means infront of the slit in a stigmatic spectrograph, or in contact with theplate in an astigmatic mounting. Its use is discussed in detail by
306 [J.O.S.A. & R.S.I. 19

PHOTOGRAPHIC PHOTOMETRY
Dobson, Griffith, and Harrison6 and the method has been used by anumber of workers.60 a The platinum wedge of Merton is very usefulin the ultraviolet.6" The wedge is slightly less convenient to use than thestep-weakener, since the position of measurement along each spectralline must be found and no uniform areas of density exist, whereas withthe latter each step is definitely marked. The wedge is extremely use-ful for showing qualitatively the spectral energy sensitivity of photo-graphic materials; as an accurate quantitative tool it is probably slightlyinferior in accuracy to a number of other methods. In the visible regionwedges can be obtained commercially made from approximately neutralglass or dyed gelatine. They are generally most easily calibrated in theposition of use by means of neutral screens.
d. Intensity Distribution from Coarse Gratings. Parkhurst andFarnsworth62 have made use of the theoretical intensity distributionof the light from coarse gratings among various orders. The gratingspectrum is produced at right angles to the principal spectrum, eachline being broken up into a number of small spots of known relativeintensity.
e. Line Intensity Distribution. The theoretical intensity distributionin a spectral line as produced by a given spectrograph gives a calibrationwith a single exposure, as explained by Ornstein and Minnaert.6 3
Besides the saving of time, all of these methods have the advantagethat the calibration spectrum and that being measured are automatic-ally made to have the proper relative density ranges, the required wavelengths are always present in the calibrating source, and it presents thesame intermittency characteristics as the source being measured. Thesecalibration methods would undoubtedly displace those requiringsuccessive calibration exposures, were it not for the fact that theypresent certain optical difficulties in many cases. Where they can beused they are most convenient.
2. Limiting Density Methods. a. The Outline Wedge -Method.Merton and Nicholson6 4 describe a method of using the optical wedgewhich avoids the use of a microphotometer. There is always somemore or less well defined intensity which will give a minimum visibledensity; by the use of a wedge a large number of densities are producedand the one of vanishing visibility is taken as a standard. Knowingthe intensity distribution produced by the wedge, if the length of thespectral line from its base to its last point of visible density be measured,one can obtain the intensity of the line. The method is not of the high-
November, 1929] 307
GEORGE R. HARRISON [J.O.S.A. & R.S.I., 19
est accuracy, since in practice the density of the lowest visibility is notsharply marked. To make the line of demarcation more definite recourseis had to copying on a more contrasty emulsion, and to cutting withreducers. This has the disadvantage of all copying processes, that eachtime an extra photographic emulsion is involved in the reduction newerrors are introduced due to the variation of the emulsion. For rapidsemi-quantitative determinations of spectral intensities the method isvery useful.
b. Merton's Grating Method.65 By interposing a coarse grating in thespectrum in connection with an optical wedge, each line is broken upinto a number of small dots which gradually fade out. By counting thenumber of visible dots a rough value of the intensity of the line is arrivedat.
3. Methods primarily for Use in Absorption or Reflection Measurements(Special Homochromatic Methods). a. The Hilger Sector Photometer67
Although the use of the rotating sector disc introduces both intermit-tency and reciprocity errors,68 under certain conditions these can ap-parently be made negligible.69 Use is made of this fact in the apparatusmanufactured by Hilger, designed for measurements of absorption inthe visible and ultraviolet by a method similar to that of Henri. Lightfrom a source, which need not be constant, is divided into two beamsby a bi-prism, one beam passing through the absorbing material and arotating sector of fixed aperture, and the other through a rotating sectorof variable aperture. The two beams are then sent into a spectrographin such a way that they produce contiguous spectra. A series of spectro-grams is taken for various settings of the variable sector, and pointswhere the densities are equal in the two are found. The amount oflight transmitted at each wave length by the material under study canthen be found from the setting of the variable sector producing the samedensity. Both spectra are produced by intermittent exposures, but thereis a difference in the ratio of exposure to rest period in the two cases. 0
However, under the conditions of ordinary use the method gives resultswhich are in good agreement with those obtained by other methods.
b. Lewis' Sector Photometer.7' Lewis has designed a modification ofthe Hilger method which avoids the use of intermittent exposures andcauses the radiant energy to pass through the absorptive material ina parallel beam.
c. Jones' Method. L. A. Jones72 has devised an ingenious method forrapidly determining absorption curves of materials. Alternate strips
308

PHOTOGRAPHIC PHOTOMETRY
of the photographic plate exposed in the spectrograph are covered witha grid. Each strip is exposed to a portion of a continuous spectrumwhose intensity is increased logarithmically from top to bottom by mov-ing the plate up and down while a radial sector diaphragm isbeingopenedand closed on the collimating lens of the spectrograph. The grid is thenmoved so as to cover the exposed strips of the plate and uncoverthe unexposed, and the plate is exposed to the spectrum taken throughthe absorptive material being studied, while the intensity is variedlogarithmically in the opposite direction to the previous one. A seriesof narrow bands having a graduated density in one direction inter-laced with another series having a graduated density in the oppositedirection is obtained, and it is a simple matter to match points of equaldensity very accurately. These points, when joined by a continuouscurve, give the absorption curve of the material in the spectral regionunder observation.
d. Other Methods. While numerous other methods of photographicphotometry have been proposed, most of them vary only slightly inprinciple from those described, and reference should be made to theoriginal articles. A number of general discussions of the problems in-volved and methods of their solution are included in the references,many of these dealing with both heterochromatic and homochromaticphotometry.73
V. SPECIAL SPECTRAL REGIONS
The problems encountered in special spectral regions are usually thoseof photography rather than photometry, since the methods describedcan generally be used at any wave lengths provided suitable sourcesand other equipment are provided. Certain methods lend themselvesbetter mechanically to one region than another, however.
1. The Infrared. Photographs on plates stained with dyes74 have beenobtained up to 12,OOOA and beyond, and photometry could undoubtedlybe done in this region by the photographic method. The methods fortaking a single calibration exposure should be useful here, as the ex-posure times required are very long. Schoen75 has extended a homo-chromatic method into the infrared as far as 9000A, and there seemsto be no natural limit at this point with the newer dyes. The methodcould also doubtless be extended to include heterochromatic photo-metry, the chief problem being the intensity of the light sources.
2. The Visible. Glass apparatus and the ordinary dry plate can beused in the region 5200-3500, the glass providing the lower but not the
November, 1929] 309

GEORGE R. HARRISON [J.O.S.A. & R.S.I., 19
upper limit. Panchromatic plates are necessary for extending spectrainto the red as far as 7200A; orthochromatic plates reach 6000A, andspecialAstronomical Green Sensitive Plates canbeobtainedfor increasedsensitivity around 5400A. The subjective methods described can ofcourse be supplemented by eye methods in this region alone.
3. The Ultraviolet. Certain glasses can now be obtained which aretransparent down to 2500A,78 and fused and crystal quartz can be usedfrom far in the infrared down to about 2000A, the crystal quartz beingsomewhat more transparent at the shorter wave lengths than the other.Rock-salt equipment can also be used in the visible, infrared, and ultra-violet. Water prisms and lenses can be used as far down as 1800Awhen enclosed in thin quartz walls. Fluorite can be used from theinfrared down to about 1200A, and is often useful for thin windows andfor correcting lenses. Clear thick pieces of this material are ratherexpensive.
Fewer filters are available for the ultraviolet region than for theothers, although many solutions7 7 in quartz vessels can be used. Thesputtering or evaporating of metallic coats on quartz or fluorite for thispurpose needs much investigation.
4. The Schumann Region. Below 2000A the absorption of the atmos-phere is very great, so vacuum spectrographs must be used. Practicallyno quantitative intensity measurements on individual line intensitieshave been made in the region below 2000A, a small amount of re-flection and absorption work having been done.78 While general photo-metry would be difficult, it is by no means impossible. The new vacuumspectrographs of higher dispersion now available7 9 in a number of labor-atories should be of great value in this regard.
The ordinary photographic emulsion is not sensitive below about1800A due to the absorption of the gelatine. The sensitivity beginsto decrease rapidly below 2500A. Schumann plates8 0 which contain re-latively little gelatine can be obtained commerically or they can be madein the laboratory. 8' They are generally not suitable for intensity workas the emulsion is apt to be very irregular in sensitivity. Duclaux andJeantet8 2 have dissolved the gelatine from ordinary emulsions withacid, producing sensitive plates; the writer has seen no data on theiruniformity. Plates coated with fluorescent oils have been investigatedfor uniformity83 7 8 and found satisfactory for intensity work. Thewriter understands, however, that the Eastman Kodak Laboratorieshave succeeded in dyeing emulsions so that they are sensitive in the
310

PHOTOGRAPHIC PHOTOMETRY
extreme ultraviolet, and these will doubtless be found superior to anyothers for intensity work in this region.
The principal problems in the region of short wave lengths would seemto be in the accurate determination of calibration and standardizationcurves. Work is now in progress on this in the Stanford laboratory.
5. The X-ray Region. Photographic photometry can be satisfactorilycarried on in the x-ray region, -although standardization of plates israther difficult, both due to the scarcity of accurate means of measuringenergy distribution with wave length, and because the sensitivity of theemulsion has abrupt discontinuities at certain wave lengths. The re-ciprocity law seems to hold quite accurately under many conditions85and makes calibration easy, since it can be tested in any given case bycomparing the densities obtained with lines of known relative intensity,such as the K, and 2 lines. Here self-reversal need not be feared,and the relative intensities of numerous lines in the x-ray region havebeen measured for a number of materials. 8 6 Care should of course betaken not to choose lines which vary in relative intensity with excitationconditions.
Step filters for use in this region can be readily constructed from thinsheets of aluminium or other material, these being calibrated by meansof an ionization chamber. Other methods will readily be suggestedby a consideration of those used in the visible region.
The characteristic curves obtained with x-rays are of the same generaltype as those obtained with light, but equivalent phenomana takeplace at higher densities in the former case.87 The under-exposure regionfrequently extends up to density two or three, and it is this region whichis most frequently used and is most convenient for photometry. Densityis practically proportional to intensity I instead of to log I in the toe ofthe curve, so it is more useful to plot d-I curves than the usual d-logI.The departure from this law at higher densities is gradual, however,and care must be taken to accurately follow the true course of thedensity-intensity relation.
A good general discussion of photographic photometry in the x-rayregion will be found in Dorgelo's review article.8 3
VI. CONCLUSION
Photographic photometry, when properly carried out, furnishes avery convenient method of measuring spectral light intensities, anddata can be obtained with it which at present can be obtained in no
November, 1929] 311

GEORGE R. HARRISON [J.O.S.A. & R.S.I., 19
other way. Much work needs to be done in its development, especiallyin the selection and calibration of sources of standard intensity distribu-tion. It has been developing very rapidly in the past few years, and avast amount of data on radiation and atomic structure can be obtainedby its use. It furnishes one of the most fertile and rapidly growingfields of investigation of the present time, and it is to be hoped that anincreasing number of laboratories will see their way open to embarkingon major programs of intensity work in the near future.
DEPARTMENT OF PHYSICS,STANFORD UNIVERSITY,
PALO ALTO, CALIFORNIA.
REFERENCES
1 W. W. Coblentz, Bull. Bur. Stds., 4, p. 392, 1908; 9, p. 7, 1911; 11, p. 132, 1914; 12,p. 504, 1916; this journal, 7, p. 439, 1923; 5, p. 259, 1921.
W. H. J. Moll and H. C. Burger, Phil Mag., 50, p. 618, 1925; 50, p. 626, 1925. ZS.f ur Phys., 34; p. 112, 1925; Rev. d'Opt., 4, p. 562, 1925.
2 W. H. J. Moll and H. C. Burger, Phil. Mag., 50, p. 624, 1925. ZS. fur Phys., 34, p. 109.1925.
J. Taylor, The Wireless Eng., p. 627; Oct. 1927.3 See A. C. Hardy, this journal, 18, p. 96; 1929.
K. S. Gibson, this journal, 7, p. 693; 1923.4 L. S. Ornstein, Proc. Phys. Soc. Lond, 37; p. 334, 1925. Phys. ZS. 28, p. 688, 1927.6 H. B. Dorgelo. Phys. ZS., 26, p. 756; 1925.6 Photographic Photometry, by G. M. B. Dobson, I. 0. Griffith, and D. N. Harrison,
Oxford, University Press, p. 121; 1926.7 F. E. Ross, this journal, 4, p. 255; 1920.
P. S. Helmick, this journal, 5, p. 336; 1921.8 See Investigations on the Theory of the Photographic Process, S. E. Sheppard and C. E.
K. Mees, Longmans, 1907.F. E. Ross, Astrophys. Jour., 52; p. 86; 1920.K. Schwarzschild, Astrophys. Jour., 11, p. 89; 1900.W. de W. Abney, Phot. Jour., 18, p. 302; 1893-4.L. A. Jones and E. Huse, this journal, 7, p. 1079, 1923 (refs.).L. A. Jones, V. C. Hall and R. M. Briggs, this journal, 14, p. 223; 1927 (refs.).
12 L. A. Jones and E. Huse, Ioc cit.13 G. R. Harrison, this journal, 11, p. 341; 1925.4 L. A. Jones and 0. Sandvik, this journal, 12; p. 401; 1926.
P. Lafay, Rev. d'Optique, 7, p. 495; 1928.15 A. Eagle, Astrophys. Jour., 31, p. 120; 1910.
F. Wadsworth, Astrophys. Jour., 2, 370; 1895.W. F. Meggers, Bur. Stds. Sci. Paper No. 441.
17 G. R. Harrison, this journal, 17, p. 389; 1928.17a C. E. Weinland, this journal, 15, p. 337; 1927 (refs.).18 G. R. Harrison and G. S. Forbes, this journal, 10, p. 1; 1925.
Forbes and Harrison, this journal, 11, p. 99; 1925.
D. C. Stockbarger, this journal, 14, p. 356; 1927.
312

PHOTOGRAPHIC PHOTOMETRY
19 E. T. Bovie, this journal, 7, p. 1026; 1923.20 G. R. Harrison, Phys. Rev., 24, p. 477, 1924; 25, p. 768, 1925.
Harrison and C. E. Hesthal, this journal, 8, p. 471; 1924.20a R. W. Ditchburn, Camb. Phil. Soc. Proc., 23, p. 959; 1927.20b Ham, Fehr, and Bitner, Jour. Frank. Inst., 178, p. 299; 1914.21 G. R. Harrison, this journal, 18, p. 492; 1929.22 L. S. Ornstein, Proc. Phys. Soc. Lond., 37, p. 337; 1925.23 H. B. Dorgelo, Diss. Utrecht, 1924.
R. Frerichs, ZS. f. Phys., 31, p. 305; 1925.24 A. H. Pfund, Jour. Frank. Inst., 192, p. 641; 1922.
E. Karrer, this journal, 7, p. 893; 1923.25 T. R. Merton, Proc. Roy. Soc., 106, p. 378; 1924.26 K. S. Gibson, this journal, 13, p. 267; 1926.
T. M. Dahm, this journal, 15, p. 266; 1927.L. A. Jones, this journal, 16, p. 259; 1928.
27 L. S. Ornstein and M. Minnaert, ZS. fur Phys., 43, p. 404; 1927.28 W. E. Forsythe, this journal, 16, p. 307; 1928.29 R. Frerichs, Ann. der Phys., 386, p. 813; 1926.30 G. R. Harrison, this journal, in press.31 H. B. Dorgelo, Phys. ZS., 26, p. 767; 1925.32 W. E. Forsythe, this journal, 10, p. 19, 1925; 5, p. 494; 1921.
C. 0. Fairchild and W. E. Hoover, this journal, 7, p. 542; 1923.33 A. E. Worthing, Phys. Rev., 10, p. 377; 1917.
Hyde, Cady, and Forsythe, Jour. Frank. Inst., 181, p. 418; 1916.Int. Crit. Tables, 5, pp. 245-246.
24 C. Zwikker, Diss. Amsterdam 1925. (Dorgelo, Phys. ZS., 26, p. 770; 1925.)35 G. Gelhoff, ZS. fr Techn. Phys., 1, p. 224; 1920.
J. Franck and W. Grotrian, ZS. fr Techn. Phys., 3, p. 195; 1922.D. C. Stockbarger, this journal, 9, p. 237; 1924.
36 H. C. v. Alphen, Ann. der Phys., 85, p. 1058; 1928.37 P. H. van Cittert, Physica, 3, p. 182, 1923; Rev. d'Opt., 2, p. 57, 1923. (or see Ornstein,
ref. 4, p. 340, or Dorgelo, ref. 5, p. 771.)38 W. T. Anderson, Jr., H. D. Frazer, and L. F. Bird, this journal, 17, p. 454; 1928.39 H. F. Kurtz, this journal, 13, p. 495; 1926.40 Dorgelo, ref. 5, p. 771.41 G. R. Harrison and H. Engwicht, this journal, 18, p. 287; 1929. (See also refs. 17, 18,
20, and 38.)42 F. Bates, Phil. Mag., 39, p. 353, 1920; Bull. Bur. Stds., 16, p. 45; 1920.43 0. Bloch and H. Horton, Phot. Jour., 68, p. 352; 1928.44 W. Clark, Phot. Jour., 65, p. 76; 1925.45 C. F. Brush, Brit. Jour. Phot., 57, p. 781, 1910; Phys. Rev., 31, p. 241, 1910.46 C. E. Wienland, this journal, 15, p. 337; 1927.
A. E. Weber, Ann. der Phys., 45, p. 801; 1914.46a L. A. Jones, this journal, 7, p. 231; 1923.47 G. R. Harrison, this journal, 10, p. 157; 1925.48 H. T. Stetson, Astrophys. Jour., 43. pp. 253 and 325; 1916.
W. H. J. Moll, Proc. Phys. Soc. Lond., 33, p. 207; 1921.Stetson and Carpenter, Astrophys. Jour., 58, p. 36; 1923.E. Pettit and S. B. Nicholson, this journal, 7, p. 187; 1923.M. Siegbahn, Phil. Mag., 48, p. 217; 1924.G. R. Harrison, loc. cit., 1925.
November, 1929] 313

GEORGE R. HARRISON
E. Backlin, ZS. fir Inst., 47, p. 373; 1927.E. Spiller, ZS. f r. Inst., 47, p. 493; 1927.E. A. Harrington, this journal, 16, p. 211; 1928.
49 E. Pettit and S. B. Nicholson, loc. cit.50 G. R. Harrison, this journal, 7, p. 999; 1923.1 G. R. Harrison, this journal, 16, p. 63; 1928.52 P. P. Koch, Ann. der Phys., 39, p. 705; 1912.
Koch and A. S. King, Astrophys. Jour., 39, p. 213; 1914.F. Goos, ZS. fr Inst., 41, p. 313, 1921; Phys. ZS., 22, p. 468; 1921.J. 0. Perrine, this journal, 8, p. 381; 1924.L. F. Behr, Boston Meeting Opt. Soc. Amer., Oct. 1924.E. A. Baker, Jour. Sci. Inst., p. 345, 1924; Proc. Roy. Soc. Edin., 45, pt. 2.P. P. Koch, ZS. for Inst., 45, p. 294; 1925.F. A. Lindemann and G. M. B. Dobson, Engineering, 122, p. 403; 1926.E. Banty, Rev. d'Opt., 5, p. 404; 1926.F. Goos and P. P. Koch, Phys. ZS., 27, p. 41; 1926.F. Goos and P. P. Koch, ZS. fur Phys., 44, p. 855; 1927.Goldschmidt, Meteorolog. ZS., p. 241; 1926.F. C. Toy, Jour. Sci. Inst., 4, p. 369; 1927.Muller, ZS. f. Techn. Phys., p. 154; 1928.
53 A. R. Olpin, Amer. Phys. Soc. Proc., Washington meeting, Apr. 1929, Abst. 57. BerkeleyMeeting, June 1929, Abst. 17.
53a P. P. Koch, Ann. der Phys., 39, p. 705; 1912.54 E. A. Baker, loc. cit.55 G. M. B. Dobson, Proc. Roy. Soc., 104, p. 248; 1923.5G C. E. Hesthal and G. R. Harrison, Bull. Amer. Phys. Soc., Berkeley Meeting, June
1929, Abst. 16.57 J. Brentano, Nature, Dec. 22, 1921; Phil. Mag. 7, 685; 1929.
Rosenberg, ZS. fur Phys., 7, p. 18; 1921.C. E. Wynn-Williams, Phil. Mag., 6, p. 324, 1928; Proc. Camb. Phil. Soc., 23, p. 811,
1927.A. Marcus, Phys. Rev., 31, p. 302; 1928.J. Razek and P. J. Mulder, P. Rev., 33, p. 284; 1929.
58 T. T. Snith, this journal, 17, p. 145; 1928.69 A. L. Schoen, this ournal, 7, p. 483; 1923.
C. B. Bazzoni, R. W. Duncan, and W. S. Mathews, this journal, 7, p. 1003; 1923.F. C. Toy, Proc. Phys. Soc. Lond., 36, p. 432; 1924.Toy and Rawling, Jour. Sci. Inst. 1, p. 362; 1924.J. Kaplan, this journal, 14, p. 251, 1927 (use of thalofide cell).
G' G Hansen, Ann. der Phys., 383, p. 558; 1925R. Frerichs, Ann. der Phys., 386 p. 809; 1925.
GOa J. S. Foster, this journal, 8, p. 373; 1924Nicholson and Merton, Phil. Trans., 216, p. 459; 1916.I. 0. Griffith, Proc. Phys. Soc. Lond., 38, p. 85; 1925.
61 T. R Merton, Proc. Roy. Soc., 1924.62 J. A. Parkhurst and A. H. Farnsworth, Astrophys. Jour., 62, p. 179; 1925.
C. Davidson, J.S.I., 5, p. 238; 1928.G3 L. S. Ornstein and M. Minnaert, ZS. fuir Phys., 43, p. 404; 1927.64 T. R. Merton and J. W. Nicholson, Phil. Trans. 217, p. 237; 1917.
Merton, ref. 61.85 T. R. Merton, Proc. Roy. Soc., 113, p. 697, 1927; ibid., 106, p. 378, 1924.
[J.O.S.A. & R.S.I. 19314

PHOTOGRAPHIC PHOTOMETRY
66 T. Abe, Mazda Kenkyu-Jiho, 3, p. 325; 1928. (In English.)67 Catalogs of Adam Hilger, Ltd.
V. Henri, Etudes de Photochimie, Paris, Gauthier-Villars, 1919.H. E. Howe, Phys. Rev., 8, p. 674; 1916.H. J. McNicholas, Bur. Stds. Jour. Res., 1, p. 939; 1928.Sci. Papers Bur. Stds., No. 440; 18, p. 121; 1922.V. Hardung, Helv. Phys. Acta, 1, p. 472; 1928.Proc. Roy. Soc. Lond, 120, p. 21; 1928.
68 C. E. Weinland, this journal, 15, p. 337, 1927; 16, p. 295; 1928.E. A. Baker, Proc. Opt. Conv., part 1, p. 238; 1926.Weber, Ann. der Phys., 45, p. 801; 1914.
G9 Bur. Stds. Sci. Paper No. 440.70 C. E. Weinland, this journal, 15, p. 337; 1927.71 S. J. Lewis, Jour. Chem. Soc. Trans., 115, p. 312; 1919.72 L. A. Jones, this journal, 10, p. 561, 1925; Bull. N.R.C., 61, p. 109; 1927.73 H. Ewest, Beitrage zur Quantitativen Spectralphotographie. Abstract in English by
F. F. Renwick, Phot. Jour., 54, p. 99; 1914.Slade and Toy, Proc. Roy. Soc., 97, p. 181; 1920.T. R. Merton, Proc. Roy. Soc., 99, p. 78; 1921.A. L. Narayan, Phil. Mag., 43, p. 662; 1922.H. H. Plaskett, Dom Ast. Obs. Pub., 2, p. 213; 1923.R. Frerichs, ZS. fr Phys., 35, p. 524; 1926.H. M. Kellner, ZS. Wiss. Phot., 24, p. 41; 1926.C. Fabry, Phot. Jour., 66, p. 328; 1926.H. Ley and F. Volbert, ZS. Phys. Chem., 130, p. 308; 1927.H. v. Alband and J. Eisenbrand, Proc. Roy. Soc., 116, p. 153, 1927; ZS. Wiss Phot.,
25, p. 138, 1928.C. H. Payne and F. S. Hogg, Proc. Nat. Acad. Sci., 14, p. 88; 1928.L. Lobel and J. Lefevre, Rev. d'Opt., 6, p. 377; 1927.J. K. Robertson, this journal, 7, p. 983; 1923.K. Schachtschabel, Ann. der Phys., 81, 929; 1926.I. Wynekin, Ann. der Phys., 86, p. 1071; 1928.Baly, Morton and Rinding, Proc. Roy. Soc., 113, p. 709; 1927.K. Schaum, ZS. Wiss. Phot., 22, p. 148; 1923.
74 M. L. Dundon, A. L. Schoen, and R. M. Briggs, this journal, 12, p. 397; 1926.Spectroscopy, E.C.C. Baly, Longmans, 2, p. 357; 1927.H. Babcock, Amer. Phys. Soc. meeting, Berkeley, June 1929.
75 A. L. Schoen, this journal, 14, p. 179; 1927.76 Corning Glass Works, Catalog of Ultraviolet Glasses.77 I. C. T. 5, p. 335. R. W. Wood, Physical Optics, MacMillan.78 T. Lyman, Spectroscopy of the Extreme Ultraviolet.
P. R. Gleason, Proc. Nat. Acad. Soc., 15, p. 551; 1929.79 R. J. Lang and S. Smith, this journal, 12, p. 523; 1926.80 V. Schumann, Ann. der Phys., 5, p. 349; 1901.81 E. C. C. Baly, Spectroscopy, 2, p. 380.82 Duclaux and Jeantet, Jour. de Phys. et Le Rad., 2, p. 154; 1921.83 Ibid.
G. R. Harrison, this journal, 11, p. 113; 1925.84 T. Lyman, Nature, 112, p. 202; 1922.85 R. B. Wilsey, Eastman Kodak Res. Lab. Comm. No. 239.
R. B. Wilsey and H. A. Pritchard, this journal, 12, p. 661; 1926.
November, 19291 315

316 GEORGE R. HARRISON (J.O.S.A. & R.S.I., 19
86 H. C. Webster, Proc. Phys. Soc. Lond., 41, p. 181; 1929.
H. T. Meyer, Wissenschaftliche Verbffentlichung aus dem Siemans-Konzern, 7te Band,
2 Heft, p. 109.A. Bowers, ZS. fur Phys., 14, p. 174, 1923; Physica, 3, p. 113, 1923; ibid., 5, p. 8, 1925.
Diss. Utrecht 1924.R. Glocker and W. Traub, Phys. ZS. 22, p. 345; 1921.
87 L. A. Jones, this journal, 7, p. 231; 1923.88 H. B. Dorgelo, Phys. ZS., 26, p. 790; 1925.