instrumentation to acquire road profile data for use in ... · instrumentation to acquire road...
TRANSCRIPT

ATSB RESEARCH AND ANALYSIS REPORT Road Safety Research Grant 2007/01
Final Report
Instrumentation to acquire road profile data for use in whole body vibration apparatus
John Patterson Mark Schier
Caroline Owen Julie Pallant
Swinburne University of Technology
April 2007

ATSB RESEARCH AND ANALYSIS REPORT ROAD SAFETYRESEARCH GRANT 2007/01
Instrumentation to acquire road profile data for use in whole body vibration apparatus
John Patterson
Mark Schier Caroline Owen
Julie Pallant
Faculty of Life & Social Sciences Swinburne University of Technology
April 2007

Published by: Australian Transport Safety Bureau Postal address: PO Box 967, Civic Square ACT 2608 Office location: 15 Mort Street, Canberra City, Australian Capital Territory Telephone: 1800 621 372; from overseas + 61 2 6274 6590 Facsimile: 02 6274 6474; from overseas + 61 2 6274 6474 E-mail: [email protected] Internet: www.atsb.gov.au
© Swinburne University of Technology 2006
To encourage the dissemination of this publication, it may be copied, downloaded, displayed, printed, reproduced, and distributed in unaltered form (retaining this notice). Subject to the provisions of the Copyright Act 1968, no other use of the material in this publication may be made without the authorisation of Swinburne University of Technology.
ii Instrumentation to acquire road profile data for use in whole body vibration apparatus
DOCUMENT RETRIEVAL INFORMATION Publication date April 2007
No. of pages 59
ISBN 978-0-642-25546-4
Publication title Instrumentation to acquire road profile data for use in whole body vibration apparatus
Authors John Patterson, Mark Schier, Caroline Owen, Julie Pallant Faculty of Life & Social Sciences, Swinburne University of Technology
Performing Organisation Swinburne University of Technology PO Box 218 Hawthorn Vic 3122
Sponsor [Available from] Australian Transport Safety Bureau PO Box 967, Civic Square ACT 2608 Australia www.atsb.gov.au
Reference No. Apr2007/DOTARS 50208
Acknowledgements We wish to acknowledge the invaluable assistance of Professor Peter Cadusch, Swinburne University of Technology for his assistance in processing the acceleration data for the trial, as well as his filter software which streamlined the extraction of the heart rate data from the raw files. David Simpson’s contribution in designing and refining the three electronic devices was another vital collaboration. Three important assistants were Martin Dubaj, Sarah Nelder and Cameron Czernicki whose efforts to overcome the vicissitudes imposed on us by major building works meant that the project finished on time: a sterling effort.
Abstract Previous research demonstrated that vertical whole-body vibration can induce feelings reminiscent of fatigue and lassitude. These studies used 4 Hz as the driving frequency as this has been shown to be prominent in road-induced vibration in heavy vehicles. A series of tests of cognition, brain function, heart rate and questionnaires concerning subjective effects were previously validated using 10 minutes of vibration at 4 Hz. This report describes the use of these measures in a comparison between the effects caused by 4 Hz vibration and a vibration pattern recorded from a road in a small articulated truck. Twenty-two young healthy participants were each exposed in separate experiments to 10 minutes of each vibration pattern. The results indicated that a road profile used to create a pattern of vertical vibration was as effective as 4 Hz in most respects. There were minor differences from the previous study but these may have been due to the smaller numbers who participated in the current study. The equipment developed to obtain the road profile acceleration data proved to be very effective at obtaining a signal suitable for use in controlling the hydraulic actuator. The differences in subjective and physiological responses to the two vibration profiles were minor, suggesting that 4 Hz may be a suitable substitute to ‘real’ road profiles in studying the effects of vertical vibration on fatigue.
Keywords:
Vibration, fatigue, road profile, psychophysics
Notes (1) ATSB reports are disseminated in the interest of information exchange. (2) The views expressed are those of the authors and do not necessarily represent those of the Australian
Government.
Instrumentation to acquire road profile data for use in whole body vibration apparatus iii

iv Instrumentation to acquire road profile data for use in whole body vibration apparatus

CONTENTS
EXECUTIVE SUMMARY............................................................................................................ VI
1 INTRODUCTION .................................................................................................................... 1 1.1 Background ..................................................................................................................... 1
2 METHOD.................................................................................................................................. 3 2.1 Location for road profiles .............................................................................................. 3 2.2 Recording of road profiles ............................................................................................. 4 2.3 Creation of the road profile signal ................................................................................ 5 2.4 Participants...................................................................................................................... 6 2.5 Recording arrangement ................................................................................................. 7 2.6 Procedure......................................................................................................................... 9 2.7 Results analysis ............................................................................................................. 10
3 RESULTS................................................................................................................................ 13 3.1 Questionnaire data........................................................................................................ 13 3.2 Physiological data ......................................................................................................... 16
3.2.1 N-back task........................................................................................................... 17 3.2.2 Heart rate variability............................................................................................. 21 3.2.3 EEG activity ......................................................................................................... 23
4 DISCUSSION.......................................................................................................................... 27 4.1 Questionnaire data........................................................................................................ 27 4.2 N-Back Task data.......................................................................................................... 28 4.3 Heart Rate data............................................................................................................. 29 4.4 EEG frequency data ..................................................................................................... 30 4.5 Conclusion ..................................................................................................................... 30
5 REFERENCES ....................................................................................................................... 31
APPENDIXES ................................................................................................................................ 32
APPENDIX A: RAW DATA FROM QUESTIONNAIRES....................................................... 33
APPENDIX B: QUESTIONNAIRE ............................................................................................. 49
Instrumentation to acquire road profile data for use in whole body vibration apparatus v

EXECUTIVE SUMMARY
The objective of the project. The major objective of this project was to develop, utilise and then evaluate instrumentation to record road profiles as acceleration values. These values were then to be used in a comparison of the influence of vertical road vibrations and a 4 Hz sine wave on the subjective and physiological responses of young participants. Several electronic devices were required to achieve this goal. The evaluation of the data obtained from the road was undertaken by using these acceleration values to drive a vertical hydraulic ram which was attached to a mounted seat. Volunteers were then exposed to two vibration patterns: 4 Hz sine-wave and the modified road profile. A series of physiological recordings were obtained from the participants during two non-vibration and one vibration period, and they attempted a single cognitive task during each period. The results were compared to determine if the road profile vibration pattern resulted in similar changes to those occurring when the 4 Hz sine-wave was used.
Recording and modifying the road profile. The major objective of this project was to develop, utilise, and then evaluate, instrumentation to record road profiles as vertical acceleration values, using small accelerometers developed for the project and a purpose-built data acquisition system which could output a serial stream of data to a laptop for storage and subsequent analysis. These data were the vertical accelerations recorded from the driver’s seat frame. Several trips were taken over a strip of public road known to be ‘rough’ and the data recorded. These numbers were then subjected to a process to characterise their frequency content, amplitudes and acceleration values. From the files, a representative set was chosen to be scaled and adjusted so that they could be used to drive the hydraulic actuator controller in the laboratory. Subjective tests on volunteers were used to determine if the vibration was within acceptable limits, but these do not form part of the recordings used in the study.
Recorded information from participants. Twenty-two volunteers each undertook two 30-minute recording periods. Each recording period involved 10 minutes of control condition (no vibration), 10 minutes of vibration (either 4 Hz, or the road profile), and finally 10 minutes of no vibration. At least one day separated the two recording periods to allow for a wash-out of any effects.
Changes in mood and energy from questionnaire responses
A comparison of the questionnaire responses before and after the vibration sessions (i.e. before and after the 4 Hz session; and, before and after the road profile session) revealed a significant difference between the overall expression of tiredness before the 4 Hz and after the 4 Hz. This confirmed the previous study’s results. Before and after the road profile vibration, the questionnaire measures of energy and mood showed very similar patterns. For almost all the questions associated with general tiredness or fatigue both the 4 Hz and road profile responses were significantly different from the baseline, or no-vibration, period. The majority of energy questions resulted in a significant change in response between the before and after vibration conditions. Only two measures – ‘I feel half awake’ and ‘I feel carefree’ did not differ significantly before and after vibration. Neither of these is thought to be related directly to a feeling of tiredness or fatigue. Two measures – ‘I feel vigorous’ and ‘I feel peppy’ – were significantly different between the before and
vi Instrumentation to acquire road profile data for use in whole body vibration apparatus

after vibration conditions for the road vibration condition, but there were no differences for the 4 Hz condition. For the mood measures, the questions were more direct and simple and these had fewer significant differences. Two measures (‘lively’ and ‘exhausted’) were significant in both 4 Hz and road profile conditions. Both these directly relate to commonly held views as to what tiredness and fatigue mean to non-specialist people. Another 11 measures were either significant in 4 Hz or the road profile vibration conditions, but not in both. In some of these, perhaps larger numbers of participants may have produced a convergence of outcome. As with our previous study, these significant differences are taken to confirm that the presence of vibration in the vertical direction is, regardless of the nature of the signal, resulting in consistent changes in personal perceptions commonly associated with tiredness and fatigue. The differences in outcome may be explained by the differences in the vibration signals. The 4 Hz component present in the road vibration profile was less intense than in the pure 4 Hz situation. The conclusion is that the test protocol and the presence of some vertical vibration, consistently causes perceptions to trend towards a feeling of tiredness. Further, the 4 Hz signal may be an adequate replacement for a more complex signal in producing this effect. Conversely, the study has confirmed these psychological changes seen with 4 Hz are not unique to this signal, but may be caused also by road profiles.
Heart rate changes
Increases in the mean heart rate were observed when participants were doing the n-back task. (This is a computer-based attention task where the participant watches letters appear one after each other on a computer screen, and they have to press a button to indicate, for each one, if it is the same as, or different to, the letter which was shown two steps previously in the sequence.). Further, the standard deviations were smaller compared with the non-task period preceding the task period. This is in keeping with the general opinion that heart rate variation is less when we are ‘stressed’. Comparing the standard deviations observed during the two periods of vibration, there was a larger reduction for the 4 Hz protocol when the participants were not doing the cognitive task. For the road profile, the standard deviation for the no-task/vibration condition was no different to that observed before, or after, vibration. This could be interpreted to suggest that the 4 Hz vibration was more ‘stressing’ than the road profile; however, caution must be exercised in this conclusion as the 4 Hz signal may be mechanically adding a consistent value to the ECG through harmonics from the electrodes moving on the skin. In conclusion, though, it would appear that there are no major differences in physiological state between the 4 Hz and road profile form of vibration in heart rate terms. Trends in both vibration conditions were essentially the same.
Changes in cognitive processing and short term memory
The test used for the study relies on attention and short-term memory. The results from the study were slightly unexpected for the 4 Hz component, in that they were not consistent with previous observations using this frequency of vibration. In previous studies, there was an increase in reaction time for incorrect responses, but only during the vibration condition. In the current study there was only a linear decrease in reaction time over the succeeding recording periods (the last five minutes of each 10-minute block). The road profile results, however, had an additional decrease in reaction time after the vibration period was finished. This suggests that there was delayed response caused by the vibration. Again, the delay was only for incorrect responses. Reaction times to correct responses maintained the steady improvement over time which is associated with a practice effect. While this needs confirming with greater numbers of participants, it is an important observation if confirmed. The road profile vibration is possibly causing increased processing time when the answer is not immediately clear; that is, uncertainty exists.
Instrumentation to acquire road profile data for use in whole body vibration apparatus vii

Changes in electrical activity in the brain
Brain electrical activity (electroencephalogram: EEG) is a very complex parameter to measure and interpret. In our laboratory we simplify the analysis and interpretation of EEG data by concentrating on any changes in frequency of activity, rather than specific changes in signal amplitude over time. In previous studies there have been indications of ‘tuning’ of the brain to the driving frequency with an increase in proportion of the electrical frequency recorded from the scalp which matched the vibration frequency. This occurred again in the current study with the 4 Hz vibration resulting in a large proportion of 4 Hz in the overall signals recorded from the brain during the vibration component of the testing. The situation with the road profile was as expected. Being a range of frequencies, there was no guarantee of it being likely that only one frequency would increase as was the case with 4 Hz. Rather, it was expected that there would be a general shift in proportions of brain activity during vibration. This is what occurred. It is not possible to further examine this result because of the complexity of the brain’s function; however, there may be more conclusions which could be drawn from a more detailed analysis of the signals. For example, it may be worthwhile to take signals from participants whose reactions were strong and compare their changes to those whose reactions were weaker to the vibration.
Conclusions The hypothesis that vertical vibrations produced by road profile acceleration data and 4 Hz sine-wave acceleration data would produce similar changes in subjectively reported and recorded effects on participants was, in general, supported. The differences between the two types of vibration may be due to variations in the sub-population of participants used for the current project compared to previous studies, or entirely caused by the different nature of the road profile vibration signal.
While it was never expected that the two vibration patterns would produce identical results, the level of overlap is most gratifying. It clearly shows that either vibration pattern is capable of causing trends towards a condition for which subjective ratings are suggestive of fatigue; or are believed by the participants to be fatigue-like. That there were differences in detail between the results of the study when 4 Hz was used and those obtained from road profile data, is also encouraging – it indicates that simple vibration does not cause effects coincidently, but that the frequency, and hence the acceleration, component is capable of altering the ratings to specific questionnaire questions, the brain electrical activity responses and the cognitive/short term memory responses.
viii Instrumentation to acquire road profile data for use in whole body vibration apparatus

1 INTRODUCTION
1.1 Background Studies previously undertaken at Swinburne University of Technology (unpublished data) revealed that even short periods of low level sinusoidal vertical motion at 4 Hz can result in altered subjective mood/energy states, increases in reaction time to problem solving tasks, and changes in heart rate variability and brain electrical activity. The subjectively reported mood/energy changes were all in the direction of increased lethargy, tiredness and feelings of fatigue. Heart Rate Variability and electroencephalographic (brain electrical recordings) data showed that the 4 Hz vibrations were altering aspects of physiological arousal. While these data are useful in the understanding of basic processes occurring with an increase in fatigue when we are exposed to a pure sine-wave vertical displacement, they may not be relevant to the real-world situation where road vibrations are more complex. A logical next step beyond the previous experiments is to record and use real road profiles which, anecdotally, are considered to be causing fatigue, and to use these to repeat the previous experiments.
Vibration can be of concern in two particular ways. High level accelerations, particularly at frequencies above 8 Hz, are known to be capable of causing physical damage to tissues (Carlsöö, 1982). Low frequency, and consequently lower accelerations, are not considered to be likely to cause physical damage, but may cause problems of hand-eye coordination (McLeod and Griffin, 1988). High frequency, high acceleration vibrations are thought to modify neuromuscular control and to affect hormone levels, but these are usually applied for only short bursts (unpublished data).
The human body has high sensitivity to vertical (4 -10 Hz), lateral and longitudinal (0.5 - 2 Hz) vibrations, and physical problems associated with these have been recognised (ISO, 1997). Hassan and McManus (2001) studied the influence of Whole Body Vibration (WBV) induced by surface roughness on heavy vehicle drivers’ perception and comfort and reported that drivers of heavy articulated vehicles mainly complain about vibrations in the frequency range 1.4 Hz - 5.6 Hz. The results of recent surveys of WBV exposure levels experienced by Australian heavy vehicle drivers indicate that the measured WBV exceed the comfort and perception thresholds (ISO, 1997) of 0.315 and 0.01 m/s2 respectively (Sweatman and McFarlane, 2000). Hassan (2002) noted that the highest weighted RMS (root-mean-square) accelerations occurred in the vertical axis with a minimum value of 0.45 m/s2 in the range 1 Hz - 4 Hz, which can easily exceed the above thresholds. A study of the characteristics of selected heavy trucks measured the highest vertical vibrations in the range 1 Hz - 4 Hz (Sweatman and McFarlane, 2000).
Of particular relevance is the observation that the human brain progressively has a greater percentage of lower frequency activity when we progress to sleep. Normally awake brain electrical activity (electroencephalogram or EEG) is dominated by frequencies above 8 Hz. When undertaking mental activity the frequencies which predominate are up in the range of 14 Hz – 20 Hz; motor (muscle) activity can push the envelope to include frequencies up to 40 Hz. When in a drowsy or sleep state, the frequencies which predominate are in the lower range of 0.5 – 7 Hz. This is arrived at by adding all the power across the full range of frequencies and determining the proportion of each frequency band as a percentage of the total.
As can be seen from above, the vibrations used in our laboratory studies are known to occur on the road, but the question we wish to answer is how closely does the simple 4 Hz stimulus mimic the complex road profile signals in inducing feelings of fatigue.
This question could only be answered in a small number of ways. One which had appeal was to use the exact same apparatus used for the 4 Hz situation, but use a real road profile. While less ideal than recording in a vehicle while it traversed a section of road, it has the benefit of allowing tight
Instrumentation to acquire road profile data for use in whole body vibration apparatus 1

controls on variables to simplify the analysis. It also allowed recordings to occur which were likely to be complicated (such as EEG) in a travelling vehicle, and also likely to interfere with the driver. A paradigm which allowed a direct comparison between a laboratory-based synthetic (4 Hz sinusoidal) frequency to drive the vertical vibration and a recorded road profile was considered an advantage, as it would validate the previous observations as well as indicate the validity of laboratory-based measurements.
2 Instrumentation to acquire road profile data for use in whole body vibration apparatus
2 METHOD
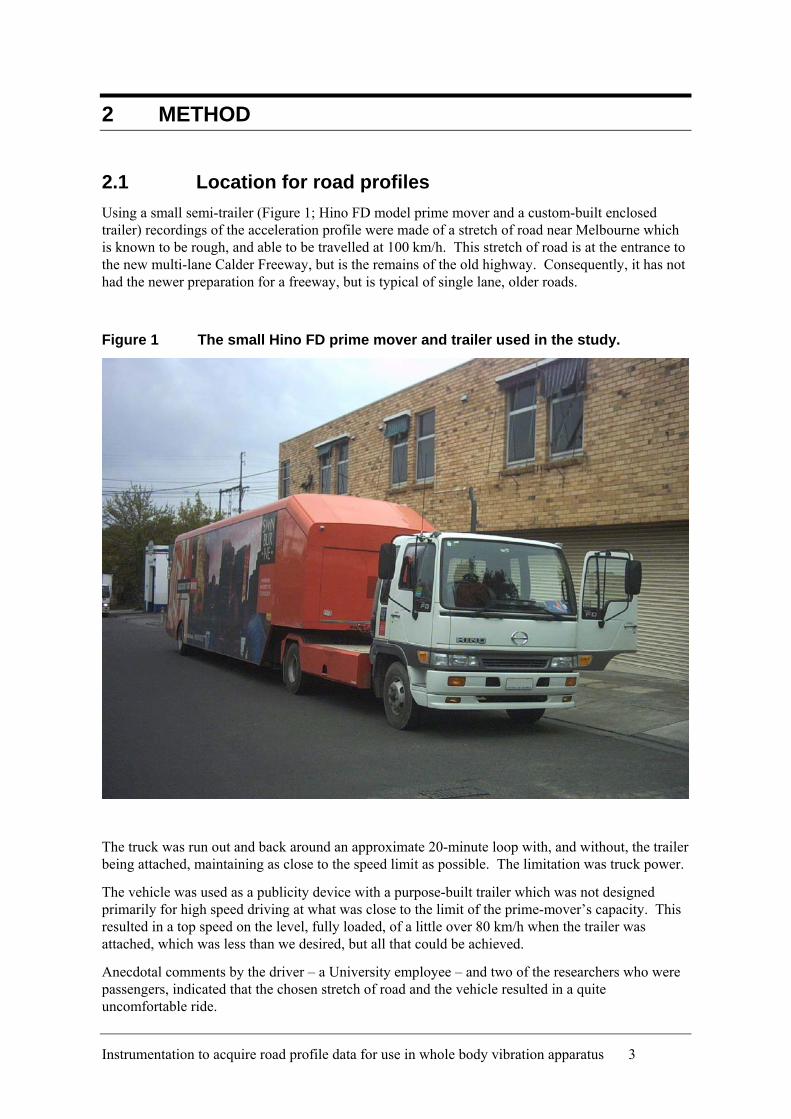
2.1 Location for road profiles Using a small semi-trailer (Figure 1; Hino FD model prime mover and a custom-built enclosed trailer) recordings of the acceleration profile were made of a stretch of road near Melbourne which is known to be rough, and able to be travelled at 100 km/h. This stretch of road is at the entrance to the new multi-lane Calder Freeway, but is the remains of the old highway. Consequently, it has not had the newer preparation for a freeway, but is typical of single lane, older roads.
Figure 1 The small Hino FD prime mover and trailer used in the study.
The truck was run out and back around an approximate 20-minute loop with, and without, the trailer being attached, maintaining as close to the speed limit as possible. The limitation was truck power.
The vehicle was used as a publicity device with a purpose-built trailer which was not designed primarily for high speed driving at what was close to the limit of the prime-mover’s capacity. This resulted in a top speed on the level, fully loaded, of a little over 80 km/h when the trailer was attached, which was less than we desired, but all that could be achieved.
Anecdotal comments by the driver – a University employee – and two of the researchers who were passengers, indicated that the chosen stretch of road and the vehicle resulted in a quite uncomfortable ride.
Instrumentation to acquire road profile data for use in whole body vibration apparatus 3

The loop of road included two stretches of smooth pavement, one stretch of very rough pavement (freeway entrance, old Calder Highway) and a stretch of freeway pavement. These regions were used to represent typical levels of vehicle vibration, but did not cover the sort of road known to have a predominance of 4 Hz: roads built on the expansive clay soil. These roads are typically in regional areas and a return trip to access them was beyond the scope of the current project. The goal of the experiments did not, however, require a specific road profile; rather that people’s reactions to a ‘typical’ road profile would be compared to those from a 4 Hz vibration.
2.2 Recording of road profiles Two purpose-built accelerometers (Figure 2) were constructed based on previous prototypes used successfully in laboratory trials. These were clamped to the floor mounting brackets on the driver’s and passenger’s seats with G-clamps and were orientated to record the vertical vibrations of the cabin floor.
Figure 2 The purpose-built accelerometer with the ADXL202 (Analog Devices Inc.) chip mounted on the printed circuit board.
Figure 3 The purpose designed and built data acquisition device used to record acceleration values and output a data stream to a laptop for storage.
Another specially built data acquisition device (Figure 3) was constructed to accept the signals from, and to provide power to, the accelerometer boxes. This microprocessor device was designed to be powered from the cigarette lighter socket in trucks and cars. This serial acquisition box was configured to deliver a continuous stream of values via a serial port to a laptop running a serial acquisition program. The data were then recorded onto the laptop’s hard drive for future processing.
4 Instrumentation to acquire road profile data for use in whole body vibration apparatus

The illustration in Figure 3 shows the device with the cigarette lighter adapter attached. The ‘output’ port on the left side provided power for the accelerometer devices. Although only one channel was used in this study, the system can power two accelerometers and acquire two accelerometer channels.
The truck details are as follows:
• Prime mover wheelbase 3830 mm (front to rear axle)
• Semi-trailer wheelbase 9840 mm (kingpin to rear axle)
• Width of trailer 1260 mm
• Trailer weight approximately 8 tonnes.
2.3 Creation of the road profile signal As recorded, the signals consisting of a set of numbers were not suitable to control the hydraulic controller used to drive a hydraulic ram to create the vertical motion. The recorded values were processed (see below) and the modified road profile signal was converted into a file which could then be used to drive the hydraulic system. This involved design and construction of another microprocessor controlled circuit which could read the data file from a computer and convert it into analogue voltages; these were scaled to drive the hydraulic controller at an appropriate level to simulate the displacement which occurred on the road to the truck seat frame.
Figure 4 The accelerometer clamped to the driver’s seat frame in the truck.
The signals used to drive the vibrating chair are based on vertical acceleration data recorded on the frame of a seat in the cabin of the truck (Figure 4) driven on the Calder Highway in various conditions. In the most recent series, acceleration data for three driving conditions were recorded, (in the following these are referred to as: CalderLocal, CalderLocalTrailer and SUTLocal), and analysed off-line to identify basic signal parameters. The CalderLocal signal was chosen as the basis for the synthesised road vibration signal.
The following paragraphs describe the processing sequence, the characteristics of the individual recorded signals and the synthesis of the final drive signal.
Instrumentation to acquire road profile data for use in whole body vibration apparatus 5

1. Data Recovery.
Acceleration data were sampled at 6 ms intervals at 10 bit resolution (although the dynamic range of vibrations was limited to slightly less than 8 bits) and stored in ASCII form on the hard-drive of the lap-top computer used to control the acquisition system. The recorded data files were found to contain occasional errors, typically a single missing character. Non-conforming entries were detected and subsequently replaced by the median of their six neighbouring values. Visual inspection of the resulting arrays suggests that this procedure cleared essentially all of the errors.
2. Acceleration Spectra.
Spectral processing was based on the Welch periodogram method, using 5 second Hamming windows with 50% overlap. In practice the general form of the acceleration spectrum trend seems to be a roughly white signal filtered by a single pole system (probably due to the truck’s suspension) with cut-off frequency in the vicinity of 4 Hz. In most cases the combination of the high frequency emphasis expected for an acceleration signal and the low-pass character of the suspension response leads to a peak in spectrum in the vicinity of 2 to 3 Hz. These values were then stored on a laptop and sent by the serial port to a dedicated converter (Figure 5) which reproduced the digital levels as analogue amplitudes suitable to drive the hydraulic controller.
Figure 5 Device to regenerate vibration signals from digitally stored acceleration values.
The illustrated device was designed and built to allow the regeneration of the analogue levels from the digitally stored acceleration values. The ribbon cable allowed the unit to receive a serial string from a laptop and output a value as an analogue voltage which was used to drive the hydraulic controller via the BNC lead as shown.
2.4 Participants Young, healthy participants (n = 22, average age 22.85 years) volunteered for the study and most were students at Swinburne University of Technology. They were provided with an informed consent form which explained to them the procedures they were agreeing to. The consent form and all procedures involving volunteers were approved by the Swinburne Human Ethics Committee,
6 Instrumentation to acquire road profile data for use in whole body vibration apparatus

keeping within the parameters and procedures established by the Swinburne University of Technology’s policies on Code of Conduct, Human Experimental Ethics Clearances and Intellectual Property.
2.5 Recording arrangement A previously developed questionnaire was available for the participants to complete and it consisted of a section for determining mood-related issues (14 items), a section for energy-related issues (24 items) and other psychological measures of the participant’s perceptions of the experience. Participants had to identify the level of subjective opinion about their ‘state’ at the time of the questionnaire. Additional personal experience items were also completed.
Figure 6 A view of the hydraulic ram located under the seat (KAB Seating, model 554B) showing the mounting frame for the system in the foreground.
Figure 7 A side view of the truck seat with the hydraulic controller in the back right of the illustration.
Instrumentation to acquire road profile data for use in whole body vibration apparatus 7

The apparatus (Figures 6 and 7) used to create the vertical vibrations consisted of a combined electronic/hydraulic interface (Instron, Norwood MA USA, computer/hydraulic controller), hydraulic controller (Zonic Master Controller, Milford Ohio USA), an hydraulic pump, cooling circuit, hydraulic ram (Zonic hydraulic exciter head), a frame for supporting the truck seat above the hydraulic ram, and a bracket for mounting the accelerometer was attached to the frame immediately below the seat frame. A separate pneumatic pump was used to provide the required air pressure for the seat dampers.
The procedure for the n-back cognitive task consisted of the participants holding a two-button response box while they remained seated on the vibration rig. A 17 inch LCD screen was placed on an adjustable stand at eye-level. The software presented large letters at approximately 3-second intervals with the letter visible for approximately 260 ms, with a black screen for the remainder of the inter-stimulus interval. As shown in Figure 9, the task was only presented for the last five minutes of each of the three 10-minute protocol blocks. For each 5-minute task period the participant was asked to press the ‘Yes’ button if the letter in front of them was the same as the one that appeared two places before, or the ‘No’ button if it was not the same (see Figure 11). For each of the 100 stimuli presented in the 5-minute block, 20 were valid targets. That is, they were two places after the same letter; for all the remaining 78, the correct response should have been to press the ‘No’ button. Because the first two letters cannot be preceded by any valid target letter, these two stimuli are ignored in the analysis. The nature of the analysis produces the following outputs: a correct response to the right letter; an incorrect response to the right letter; a correct response to the wrong letter; a response when no letter presented.
Figure 8 A schematic of the International 10-20 system for electrode placement on the scalp. The four electrode locations used in the current study are indicated by the coloured rings.
The physiological recording system was based on an 8-channel data acquisition system and software (PowerLab and Chart software; AD Instruments, Sydney). The physiological data were recorded using a purpose-built differential amplifier system. Two disposable electrodes were used with one on each wrist for recording of the electrocardiogram (ECG). Four silver-silver-chloride coated tin electrodes were attached to the scalp after abrasion and cleaning of the skin with normal electrophysiological techniques to provide an electrode impedance of less than 10 kΩ. The location of the electrodes on the scalp was determined using the International 10-20 system of electrode placement and the electrodes were in F3, F4, P3 and P4 (Figure 8). A forehead reference electrode and an earlobe ground were also attached.
8 Instrumentation to acquire road profile data for use in whole body vibration apparatus

Heart rate was obtained from the electrocardiogram recording and converted into inter-beat intervals by custom written software used to detect the QRS complex of the ECG (Figure 12).
A computer was used to view the acquired data (Figures 13, 14, 15) from the various sources as indicated below: Channel 1: Driving signal for the hydraulic ram. Channel 2: Accelerometer output from the seat frame bracket above the hydraulic ram. Channel 3: Electrocardiogram Channel 4: F3 EEG signal Channel 5: F4 EEG signal. Channel 6: P3 EEG signal. Channel 7: P4 EEG signal. Channel 8: Accelerometer attached to the participant’s hips by an adjustable strap. Channel 9: Computed heart rate from Channel 3.
2.6 Procedure The following outlines the procedure for each participant (Figure 9).
1. Read and sign consent form.
2. Complete the questionnaire items on their current state.
3. Have the electrodes attached while they sit on the vibration rig seat.
4. They are given a brief familiarisation experience trying the n-back task.
5. Once all channels are recording properly, the test proper starts with a 10-minute baseline.
6. During the last five minutes of the first 10-minute period, the participant does the n-back task.
7. Without any break in proceedings the seat is set into motion (using either the 4 Hz sine-wave signal, or the modified road profile) for the next 10-minute period; during the last 5 minutes the participant also completes a 5-minute n-back session while the vibration continues.
8. The vibration is then switched off and the last 10 minutes of recording occurs with another 5-minute n-back at the conclusion of this period.
9. The study interval concludes when the participant completes the last section of the questionnaire on their current feelings. During this period all electrodes are removed along with any electrode paste.
At the completion of the first experiment, each participant was asked to come on another day to undertake the second vibration experiment. The order of presentation of the 4 Hz and road vibrations in each vibration experiment was counterbalanced across participants.
All data were then saved and backed up.
Instrumentation to acquire road profile data for use in whole body vibration apparatus 9

Figure 9 The recording protocol: EEG and ECG were recorded during the 30-minute recording session.
The electrode application and consent form aspects are not illustrated.
2.7 Results analysis Data from the questionnaires were entered into an SPSS file and descriptive statistics were carried out on the various conditions (Figure 10):
4 Hz baseline against 4 Hz post-vibration.
Road profile baseline against road profile post-vibration.
Data from the heart rate, EEG and n-back task were exported from the data recording computer and after averaging they were separated into the following groups:
4 Hz baseline against 4 Hz vibration.
4 Hz vibration against 4 Hz post-vibration.
Road profile baseline against road profile vibration.
Road profile vibration against road profile post-vibration.
Figure 10 The location during the experiments where the comparisons were derived for the questionnaire data.
10 Instrumentation to acquire road profile data for use in whole body vibration apparatus

All of these data had descriptive statistics applied to them to seek out any significant differences between the 4 Hz and road profile conditions.
The cognitive task which is computerised automatically generates the various output data from participants’ responses. Averages of reaction times and scores on correct responses are available as an output file. These are recorded relevant to the task. The four alternatives are: correct target response; correct non-target response; false response and correct stimulus response.
Figure 11 A schematic which illustrates the n-back task and the correct response.
Figure 12 A schematic of a standard ECG signal and how a threshold is applied to leave the peaks of the ‘R’ waves from which the R-R interval is obtained and the heart rate is computed.
The letters, ‘P’, ‘Q’, ‘R’ and ‘S’, are standard designators used in cardiology to label the waveforms found in the standard 12-lead ECG. The complex indicated by ’QRS’ is caused by the electrical activity in the ventricle of the heart which is related to the heart beat. The physiological data – heart rate and the four EEG channels – were extracted from the data acquisition program as text files with two channels: time and analogue value. For heart rate the R-R intervals were obtained by applying a threshold to the electrocardiogram channel to detect the QRS peaks (see Figure 12).
Once converted to inter-beat intervals, the values from the ECG were subjected to descriptive statistics. From these the mean values and standard deviations of the heart rates during all the conditions were obtained and plotted.
Instrumentation to acquire road profile data for use in whole body vibration apparatus 11

The electroencephalography data were processed using a routine Fast Fourier Transform process used in the laboratory for all the brain electrical activity studies. The total electrical activity was normalised across the various participants and the frequency bins were then quoted as percentages of the total electrical power across all frequencies.
12 Instrumentation to acquire road profile data for use in whole body vibration apparatus

3 RESULTS
3.1 Questionnaire data The statistical analysis of the questionnaire data supported all of the previous study’s observations in relation to the effects of 4 Hz vertical vibration on theses measures. This was an important internal control for the project as there were differences in some aspects of the location of the vibration rig and where the experiments were undertaken which were unavoidable.
The following tables indicate the questionnaire items and the significance of the differences between the baseline (no-vibration condition) and the responses after the vibration (actually 10 minutes after the vibration ceased).
Table 1 The t values and significance levels for the differences between the responses to each of the ‘Energy’ questions before and after the vibration (n = 22).
Road Vibration 4 Hz Items t Sig. t Sig. Pair 1 I feel sleepy -4.672 .000* -4.500 .000*Pair 2 I feel active 4.328 .000* 3.576 .002*Pair 3 I feel half asleep -2.468 .022* -2.581 .017*Pair 4 I feel lively 4.389 .000* 3.932 .001*Pair 5 My eyes are heavy -4.897 .000* -2.492 .021*Pair 6 Full of pep 5.452 .000* 2.981 .007*Pair 7 Half awake -1.790 .089 -1.000 .329Pair 8 Energetic 4.297 .000* 3.039 .006*Pair 9 Dead on my feet -3.212 .004* -3.016 .007*Pair 10 Vigorous 2.193 .040* 1.254 .224Pair 11 Bushed -2.796 .011* -3.521 .002*Pair 12 Peppy 3.750 .001* 1.466 .158Pair 13 Dozing off -3.632 .002* -4.039 .001*Pair 14 Wide-awake 3.444 .002* 3.926 .001*Pair 15 Carefree -1.976 .061 1.301 .207Pair 16 Groggy -3.804 .001* -4.018 .001*Pair 17 Alert 5.210 .000* 3.038 .006*Pair 18 Wakeful 4.638 .000* 3.250 .004*
* Significant at the p<0.05 level.
The data in Table 1 are not meant to be considered as a statistical comparison of the differences between the two conditions, but rather, as a means of showing that there was a high degree of similarity between the two vibration forms. For these ‘energy’ measures, all but two showed a significant difference between the two conditions (‘half awake’ and ‘carefree’). For two additional measures (‘vigorous’, and ‘peppy’), the road vibration resulted in a significant difference between the non-vibration condition and the vibration, however, this difference was not seen with 4 Hz.
Instrumentation to acquire road profile data for use in whole body vibration apparatus 13

Table 2 The t values and the significance values (p<0.05) for the questions dealing with ‘Mood’ issues (n = 22).
Road Vibration 4 Hz Items t Sig. t Sig. Pair 1 Panicky .568 .576 1.312 .204Pair 2 Lively 4.805 .000* 3.044 .006*Pair 3 Confused 1.449 .162 .000 1.000Pair 4 Worn out -1.571 .131 -2.837 .010*Pair 5 Depressed 2.017 .057 2.160 .042*Pair 6 Downhearted 1.821 .083 2.027 .056Pair 7 Annoyed 1.449 .162 .810 .427Pair 8 Exhausted -2.247 .036* -3.873 .001*Pair 9 Mixed-up -.370 .715 -1.368 .186Pair 10 Sleepy -3.156 .005* -.819 .422Pair 12 Bitter 2.160 .042* 1.742 .096Pair 13 Unhappy 2.347 .029* 1.449 .162Pair 14 Anxious .901 .378 3.600 .002*Pair 15 Worried 3.578 .002* .439 .665Pair 16 Energetic 1.449 .162 -.370 .715Pair 17 Miserable -.568 .576 2.324 .030*Pair 18 Muddled 1.742 .096 1.368 .186Pair 19 Nervous 1.368 .186 3.813 .001*Pair 20 Angry 3.846 .001* -1.596 .125Pair 21 Active -3.645 .002* 1.000 .329Pair 22 Tired .000 1.000 2.453 .023*Pair 23 Bad tempered 5.139 .000* -.326 .747Pair 24 Alert .901 .378 1.449 .162
* Significant at the p<0.05 level.
Note: Pair 11 in Road Vibration condition cannot be analysed because (quote SPSS) ‘The correlation and t cannot be computed because the standard error of the difference is 0’.
In Table 2, mood measures such as ‘lively’ and ‘exhausted’ were similarly affected by the presence of the vibration. With only road profile vibration was there a difference with ‘sleep’, ‘‘bitter’, ‘unhappy’, ‘worried’ and ‘bad-tempered’. In contrast, ‘worn out’, ‘depressed’, ‘anxious’, ‘miserable’, ‘nervous’ and ‘tired’ were only significant if the vibration was 4 Hz. Measures where there was no difference of any significance in either vibration condition were: ‘panicky’, ‘confused’, ‘downhearted’, ‘annoyed’, ‘mixed-up’, ‘energetic’, ‘muddled’ and ‘alert’.
Items were incorporated into the questionnaire to seek an estimate of the subjective levels of pre-test ‘energy’. The scale was 1 to 10, with 1 rating no level of the item, and 10, extreme levels of the item. When the means of these were compared with each other within a vibration condition, and with the same item in the other vibration condition, there were no marked differences (the maximum rating difference was 0.78 for the ‘sleepiness’ item). The pre-test rated levels of sleepiness, lethargy, lacking energy, tiredness and fatigue items were all slightly less than half way between ‘Not at all’ and ‘Extremely’.
To determine if the vibration period was in anyway familiar with previous experiences in transport, ratings were included for a variety of transport modes. Again the rating scales were 1 (‘not at all’), to 10 (‘very similar’). The values recorded were very similar for both 4 Hz and the road profile conditions (maximum rating difference was 1.06 for the ‘car’ item). When each of the mean rating values were compared within vibration conditions, the following ranking of subjective ratings of similarity was obtained: Bus> Car> Train> Motor Bike> Amusement ride> Twin engine plane> Jet
14 Instrumentation to acquire road profile data for use in whole body vibration apparatus

aircraft> Bike> Boat. The ranking suggests that both vibration conditions were, overall, more like a bus and car, than a bicycle or boat.
As a means of accessing information about subjective feelings about, or induced by, the vibration experience, a series of items were listed and rated from 1, (‘not at all’) to 10, (‘extremely’). There were no obvious or marked differences between the responses recorded for 4 Hz and road vibration conditions (maximum rating difference was 0.91 for the ‘sleepiness’ item). A comparison of the means revealed that the ratings were ranked in the following sequence: Boredom> Tiredness> Difficulty Concentrating> Sleepiness> Relaxation> Lethargy> Exhaustion> Physical Heaviness> Excitement> Anxiety> Confusion> Depression> Dizziness. The ranking suggested that overall, boredom was a stronger experience than dizziness.
To distinguish short term responses from an overall experience, there were additional responses sought for items where a rating of 1 was ‘not at all’ and 10 was ‘extremely’. There were no differences when the mean rating responses from either vibration condition were compared (maximum rating difference between the road profile and the 4 Hz condition was only 0.46 for the ‘boring’ item). There were some different subjective ratings provided for the items, and these were of interest in their relationship to the issue of tiredness. The most extreme reported level was for the ‘tiring’ item (mean 6.50) and the next most extreme was ‘boring’ (at 5.91). The next two highest values reported, in descending order, were ‘soothing’ and ‘relaxing’. The rest were much lower in rating and the whole sequence – from the highest rating value (closest to 10) to the lowest (closest to zero) – was: Tiring> Boring> Relaxing> Calming> Soothing> Enjoyable> Exciting> Disorienting> Unpleasant> Uncomfortable> Unsettling> Confusing> Painful. The mean value for the last item was 1.32 which is very close to ‘not at all’. These data suggest that the experience was generally considered to be more enervating and relaxing than unpleasant or aggravating.
Instrumentation to acquire road profile data for use in whole body vibration apparatus 15

3.2 Physiological data The nature of the recording of physiological data are shown in the following figures (Figures 13, 14, 15). The sequence of channels is numbered from the top down and the channel data are as indicated in the Methods (Section 2.5).
Figure 13 This is a screen shot of the data file where the physiological data are monitored while being acquired. This figure was obtained while the data were acquired during a 4 Hz stimulus period.
Figure 14 As for Figure 13, this is a screen shot of the data file where the physiological data were acquired when the driving frequency was from the road profile data.
16 Instrumentation to acquire road profile data for use in whole body vibration apparatus

Figure 15. This figure illustrates the recording of data throughout the 30-minute period with the 10 minutes of 4 Hz vibration shown in the top trace and the two baseline no-vibration periods on either side.
3.2.1 N-back task
The cognitive task (n-back) data (Figures 16, 17, 18, 19) show the expected practice effect with progressive improvement in reaction time during the 30-minute recording period and the three 5-minute sessions of carrying out the tasks. There were no differences in accuracy between any of the three periods in each vibration condition, nor between the two vibration conditions. As can be seen from Table 3 and Table 4, participants maintained nearly 100% accuracy. The average reaction time for the baseline conditions in both the 4 Hz and road profile trials (the first 5 minutes) was 700 ms for the three correct response types. By the third period, the reaction time was down to 600 ms for the same responses. The incorrect response type was consistently slower, up to 1 second. There was the expected practice improvement in the 4 Hz incorrect response reaction time so that it decreased to 800 ms by the last task period. With the road profile data, the last reaction time had increased to 900 ms and was the only one of the reaction times which did not follow the expected progressive improvement.
Instrumentation to acquire road profile data for use in whole body vibration apparatus 17
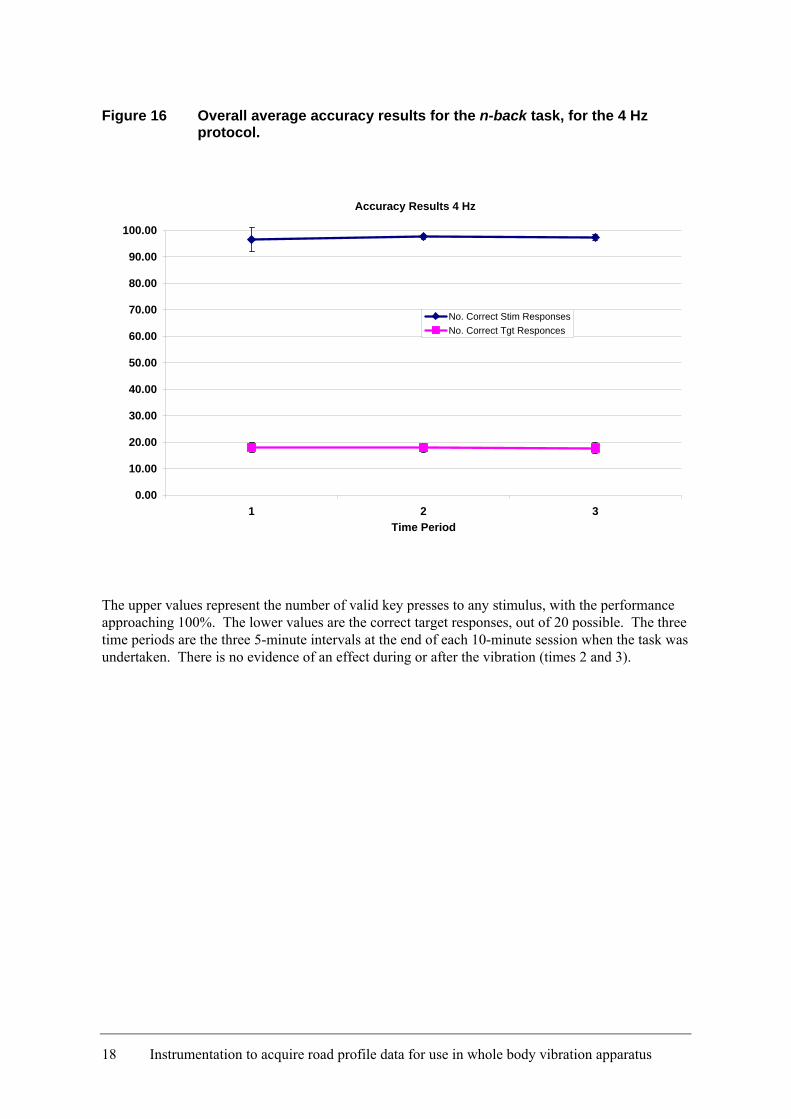
Figure 16 Overall average accuracy results for the n-back task, for the 4 Hz protocol.
Accuracy Results 4 Hz
0.00
10.00
20.00
30.00
40.00
50.00
60.00
70.00
80.00
90.00
100.00
1 2 3Time Period
No. Correct Stim ResponsesNo. Correct Tgt Responces
The upper values represent the number of valid key presses to any stimulus, with the performance approaching 100%. The lower values are the correct target responses, out of 20 possible. The three time periods are the three 5-minute intervals at the end of each 10-minute session when the task was undertaken. There is no evidence of an effect during or after the vibration (times 2 and 3).
18 Instrumentation to acquire road profile data for use in whole body vibration apparatus

Figure 17 Overall average accuracy results for the n-back task, for the road profile protocol.
Accuracy Results Road Profile
0.00
10.00
20.00
30.00
40.00
50.00
60.00
70.00
80.00
90.00
100.00
1 2 3Time Period
No. Correct Stim ResponsesNo. Correct Tgt Responces
The upper values in Figure 17 represent the number of valid key presses to any stimulus, with the performance approaching 100%. The lower values are the correct target responses, out of 20 possible. The three time periods are the three 5-minute intervals at the end of each 10-minute session when the task was undertaken. There is no evidence of an effect during or after the vibration (times 2 and 3).
Figure 18 Overall average reaction time results for the n-back task, for the 4 Hz protocol.
Reaction Times 4 Hz
400.00
600.00
800.00
1000.00
1200.00
1400.00
1600.00
1 2 3Time Period
Straight Average Correct Stim Response Correct Tgt Response
False Tgt Response Correct Non-Tgt Response
Instrumentation to acquire road profile data for use in whole body vibration apparatus 19

In Figure 18, the standard errors are shown as vertical bars. The upper line represents where a response was made that was incorrect (wrong button pressed). The other plots are for the correct responses. The three time periods are the three 5-minute intervals at the end of each 10-minute session when the task was undertaken. There is no evidence of an effect during or after the vibration (times 1 and 3).
Figure 19. Overall average reaction time results for the n-back task, for the road profile protocol.
Reaction Times Road Profile
400.00
600.00
800.00
1000.00
1200.00
1400.00
1600.00
1 2 3Time Period
Straight Average Correct Stim Response Correct Tgt Response
False Tgt Response Correct Non-Tgt Response
In Figure 19, the standard errors are shown as vertical bars. The upper line represents where a response was made that was incorrect (wrong button pressed). The other plots are for the correct responses. The three time periods are the three 5-minute intervals at the end of each 10-minute session when the task was undertaken. There is evidence of an effect after the vibration (time period 3) for the false target result (light blue line).
Table 3 Correct response values for the n-back task for the 4 Hz vibration protocol (seen in Figure 16).
4 Hz Condition Before During After Task parameter Mean S.D. Mean S.D. Mean S.D. No. Correct Stim Responses 96.50 4.52 97.64 0.95 97.41 1.10 No. False Stim Responses 0.05 0.21 0.23 0.53 0.45 1.10 No. Correct Tgt Responses 18.09 1.85 17.91 1.69 17.82 2.26 No. False Tgt Responses 2.68 4.31 1.45 1.79 1.00 1.45
The mean number of correct responses and the standard deviations for the various response conditions are listed: correct responses to the presence of a valid task (out of 100), invalid responses to a valid task (out of 100), incorrect responses to a valid task (out of 20), and incorrect responses to a valid task (out of 100).
20 Instrumentation to acquire road profile data for use in whole body vibration apparatus
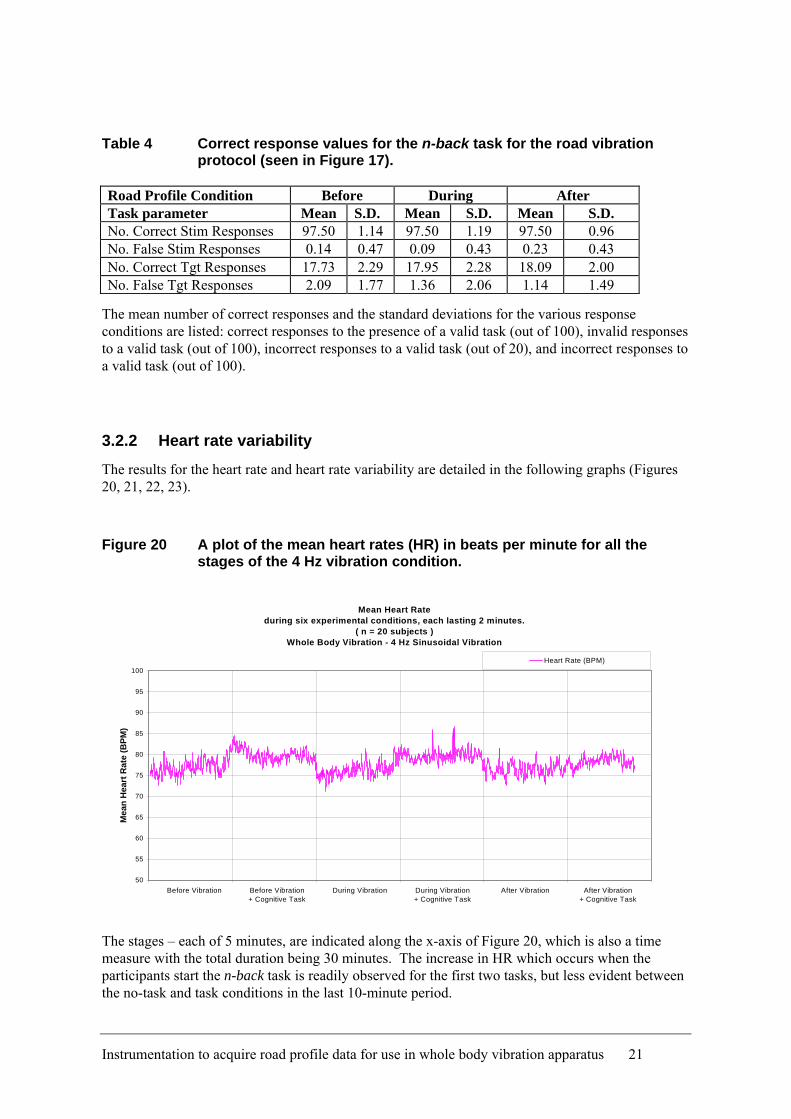
Table 4 Correct response values for the n-back task for the road vibration protocol (seen in Figure 17).
Road Profile Condition Before During After Task parameter Mean S.D. Mean S.D. Mean S.D. No. Correct Stim Responses 97.50 1.14 97.50 1.19 97.50 0.96 No. False Stim Responses 0.14 0.47 0.09 0.43 0.23 0.43 No. Correct Tgt Responses 17.73 2.29 17.95 2.28 18.09 2.00 No. False Tgt Responses 2.09 1.77 1.36 2.06 1.14 1.49
The mean number of correct responses and the standard deviations for the various response conditions are listed: correct responses to the presence of a valid task (out of 100), invalid responses to a valid task (out of 100), incorrect responses to a valid task (out of 20), and incorrect responses to a valid task (out of 100).
3.2.2 Heart rate variability
The results for the heart rate and heart rate variability are detailed in the following graphs (Figures 20, 21, 22, 23).
Figure 20 A plot of the mean heart rates (HR) in beats per minute for all the stages of the 4 Hz vibration condition.
Mean Heart Rate
during six experimental conditions, each lasting 2 minutes.( n = 20 subjects )
Whole Body Vibration - 4 Hz Sinusoidal Vibration
50
55
60
65
70
75
80
85
90
95
100
0 240 480 720 960 1200 1440
Mea
n H
eart
Rat
e (B
PM)
Heart Rate (BPM)
Before Vibration Before Vibration + Cognitive Task
During Vibration During Vibration + Cognitive Task
After Vibration After Vibration + Cognitive Task
The stages – each of 5 minutes, are indicated along the x-axis of Figure 20, which is also a time measure with the total duration being 30 minutes. The increase in HR which occurs when the participants start the n-back task is readily observed for the first two tasks, but less evident between the no-task and task conditions in the last 10-minute period.
Instrumentation to acquire road profile data for use in whole body vibration apparatus 21

Figure 21 Data from Figure 20 were plotted as standard deviations with the mean value of these shown for each condition.
Standard deviation of mean heart rate
during six experimental conditions, each lasting 2 minutes.( n = 20 subjects )
Whole Body Vibration - 4 Hz Sinusoidal Vibration
0
1
2
3
4
5
6
7
8
0 240 480 720 960 1200 1440
Stan
dard
Dev
iatio
n of
Hea
rt R
ate
(BPM
)
SD Mean SD
Before Vibration Before Vibration + Cognitive Task
During Vibration During Vibration + Cognitive Task
After Vibration After Vibration + Cognitive Task
The ‘step’ nature of the reduction in variation with each cognitive task period is clearly shown in Figure 21. Unlike the situation obtained during the road-vibration protocol, the variation in heart rate during the task stage of the vibration period is marked and the mean value is no less than the other two periods of task performance.
Figure 22 A plot of the mean heart rates (HR) in beats per minute for all the stages of the road vibration condition.
Mean Heart Rateduring six experimental conditions, each lasting 2 minutes.
( n = 21 subjects )Whole Body Vibration - Road Vibration
40
45
50
55
60
65
70
75
80
85
90
0 240 480 720 960 1200 1440
Mea
n H
eart
Rat
e (B
PM)
Heart Rate (BPM)
Before Vibration Before Vibration + Cognitive Task
During Vibration During Vibration + Cognitive Task
After Vibration After Vibration + Cognitive Task
22 Instrumentation to acquire road profile data for use in whole body vibration apparatus

The stages – each of 5 minutes, are indicated along the x-axis, with the total duration being 30 minutes. The increase in HR which occurs when the participants start the n-back task is readily observed for the first two tasks, but less evident between the no-task and task conditions in the last 10-minute period.
Figure 23 Data from Figure 22 were plotted as standard deviations with the mean value of these shown for each condition.
Standard deviation of mean heart rateduring six experimental conditions, each lasting 2 minutes.
( n = 21 subjects )Whole Body Vibration - Road Vibration
0
1
2
3
4
5
6
7
8
0 240 480 720 960 1200 1440
Stan
dard
Dev
iatio
n of
Hea
rt R
ate
(BPM
)
SD Mean SD
Before Vibration Before Vibration + Cognitive Task
During Vibration During Vibration + Cognitive Task
After Vibration After Vibration + Cognitive Task
The ‘step’ nature of the reduction in variation with each cognitive task period is clearly shown. The least variation and the lowest mean deviation occurred in the task period during vibration.
3.2.3 EEG activity
The following graphs show some of the large amount of data and comparisons which can be obtained from the EEG recordings in the various conditions.
These are:
No vibration period before
5 minutes of no cognitive task
5 minutes of cognitive task
Vibration period
5 minutes of no cognitive task
5 minutes of cognitive task
No vibration period after
5 minutes of no cognitive task
5 minutes of cognitive task
Instrumentation to acquire road profile data for use in whole body vibration apparatus 23

Further there are the 4 electrode sites used as indicated in the Methods (see Section 2.5), two on each side in front of the head, and two on each side at the back of the head. Lastly we have the frequency domain for EEG which is normally taken to cover the range from nearly 0 Hz to 40 Hz. For reasons associated with the size of the signals, we have concentrated on the lower frequencies and pooled all the frequencies above 15 Hz. These were divided into 8 frequency bins: 1 to 3, 3 to 5, 5 to 7, 7 to 9, 9 to 11, 11 to 13, 13 to 15 and 15+.
The following figures (Figure 24, 25, 26 ) are examples of the various analyses.
In Figure 24 it is evident that across the various conditions and across the two vibration modes, the standard errors remain relatively consistent suggesting that there is no marked difference in the effects of the two different vibration conditions in the F3 location, even when the cognitive task is being undertaken.
Figure 24. This figure demonstrates the relative power of the spectrum in different frequency bands.
The data were obtained from the F3 (left frontal) electrode while the participants were doing the task (second 5-minutes of the three study periods). The bars are the means of both 4 Hz and road profile values. For each frequency band, the left-hand column shows the mean and standard error for the before vibration condition, the middle column is for the vibration period and the right-hand column is for the post-vibration interval.
24 Instrumentation to acquire road profile data for use in whole body vibration apparatus

Figure 25. This figure compares the road vibration and 4 Hz conditions when the participants were sitting with no task to carry out.
Data were obtained from the posterior electrode on the right side. There are only minor differences between the two vibration conditions. Importantly, there is evidence of an increase in the 03-05 band in the 4 Hz condition. In the equivalent road condition there are increases in the first three bins which include the frequencies inherent in the vibration pattern.
Instrumentation to acquire road profile data for use in whole body vibration apparatus 25
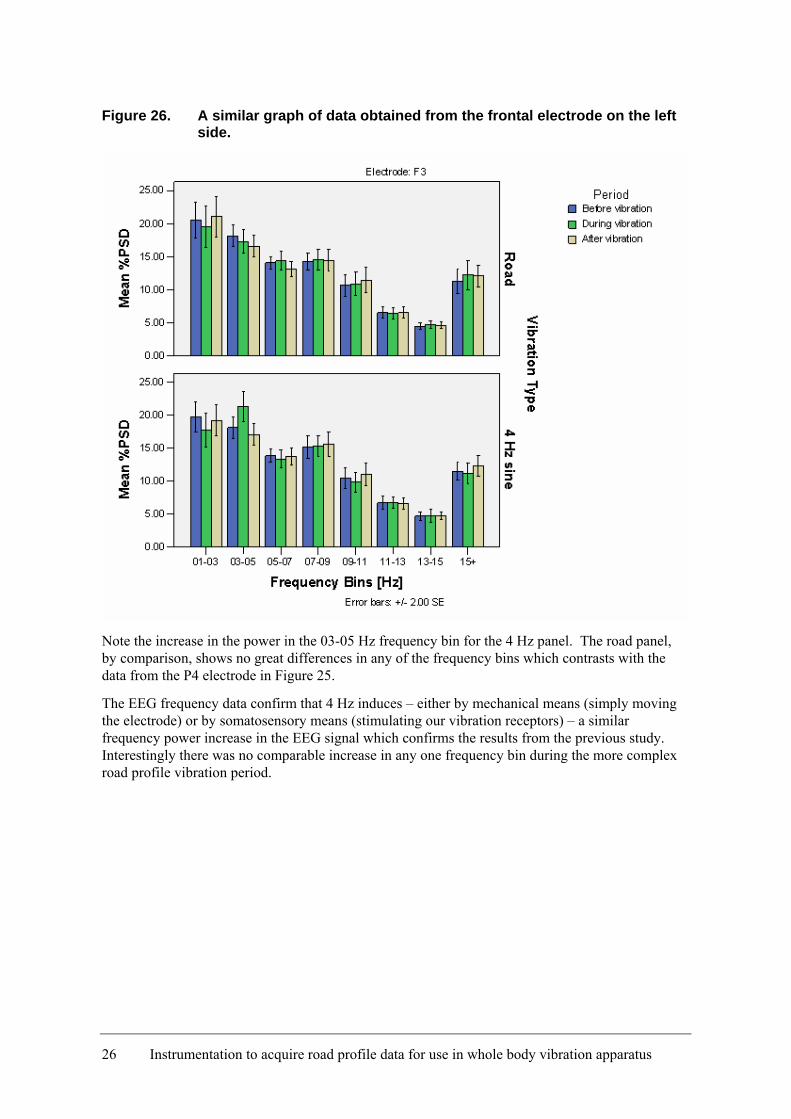
Figure 26. A similar graph of data obtained from the frontal electrode on the left side.
Note the increase in the power in the 03-05 Hz frequency bin for the 4 Hz panel. The road panel, by comparison, shows no great differences in any of the frequency bins which contrasts with the data from the P4 electrode in Figure 25.
The EEG frequency data confirm that 4 Hz induces – either by mechanical means (simply moving the electrode) or by somatosensory means (stimulating our vibration receptors) – a similar frequency power increase in the EEG signal which confirms the results from the previous study. Interestingly there was no comparable increase in any one frequency bin during the more complex road profile vibration period.
26 Instrumentation to acquire road profile data for use in whole body vibration apparatus
4 DISCUSSION
4.1 Questionnaire data The goal of developing the questionnaire was to obtain subjective estimates of the sensations and perceptions of the participants to their initial state and after their period of vibration. The questionnaire specifically requests they report about the vibration ‘experience’ and so it is assumed that these comments were related to the vibration and not the no-vibration periods. The general close similarity – no mean value differed by more than one rating point – between the responses to all items for the road profile condition and the 4 Hz condition, suggests that the experiences were considered to induce similar feelings and sensations. The main purpose of the participant recording part of the study was to see if there were any marked differences in induced feelings and experiences between the road profile vibration and that produced by a 4 Hz stimulus. The lack of marked differences suggests that the two profiles were – overall – equally effective in inducing changes.
The questionnaire parameters which were most different after the vibration from before were ‘tiredness’ and ‘sleepiness’. The ‘after’ ratings for these were nearly double the ‘pre-test’ values. While this is suggestive, it cannot be as reliable a measure of fatigue as more sophisticated tests using complex task paradigms. The reason these were not used in this study is simple: the time available to have the participants in the truck seat doing tests had to be short to avoid the problems of boredom and distraction. The important result from this study was the observed consistency in the ratings for these measures for the road profile vibration and the 4 Hz.
The initial questions were designed to determine, in a simple way, the baseline state of the participants in respect of tiredness, sleep characteristics, sleep satisfaction and proneness to motion sickness. Most of the ratings in response to these questions were between ‘not at all’ and ‘extremely’, with the standard deviation generally around 2 rating points. This suggests that the participants were generally similar in their sleep habits and sleep quality, by their estimation. The approach used in this questionnaire is not going to provide detailed information about sleep; that requires much more extensive questioning. The goal was to ensure that the participants represented a population of normal sleepers. While it can be argued that these were predominately young people – average between 21 and 23 years – and that this group is more cavalier in their approach to sleep, the fact that they are ‘normal’ cannot be ignored or trivialised. In fact, this group may be of more relevance given that they are more represented in the road toll. It would require a much larger study to get different age groups, and a longer time to ensure that all participants attended the test phase only when they had a specific night’s sleep.
The questionnaire responses to items designed to probe for various commonly used expressions of energy levels and mood state followed the expected trend for 4 Hz. Almost all of the measures were in line with our previous results where a study on 40 people showed that the constant 4 Hz sine-wave vibration pattern produced significantly increased expressions generally associated with tiredness, but no significant changes to those items not expected to be related to tiredness or fatigue.
As can be seen from Table 1, items such as ‘feeling sleepy’, ‘feeling lively’, ‘feeling alert’ all showed significant differences between the no vibration and vibration conditions for both the road profile data and the 4 Hz data. The only items where there was a discrepancy between the levels of significance between road profile and 4 Hz responses were: ‘I feel vigorous’ and ‘I feel peppy’. Informal observations of the participants suggested that the meanings of these questions were not immediately clear to some people. Except for these items, the questionnaire responses to the energy questions all showed the same trend for the two vibration conditions.
Instrumentation to acquire road profile data for use in whole body vibration apparatus 27
From Table 2, the analysis to responses to mood items also showed a similar trend for 4 Hz to the previous study. With these items there are more issues which might be postulated as being less connected or influenced by fatigue or tiredness. Participant responses to such mood issues as ‘annoyed’, ‘miserable’ and ‘worried’ were expected to be relatively unaffected by the vibration. The items where there were significant differences between pre- and post-vibration values were: ‘lively’, ‘exhausted’, ‘energetic’, ‘active’ and ‘alert’. All of these are strongly connected with the concept of tiredness and fatigue. Examples of cases where the differences were not significant were: ‘panicky’, ‘mixed up’, ‘annoyed’ and ‘worried’. Generally there were similar trends for the road profile vibration responses and the 4 Hz vibration responses. As with the energy measures there were some items where there were differences in significance between the two conditions. Three items, ‘worn out’, ‘depressed’ and ‘nervous’, were significantly different in response to 4 Hz but not road profile vibration protocols. By contrast, ‘sleepy’, ‘tired’ and ‘uncertain’ were significantly different for the road profile but not for the 4 Hz conditions. It is particularly interesting that ‘sleepy’ and ‘tired’, which are very similar in meaning, were both reported to differ more for the road profile condition. This suggests that the questionnaire is consistent in the nature of the responses and that these items at least are valid.
The results from the questionnaires suggest that the road profile vibration has the same effect on mood and energy as the continuous 4Hz vibration for nearly all the measures used in the study. The data appear internally consistent, except where understanding of the meaning of the question may have confounded the responses. Overall, both forms of vibration increased the reported value of those items which were intended to determine increased feelings of fatigue and tiredness. This part of the study, therefore, had a successful outcome. The major question and problem is the definition and use of the expression ‘fatigue’. Whether all of us share an identical understanding of this concept is a key question and so the use of multiple descriptors in the questionnaire is designed to gather as much peripherally associated information as possible. Simply asking if the participant felt fatigued would run the risk of obtaining information with a semantic, or ‘knowledge’ bias. The observation in this study that items such as ‘tiredness’, ‘difficulty concentrating’ and ‘boredom’ were given higher rating levels than items such as ‘confusion’, ‘anxiety’ and ‘dizziness’ suggests that the consequences of the vibration of both forms are related to items more associated with fatigue and tiredness. It must be noted that the recording arrangement was limited to a sequence in which the vibration was the middle 10 minutes, but, because the questionnaire took some time to complete it prevented this occurring immediately after the vibration. Instead, filling in the questionnaire occurred at the end of the session some 10 minutes after the vibration had ceased. This means that the observations intended to be related to the vibration experience, and which specifically requested these responses, were perhaps affected by the 10 minutes of no-vibration which intervened.
4.2 N-Back Task data The use of the n-back task has a significant confound when used in studies such as these. As a task which demands activity (pushing buttons) and displays a changing visual field., the concern arises from the possibility that the change in activity removes any induced fatigue or boredom and invigorates the participant. This is similar to the recommendation that tired drivers should get out of their car and walk around. If this suggestion is true, then the performance of the participants may be better than would be expected if there was a depression in attention caused by the vibration. Another concern with the task is that it is too easy and does not require elevated attention. If the performance of participants is such that 100% of responses are correct, then the task is likely to be too easy and not readily subject to performance decrement. A more difficult version, such as having three letters to remember, may have been a better approach; however, to maintain comparability with the previous study it was decided not to change this test.
28 Instrumentation to acquire road profile data for use in whole body vibration apparatus
Despite these concerns, there are two sets of results from the n-back that can be of value in assessing attention changes: error rate and reaction time. An increase in error rate occurring with the vibration would be suggestive of a decrease in attention. Another measure is that of the response time or reaction time of the participant to the stimulus presentation. There are several alternatives which can occur. A correct response occurs when the participant correctly identifies the current letter as the same as the target and presses the correct button. An incorrect response is recorded if the participant presses the ‘yes’ button when the current letter is not the same as the target letter, or, the participant presses the ‘no’ button when the current letter is the same as the target. Additional information is recorded if the participant presses either button too quickly (anticipation) with a reaction time which is too fast to be acceptable. For the purposes of this study the only aspect of significance was the loss of consistency in the pattern of results. The increase in reaction time – longer response time – after the road profile data requires additional investigation. While it is possible that the increased delay was caused by a delayed reaction to the road profile, the confounding effect of the nature of the type of task may have simply caused a wider variation in reaction times. This is supported by the increased variance in the values obtained for this particular condition, exceeding those from any other test point.
4.3 Heart Rate data Heart rate (HR) is normally a stable physiological parameter which is subject to change as a result of increasing physical activity and, in some situations, emotional stress. It has been suggested that it is not the average heart rate which is of note in emotionally stressful situations. The parameter of interest is the variation in heart rate (HRV).
The results of the analysis of HR and HRV in this study with the two vibration conditions showed that there were no major differences whether it was road profile or 4 Hz. The HR during the no-task part of each test period (the first five minutes) was always more variable than the period in which the n-back task was being undertaken. The fact that the mean HRV was lowest during the road profile task stage would be suggestive that this was the most ‘stressful’ condition. The drop in HRV occurring at the onset of each task period is also supportive of the ‘added stress’ of the task starting. The value of this measure is apparent when it is obvious that the HRV parameters do change, particularly for the last task in the set, when the mean heart rate shows no marked change at all. This suggests that there may be merit in examining the relationship between the difficulty of the task – that is not getting it 100% correct – and the HRV. The n-back task may be a good task for these conditions, but only if it is made more demanding, and combined with HRV measures.
The comparison between the 4 Hz and road profile HRV data suggests that there may be a slight difference during vibration between these patterns. While there is a trend, a more extensive analysis would be required to establish if the observed differences were significant. The larger variation about the mean value evident in the 4 Hz vibration condition compared with the more consistent pattern for the road profile may be an artefact of the shaking, but it may also be a physiological consequence of the movement of the chest and heart in a regular fashion altering venous return to the heart.
To conclude, it is clear that the two vibration conditions were not fundamentally different in their affect on HR or HRV, but there are differences. It is also clear that the HR and HRV are not constant as they can be modulated by the stress of doing the cognitive task. It is suggested that of the two profiles, the road profile pattern may have the most impact on underlying ‘non-physical stress’, although a much larger study on this would be necessary to obtain sufficient data for a relevant analysis to occur.
Instrumentation to acquire road profile data for use in whole body vibration apparatus 29

4.4 EEG frequency data There was no evidence visible in the EEG frequency data to suggest that the changes in brain activity induced by the stimulus were fundamentally different whether the stimulus was a 4 Hz or road profile vibration. This outcome supports the conclusion that only small differences in responses were induced by the two patterns of vibration. Had one of the analyses of the EEG frequency data produced a totally different result from the other, then the question would have arisen as to the validity of the protocols. It is not expected that a major difference in activity in the brain would be caused by, essentially, the same general stimulus type. The greater part of the brain’s activity is handling external and internal parameters and only a proportion would be involved in the response to vibration. Had the responses to each vibration been identical there would also be concern as to the validity of the experiment and the conclusions drawn. The results, however, were essentially the same with sufficient differences to suggest that the actual recordings were in fact directly influenced by the individual nature of the vibrations. It must be remembered that the road profile data included a component of 4 Hz. This would suggest, in turn, that the EEG signal recorded in road profile part of the experiments might be expected to include signals also found in the 4 Hz vibration study. This is the logic in assuming that the responses to the vibrations would contain some similarity in EEG response.
Further analysis of the EEG data, including analysis of the information in the time domain, rather than the frequency domain, is beyond the scope of this study. It is not known whether there may be additional indications of vibration response details beyond those found in the frequency domain. The advantage of the frequency domain is the benefit of treating the whole recording interval and averaging over this period. This ensures that any small responses are not missed. It has the disadvantage of then reducing the magnitude of any responses. Another disadvantage of the frequency domain is that there may be responses which vary progressively throughout the period of study. This may be as a result of the increasing influence of the vibration accumulating with time. Early in the vibration period the influence may be small but rise as the effect compounds. This is only one of many possible outcomes. There is an effective limit to how small a time interval can be used for frequency analysis and so very small time samples are not suitable for frequency domain interpretation. Time domain data – that is the voltage changes which occur continuously – can show rapidly occurring activity changes. Analysis of this is, however, a very time consuming process with no guarantee of success.
4.5 Conclusion The experimental design and equipment constructed have resulted in an experiment producing data supporting the hypothesis that vibrations produced by road profile acceleration data and 4 Hz sine-wave acceleration data would produce similar reported and recorded effects on participants. The differences observed may be due to variations in the sub-population of participants used for the current project compared to previous studies, or entirely caused by the different nature of the road profile vibration signal.
While it was never expected that the two vibration patterns would result in identical results, the level of overlap is most gratifying. It clearly shows that either vibration pattern is capable of causing trends towards subjective fatigue. That there were differences in detail between the results of the study when 4 Hz was used and those obtained from road profile data, is also encouraging as it indicates that simple vibration does not cause effects coincidently, but that the frequency, and hence the acceleration, component is capable of altering the questionnaire responses, the brain electrical activity responses and the cognitive/short term memory responses in subtle ways.
30 Instrumentation to acquire road profile data for use in whole body vibration apparatus

5 REFERENCES
Carlsöö, S. (1982) The effect of vibration on the skeleton, joints and muscles: a review of the literature Applied Ergonomics, 13 (4), 251 - 258.
Hassan, R., (2002) Assessment of road roughness effects on heavy vehicles, PhD Thesis submitted in partial fulfilment of the requirements of the degree of Doctor of Philosophy in Civil Engineering, Swinburne University of Technology.
Hassan R. and McManus, K. (2001) Truck Ride Number- A New Management Tool, Proceedings of the 20th ARRB Conference on Managing your Transport Assets, 19-21 March, Melbourne, Australia.
ISO (1997) ‘Mechanical vibration and shock Evaluation of human exposure to whole body vibration’, Part 1 General requirements, 2nd edition, International Organization for Standardisation.
McLeod, R.W. and Griffin, M.J. (1988) Performance of a complex manual control task during exposure to vertical whole-body vibration between 0.5 and 5.0 Hz Ergonomics 31 (8), 1193 – 1203.
Sweatman, P. and McFarlane, S. (2000) Investigation into the Specification of Heavy Trucks and Consequent Effects on Truck Dynamics and Drivers: Final Report, Federal Office of Road Safety, Australia.
Instrumentation to acquire road profile data for use in whole body vibration apparatus 31

APPENDIXES
32 Instrumentation to acquire road profile data for use in whole body vibration apparatus

APPENDIX A: RAW DATA FROM QUESTIONNAIRES
Road Profile Condition Paired Differences
95% Confidence Interval of Diff
‘Energy’ Items
Differences between pre- and post-vibration measures Mean
Std. Dev.
Std. Error Mean Lower Upper t df
Sig. (2-tailed)
Pair 1 I feel sleepy -2.136 2.145 .457 -3.087 -1.185 -4.672 21 .000* Pair 2 I feel active 1.500 1.626 .347 .779 2.221 4.328 21 .000* Pair 3 I feel half asleep -1.636 3.110 .663 -3.015 -.258 -2.468 21 .022* Pair 4 I feel half lively 1.818 1.943 .414 .957 2.680 4.389 21 .000* Pair 5 My eyes feel heavy -2.591 2.482 .529 -3.691 -1.491 -4.897 21 .000* Pair 6 I feel full of pep 1.727 1.486 .317 1.068 2.386 5.452 21 .000* Pair 7 I feel half awake -.952 2.439 .532 -2.062 .158 -1.790 20 .089 Pair 8 I feel energetic 1.682 1.836 .391 .868 2.496 4.297 21 .000* Pair 9 I feel dead on my feet -1.591 2.323 .495 -2.621 -.561 -3.212 21 .004* Pair 10 I feel vigorous 1.045 2.236 .477 .054 2.037 2.193 21 .040* Pair 11 I feel bushed -1.409 2.364 .504 -2.457 -.361 -2.796 21 .011* Pair 12 I feel peppy 1.364 1.706 .364 .607 2.120 3.750 21 .001* Pair 13 I am dozing off -2.409 3.112 .663 -3.789 -1.030 -3.632 21 .002* Pair 14 I feel wide awake 2.045 2.786 .594 .810 3.281 3.444 21 .002* Pair 15 I feel carefree -.591 1.403 .299 -1.213 .031 -1.976 21 .061 Pair 16 I feel groggy -2.409 2.971 .633 -3.726 -1.092 -3.804 21 .001* Pair 17 I feel alert 2.364 2.128 .454 1.420 3.307 5.210 21 .000* Pair 18 I feel wakeful 1.864 1.885 .402 1.028 2.699 4.638 21 .000*
* Significant at the p<0.05 level.
Instrumentation to acquire road profile data for use in whole body vibration apparatus 33

4 Hz Condition Paired Differences
95% Confidence Interval of Dif
‘Energy’ Items
Differences between pre- and post-vibration measures Mean
Std. Deviation
Std. Error Mean Lower Upper t df
Sig. (2-
tailed) Pair 1 I feel sleepy -1.636 1.706 .364 -2.393 -.880 -4.500 21 .000* Pair 2 I feel active 1.318 1.729 .369 .552 2.085 3.576 21 .002* Pair 3 I feel half asleep -1.273 2.313 .493 -2.298 -.247 -2.581 21 .017* Pair 4 I feel half lively 1.409 1.681 .358 .664 2.154 3.932 21 .001* Pair 5 My eyes feel heavy -1.455 2.738 .584 -2.669 -.240 -2.492 21 .021* Pair 6 I feel full of pep 1.000 1.574 .335 .302 1.698 2.981 21 .007* Pair 7 I feel half awake -.455 2.132 .455 -1.400 .491 -1.000 21 .329 Pair 8 I feel energetic 1.136 1.754 .374 .359 1.914 3.039 21 .006* Pair 9 I feel dead on my feet -1.524 2.316 .505 -2.578 -.470 -3.016 20 .007* Pair 10 I feel vigorous .545 2.041 .435 -.359 1.450 1.254 21 .224 Pair 11 I feel bushed -1.273 1.695 .361 -2.024 -.521 -3.521 21 .002* Pair 12 I feel peppy .636 2.036 .434 -.267 1.539 1.466 21 .158 Pair 13 I feel I am dozing off -2.545 2.956 .630 -3.856 -1.235 -4.039 21 .001* Pair 14 I feel wide awake 1.682 2.009 .428 .791 2.573 3.926 21 .001* Pair 15 I feel carefree .591 2.130 .454 -.354 1.536 1.301 21 .207 Pair 16 I feel groggy -2.136 2.494 .532 -3.242 -1.031 -4.018 21 .001* Pair 17 I feel alert 1.364 2.105 .449 .430 2.297 3.038 21 .006* Pair 18 I feel wakeful 1.227 1.771 .378 .442 2.012 3.250 21 .004*
* Significant at the p<0.05 level.
34 Instrumentation to acquire road profile data for use in whole body vibration apparatus

Road Profile Condition Paired Differences
95% Confidence Interval of Diff
‘Mood’ Items
Differences between pre- and post-vibration
measures Mean Std. Dev.
Std. Error Mean Lower Upper t df
Sig. (2-tailed)
Pair 1 Panicky .045 .375 .080 -.121 .212 .568 21 .576 Pair 2 Lively 1.091 1.065 .227 .619 1.563 4.805 21 .000* Pair 3 Confused .182 .588 .125 -.079 .443 1.449 21 .162 Pair 4 Worn out -.409 1.221 .260 -.951 .132 -1.571 21 .131 Pair 5 Depressed .227 .528 .113 -.007 .462 2.017 21 .057 Pair 6 Downhearted .136 .351 .075 -.019 .292 1.821 21 .083 Pair 7 Annoyed .091 .294 .063 -.040 .221 1.449 21 .162 Pair 8 Exhausted -.409 .854 .182 -.788 -.030 -2.247 21 .036* Pair 9 Mixed-up -.045 .575 .123 -.301 .210 -.370 21 .715 Pair 10 Sleepy -.864 1.283 .274 -1.433 -.295 -3.156 21 .005* Pair 12 Bitter .182 .395 .084 .007 .357 2.160 21 .042* Pair 13 Unhappy .364 .727 .155 .041 .686 2.347 21 .029* Pair 14 Anxious .136 .710 .151 -.179 .451 .901 21 .378 Pair 15 Worried .682 .894 .191 .286 1.078 3.578 21 .002* Pair 16 Energetic .091 .294 .063 -.040 .221 1.449 21 .162 Pair 17 Miserable -.045 .375 .080 -.212 .121 -.568 21 .576 Pair 18 Muddled .227 .612 .130 -.044 .499 1.742 21 .096 Pair 19 Angry .136 .468 .100 -.071 .344 1.368 21 .186 Pair 20 Active .909 1.109 .236 .417 1.401 3.846 21 .001* Pair 21 Tired -.818 1.053 .224 -1.285 -.351 -3.645 21 .002* Pair 22 Bad tempered .000 .309 .066 -.137 .137 .000 21 1.000 Pair 23 Alert 1.136 1.037 .221 .677 1.596 5.139 21 .000* Pair 24 Uncertain .136 .710 .151 -.179 .451 .901 21 .378 * Significant at the p<0.05 level. Note: Pair 11 not analysed: (quote SPSS) ‘The correlation and t cannot be computed because the standard error of the difference is 0’ .
Instrumentation to acquire road profile data for use in whole body vibration apparatus 35

4 Hz Condition Paired Differences
95% Confidence Interval of Diff
‘Mood’
Differences between pre- and post-vibration measures Mean
Std. Dev.
Std. Error Mean Lower Upper t df
Sig. (2-tailed)
Pair 1 Panicky .227 .813 .173 -.133 .588 1.312 21 .204 Pair 2 Lively .727 1.120 .239 .230 1.224 3.044 21 .006* Pair 3 Confused .000 .436 .093 -.194 .194 .000 21 1.000 Pair 4 Worn out -.727 1.202 .256 -1.260 -.194 -2.837 21 .010* Pair 5 Depressed .182 .395 .084 .007 .357 2.160 21 .042* Pair 6 Downhearted .273 .631 .135 -.007 .553 2.027 21 .056 Pair 7 Annoyed .091 .526 .112 -.142 .324 .810 21 .427 Pair 8 Exhausted -.714 .845 .184 -1.099 -.330 -3.873 20 .001* Pair 9 Mixed-up -.136 .468 .100 -.344 .071 -1.368 21 .186 Pair 10 Sleepy -.409 2.343 .500 -1.448 .630 -.819 21 .422 Pair 11 Bitter .091 .294 .063 -.040 .221 1.449 21 .162 Pair 12 Unhappy .227 .612 .130 -.044 .499 1.742 21 .096 Pair 13 Anxious .182 .588 .125 -.079 .443 1.449 21 .162 Pair 14 Worried .864 1.125 .240 .365 1.363 3.600 21 .002* Pair 15 Energetic .045 .486 .104 -.170 .261 .439 21 .665 Pair 16 Miserable -.045 .575 .123 -.301 .210 -.370 21 .715 Pair 17 Muddled .273 .550 .117 .029 .517 2.324 21 .030* Pair 18 Angry .136 .468 .100 -.071 .344 1.368 21 .186 Pair 19 Active .682 .839 .179 .310 1.054 3.813 21 .001* Pair 20 Tired -.455 1.335 .285 -1.047 .138 -1.596 21 .125 Pair 21 Bad tempered .045 .213 .045 -.049 .140 1.000 21 .329 Pair 22 Alert .636 1.217 .259 .097 1.176 2.453 21 .023* Pair 23 Uncertain -.045 .653 .139 -.335 .244 -.326 21 .747 Pair 24 Panicky .091 .294 .063 -.040 .221 1.449 21 .162 * Significant at the p<0.05
36 Instrumentation to acquire road profile data for use in whole body vibration apparatus

Road Profile Condition Parameter N Range Min. Max. Mean Std. Dev.
Vibration Test Condition 22 0 1 1 1.00 .000 Time of Testing 19 14:20 3:45 18:05 12:24 3:40 Subject Gender 21 1 1 2 1.43 .507 Subject Age 21 27 18 45 22.86 7.398 Education Level 21 3 2 5 3.14 1.276 Is Subject Pregnant 21 0 2 2 2.00 .000 History of epileptic seizure 21 0 2 2 2.00 .000 Problems with balance 21 0 2 2 2.00 .000 Any major health problems 21 0 2 2 2.00 .000 Low blood pressure 21 1 1 2 1.95 .218 Feelings of dizziness or faintness 21 1 1 2 1.86 .359 Drivers licence 21 1 1 2 1.24 .436 Number of years driving 17 24.0 1.0 25.0 5.882 6.9788 Fallen asleep at the wheel 19 1 1 2 1.95 .229 Number times fallen asleep 1 0 1 1 1.00 . Truck licence 21 0 2 2 2.00 .000 Number of years truck licence 0 Suffer from motion sickness 22 7 0 7 2.05 2.886 Enjoyment of amusement ride 22 8 2 10 7.73 2.028 Number of amusement rides 18 50 0 50 8.33 11.762 Sleep History 22 9 0 9 1.14 2.376 Sleep affected by shift work 22 1 1 2 1.86 .351 Avg hours sleep on work day 22 4.0 6.0 10.0 7.523 1.1178 Avg hours sleep on weekend 22 6.5 5.5 12.0 8.886 1.6614 General level of sleep satisfaction 22 9 1 10 6.55 2.345 Bed time for previous night (24 hr) 22 23:30 0:00 23:30 7:20 9:56 Time of getting up on current day (24 hr)
22 6:20 6:10 12:30 8:23 1:38
Number of hours slept previous night 22 7.0 4.0 11.0 7.470 1.6061 Level of satisfaction with previous night sleep
22 7 3 10 6.14 2.336
Number of hours been awake 22 10.0 .5 10.5 4.977 3.0608 Pre test level of sleepiness 22 6 1 7 3.95 1.963 Pre test level of lethargy 22 6 1 7 3.23 1.798 Pre test level of lacking energy 22 7 1 8 3.86 2.007 Pre test level of tiredness 22 6 2 8 4.36 2.105 Pre test level of fatigue 22 7 1 8 3.36 2.013
Instrumentation to acquire road profile data for use in whole body vibration apparatus 37
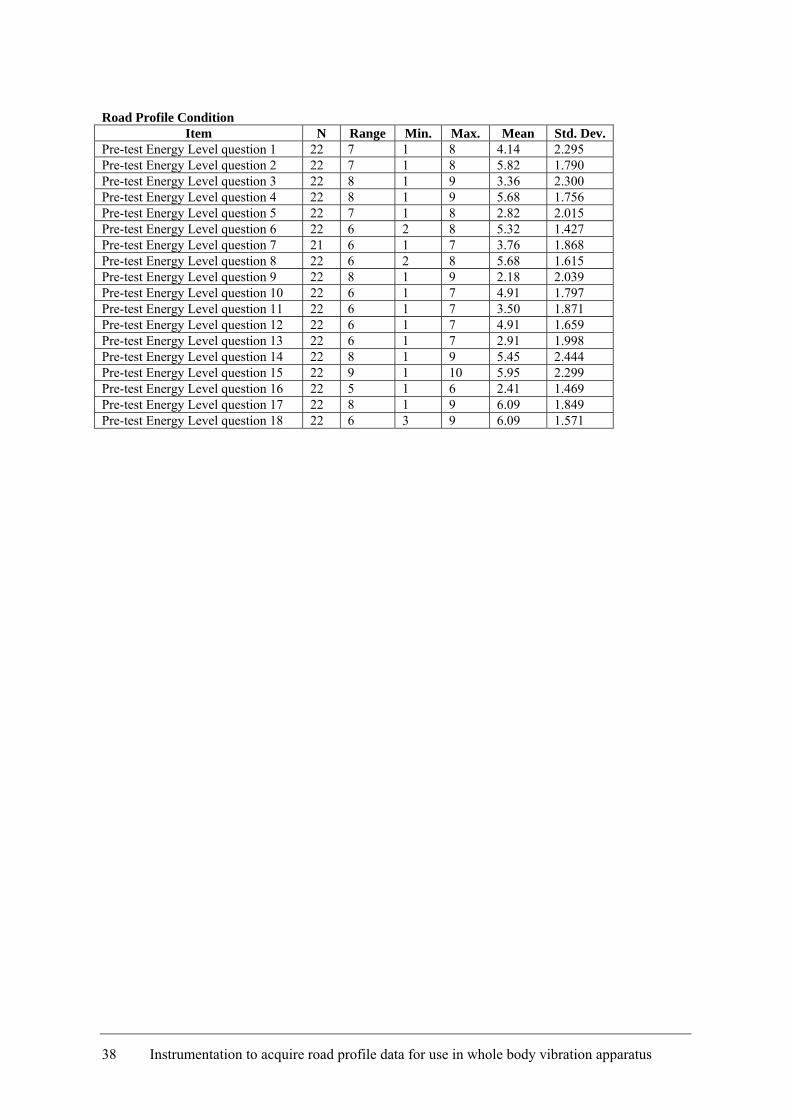
Road Profile Condition Item N Range Min. Max. Mean Std. Dev.
Pre-test Energy Level question 1 22 7 1 8 4.14 2.295 Pre-test Energy Level question 2 22 7 1 8 5.82 1.790 Pre-test Energy Level question 3 22 8 1 9 3.36 2.300 Pre-test Energy Level question 4 22 8 1 9 5.68 1.756 Pre-test Energy Level question 5 22 7 1 8 2.82 2.015 Pre-test Energy Level question 6 22 6 2 8 5.32 1.427 Pre-test Energy Level question 7 21 6 1 7 3.76 1.868 Pre-test Energy Level question 8 22 6 2 8 5.68 1.615 Pre-test Energy Level question 9 22 8 1 9 2.18 2.039 Pre-test Energy Level question 10 22 6 1 7 4.91 1.797 Pre-test Energy Level question 11 22 6 1 7 3.50 1.871 Pre-test Energy Level question 12 22 6 1 7 4.91 1.659 Pre-test Energy Level question 13 22 6 1 7 2.91 1.998 Pre-test Energy Level question 14 22 8 1 9 5.45 2.444 Pre-test Energy Level question 15 22 9 1 10 5.95 2.299 Pre-test Energy Level question 16 22 5 1 6 2.41 1.469 Pre-test Energy Level question 17 22 8 1 9 6.09 1.849 Pre-test Energy Level question 18 22 6 3 9 6.09 1.571
38 Instrumentation to acquire road profile data for use in whole body vibration apparatus

Road Profile Condition Item N Range Min. Max. Mean Std. Dev.
Pre-test Mood Levels question 1 22 1 0 1 .14 .351 Pre-test Mood Levels question 2 22 4 0 4 2.23 1.193 Pre-test Mood Levels question 3 22 2 0 2 .27 .550 Pre-test Mood Levels question 4 22 3 0 3 1.09 1.065 Pre-test Mood Levels question 5 22 3 0 3 .45 .963 Pre-test Mood Levels question 6 22 3 0 3 .45 .800 Pre-test Mood Levels question 7 22 1 0 1 .18 .395 Pre-test Mood Levels question 8 22 3 0 3 .77 .922 Pre-test Mood Levels question 9 22 3 0 3 .23 .752 Pre-test Mood Levels question 10 22 3 0 3 1.23 .869 Pre-test Mood Levels question 11 22 2 0 2 .14 .468 Pre-test Mood Levels question 12 22 4 0 4 .45 .963 Pre-test Mood Levels question 13 22 3 0 3 .41 .734 Pre-test Mood Levels question 14 22 2 0 2 .27 .703 Pre-test Mood Levels question 15 22 3 0 3 1.73 1.032 Pre-test Mood Levels question 16 22 3 0 3 .27 .767 Pre-test Mood Levels question 17 22 2 0 2 .23 .528 Pre-test Mood Levels question 18 22 2 0 2 .32 .646 Pre-test Mood Levels question 19 22 2 0 2 .14 .468 Pre-test Mood Levels question 20 22 3 0 3 1.86 1.037 Pre-test Mood Levels question 21 22 3 0 3 1.27 .883 Pre-test Mood Levels question 22 22 1 0 1 .09 .294 Pre-test Mood Levels question 23 22 3 0 3 2.05 .844 Pre-test Mood Levels question 24 22 2 0 2 .41 .666
Instrumentation to acquire road profile data for use in whole body vibration apparatus 39

Road Profile Condition Item N Range Min. Max. Mean Std. Dev.
Post-test Energy Level question 1 22 8 2 10 6.27 1.932 Post-test Energy Level question 2 22 7 1 8 4.32 1.862 Post-test Energy Level question 3 22 6 2 8 5.00 1.604 Post-test Energy Level question 4 22 6 1 7 3.86 1.583 Post-test Energy Level question 5 22 7 2 9 5.41 1.681 Post-test Energy Level question 6 22 5 1 6 3.59 1.563 Post-test Energy Level question 7 22 6 2 8 4.68 1.393 Post-test Energy Level question 8 22 6 1 7 4.00 1.512 Post-test Energy Level question 9 22 7 1 8 3.77 1.998 Post-test Energy Level question 10 22 7 1 8 3.86 1.699 Post-test Energy Level question 11 22 7 2 9 4.91 1.849 Post-test Energy Level question 12 22 5 1 6 3.55 1.654 Post-test Energy Level question 13 22 9 1 10 5.32 2.276 Post-test Energy Level question 14 22 7 1 8 3.41 1.894 Post-test Energy Level question 15 22 8 2 10 6.55 2.154 Post-test Energy Level question 16 22 6 2 8 4.82 2.196 Post-test Energy Level question 17 22 7 1 8 3.73 1.804 Post-test Energy Level question 18 22 6 1 7 4.23 1.850
40 Instrumentation to acquire road profile data for use in whole body vibration apparatus

Road Profile Condition Item N Range Min. Max. Mean Std. Dev.
Post-test Mood Levels question 1 22 1 0 1 .09 .294 Post-test Mood Levels question 2 22 3 0 3 1.14 .889 Post-test Mood Levels question 3 22 1 0 1 .09 .294 Post-test Mood Levels question 4 22 4 0 4 1.50 1.225 Post-test Mood Levels question 5 22 3 0 3 .23 .752 Post-test Mood Levels question 6 22 3 0 3 .32 .780 Post-test Mood Levels question 7 22 1 0 1 .09 .294 Post-test Mood Levels question 8 22 3 0 3 1.18 1.053 Post-test Mood Levels question 9 22 2 0 2 .27 .631 Post-test Mood Levels question 10 22 4 0 4 2.09 1.151 Post-test Mood Levels question 11 22 2 0 2 .14 .468 Post-test Mood Levels question 12 22 3 0 3 .27 .767 Post-test Mood Levels question 13 22 1 0 1 .05 .213 Post-test Mood Levels question 14 22 1 0 1 .14 .351 Post-test Mood Levels question 15 22 3 0 3 1.05 .899 Post-test Mood Levels question 16 22 3 0 3 .18 .664 Post-test Mood Levels question 17 22 2 0 2 .27 .631 Post-test Mood Levels question 18 22 1 0 1 .09 .294 Post-test Mood Levels question 19 22 0 0 0 .00 .000 Post-test Mood Levels question 20 22 3 0 3 .95 .899 Post-test Mood Levels question 21 22 4 0 4 2.09 1.109 Post-test Mood Levels question 22 22 2 0 2 .09 .426 Post-test Mood Levels question 23 22 2 0 2 .91 .684 Post-test Mood Levels question 24 22 2 0 2 .27 .550
Instrumentation to acquire road profile data for use in whole body vibration apparatus 41
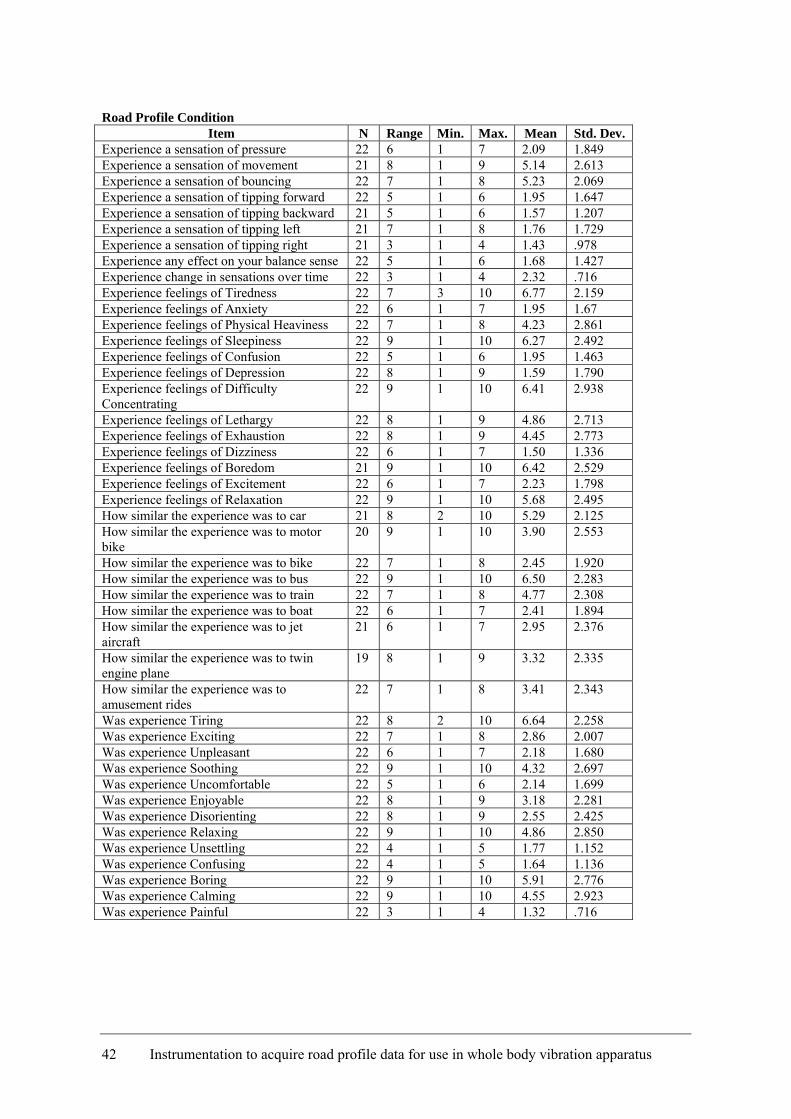
Road Profile Condition Item N Range Min. Max. Mean Std. Dev.
Experience a sensation of pressure 22 6 1 7 2.09 1.849 Experience a sensation of movement 21 8 1 9 5.14 2.613 Experience a sensation of bouncing 22 7 1 8 5.23 2.069 Experience a sensation of tipping forward 22 5 1 6 1.95 1.647 Experience a sensation of tipping backward 21 5 1 6 1.57 1.207 Experience a sensation of tipping left 21 7 1 8 1.76 1.729 Experience a sensation of tipping right 21 3 1 4 1.43 .978 Experience any effect on your balance sense 22 5 1 6 1.68 1.427 Experience change in sensations over time 22 3 1 4 2.32 .716 Experience feelings of Tiredness 22 7 3 10 6.77 2.159 Experience feelings of Anxiety 22 6 1 7 1.95 1.67 Experience feelings of Physical Heaviness 22 7 1 8 4.23 2.861 Experience feelings of Sleepiness 22 9 1 10 6.27 2.492 Experience feelings of Confusion 22 5 1 6 1.95 1.463 Experience feelings of Depression 22 8 1 9 1.59 1.790 Experience feelings of Difficulty Concentrating
22 9 1 10 6.41 2.938
Experience feelings of Lethargy 22 8 1 9 4.86 2.713 Experience feelings of Exhaustion 22 8 1 9 4.45 2.773 Experience feelings of Dizziness 22 6 1 7 1.50 1.336 Experience feelings of Boredom 21 9 1 10 6.42 2.529 Experience feelings of Excitement 22 6 1 7 2.23 1.798 Experience feelings of Relaxation 22 9 1 10 5.68 2.495 How similar the experience was to car 21 8 2 10 5.29 2.125 How similar the experience was to motor bike
20 9 1 10 3.90 2.553
How similar the experience was to bike 22 7 1 8 2.45 1.920 How similar the experience was to bus 22 9 1 10 6.50 2.283 How similar the experience was to train 22 7 1 8 4.77 2.308 How similar the experience was to boat 22 6 1 7 2.41 1.894 How similar the experience was to jet aircraft
21 6 1 7 2.95 2.376
How similar the experience was to twin engine plane
19 8 1 9 3.32 2.335
How similar the experience was to amusement rides
22 7 1 8 3.41 2.343
Was experience Tiring 22 8 2 10 6.64 2.258 Was experience Exciting 22 7 1 8 2.86 2.007 Was experience Unpleasant 22 6 1 7 2.18 1.680 Was experience Soothing 22 9 1 10 4.32 2.697 Was experience Uncomfortable 22 5 1 6 2.14 1.699 Was experience Enjoyable 22 8 1 9 3.18 2.281 Was experience Disorienting 22 8 1 9 2.55 2.425 Was experience Relaxing 22 9 1 10 4.86 2.850 Was experience Unsettling 22 4 1 5 1.77 1.152 Was experience Confusing 22 4 1 5 1.64 1.136 Was experience Boring 22 9 1 10 5.91 2.776 Was experience Calming 22 9 1 10 4.55 2.923 Was experience Painful 22 3 1 4 1.32 .716
42 Instrumentation to acquire road profile data for use in whole body vibration apparatus

4 Hz Condition Parameter N Range Min. Max. Mean Std. Dev.
Vibration Test Condition 22 0 2 2 2.00 .000 Time of Testing 22 9:21 9:00 18:21 13:36 2:46 Subject Gender 22 1 1 2 1.41 .503 Subject Age 22 44 1 45 21.86 8.593 Education Level 22 6 2 8 3.36 1.649 Is Subject Pregnant 22 0 2 2 2.00 .000 History of epileptic seizure 22 0 2 2 2.00 .000 Problems with balance 22 0 2 2 2.00 .000 Any major health problems 22 0 2 2 2.00 .000 Low blood pressure 22 1 1 2 1.95 .213 Feelings of dizziness or faintness 22 1 1 2 1.82 .395 Drivers licence 22 10 1 11 1.68 2.124 Number of years driving 17 24.0 1.0 25.0 5.294 6.7432 Fallen asleep at the wheel 19 1 1 2 1.95 .229 Number times fallen asleep 1 0 1 1 1.00 . Truck licence 22 0 2 2 2.00 .000 Number of years truck licence 0 Suffer from motion sickness 22 7 0 7 1.77 2.776 Enjoyment of amusement ride 21 9 1 10 7.76 2.256 Number of amusement rides 19 50 0 50 10.95 14.650 Sleep History 22 9 0 9 1.77 3.131 Sleep affected by shift work 21 1 1 2 1.81 .402 Avg hours sleep on work day 22 4.5 5.5 10.0 7.250 1.2607 Avg hours sleep on weekend 22 6.5 5.5 12.0 8.773 1.6310 General level of sleep satisfaction 21 6 2 8 6.33 1.906 Bed time for previous night (24 hr) 22 24:00 0:00 24:00 7:43 9:49 Time of getting up on current day (24 hr)
22 5:20 6:25 11:45 8:26 1:36
Number of hours slept previous night 22 5.0 4.0 9.0 6.920 1.3303 Level of satisfaction with previous night sleep
22 8 2 10 6.07 2.20
Number of hours been awake 22 10.0 1.0 11.0 5.318 3.0911 Pre-test level of sleepiness 22 9 1 10 4.73 2.208 Pre-test level of lethargy 22 7 1 8 3.86 2.031 Pre-test level of lacking energy 22 8 1 9 4.82 2.218 Pre-test level of tiredness 22 8 1 9 4.95 2.171 Pre-test level of fatigue 22 7 1 8 4.00 2.070
Instrumentation to acquire road profile data for use in whole body vibration apparatus 43

4 Hz Condition Item N Range Min. Max. Mean Std. Dev.
Pre-test Energy Level question 1 22 8 1 9 4.91 2.505 Pre-test Energy Level question 2 22 7 2 9 5.09 1.659 Pre-test Energy Level question 3 22 7 1 8 4.09 2.617 Pre-test Energy Level question 4 22 8 1 9 4.82 2.015 Pre-test Energy Level question 5 22 7 1 8 3.68 2.191 Pre-test Energy Level question 6 22 8 1 9 4.55 2.241 Pre-test Energy Level question 7 22 6 1 7 4.05 1.914 Pre-test Energy Level question 8 22 7 2 9 4.68 2.079 Pre-test Energy Level question 9 21 6 1 7 2.67 2.008 Pre-test Energy Level question 10 22 8 1 9 4.14 2.031 Pre-test Energy Level question 11 22 6 1 7 3.64 1.840 Pre-test Energy Level question 12 22 7 2 9 4.41 2.016 Pre-test Energy Level question 13 22 7 1 8 3.27 2.208 Pre-test Energy Level question 14 22 7 2 9 4.86 2.376 Pre-test Energy Level question 15 22 8 2 10 6.18 2.302 Pre-test Energy Level question 16 22 7 1 8 3.14 2.100 Pre-test Energy Level question 17 22 9 0 9 5.32 2.338 Pre-test Energy Level question 18 22 8 1 9 5.23 2.329
44 Instrumentation to acquire road profile data for use in whole body vibration apparatus

4 Hz Condition Item N Range Min. Max. Mean Std. Dev.
Pre-test Mood Levels question 1 22 2 0 2 .36 .658 Pre-test Mood Levels question 2 22 3 0 3 1.68 1.086 Pre-test Mood Levels question 3 22 2 0 2 .18 .501 Pre-test Mood Levels question 4 22 3 0 3 1.09 1.109 Pre-test Mood Levels question 5 22 3 0 3 .41 .908 Pre-test Mood Levels question 6 22 3 0 3 .59 .959 Pre-test Mood Levels question 7 22 2 0 2 .23 .528 Pre-test Mood Levels question 8 21 3 0 3 .81 .981 Pre-test Mood Levels question 9 22 3 0 3 .18 .664 Pre-test Mood Levels question 10 22 10 0 10 1.95 2.035 Pre-test Mood Levels question 11 22 2 0 2 .14 .468 Pre-test Mood Levels question 12 22 2 0 2 .32 .646 Pre-test Mood Levels question 13 22 2 0 2 .27 .550 Pre-test Mood Levels question 14 22 2 0 2 .23 .528 Pre-test Mood Levels question 15 22 3 0 3 1.50 1.102 Pre-test Mood Levels question 16 22 2 0 2 .27 .703 Pre-test Mood Levels question 17 22 3 0 3 .32 .716 Pre-test Mood Levels question 18 22 2 0 2 .32 .568 Pre-test Mood Levels question 19 22 2 0 2 .18 .501 Pre-test Mood Levels question 20 22 3 0 3 1.36 1.093 Pre-test Mood Levels question 21 22 4 0 4 1.64 .953 Pre-test Mood Levels question 22 22 1 0 1 .14 .351 Pre-test Mood Levels question 23 22 3 0 3 1.64 .953 Pre-test Mood Levels question 24 22 2 0 2 .32 .568
Instrumentation to acquire road profile data for use in whole body vibration apparatus 45

4 Hz Condition Item N Range Min. Max. Mean Std. Dev.
Post-test Energy Level question 1 22 8 2 10 6.55 2.087 Post-test Energy Level question 2 22 7 1 8 3.77 1.850 Post-test Energy Level question 3 22 8 1 9 5.36 2.300 Post-test Energy Level question 4 22 6 1 7 3.41 1.501 Post-test Energy Level question 5 22 8 1 9 5.14 2.376 Post-test Energy Level question 6 22 6 1 7 3.55 1.792 Post-test Energy Level question 7 22 6 2 8 4.50 1.504 Post-test Energy Level question 8 22 7 1 8 3.55 1.819 Post-test Energy Level question 9 22 8 1 9 4.09 2.448 Post-test Energy Level question 10 22 7 1 8 3.59 1.563 Post-test Energy Level question 11 22 8 1 9 4.91 1.925 Post-test Energy Level question 12 22 7 1 8 3.77 1.771 Post-test Energy Level question 13 22 9 1 10 5.82 2.648 Post-test Energy Level question 14 22 6 1 7 3.18 1.532 Post-test Energy Level question 15 22 9 1 10 5.59 2.482 Post-test Energy Level question 16 22 8 1 9 5.27 2.272 Post-test Energy Level question 17 22 7 1 8 3.95 1.731 Post-test Energy Level question 18 22 7 1 8 4.00 1.718
46 Instrumentation to acquire road profile data for use in whole body vibration apparatus
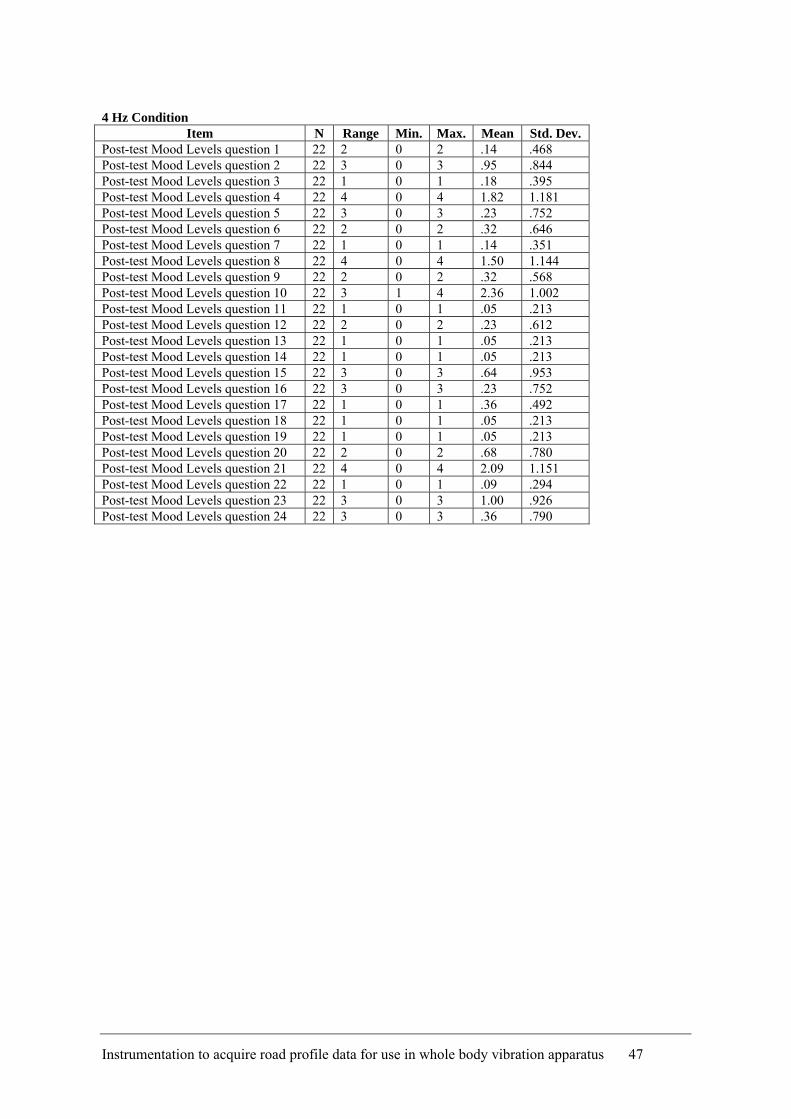
4 Hz Condition Item N Range Min. Max. Mean Std. Dev.
Post-test Mood Levels question 1 22 2 0 2 .14 .468 Post-test Mood Levels question 2 22 3 0 3 .95 .844 Post-test Mood Levels question 3 22 1 0 1 .18 .395 Post-test Mood Levels question 4 22 4 0 4 1.82 1.181 Post-test Mood Levels question 5 22 3 0 3 .23 .752 Post-test Mood Levels question 6 22 2 0 2 .32 .646 Post-test Mood Levels question 7 22 1 0 1 .14 .351 Post-test Mood Levels question 8 22 4 0 4 1.50 1.144 Post-test Mood Levels question 9 22 2 0 2 .32 .568 Post-test Mood Levels question 10 22 3 1 4 2.36 1.002 Post-test Mood Levels question 11 22 1 0 1 .05 .213 Post-test Mood Levels question 12 22 2 0 2 .23 .612 Post-test Mood Levels question 13 22 1 0 1 .05 .213 Post-test Mood Levels question 14 22 1 0 1 .05 .213 Post-test Mood Levels question 15 22 3 0 3 .64 .953 Post-test Mood Levels question 16 22 3 0 3 .23 .752 Post-test Mood Levels question 17 22 1 0 1 .36 .492 Post-test Mood Levels question 18 22 1 0 1 .05 .213 Post-test Mood Levels question 19 22 1 0 1 .05 .213 Post-test Mood Levels question 20 22 2 0 2 .68 .780 Post-test Mood Levels question 21 22 4 0 4 2.09 1.151 Post-test Mood Levels question 22 22 1 0 1 .09 .294 Post-test Mood Levels question 23 22 3 0 3 1.00 .926 Post-test Mood Levels question 24 22 3 0 3 .36 .790
Instrumentation to acquire road profile data for use in whole body vibration apparatus 47

4 Hz Condition
Item N Range Min. Max. Mean Std. Dev.
Experience a sensation of pressure 21 6 1 7 2.76 2.211 Experience a sensation of movement 22 8 1 9 4.95 2.716 Experience a sensation of bouncing 21 9 1 10 6.14 2.197 Experience a sensation of tipping forward 21 7 1 8 2.95 2.334 Experience a sensation of tipping backward 21 3 1 4 1.52 .814 Experience a sensation of tipping left 21 3 1 4 1.43 .811 Experience any change in your balance sense
21 6 1 7 1.86 1.797
Experience a sensation of tipping right 21 6 1 7 2.10 1.670 Experience change in sensations over time 21 2 1 3 2.14 .573 Experience feelings of Tiredness 22 8 2 10 7.05 2.081 Experience feelings of Anxiety 22 5 1 6 2.18 1.868 Experience feelings of Physical Heaviness 22 8 1 9 4.73 2.763 Experience feelings of Sleepiness 22 8 2 10 7.18 1.893 Experience feelings of Confusion 22 6 1 7 2.27 1.907 Experience feelings of Depression 22 7 1 8 1.50 1.504 Experience feelings of Difficulty Concentrating
22 8 1 9 6.41 2.085
Experience feelings of Lethargy 22 8 1 9 4.91 2.635 Experience feelings of Exhaustion 22 8 1 9 4.68 2.358 Experience feelings of Dizziness 22 6 1 7 1.82 1.651 Experience feelings of Boredom 22 9 1 10 6.50 2.632 Experience feelings of Excitement 22 6 1 7 2.23 1.688 Experience feelings of Relaxation 22 9 1 10 5.14 2.731 How similar the experience was to car 22 8 1 9 4.23 2.617 How similar the experience was to motor bike
21 9 1 10 3.52 2.750
How similar the experience was to bike 22 6 1 7 1.77 1.541 How similar the experience was to bus 22 9 1 10 5.77 2.159 How similar the experience was to train 22 9 1 10 4.95 2.554 How similar the experience was to boat 22 5 1 6 2.55 1.654 How similar the experience was to jet aircraft
21 6 1 7 2.81 1.990
How similar the experience was to twin engine plane
20 6 1 7 3.20 1.881
How similar the experience was to amusement rides
21 8 1 9 3.10 2.364
Was experience Tiring 22 9 1 10 6.50 2.405 Was experience Exciting 22 7 1 8 2.73 1.882 Was experience Unpleasant 22 5 1 6 1.95 1.647 Was experience Soothing 22 9 1 10 4.36 2.953 Was experience Uncomfortable 22 6 1 7 2.14 1.754 Was experience Enjoyable 22 8 1 9 3.09 2.114 Was experience Disorienting 22 8 1 9 2.32 2.255 Was experience Relaxing 22 9 1 10 4.77 2.724 Was experience Unsettling 22 5 1 6 2.00 1.574 Was experience Confusing 22 3 1 4 1.86 1.037 Was experience Boring 22 9 1 10 5.45 2.790 Was experience Calming 22 9 1 10 4.73 2.831 Was experience Painful 22 5 1 6 1.36 1.136
48 Instrumentation to acquire road profile data for use in whole body vibration apparatus

APPENDIX B: QUESTIONNAIRE
The questionnaire used in the study is shown on the succeeding pages. This was specifically developed for research into the effects of vibration on fatigue by Dr. Julie Pallant.
Instrumentation to acquire road profile data for use in whole body vibration apparatus 49

Changes in Task Performance and Attitudes in Response to Whole Body Vibrations
For queries concerning this project please contact
Dr John Patterson
(03) 9214 8862
50 Instrumentation to acquire road profile data for use in whole body vibration apparatus

Pre-exposure questionnaire
Today’s date: ________________ Current time: ________________
Demographics
Name: ____________________________
Gender: Male Female
Age: __________
Highest education level achieved:
Some secondary school
Completed secondary school
Additional trade training
Undergraduate University
Postgraduate University
Exclusion criteria
Are you pregnant (or is there a chance that you are pregnant)?
Yes No
Have you ever experienced an epileptic seizure?
Yes No
Do you currently have any problems with your sense of balance?
Yes No
Have you ever been diagnosed with any major health problems (eg. cancer, heart disease, stroke)?
Yes No
Do you have low blood pressure?
Yes No
Do you ever feel dizzy or faint?
Yes No
Driving experience
Instrumentation to acquire road profile data for use in whole body vibration apparatus 51

Do you have a driver’s licence?
Yes No
If yes:
How many years of driving experience have you had? _____________________
Have you ever fallen asleep while driving?
Yes No If Yes, how many times _______
Do you have a truck driving licence?
Yes No
If yes, how many years of truck driving experience have you had? _____________________
52 Instrumentation to acquire road profile data for use in whole body vibration apparatus
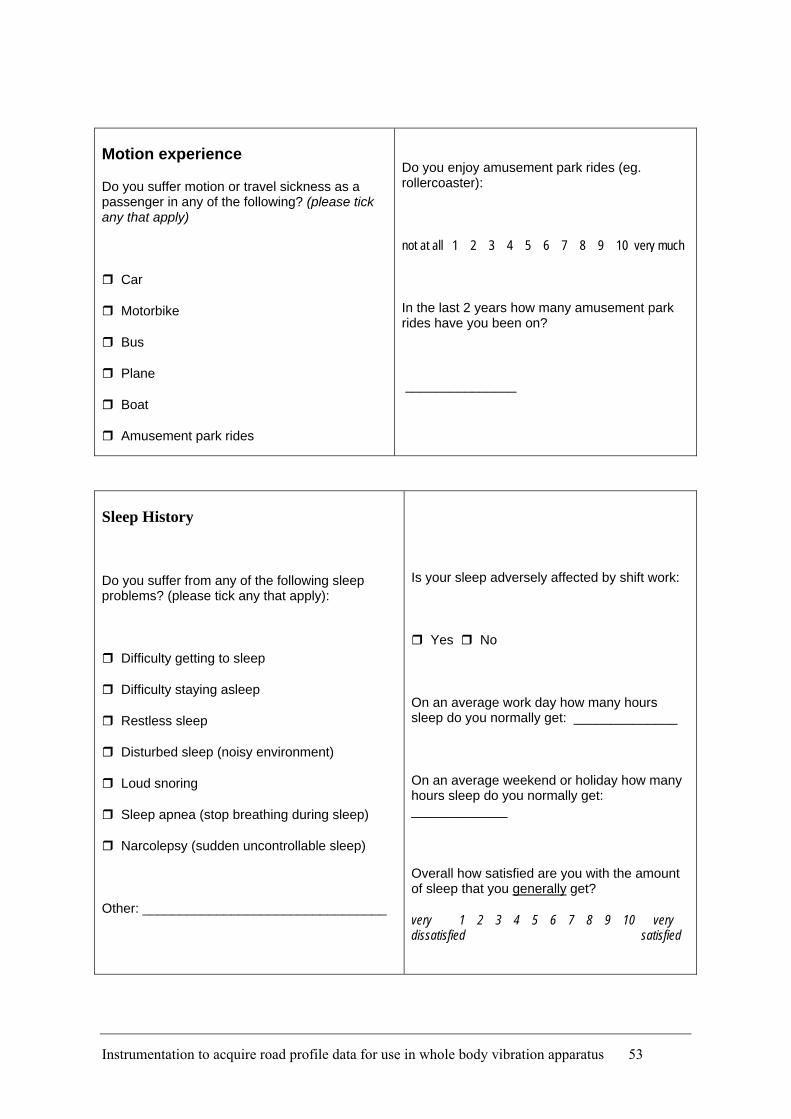
Motion experience
Do you suffer motion or travel sickness as a passenger in any of the following? (please tick any that apply)
Car
Motorbike
Bus
Plane
Boat
Amusement park rides
Do you enjoy amusement park rides (eg. rollercoaster):
not at all 1 2 3 4 5 6 7 8 9 10 very much
In the last 2 years how many amusement park rides have you been on?
_______________
Sleep History
Do you suffer from any of the following sleep problems? (please tick any that apply):
Difficulty getting to sleep
Difficulty staying asleep
Restless sleep
Disturbed sleep (noisy environment)
Loud snoring
Sleep apnea (stop breathing during sleep)
Narcolepsy (sudden uncontrollable sleep)
Other: _________________________________
Is your sleep adversely affected by shift work:
Yes No
On an average work day how many hours sleep do you normally get: ______________
On an average weekend or holiday how many hours sleep do you normally get: _____________
Overall how satisfied are you with the amount of sleep that you generally get?
very 1 2 3 4 5 6 7 8 9 10 very dissatisfied satisfied
Instrumentation to acquire road profile data for use in whole body vibration apparatus 53

Current state
What time did you go to sleep last night: ________
What time did you wake up this morning: _______
How many hours sleep did you get last night?
_________________
Overall how satisfied are you with the amount of sleep that you had last night?
very 1 2 3 4 5 6 7 8 9 10 very dissatisfied satisfied
How many hours have you been awake: _______
Please rate how you feel at the moment on the following scales:
Sleepy
not at all 1 2 3 4 5 6 7 8 9 10 extremely
Lethargic
not at all 1 2 3 4 5 6 7 8 9 10 extremely
Lacking energy
not at all 1 2 3 4 5 6 7 8 9 10 extremely
Tired
not at all 1 2 3 4 5 6 7 8 9 10 extremely
Fatigued
not at all 1 2 3 4 5 6 7 8 9 10 extremely
54 Instrumentation to acquire road profile data for use in whole body vibration apparatus

Current energy level Please rate how you feel now by writing a number from 1 (not at all) to 10 (extremely) on the line next to each of the statements provided below.
not at all 1 2 3 4 5 6 7 8 9 10 extremely
_____1. I feel sleepy
_____2. I feel active
_____3. I feel half asleep
_____4. I feel lively
_____5. I feel as though my eyes are very heavy
_____6. I feel full of pep
_____7. I feel half-awake
_____8. I feel energetic
_____9. I feel like I’m dead on my feet
_____10. I feel vigorous
_____11. I feel bushed
_____12. I feel peppy
_____13. I feel as though I am dozing off
_____14. I feel wide-awake
_____15. I feel carefree
_____16. I feel groggy
_____17. I feel alert
_____18. I feel wakeful
Current Mood
Below is a list of words that describe feelings people have. Please read each one carefully. Then circle ONE answer which best describes how you feel right now.
Not at all A little Moderately Quite a bit Extremely 0 1 2 3 4
1. Panicky
2. Lively
3. Confused
4. Worn out
5. Depressed
6. Downhearted
7. Annoyed
8. Exhausted
0 1 2 3 4
0 1 2 3 4
0 1 2 3 4
0 1 2 3 4
0 1 2 3 4
0 1 2 3 4
0 1 2 3 4
0 1 2 3 4
9. Mixed-up
10. Sleepy
11. Bitter
12. Unhappy
13. Anxious
14. Worried
15. Energetic
16. Miserable
0 1 2 3 4
0 1 2 3 4
0 1 2 3 4
0 1 2 3 4
0 1 2 3 4
0 1 2 3 4
0 1 2 3 4
0 1 2 3 4
17. Muddled
18. Nervous
19. Angry
20. Active
21. Tired
22. Bad tempered
23. Alert
24. Uncertain
0 1 2 3 4
0 1 2 3 4
0 1 2 3 4
0 1 2 3 4
0 1 2 3 4
0 1 2 3 4
0 1 2 3 4
0 1 2 3 4
Instrumentation to acquire road profile data for use in whole body vibration apparatus 55

Post-exposure questionnaire
Instructions While seated on the vibrating chair people experience different sensations. We are interested in finding out what it was like for you. Please answer the following questions concerning how you feel now and the sensations and perceptions you experienced while seated on the chair.
Current energy Please rate how you feel now by writing a number from 1 (not at all) to 10 (extremely) on the line next to each of the statements provided below.
not at all 1 2 3 4 5 6 7 8 9 10 extremely _____1. I feel sleepy
_____2. I feel active
_____3. I feel half asleep
_____4. I feel lively
_____5. I feel as though my eyes are very heavy
_____6. I feel full of pep
_____7. I feel half-awake
_____8. I feel energetic
_____9. I feel like I’m dead on my feet
_____10. I feel vigorous
_____11. I feel bushed
_____12. I feel peppy
_____13. I feel as though I am
dozing off
_____14. I feel wide-awake
_____15. I feel carefree
_____16. I feel groggy
_____17. I feel alert
_____18. I feel wakeful
Current Mood Below is a list of words that describe feelings people have. Please read each one carefully. Then circle ONE answer which best describes how you feel right now.
Not at all A little Moderately Quite a bit Extremely 0 1 2 3 4
1. Panicky
2. Lively
3. Confused
4. Worn out
5. Depressed
6. Downhearted
7. Annoyed
8. Exhausted
0 1 2 3 4
0 1 2 3 4
0 1 2 3 4
0 1 2 3 4
0 1 2 3 4
0 1 2 3 4
0 1 2 3 4
0 1 2 3 4
9. Mixed-up
10. Sleepy
11. Bitter
12. Unhappy
13. Anxious
14. Worried
15. Energetic
16. Miserable
0 1 2 3 4
0 1 2 3 4
0 1 2 3 4
0 1 2 3 4
0 1 2 3 4
0 1 2 3 4
0 1 2 3 4
0 1 2 3 4
17. Muddled
18. Nervous
19. Angry
20. Active
21. Tired
22. Bad tempered
23. Alert
24. Uncertain
0 1 2 3 4
0 1 2 3 4
0 1 2 3 4
0 1 2 3 4
0 1 2 3 4
0 1 2 3 4
0 1 2 3 4
0 1 2 3 4
Please describe your sensations and perceptions while on the vibrating chair: ___________________________________________________________________________________ ___________________________________________________________________________________
56 Instrumentation to acquire road profile data for use in whole body vibration apparatus

Sensations
While sitting on the chair did you experience a sensation of pressure? not at all 1 2 3 4 5 6 7 8 9 10 extremely
If yes, where did you experience this feeling? ________________________________________ Did you experience a feeling of movement? not at all 1 2 3 4 5 6 7 8 9 10 extremely
If yes, please describe: __________________________________________________________ Did you experience a sensation of bouncing? not at all 1 2 3 4 5 6 7 8 9 10 extremely Did you experience a sensation of tipping: forward not at all 1 2 3 4 5 6 7 8 9 10 extremely
backward not at all 1 2 3 4 5 6 7 8 9 10 extremely
left not at all 1 2 3 4 5 6 7 8 9 10 extremely
right not at all 1 2 3 4 5 6 7 8 9 10 extremely
Did you experience any effect on your sense of balance?
not at all 1 2 3 4 5 6 7 8 9 10 extremely During the time you were sitting on the chair did you experience:
An increase in sensation over time A decrease in sensation over time No change in sensation
No sensation at all While sitting on the chair did you experience any feelings of :
Tiredness not at all 1 2 3 4 5 6 7 8 9 10 extremely
Anxiety not at all 1 2 3 4 5 6 7 8 9 10 extremely
Physical heaviness not at all 1 2 3 4 5 6 7 8 9 10 extremely
Sleepiness not at all 1 2 3 4 5 6 7 8 9 10 extremely
Confusion not at all 1 2 3 4 5 6 7 8 9 10 extremely
Depression not at all 1 2 3 4 5 6 7 8 9 10 extremely
Difficulty concentrating not at all 1 2 3 4 5 6 7 8 9 10 extremely
Lethargy not at all 1 2 3 4 5 6 7 8 9 10 extremely
Exhaustion not at all 1 2 3 4 5 6 7 8 9 10 extremely
Dizziness not at all 1 2 3 4 5 6 7 8 9 10 extremely
Boredom not at all 1 2 3 4 5 6 7 8 9 10 extremely
Excitement not at all 1 2 3 4 5 6 7 8 9 10 extremely
Relaxation not at all 1 2 3 4 5 6 7 8 9 10 extremely
Comparison with past experiences
Instrumentation to acquire road profile data for use in whole body vibration apparatus 57
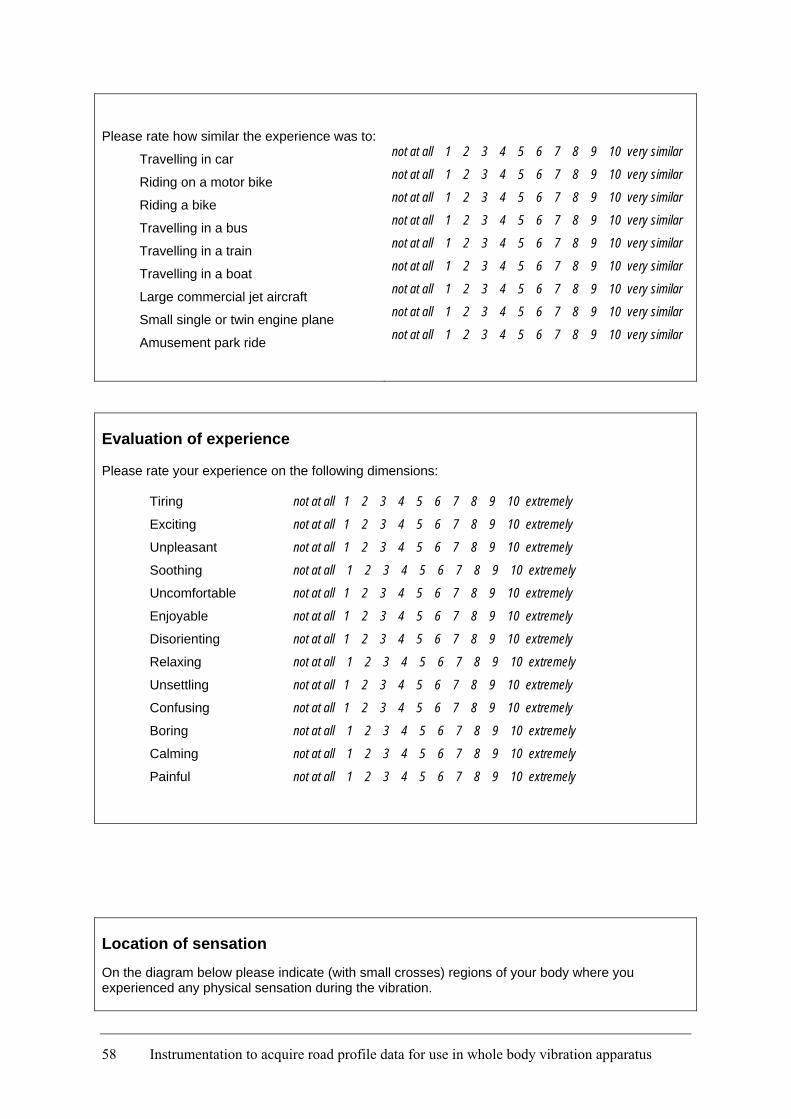
Please rate how similar the experience was to:
Travelling in car
Riding on a motor bike
Riding a bike
Travelling in a bus
Travelling in a train
Travelling in a boat
Large commercial jet aircraft
Small single or twin engine plane
Amusement park ride
not at all 1 2 3 4 5 6 7 8 9 10 very similar
not at all 1 2 3 4 5 6 7 8 9 10 very similar
not at all 1 2 3 4 5 6 7 8 9 10 very similar
not at all 1 2 3 4 5 6 7 8 9 10 very similar
not at all 1 2 3 4 5 6 7 8 9 10 very similar
not at all 1 2 3 4 5 6 7 8 9 10 very similar
not at all 1 2 3 4 5 6 7 8 9 10 very similar
not at all 1 2 3 4 5 6 7 8 9 10 very similar
not at all 1 2 3 4 5 6 7 8 9 10 very similar
Evaluation of experience Please rate your experience on the following dimensions:
Tiring not at all 1 2 3 4 5 6 7 8 9 10 extremely
Exciting not at all 1 2 3 4 5 6 7 8 9 10 extremely
Unpleasant not at all 1 2 3 4 5 6 7 8 9 10 extremely
Soothing not at all 1 2 3 4 5 6 7 8 9 10 extremely
Uncomfortable not at all 1 2 3 4 5 6 7 8 9 10 extremely
Enjoyable not at all 1 2 3 4 5 6 7 8 9 10 extremely
Disorienting not at all 1 2 3 4 5 6 7 8 9 10 extremely
Relaxing not at all 1 2 3 4 5 6 7 8 9 10 extremely
Unsettling not at all 1 2 3 4 5 6 7 8 9 10 extremely
Confusing not at all 1 2 3 4 5 6 7 8 9 10 extremely
Boring not at all 1 2 3 4 5 6 7 8 9 10 extremely
Calming not at all 1 2 3 4 5 6 7 8 9 10 extremely
Painful not at all 1 2 3 4 5 6 7 8 9 10 extremely
Location of sensation On the diagram below please indicate (with small crosses) regions of your body where you experienced any physical sensation during the vibration.
58 Instrumentation to acquire road profile data for use in whole body vibration apparatus

For each of the locations that you identify please rate the intensity of the sensation using the following scale. Write this number beside the figure and draw a line to the corresponding cross marked on the figure. Barely noticeable Intense
1 2 3 4 5 6 7 8 9 10
Instrumentation to acquire road profile data for use in whole body vibration apparatus 59