instructor guide chapter 14 northern hemisphere glaciation · instructor guide chapter 14 northern...
TRANSCRIPT
Ch 14 Northern Hemisphere Glaciation Instructor Guide
Page 1 of 30
Instructor Guide Chapter 14 Northern Hemisphere Glaciation
SUMMARY This investigation introduces the characteristics and possible causes of the northern hemi-
sphere glaciation during the Cenozoic. In Part 14.1, you will make predictions about where
and why continental ice sheets form. In Part 14.2, you will examine geological, geochemical, and
paleontological data to infer the spatial extent and temporal history of this glaciation. In Part 14.3, you will read abstracts critically from seven peer-reviewed papers to decipher proposed
mechanisms for the expansion of northern hemisphere glaciation at approximately 2.6 Ma and re-
flect on the scientific value of multiple working hypotheses.
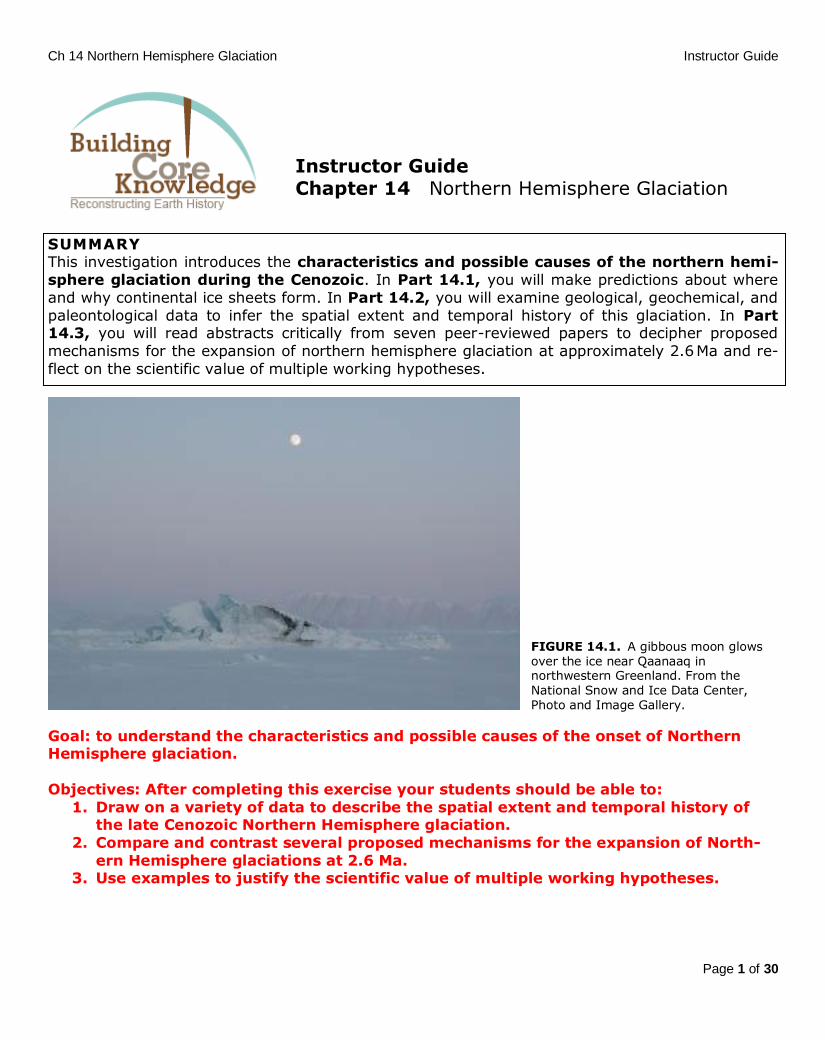
FIGURE 14.1. A gibbous moon glows over the ice near Qaanaaq in northwestern Greenland. From the National Snow and Ice Data Center, Photo and Image Gallery.
Goal: to understand the characteristics and possible causes of the onset of Northern Hemisphere glaciation.
Objectives: After completing this exercise your students should be able to:
1. Draw on a variety of data to describe the spatial extent and temporal history of the late Cenozoic Northern Hemisphere glaciation.
2. Compare and contrast several proposed mechanisms for the expansion of North-
ern Hemisphere glaciations at 2.6 Ma. 3. Use examples to justify the scientific value of multiple working hypotheses.
Ch 14 Northern Hemisphere Glaciation Instructor Guide
Page 2 of 30
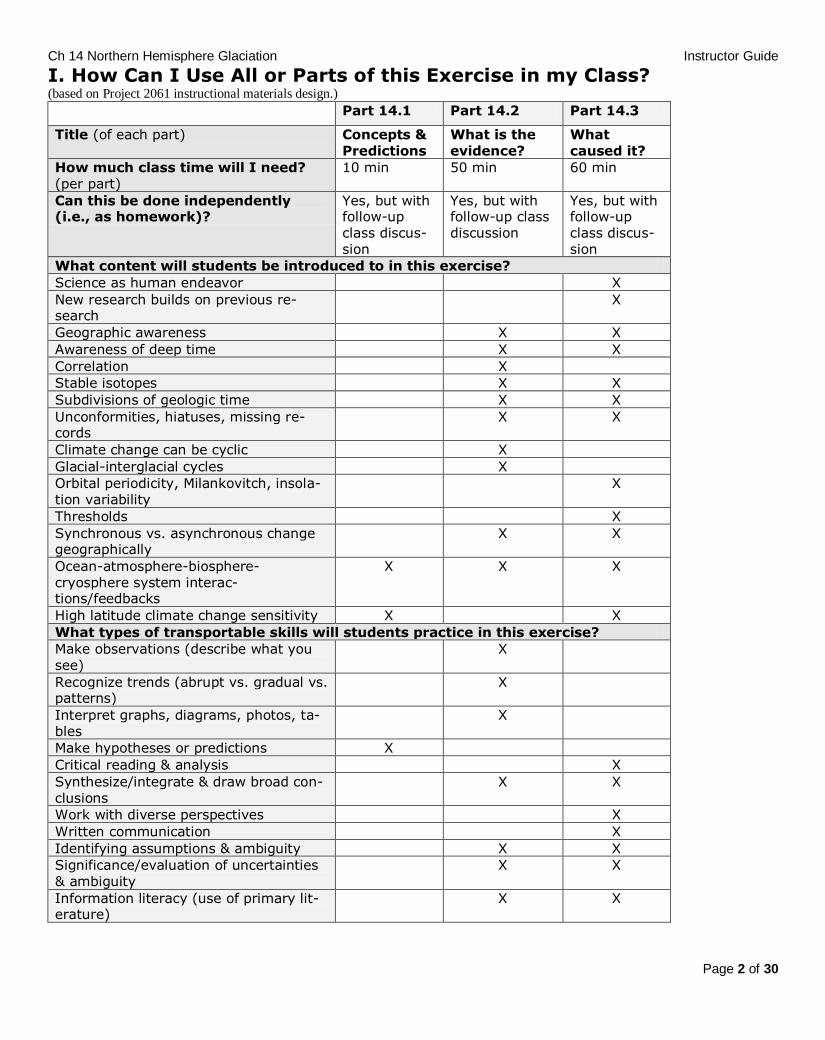
I. How Can I Use All or Parts of this Exercise in my Class? (based on Project 2061 instructional materials design.) Part 14.1 Part 14.2 Part 14.3
Title (of each part) Concepts & Predictions
What is the evidence?
What caused it?
How much class time will I need? (per part)
10 min 50 min 60 min
Can this be done independently (i.e., as homework)?
Yes, but with follow-up class discus-sion
Yes, but with follow-up class discussion
Yes, but with follow-up class discus-sion
What content will students be introduced to in this exercise?
Science as human endeavor X
New research builds on previous re-search
X
Geographic awareness X X
Awareness of deep time X X
Correlation X
Stable isotopes X X
Subdivisions of geologic time X X
Unconformities, hiatuses, missing re-cords
X X
Climate change can be cyclic X
Glacial-interglacial cycles X
Orbital periodicity, Milankovitch, insola-tion variability
X
Thresholds X
Synchronous vs. asynchronous change geographically
X X
Ocean-atmosphere-biosphere-
cryosphere system interac-tions/feedbacks
X X X
High latitude climate change sensitivity X X
What types of transportable skills will students practice in this exercise?
Make observations (describe what you see)
X
Recognize trends (abrupt vs. gradual vs. patterns)
X
Interpret graphs, diagrams, photos, ta-bles
X
Make hypotheses or predictions X
Critical reading & analysis X
Synthesize/integrate & draw broad con-
clusions
X X
Work with diverse perspectives X
Written communication X
Identifying assumptions & ambiguity X X
Significance/evaluation of uncertainties & ambiguity
X X
Information literacy (use of primary lit-erature)
X X

Ch 14 Northern Hemisphere Glaciation Instructor Guide
Page 3 of 30
What general prerequisite knowl-edge & skills are required?
None None None
What Anchor Exercises (or Parts of Exercises) should be done prior to this to guide student interpretation & reasoning?
None None required, but helpful to do Part 8.1
None required, but helpful to do Parts 8.1 &
8.2
What other resources or materials do I need? (e.g., internet access to show on-line video; access to maps, colored pencils)
None None None
What student misconception does
this exercise address?
Requirements
for perennial glacial ice formation
Concepts re-
lated to the spatial and temporal pat-terns of North-ern Hemi-sphere glacia-tion
Concepts re-
lated to the cause of Northern Hemisphere glaciation; scientists can disagree on the best ex-planation of natural events (mul-tiple working hypotheses)
What forms of data are used in this? (e.g., graphs, tables, photos, maps)
None Graphs, tables, photos, maps
Abstracts from peer-reviewed pa-pers
What geographic locations are these datasets from?
None Several North-ern Hemi-sphere loca-
tions
Northern Hemisphere & equatorial
locations
How can I use this exercise to iden-tify my students’ prior knowledge (i.e., student misconceptions, com-monly held beliefs)?
Part 8.1 is designed as an initial inquiry aimed at drawing out student beliefs and prior knowl-edge. Parts 8.2 and 8.3 follow-up on the same topics as Part 8.1 and can be used by students to construct new conceptual knowledge.
How can I encourage students to reflect on what they have learned in this exercise? [Formative Assess-ment]
Each exercise part can be concluded by asking: On note card (with or without name) to turn in, answer: What did you find most interest-ing/helpful in the exercise we did above? Does what we did model scientific practice? If so, how and if not, why not?
How can I assess student learning after they complete all or part of the exercise? [Summative Assess-ment]
See suggestions in Summative Assessment section below.
Where can I go to for more informa-tion on the science in this exercise?
See the Supplemental Materials and Reference sections below.
Ch 14 Northern Hemisphere Glaciation Instructor Guide
Page 4 of 30
II. Annotated Student Worksheets (i.e., the ANSWER KEY)
This section includes the annotated copy of the student worksheets with answers for
each Part of this Chapter. This instructor guide contain the same sections as in the student book chapter, but also includes additional information such as: useful tips,
discussion points, notes on places where students might get stuck, what specific points students
should come away with from an exercise so as to be prepared for further work, as well as ideas and/or material for mini-lectures.
Part 14.1. Concepts and Predictions
Introduction This exercise examines the expansion and contraction of large land-based ice sheets, such as
the Greenland Ice Sheet, which is the last vestige of the great northern hemisphere ice sheets of
the Pleistocene.
Creating class lists (use white board, poster paper, etc.) of the responses to the following ques-
tions may help facilitate discussion for Part 14.1. These saved lists can also be revisited after
students have completed Parts 14.2 and 14.3 to reflect and discuss what they have learned.
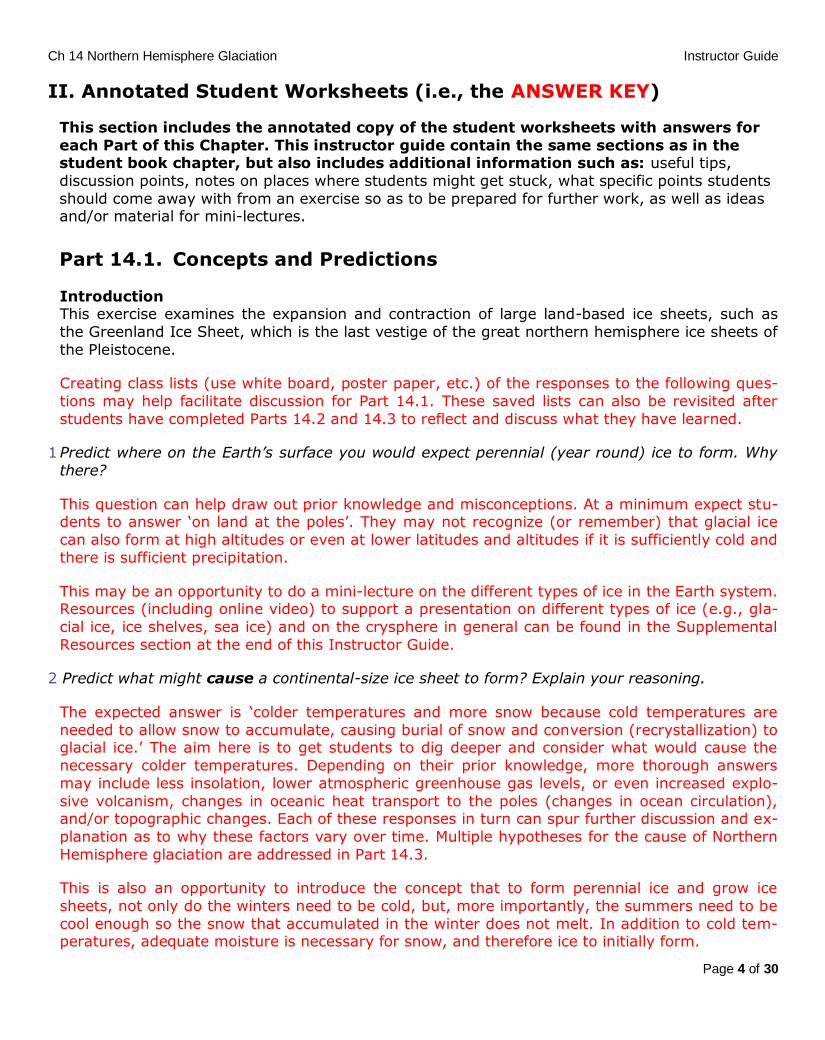
1 Predict where on the Earth’s surface you would expect perennial (year round) ice to form. Why
there?
This question can help draw out prior knowledge and misconceptions. At a minimum expect stu-dents to answer ‘on land at the poles’. They may not recognize (or remember) that glacial ice
can also form at high altitudes or even at lower latitudes and altitudes if it is sufficiently cold and
there is sufficient precipitation.
This may be an opportunity to do a mini-lecture on the different types of ice in the Earth system. Resources (including online video) to support a presentation on different types of ice (e.g., gla-
cial ice, ice shelves, sea ice) and on the crysphere in general can be found in the Supplemental
Resources section at the end of this Instructor Guide.
2 Predict what might cause a continental-size ice sheet to form? Explain your reasoning.
The expected answer is ‘colder temperatures and more snow because cold temperatures are
needed to allow snow to accumulate, causing burial of snow and conversion (recrystallization) to glacial ice.’ The aim here is to get students to dig deeper and consider what would cause the
necessary colder temperatures. Depending on their prior knowledge, more thorough answers
may include less insolation, lower atmospheric greenhouse gas levels, or even increased explo-
sive volcanism, changes in oceanic heat transport to the poles (changes in ocean circulation), and/or topographic changes. Each of these responses in turn can spur further discussion and ex-
planation as to why these factors vary over time. Multiple hypotheses for the cause of Northern
Hemisphere glaciation are addressed in Part 14.3.
This is also an opportunity to introduce the concept that to form perennial ice and grow ice
sheets, not only do the winters need to be cold, but, more importantly, the summers need to be
cool enough so the snow that accumulated in the winter does not melt. In addition to cold tem-peratures, adequate moisture is necessary for snow, and therefore ice to initially form.
Ch 14 Northern Hemisphere Glaciation Instructor Guide
Page 5 of 30
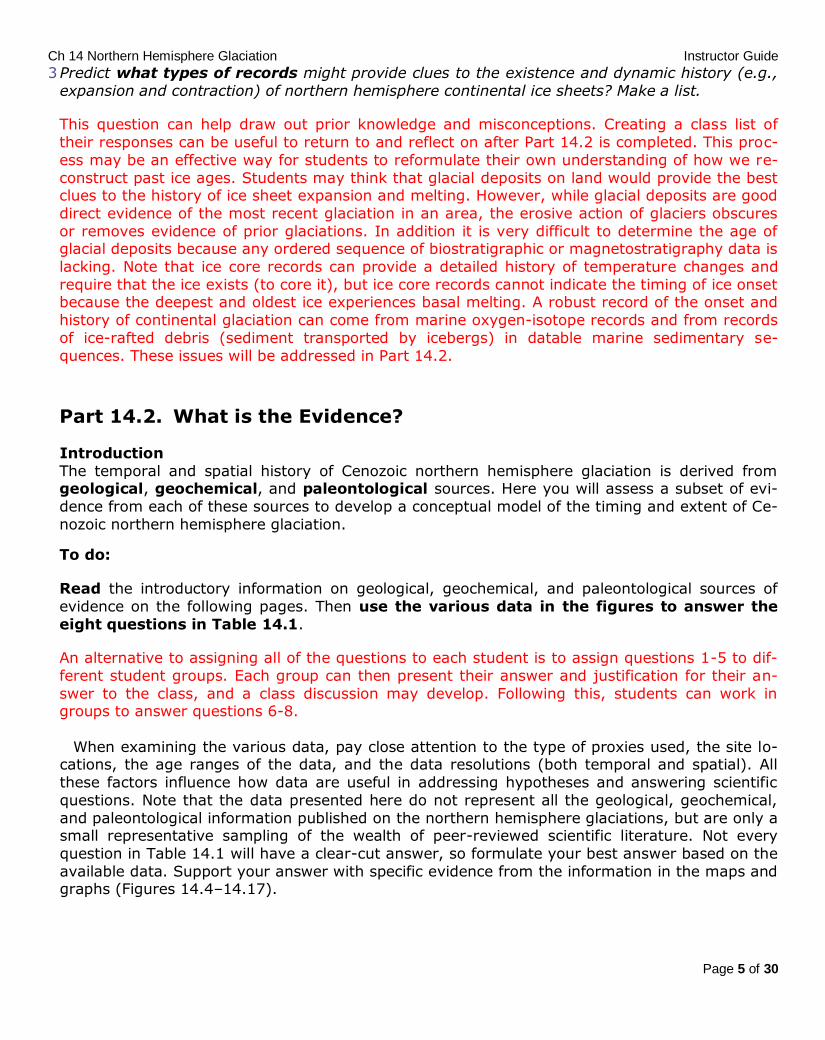
3 Predict what types of records might provide clues to the existence and dynamic history (e.g.,
expansion and contraction) of northern hemisphere continental ice sheets? Make a list.
This question can help draw out prior knowledge and misconceptions. Creating a class list of
their responses can be useful to return to and reflect on after Part 14.2 is completed. This proc-
ess may be an effective way for students to reformulate their own understanding of how we re-
construct past ice ages. Students may think that glacial deposits on land would provide the best clues to the history of ice sheet expansion and melting. However, while glacial deposits are good
direct evidence of the most recent glaciation in an area, the erosive action of glaciers obscures
or removes evidence of prior glaciations. In addition it is very difficult to determine the age of glacial deposits because any ordered sequence of biostratigraphic or magnetostratigraphy data is
lacking. Note that ice core records can provide a detailed history of temperature changes and
require that the ice exists (to core it), but ice core records cannot indicate the timing of ice onset because the deepest and oldest ice experiences basal melting. A robust record of the onset and
history of continental glaciation can come from marine oxygen-isotope records and from records
of ice-rafted debris (sediment transported by icebergs) in datable marine sedimentary se-
quences. These issues will be addressed in Part 14.2.
Part 14.2. What is the Evidence?
Introduction
The temporal and spatial history of Cenozoic northern hemisphere glaciation is derived from geological, geochemical, and paleontological sources. Here you will assess a subset of evi-
dence from each of these sources to develop a conceptual model of the timing and extent of Ce-
nozoic northern hemisphere glaciation.
To do:
Read the introductory information on geological, geochemical, and paleontological sources of
evidence on the following pages. Then use the various data in the figures to answer the
eight questions in Table 14.1.
An alternative to assigning all of the questions to each student is to assign questions 1-5 to dif-
ferent student groups. Each group can then present their answer and justification for their an-
swer to the class, and a class discussion may develop. Following this, students can work in groups to answer questions 6-8.
When examining the various data, pay close attention to the type of proxies used, the site lo-cations, the age ranges of the data, and the data resolutions (both temporal and spatial). All
these factors influence how data are useful in addressing hypotheses and answering scientific
questions. Note that the data presented here do not represent all the geological, geochemical,
and paleontological information published on the northern hemisphere glaciations, but are only a small representative sampling of the wealth of peer-reviewed scientific literature. Not every
question in Table 14.1 will have a clear-cut answer, so formulate your best answer based on the
available data. Support your answer with specific evidence from the information in the maps and graphs (Figures 14.4–14.17).

Ch 14 Northern Hemisphere Glaciation Instructor Guide
Page 6 of 30
Table 14.1 Data interpretations
Question Answer Evidence
1 How far south did ice
sheets extend in North America during the Pleisto-
cene?
(see Figures 14.4 & 14.5)
~40 deg North Reconstruction of maximum
extent of glacial deposits (Fig. 14.5) and the regional exam-
ple from the glacial map of
Ohio (Fig. 14.4).
2 When in the Cenozoic (last 65.5 million years) did
glacial ice first form in the
northern hemisphere?
(see Figures 14.7–14.13)
Perhaps ~47 million years ago, however given the
Arctic location this may
have been sea ice and not
glacial ice. Note that this question and #4 help
make the point that small
localized ice sheets may have existed long before
large scale, widespread
glaciation took place in the Northern Hemisphere.
IRD records from the Arctic (Fig. 14.7), Greenland Sea
(Fig. 14.8-14.9).
3 Where did the first
Cenozoic northern hemi-
sphere ice form? (see Figures 14.7–14.13)
Not an easy question to
answer. Would want more
evidence. It could be in the Arctic region, but sea
ice as a transporter of
IRD complicates interpre-
tations At least parts of NE Greenland were likely
glaciated by the 38 Ma.
To determine the nuclea-tion areas for ice sheets
we would want more evi-
dence on the source are
(i.e., provenance) of the IRD and confirmation that
the oldest IRD is derived
from glacial ice and not sea ice.
IRD records from the Arctic
(Fig. 14.7), Greenland Sea
(Fig. 14.8-14.9).
Ch 14 Northern Hemisphere Glaciation Instructor Guide
Page 7 of 30
4 When in the Cenozoic did
northern hemisphere glacia-tion become widespread?
(see Figures 14.7–14.13)
Between 3 and 2.5 Ma.
Note that this is close to the time of the Plio-
Pleistocene stratigraphic
boundary, which was re-
cently moved (Mascarelli, 2009) to 2.6 from 1.8 Ma
based on the evidence for
the climatic shift that oc-curred at this time.
IRD records from the northern
North Atlantic (Figs. 14.11) and North Pacific (Fig. 14.13).
5 Once northern hemisphere
glaciation was widespread,
did the northern hemi-sphere: (a) remain persis-
tently icy and cold, (b) cycle
regularly between icy/cold
and less icy/warm, or (c) ir-regularly switch from
icy/cold to less icy/warm?
(see Figures 14.4–14.17)
Cycled between icy/cold
and less icy/warm. How-
ever, at a finer resolution there appear to be less
regular oscillations.
Global marine oxygen isotope
records (Fig. 14.14) show cy-
cles with a repeated orbital periodicity (see also Exercise
on Climate Cycles). The higher
resolution records from pollen
(Fig. 14.17), and oxygen iso-topes in ice cores (Fig. 14.16)
show a more irregular oscilla-
tion during the last glacial-interglacial cycle. Note that
these millennial oscillations
are termed Dansgaard-Oeschger (DO) oscillations and
are more pronounced during
glacial periods than during in-
terglacial periods.
Ch 14 Northern Hemisphere Glaciation Instructor Guide
Page 8 of 30
Question Answer and Interpretation
6 What challenges might
there be for reconstructing a glacial history from land-
based deposits compared to
reconstructing a glacial his-tory from marine deposits?
While the dating of pollen records from lake sediments
can be well-constrained by biostratigraphic and isotopic age-depth datums, non-lacustrine terrestrial records of
continental glaciation in the Northern Hemisphere are in-
complete and generally poorly dated. This is largely be-cause of disturbance (including erosion) of older glacial
deposits by subsequent glaciations. This is an opportunity
to introduce to students additional dating techniques. The sediments are often not in situ, but are displaced from
other locations. Therefore ages of components in the tills
(e.g., fossils, minerals) may indicate ages older than the
moraine deposit itself. However there are other dating techniques that can be used, for example:
interbedded tills and lava flows in Iceland have been
dated using paleomagnetic signature of the basalts, and relative stratigraphic relationships (e.g., McDougall
and Wensink, 1966),
if a moraine buried organic material one could use
radiometric C-dating, relative weathering,
lichenometry,
cosmogenic isotope analysis, optically stimulated luminescence (OSL) methods.
7 What is the value in inves-tigating northern hemisphere
glaciation from a muiltproxy
approach?
Different proxies provide different clues to past climatic and environmental change. Just as a detective at a crime
scene values corroborating evidence so does a scientist re-
constructing past events.
8 What other types of infor-
mation would you like to ex-amine to compare with the
data here? List and explain.
Answers here may vary widely. Additional data from par-
ticular regions and time periods may be helpful to con-strain the spatial and temporal variability of the Northern
Hemisphere. Data on the source area of IRD would be
helpful to pinpoint the location of past glaciers.
Several other discussion points may come up as students complete this exercise that could serve
as a jumping off point for lecture or other exercise investigations. For example, oxygen isotope data is shown both in Figure. 14.14 and Figure 14.16, however because these data are derived
from different archives: marine microfossil (Fig 14.14) vs. glacial ice (Fig. 14.16), the δ18O values
are different as a result of isotopic-fractionated in the hydrologic cycle. Oxygen isotopes as a proxy for climate are specifically explored in Chapter 6.
Ch 14 Northern Hemisphere Glaciation Instructor Guide
Page 9 of 30
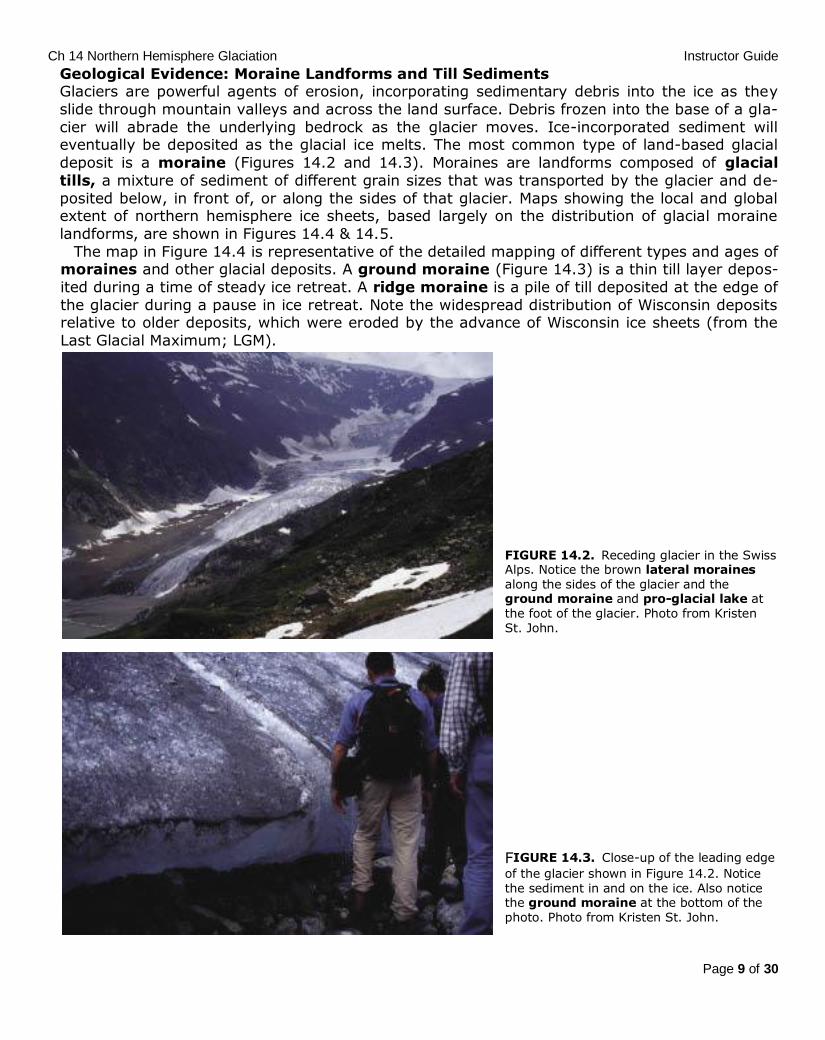
Geological Evidence: Moraine Landforms and Till Sediments Glaciers are powerful agents of erosion, incorporating sedimentary debris into the ice as they
slide through mountain valleys and across the land surface. Debris frozen into the base of a gla-
cier will abrade the underlying bedrock as the glacier moves. Ice-incorporated sediment will eventually be deposited as the glacial ice melts. The most common type of land-based glacial
deposit is a moraine (Figures 14.2 and 14.3). Moraines are landforms composed of glacial
tills, a mixture of sediment of different grain sizes that was transported by the glacier and de-
posited below, in front of, or along the sides of that glacier. Maps showing the local and global extent of northern hemisphere ice sheets, based largely on the distribution of glacial moraine
landforms, are shown in Figures 14.4 & 14.5.
The map in Figure 14.4 is representative of the detailed mapping of different types and ages of moraines and other glacial deposits. A ground moraine (Figure 14.3) is a thin till layer depos-
ited during a time of steady ice retreat. A ridge moraine is a pile of till deposited at the edge of
the glacier during a pause in ice retreat. Note the widespread distribution of Wisconsin deposits relative to older deposits, which were eroded by the advance of Wisconsin ice sheets (from the
Last Glacial Maximum; LGM).
FIGURE 14.2. Receding glacier in the Swiss Alps. Notice the brown lateral moraines along the sides of the glacier and the ground moraine and pro-glacial lake at the foot of the glacier. Photo from Kristen St. John.
FIGURE 14.3. Close-up of the leading edge
of the glacier shown in Figure 14.2. Notice the sediment in and on the ice. Also notice the ground moraine at the bottom of the photo. Photo from Kristen St. John.

Ch 14 Northern Hemisphere Glaciation Instructor Guide
Page 10 of 30
FIGURE 14.4. Map showing the distribution of glacial deposits in Ohio. Map courtesy of the Geological Survey, Ohio Division of Natural Resources.
Ch 14 Northern Hemisphere Glaciation Instructor Guide
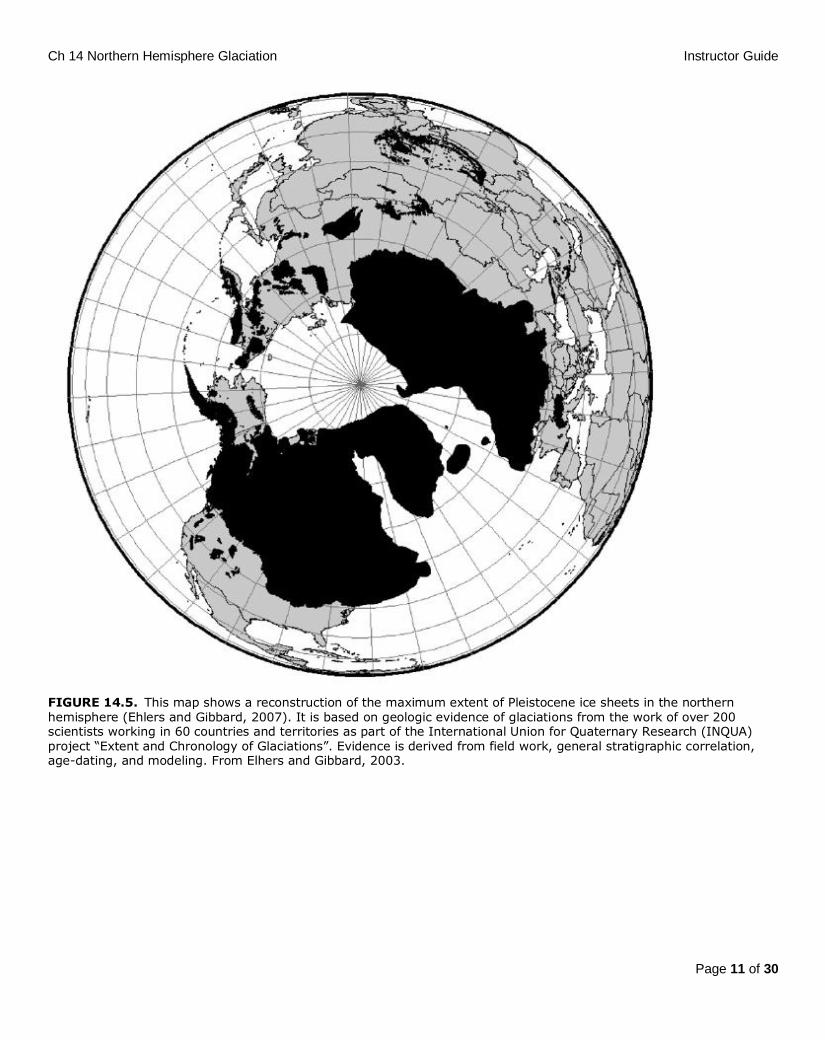
Page 11 of 30
FIGURE 14.5. This map shows a reconstruction of the maximum extent of Pleistocene ice sheets in the northern hemisphere (Ehlers and Gibbard, 2007). It is based on geologic evidence of glaciations from the work of over 200 scientists working in 60 countries and territories as part of the International Union for Quaternary Research (INQUA) project “Extent and Chronology of Glaciations”. Evidence is derived from field work, general stratigraphic correlation, age-dating, and modeling. From Elhers and Gibbard, 2003.
Ch 14 Northern Hemisphere Glaciation Instructor Guide
Page 12 of 30
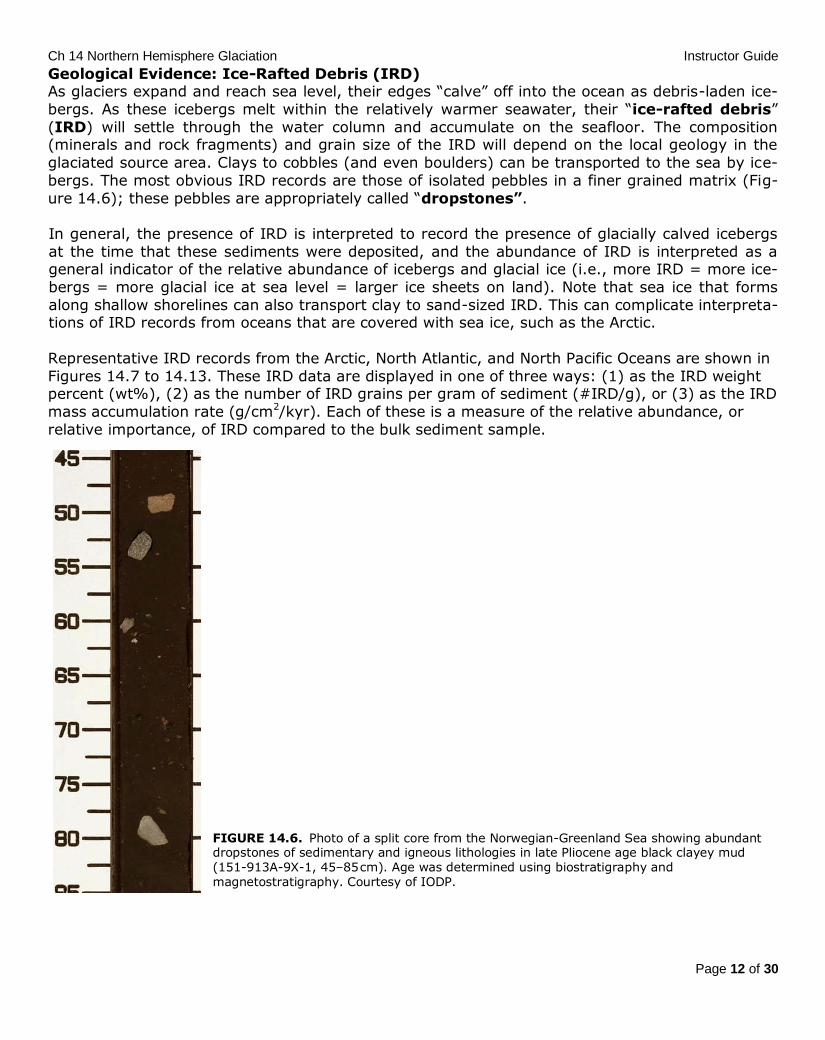
Geological Evidence: Ice-Rafted Debris (IRD) As glaciers expand and reach sea level, their edges “calve” off into the ocean as debris-laden ice-
bergs. As these icebergs melt within the relatively warmer seawater, their “ice-rafted debris”
(IRD) will settle through the water column and accumulate on the seafloor. The composition (minerals and rock fragments) and grain size of the IRD will depend on the local geology in the
glaciated source area. Clays to cobbles (and even boulders) can be transported to the sea by ice-
bergs. The most obvious IRD records are those of isolated pebbles in a finer grained matrix (Fig-
ure 14.6); these pebbles are appropriately called “dropstones”.
In general, the presence of IRD is interpreted to record the presence of glacially calved icebergs
at the time that these sediments were deposited, and the abundance of IRD is interpreted as a general indicator of the relative abundance of icebergs and glacial ice (i.e., more IRD = more ice-
bergs = more glacial ice at sea level = larger ice sheets on land). Note that sea ice that forms
along shallow shorelines can also transport clay to sand-sized IRD. This can complicate interpreta-tions of IRD records from oceans that are covered with sea ice, such as the Arctic.
Representative IRD records from the Arctic, North Atlantic, and North Pacific Oceans are shown in
Figures 14.7 to 14.13. These IRD data are displayed in one of three ways: (1) as the IRD weight percent (wt%), (2) as the number of IRD grains per gram of sediment (#IRD/g), or (3) as the IRD
mass accumulation rate (g/cm2/kyr). Each of these is a measure of the relative abundance, or
relative importance, of IRD compared to the bulk sediment sample. FIGURE 14.6. Photo of a split core from the Norwegian-Greenland Sea showing abundant dropstones of sedimentary and igneous lithologies in late Pliocene age black clayey mud (151-913A-9X-1, 45–85 cm). Age was determined using biostratigraphy and magnetostratigraphy. Courtesy of IODP.

Ch 14 Northern Hemisphere Glaciation Instructor Guide
Page 13 of 30
FIGURE 14.7. Compilation of Miocene to Pleistocene IRD records from the Norwegian-Greenland Seas (Site 908 is west of Svalbard, Site 907 is north of Iceland, Site 643 is northeast of Iceland) and Arctic Ocean (site 302 is on the Lomonosov Ridge in the central Arctic). (originally drawn by Matt O’Regan; from Polyak et al., 2010). Sediments at Exp. 302, Site 908, and Site 643 have the same age range as the Pliocene–Pleistocene sediments at Site 907. Note that Ma = million years ago.
Ch 14 Northern Hemisphere Glaciation Instructor Guide
Page 14 of 30
Site 302 IRD MAR (g/cm2/kyr)
0.00 0.02 0.04 0.06 0.08 0.10 0.12 0.14
Age (M
a)
0
10
20
30
40
50
150-250 micron fraction
>250 micron fraction
isolated granules and pebbles
hiatus
subunit 1/5 reworked?
hiatus
Site 302 IRD MAR (g/cm2/kyr)
0.00 0.02 0.04 0.06 0.08 0.10 0.12 0.14
Age (M
a)
0
10
20
30
40
50
150-250 micron fraction
>250 micron fraction
isolated granules and pebbles
hiatushiatus
subunit 1/5 reworked?
hiatus
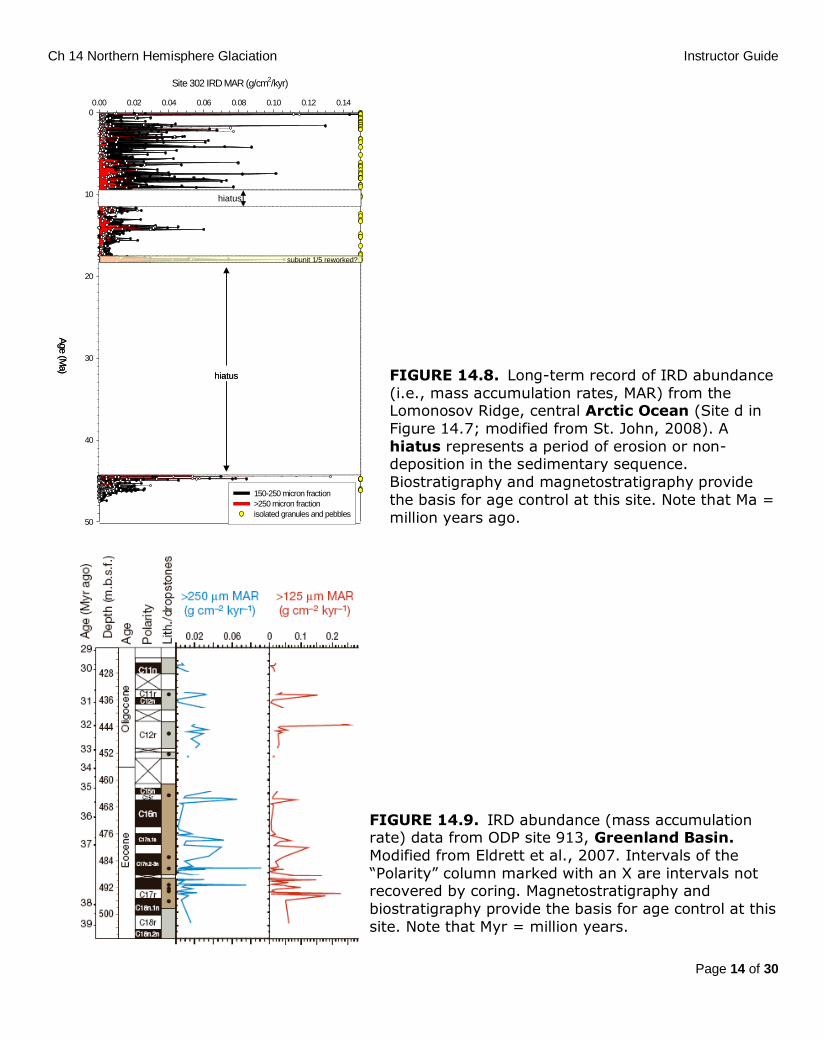
FIGURE 14.8. Long-term record of IRD abundance
(i.e., mass accumulation rates, MAR) from the Lomonosov Ridge, central Arctic Ocean (Site d in
Figure 14.7; modified from St. John, 2008). A
hiatus represents a period of erosion or non-deposition in the sedimentary sequence.
Biostratigraphy and magnetostratigraphy provide
the basis for age control at this site. Note that Ma =
million years ago.
FIGURE 14.9. IRD abundance (mass accumulation rate) data from ODP site 913, Greenland Basin.
Modified from Eldrett et al., 2007. Intervals of the
“Polarity” column marked with an X are intervals not recovered by coring. Magnetostratigraphy and
biostratigraphy provide the basis for age control at this
site. Note that Myr = million years.
Ch 14 Northern Hemisphere Glaciation Instructor Guide
Page 15 of 30
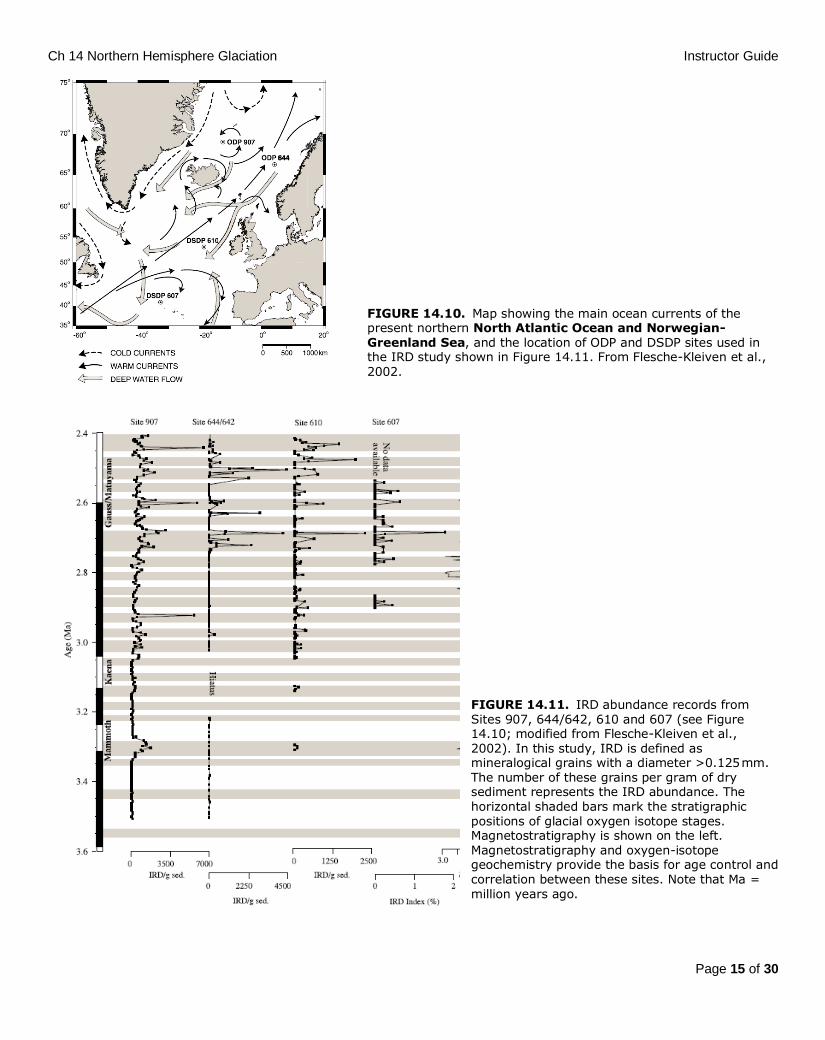
FIGURE 14.10. Map showing the main ocean currents of the present northern North Atlantic Ocean and Norwegian-Greenland Sea, and the location of ODP and DSDP sites used in the IRD study shown in Figure 14.11. From Flesche-Kleiven et al., 2002.
FIGURE 14.11. IRD abundance records from Sites 907, 644/642, 610 and 607 (see Figure 14.10; modified from Flesche-Kleiven et al., 2002). In this study, IRD is defined as mineralogical grains with a diameter >0.125 mm. The number of these grains per gram of dry sediment represents the IRD abundance. The horizontal shaded bars mark the stratigraphic positions of glacial oxygen isotope stages. Magnetostratigraphy is shown on the left. Magnetostratigraphy and oxygen-isotope geochemistry provide the basis for age control and correlation between these sites. Note that Ma = million years ago.
Ch 14 Northern Hemisphere Glaciation Instructor Guide
Page 16 of 30
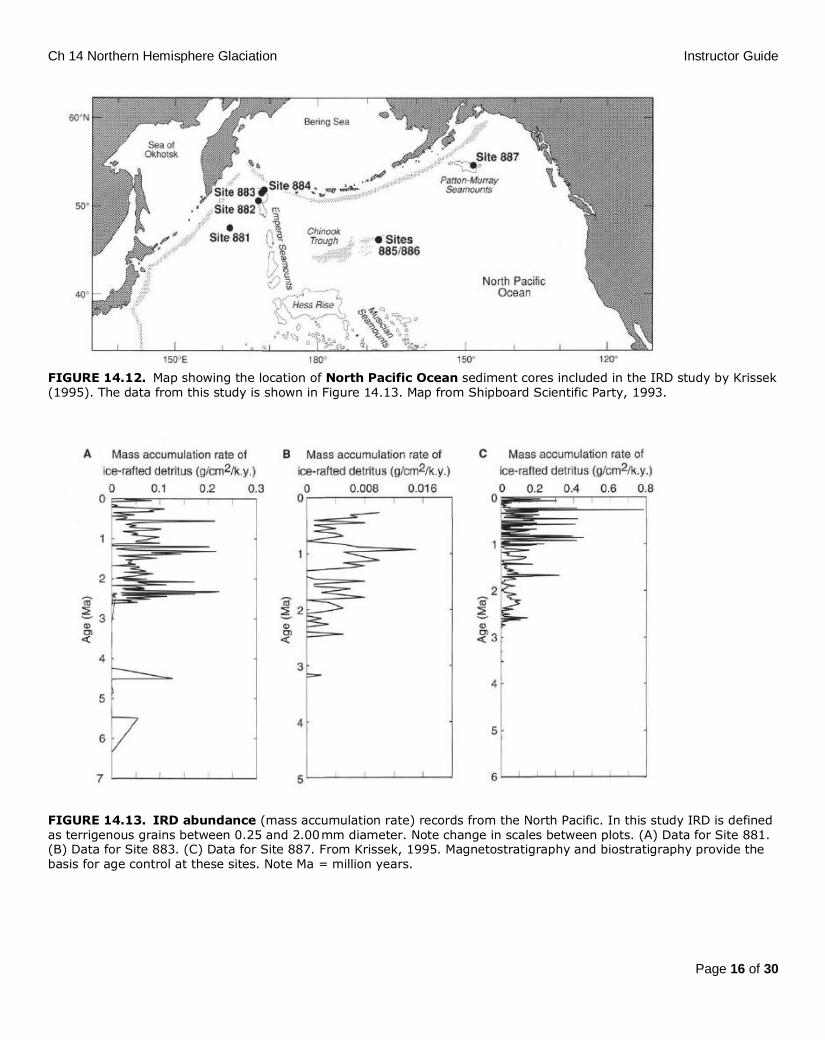
FIGURE 14.12. Map showing the location of North Pacific Ocean sediment cores included in the IRD study by Krissek (1995). The data from this study is shown in Figure 14.13. Map from Shipboard Scientific Party, 1993.
FIGURE 14.13. IRD abundance (mass accumulation rate) records from the North Pacific. In this study IRD is defined as terrigenous grains between 0.25 and 2.00 mm diameter. Note change in scales between plots. (A) Data for Site 881. (B) Data for Site 883. (C) Data for Site 887. From Krissek, 1995. Magnetostratigraphy and biostratigraphy provide the basis for age control at these sites. Note Ma = million years.
Ch 14 Northern Hemisphere Glaciation Instructor Guide
Page 17 of 30
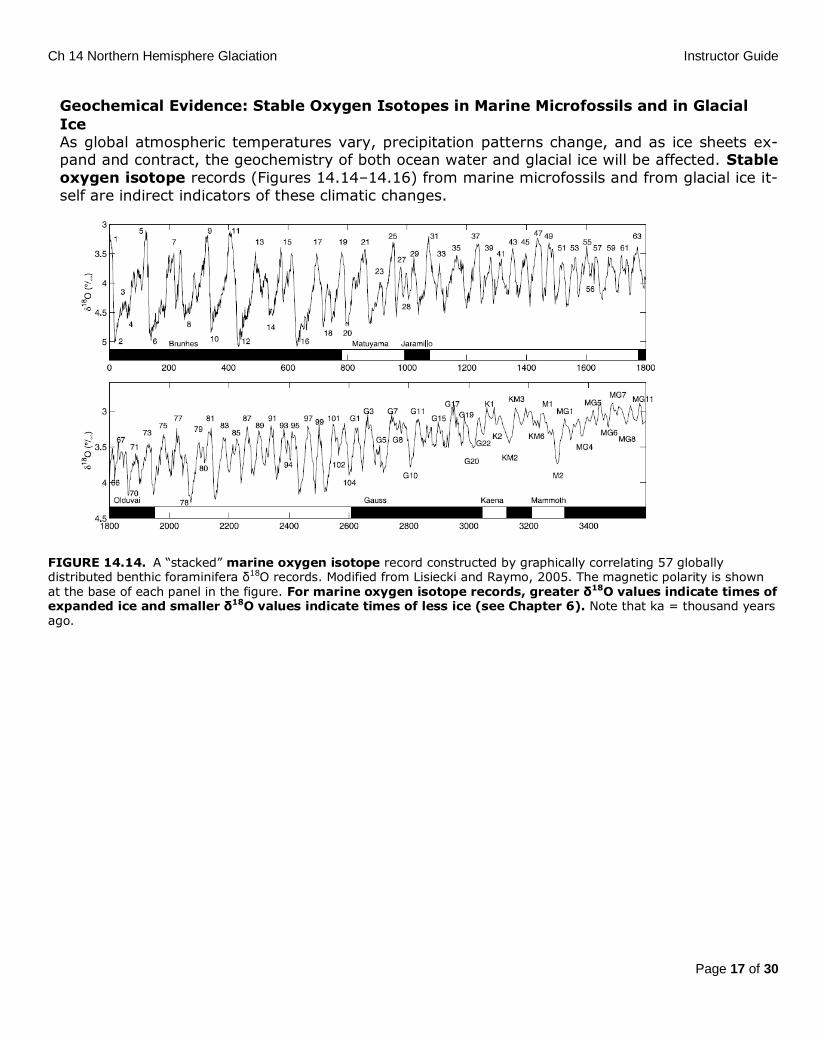
Geochemical Evidence: Stable Oxygen Isotopes in Marine Microfossils and in Glacial
Ice
As global atmospheric temperatures vary, precipitation patterns change, and as ice sheets ex-pand and contract, the geochemistry of both ocean water and glacial ice will be affected. Stable
oxygen isotope records (Figures 14.14–14.16) from marine microfossils and from glacial ice it-
self are indirect indicators of these climatic changes.
FIGURE 14.14. A “stacked” marine oxygen isotope record constructed by graphically correlating 57 globally distributed benthic foraminifera δ18O records. Modified from Lisiecki and Raymo, 2005. The magnetic polarity is shown at the base of each panel in the figure. For marine oxygen isotope records, greater δ18O values indicate times of expanded ice and smaller δ18O values indicate times of less ice (see Chapter 6). Note that ka = thousand years ago.

Ch 14 Northern Hemisphere Glaciation Instructor Guide
Page 18 of 30
FIGURE 14.15. Map showing the locations of ice core sites in Greenland. From Johnsen et al., 2001.
Time (ka) FIGURE 14.16. Stable oxygen isotope profiles (δ 18O) from the two central Greenland ice cores (GRIP and GISP2, shown in Figure 14.15. Modified from Johnsen et al., 2001. Note ka = thousand years ago.
Note that the oldest ice core in Greenland extends back approximately 250 kyr, with a robust record back to approximately 120 kyr. The records in Figure 14.16 show oxygen-isotope variabil-
ity for the last 110 kyr measured from ice cores. For glacial ice records, more negative δ 18O
values indicate colder conditions and less negative δ 18O values indicate warmer con-ditions.
Ch 14 Northern Hemisphere Glaciation Instructor Guide
Page 19 of 30
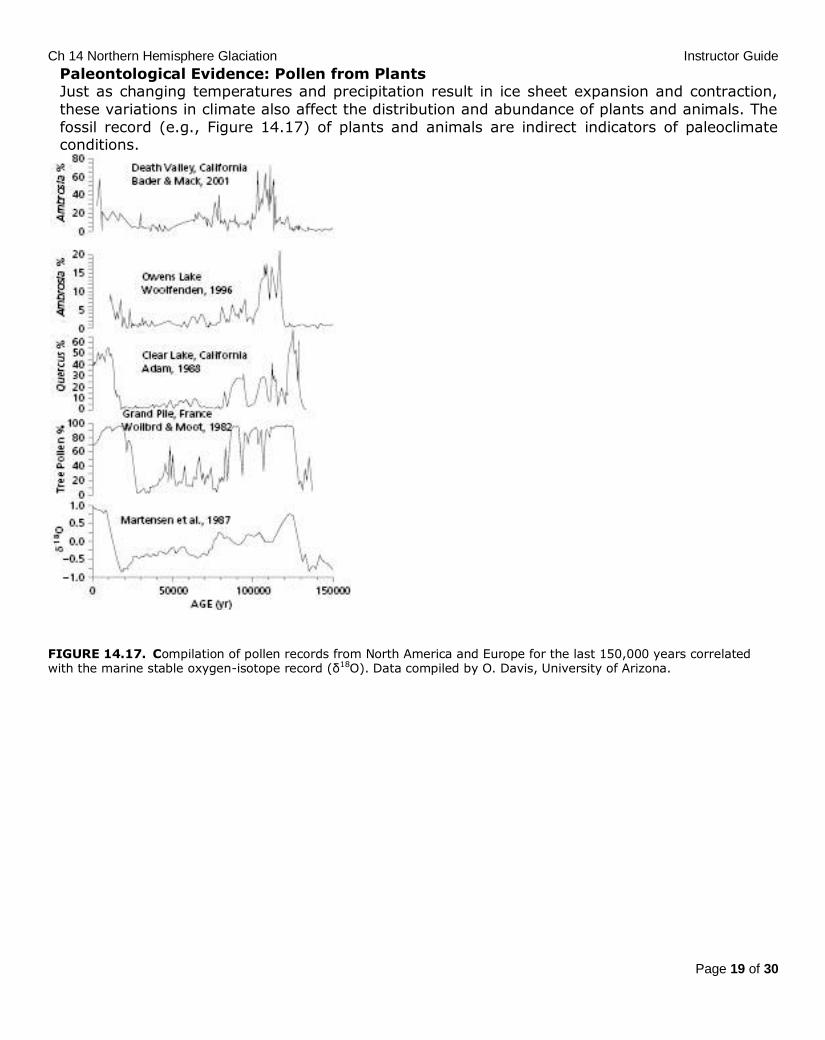
Paleontological Evidence: Pollen from Plants Just as changing temperatures and precipitation result in ice sheet expansion and contraction,
these variations in climate also affect the distribution and abundance of plants and animals. The
fossil record (e.g., Figure 14.17) of plants and animals are indirect indicators of paleoclimate conditions.
FIGURE 14.17. Compilation of pollen records from North America and Europe for the last 150,000 years correlated with the marine stable oxygen-isotope record (δ18O). Data compiled by O. Davis, University of Arizona.
Ch 14 Northern Hemisphere Glaciation Instructor Guide
Page 20 of 30
Part 14.3. What Caused It?
Introduction What caused the northern hemisphere glaciation? This is a simple question, but like a challeng-
ing detective case, not necessarily easy to answer. To investigate the cause of the widespread expansion of northern hemisphere ice between 3–2.5 Ma you will read several abstracts from
published peer-reviewed journal articles. The abstracts are summaries of the main points in the
paper written by the authors.
1 Use what you have learned from each abstract to complete Table 14.2 below. Then use your completed Table 14.2 to synthesize the information on the expansion of northern
hemisphere glaciation. Since these abstracts are from the primary literature they are written
for a scientific audience and may contain terms that are unfamiliar to you. When you come across such terms, look them up. Highlight, underline, make notes in the margins, too, if that
helps you decipher the abstract.
An alternative to assigning all of the abstracts to each student is to assign each of the 7 abstracts to different students, or to different groups of students. Each student, or student
group, can then present their dissection of the abstract (i.e., present the Table 14.2 information
required for their abstract) to the class. A class discussion on the 6 synthesis questions can
follow. You may also consider directing the discussion back to the original questions in Part 14.1, as students should now have a more thorough understanding of Northern Hemisphere glaciation
and the processes and proxies used to investigate it.

Ch 14 Northern Hemisphere Glaciation Instructor Guide
Page 21 of 30
Table 14.2 Summary of abstracts
Abstract number
Abstract Title and
Date of
Publication
Proposed Mechanism (Hypothesis) for the
Onset of Widespread
Northern Hemi-sphere Glaciation
Parts of the Earth
System
This Mecha-
nism
Would In-
volve
Types of Data
and/or
Method Used to
Support
This Hy-
pothesis
Location of Data Set(s)
Terms used in Abstract That
You Needed to
Look Up
1 Influence of
late Cenozoic
mountain building on
ocean geo-
chemical cy-
cles (1988)
Decreased atmospheric
CO2 (and therefore
temperature) driven by increased uplift and
subsequent weathering
of the Andes and Hima-
layan mountains
Lithosphere
(moun-
tains), atmos-
phere,
ocean
Ocean
carbonate
sediments, level of CCD,
and marine
isotopic re-
cords of C-13 and Sr-87
Presumably from
ocean sediments
near these mountains (N
Indian Ocean
and SE Pacific)
Expect several
(e.g., flux, cal-
cite compensa-tion depth)
2 Forcing of Late
Cenozoic northern
hemisphere
climate by
plateau uplift in southern
Asia and the
American West (1989)
Increased uplift of SE
Asia and the American west caused changes in
winds and atm vertical
circulation, which
caused changes in heating and cooling of
the land, but notes that
uplift-induced cooling is probably not enough to
fully explain the cli-
mate change
Lithosphere
(moun-tains),
atmos-
phere,
ocean
General
circulation computer
model ex-
periments
Computer simu-
lation for North America, Europe,
the Mediterra-
nean, Asia, and
the Arctic.
Expect several
(e.g., General Circulation
Model, sensitiv-
ity tests, oro-
graphic)

Ch 14 Northern Hemisphere Glaciation Instructor Guide
Page 22 of 30
3 Volcanic trig-
gering of late Pliocene glaci-
ation: evi-
dence from
the flux of vol-canic glass
and ice-rafted
debris to the North Pacific
Ocean (2001)
Explosive volcanic
eruptions along the N Pacific rim caused
cooling [because
ash and volcanic
S-aerosols reflect the incoming radia-
tion]
Lithosphere
(explosive volcanoes),
and atmos-
phere
Mass
accumulation rates of
volcanic
glass and ice
rafted debris in deep sea
sediments
North Pacific
Ocean (Leg 145 sites)
Expect several (e.g.,
mass accumulation rates, location of
Kamchatka-Kurile arc,
piston-core. Flux)
4 Initiation of
northern hemisphere
glaciation and
strengthening of the north-
east Indian
monsoon:
Ocean Drilling Program Site
758, eastern
equatorial In-dian Ocean
(2003)
An increase in the
strength and dura-tion of the Indian
winter monsoon
played some unde-fined role [Although
not directly stated
in the abstract an
increase: the mon-soon change may
have caused an in-
crease in the depo-sition of organic
matter to the sea
floor, which would cause a decrease in
atmosphere CO2,
which could lead to
cooling]
Atmosphere,
ocean, [bio-sphere]
Benthic
foraminifera
Eastern
equatorial Indian
Ocean (ODP
site 758)
Expect several (e.g.,
coeval, productivity, taxa, foraminifera)
Ch 14 Northern Hemisphere Glaciation Instructor Guide
Page 23 of 30
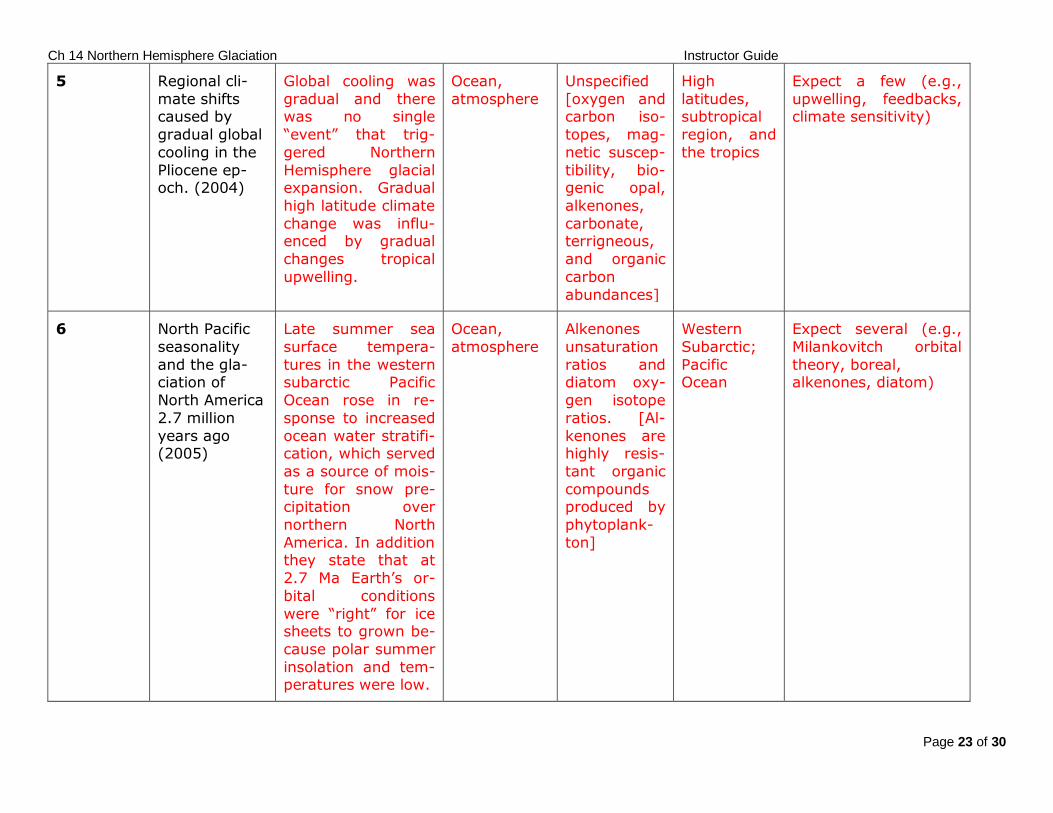
5 Regional cli-
mate shifts caused by
gradual global
cooling in the
Pliocene ep-och. (2004)
Global cooling was
gradual and there was no single
“event” that trig-
gered Northern
Hemisphere glacial expansion. Gradual
high latitude climate
change was influ-enced by gradual
changes tropical
upwelling.
Ocean,
atmosphere
Unspecified
[oxygen and carbon iso-
topes, mag-
netic suscep-
tibility, bio-genic opal,
alkenones,
carbonate, terrigneous,
and organic
carbon
abundances]
High
latitudes, subtropical
region, and
the tropics
Expect a few (e.g.,
upwelling, feedbacks, climate sensitivity)
6 North Pacific
seasonality
and the gla-ciation of
North America
2.7 million
years ago (2005)
Late summer sea
surface tempera-
tures in the western subarctic Pacific
Ocean rose in re-
sponse to increased
ocean water stratifi-cation, which served
as a source of mois-
ture for snow pre-cipitation over
northern North
America. In addition they state that at
2.7 Ma Earth’s or-
bital conditions
were “right” for ice sheets to grown be-
cause polar summer
insolation and tem-peratures were low.
Ocean,
atmosphere
Alkenones
unsaturation
ratios and diatom oxy-
gen isotope
ratios. [Al-
kenones are highly resis-
tant organic
compounds produced by
phytoplank-
ton]
Western
Subarctic;
Pacific Ocean
Expect several (e.g.,
Milankovitch orbital
theory, boreal, alkenones, diatom)
Ch 14 Northern Hemisphere Glaciation Instructor Guide
Page 24 of 30
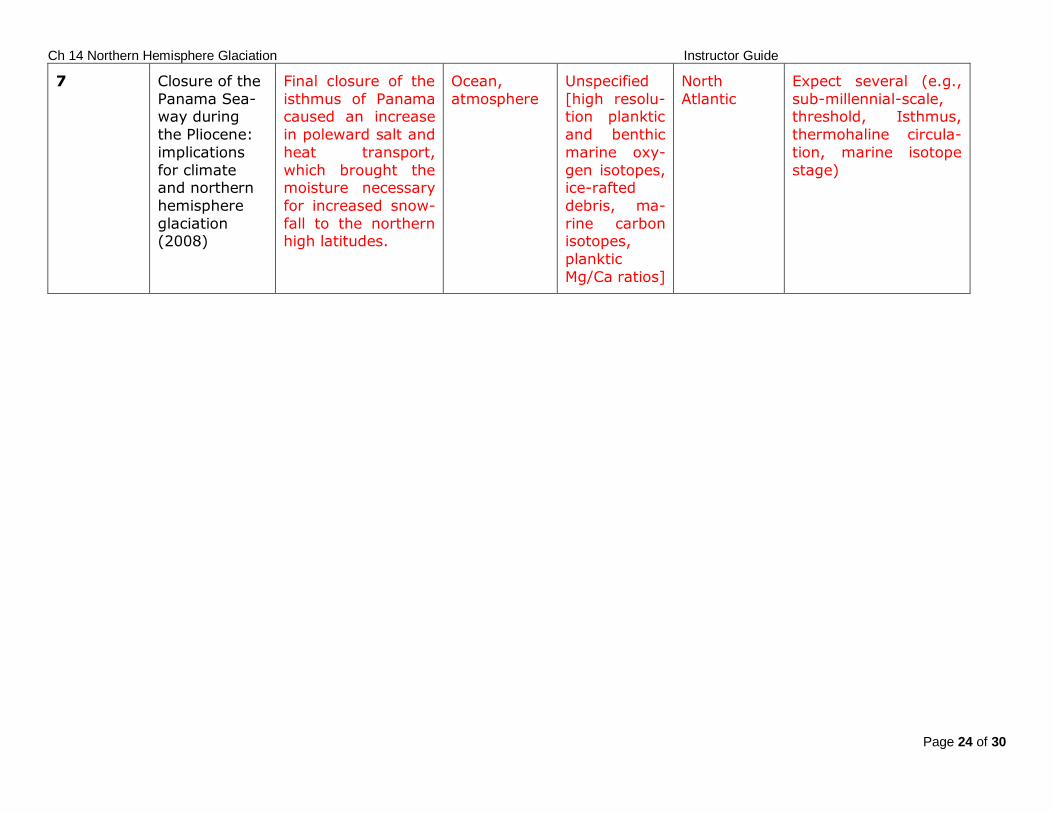
7 Closure of the
Panama Sea-way during
the Pliocene:
implications
for climate and northern
hemisphere
glaciation (2008)
Final closure of the
isthmus of Panama caused an increase
in poleward salt and
heat transport,
which brought the moisture necessary
for increased snow-
fall to the northern high latitudes.
Ocean,
atmosphere
Unspecified
[high resolu-tion planktic
and benthic
marine oxy-
gen isotopes, ice-rafted
debris, ma-
rine carbon isotopes,
planktic
Mg/Ca ratios]
North
Atlantic
Expect several (e.g.,
sub-millennial-scale, threshold, Isthmus,
thermohaline circula-
tion, marine isotope
stage)
Ch 14 Northern Hemisphere Glaciation Instructor Guide
Page 25 of 30
Abstract 1. Influence of Late Cenozoic Mountain Building on Ocean Geochemical
Cycles (Raymo et al., 1988)
In a steady-state ocean, input fluxes of dissolved salts to the sea must be balanced in mass and isotopic value by output fluxes. For the elements strontium, calcium, and carbon, rivers
provide the primary input, whereas marine biogenic sedimentation dominates removal. Dis-
solved fluxes in rivers are related to rates of continental weathering, which in turn are strongly dependent on rates of uplift. The largest dissolved fluxes today arise in the Himalayan and An-
dean mountain ranges and the Tibetan Plateau. During the past 5 myr, uplift rates in these ar-
eas have increased significantly; this suggests that weathering rates and river fluxes may also
have increased. The oceanic records of carbonate sedimentation, level of the calcite compensa-tion depth, and δ 13C and δ 87Sr in biogenic sediments are consistent with a global increase in
river fluxes since the late Miocene. The cooling of global climate over the past few million years
may be linked to a decrease in atmospheric CO2 driven by enhanced continental weathering in these tectonically active regions.
Abstract 2. Forcing of Late Cenozoic Northern Hemisphere Climate by Plateau Uplift
in Southern Asia and the American West (Ruddiman and Kutzbach, 1989)
Geologic evidence indicates that net vertical uplift occurred on a large (kilometer) scale and at accelerating rates during the middle and late Cenozoic in the plateaus of southern Asia and the
American west. Based on this evidence, general circulation model sensitivity tests were run to
isolate the unique effects of plateau uplift on climate. The experiments simulated significant
climatic changes in many places, some far from the uplifted regions. The basic direction of most of these simulated responses to progressive uplift is borne out by changes found in the
geologic record: winter cooling in North America, northern Europe, northern Asia, and the Arc-
tic Ocean; summer drying in the North American west coast, the Eurasian interior, and the Mediterranean; winter drying in the North American northern plains and the interior of Asia;
and changes over the North Atlantic Ocean conducive to increased formation of deep water.
The modeled changes result from increased orographic diversion of westerly winds, from cyc-lonic and anticyclonic surface flow induced by summer heating and winter cooling of the up-
lifted plateaus, and from the intensification of vertical circulation cells in the atmosphere
caused by exchanges of mass between the summer-heated (and winter-cooled) plateaus and
the mid-latitude oceans. Disagreements between the geologic record and the model simula-tions in Alaska and the Southern Rockies and plains may be related mainly to the lack of nar-
row mountain barriers in the model orography. Taken together, the observed regional trends
comprise much of the pattern of “late Cenozoic climatic deterioration” in the northern hemi-sphere that culminated in the Pliocene–Pleistocene ice ages. The success of the uplift sensitiv-
ity experiment in simulating the correct pattern and sign of most of the observed regional cli-
matic trends points to uplift as an important forcing function of late Cenozoic climatic change in
the northern hemisphere at time scales longer than orbital variations; however, the modest amplitude of the uplift-induced cooling simulated at high latitudes indicates a probable need for
additional climatic forcing.
Abstract 3. Volcanic Triggering of Late Pliocene Glaciation: Evidence from the Flux of
Volcanic Glass and Ice-Rafted Debris to the North Pacific Ocean (Prueher and Rea,
2001)
Mass accumulation rates (MAR) of different components of North Pacific deep-sea sediment
provide detailed information about the timing of the onset of major northern hemisphere glaci-
Ch 14 Northern Hemisphere Glaciation Instructor Guide
Page 26 of 30
ation that occurred at 2.65 Ma. An increase in explosive volcanism in the Kamchatka–Kurile and
Aleutian arcs occurred at this same time, suggesting a link between volcanism and glaciation. Sediments recovered by piston-coring techniques during ODP Leg 145 provide a unique oppor-
tunity to undertake a detailed test of this possibility. Here we use volcanic glass as a proxy for
explosive volcanism and ice-rafted debris (IRD) as a proxy for glaciation. The MAR of both
glass and IRD increase markedly at 2.65 Ma. Further, the flux of the volcanic glass increased just prior to the flux of ice-rafted material, suggesting that the cooling resulting from explosive
volcanic eruptions may have been the ultimate trigger for the mid-Pliocene glacial intensifica-
tion.
Abstract 4. Initiation of Northern Hemisphere Glaciation and Strengthening of the
Northeast Indian Monsoon: Ocean Drilling Program Site 758, Eastern Equatorial
Indian Ocean (Gupta and Thomas, 2003) The Indian monsoon system, as recorded by ocean-floor biota (benthic foraminifera) at Ocean
Drilling Program Site 758 in the eastern equatorial Indian Ocean, has varied dramatically over
the past 5.5 myr, long after the onset of the monsoons at 10–8 Ma. Benthic foraminifera that thrive with high productivity year round were common before the formation of northern hemi-
sphere continental ice sheets approximately 3.1–2.5 Ma, indicating that the summer (south-
west) monsoon had high intensity and long seasonal duration. Ca. 2.8 Ma benthic faunas be-came dominated by taxa that flourish with a seasonally strongly fluctuating food supply, indi-
cating that the northeast (winter) monsoon, during which primary productivity is relatively low,
increased in duration and strength to form a system similar to that of today. The change oc-curred coeval with the initiation of the northern hemisphere glaciation, documenting a close
link between the development of the Indian monsoon and northern hemisphere glaciation.
Abstract 5. Regional Climate Shifts Caused by Gradual Global Cooling in the Pliocene
Epoch (Ravelo et al., 2004) The Earth’s climate has undergone a global transition over the past four million years, from
warm conditions with global surface temperatures about 3°C warmer than today, smaller ice sheets and higher sea levels to the current cooler conditions. Tectonic changes and their influ-
ence on ocean heat transport have been suggested as forcing factors for that transition, includ-
ing the onset of significant northern hemisphere glaciation approximately 2.75 million years ago, but the ultimate causes of the climatic changes are still under debate. Here we compare
climate records from high latitudes, subtropical regions and the tropics, indicating that the on-
set of large glacial/interglacial cycles did not coincide with a specific climate reorganization
event at lower latitudes. The regional differences in the timing of cooling imply that global cool-ing was a gradual process, rather than the response to a single threshold or episodic event as
previously suggested. We also find that high-latitude climate sensitivity to variations in solar
heating increased gradually, culminating after cool tropical and subtropical upwelling conditions were established two million years ago. Our results suggest that mean low-latitude climate
conditions can significantly influence global climate feedback.
Abstract 6. North Pacific Seasonality and the Glaciation of North America 2.7 Million
Years Ago (Haug et al., 2005) In the context of gradual Cenozoic cooling, the timing of the onset of significant northern
hemisphere glaciation 2.7 million years ago is consistent with Milankovitch’s orbital theory,
which posited that ice sheets grow when polar summertime insolation and temperature are
Ch 14 Northern Hemisphere Glaciation Instructor Guide
Page 27 of 30
low. However, the role of moisture supply in the initiation of large northern hemisphere ice
sheets has remained unclear. The subarctic Pacific Ocean represents a significant source of wa-ter vapor to boreal North America, but it has been largely overlooked in efforts to explain
northern hemisphere glaciation. Here we present alkenone unsaturation ratios and diatom oxy-
gen isotope ratios from a sediment core in the western subarctic Pacific Ocean, indicating that
2.7 million years ago late summer sea surface temperatures in this ocean region rose in re-sponse to an increase in stratification. At the same time, winter sea surface temperatures
cooled, winter floating ice became more abundant and global climate descended into glacial
conditions. We suggest that the observed summer warming extended into the autumn, provid-ing water vapor to northern North America, where it precipitated and accumulated as snow and
thus allowed the initiation of northern hemisphere glaciation.
Abstract 7. Closure of the Panama Seaway During the Pliocene: Implications for
Climate and Northern Hemisphere Glaciation (Lunt et al., 2008)
The ‘‘Panama Hypothesis’’ states that the gradual closure of the Panama Seaway, between 13 million years ago (13 Ma) and 2.6 Ma, led to decreased mixing of Atlantic and Pacific water
Masses, the formation of North Atlantic deep water and strengthening of the Atlantic thermo-
haline circulation, increased temperatures and evaporation in the North Atlantic, and increased
precipitation in northern hemisphere (NH) high latitudes, culminating in the intensification of northern hemisphere Glaciation (NHG) during the Pliocene, 3.2–2.7 Ma. Here we test this hy-
pothesis using a fully coupled, fully dynamic ocean atmosphere general circulation model
(GCM), with boundary conditions specific to the Pliocene, and a high resolution dynamic ice sheet model. We carry out two GCM simulations with ‘‘closed’’ and ‘‘open’’ Panama Seaways
and use the simulated climatologies to force the ice sheet model. We find that the models sup-
port the ‘‘Panama Hypothesis’’ in as much as the closure of the seaway results in a more in-tense Atlantic thermohaline circulation, enhanced precipitation over Greenland and North
America, and ultimately larger ice sheets. However, the volume difference between the ice
sheets in the ‘‘closed’’ and ‘‘open’’ configurations is small, equivalent to about 5 cm from sea
level. We conclude that although the closure of the Panama Seaway may have slightly en-hanced or advanced the onset of NHG, it was not a major forcing mechanism. Future work
must fully couple the ice sheet model and GCM and investigate the role of orbital and CO2 ef-
fects in controlling NHG.
Synthesis
2 Do any of the proposed mechanisms involve only one part of the Earth system? Why do you think this is?
No. All involve the atmosphere and the ocean, and some also involve the lithosphere, and the
biosphere. This attests to the importance of Earth system interactions and climate feedbacks. The ocean, atmosphere, and lithosphere do not operate in isolation.
3 Can these mechanisms ever truly be proved, or can they only be disproved?
There is never absolutely certain, definitive proof for a scientific hypothesis. Rather, new data,
methods, or models can find flaws in an existing hypothesis and be used to modify or even
throw out a hypothesis. In contrast, hypotheses gain strength when new data, methods, and
models continue to support the explanation the hypothesis provides for natural phenomena.
Ch 14 Northern Hemisphere Glaciation Instructor Guide
Page 28 of 30
4 Do you view any of the proposed mechanisms as mutually exclusive? Why or why not?
That depends. Several imply an abrupt shift in the climate system at the onset of widespread Northern Hemisphere, whereas at least one (#5) argues for gradual and regional mechanisms;
these ideas do seem in conflict. Other proposed mechanisms may operate in concert or at least
simultaneously (e.g., uplift-weathering (#1), explosive volcanism (#3), and the redirection of
ocean currents (#7)). The strategy of considering multiple working hypotheses is a common and useful practice in the geosciences.
5 Several of these hypotheses arise because of a concurrent timing of some change in the Earth system and northern hemisphere glacial expansion. Does concurrent timing imply causal rela-
tionships? Explain.
No, although concurrent timing certainly raises the question of whether a cause and effect ex-ist. Alternatively these events may be unrelated or perhaps mutual outcomes of some other
cause.
6 The growth of ice sheets requires sufficient temperature and adequate moisture supply. Which
of these mechanisms aim to satisfy the temperature requirement and which aim to satisfy the moisture requirement?
Temperature requirement = mechanisms proposed in abstracts # 1, 2, 3 (4, 5)
Moisture requirement = mechanisms in abstracts 6 & 7
7 Are the data used to support the hypotheses proposed in the abstracts largely marine or non-
marine (land-based)? Why do you think that is?
Largely marine – from seafloor sedimentary sequences. This type of archive has many different proxies, and can offer relatively undisturbed, continuous and sometimes high resolution data
sets.
III. Summative Assessment
There are several ways the instructor can assess student learning after completion of this exer-
cise:
4. After completing Parts 14.2 and 14.3, have students answer the questions in Part 14.1
again. Their answers should be more detailed and more accurate than their initial predic-tions.
5. Students could be asked to critically summarize (similar to their task in Table 14.2) addi-
tional abstracts extracted from peer-reviewed papers on the cause of the Northern Hemi-sphere glaciation.
6. Students could be asked to develop individual concept maps on Northern Hemisphere gla-
ciation.
Ch 14 Northern Hemisphere Glaciation Instructor Guide
Page 29 of 30
IV. Supplemental Materials
For information on different types of ice (e.g. glacials, ice shelves, sea ice) and the cryosphere in general go to:
o NASA – A Tour of the Cryosphere at http://www.nasa.gov/vision/earth/environment/cryosphere.html
o The National Snow and Ice Data Center at http://nsidc.org/
For information on the recent time scale vote moving the Plio-Pleistocene boundary from 1.8 to 2.6 Ma read: Mascarelli, 2009, Quaternary geologists win timescale vote: Nature,
459, p. 624.
For additional reading on the the spatial extent and timeline of Northern Hemisphere gla-
ciation see the following 3 volume series: o Ehlers, J., & Gibbard, P.L., eds., 2004a, Extent and chronology of Glaciation. Vol-
ume 1: Europe, Elsevier Science, Amsterdam, 488pp.
o Ehlers, J., & Gibbard, P.L., eds., 2004b, Extent and chronology of Glaciation. Vol-ume 2: North America, Elsevier Science, Amsterdam, 450pp.
o Ehlers, J., & Gibbard, P.L., eds., 2004c, Extent and chronology of Glaciation. Vol-
ume 3: South America, Asia, Africa, Australia, Antarctica. Elsevier Science, Amster-
dam, 433pp.
V. References
Adam, D.P., 1988, Correlations of the Clear Lake, California, Core CL-73-4 pollen sequence with
other long climate records. Special Paper. Geological Society of America, 214, 81–95.
Bartoli, G., Sarnthein, M., Weinelt, M., Erlenkeuser, H., Garbe-Schonberg, D., and Lea, D.W., 2005, Final closure of Panama and the onset of northern hemisphere glaciation: Earth and
Planetary Science Letters, v. 237, p. 33–44.
Eldrett, J.S., et al., 2007, Continental ice in Greenland during the Eocene and Oligocene. Nature, 446, 176–9.
Elhers, J. and Gibbard, P.L., 2003, Extent and chronology of glaciations. Quaternary Science Re-
views, 22, 1561–8.
Elhers, J. and Gibbard, P.L., 2007, The extent and chronology of Cenozoic global glaciation. Qua-
ternary International, 164–165, 6–20.
Flesche-Kleiven, H., et al., 2002, Intensification of northern hemisphere glaciations in the circum
Atlantic region (3.5–2.4 Ma) – ice-rafted detritus evidence. Palaeogeography, Palaeoclimatol-ogy, Palaeoecology, 184, 213–23.
Geological Survey, Ohio Division of Natural Resources,
http://www.dnr.ohio.gov/Portals/10/pdf/glacial.pdf
Gupta, A.K. and Thomas, E, 2003, Initiation of northern hemisphere glaciation and strengthen-
ing of the northeast Indian monsoon. Ocean Drilling Program Site 758, eastern equatorial In-
dian Ocean. Geology, 31, 47–50.
Haug, G.H., et al., 2005, North Pacific seasonality and the glaciation of North America 2.7 million years ago. Nature, 433, 821–5.
Hull, D.M., Osterman, L.E., and Thiede, J., 1996, Biostratigraphic synthesis of Leg 151, North
Atlantic-Arctic Gateways, in Thiede, J., Myhre, A.M., Firth, J.V., Johnson, G.L., and Ruddiman, W.F., eds., Proceeding of the Ocean Drilling Program, Scientific Results, v. 51, College Station,
Ch 14 Northern Hemisphere Glaciation Instructor Guide
Page 30 of 30
TX, Ocean Drilling Program, p. 627–644, doi:10.2973/odp.proc.sr.151.146.1996.
Johnsen, S. J., et al., 2001, Oxygen isotope and palaeotemperature records from six Greenland ice-core stations: Camp Century, Dye-3, GRIP, GISP2, Renland and NorthGRIP. Journal of Qua-
ternary Science, 16, 299–307.
Krissek, L.A., 1995, Late Cenozoic ice-rafting records from Leg 145 sites in the North Pacific:
late Miocene onset, late Pliocene intensification, and Pliocene–Pleistocene events. In Proceed-ings of the Ocean Drilling Program, Scientific Results, vol. 145, Rea, D.K., et al., (eds), College
Station, TX, Ocean Drilling Program, pp. 179–94. doi:10.2973/odp.proc.sr.145.118.1995.
Lisiecki L. E. and Raymo, M.E., 2005, A Pliocene–Pleistocene stack of 57 globally distributed ben-thic δ 18O records. Paleoceanography, 20, PA1003, doi:10.1029/2004PA001071.
Lunt, D. J., et al., 2008, Closure of the panama seaway during the pliocene: Implications for cli-
mate and northern hemisphere glaciation. Climate Dynamics, 30 (1), 1–18.
Martinson, D.G., et al., 1987, Age dating and the orbital theory of the ice ages: Development of
a high-resolution 0–300,000 year chronostratigraphy. Quaternary Research, 27, 1–29.
Mascarelli, 2009, Quaternary geologists win timescale vote: Nature, v. 459, p. 624.
McDougall, I., and Wensink, H., 1966, Paleomagnetism and geochronology of the Pliocene-Pleistocene lavas in Iceland: Earth and Planetary Science Letters, v. 1, p. 232-236.
Polyak, L., et al., 2010, History of Sea Ice in the Arctic. Quaternary Science Review (QSR) Spe-
cial Issue: Past Climate Variability and Change in the Arctic, (in press). doi:10.1016/j.quascirev.2010.02.010.
Prueher, L.M. and Rea, D.K., 2001, Volcanic triggering of late Pliocene glaciation: evidence from
the flux of volcanic glass and ice-rafted debris to the North Pacific Ocean. Palaeogeography, Palaoeclimatology, Palaeoecology, 173, 215–30.
Ravelo, A.C., et al., 2004, Regional climate shifts caused by gradual global cooling in the Plio-
cene epoch. Nature, 429, 263–7.
Raymo, M.E., et al., 1988, Influence of late Cenozoic mountain building on ocean geochemical cycles. Geology, 16, 649–53.
Ruddiman, W.F. and Kutzbach, J.E., 1989, Forcing of Late Cenozoic northern hemisphere Cli-
mate by Plateau Uplift in Southern Asia and the American West. Journal of Geophysical Re-search, 94(D15), 18409–27.
Shipboard Scientific Party, 1993, Introduction to Leg 145: North Pacific Transect, In Proceeding
of the Ocean Drilling Program, Initial Reports, vol. 145, Rea, D.K., et al. (eds), College Station, TX, Ocean Drilling Program, pp. 5–7.
St. John, K., 2008, Cenozoic History of Ice-Rafting in the Central Arctic: Terrigenous Sands on
the Lomonosov Ridge. Paleoceanography, 23, PA1S05.
Woillard G.M. and Mook, W.G., 1982, Carbon-14 dates at Grande Pile: correlation of land and sea chronologies. Science, 215, 159–61.
Woolfenden, W.B., 1996, 180,000-year pollen record from Owens Lake, CA: terrestrial vegeta-
tion change on orbital scales. Quaternary Research, 59, 430–44.