instructions for use - eprints.lib.hokudai.ac.jp · melanoma than in nevus pigmentosus (9). there...
TRANSCRIPT
Instructions for use
Title Disordered Expression of HOX Genes in Human Non-Small Cell Lung Cancer
Author(s) Abe, Motoki; Hamada, Jun-ichi; Takahashi, Osamu; Takahashi, Yoko; Tada, Mitsuhiro; Miyamoto, Masaki; Morikawa,Toshiaki; Kondo, Satoshi; Moriuchi, Tetsuya
Citation ONCOLOGY REPORTS, 15(4): 797-802
Issue Date 2006-04
Doc URL http://hdl.handle.net/2115/8484
Type article
File Information Oncology Reports-Abe et al.pdf
Hokkaido University Collection of Scholarly and Academic Papers : HUSCAP

1
Disordered Expression of HOX Genes in Human Non-Small Cell Lung Cancer
Motoki Abe1,2, Jun-ichi Hamada1, 3, Osamu Takahashi1,2, Yoko Takahashi1, Mitsuhiro
Tada1, Masaki Miyamoto2, Toshiaki Morikawa2, Satoshi Kondo2 and Tetsuya Moriuchi1
1 Division of Cancer-Related Genes, Institute for Genetic Medicine, Hokkaido
University, Sapporo, 060-0815, Japan
2 Department of Surgical Oncology, Division of Cancer Medicine, Hokkaido University
Graduate School of Medicine, Sapporo 060-0815, Japan
3Correspondence to: Jun-ichi Hamada, Ph.D.; Division of Cancer-Related Genes,
Institute for Genetic Medicine, Hokkaido University, Kita-15, Nishi-7, Kita-ku, Sapporo,
060-0815, Japan
TEL: +81-11-706-6083; Fax: +81-11-706-7870; E-mail: [email protected]
Running Title: Disorder of HOX code in lung cancer
Key Words: Homeobox gene, HOX, Real-time RT-PCR, Lung cancer
3
ABSTRACT
We hypothesized that the disordered tissue architecture in cancer results from the steps
that the cells execute the program designed during ontogeny in a spatiotemporally
inappropriate manner. HOX genes are known as master regulators of embryonic
morphogenesis, and encode transcription factors which regulate the transcription of the
downstream genes to realize the program of body plan. In this study, we quantified the
expression levels of 39 HOX genes in 41 human non-small cell lung cancer (non-SCLC)
and non-cancerous lung tissues by a comprehensive analysis system based on the real-
time RT-PCR method. We found that the expression levels of HOXA1, A5, A10 and C6
in squamous cell carcinoma tissues (and HOXA5 and A10 in adenocarcinoma tissues)
were significantly higher than those in the non-cancerous tissues. Comparison of HOX
gene expressions between adenocarcinoma and squamous cell carcinoma tissues
showed higher expressions of HOXA1, D9, D10 and D11 in squamous cell carcinoma
tissues than in adenocarcinoma tissues. Immunohistochemical analysis revealed that
HOXA5 and A10 proteins were localized in the cytoplasm of tumor cells in both
adenocarcinoma and squamous cell carcinoma tissues. These results suggest that the
disordered patterns of HOX gene expressions were involved in not only the
development of non-SCLC but also histological diversity such as adenocarcinoma and
4
squamous cell carcinoma.
INTRODUCTION
It can be hypothesized that the disordered tissue architecture in cancer results
from the steps that the cells execute the program designed during ontogeny in a
spatiotemporally inappropriate manner. In other words, the cancer cells may partly
follow the ontogenic program to display the transformed phenotype and dynamic
movement to surrounding or distant areas. Homeobox genes are a superfamily of the
genes encoding transcription factors, which regulate the embryonic morphogenesis in
animals (1). The clustered group of homeobox genes in human are called HOX genes.
The genes contain a 180-bp DNA sequence (homeobox), which encodes a highly
conserved 60-amino-acid homeodomain. The HOX proteins function as transcription
factors through their homeodomain, which is responsible for recognition and binding of
sequence-specific DNA motifs (2, 3). In human genome, 39 HOX genes are clustered
in a similar arrangement of 13 paralog groups in four different chromosomal regions,
HOXA, B, C, and D (4). During embryonic morphogenesis, HOX gene expressions
are regulated in a precise spatiotemporal manner: the 3'-end genes of the clusters are
expressed earlier and in more anterior domain than the genes localized in more 5'
5
positions (5).
Recently, there is a growing interest in investigating relationship of
inappropriate expressions of HOX genes with carcinogenesis or malignant progression.
Some HOX genes exhibit different expression levels in a variety of human cancers
including kidney, colon, bladder, melanoma and prostate cancers, compared to normal
tissues from which they were derived (6-10). For example, HOXB5 and B9 are
expressed in normal kidney but not in renal cancer whereas the expression of HOXC11
is observed in human renal cancer but not in normal kidney (6). In human prostate
cancer, overexpression of HOXC8 correlates with loss of differentiation phenotype (10).
Increased expressions of HOXC4, C5, C6 and C11 are likely to be involved in the
development of human bladder transitional cell carcinomas (8). We also found that the
expression levels of HOXA11, A13, B9, D12 and D13 were higher in cutaneous
melanoma than in nevus pigmentosus (9).
There are few reports on HOX gene expressions in human lung cancer. The
expression of some HOX genes in human small-cell lung cancers xenografted into nude
mice was different from that in normal lung (11). Analysis of HOX gene expressions
by using degenerate reverse transcription-PCR showed that HOXA9, A10 and B9 were
frequently up-regulated in human lung cancer cell lines and lung tumor tissues (12).

6
Lechner et al. reported that some HOX genes of which expression was restricted to
pulmonary embryogenesis were re-expressed in lung cancer cells (13). To better
understand the roles of HOX genes in lung cancer, we investigated the HOX gene
expressions in 41 human non-small cell lung cancer tissues by a comprehensive analysis
system to quantify the expressions of 39 human HOX genes based on the real-time
reverse transcription-PCR method. And we further examined the relationship between
HOX gene expression and clinicopathologic parameters.
MATERIALS AND METHODS
Patients and samples. A total of 41 primary lung cancer tissues (28 adenocarcinoma
and 13 squamous cell carcinoma tissues) and 15 non-cancerous tissues were obtained
from surgical specimens resected from patients who underwent radical surgery without
any preoperative chemotherapy or radiotherapy at the Department of Surgical Oncology,
Hokkaido University Hospital and 33 affiliated hospitals in Hokkaido, Japan, between
January 2001 and September 2004. Only those patients who agreed with the aim and
contents of this study and who provided their written informed consent were subjected
to the study. Tumor and normal tissue samples of about 5 mm-size were immediately
cut from the lung resected by a standard surgical procedure, snap frozen in liquid
7
nitrogen, and stored at -80°C until use. Part of each tumor sample piece was cut and
examined for histopathological analysis, and the sample pieces were used for RNA
extraction. All procedures in this portion of the study were approved by the Ethics
Committee of Hokkaido University and the independent internal ethics committees of
the affiliated hospitals.
Histological subclassification and staging of the tumors were done by reviewing
the specimens taken for pathological diagnosis, according to the TNM classification.
The tumor status of each case was categorized based on the pTNM pathological
classification of the International Union Against Cancer (14). Pertinent major
clinicopathological parameters are shown in Table 1.
RNA extraction and cDNA preparation. Total RNA was extracted from powdery
frozen tissues of each clinical specimen which had been crushed in liquid nitrogen with
a CRYO-PRESS compressor (Microtec Nition, Chiba, Japan) with Trizol reagent
(Invitrogen, Carlsbad, CA) according to the manufacturer’s instruction. For exclusion
of contaminated genomic DNA, 50 microg of total RNA was incubated for 30 min at
37°C in 50 microL of reaction mixture containing 40 mM Tris-HCl (pH 7.2), 10 mM
NaCl, 6 mM MgCl2, 2 mM dithiothreitol, 0.04 U/microL PQ1 DNase (Promega,
Madison, WI), and 0.4 U/microL RNase inhibitor. Reverse transcription reaction for
8
real-time PCR was performed by the same method as described in our previous report
(15).
Quantitative real-time PCR. Quantitative RT-PCR assays were carried out by using
ABI PRISM 7900HT (Applied Biosystems) with SYBR-green fluorescence under the
same condition as described in our previous report (15). The primer sets for
amplification of 39 HOX genes and beta-actin gene were listed in our previous report
(15).
Immunohistochemistry. Surgical specimens were fixed in a 10% formalin solution and
embedded by routine methods in paraffin for sectioning at a thickness of 4 microm.
Immunohistochemical reactions were carried out by the streptavidin-biotin-peroxidase
methods. Sections were deparaffinized in xylene, and rehydrated through a graded
series of ethanol. The specimens were boiled in target retrieval solution at 10x
concentration (Dako Cytomation, Glostrup, Denmark; diluted at 1:10) in a pressure
cooker for 8 min. Endogenous peroxidase activity was blocked by incubation in 0.3%
hydrogen peroxide methanol for 10 min. The specimens were then washed with
phosphate-buffered saline (PBS, pH7.2), placed in a serum-free protein blocker (DAKO
corporation, Carpinteria, CA) for 5 min, and incubated overnight at 4℃ with the
primary antibodies, anti-HOXA5 goat immunoglobulin polyclonal antibody and anti-
9
HOXA10 goat immunoglobulin polyclonal antibody (Santa Cruz Biotechnology, CA;
diluted at 1:200). After washing in PBS, Biotinylated Link Universal (Dako
Cytomation) was applied, and the specimens were incubated at room temperature for 20
min. After washing in PBS, the specimens were incubated in streptavidin conjugated
with peroxidase solution (Nichirei, Tokyo, Japan) at room temperature for 15 min. After
washing in PBS, immunohistochemical reactions were developed in freshly prepared 3,
3`-diaminobenzidine tetrahydrochloride (Nichirei). The sections were counterstained
with hematoxylin and coverslipped in a systemic mounting medium. As a negative
control, we omitted the primary antibody.
Statistical analysis. The relationship between the expression of each HOX and each
clinicopathological parameter was determined by the Mann-Whitney U test, the
Kruskal-Wallis rank test or the Spearman rank correlation test. The statistical software
package applied was Statview 5.0 for Macintosh (SAS Institute, Cary, NC). A p value
less than 0.01 was considered statistically significant.
RESULTS
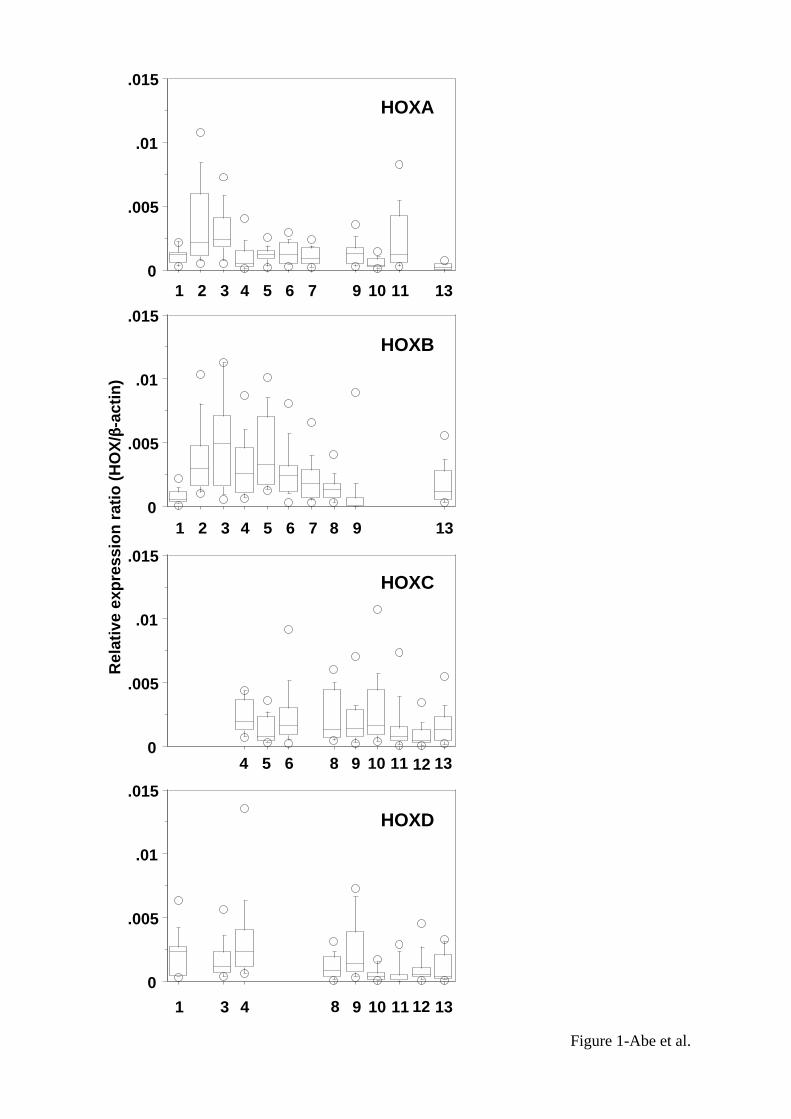
Expressions of HOX genes in non-cancerous tissues. Figure 1 shows the expression
levels of 39 HOX genes in 15 non-cancerous lung tissues which were obtained from the

10
surgically resected tissues of lung cancer patients. The non-cancerous tissues showed
relatively high expressions of HOXB2, B3, B4, B5 and B6 which were located at 3'-side
of cluster B, and HOXA3 (median values of relative expression ratio were more than
0.0025) whereas they showed relatively low or no expression of Abd-B family of HOX
genes (paralog 9 to 13) which were located at 5'-side of each cluster. Generally, there
was a tendency that the expression levels varied relatively in a wide range within each
sample.
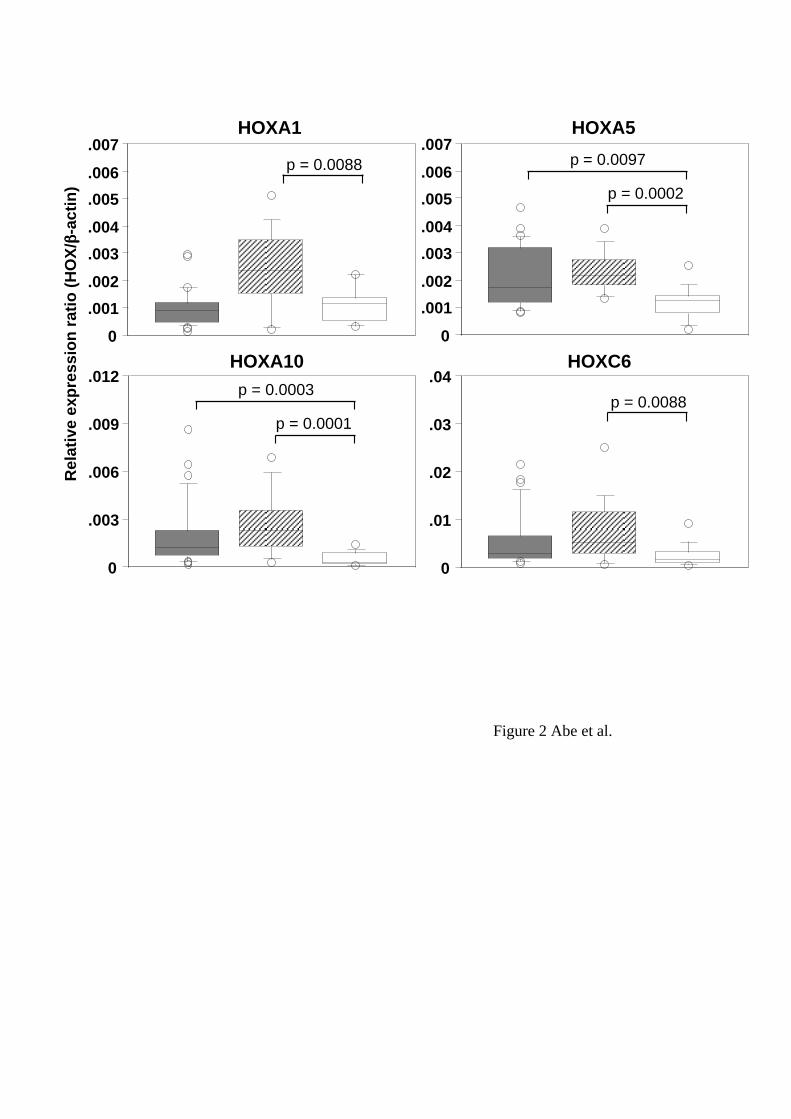
Differences in HOX gene expression between lung cancer and non-cancerous
tissues. We compared the expression levels of each HOX gene between lung cancer
tissues and non-cancerous tissues. Four of 39 HOX genes, HOXA1, A5, A10 and C6,
showed significant differences in the expression levels between cancer and non-
cancerous tissues (p < 0.01, Mann-Whitney U-test) (Figure 2). The expressions levels of
all the 4 HOX genes in squamous cell carcinoma tissues were higher than those in non-
cancerous tissues. In adenocarcinoma tissues, the expression levels of HOXA5 and
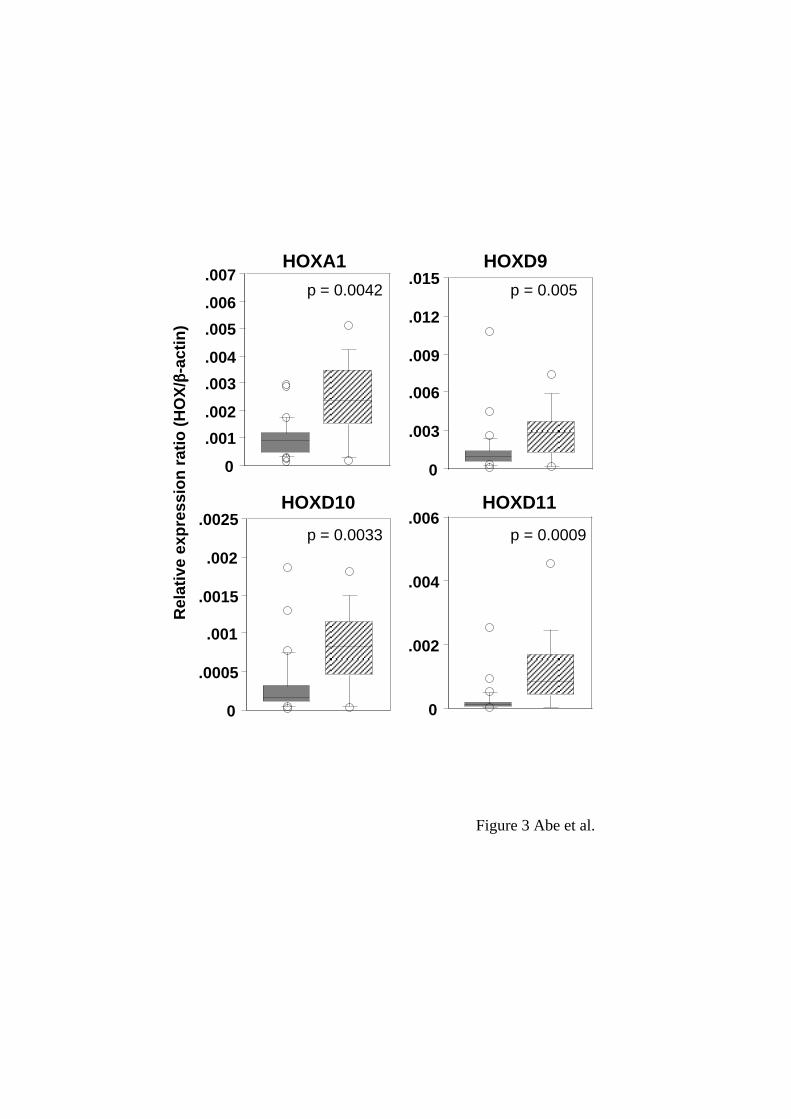
A10 were high compared to non-cancerous tissues. We also found significant
differences in the expression levels between squamous cell carcinoma tissues and
adenocarcinoma tissues: HOXA1, D9, D10 and D11 showed higher expressions in
squamous cell carcinoma than in adenocarcinoma tissues (Figure 3).
11
HOX gene expression and clinicopathologic parameters. We next examined
whether there was a relationship between HOX gene expression patterns and
clinicopathologic parameters. Although we did not find significant difference in any
HOX gene expression between cancer tissues with metastasis to lymph node and those
without it, there was a tendency that the expression levels of HOXB7 in
adenocarcinoma tissues with lymph node metastasis were low compared to those
without it (p = 0.0295, Mann-Whitney U-test). There was no HOX gene which
characterized the disease stage (IB, IIB and IIIA) or histological types of differentiation.
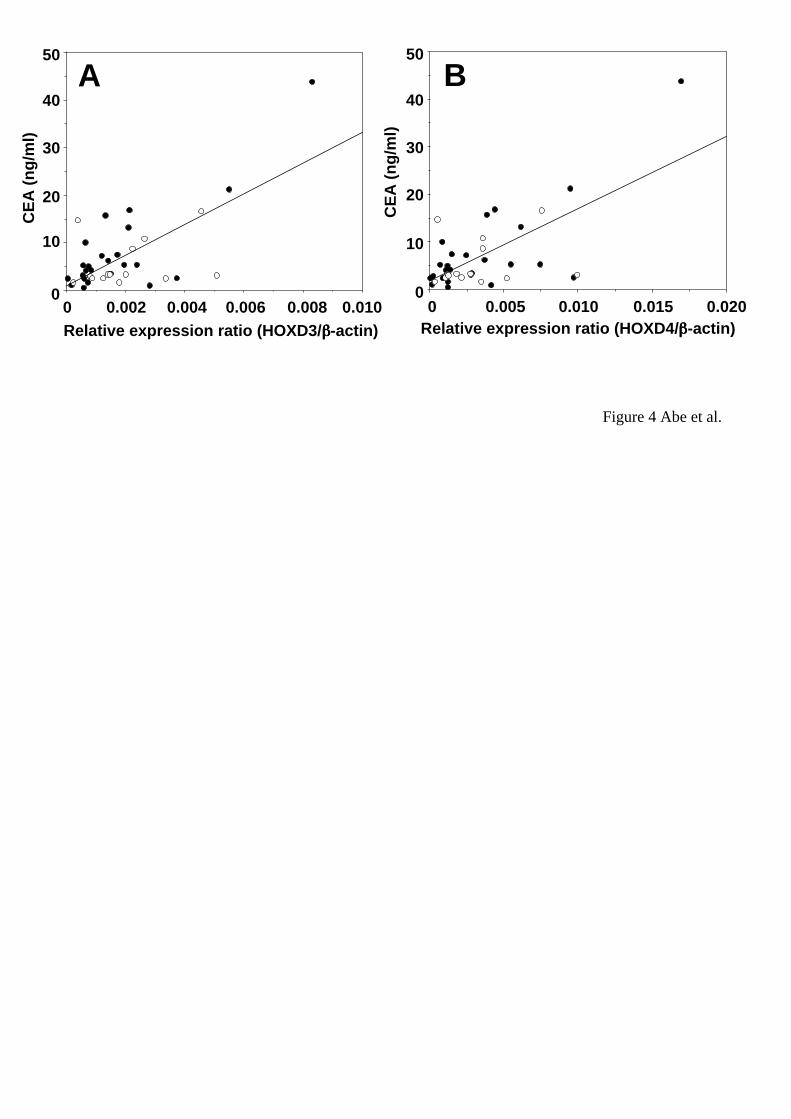
We also examined the correlation between HOX gene expressions and levels of tumor
markers. As shown in Figure 4, there was a slight correlation between CEA levels and
HOXD3 or HOXD4 expression levels (HOXD3 vs CEA: r = 0.389 with p = 0.0166, n =
39; HOXD4 vs CEA: r = 0.407 with p = 0.0122, n = 39). There was no HOX gene of
which expression correlated with the levels of other tumor markers such as SCC, NSE,
CYFRA21-1 and ProGRP or smoking.
Immunohistochemical examination for HOXA5 and A10 in non-SCLC specimens.
We subjected non-SCLC tissues and their adjacent non-cancerous tissues of 8
specimens (4 adenocarcinoma and 4 squamous cell carcinoma) to immunohistochemical
staining to detect the protein expression of HOXA5 and A10 of which expressions were
12
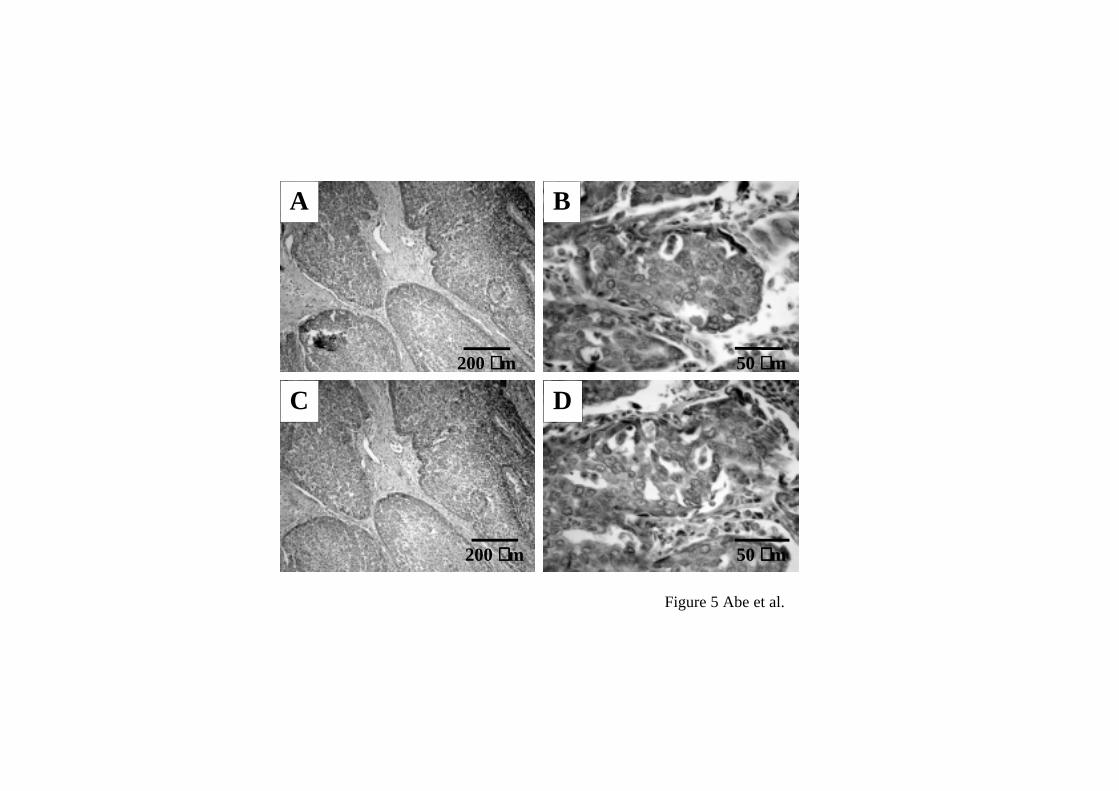
higher at mRNA levels in non-SCLC than non-cancerous tissues. Figure 5 shows
representative examples of immunohistochemical staining for HOXA5 and A10.
Immunoreactivity of HOXA5 and A10 was observed in cytoplasma of lung cancer cells
and bronchial epithelial cells but neither in alveolar epithelial cells nor in interstitial
tissues of lung cancer. The immunoreactivity of both HOX proteins was detected in
squamous metaplasia tissues involved in squamous cell carcinoma. Intensity of
immunoreactivity of both HOX proteins was consistent with the expression levels of
mRNA for the HOX genes in the 8 samples examined (data not shown).
.
DISCUSSION
In this study, we tried to elucidate whether inappropriate expressions of HOX genes
were involved in the development and progression of non-small cell lung cancer (non-
SCLC). Our comprehensive analysis of 39 HOX genes in 41 non-SCLC and 15 non-
cancerous tissues revealed the expression patterns of HOX genes characteristic of
adenocarcinoma or squamous cell carcinoma. Compared to non-cancerous tissues,
adenocarcinoma tissues showed enhanced expressions of HOXA5 and A10, and
squamous cell carcinoma tissues showed enhanced expressions of HOXA1 and C6 in
addition to the two HOX genes. It is likely that the increased expressions of HOXA5
13
and/or A10 are positively associated with the development of non-SCLC. The
HOXA5 gene product is a potent transactivator of the p53 promoter (16). The
HOXA10 gene product activates p21 transcription and results in cell cycle arrest and
differentiation in myelomonocytic cells (17). These reports suggest anti-oncogenic
function of both HOXA5 and A10 proteins, which is contradictory to our assumption of
the roles of the two HOX genes in the development of non-SCLC. However, our
immunohistological analysis suggested to us the possibility of interesting interpretation:
Unexpectedly, both HOX proteins existed in the cytoplasm but not in the nuclei of
cancer cells, indicating that they do not function as transcription factors to regulate
downstream target genes such as p53 and p21. Recently, HOX proteins are known to
have other functions than DNA binding-transcription factors. For example, HOXA13
and D13 interact with Smad protein to modify Smad transcriptional activation (18).
Homeodomain of HOX proteins bind to CREB binding protein (CBP) and block its
acetyltransferase activity (19). These indicate that HOX proteins modulate the
transcriptional activity through interaction with other proteins in a non-DNA binding
manner. Therefore, we need to consider a possibility that HOXA5 and A10 proteins
interfere with the function of anti-oncogenic molecules in lung cancer cells.
It is known that HOXA1 and C6, which were upregulated in squamous cell
14
carcinoma, affect the cell growth and death. Forced expression of HOXA1 in human
breast cancer cells results in increased cell growth activity (20). Loss of HOXC6
expression by transfection with siRNA induces apoptosis in human prostate cancer cell
lines (21). Therefore, the increased expressions of HOXA1 and C6 may play a
promoting role in the primary growth of lung squamous cell carcinoma tissues.
Between adenocarcinoma and squamous cell carcinoma, 4 HOX genes presented
different expressions. The expression levels of HOXA1, D9, D10 and D11 were
significantly higher in squamous cell carcinoma than in adenocarcinoma. The
expression levels of HOXD12 and D13 also tended to be high in squamous cell
carcinoma (p = 0.05 and 0.01, respectively, Mann-Whitney U-test, data not shown). We
examined the relationship between the expression of these HOX genes, and SCC and
CYFRA21-1 which were tumor markers of lung squamous cell carcinoma. There was
no relationship between them. As the expressions of HOXA1 and HOXD9-11 genes
were also upregulated in oral squamous cell carcinoma (our unpublished data), these
HOX genes are likely involved in maintaining the squamous cell carcinoma-related
phenotypes other than SCC and CYFRA21-1.
We found a positive correlation between CEA levels and HOXD3 or D4 expression
levels although their correlation coefficients were not so high. There are many
15
common phenomena between cancer and embryonic morphogenesis, one of which is the
production of oncofetal proteins. This evidence provides us the possibility to consider
HOX genes as candidates which regulate the production of oncofetal proteins.
In conclusion, the results presented here suggest that the disordered patterns of HOX
gene expressions were involved not only in the development of non-SCLC but also in
the histologically aberrant diversity such as adenocarcinoma and squamous cell
carcinoma.
ACKNOWLEDGMENTS
The authors wish to thank Ms. Masako Yanome for her help in preparing the
manuscript. This work was supported in part by Grant-in-Aid for Scientific Research
(B) (J.H.) from the Ministry of Education, Culture, Sports, Science and Technology of
Japan.
REFERENCES
1. Gehring WJ and Hiromi Y: Homeotic genes and the homeobox. Annu Rev Genet
20:147-173, 1986.
16
2. McGinnis W and Krumlauf R: Homeobox genes and axial patterning. Cell 68: 283-
302, 1992.
3. Levine M and Hoey T: Homeobox proteins as sequence-specific transcription factors.
Cell 55: 537-540, 1988.
4. Ruddle FH, Bartels JL, Bentley KL, Kappen C, Murtha MT and Pendleton JW:
Evolution of Hox genes. Annu Rev Genet 28: 423-442, 1994.
5. Krumlauf R: Hox genes in vertebrate development. Cell 78: 191-201, 1994.
6. Cillo C, Barba P, Freschi G, Bucciarelli G, Magli MC and Boncinelli E: HOX gene
expression in normal and neoplastic human kidney. Int J Cancer 51: 892-897, 1992.
7. De Vita G, Barba P, Odartchenko N, Givel JC, Freschi G, Bucciarelli G. Magli MC,
Boncinelli E and Cillo C: Expression of homeobox-containing genes in primary and
metastatic colorectal cancer. Eur J Cancer 29: 887-893, 1993.
17
8. Cantile M, Cindolo L, Napodano G, Altieri V and Cillo C: Hyperexpression of locus
C genes in the HOX network is strongly associated in vivo with human bladder
transitional cell carcinomas. Oncogene 22: 6462-6468, 2003.
9. Maeda K, Hamada J, Takahashi Y, Tada M, Yamamoto Y, Sugihara,T and Moriuchi T:
Altered expressions of HOX genes in human cutaneous malignant melanoma. Int J
Cancer 114: 436-441, 2005.
10. Waltregny D, Alami Y, Clausse N, de Leval J and Castronovo V: Overexpression of
the homeobox gene HOXC8 in human prostate cancer correlates with loss of tumor
differentiation. Prostate 50: 162-169, 2002.
11. Tiberio C, Barba P, Magli MC, Arvelo F, Le Chevalier T, Poupon MF and Cillo C:
HOX gene expression in human small-cell lung cancers xenografted into nude mice. Int
J Cancer 58: 608-615, 1994.
12. Calvo R, West J, Franklin W, Erickson P, Bemis L, Li E, Helfrich B, Bunn P,
Roche J, Brambilla E, Rosell R, Gemmill RM and Drabkin HA: Altered HOX and
18
WNT7A expression in human lung cancer. Proc Natl Acad Sci U S A 97: 12776-12781,
2000.
13. Lechner JF, Wang Y, Siddiq F, Fugaro JM, Wali A, Lonardo F, Willey JC,
Harris CC and Pass HI: Human lung cancer cells and tissues partially recapitulate the
homeobox gene expression profile of embryonic lung. Lung Cancer 37: 41-47, 2002.
14. Sobin LH and Witterkind C, eds. TNM classification of malignant tumours, 6th ed.
New York: Wiley-Liss, pp97-103, 2002.
15. Takahashi Y, Hamada J, Murakawa K, Takada M, Tada M, Nogami I, Hayashi N,
Nakamori S, Monden M, Miyamoto M, Katoh H and Moriuchi T: Expression profiles
of 39 HOX genes in normal human adult organs and anaplastic thyroid cancer cell lines
by quantitative real-time RT-PCR system. Exp Cell Res 293: 144-153, 2004.
16. Raman V, Martensen SA, Reisman D, Evron E, Odenwald WF, Jaffee E, Marks J
and Sukumar S: Compromised HOXA5 function can limit p53 expression in human
breast tumours. Nature 405: 974-978, 2000.
19
17. Bromleigh VC and Freedman LP: p21 is a transcriptional target of HOXA10 in
differentiating myelomonocytic cells. Genes Dev 14: 2581-2586, 2000.
18. Williams TM, Williams ME, Heaton JH, Gelehrter TD and Innis JW: Group 13
HOX proteins interact with the MH2 domain of R-Smads and modulate Smad
transcriptional activation functions independent of HOX DNA-binding capability.
Nucleic Acids Res 33: 4475-4484, 2005.
19. Shen WF, Krishnan K, Lawrence HJ and Largman C: The HOX homeodomain
proteins block CBP histone acetyltransferase activity. Mol Cell Biol 21: 7509-7522,
2001.
20. Zhang X, Zhu T, Chen Y, Mertani HC, Lee KO and Lobie PE: Human growth
hormone-regulated HOXA1 is a human mammary epithelial oncogene. J Biol Chem
278: 7580-7590, 2003.
21. Ramachandran S, Liu P, Young AN, Yin-Goen Q, Lim SD, Laycock N, Amin MB,
Carney JK, Marshall FF, Petros JA and Moreno CS: Loss of HOXC6 expression induces

20
apoptosis in prostate cancer cells. Oncogene 24: 188-198, 2005.
21
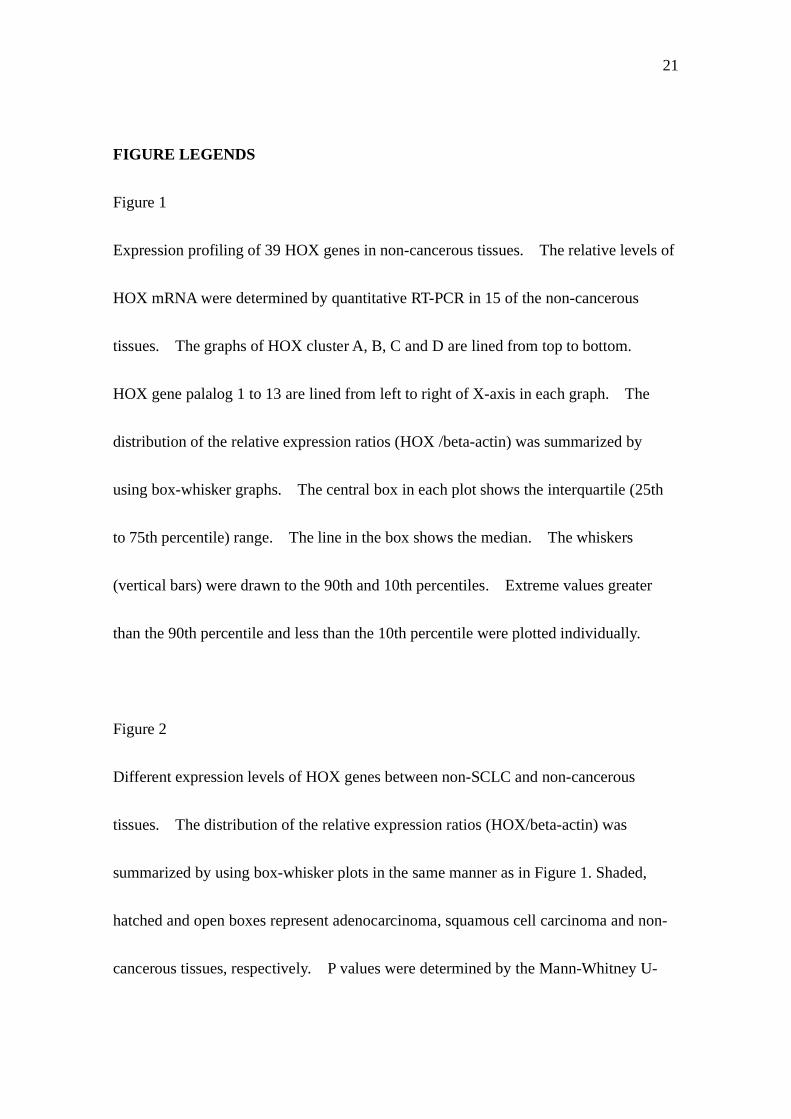
FIGURE LEGENDS
Figure 1
Expression profiling of 39 HOX genes in non-cancerous tissues. The relative levels of
HOX mRNA were determined by quantitative RT-PCR in 15 of the non-cancerous
tissues. The graphs of HOX cluster A, B, C and D are lined from top to bottom.
HOX gene palalog 1 to 13 are lined from left to right of X-axis in each graph. The
distribution of the relative expression ratios (HOX /beta-actin) was summarized by
using box-whisker graphs. The central box in each plot shows the interquartile (25th
to 75th percentile) range. The line in the box shows the median. The whiskers
(vertical bars) were drawn to the 90th and 10th percentiles. Extreme values greater
than the 90th percentile and less than the 10th percentile were plotted individually.
Figure 2
Different expression levels of HOX genes between non-SCLC and non-cancerous
tissues. The distribution of the relative expression ratios (HOX/beta-actin) was
summarized by using box-whisker plots in the same manner as in Figure 1. Shaded,
hatched and open boxes represent adenocarcinoma, squamous cell carcinoma and non-
cancerous tissues, respectively. P values were determined by the Mann-Whitney U-

22
test.
Figure 3
Different expression levels of HOX genes between adenocarcinoma and squamous cell
carcinoma tissues. The distribution of the relative expression ratios (HOX/beta-actin)
was summarized by using box-whisker plots in the same manner as in Figure 1. Shaded
and hatched boxes represent adenocarcinoma and squamous cell carcinoma,
respectively. P values were determined by the Mann-Whitney U-test.
Figure 4
Relationships between the levels of CEA and HOXD3 or D4 in non-SCLC. (A)
Correlation plots for HOXD3 (x-axis) vs. CEA (y-axis). The Spearman correlation
coefficient was r = 0.389 with p = 0.0166 (n = 39). B, Correlation plots for HOXD4
(x-axis) vs. CEA (y-axis). The Spearman correlation coefficient was r = 0.407 with p
= 0.0122 (n = 39). Closed and open circles represent adenocarcinoma and squamous
cell carcinoma samples, respectively.
Figure 5
23
Immunohistochemical staining of HOXA5 and A10. Immunoreactivity of HOXA5 and
A10 was observed in tumor cells but not in interstitial tissues (A, HOXA5; C, HOXA10,
original magnification x40). Immunoreactivity of both HOXA5 and A10 was
observed in the cytoplasm but not the nuclei of the tumor cells (B, HOXA5; D,
HOXA10, original magnification x400).
0
.005
.01
.015
1 2 3 4 5 6 7 9 10 11 13
0
.005
.01
.015
1 2 3 4 5 6 7 9 138
0
.005
.01
.015
4 5 6 8 9 10 11 1312
0
.005
.01
.015
1 3 4 9 10 11 138 12
Rel
ativ
e ex
pre
ssio
n r
atio
(H
OX
/ββββ-a
ctin
)HOXA
HOXB
HOXC
HOXD
Figure 1-Abe et al.
0
.001
.002
.003
.004
.005
.006
.007
0
.001
.002
.003
.004
.005
.006
.007
0
.01
.02
.03
.04
0
.003
.006
.009
.012
HOXA1 HOXA5
HOXC6HOXA10
Rel
ativ
e ex
pre
ssio
n r
atio
(H
OX
/ββββ-a
ctin
)
Figure 2 Abe et al.
p = 0.0088
p = 0.0002
p = 0.0097
p = 0.0001
p = 0.0003p = 0.0088
0
.002
.004
.006
0
.001
.002
.003
.004
.005
.006
.007HOXA1
0
.003
.006
.009
.012
.015HOXD9
HOXD11
0
.0005
.001
.0015
.002
.0025HOXD10
Figure 3 Abe et al.
Rel
ativ
e ex
pre
ssio
n r
atio
(H
OX
/ββββ-a
ctin
)
p = 0.0042 p = 0.005
p = 0.0009p = 0.0033
0.0100.0080.0060.0040.00200
10
20
30
40
50
Relative expression ratio (HOXD3/ββββ-actin)
CE
A (
ng
/ml)
0.0200.0150.0100.00500
10
20
30
40
50
Relative expression ratio (HOXD4/ββββ-actin)
CE
A (
ng
/ml)
A B
Figure 4 Abe et al.
A B
DC
200 µµµµm
200 µµµµm
50 µµµµm
50 µµµµm
Figure 5 Abe et al.
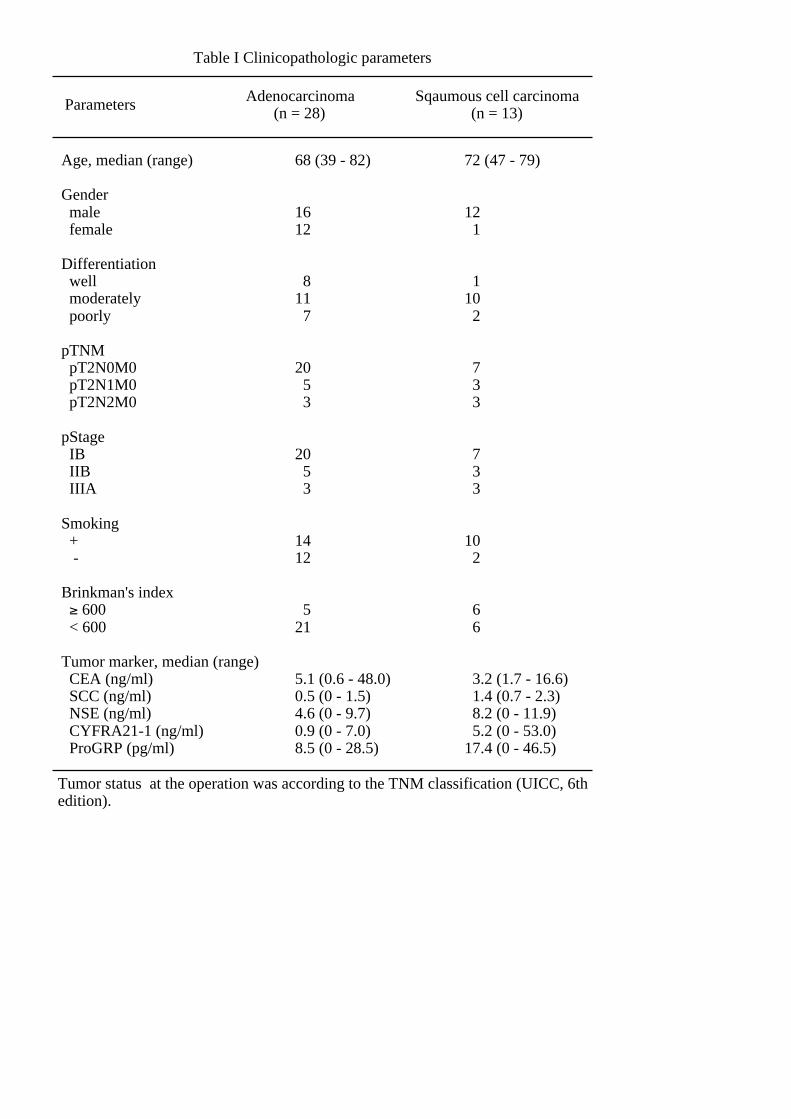
Table I Clinicopathologic parameters
Age, median (range)
Gender male female
Differentiation well moderately poorly
pTNM pT2N0M0 pT2N1M0 pT2N2M0
pStage IB IIB IIIA
Smoking + -
Brinkman's index ≥ 600 < 600
Tumor marker, median (range) CEA (ng/ml) SCC (ng/ml) NSE (ng/ml) CYFRA21-1 (ng/ml) ProGRP (pg/ml)
Adenocarcinoma (n = 28)
Sqaumous cell carcinoma (n = 13)
68 (39 - 82)
1612
811 7
20 5 3
20 5 3
1412
521
5.1 (0.6 - 48.0)0.5 (0 - 1.5)4.6 (0 - 9.7)0.9 (0 - 7.0)8.5 (0 - 28.5)
72 (47 - 79)
12 1
110 2
7 3 3
7 3 3
10 2
6 6
3.2 (1.7 - 16.6) 1.4 (0.7 - 2.3) 8.2 (0 - 11.9) 5.2 (0 - 53.0)17.4 (0 - 46.5)
Parameters
Tumor status at the operation was according to the TNM classification (UICC, 6th edition).