instructions for use - eprints.lib.hokudai.ac.jp5)_p525-539.pdf · title palaeohydrological...
TRANSCRIPT

Instructions for use
Title Palaeohydrological Evaluations for Qinghai Plateau, China, on the Climatic Changes Since the late Pleistocene
Author(s) NAKAO, Kinshiro; URAKAMI, Koichi; MOMOKI, Yoshiro; TOKUNAGA, Eiji
Citation Journal of the Faculty of Science, Hokkaido University. Series 7, Geophysics, 9(5), 525-539
Issue Date 1995-03-14
Doc URL http://hdl.handle.net/2115/8805
Type bulletin (article)
File Information 9(5)_p525-539.pdf
Hokkaido University Collection of Scholarly and Academic Papers : HUSCAP

Jour. Fac. Sci., Hokkaido Univ., Ser. VII (Geophysics), Vol. 9, No.5, 525-539, 1995.
Palaeohydrological Evaluations for Qinghai Lake,
Qinghai Plateau, China, on the Climatic
Changes Since the Late Pleistocene
Kinshiro Nakao, Koichi U rakami, Yoshiro Momoki
Department of Geophysics, Faculty of Science, . Hokkaido University, Sapporo 060, Japan
and
Eiji Tokunaga
Faculty of Economics, Chuo University, Tokyo, 192-03, Japan
(Received November 30, 1994)
Abstract
The China-Japan Joint expedition for Qinghai Lake had been carried out in 1987 and 1988, to clarify the changes of the Asian monsoonal activity by the palaeohydrological evaluation on the water budget of palaeo-lake levels since the late Pleistocene. Qinghai Lake, situated in the northeastern part of Tibet-Qinghai Plateau at latitude 3TN and longitude 100'E, is a closed saline lake in the interior China. Its morphometric features are: 4,484 km2 in area, 27 m in the maximum depth and 14.8 m in mean depth, the lake surface being 3,193 m above mean sea level and the basin has an area of 30,030 km2
•
The lake is shallowing year by year, after Kozloff's expedition measured the maximum depth of 36.6 m in 1908 (Kozloff, 1909), and the lowering tendency of lake level became remarkably after 1955. The lowering of lake level came to the conclusion which was effectively influenced by the increase of irrigation from the inlet rivers to the rapeseed farms around the lake as resulted by the water budget analysis.
The QinghaI Lake had been continued probably on the situation of an open lake to the end of the Riss-Wiirm interglacial epoch, cleared as the results of studies for the sedimentary structure along the Daotang River (Nakao, 1995). But, the lake came down to the lowest lake level of 5 m on the maximum depth in the end of the last glaciation; the last glacial maximum, because the Asian monsoon became extremely weak activity. In this time, the annual value of 184 mm for the precipitation is estimated by the water budget of the lake basin in the lowest stage of lake level.
In the opening of the Holocene, about 12,000 yr. B.P., the lake level was risen up to about 105 m in the relative height for the present lake level by the supplying of a melted water from the mountain glacier reached to the lowest limit of 3,800 m in the altitude. The volumes of melted water are equivalent of glacier ice covered by the

526 K. Nakao et al.
thickness of about 160 m over the mountainous area. The highest lake level risen by the flooding of a melted water, attained firstly to the equilibrium stage on the highest lacustrine terrace in the relative height of 80 m above the present lake level, in about 8,000 yr. B.P., when the annual precipitation estimated the values of 398 mm by the water budget. After this time; Hypsithermal age, the lake level has been continued fundamentally to fall down to present. The palaeohydrological changes for Qinghai Lake are depended clearly by the rhythm of monsoon activity synchronized the variation of an ice cover area on the Qinghai Plateau.
1. Introduction
Qinghai Lake, so called Qinghai Fu or Koko N or in the meaning of a blue sea by a Chinese and Mongolian words and situated in the far eastern part of Qinghai Plateau at latitude 3TN and longitude 100"E, is a closed saline lake in the interior China. Its morphometric features are 4,484 km2 in a lake area estimated from the satellite photo, 27 m in maximum depth measured in July 1988 and 14.8 m in mean depth in consideration of the decline of a lake level, based on the bathymetric map published in 1976, adjusted to the lake surface being 3,193 m above mean sea level at present. The basin areas around the lake estimated 25,544 km2 on the basis of the satellite photo. The morphometric features for the Qinghai Lake Basin are shown by Fig. 1 and summarized by Table l.
The first footmark for lake was made by Kozloff's expedition supported by Russian Geography Society in 1908. The two staves of the expedition party; geologist Mr. Chernof and topographer Mr. Chetyrkin measured the maximum
Table 1. Morphometric features are summarized for the Qinghai Lake Basin.
Morphometric features of Qinghai Lake
Lake area (AI) 4,484 km'
Basin area (A=AI + A,) 30,028 km'
(included lake)
Lake area of the highest level (+ 100 m)
Lacustrine terraces
Maximum depth
Mean depth (dm)
Lake altitude
lowest one
middle one
highest one
8,840 km'
Relative height
10~15m
25~50 m
60~80m
27 m (1988)
14.8m
3,193 m

o Hainan
Fig, 1. Topographic outline of the Qinghai Lake Basin was made on the basis of the satellite photo,
>-rj Cl 5) (I) o ::r '< 0.. ..., 2-o
(fq
0' 2'..
~ Cl
2" Cl r+
0' ;:J if'
H-, o ..., D S'
(fq ::r 2::, l" Cl ?;"
.(1)
Q s' Cl
CJl N --J

528 K. Nakao et al.
depth of 36.6 m near the Haixin Island and the relative height of 61 m for the peak of the Haixin Mountain above the lake surface (Kozloff, 1909). The next expedition was carried out for the synthetic researches on geological, geomorphological, limnological standpoints from 1961 to 1962, in a nucleus of Lanzhou Institute of Geology, Academia Sinica (Lanzhou Institute of Geology et aI., 1979). They made clear by this first scientific researches for Qinghai Lake that it was 28.7 m on the maximum depth and also the lake was formed in the fault basin, Daotang River was continued on the open condition to Yellow River until the late or early Pleistocene.
Recently, Western German Scientific Expedition headed Professor ]lirgen Hovermann of Gottingen University had been carried out for the geographical studies on the Qinghai-Xizang Plateau, jointed by Lanzhou Institute of Glaciology and Cryopedology, Academia Sinica in 1981 and it was pointed out by H. Flohn (1987) that the Qinghai-Xizang Plateau as heat source gave the strong effects to the large-scale summer monsoon system in south Asia and north Africa.
In 1985, the Swiss party headed Dr. Kerry Kelts resulted in success on the seismic profiling and picked up the sediments cores in Qinghai Lake, cooperated by Qinghai Salt Lake Institute, Academia Sinica (Kelts et aI., 1988; Lister et aI., 1991). Especially, they found out the lowest lake-level of 5 m in the maximum depth in the latest Pleistocene.
2. Climate and lowering tendency of lake-level at present
The annual precipitation and the mean annual air temperature are respectively 375 mm and -0.6°C at Gangcha Meteorological Station, based on the record during the period from 1958 to 1986, as shown by Table 2. The seasonal variation on precipitation is characterized by the increase in the May-October period when it accounts for 90% of the annual precipitation and the snowfall amounts in winter season are only 3% of the annual one. The precipitation concentrated at the summer season of snow free period is characterized by the active Asian monsoon as the result of a solar heating on the plateau, as pointed by Flohn (1987).
The amounts of evaporation were calculated by using the penman's method (Penman, 1954, 1956; Nakao, 1974), from the meteorological data at Gangcha Meteorological Station as shown in Table 2 as follows:
Eo=(0.417L1 He+/ Ea)/(0.417L1+/);

Palaeohydrological Evaluations for Qinghai Lake, China
Table 2. Mean Meteorological data based on record during 1957-1986 p.eriod at Gangcha Meteorological Station.
Saturated
529
Air Relative Vapor Wind Precipitation Vapor Rate of Month Temperature Humidity Pressure Velocity (·C) (mm)
(%) (mb) Pressure (m/s)
Sunshine (mb)
JAN -13.9 1.2 44 0.81 1.83 2.9 0.41
FEB -10.9 1.6 42 1.01 2.40 3.6 0.77
MAR -5.0 4.2 40 1.61 4.02 4.2 0.71
APL 0.8 13.2 46 2.98 6.48 4.3 0.68
MAY 5.2 42.1 56 4.96 8.85 4.2 0.61
JUN 8.0 68.8 63 6.76 10.73 3.9 0.57
JUL 10.7 88.2 68 8.75 12.87 3.6 0.57
AUG 10.1 82.9 69 8.47 12.28 3.4 0.61
SEP 5.6 55.2 69 6.28 9.10 3.2 0.61
OCT 0.2 14.1 56 3.47 6.20 3.4 0.75
NOV -7.0 3.0 45 1.52 3.38 3.9 0.81
DEC -11.5 0.8 43 0.98 2.27 3.6 0.82
ANN -0.6 375.3 54 3.97 6.70 3.7 0.66
whereEo: evaporation (mmday-') ; r: psychrometer constant, namely 0.27 (mmH/F- 1
);
whereL1: variation in saturated vapor pressure for the air temperature (mbtC) ; Ea: Ea=/(u)(ea-ed) in which /(u) is the function of wind speed u(m/s),
as given by
/(u)=0.26(0.5+0.54 u);
ea: saturated vapor pressure for the mean air temperature (mb) ; ed: vapor pressure in the air at the screen height (mb).
Besides, He shows in evaporation units for the incoming heat of the net
radiation Ho; namely He=Ho/59 (mm).
The value of Ho is obtained by the following equation;
Ho=(1- r)RA(0.18+0.55 n/N)-8Ta4 (0.56-0.078Je;J (0.10+0.90 n/N),
R A =UoIl/7rQ2) (tJ sin8 sin~+cos8 cos~ sintJ),
costJ= -tan~ tano, N=(24/n)tJ,
where r : reflection coefficient, albedo; R..: Angot value (cal/day cm2
) ;
n : duration of bright sunshine (hour) ;

530 K. Nakao et al.
N: possible duration of sunshine (hour) and n/N is rate of sunshine;
(J : Stefan's constant, 1.183 X 10⁻⁷ (cal/cm2K4 day);
'Fa: air temperature (K) ;
10 : solar constant, 2.00 cal/cm2 min;
Q : radius vector of earth for sun;
II : total hours of day, II = 1,440 min. ;
to : hour angle of half day;
o apparent declination of sun;
q; : latitude.
The reflection coefficient for the shortwave income, namely albedo, was
obtained by taking r=0.05 for the open water surface during the summer when
the air temperature was above O°C and by taking r = 0.63 for the snow surface
during the winter when it was below O°c. The annual amounts of evaporation
calculated were 804 mm as shown in Table 3. On the other hand, Momoki
(1994) estimated the annual amounts of 920 mm for the evaporation with the
present salinity of 12.5 gkg-1 and also 850 mm for the case of a pure water at
Qinghai Lake, in the consideration of the salinity effect for suface temperature
of the lake and the increase of an income solar radiation on the altitudes of 3,200 m.
The maximum depth of 36.6 m (120 ft) at Qinghai Lake was firstly measured
Table 3. Monthly evaporation rate calculated from the meteorologi· cal data at Gangcha Meteorological Station based on record during 1957-1986 period, where unit of ly denoted cal cm-'.
Month RA(ly/day) Ho(ly/day) He(mm/day) L1(mb/K) E;,(mm/day)
JAN 413.4 -63.2 -1.07 0.167 -0.16
FEB 534.9 -100.5 -1.70 0.214 0.12
MAR 703.8 -67.5 -1.14 0.343 0.56
APL 863.7 152.7 2.59 0.467 3.41
MAY 969.7 296.9 5.03 0.620 4.14
JUN 1,013.9 315.0 5.34 0.730 4.38
JUL 991.2 310.9 5.27 0.857 4.40
AUG 904.0 279.2 4.73 0.827 3.93
SEP 762.8 204.6 3.47 0.631 2.72
OCT 600.0 125.6 2.13 0.450 1.88
NOV 451.8 -129.4 -2.19 0.293 1.08
DEC 381.0 -139.1 -2.24 0.204 -0.14
Palaeohydrological Evaluations for Qinghai Lake, China 531
by Mr. Chernof and Mr. Chetyrkin of Kozloff's expedition crew at the near site
in the southeast direction from Haixin Island in September 1908 and the site measured by them coincided unexpectedly with the deepest point obtained by the subsequent depth surveying. After Kozloff's expedition, Chinese surveyer measured the maximum depth of 32.8 m at the same site in 1955, as reported by Shi (1958). The bathymetric surveying was carried out by Lanzhou Institute of Geology, Academia Sinica (1979), in 1962. But, they missed regrettably the measurement for the deepest site and reported the maximum depth of 28.7 m
measured at two sites, 21 km away from Haixin Island to southeast and 18 km away to north-northwest. Then, on comparing with the both bathymetric maps surveyed in 1955 and 1962, it was judged that the contour line of 30.0 m depth measured in 1955 corresponded to the depth of 28.7 m measured in 1962 and the depth of the deepest site estimated 30.8 m.
Our echo soundings were carried out on the line Erhai Lake to Haixin Island and near Haixin Island in 1988 and measured the maximum depth of 27 m at the deepest point sited about 5 km away from Haixin Island to east-southeast and also the site measured the 28.7 m depth in 1962, was pointed out the depth of 25. 5 m by our surveying. Then, the maximum depth in 1962 estimated finally the depth of 31.5 m.
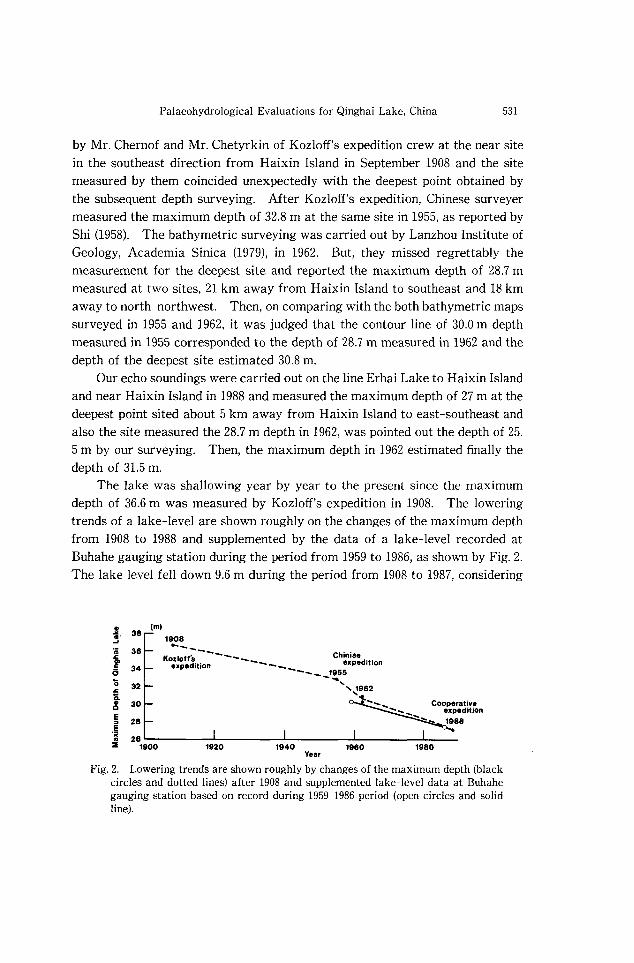
The lake was shallowing year by year to the present since the maximum depth of 36.6 m was measured by Kozloffs expedition in 1908. The lowering trends of a lake-level are shown roughly on the changes of the maximum depth from 1908 to 1988 and supplemented by the data of a lake-level recorded at Buhahe gauging station during the period from 1959 to 1986, as shown by Fig. 2.
The lake level fell down 9.6 m during the period from 1908 to 1987, considering
J 38 (m) .. ' ...
'iii 38 .c f 34 is 0 32 .c Co II 30 Q
E 28 " ,Ii .. 28 ..
:II 1900
1908 --KOZIO";----- Chinise
expedition ---_ expedition ----_ 1955 --....
1920 1940 Year
'..1962 'Co_
1960
...... ...... -- ,..~
1980
Fig. 2. Lowering trends are shown roughly by changes of the maximum depth (black circles and dotted lines) after 1908 and supplemented lake-level data at Buhahe gauging station based on record during 1959-1986 period (open circles and solid line).

532 K. Nakao et al.
that the maximum depth decreased from 36.6 m to 27.0 m. On the other side, Mr. Chernof and Mr. Chetyrkin surveyed the relative
height between the lake-level and Haixin Mountain peak in 1908 (Kozloff, 1909) and obtained the relative height of 61 m. Haixin Mountain peak is the altitude of 3,266 m above sea level with the surveying and also the lake-level in 1987
co 200 g § mm Gangcha meteological site
:a.;:: 100 ,\
~.~ /\ A /\
§.~ or-----~~--~~~~'~\~~~/'-·--~~_7~/~\~--_,~~~~,~~~/--J\ .~ IV ... ...",,' '..J w.... \,' '...... / './ ... ~ ~ 5. ......~ 'V'-~ .~ -100
'" "" 0) 3197 m
~ , !i ! ... o
5
~ 4 '" E
m 3193 :::l c: c:
"'"
Buhahe gauging. station
1985
Fig. 3. Yearly changes on the deviated value of annual precipitation at Gangcha Meteorological Station and annual mean value of lake-level at Buhahe gauging station based on record during 1959-1986 period.
100 mm
CD
&i ~£ .~ ~ -.00 a.CI P
" .. " ~ / \ os,oofm f \ R P-c ';; I \ I \ ~, ~ I , .0
~ i 0 ----------A----'t----;-j,---I-~-'sr::.~~-L-'_'. __ /--~-~~---O:-O~ ",-§ I'd', I \ I \1 1:\., I '0
_00. / b..-o-._d b._j " -100 ........... "", ....
~ 3
id~-~ -20 1880 65 70 75 80 1985
Fig. 4. Deviated values of annual precipitation are shown at Gangcha and Buhahe site and also annual mean of flow rate for Buha River during 1959-1986 period.

Palaeohydrological Evaluations for Qinghai Lake, China 533
recorded about 3,193 m above sea level. The relative height was estimated with 73 min 1987. Then, the faIling height of a leke-level was roughly concluded as
about 12 m during 79 years. Furthermore, Erhai Lake of a lagoon situated at the estuary of Daotang
River could not find on the geographic map of Qinghai Lake sketched by Kozloff (1909). Erhai Lake would be appeared by the lowering of a lake-level after 1908. The lowering tendency of a lake-level became remarkably high after 1955 as shown by Fig. 2. The self recording of a lake-level started at Buhahe
gauging station from 1958 and the lake-level has been declined gradually to the present in the average rate of 9.6 cmyc 1 as shown by Fig. 3.
The precipitation data are continually recorded at Gangcha and Buha sited near the estuarys of Saryu River and Buha River after 1958. The decreasing tendency of annual precipitation cannot be seen for both data. Also, the flow rate is recorded on Buha River after 1957 that it is one of the main rivers inflowed to a lake together with Saryu River. The decreasing tendency is found out clearly on the yearly changes of a flow rate after 1967, but on the contrary it is not changeable for the annual precipitation as shown by Fig. 4. The modern lowering of lake-level is caused by the irrigation for the rape oil farm
on the lacustrine plain.
3. Water budget and lake-level stability for Qinghai Lake at present
Qinghai Lake has the area of 4,484 km2 and the lake-level of 3,193 m above sea level in the end of 1986. The basin around the lake has the area of 25,544 km2
. The basin has two land features: a high mountainous region and a steppe land. The former is covered with a rock debris above the altitude of 4,000 m and the latter is covered with a grass and poor vegetation on the more lower altitude. Also the rape oil farm on the lacustrine plain tends to spread widely more and more.
The lake is a closed tectonic basin and it has the main inlet rivers of Buha River (basin area, 14,337 km2
) and Saryu River which occupy 68% of the total inflow to a lake.
Table 4. Monthly discharged rate (m'/s) based on record during 1959-1986 period for Saryu River and Buha River.
Q,,(m'/s) JAN FEB MAR APR MAY JUN JUL AUG SEP OCT NOV DEC YEAR
Saryu R. 0.21 0.12 0.64 3.37 6.89 11.0 22.0 17.0 15.2 6.96 2.58 0.72 7.26
Buha R. 2.37 2.30 2.44 3.67 12.5 36.3 86.8 70.3 52.9 20.3 5.81 2.75 25.0
534 K. Nakao et al.
An annual water budget of Qinghai Lake was estimated, using the meteorological data tabulated in Table 2 and the inflow data in Table 4. When the period of water budget is longer with yearly unit and surface storage due to the snow cover are neglected in comparison with other values; then (Qri+ Qgi)llt=
(P- Eg)A2, where Qri and Qgi are the river inflow and the groundwater inflow to a lake; llt and A2 are the period of a water budget and the area of the drainage basin around a lake; P and Eg denote respectively the precipitation and evapotranspiration for the drainage basin during llt.
If the lake-level is kept with stable state in secular variations, a water budget is given by the following equation because no outflows by a river and a groundwater occur from a closed basin:
where
aP-bEo=O,
a =(AI + A 2)/ AI, a =6.70,
b=(AI + IA2)/AJ, I=-EgjEo,
Eo and Al denote respectively the evaporation from the lake surface and the lake area. Then, the value of f is estimated as 0.37, where P=375 mm yc l and Eo=804 mm yc l on a drainage basin.
As for values of 1 in humid regions, Nakao (1974) estimated 1=0.65 in Ishikari River, Hokkaido, Japan and Penman (1941) estimated 1=0.75 in England. As for a value of 1 in an arid region, Nakao (1975) estimated it to be 0.15 at Lake Lahontan, Nevada, U.S.A., using the hydrological data of Broecker et al. (1958) and Nakao et al. (1981) estimated 1 =- 0.3 in the forest basin of discontinuous permafrost, at Harding Lake, Interior Alaska, U.S.A., and Nakao et al. (1986) estimated 1 = 0.5 for the tundra plain and 1 = 0.15 - 0.3 for the mountainous region with a debris of poor vegetation, St. Lawrence Island in Bering Sea. The value (J = 0.3) at Harding Lake basin may be smaller because that part of incoming radiation is expended to melt underground ice.
Meanwhile, the value (J = 0.5) for the tundra plain may be larger than the value at Harding Lake due to the swampy ground condition. This value (J == 0.37) for Qinghai Lake basin is judged to be a proper value in the area of discontinuous permafrost where the basin is covered with a debris, a grass and poor vegetation.
But, the lake-levels are lowering year by year with the average rate of -9.6 cm yc l on record 1959-1986 period as shown by Fig. 3. Then, in the case of unstable state on lake-level, a water budget is given by the following equation:
aP- bEo =llh/llt,
Palaeohydrological Evaluations for Qinghai Lake, China 535
where Llh/Llt=P- Eo + (Qri+ Qgi)Llt/A,.
The discharged flow rate (Qr;) was measured respectively for the main rivers on the preliminary expedition of 1987 and the principal expedition of 1988,
as shown by Table 5. And also, the total inflow values of 155.0 m3 sec ' were estimated by the measuring for all inflow rivers around a lake in July 1988. On the other side, the inflow rate summed for Buha River and Saryu River obtained the value of 104.9 m3 sec- l on the measurements in July 1988. The ratio between the total inflow and that of both rivers was 67.7% and the mean annual values summed for both rivers obtained 32.3 m3 sec- l based on record during 1959-1986 period for Saryu River and Buha River in Table 4. Then, the mean totally annual inflow was evaluated with the value (Qri) of 47.7 m3 sec- l during 1959-1986 period, as judged from the above-mentioned results of measurements and recordings for the rivers.
The estimations of the groundwater inflow (Qgi) to a lake is given by the following equation based on Darcy's law for the shore lines divided the principally four river subbasins; Buha River, Harugai River, Erlangjian River and Daotang River:
Qgi=LDkI,
where Land D denote respectively the length of shore line in right angles to the flow direction of groundwater for each subbasins and the aquifer thickness; k
Table 5. Discharged flow rate (Qr,) was measured for main inflow rivers on our expeditions in 1987 and 1988.
Measurement Sept., 1987 July, 1988 Data
Inflow River Flow rate (m 3/s)
Xiaobeihu Spring 0.07 0.00
Daotang River 0.15 0.18
Jangshigu 0.18 0.06
Heima River 0.26 1.32
Riaguogu 0.44 0.25
Buha River 22.00 48.90
Saryu River 25.20 56.00
Harugai River 0.45 8.25
Gangzi River 0.41 0.57
TOTAL 49.2 115.5

536 K. Nakao et al.
Table 6. Groundwater inflow is estimated for principal four river subbasins where L, D, k and I denote respectively length of shore line, aquifer thickness, hydraulic conductivity and hydrautic gradient of groundwater head.
Subbasin L D I Qgi (km) (m) (m3 day-I)
Buha River 39.1 142 1.42 x 10⁻³ 3.0 X 10'
Harugai River 120.8 54 1.71 x 10⁻³ 4.2 X 10'
Erlangjian R. 110.9 32 1.28 x 10⁻³ 1.7 X 10'
Daotang R. 29.1 62 3.18x 10⁻³ 2.2 x 10'
Sum. 11.1 X 10'
and I are respectively the hydraulic conductivity and the hydraulic gradient of a groundwater head.
The values of D and I are estimated by the reference of the logging data on the eight test holes to 511 m depth around a lake, offered from Qinghai Geological Survey. Meanwhile, the hydraulic conductivity values were measured for the fluvial sediments at the lake shores near Erhai Lake and Gahai Lake by the field measurements of Theis's permeameter in July 1988. The mean value of k obtained 0.044 cm sec! for the groundwater aquifer. The value of Qgi is estimated to be Qgi = 11.1 X 10⁵ m3 day-l as shown in Table 6.
Then, the lowering rate of a lake-level is estimated to be ilh/ilt = - 85 mm yc 1
• This value is nearly equal as compared with the averaged value (ilh/ilt= -96 mm yc!) measured during 1957-1986 period. Also, the value (Eg =314 mm yc 1
) may be larger than the value (Eg =297 mm yr- 1) estimated in
the case of a stable state on a lake-level because a part of river inflow is used the irrigation to the rape oil farm.
4. Palaeo-water budgets for Qinghai Lake
During Riss-WOrm interglacial epoch, Qinghai Lake perhaps was discharged through Dotang River to Yellow River, due to the wet and warm climate, in the judgment for the sedimentary structure along Daotang River (N akao et aI., 1995). After the interglaical epoch, the lake was closed by the dry climate and the uplift near Mt. Sun-moon Pass in Daotang basin during the last glaciation (WOrm glaciation). The lake had recorded the lowest lake-level with the maximum depth of 5 m in 14,800 yr B.P. as reported by Lister et aI., (1991). The

Palaeohydrological Evaluations for Qinghai Lake, China
Table 7. On Qinghai plateau, changing pattern of Climate is summarized by palaeohydrological evaluations since late Pleistocene. Values of LlP denote increase for present annual precipitation.
Geological age Hydrological changes Climatic changes
Riss-Wiirm Open lake Wet, Warm Interglacical epoch (Coring near lake shore)
Wiirm glaciation Closed lake Dry, Cold 70,000~12,000 yrB.P. Al = 1,000 km'
LlP = -191 mm/yr
Opening of Holocene h= + 105 m (AI =8,840 km') ·Wet, Warm 12,000 yrB.P. melting of glaciar
lower limit 3,800 m
Hypsithermal age h= +67 m Wettest, Warmest 8,000 yrB.P. Al = 5,923 km'
LlP = 23 mm/yr
lake area (AI) is estimated to be 1,000 km2 for this lake-level.
537
Meanwhile, if the value (f = 0.37) is judged to be a proper value also in the glacial age, the annual precipitation is estimated as P=184 mm yc l by the
water budget as for Al = 1,000 km2• This value is half for the present one (P =
375 mm yr- I).
In the opening time of Holocene (about 12,000 yr B.P.), the lake-level rose up abruptly from the lowest level to the height of 105 m above the present one by the supplying of a melted water from a mountainous glacier which it reached down to the altitude of 3,800 m above sea level at the glaciation maximum (Nakao et aI., 1995). In this time the lake area (AI) was the value of 8,840 km2
and the glacier covered a mountainous area evaluated 160 m on a ice thickness for the covered area of 4,440 km2
.
Throughout the Holocene, the lake-level had kept temporarily in stable
state when it fell down to the height of 67 m above the present level in the hypsithermal age (about 8,000 yr B.P). In this time, the value of annual precipitation obtained P=398 mm yc l by the estimation of the palaeo-water budget as
for the lake area of 5,923 km2•
On Qinghai Plateau, the changing pattern of climate was revealed through
the palaeohydrological evaluations for Qinghai Lake to have fundamentally the rhythms with the warm~wet climate and the cold~dry climate since the late Pleistocene, as summarized in Table 7.

538 K. Nakao et al.
5. Conclusions
The lowering of the lake-level from the beginning of the twentieth century is caused by the irrigation to the rape oil farm from the inflow rivers at Qinghai Lake.
Meanwhile, the variations of a lake-level recorded on the laucustrine terraces and lake bottom core, is explained as the result of climatic changes since the late Pleistocene. Through the Riss-Wlirm interglacial epoch, Qinghai Lake was an open lake as that the ancient Daotang River had flowed out to Yellow River. But, in the last glaciation (Wlirm glaciation), the annual precipi. tation had decreased the half value (p= 184 mm ye 1
) of present one and the lake became a closed lake with the maximum depth of 5 m.
At the time of Holocene opening (about 12,000 yr B.P.), the lake-level rose up abruptly from the lowest level with the maximum depth of 5 m to the height of 105 m above the present lake -level, as the large quantity of a melted water was supplied from the mountainous glacier.
After that time, the lake-level fell down to the height of 67 m above the present level at the hypsithermal age (about 8,000 yr B.P.) and it had been kept temporarily on stable level. The annual precipitation obtained the value of p= 398 mm ye 1 throughout the age as estimated the water budget for the lake area of 5,923 km2
•
On Qinghai Plateau, it is clear that the climate has the changing pattern as cold-dry climate and warm-wet climate. The changing rhythms of climate depend on the monsoon activity synchronized the variation of ice area covered on Tibet-Qinghai Plateau.
Acknowledgments
The writers wish to express their hearty thanks to Chinese expedition members; Professor Y. Shi, Professor S. Wang, Associate Professor Y. Wang, Scientific researcher Mrs. R. Wu and others of Nanjing Institute of Geography and Limnology, Academia Sinica for their kind cooperation on the field works.
Also, authors would like to express their thanks to Chairman Mr. Y. Yin and Mr. H. Zhao of Provincial Committee of Science and Technology, Qinghai, China, Director Mr. X. Zhou, Mr. C. Wang and others of Qinghai Center for Science and Technology Exchange with Foreign Countries for their kind logistic support in field.
They should finally like to extend their gratitude to other Japanese memo
Palaeohydrological Evaluations for Qinghai Lake, China 539
bers; Professor Y. Yusa of Geophysical Research Station, Kyoto University, Professor R. Tanoue of Asahikawa Technical College, Professor S. Nakaya of Department of Earth Science, Hirosaki University and Technician Mr. M. Okayama of Research Center for Earthquake Prediction, Hokkaido University
for their earnest assistance in field work. The expense of this research was supported by the Grant-in-Aid for the
International Scientific Research Program (Project Nos. 62042001 and 63041007) of the Ministry of Education, Science and Culture, Japan.
References
Broecker, W.S. and P.e. Orr, 1958. Radiocarbon chronology of Lake Lahontan and Lake Bonneville, Geol. Soc. America Bull., 69, 1009-1032.
Flohn, H., 1987. Recent investigations on the climatogenetic role of the Qinghai-Xizang Plateau: Now and during the Late Cenozoic, Reports on the Northeastern part of the Qinghai-Xizang (Tibet) Plateau, Science Press, Beijing, 387-416.
Kelts, K., C.K. Zao, G. Lister, YJ. Qing, G.Z. Hing, F. Niessen, and G. Bonani, 1988. Geological fingerprints of climate history: A cooperative study of Qinghai Lake, China, Eclogae Geol. Helv., 82, No.1 167-182.
Kozloff, P.K., 1908. The Mongolia-Sze-Chuan expedition of the Imperial Russian Geographi· cal Society. The Geographical Journal, 34, No.4, 384-421.
Lanzhou Institute of Geology, Academia Sinica, et aI., 1979. Qinghai Lake Monograph of the 1961 expedition. Science Press Series, Beijing, 294 pp.
Lister, G.S., K. Kelts, C.K. Zao, ].Q. Yu and F. Niessen, 1991. Lake Qinghai, China: closedbasin lake levels and the oxygen isotope record for ostracoda since the latest Pleistocene. Palaeogeography, Palaeoclimatology, Palaeoecology, 84, 141-162.
Momoki, Y., 1994. The changing mechanism of evaporation for a closed saline lake in a cold region. (in Japanese), Doctoral thesis, Faculty of Science, Hokkaido University, 38pp.
Nakao, K., 1974. Hydrological regime on the regulation of lake-Ievel-A contribution to the paleolimnological study of Lake Biwa-, Proc. Japan Acad., 50, 665-670.
Nakao, K., 1975. Ancient precipitation estimated from the past shore-line of a closed lake (in Japanese), Water temperature Research, 18, No.6, 17-26.
Nakao, K., R. Tanoue, T. Oike, and J. LaPerriere, 1981. Water budget and lake-level stabil· ity of Harding Lake in the Interior Alaska. J. Fac. Sci., Hokkaido Univ., Ser. 7,7, 13-25.
Nakao, K., Y. Ishii, K. Urakami, and]. LaPerriere, 1986. Hydrological regime in tundra plain, St. Lawrence Island in Bering Sea. J. Fac. Sci., Hokkaido Univ., Ser. 7, 8, 1-13.
Nakao, K., R. Tanoue, and M.Okayama, 1995. Geomorphological history of the basin and the origin of Qinghai Lake, Qinghai Plateau, China. ]. Fac. Sci., Hokkaido Univ. Ser. 7, 9, 509-523.
Penman, H.L., 1954. Evaporation over parts of Europe, Assemblee Generale Rome, LA.S.H., III, 168-176.
Penman, H.L., 1956. Estimating evaporation, Trans. Amer. Geophys. Union, 37, 43-50. Shi, Y., M. Chen, W. Li and S. Yi, 1958. A primary research on physical geography (emphasiz·
ing geomorphology) of Qinghai Lake and adjacent regions. Acta Geographica Sinica, 24, No.1, 33-50.