instructional decision making, objectives, and activities … · instructional decision making,...
TRANSCRIPT
Horizon Research, Inc. 69 February 2013
CHAPTER FIVE
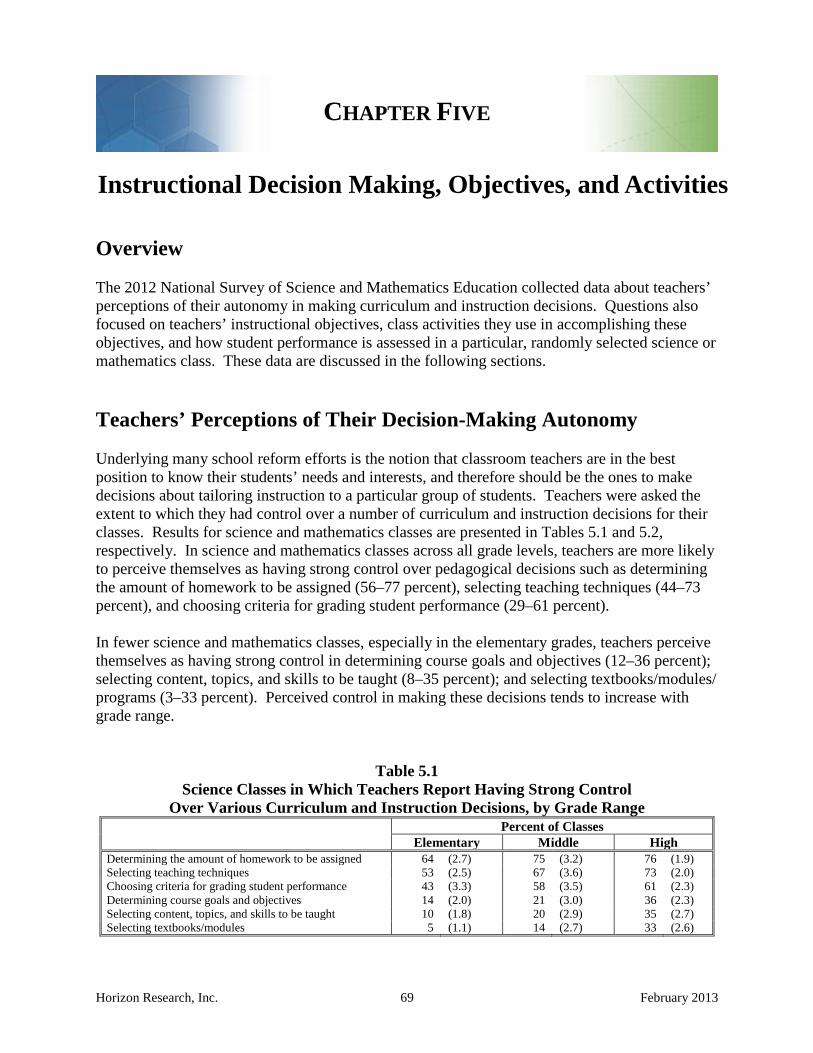
Instructional Decision Making, Objectives, and Activities Overview The 2012 National Survey of Science and Mathematics Education collected data about teachers’ perceptions of their autonomy in making curriculum and instruction decisions. Questions also focused on teachers’ instructional objectives, class activities they use in accomplishing these objectives, and how student performance is assessed in a particular, randomly selected science or mathematics class. These data are discussed in the following sections. Teachers’ Perceptions of Their Decision-Making Autonomy Underlying many school reform efforts is the notion that classroom teachers are in the best position to know their students’ needs and interests, and therefore should be the ones to make decisions about tailoring instruction to a particular group of students. Teachers were asked the extent to which they had control over a number of curriculum and instruction decisions for their classes. Results for science and mathematics classes are presented in Tables 5.1 and 5.2, respectively. In science and mathematics classes across all grade levels, teachers are more likely to perceive themselves as having strong control over pedagogical decisions such as determining the amount of homework to be assigned (56–77 percent), selecting teaching techniques (44–73 percent), and choosing criteria for grading student performance (29–61 percent). In fewer science and mathematics classes, especially in the elementary grades, teachers perceive themselves as having strong control in determining course goals and objectives (12–36 percent); selecting content, topics, and skills to be taught (8–35 percent); and selecting textbooks/modules/programs (3–33 percent). Perceived control in making these decisions tends to increase with grade range.
Table 5.1 Science Classes in Which Teachers Report Having Strong Control
Over Various Curriculum and Instruction Decisions, by Grade Range Percent of Classes Elementary Middle High
Determining the amount of homework to be assigned 64 (2.7) 75 (3.2) 76 (1.9) Selecting teaching techniques 53 (2.5) 67 (3.6) 73 (2.0) Choosing criteria for grading student performance 43 (3.3) 58 (3.5) 61 (2.3) Determining course goals and objectives 14 (2.0) 21 (3.0) 36 (2.3) Selecting content, topics, and skills to be taught 10 (1.8) 20 (2.9) 35 (2.7) Selecting textbooks/modules 5 (1.1) 14 (2.7) 33 (2.6)
Horizon Research, Inc. 70 February 2013
Table 5.2
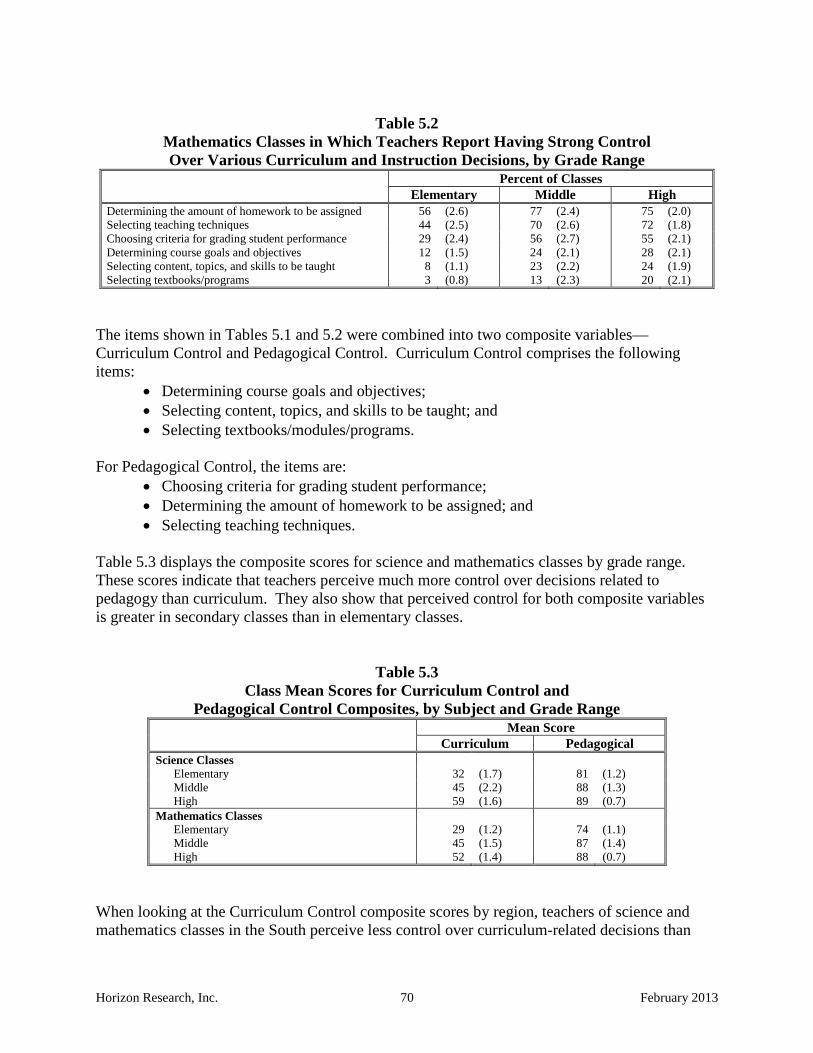
Mathematics Classes in Which Teachers Report Having Strong Control Over Various Curriculum and Instruction Decisions, by Grade Range
Percent of Classes Elementary Middle High
Determining the amount of homework to be assigned 56 (2.6) 77 (2.4) 75 (2.0) Selecting teaching techniques 44 (2.5) 70 (2.6) 72 (1.8) Choosing criteria for grading student performance 29 (2.4) 56 (2.7) 55 (2.1) Determining course goals and objectives 12 (1.5) 24 (2.1) 28 (2.1) Selecting content, topics, and skills to be taught 8 (1.1) 23 (2.2) 24 (1.9) Selecting textbooks/programs 3 (0.8) 13 (2.3) 20 (2.1)
The items shown in Tables 5.1 and 5.2 were combined into two composite variables—Curriculum Control and Pedagogical Control. Curriculum Control comprises the following items:
• Determining course goals and objectives; • Selecting content, topics, and skills to be taught; and • Selecting textbooks/modules/programs.
For Pedagogical Control, the items are:
• Choosing criteria for grading student performance; • Determining the amount of homework to be assigned; and • Selecting teaching techniques.
Table 5.3 displays the composite scores for science and mathematics classes by grade range. These scores indicate that teachers perceive much more control over decisions related to pedagogy than curriculum. They also show that perceived control for both composite variables is greater in secondary classes than in elementary classes.
Table 5.3 Class Mean Scores for Curriculum Control and
Pedagogical Control Composites, by Subject and Grade Range Mean Score Curriculum Pedagogical Science Classes
Elementary 32 (1.7) 81 (1.2) Middle 45 (2.2) 88 (1.3) High 59 (1.6) 89 (0.7)
Mathematics Classes Elementary 29 (1.2) 74 (1.1) Middle 45 (1.5) 87 (1.4) High 52 (1.4) 88 (0.7)
When looking at the Curriculum Control composite scores by region, teachers of science and mathematics classes in the South perceive less control over curriculum-related decisions than

Horizon Research, Inc. 71 February 2013
teachers of classes in other regions (see Table 5.4). There is less variation by region in pedagogical control.
Table 5.4 Class Mean Scores for Curriculum Control and
Pedagogical Control Composites, by Subject and Region Mean Score Curriculum Pedagogical Science
Midwest 54 (2.4) 88 (1.1) Northeast 46 (2.0) 84 (1.5) South 34 (1.4) 83 (1.2) West 48 (2.6) 89 (1.3)
Mathematics Midwest 48 (1.6) 84 (1.1) Northeast 40 (2.0) 78 (1.8) South 33 (1.4) 81 (1.2) West 39 (2.0) 82 (1.4)
Objectives of Science and Mathematics Instruction The survey provided a list of possible objectives of science and mathematics instruction and asked teachers how much emphasis each would receive in an entire course of a particular, randomly selected class. Table 5.5 shows the percentage of science classes by grade range whose teachers indicated heavy emphasis for each objective. Understanding science concepts is frequently emphasized, although more so in secondary classes (80 percent of middle and high school classes) than in elementary (59 percent of classes). Across all grade levels, 45 percent or more of science classes have a heavy emphasis on increasing students’ interest in science, learning science process skills, and learning about real-life applications of science. Objectives least likely to be emphasized are learning test taking skills/strategies (fewer than 25 percent of science classes) and memorizing science vocabulary and/or facts (roughly 10 percent of science classes).
Table 5.5 Science Classes with Heavy Emphasis on
Various Instructional Objectives, by Grade Range Percent of Classes Elementary Middle High Understanding science concepts 59 (2.2) 80 (2.1) 80 (1.2) Increasing students’ interest in science 56 (2.0) 57 (2.2) 50 (1.4) Learning science process skills (e.g., observing, measuring) 47 (2.1) 54 (2.3) 49 (1.6) Preparing for further study in science 35 (2.0) 40 (2.1) 46 (1.3) Learning about real-life applications of science 46 (2.3) 45 (2.3) 45 (1.5) Learning test taking skills/strategies 22 (1.6) 24 (1.7) 22 (1.2) Memorizing science vocabulary and/or facts 10 (1.3) 10 (1.2) 13 (1.3)
Horizon Research, Inc. 72 February 2013
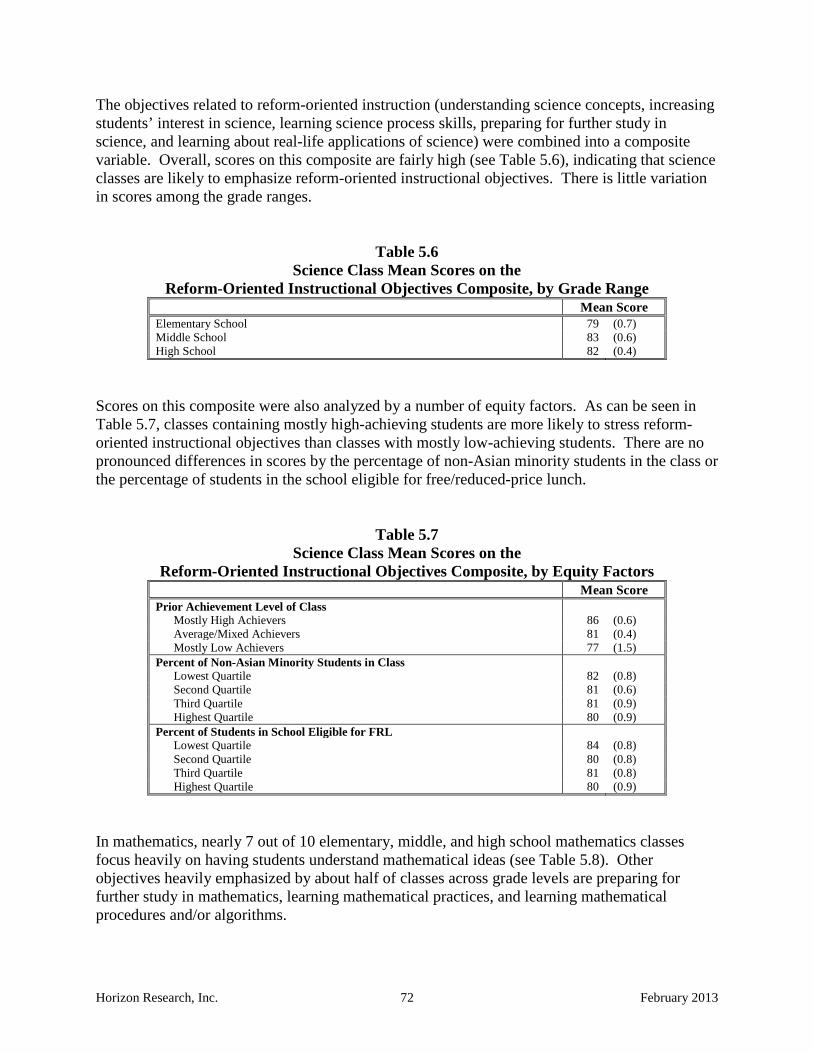
The objectives related to reform-oriented instruction (understanding science concepts, increasing students’ interest in science, learning science process skills, preparing for further study in science, and learning about real-life applications of science) were combined into a composite variable. Overall, scores on this composite are fairly high (see Table 5.6), indicating that science classes are likely to emphasize reform-oriented instructional objectives. There is little variation in scores among the grade ranges.
Table 5.6 Science Class Mean Scores on the
Reform-Oriented Instructional Objectives Composite, by Grade Range Mean Score Elementary School 79 (0.7) Middle School 83 (0.6) High School 82 (0.4)
Scores on this composite were also analyzed by a number of equity factors. As can be seen in Table 5.7, classes containing mostly high-achieving students are more likely to stress reform-oriented instructional objectives than classes with mostly low-achieving students. There are no pronounced differences in scores by the percentage of non-Asian minority students in the class or the percentage of students in the school eligible for free/reduced-price lunch.
Table 5.7 Science Class Mean Scores on the
Reform-Oriented Instructional Objectives Composite, by Equity Factors Mean Score Prior Achievement Level of Class
Mostly High Achievers 86 (0.6) Average/Mixed Achievers 81 (0.4) Mostly Low Achievers 77 (1.5)
Percent of Non-Asian Minority Students in Class Lowest Quartile 82 (0.8) Second Quartile 81 (0.6) Third Quartile 81 (0.9) Highest Quartile 80 (0.9)
Percent of Students in School Eligible for FRL Lowest Quartile 84 (0.8) Second Quartile 80 (0.8) Third Quartile 81 (0.8) Highest Quartile 80 (0.9)
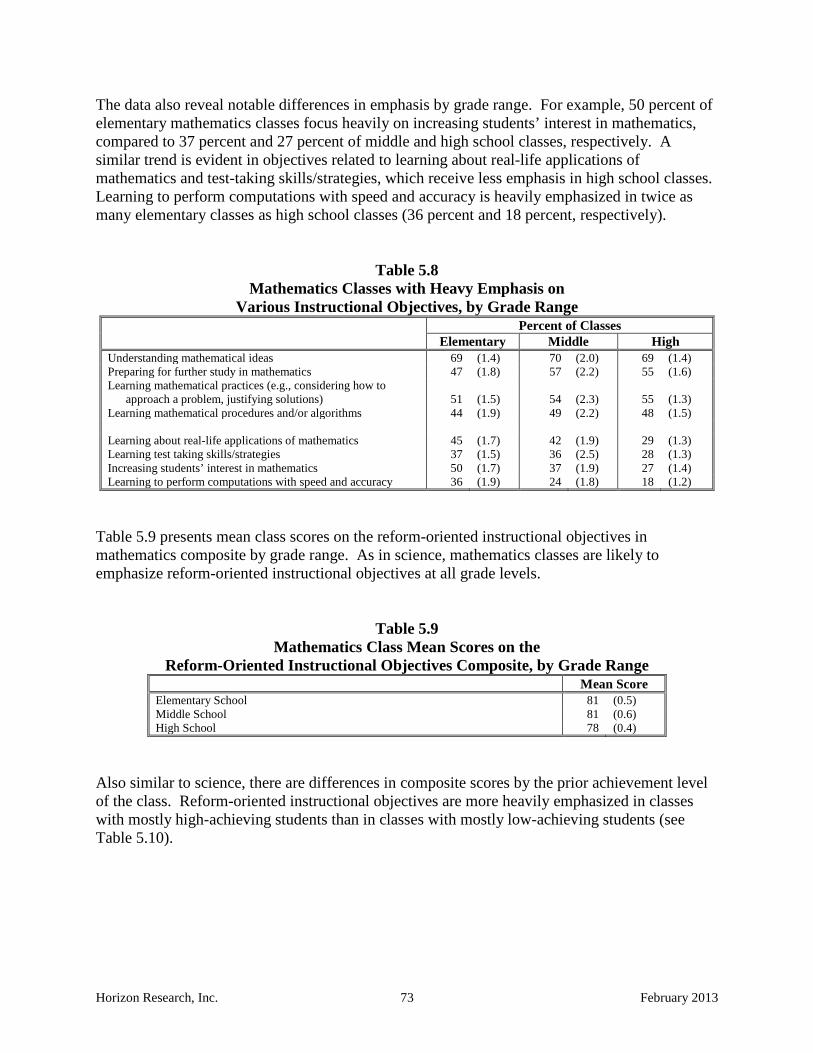
In mathematics, nearly 7 out of 10 elementary, middle, and high school mathematics classes focus heavily on having students understand mathematical ideas (see Table 5.8). Other objectives heavily emphasized by about half of classes across grade levels are preparing for further study in mathematics, learning mathematical practices, and learning mathematical procedures and/or algorithms.
Horizon Research, Inc. 73 February 2013
The data also reveal notable differences in emphasis by grade range. For example, 50 percent of elementary mathematics classes focus heavily on increasing students’ interest in mathematics, compared to 37 percent and 27 percent of middle and high school classes, respectively. A similar trend is evident in objectives related to learning about real-life applications of mathematics and test-taking skills/strategies, which receive less emphasis in high school classes. Learning to perform computations with speed and accuracy is heavily emphasized in twice as many elementary classes as high school classes (36 percent and 18 percent, respectively).
Table 5.8 Mathematics Classes with Heavy Emphasis on
Various Instructional Objectives, by Grade Range Percent of Classes Elementary Middle High Understanding mathematical ideas 69 (1.4) 70 (2.0) 69 (1.4) Preparing for further study in mathematics 47 (1.8) 57 (2.2) 55 (1.6) Learning mathematical practices (e.g., considering how to
approach a problem, justifying solutions) 51 (1.5) 54 (2.3) 55 (1.3) Learning mathematical procedures and/or algorithms 44 (1.9) 49 (2.2) 48 (1.5) Learning about real-life applications of mathematics 45 (1.7) 42 (1.9) 29 (1.3) Learning test taking skills/strategies 37 (1.5) 36 (2.5) 28 (1.3) Increasing students’ interest in mathematics 50 (1.7) 37 (1.9) 27 (1.4) Learning to perform computations with speed and accuracy 36 (1.9) 24 (1.8) 18 (1.2)
Table 5.9 presents mean class scores on the reform-oriented instructional objectives in mathematics composite by grade range. As in science, mathematics classes are likely to emphasize reform-oriented instructional objectives at all grade levels.
Table 5.9 Mathematics Class Mean Scores on the
Reform-Oriented Instructional Objectives Composite, by Grade Range Mean Score Elementary School 81 (0.5) Middle School 81 (0.6) High School 78 (0.4)
Also similar to science, there are differences in composite scores by the prior achievement level of the class. Reform-oriented instructional objectives are more heavily emphasized in classes with mostly high-achieving students than in classes with mostly low-achieving students (see Table 5.10).

Horizon Research, Inc. 74 February 2013
Table 5.10 Mathematics Class Mean Scores on the
Reform-Oriented Instructional Objectives Composite, by Equity Factors Mean Score Prior Achievement Level of Class
Mostly High Achievers 85 (0.6) Average/Mixed Achievers 80 (0.4) Mostly Low Achievers 77 (0.7)
Percent of Non-Asian Minority Students in Class Lowest Quartile 80 (0.7) Second Quartile 80 (0.5) Third Quartile 80 (0.6) Highest Quartile 81 (0.6)
Percent of Students in School Eligible for FRL Lowest Quartile 82 (0.8) Second Quartile 79 (0.6) Third Quartile 80 (0.6) Highest Quartile 80 (0.8)
Class Activities Teachers were given a list of activities and asked how often they did each in the randomly selected class; response options were: never, rarely (e.g., a few times a year), sometimes (e.g., once or twice a month), often (e.g., once or twice a week), and all or almost all science/mathematics lessons. Results for science instruction are presented first, followed by mathematics instruction. Science Instruction As can be seen in Table 5.11, across the grade ranges, roughly 50 percent of classes include the teacher explaining science ideas in all or nearly all lessons. The majority of elementary science classes engage in whole class discussions in nearly every lesson, though this activity becomes less frequent as the grade level increases. Approximately a quarter of K–12 science classes have students work in small groups in all or almost all science lessons.
Horizon Research, Inc. 75 February 2013
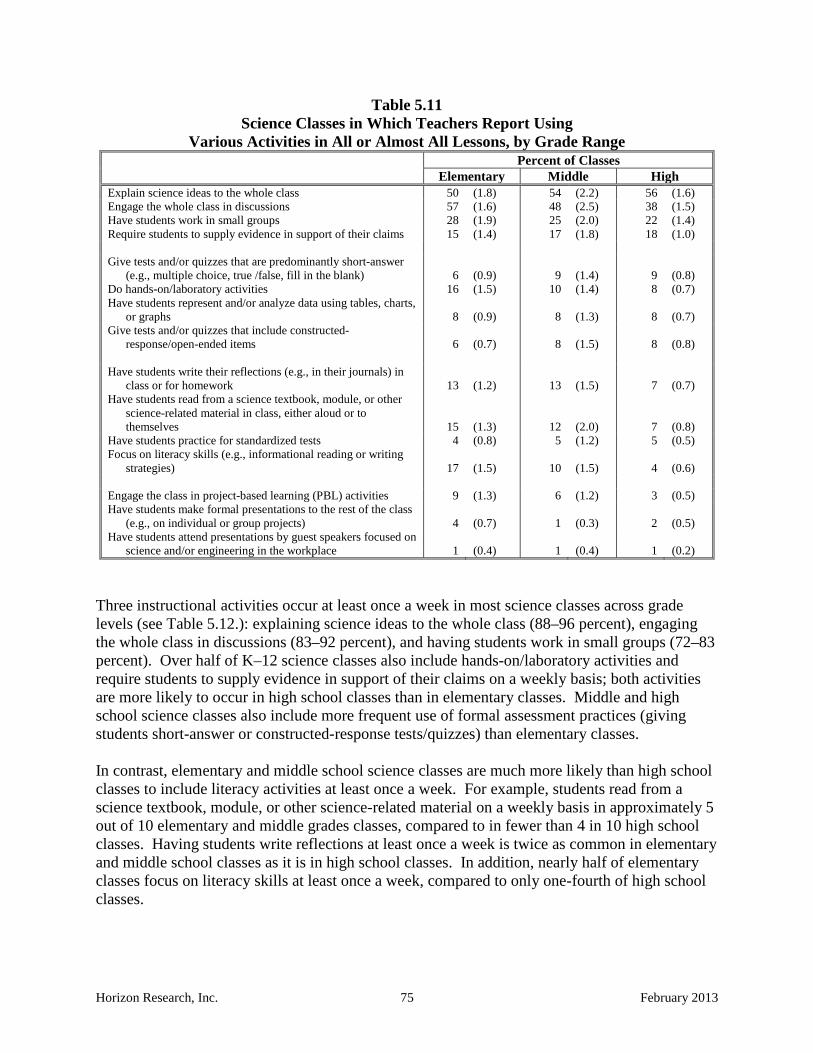
Table 5.11 Science Classes in Which Teachers Report Using
Various Activities in All or Almost All Lessons, by Grade Range Percent of Classes Elementary Middle High Explain science ideas to the whole class 50 (1.8) 54 (2.2) 56 (1.6) Engage the whole class in discussions 57 (1.6) 48 (2.5) 38 (1.5) Have students work in small groups 28 (1.9) 25 (2.0) 22 (1.4) Require students to supply evidence in support of their claims 15 (1.4) 17 (1.8) 18 (1.0) Give tests and/or quizzes that are predominantly short-answer
(e.g., multiple choice, true /false, fill in the blank) 6 (0.9) 9 (1.4) 9 (0.8) Do hands-on/laboratory activities 16 (1.5) 10 (1.4) 8 (0.7) Have students represent and/or analyze data using tables, charts,
or graphs 8 (0.9) 8 (1.3) 8 (0.7) Give tests and/or quizzes that include constructed-
response/open-ended items 6 (0.7) 8 (1.5) 8 (0.8) Have students write their reflections (e.g., in their journals) in
class or for homework 13 (1.2) 13 (1.5) 7 (0.7) Have students read from a science textbook, module, or other
science-related material in class, either aloud or to themselves 15 (1.3) 12 (2.0) 7 (0.8)
Have students practice for standardized tests 4 (0.8) 5 (1.2) 5 (0.5) Focus on literacy skills (e.g., informational reading or writing
strategies) 17 (1.5) 10 (1.5) 4 (0.6) Engage the class in project-based learning (PBL) activities 9 (1.3) 6 (1.2) 3 (0.5) Have students make formal presentations to the rest of the class
(e.g., on individual or group projects) 4 (0.7) 1 (0.3) 2 (0.5) Have students attend presentations by guest speakers focused on
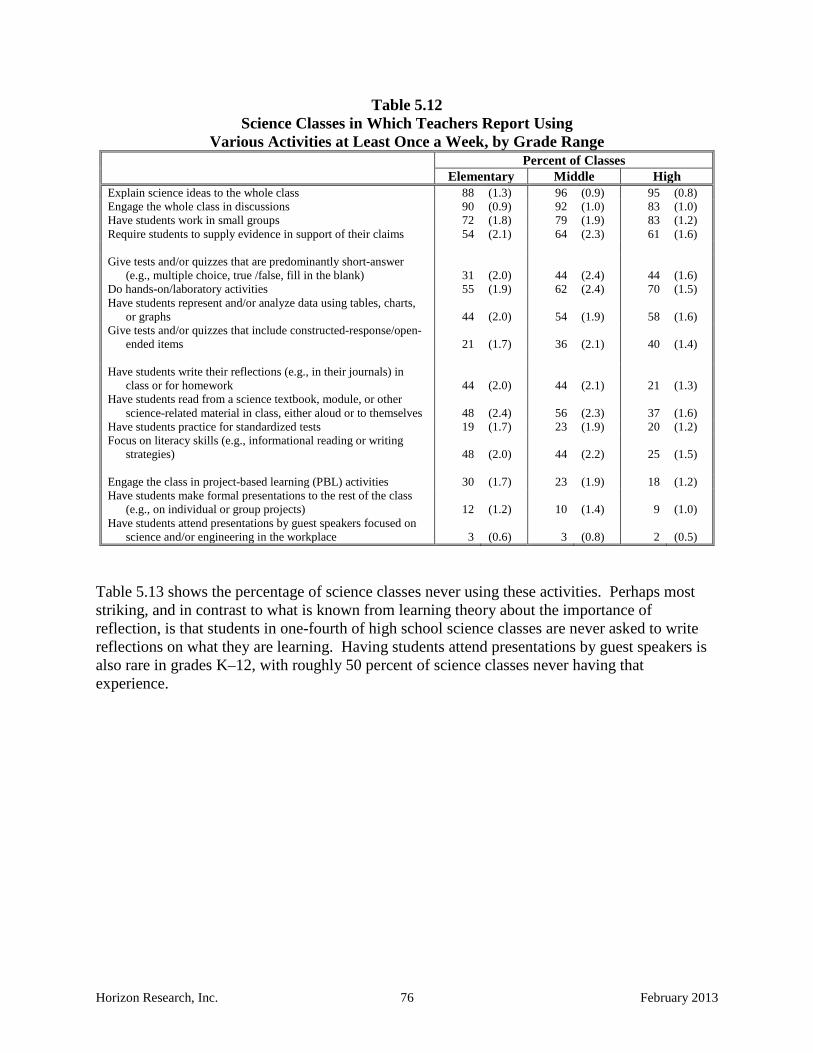
science and/or engineering in the workplace 1 (0.4) 1 (0.4) 1 (0.2) Three instructional activities occur at least once a week in most science classes across grade levels (see Table 5.12.): explaining science ideas to the whole class (88–96 percent), engaging the whole class in discussions (83–92 percent), and having students work in small groups (72–83 percent). Over half of K–12 science classes also include hands-on/laboratory activities and require students to supply evidence in support of their claims on a weekly basis; both activities are more likely to occur in high school classes than in elementary classes. Middle and high school science classes also include more frequent use of formal assessment practices (giving students short-answer or constructed-response tests/quizzes) than elementary classes. In contrast, elementary and middle school science classes are much more likely than high school classes to include literacy activities at least once a week. For example, students read from a science textbook, module, or other science-related material on a weekly basis in approximately 5 out of 10 elementary and middle grades classes, compared to in fewer than 4 in 10 high school classes. Having students write reflections at least once a week is twice as common in elementary and middle school classes as it is in high school classes. In addition, nearly half of elementary classes focus on literacy skills at least once a week, compared to only one-fourth of high school classes.
Horizon Research, Inc. 76 February 2013
Table 5.12 Science Classes in Which Teachers Report Using
Various Activities at Least Once a Week, by Grade Range Percent of Classes Elementary Middle High Explain science ideas to the whole class 88 (1.3) 96 (0.9) 95 (0.8) Engage the whole class in discussions 90 (0.9) 92 (1.0) 83 (1.0) Have students work in small groups 72 (1.8) 79 (1.9) 83 (1.2) Require students to supply evidence in support of their claims 54 (2.1) 64 (2.3) 61 (1.6) Give tests and/or quizzes that are predominantly short-answer
(e.g., multiple choice, true /false, fill in the blank) 31 (2.0) 44 (2.4) 44 (1.6) Do hands-on/laboratory activities 55 (1.9) 62 (2.4) 70 (1.5) Have students represent and/or analyze data using tables, charts,
or graphs 44 (2.0) 54 (1.9) 58 (1.6) Give tests and/or quizzes that include constructed-response/open-
ended items 21 (1.7) 36 (2.1) 40 (1.4) Have students write their reflections (e.g., in their journals) in
class or for homework 44 (2.0) 44 (2.1) 21 (1.3) Have students read from a science textbook, module, or other
science-related material in class, either aloud or to themselves 48 (2.4) 56 (2.3) 37 (1.6) Have students practice for standardized tests 19 (1.7) 23 (1.9) 20 (1.2) Focus on literacy skills (e.g., informational reading or writing
strategies) 48 (2.0) 44 (2.2) 25 (1.5) Engage the class in project-based learning (PBL) activities 30 (1.7) 23 (1.9) 18 (1.2) Have students make formal presentations to the rest of the class
(e.g., on individual or group projects) 12 (1.2) 10 (1.4) 9 (1.0) Have students attend presentations by guest speakers focused on
science and/or engineering in the workplace 3 (0.6) 3 (0.8) 2 (0.5) Table 5.13 shows the percentage of science classes never using these activities. Perhaps most striking, and in contrast to what is known from learning theory about the importance of reflection, is that students in one-fourth of high school science classes are never asked to write reflections on what they are learning. Having students attend presentations by guest speakers is also rare in grades K–12, with roughly 50 percent of science classes never having that experience.

Horizon Research, Inc. 77 February 2013
Table 5.13 Science Classes in Which Teachers Report
Never Using Various Activities, by Grade Range Percent of Classes Elementary Middle High Explain science ideas to the whole class 0 ---† 0 ---† 0 (0.1) Engage the whole class in discussions 0 ---† 0 (0.1) 1 (0.5) Have students work in small groups 0 (0.2) 0 (0.1) 0 (0.3) Require students to supply evidence in support of their claims 5 (0.7) 1 (0.7) 1 (0.3) Give tests and/or quizzes that are predominantly short-answer
(e.g., multiple choice, true /false, fill in the blank) 15 (1.3) 2 (0.5) 3 (0.4) Do hands-on/laboratory activities 2 (0.5) 2 (0.9) 1 (0.3) Have students represent and/or analyze data using tables,
charts, or graphs 2 (0.5) 0 (0.1) 0 (0.2) Give tests and/or quizzes that include constructed-
response/open-ended items 19 (1.5) 3 (0.5) 3 (0.4) Have students write their reflections (e.g., in their journals) in
class or for homework 10 (1.0) 9 (1.1) 25 (1.5) Have students read from a science textbook, module, or other
science-related material in class, either aloud or to themselves 9 (1.2) 4 (1.1) 10 (0.9)
Have students practice for standardized tests 32 (2.1) 13 (1.5) 19 (1.3) Focus on literacy skills (e.g., informational reading or writing
strategies) 6 (0.9) 3 (0.7) 9 (0.9) Engage the class in project-based learning (PBL) activities 8 (1.4) 4 (0.7) 9 (1.0) Have students make formal presentations to the rest of the
class (e.g., on individual or group projects) 16 (1.5) 6 (1.1) 11 (0.9) Have students attend presentations by guest speakers focused
on science and/or engineering in the workplace 51 (1.8) 45 (2.3) 51 (1.6) † No teachers at this grade level in the sample selected this response option. Thus, it is not possible to calculate the
standard error of this estimate. Teachers were also asked about the frequency with which they use various instructional technologies in their science classes. As can be seen in Table 5.14, technology use is generally low across grade ranges, with about one-third of classes using the Internet and 21–31 percent using personal computers at least once a week. Although calculators are used weekly in about 1 in 5 high school classes, very few elementary and middle school classes use them that often.
Table 5.14 Science Classes in Which Teachers Report that Students Use
Various Instructional Technologies at Least Once a Week, by Grade Range Percent of Classes Elementary Middle High Internet 31 (2.9) 32 (2.7) 35 (2.2) Personal computers, including laptops 21 (3.0) 23 (2.2) 31 (2.3) Calculators/Graphing calculators† 8 (1.7) 2 (0.5) 19 (1.7) Hand-held computers 2 (0.8) 4 (1.2) 9 (1.3) Probes for collecting data 7 (2.1) 2 (0.6) 8 (1.1) Classroom response system or “Clickers” 8 (2.8) 6 (1.0) 6 (1.0) † Elementary teachers were asked about their use of “calculators,” middle and high school teachers were asked about their use
of “graphing calculators.”
Horizon Research, Inc. 78 February 2013
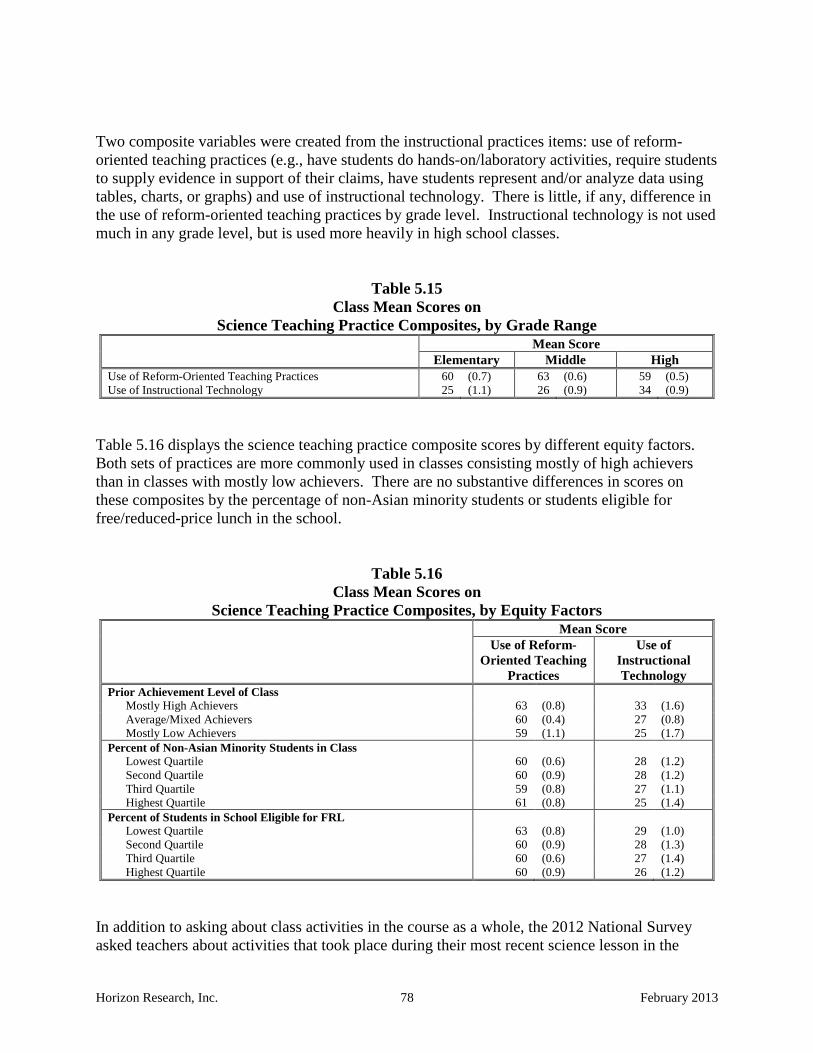
Two composite variables were created from the instructional practices items: use of reform-oriented teaching practices (e.g., have students do hands-on/laboratory activities, require students to supply evidence in support of their claims, have students represent and/or analyze data using tables, charts, or graphs) and use of instructional technology. There is little, if any, difference in the use of reform-oriented teaching practices by grade level. Instructional technology is not used much in any grade level, but is used more heavily in high school classes.
Table 5.15 Class Mean Scores on
Science Teaching Practice Composites, by Grade Range Mean Score Elementary Middle High Use of Reform-Oriented Teaching Practices 60 (0.7) 63 (0.6) 59 (0.5) Use of Instructional Technology 25 (1.1) 26 (0.9) 34 (0.9)
Table 5.16 displays the science teaching practice composite scores by different equity factors. Both sets of practices are more commonly used in classes consisting mostly of high achievers than in classes with mostly low achievers. There are no substantive differences in scores on these composites by the percentage of non-Asian minority students or students eligible for free/reduced-price lunch in the school.
Table 5.16 Class Mean Scores on
Science Teaching Practice Composites, by Equity Factors Mean Score
Use of Reform-Oriented Teaching
Practices
Use of Instructional Technology
Prior Achievement Level of Class Mostly High Achievers 63 (0.8) 33 (1.6) Average/Mixed Achievers 60 (0.4) 27 (0.8) Mostly Low Achievers 59 (1.1) 25 (1.7)
Percent of Non-Asian Minority Students in Class Lowest Quartile 60 (0.6) 28 (1.2) Second Quartile 60 (0.9) 28 (1.2) Third Quartile 59 (0.8) 27 (1.1) Highest Quartile 61 (0.8) 25 (1.4)
Percent of Students in School Eligible for FRL Lowest Quartile 63 (0.8) 29 (1.0) Second Quartile 60 (0.9) 28 (1.3) Third Quartile 60 (0.6) 27 (1.4) Highest Quartile 60 (0.9) 26 (1.2)
In addition to asking about class activities in the course as a whole, the 2012 National Survey asked teachers about activities that took place during their most recent science lesson in the

Horizon Research, Inc. 79 February 2013
randomly selected class. As can be seen in Table 5.17, roughly 90 percent of classes in each grade range include the teacher explaining a science idea to the whole class in their most recent lesson. The use of whole class discussion is also prevalent, especially in elementary lessons (91 percent), but is less common in middle and high school lessons (77 and 67 percent, respectively). About half of elementary and middle school classes include students doing hands-on/laboratory activities and reading about science in the most recent lesson, compared to fewer than 4 in 10 high school classes. In contrast, students completing textbook/worksheet problems is more common in middle and high school science lessons (51 percent and 59 percent, respectively) than in elementary lessons (43 percent).
Table 5.17 Science Classes Participating in Various
Activities in the Most Recent Lesson, by Grade Range Percent of Classes
Elementary Middle High Teacher explaining a science idea to the whole class 89 (1.2) 89 (1.4) 90 (0.9) Whole class discussion 91 (1.1) 77 (1.8) 67 (1.4) Students completing textbook/worksheet problems 43 (1.8) 51 (2.2) 59 (1.6) Students doing hands-on/laboratory activities 52 (1.9) 50 (2.3) 39 (1.5) Students reading about science 53 (2.2) 50 (2.1) 35 (1.5) Teacher conducting a demonstration while students watched 40 (2.0) 32 (2.4) 32 (1.4) Students using instructional technology 22 (1.5) 30 (2.0) 27 (1.4) Test or quiz 12 (1.2) 22 (2.0) 20 (1.4) Practicing for standardized tests 5 (0.8) 9 (1.2) 10 (0.8)
The survey also asked teachers to estimate the time spent on each of a number of types of activities in this most recent science lesson. On average, there is little difference by grade level (see Table 5.18). Approximately 40 percent of class time is spent on whole class activities, 30 percent on small group work, and 20 percent on students working individually. Non-instructional activities, including attendance taking and interruptions, account for 10 percent or less of science class time.
Table 5.18 Average Percentage of Time Spent on Different
Activities in the Most Recent Science Lesson, by Grade Range Average Percent of Class Time Elementary Middle High Whole class activities (e.g., lectures, explanations, discussions) 43 (0.8) 40 (0.9) 43 (0.6) Small group work 32 (0.9) 31 (1.2) 30 (0.7) Students working individually (e.g., reading textbooks, completing
worksheets, taking a test or quiz) 19 (0.6) 20 (0.9) 18 (0.6) Non-instructional activities (e.g., attendance taking, interruptions) 6 (0.3) 10 (0.3) 9 (0.3)
Horizon Research, Inc. 80 February 2013
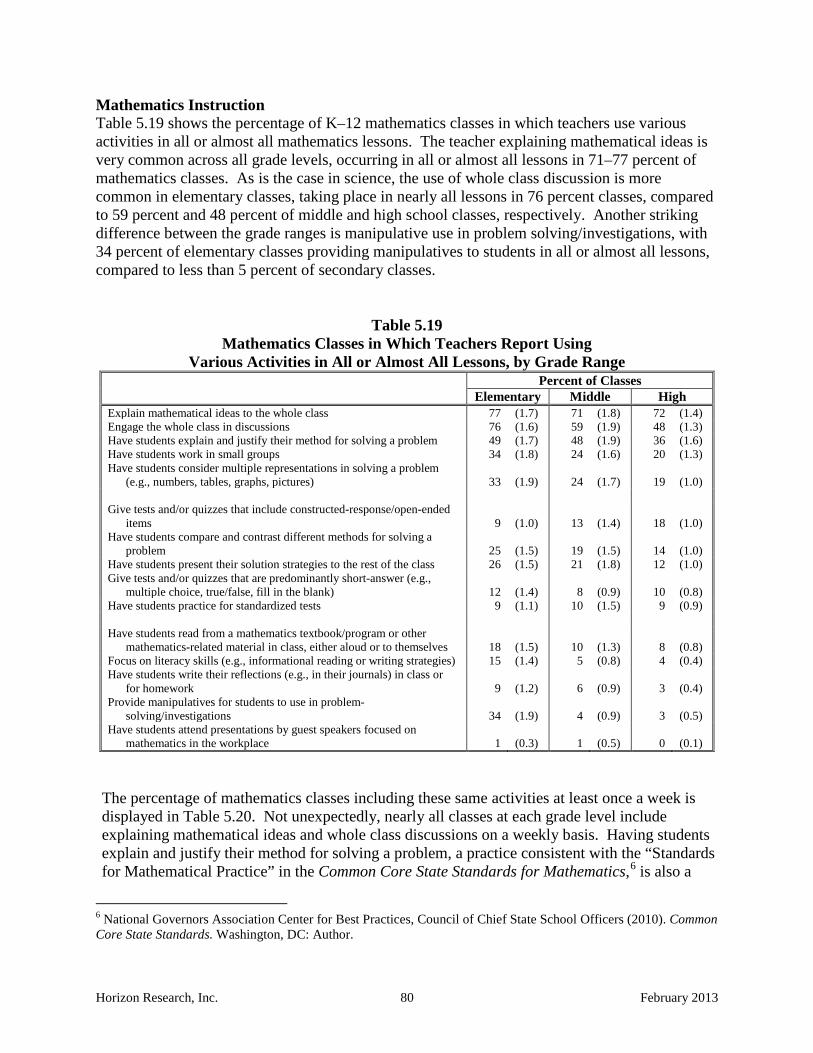
Mathematics Instruction Table 5.19 shows the percentage of K–12 mathematics classes in which teachers use various activities in all or almost all mathematics lessons. The teacher explaining mathematical ideas is very common across all grade levels, occurring in all or almost all lessons in 71–77 percent of mathematics classes. As is the case in science, the use of whole class discussion is more common in elementary classes, taking place in nearly all lessons in 76 percent classes, compared to 59 percent and 48 percent of middle and high school classes, respectively. Another striking difference between the grade ranges is manipulative use in problem solving/investigations, with 34 percent of elementary classes providing manipulatives to students in all or almost all lessons, compared to less than 5 percent of secondary classes.
Table 5.19 Mathematics Classes in Which Teachers Report Using
Various Activities in All or Almost All Lessons, by Grade Range Percent of Classes Elementary Middle High Explain mathematical ideas to the whole class 77 (1.7) 71 (1.8) 72 (1.4) Engage the whole class in discussions 76 (1.6) 59 (1.9) 48 (1.3) Have students explain and justify their method for solving a problem 49 (1.7) 48 (1.9) 36 (1.6) Have students work in small groups 34 (1.8) 24 (1.6) 20 (1.3) Have students consider multiple representations in solving a problem
(e.g., numbers, tables, graphs, pictures) 33 (1.9) 24 (1.7) 19 (1.0) Give tests and/or quizzes that include constructed-response/open-ended
items 9 (1.0) 13 (1.4) 18 (1.0) Have students compare and contrast different methods for solving a
problem 25 (1.5) 19 (1.5) 14 (1.0) Have students present their solution strategies to the rest of the class 26 (1.5) 21 (1.8) 12 (1.0) Give tests and/or quizzes that are predominantly short-answer (e.g.,
multiple choice, true/false, fill in the blank) 12 (1.4) 8 (0.9) 10 (0.8) Have students practice for standardized tests 9 (1.1) 10 (1.5) 9 (0.9) Have students read from a mathematics textbook/program or other
mathematics-related material in class, either aloud or to themselves 18 (1.5) 10 (1.3) 8 (0.8) Focus on literacy skills (e.g., informational reading or writing strategies) 15 (1.4) 5 (0.8) 4 (0.4) Have students write their reflections (e.g., in their journals) in class or
for homework 9 (1.2) 6 (0.9) 3 (0.4) Provide manipulatives for students to use in problem-
solving/investigations 34 (1.9) 4 (0.9) 3 (0.5) Have students attend presentations by guest speakers focused on
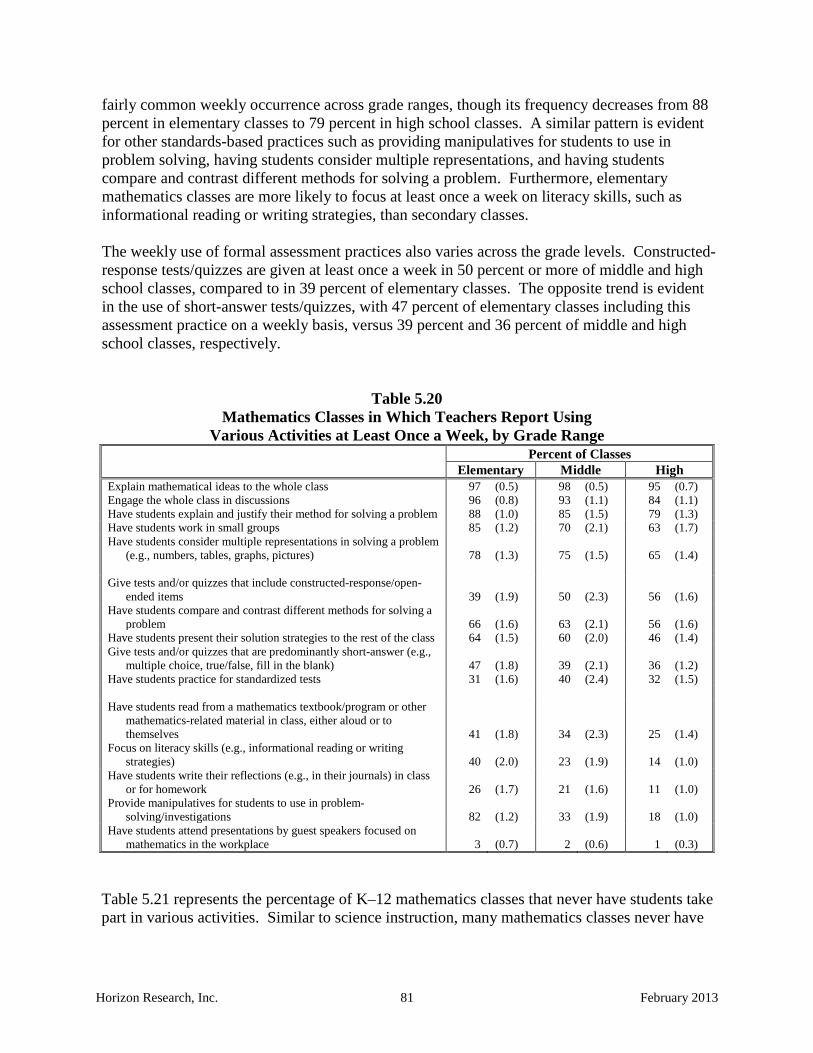
mathematics in the workplace 1 (0.3) 1 (0.5) 0 (0.1) The percentage of mathematics classes including these same activities at least once a week is displayed in Table 5.20. Not unexpectedly, nearly all classes at each grade level include explaining mathematical ideas and whole class discussions on a weekly basis. Having students explain and justify their method for solving a problem, a practice consistent with the “Standards for Mathematical Practice” in the Common Core State Standards for Mathematics,6 is also a
6 National Governors Association Center for Best Practices, Council of Chief State School Officers (2010). Common Core State Standards. Washington, DC: Author.
Horizon Research, Inc. 81 February 2013
fairly common weekly occurrence across grade ranges, though its frequency decreases from 88 percent in elementary classes to 79 percent in high school classes. A similar pattern is evident for other standards-based practices such as providing manipulatives for students to use in problem solving, having students consider multiple representations, and having students compare and contrast different methods for solving a problem. Furthermore, elementary mathematics classes are more likely to focus at least once a week on literacy skills, such as informational reading or writing strategies, than secondary classes. The weekly use of formal assessment practices also varies across the grade levels. Constructed-response tests/quizzes are given at least once a week in 50 percent or more of middle and high school classes, compared to in 39 percent of elementary classes. The opposite trend is evident in the use of short-answer tests/quizzes, with 47 percent of elementary classes including this assessment practice on a weekly basis, versus 39 percent and 36 percent of middle and high school classes, respectively.
Table 5.20 Mathematics Classes in Which Teachers Report Using
Various Activities at Least Once a Week, by Grade Range Percent of Classes Elementary Middle High Explain mathematical ideas to the whole class 97 (0.5) 98 (0.5) 95 (0.7) Engage the whole class in discussions 96 (0.8) 93 (1.1) 84 (1.1) Have students explain and justify their method for solving a problem 88 (1.0) 85 (1.5) 79 (1.3) Have students work in small groups 85 (1.2) 70 (2.1) 63 (1.7) Have students consider multiple representations in solving a problem
(e.g., numbers, tables, graphs, pictures) 78 (1.3) 75 (1.5) 65 (1.4) Give tests and/or quizzes that include constructed-response/open-
ended items 39 (1.9) 50 (2.3) 56 (1.6) Have students compare and contrast different methods for solving a
problem 66 (1.6) 63 (2.1) 56 (1.6) Have students present their solution strategies to the rest of the class 64 (1.5) 60 (2.0) 46 (1.4) Give tests and/or quizzes that are predominantly short-answer (e.g.,
multiple choice, true/false, fill in the blank) 47 (1.8) 39 (2.1) 36 (1.2) Have students practice for standardized tests 31 (1.6) 40 (2.4) 32 (1.5) Have students read from a mathematics textbook/program or other
mathematics-related material in class, either aloud or to themselves 41 (1.8) 34 (2.3) 25 (1.4)
Focus on literacy skills (e.g., informational reading or writing strategies) 40 (2.0) 23 (1.9) 14 (1.0)
Have students write their reflections (e.g., in their journals) in class or for homework 26 (1.7) 21 (1.6) 11 (1.0)
Provide manipulatives for students to use in problem-solving/investigations 82 (1.2) 33 (1.9) 18 (1.0)
Have students attend presentations by guest speakers focused on mathematics in the workplace 3 (0.7) 2 (0.6) 1 (0.3)
Table 5.21 represents the percentage of K–12 mathematics classes that never have students take part in various activities. Similar to science instruction, many mathematics classes never have

Horizon Research, Inc. 82 February 2013
students attend presentations by guest speakers. Also note that 43 percent of high school mathematics classes never ask students to write reflections.
Table 5.21 Mathematics Classes in Which Teachers Report Never Using Various Activities, by Grade Range
Percent of Classes Elementary Middle High Explain mathematical ideas to the whole class 0 (0.2) 0 ---† 0 (0.2) Engage the whole class in discussions 0 (0.2) 0 ---† 0 (0.2) Have students explain and justify their method for solving a
problem 0 (0.1) 0 (0.2) 0 (0.2) Have students work in small groups 0 (0.2) 1 (0.2) 1 (0.5) Have students consider multiple representations in solving a
problem (e.g., numbers, tables, graphs, pictures) 1 (0.2) 0 (0.2) 1 (0.3) Give tests and/or quizzes that include constructed-response/open-
ended items 13 (1.2) 4 (0.7) 4 (1.0) Have students compare and contrast different methods for solving
a problem 2 (0.4) 1 (0.3) 2 (0.3) Have students present their solution strategies to the rest of the
class 3 (0.5) 2 (0.5) 4 (0.6) Give tests and/or quizzes that are predominantly short-answer
(e.g., multiple choice, true/false, fill in the blank) 11 (1.2) 8 (1.2) 13 (1.2) Have students practice for standardized tests 17 (1.4) 4 (0.8) 9 (0.8) Have students read from a mathematics textbook/program or other
mathematics-related material in class, either aloud or to themselves 14 (1.1) 9 (1.0) 18 (1.1)
Focus on literacy skills (e.g., informational reading or writing strategies) 11 (1.0) 14 (1.3) 23 (1.3)
Have students write their reflections (e.g., in their journals) in class or for homework 22 (1.4) 26 (1.9) 43 (1.5)
Provide manipulatives for students to use in problem-solving/investigations 0 ---† 1 (0.4) 7 (0.7)
Have students attend presentations by guest speakers focused on mathematics in the workplace 79 (1.5) 76 (1.8) 78 (1.2)
† No teachers in the sample at this grade level selected this response option. Thus, it is not possible to calculate the standard error of this estimate.
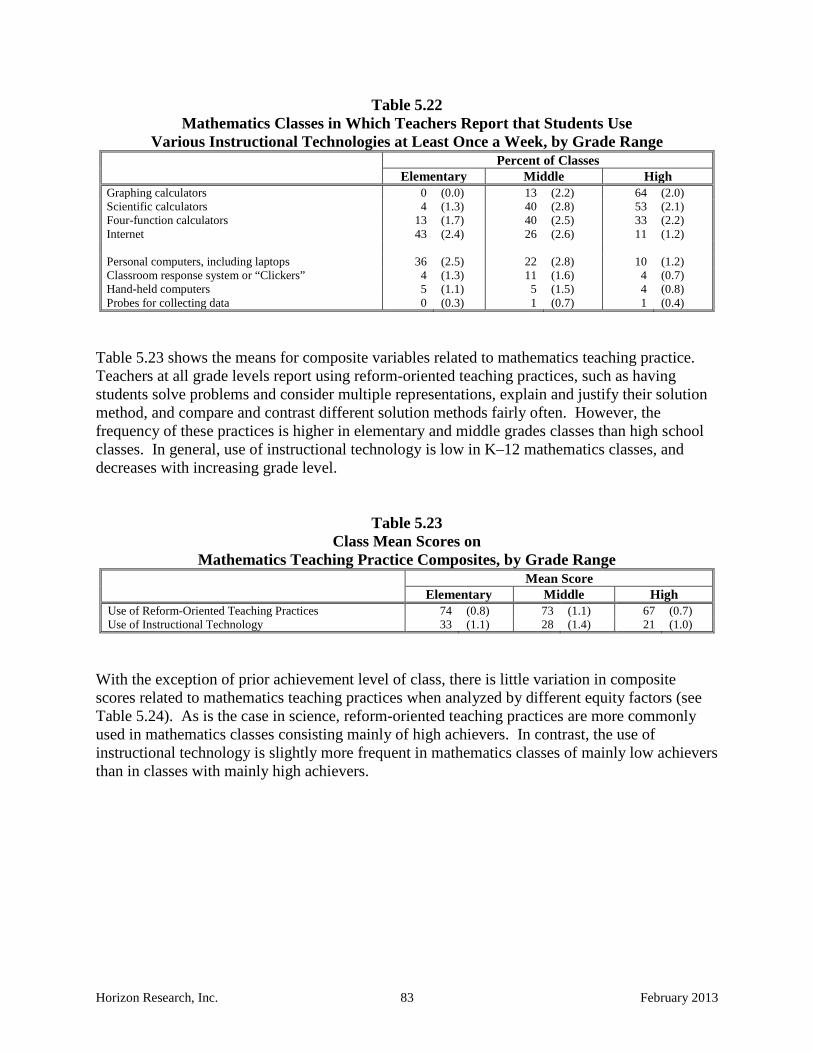
Teachers were asked to provide information about the use of technology in their mathematics instruction. Table 5.22 shows the percentage of classes in which various instructional technologies are used at least once a week. Graphing and/or scientific calculators are used most often at the high school level; very few elementary classes use any type of calculator on a weekly basis. In contrast, 43 percent of elementary mathematics classes use the Internet weekly, compared to just 26 percent of middle school mathematics classes and 11 percent of high school mathematics classes.
Horizon Research, Inc. 83 February 2013
Table 5.22 Mathematics Classes in Which Teachers Report that Students Use
Various Instructional Technologies at Least Once a Week, by Grade Range Percent of Classes Elementary Middle High Graphing calculators 0 (0.0) 13 (2.2) 64 (2.0) Scientific calculators 4 (1.3) 40 (2.8) 53 (2.1) Four-function calculators 13 (1.7) 40 (2.5) 33 (2.2) Internet 43 (2.4) 26 (2.6) 11 (1.2) Personal computers, including laptops 36 (2.5) 22 (2.8) 10 (1.2) Classroom response system or “Clickers” 4 (1.3) 11 (1.6) 4 (0.7) Hand-held computers 5 (1.1) 5 (1.5) 4 (0.8) Probes for collecting data 0 (0.3) 1 (0.7) 1 (0.4)
Table 5.23 shows the means for composite variables related to mathematics teaching practice. Teachers at all grade levels report using reform-oriented teaching practices, such as having students solve problems and consider multiple representations, explain and justify their solution method, and compare and contrast different solution methods fairly often. However, the frequency of these practices is higher in elementary and middle grades classes than high school classes. In general, use of instructional technology is low in K–12 mathematics classes, and decreases with increasing grade level.
Table 5.23 Class Mean Scores on
Mathematics Teaching Practice Composites, by Grade Range Mean Score Elementary Middle High Use of Reform-Oriented Teaching Practices 74 (0.8) 73 (1.1) 67 (0.7) Use of Instructional Technology 33 (1.1) 28 (1.4) 21 (1.0)
With the exception of prior achievement level of class, there is little variation in composite scores related to mathematics teaching practices when analyzed by different equity factors (see Table 5.24). As is the case in science, reform-oriented teaching practices are more commonly used in mathematics classes consisting mainly of high achievers. In contrast, the use of instructional technology is slightly more frequent in mathematics classes of mainly low achievers than in classes with mainly high achievers.

Horizon Research, Inc. 84 February 2013
Table 5.24 Class Mean Scores on Mathematics
Teaching Practice Composites, by Equity Factors Mean Score
Use of Reform-Oriented Teaching
Practices
Use of Instructional Technology
Prior Achievement Level of Class Mostly High Achievers 74 (0.7) 27 (1.3) Average/Mixed Achievers 72 (0.5) 28 (0.9) Mostly Low Achievers 70 (0.9) 30 (1.1)
Percent of Non-Asian Minority Students in Class Lowest Quartile 71 (0.8) 27 (1.2) Second Quartile 72 (0.7) 27 (1.4) Third Quartile 72 (0.7) 30 (1.4) Highest Quartile 73 (0.7) 29 (1.4)
Percent of Students in School Eligible for FRL Lowest Quartile 74 (0.8) 27 (1.4) Second Quartile 71 (0.8) 29 (1.6) Third Quartile 73 (0.6) 29 (1.5) Highest Quartile 72 (0.9) 31 (1.9)
Table 5.25 presents the percentage of most recent lessons in K–12 mathematics classes that include various activities. With only a few exceptions, the frequency of activities in each grade range is fairly similar. For example, most elementary, middle, and high school lessons include the explanation of mathematical ideas (93–95 percent) and whole class discussion (75–89 percent). Having students complete textbook/worksheet problems is also prevalent, occurring in roughly 4 out of 5 mathematics lessons. Lessons vary across the grade ranges in the use of hands-on/manipulatives and instructional technology. At the elementary level, 77 percent classes include students doing hands-on/manipulative activities compared to only 21 percent of high school mathematics classes. In contrast, high school mathematics classes are more likely than elementary classes to include the use of instructional technology (43 versus 29 percent, respectively).
Table 5.25 Mathematics Classes Participating in Various
Activities in the Most Recent Lesson, by Grade Range Percent of Classes Elementary Middle High Teacher explaining a mathematical idea to the whole class 93 (0.9) 93 (1.0) 95 (0.7) Students completing textbook/worksheet problems 80 (1.5) 78 (1.8) 83 (1.0) Whole class discussion 89 (1.1) 85 (1.4) 75 (1.3) Teacher conducting a demonstration while students watched 74 (1.5) 71 (2.0) 65 (1.2) Students using instructional technology 29 (1.7) 31 (1.8) 43 (1.3) Students doing hands-on/manipulative activities 77 (1.4) 37 (1.6) 21 (1.3) Test or quiz 19 (1.3) 19 (1.6) 20 (1.3) Students reading about mathematics 19 (1.3) 23 (1.7) 17 (1.2) Practicing for standardized tests 14 (1.3) 23 (1.9) 16 (1.1)
Horizon Research, Inc. 85 February 2013
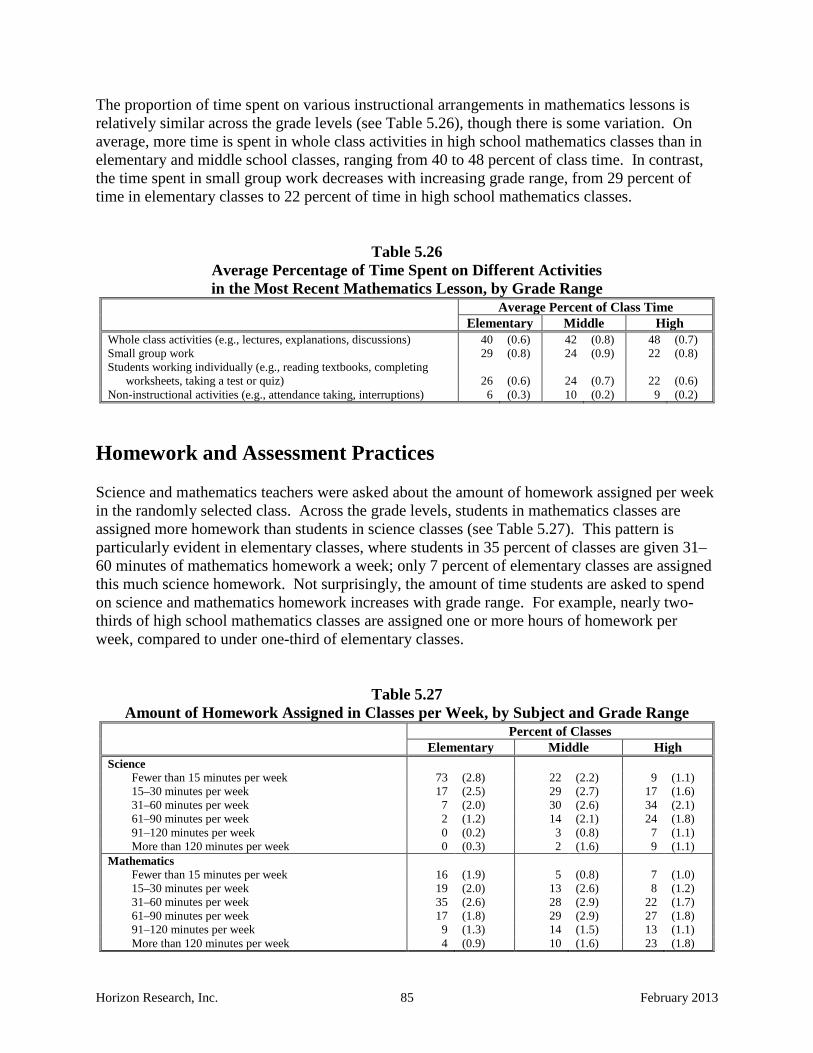
The proportion of time spent on various instructional arrangements in mathematics lessons is relatively similar across the grade levels (see Table 5.26), though there is some variation. On average, more time is spent in whole class activities in high school mathematics classes than in elementary and middle school classes, ranging from 40 to 48 percent of class time. In contrast, the time spent in small group work decreases with increasing grade range, from 29 percent of time in elementary classes to 22 percent of time in high school mathematics classes.
Table 5.26 Average Percentage of Time Spent on Different Activities in the Most Recent Mathematics Lesson, by Grade Range
Average Percent of Class Time Elementary Middle High Whole class activities (e.g., lectures, explanations, discussions) 40 (0.6) 42 (0.8) 48 (0.7) Small group work 29 (0.8) 24 (0.9) 22 (0.8) Students working individually (e.g., reading textbooks, completing
worksheets, taking a test or quiz) 26 (0.6) 24 (0.7) 22 (0.6) Non-instructional activities (e.g., attendance taking, interruptions) 6 (0.3) 10 (0.2) 9 (0.2)
Homework and Assessment Practices Science and mathematics teachers were asked about the amount of homework assigned per week in the randomly selected class. Across the grade levels, students in mathematics classes are assigned more homework than students in science classes (see Table 5.27). This pattern is particularly evident in elementary classes, where students in 35 percent of classes are given 31–60 minutes of mathematics homework a week; only 7 percent of elementary classes are assigned this much science homework. Not surprisingly, the amount of time students are asked to spend on science and mathematics homework increases with grade range. For example, nearly two-thirds of high school mathematics classes are assigned one or more hours of homework per week, compared to under one-third of elementary classes.
Table 5.27 Amount of Homework Assigned in Classes per Week, by Subject and Grade Range
Percent of Classes Elementary Middle High Science
Fewer than 15 minutes per week 73 (2.8) 22 (2.2) 9 (1.1) 15–30 minutes per week 17 (2.5) 29 (2.7) 17 (1.6) 31–60 minutes per week 7 (2.0) 30 (2.6) 34 (2.1) 61–90 minutes per week 2 (1.2) 14 (2.1) 24 (1.8) 91–120 minutes per week 0 (0.2) 3 (0.8) 7 (1.1) More than 120 minutes per week 0 (0.3) 2 (1.6) 9 (1.1)
Mathematics Fewer than 15 minutes per week 16 (1.9) 5 (0.8) 7 (1.0) 15–30 minutes per week 19 (2.0) 13 (2.6) 8 (1.2) 31–60 minutes per week 35 (2.6) 28 (2.9) 22 (1.7) 61–90 minutes per week 17 (1.8) 29 (2.9) 27 (1.8) 91–120 minutes per week 9 (1.3) 14 (1.5) 13 (1.1) More than 120 minutes per week 4 (0.9) 10 (1.6) 23 (1.8)

Horizon Research, Inc. 86 February 2013
Teachers were also given a list of ways that they might assess student progress and asked to describe which practices they used in the most recently completed unit in the randomly selected class. These data are shown in Tables 5.28 and 5.29. In both science and mathematics, the vast majority of classes at all grade levels included informal assessment practices during the unit to see if students were “getting it.” For example, more than 90 percent of K–12 science and mathematics classes involved the teacher questioning students during activities to monitor understanding. Using whole class informal assessments such as “thumbs up/thumbs down” was another common practice, used in most science and mathematics classes (80–90 percent) during the unit. In addition, the use of formal assessment techniques such as grading student work, quizzes, and tests, as well as reviewing the correct answers to assignments were also prevalent features of science and mathematics units, especially in secondary classes. Middle and high school teachers in roughly 9 out of 10 classes administered a test or quiz to assign grades and assigned grades to student work; teachers in approximately 6 in 10 elementary classes used these practices during their most recent unit. In contrast, having students use rubrics to examine their own or their classmates’ work was infrequent across all grade levels.
Table 5.28 Science Classes in Which Teachers Report Assessing Students
Using Various Methods in the Most Recent Unit, by Grade Range Percent of Classes Elementary Middle High Questioned individual students during class activities to see if they
were “getting it” 94 (0.9) 95 (1.4) 97 (0.5) Reviewed student work (e.g., homework, notebooks, journals,
portfolios, projects) to see if they were “getting it” 89 (1.4) 96 (0.7) 94 (0.7) Assigned grades to student work (e.g., homework, notebooks, journals,
portfolios, projects) 60 (1.8) 94 (0.9) 92 (0.7) Administered one or more quizzes and/or tests to assign grades 56 (2.4) 90 (1.5) 91 (0.7) Went over the correct answers to assignments, quizzes, and/or tests
with the class as a whole 62 (2.2) 89 (1.7) 88 (1.0) Administered one or more quizzes and/or tests to see if students were
“getting it” 52 (2.5) 82 (1.7) 81 (1.3) Used information from informal assessments of the entire class (e.g.,
asking for a show of hands, thumbs up/thumbs down, clickers, exit tickets) to see if students were “getting it” 87 (1.3) 86 (1.8) 80 (1.3)
Administered an assessment, task, or probe at the beginning of the unit to find out what students thought or already knew about the key science ideas 54 (2.0) 62 (2.1) 53 (1.4)
Had students use rubrics to examine their own or their classmates’ work 14 (1.5) 27 (2.0) 18 (1.2)
Horizon Research, Inc. 87 February 2013
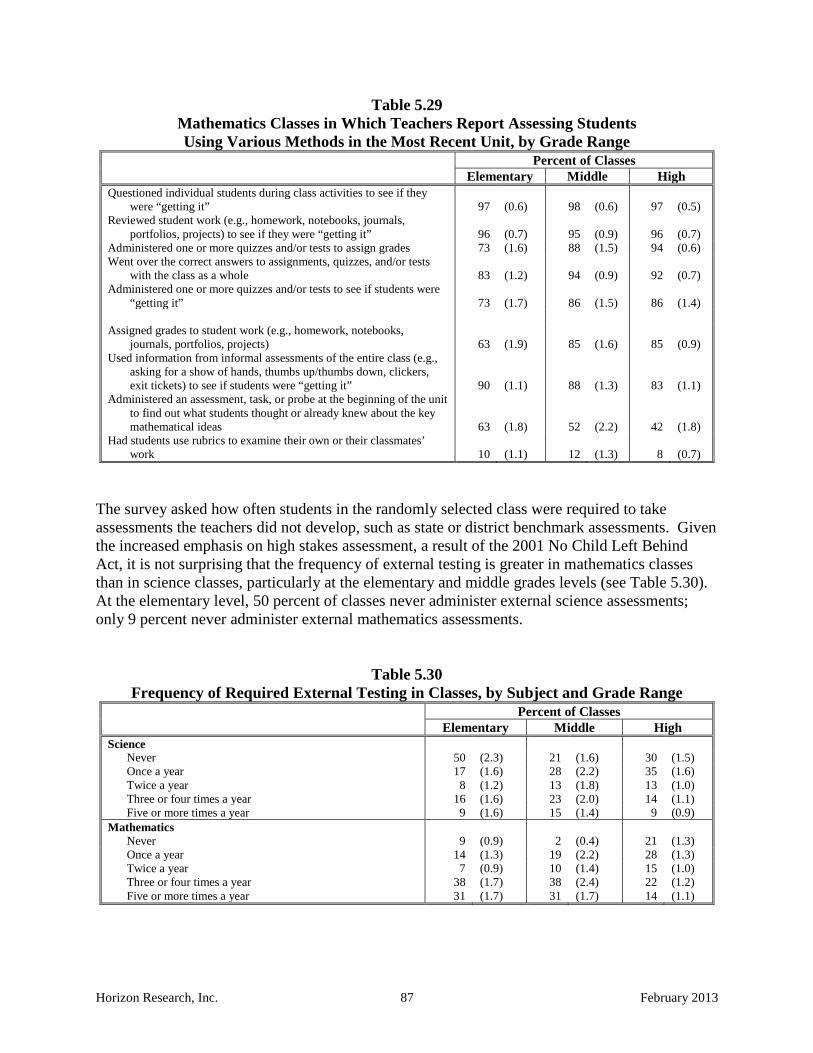
Table 5.29 Mathematics Classes in Which Teachers Report Assessing Students Using Various Methods in the Most Recent Unit, by Grade Range
Percent of Classes Elementary Middle High Questioned individual students during class activities to see if they
were “getting it” 97 (0.6) 98 (0.6) 97 (0.5) Reviewed student work (e.g., homework, notebooks, journals,
portfolios, projects) to see if they were “getting it” 96 (0.7) 95 (0.9) 96 (0.7) Administered one or more quizzes and/or tests to assign grades 73 (1.6) 88 (1.5) 94 (0.6) Went over the correct answers to assignments, quizzes, and/or tests
with the class as a whole 83 (1.2) 94 (0.9) 92 (0.7) Administered one or more quizzes and/or tests to see if students were
“getting it” 73 (1.7) 86 (1.5) 86 (1.4) Assigned grades to student work (e.g., homework, notebooks,
journals, portfolios, projects) 63 (1.9) 85 (1.6) 85 (0.9) Used information from informal assessments of the entire class (e.g.,
asking for a show of hands, thumbs up/thumbs down, clickers, exit tickets) to see if students were “getting it” 90 (1.1) 88 (1.3) 83 (1.1)
Administered an assessment, task, or probe at the beginning of the unit to find out what students thought or already knew about the key mathematical ideas 63 (1.8) 52 (2.2) 42 (1.8)
Had students use rubrics to examine their own or their classmates’ work 10 (1.1) 12 (1.3) 8 (0.7)
The survey asked how often students in the randomly selected class were required to take assessments the teachers did not develop, such as state or district benchmark assessments. Given the increased emphasis on high stakes assessment, a result of the 2001 No Child Left Behind Act, it is not surprising that the frequency of external testing is greater in mathematics classes than in science classes, particularly at the elementary and middle grades levels (see Table 5.30). At the elementary level, 50 percent of classes never administer external science assessments; only 9 percent never administer external mathematics assessments.
Table 5.30 Frequency of Required External Testing in Classes, by Subject and Grade Range
Percent of Classes Elementary Middle High Science
Never 50 (2.3) 21 (1.6) 30 (1.5) Once a year 17 (1.6) 28 (2.2) 35 (1.6) Twice a year 8 (1.2) 13 (1.8) 13 (1.0) Three or four times a year 16 (1.6) 23 (2.0) 14 (1.1) Five or more times a year 9 (1.6) 15 (1.4) 9 (0.9)
Mathematics Never 9 (0.9) 2 (0.4) 21 (1.3) Once a year 14 (1.3) 19 (2.2) 28 (1.3) Twice a year 7 (0.9) 10 (1.4) 15 (1.0) Three or four times a year 38 (1.7) 38 (2.4) 22 (1.2) Five or more times a year 31 (1.7) 31 (1.7) 14 (1.1)
Horizon Research, Inc. 88 February 2013
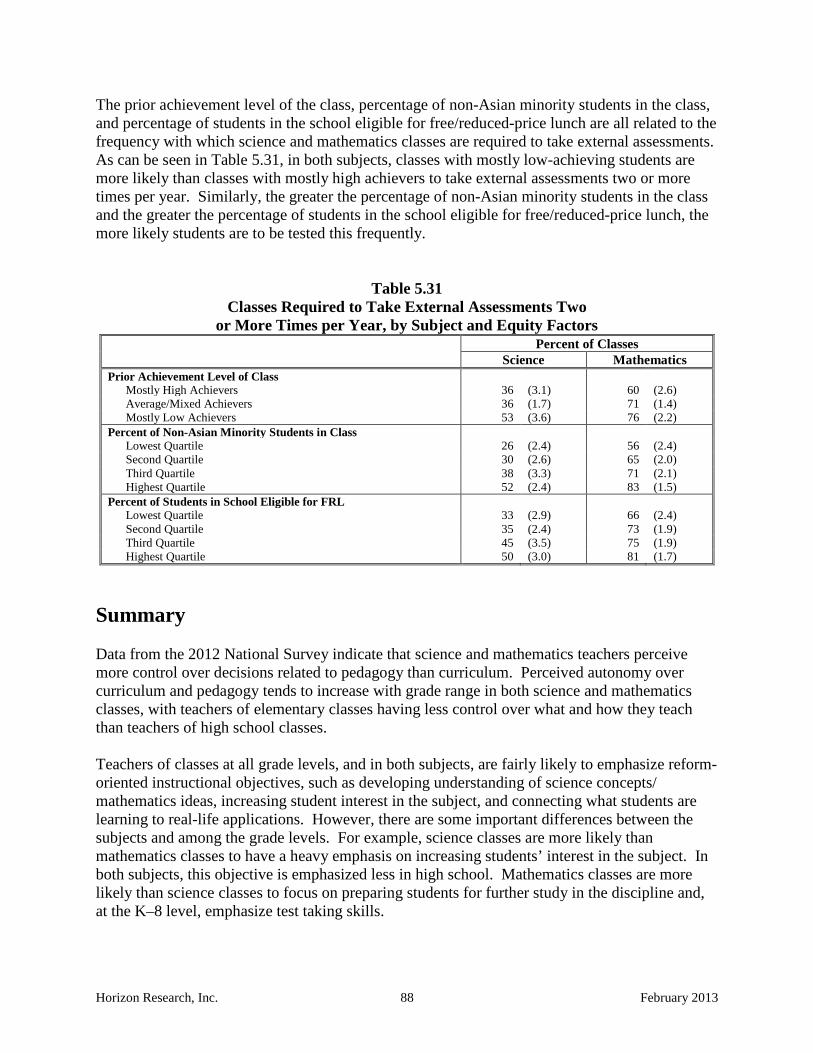
The prior achievement level of the class, percentage of non-Asian minority students in the class, and percentage of students in the school eligible for free/reduced-price lunch are all related to the frequency with which science and mathematics classes are required to take external assessments. As can be seen in Table 5.31, in both subjects, classes with mostly low-achieving students are more likely than classes with mostly high achievers to take external assessments two or more times per year. Similarly, the greater the percentage of non-Asian minority students in the class and the greater the percentage of students in the school eligible for free/reduced-price lunch, the more likely students are to be tested this frequently.
Table 5.31 Classes Required to Take External Assessments Two
or More Times per Year, by Subject and Equity Factors Percent of Classes Science Mathematics Prior Achievement Level of Class
Mostly High Achievers 36 (3.1) 60 (2.6) Average/Mixed Achievers 36 (1.7) 71 (1.4) Mostly Low Achievers 53 (3.6) 76 (2.2)
Percent of Non-Asian Minority Students in Class Lowest Quartile 26 (2.4) 56 (2.4) Second Quartile 30 (2.6) 65 (2.0) Third Quartile 38 (3.3) 71 (2.1) Highest Quartile 52 (2.4) 83 (1.5)
Percent of Students in School Eligible for FRL Lowest Quartile 33 (2.9) 66 (2.4) Second Quartile 35 (2.4) 73 (1.9) Third Quartile 45 (3.5) 75 (1.9) Highest Quartile 50 (3.0) 81 (1.7)
Summary Data from the 2012 National Survey indicate that science and mathematics teachers perceive more control over decisions related to pedagogy than curriculum. Perceived autonomy over curriculum and pedagogy tends to increase with grade range in both science and mathematics classes, with teachers of elementary classes having less control over what and how they teach than teachers of high school classes. Teachers of classes at all grade levels, and in both subjects, are fairly likely to emphasize reform-oriented instructional objectives, such as developing understanding of science concepts/mathematics ideas, increasing student interest in the subject, and connecting what students are learning to real-life applications. However, there are some important differences between the subjects and among the grade levels. For example, science classes are more likely than mathematics classes to have a heavy emphasis on increasing students’ interest in the subject. In both subjects, this objective is emphasized less in high school. Mathematics classes are more likely than science classes to focus on preparing students for further study in the discipline and, at the K–8 level, emphasize test taking skills.
Horizon Research, Inc. 89 February 2013
In terms of instructional activities, teacher explanation of science ideas and whole group discussion are very common across the grade levels. The use of small group work and hands-on activities are also fairly prevalent, with over half of K–12 science classes including these activities on a weekly basis. Given that accountability efforts in recent years have focused on reading/language arts and mathematics, it is not surprising that science classes in grades K–8 often include literacy activities. In contrast, the use of instructional technology and practicing for standardized tests in science is quite infrequent across grade levels. Explanation of ideas and whole group discussion are also very prominent in mathematics instruction, as is the use of textbook/worksheet problems. Having students engage in practices consistent with the Common Core State Standards for Mathematics, such as explaining and justifying methods for solving a problem and comparing/contrasting different solution methods, is also a common weekly occurrence across grade ranges, although the frequency of use decreases as grade range increases. For example, 78 percent of elementary classes have students consider multiple representations in solving a problem at least once per week, compared to only 65 percent of high school classes. Similar to science, the use of technology in mathematics instruction is fairly low across grade levels. In both science and mathematics, informal means of assessment—e.g., questioning students during activities, reviewing student work—are commonly used to monitor student progress. Grading student homework, quizzes, and tests is also quite frequent, especially at the secondary level. Not surprisingly, external testing occurs more frequently in mathematics classes than science classes. However, in both subjects, the frequency of external testing varies by grade range. Equity factors, in particular prior achievement level of the class, are related to objectives and instructional activities in science and mathematics. Classes with mostly high-achieving students are more likely to stress reform-oriented objectives and teaching practices than classes consisting of mostly low-achieving students. Classes of mostly low-achieving students tend to have to take external assessments more frequently than classes of mostly high-achieving students.

Horizon Research, Inc. 90 February 2013