institvion organisation for economic cooperation and … · organisation for economic cooperation...
TRANSCRIPT

ED' 168, 294
TITLE
INSTITVION_
PUB-DATE .*
NOTEAVAIIABLEEROM
DOCUMENT RESUME
EA 007 207. -
"Education in OECD Developing Countries: Trends and
Perspectives.'Organisation for Economic cooperation andDevelopment, Paris (Prance) .74296p.-; Eest copy available for reproduction. ,
OECD. Publications Center, Suite 1207,;1750Pennsylvania Avenue, N.4:, Washington, D. C. 20006
($8.09.)
ED 'BS PRICE MF-$0.,76 PLUS POSTAGE. MC Not.. Available from EDRS.
DESCRIPTORS .*Developing Nations; Educational Assessment;*Educational Chafigel *Educational Development;"
_Educational Policy; Elementary Secondary= Education;.Evaluation Criteria; National Surveys; Post SeCondaryEducation; *School Statistics;_ StatisticAl Da ta;*Tables (Data)
IDENTIFIERS Greece; OECD; Portugal; Spain; Turkey; Yugoslavia
ABSTRACTA .major purpose of this publication is to describe
and= analyze educational development during the 1960s in thedeveloping Countries that are members of the Organisation forEconomic Co-operation and Development (Greece, Portugal, Spaiii/,
Turkey, and Yugoslavia). On the basis of t__his= analysis, an attempt is
made to assess_anticipated changes in the educational s/stems ofthose Countries during the 1970s and to identify prioFity areas Of
concern in planning long-term educational development policies.Extensive tables of = educational =data =are presented to serve =both as
indicators of the present level of educational evelopment and as EL
statistical framework for periodic reviews of educational progress inthedeveloping OECD countries. Because directly =comparable data were
not always available for all he countries, the tables may be more
useful for the study of educational development in each individual
country; than for comparative purposes. (JG)
*************************************************************t********** Documents acquired by ERIC include many informal unpublished *
* °materials= not available from other sources. ERIC makes every effort *
* to obtain the begt copy available. nevertheless, items of marginal *
* = reproducibility are =often .encountered and this affects the quality 40
* of the microfiche and= hardcopy= reproductions ERIC makes available *
via the ERIC Document =ReProduction Service (EDRS). EDRS is not* responsible for the. quality of the original document. Reproductions ** supplied by FDRS are the=best that can be made from the original. *
***********************************************,4************4*********
Co
j
A
US DEPARTMENT OF HEAL T t1,EDUCATION &WELFARENATIONAL INSTITUTEOF
EDUCATIONTHIS DOCUMENT HAS BEEN REPRO
DUCED ExAcTLY;AS RECEIVED FROM
THE PERSON OR OrttoiNiZATtON OR
AT LNG IT POINTS OF VIEW OR OPINIONS
STATED DO NOT NECESSARILY REPRE
SENT OFFICIAL NATIONALtNSTITUTE Of
EDUCATION POSITION OR- POLICY
PERMISSION TO REPRODUCE THISCOPYRIGHTED MATSRTAL BY MICRO-FICHE ONLY HAS BEEN GRANTED BY
Q44.6T. ERIC AND ORGANIZATIONS OPERATING UNDER AGREEMENTS WITH THJATHINAL INSTITUTE OF EDUCATIONFURTHER REPRODUCTION OUTSIDETHE ERIC SYSTEM RFOUIRFS PERM'SSION Of THE COPYRIGHT OWNER
TRENDS_ AND PkRSPECTIVES
=ORGANISATION FORrECONOMIC -CO= OPERATION AND DEVELOPMENT
z1 497f
41-

The Organisation_for _=EconomicCe=opeiation:aud-DePel=-opinent- (OECD) Was =,- set -up under _a Convention_ -signed--in Paris_ on_ 19th DeceMber,_ 1960; _which_,provides-that-the-OECD:zshaltpromate_=pidiciers-designeds-
7-- -to--cichiet:e- _the -hikliest- sustainable economic groWtheinployment-iiMis a- rising_ standard_ ofFliVing-,in-
Member -countrieswhile final:el/11-sta=-bility,,and: thus -toveontribUte--to=the-,developinenvof-thenworldeconothy;to-contributecto,sound-economic expansion-in-Member
-as- well= -as non,member -countries in=ithe-TrOcess--of-economic:development;to contribute to= -the expansion -of - world- tradeori,za-multilaterak-non-discriminatory basis' -in accordancewith4nternationalsobligations.
The--Members-ofDECD;ate Australia,ckustria,i3elgiuM,_-Canada, Denmark, -Finland; France, the -Federal 'Republia of_Germany,_Greece,_Iceland,Irciand;_ltaly, Japan;_luXeinbonre,-the Netherlands, New _Zealand, ,vin-way, Yortugni,_ Spain,Swede/4_ Switzerland, _Turke;, -the =United -Kini;doMscand-rtheUnited:States.
PRICE F32,000 1-3.2 : $8.00(91 74 07.1) ISBN 92 A-11244-8
Organisationrfor Econontic-Co-opetelton And firvciopent, 1974.=Queries -conctrning = permissions -or translatir rf k -ts should beaddressed to:
Director= of =Information, OE: D2, ruc Andre-Pascal, 75775=PA1t1S CEDEX 16. France

TABLE-OP CONTENTS
Preface-7
INTRODUCTION9
Scope and
The Problem If the Availabilityof Educational Statistics,:,...
..__.=. 10
Chapter I
THE-GENERAL FRAMEWORK OF EDUCATIONALDEVELOPMENT POLICIES
Social_ and Economic Background ..... .. .. .... ......... .a_.- .- . -. -._. 13-
Objectives of the EducationalDevelopment
21
The Pattern of Educational26
The Evolution in Resources--...._ ...... --..,.-......- 36
Chapter II
PERSPECTIVES FOR EDUCATIONAL DEVELOPMENT
DURING THE 19708
Major Structural Changes in Education
Enrolment Forecasts for1980-,...._...-.-.... ..... 52
Educational Expenditure Forecasts....,.... 57
Chapter III
PRIORITY AREAS FOR LONG- TERM EDUCATIONALDEVELOPMENT POLICIES
The Overall Strategy63
Specific Issues in Educational Structures---....-: -68
Educational Planning Tanks....... ..... _...-..,...--. 70
3

APPENDICES
THE STATISTICAL FRAMEWORK
Statistics for Policy-planning intheEducation Sector.....,......... .... . . 75Indicators of-Educational Progress in Relationto the General Objectives of the EducationalDevelopment Policies, 77Data on Educational Expansion 79Data- on EdUcational Resources 80
Forecasting 81Classification Problems..---,..__ .._.._.. 84
Statistical- Tables
. ..... 8aPortugal......... ...... .... ...................... 119Spain. ..... ........:.............................Turkey. ... ..... : .1%- 187
II. ENROLMENT FORECASTS FOR 1980
. Greece 256
Turkey.: ......... - I :277Yugoslavia............. ..... ............ . ...--284
III. FORECASTS OF CURRENT EDUCATIONAL EXPENDITUREFOR TIE YEAR 1980.......... ...... 293
LIST OF TABLES
1. GNP per Capita, Sructure of GDP and of theLabour Force (1968)......... ..... ......... .. . .. 14
'a. Basic Demographic c.
3. Trend Rates of Growth of Output (1955-1968): AnnualAverage 17
4. Share of Savings to
5. Balance of Payments - Trade and CurrentBalance ..... 20
4-
Average Annual Rate of Growth and PercentageDistribution of Enrolments by Level ofEducation 29
7., Enrolment Ratios for the Developing Countriesand for Selected European Countries..- ... ....... 30
0
8. Holders of Higher Education Diplomas in theDeveloping Countries and in Selected Advanced
European Countries
9. Female Participation as Percentage of Total
Enrolments _
33
37
10. Enrolments in Private Education as Percentage of
Total...... 38
11. Public and Private Educational Expenditure(1960, 1968)......................................... 40
12. Percentage Increase in Enrolments and Teachersby Level of Education_..-..-- .....
1.3_ Graduates as Percentage of Last-year Enrolments.-. -44
14_ Repeaters in the First Year as Percentageof First -year Enrolments _ ......._.. -45
15. Number of Students Abandoning their Studies
as Percentage of Total .. 46
16. Enrolment Forecasts for 1980................ ..... 53
17- Enrolment Ratios (Estimates for .... --..--.. 57
18. Estimated Increase in Current Educational Expenditure o
Resulting from Enrolment Increases and AssumedImprovements in the Pupil/Teacher Ratios 59
5

PREFACE
ea
In the framework of Its activities, OECD has main=
tained a special interest in the growth problems of its
developing MeSber eountries.(1) In spite of the progress-they
have achieved over the last two decades, these countries cone
tinue to share some distinctive features of weakness in their
economic and social structures by comparison with soine of the
more industrialised Member countries.
The relatively low income per capita (among the lowest in
Western Europe) and the regional and social disparities within
these countries make for large population croups which enjoy only
limited opportunities for education; conversely, the limited
capacity of their societies to adapt to changing structures,
modern technologies and institutionalrequirements, due to, their
-loW level of educational attainment, remains one A the princi-
pal constraints on accelerated social and economic progress.
A first syb6ematic approach to the problems of educational
growth in the developing Member countries was attempted some
-ten years ago within the framework of t e OECD Mediterranean
Regional Pioject. As a pioneering activ"ty in the field of
education, the MRP stimulated significant policy decisions and
further educational planning and research in these countries.
Under conditions of continuing demand pressure for
educational sex-aces in a climate of a more general process of
economic, social and technological chancey'the developing
Member countries are now faced with the need to renew their-o
_ efforts for educational development and undertake drastic re-
forms of their educational systems. In this contet, it was
\felt that.it would be useful to attempt an analysis and evalua-
tion of the progress realised towards educational objectives
as defined in their development plans, as well as an assessment
of major chdnges in the structure of the educational systems
Greece,_ Portugal, Spain, Turkey and Yugoslavia, the last
as associate Member-
7

ztf
during the 1970s, as a basis for suggesting priority areas ofgeneral policy concern in the future. The results of thiseffort, undg-taken by the Secretariat under the programme ofthe 2ducation Committee, are presented in the -reportthatfollows.
The approach adopted -for this study was based cn a-- global
model of quantitative analysis allowing-for an overall reviewof educational developments. To achieve this purpose, a
special effort was made to build up a minimum -body of -basic
statistics. The deficiencies in the available information
are pointed out in theireport, in this way indicating priorities
for future statistical-work._
This repert has been prepared= -by the Secretariat, with_generous help from-the-national authoritieS of-the countriesconcerned in Troviding and supplementing data and-information.on- =which the-analysis-was built. Within the Seeretariat, thework- for this=study-was-carriedoutty.Constantind Doussis,
assisted -by Jacques Naturkrejt in the collection andtabulation -of the statistical data,
8

INTRODUCTION
Scope and Aims
SiAce the Washington Conference in 19 1 and the Mediter-
ranean Regional Project, the developing Mem er countries
(Greece, Portugal, Spain, Turkey and Yugoslavia)= have witnessed
a rapid rate of educational growth. There is some doubt, how- .
ever, whether the capacity of their educational systems, which _
was described as modest in the MRP reports, has grown suffi-
ciently to ensure that educational standards have been main-
tained and improved, and that the systems themselves will
develop smoothly in the future.
The general purpose of this review is first to describe
and analyse the educational development in these countries
during the'sixties; secondly, to assess approximately the mag-
nitude of the growth problems which are likely:to arise during
the next decade because of the increasing demand for educa-
tional services. The basis on which this review has been pre-
pared could also lead to the establishment of a broad frame,
work for periodic reviews of growth in education, relating it
to other objectives of development policies. Such reviews,
which would enable a rapid assessment,of the situation in th6
field of education to be made, are now necessary because of
the rapid and continuous educational growth which is taking
place within the overall process of social and economic change.
They could facilitate the discussion of major policy issues,
and help determine which are the most important areas for re-
search, improvement and innovation. Finally, they could use-_
fully compare the problems, achievements and policies of the
Member countries concerned and help determine cotton fields of
Interest.
More specifically, the purpose of the present review is:
- to evaluate the achievements of the past in rela-
tion to educational goals and to discuss the
present conditions for educational development;
9

- to analyse the factors which have conditioned
educational development and also theteffects
on these developments of educational policies;
- to consider how the Member countries are en--
visaging the future of their educational systems
in terms of the re-evaluation Gfthe overall
goals of their development policy and the rele-
vent re-allocation of resources anong the various
social and economic sectors:
- to consider their specific targets or forecasts
for educational development for the next ten -year J-`
period (as against the present situation) in rela-
tion to what they have achieved in the past; their
actual capacity and the resources they need and
can Mobilise over this period for further educa-
tional expansion;
- to examine the policies proposed for influencing
the rate and type of educational expansion in the
desired direction, according to the goals for
educational development.
. The need to examine concurrently the development of
educational planning and the means for implementing it at all
levels national,itgionaI, institutional -- and the estab-
lishment of special institutions for preparing the necessary
reforms for the application of innovations in the field of
education have given rise to a series of special 'projects
undertaken= within the framework of the OECD activities, in_
cooperation with the developing Member countries.
The Problem_nf_thp,Avallability of EdaPational Statistics
Studies of a synthetic nature require a wide range of
information in the form of either basic statistics and indi-
cators or specific studies Illuminating some important
aspects of the development and operation of the system (such
as studies on regional and social disparities, student pre-
ferences, cost studies,- eta.) Unfortunately very little
interrelated data, collected regularly by competent agencies
on .an annual or longer period basis for use inipreparing
grow -re, ew is mailable. Some useful statistical work
of thisfand has been done in the past, but only for specific
reviews-or studies.
10
41,n,

For the pgse of this review, in addition to using
existing material., attempts have been made to collect further
data. Thus, a questionnaire was drawn up to provide a struc-
tural framework for collection and presertation of statistical
information with the two-fold aim of ascertaining educational
progress in the developing Member countries and of working
out a simple model of quantitative estimates of a number of
variables of the educational system as a basis for decision-
making a the general policy level:
- one set of tables refers to what could be con-
s de:ed as a minimum_of basic data which to be
useful must allow for a number of basic inter-
relationships to be produced. For example,
enrolments in primary education have to be re-
lated to the corresponding number of teachers
and/or to the corresponding exnenditure for
primary education;
another set of tables has the purpose of pro-
viding the necessary information for following
up -the flows of students and the-changes the
pattern of educational expansion:
- finally, the tables referring the enrolment
ratios,_ the occupational structure of-the labour
force, regional disparities and father's occu-
pation aim at giving some very general indications
as to edusational.progress in relation-lb the
general objectives of the educational development
policies.
To facilitate the statistical work, the OECD Secre,
tariat filled in the tables insofar as possible from the
annual 'farts available to the Organisation and other pub-
lished material. The tabulations for each country were then
-) sent to the national authorities concerned for completion.
In the light of replies, additional information and commenta,
each was revised in the final form in which it appears in
Appendix L. However, in many ca'Ses, the statistical gaps do
not permit as thorough a description or study of specific
problems as would have been preferable In a report of this
kind-. Until an-effort has been made at the international
level to adopt a more generalised and standardised system of
statistics for evaluating the performance of educational
-.

?system* and fre,i,aoting educational de,.elc,pmentc, the lac4; of
regularly supplied, basic information will continue to be felt
in important areas in the elaboration of educational develop-
ment plans and policies.,_
12
12

1
Chapter it
T ft qP7PPAT PnAmVWnPlt nF EIMPATT0NAI DFVELnPMENT-POLICTES
SOCIAL AND ECONOMIC,BACKd OUND
Amonthe OECD Member countries, Greece., Portugal, Spain,
Turkey and Yugoslavia continue to present some ;I' the features
of countries in the process of development. Notwithstandili
the progress registered over the labt two decades, their income
per ca eta is still much lower than thatAf the other Western
European countries. The number of people employed in agricul=
ture and in the processing, ,transport and marketing of agricul-,1
tural poducts is very large. On the other hand the agricul-
tural sector' -s reldtively smai, share in the domestic product
reveals the low-productivity levels of-the sector. Since the
bulk of industrial and teztaary,activites is concentrated in a
4%, development centres :the low,,uoduCtivity in agriculture
leads to wide income disparities among the various zegions.
Must:the rural areas where a high proportion of the population
lives are characterised by extensive under-employment-and poor
living standaLds. But even in the cities, in industry and_the
tertiary sector the presence of a considerable number of small,
non-corapetitiveVnits is still evident. LTable 1 shows the GNP per capita, the structure of the GDP
and that-of the labour force -.for 4e)deVeloping-countries as_
well as for other selected OECD C'c Udiries. By comparing these
figures an indication can be obtained of the gaps which exist
between the countries, dIn addition there are other economic and social indicators
which reflect inadequacies in many sectors; these'imply the
long-term natuielof The problems faced by these co.,,ntties and
underline the need for important changes in their social and
economic structure in the 'future.
Among the most serious deficiencies hindering the dcvelqp-
ment of these countries and accentuating regional 4isparitiaa,
F

Table 1
I _
GNP 1AR CAPITA,- STRUCTURE OF GDP AND OF THE LABOUR FORCE (1968)
Country
GNP per
capita(1)
. (U.S.S)
Percentage contriinutpn to GDP Percentage breakdown oftotal employment
Agriculture Industry Services Agriculture Indipstry Services
Greece 660 21.2 27.3 51.5 50.1(2) 21.2(2) 28.7(2)
Portugal 530 19.0 42.2 38.8 32.3 36.2 31.5
Spain 770 16.3 33.7 50.0 29.4(2) 36.6(2) 34.0(2)
Turkey 350 33.8 26.5 39.7 72.7 11.4 15.9.
Yugoslavia 450(2 -) 22.7(2) 40.8(2) 36.5(2) .. 4
Other OECD Countries --
1 390 11.1 38.6 .50.3 ' 22.5 41.8 35.7
Prance, 2 530 6.6 47.8 45.6 15.8 40.4 = 43.8
Germany 2 200 3.9 50.9 45.2 10.2 46.2 -= 41.6
1) At current prices and exchange rates.
2) Year 1967Sources: OECD Observer,, February 1970 and Economic- Survey, 1969, for Tugeslavia.
a
a
within diem is the lack of an efficient economic and social
infrastpcture (communication networks, irrigation systems,
electrfcity supply, education, housing for low-income groups,
health facilities, etc.). Similar deficiences are also found
in the field of scientific research which lacks the necessary
government depar.tments and other institutions and to which only
a negligible amount of resources is devoted.(1)
The total population of the five,countries together in
1966 amounted to 101,729,000 (or 27.3 per cent of the European
OECD Member countries? total population, includi,ng YugoslaVia),
As shown in Table 2, it`-increased at a rate of 1.4 percent per.
0
year over the peraod 1955-1966. Turkey alone, however, was res-
.°Ronsible for 56.1 per ocent of the increase.
Emigration and urbanisation movements, which were accel,
crated in the early six-iea, may be largely explained by-weak-
.,
nesses.an the economic and social structures of the five
countries. All of them are more or less "emigration regions".
,In Greece, Portugal and Spain, the emigration movement has
caused a serious decline in the birth rate and in the rate of_.
population-increase. 'It has also resulted in a reduction in
the proportion of young age groups in the total population and
has had an unfavourable effect on the qualitative structure of
the labour force.
In Turkey, despite emigration, the rate of population
increase has been so hkgh that the present policy of the govern-
ment.. as defined in the Turkish Development Plan 1968-1972, is
to improve the structuraof the population and reduce its rate
of increase- ,An important demographic characteristic in this
country is the very'high proportion_of ghildren in the total
population (41'.2 per cent ih 1960)_
e In Yugoslavia, highobirth rates prevail mainly in the
0 ,rural areas. This county is also characterised by a high pro-
-
portion of children in the total-population; it ranks-second
among the developingMembercountries, with 51.1 per cent of the
total copulation under'15 years of age (Table 2)- This proPor-
1- 0 tion is still among the highest in Western Europe-1,,0
1) An extensive description of the structural social and econo-
.mic problems of the developing Member countries can be found
in their development plans, which constitute theMobt,itpor-utant source of official information for this report, ,and in
the OECD Economic, fiurve s for each country. See also The
Growthof_Output-19 0-1 80, Chapter IV-,"Developing Countries ".
OECD, 1970.
15

- Table 2
BASIC DEMOGRAPHIC DATA
CountryDemographicdata
Greeoc -Portugal Spain Turkey Yugoslavia Total gMtIn
Total population (in 0001s)
1955 7,966 8,610 29,056 24,0 17.560 87,263 332.c00
1956 8,614 9,335 31,871 32,174 ,= 19,737 101,731 = 372,600
Average annual rate ofnatural increase 1.1 1.2 1.2 .. .. v .. 0.6
Average annual ra *e ofincrease after migration 0.7 0.7 0.8 2.7 1.1 1.4 l'")
Population by a 'ge ('.', of total).
tn 1960 ..
Under 15 years 2u.1 29.1 27.4 41.2 31.1(1)
15-64 years 65.8 62.9 c64.3 59.1 62.0(1).
65 years and over 8.1 8.0 8.2 3.7 6.3(1)
Urban population C! of .,o )
Year 1950 36.8(2 )° 19.4 52.0 18.5 184(3)
Year 1960 43.3(1 ) 22.7 57.2 26.3 28.5(1)
Average annual population:growth rates (1950-191.0)
urban 2.60(4) 2.10 1.75 6.55
I
6.65(5)
total 0.95(4) 0.55 0.85 2.85 == 1.14(5).
_
1) Year 1961. 2) Year 1951. 3) Year 1953. 4) Period 1951-1961. 5) Period 1953-1961.
6) Including Yugoslavia.
S urces a)0
Viepopulation data, with the exception of Yugoslavia, were taken from the OECD
publication Labour P,rce_Statistics: for Yugoslavia,_ from the 11;11,-Democraphie*:
Yearbooks.
b) The urbanisation ratios for Greece, Portugal and Yugoslavia were taken from the LIA.
De, m(Kraphie -Yearbooks: for Spain and Turkey,_ from their development plans. "

With the exception of Spain, the majority of the popula-
tion in these countries lives in rural or seng-urban areas. The
rate of urbanisation, however, was quite rapid overt-the decade
of the fifties, as the figures in Table 2 show.
It might be said that among the five countries Spain is
the only one with a sufficient number of "urban" centres (31
towns with a population .of over 100,000 inhabitants). In
Turkey, which has about the same population as Spain but only
14 towns of over 100,000 people, the urbanisation rate is
extremely high. In Yugoslavia, the rapid increase in urban
population ran parallel to some e;stent to the' effort to promote
industrialisation in, the country-; regional disparities, how-
ever, are still very large. In Greece and Portugal, where the
urbanisation rates are lower than in Turkey and Yugoslavia, the
Main problem appears to be one of over -concentration in the
capitals.
In the post-war ,:eriod the five developing Member countries
have undertaken sustained and co-ordinated efforts to accelerate
their social and economic development. Between the years 1955-
1968 they attained growth rates higher than the OECD average
Tor the same period.
Table 3
TREND RATES OF GROWTH OF OUTPUT (1955-1968)
Annual average rates
Country GDP
Agri-cul-tune Industry Services
Greece 5.9 2.9 8:7 6.2
Portugal 5.4 1.3 8.6 5.3
Spain ,(1) 7.0 2.7 8.4 5.7
Turkey 4.9 (2)- 2.6 6.3 (3) 6.7 (3)
Yugoslavia (4 -) 5.4 2.9 6.0 6.7
European OECD . 4.8 .. .. ..
1) Period 1.958.,1968.
2) Net domestic-product.'
3) Electricity, gas and water are included under services.
4) Comparable data are not available. Growth rates are for the
period 1964-1969 and are based on Yugoslav definitions and
concepts of social product (=social and private sector).
Sources: The Growth -of Output 1960 = 1980, OECD, 1970.
Economic-Survey_for Yugoslavia, OECD, 1972.
17 ,

In Table 3. the growth rates of the three major economic
sectors reflect clearly the structure] changes which are'taking
place in the economies cf these countries. Industry is expand-
ing dt a much fatter rate th.n agriculture. of which the share
in ODP is centinuously'dim_nisning in favour of the other sec-
tors.(1) This development, in conjunction with the rapid
urbanisation movement, shows clearly that the five countries
are in a stage of rapid transition from an agrarian lo a more
diversifiedeconomy and to a new social structure.
The changes In the patterns of consumption, as well as the
need for these countries to ensure at the'same time an
increasing participati6h in theworld'econcmy, add to the need
for the restructuring, modernisation and expansion of their
productive capavity and for the application of new methods of
organisation. Parallel to this, with rising incomes and changes
in social structure the demand for -social services such as
education and health is becoming more pressing. The economic
and social problems arising from the movement of population to
, development centres call foi increasing and $ecial attention,
especially in the direction of:
- providing employment in the cities at a rate high
enough to absorb the-additional labour force
coming from Ithe villages; :
- expanding the social and economic infrastrUcture
of the cities accordingly (educational facilities,
housing, water supply, etc.);
- providing for the education and training of rural
workers to enable them to work efficiently in
their new occupations;
- ensuring a balanced development of all regions to
avoid over-concentration in one'''or more big cities.
All five countries are implementing development plans;
target growth rates for output= -are get as high as 8 per cent
per yar for Greece, 7 per cant for Portugal and Turkey and
-T-1) In Greece, share of agr_ culture in GDP fell from 33.2
per cent in 1950 to 27.9 pe, cent in 1965, in Portugal froM33.3 per cent to 21.1 per cent and in Turkey from 48.8 percen t'to 39.0 per copt.
18

5.2-per cent for Spain.(1) In Greece and Portugal, relatively
greater Importance is attached to improvement in productivity
than to increase in employment. The annual growth rates'of
employment envisaged are 1 per cent in Greece and 0.3 per cent
In Portugal, as against an increase in productivity of 7.0 per
cent and 6.7 per cent per ysar. respectively. In Spain,
'employment is expected to rise by 1.3 per cent and productivity
by 3.9 per cent per year. In all plans, measures have been
adopted for the re-distribution of income through an increased
participation of lower-income groups in the increase of GNP,
not only by means of salary policies but also those aimed at
the development of the social sectors (education, health, etc-)
and .-)f the backward regions.
To achieve these objectives, the developing Member count'
tries have to face a variety of problems which are not neces-
sarily of the same type or magnitude in all of them. A typical
example is that of savings. According to the development plans,
only Spain seems to require a modest increase in the share of
savings -to GNP.; Yugoslavia already spends a very high propor,
tion of its product for investment -(Table 4).
The,balance-of-payments situation reflects some of the
structural weaknesses of the developing Member_ countries,
mainly the litited capacity of their products to compete in
international markets
Table 5 shows that only Portugal has a balance -of- payments
surplus large enough to finance an ambitious development policy
in the next few Years from her own resourcesL The other four
countries-will still need substantial external resources to
finance their development plans, though they all hope to
achievh a-rate of exports high enough-to counterbalance
increased imports and thus reduce dependence on foreign finance.
During the sixties, all the developing Member countries
drew up long=term development plant., some of thet for the first
time, to deal,with the great number of growth problems facing
them. They have done so because they recognise the need to
view these problems within a comprehensive long-term perspec-
tive rather than piecemeal,. as An the-past,
1) The growth target in the Yugoslav Plan 1966-1970 was 7.5 per
cent to 6.5 per cent per year. The Yugoslav authorities arenow preparing a new plan for the period 1971=1975 with the
same growth target.
19
Table 4-0
SHARE OP SAVINGS TO GNP
Countries Period of PlanPer cent of Savings to GNP
Year 1967 End of -Period
.
Greece . 1968-1972 21.8 26.'2
Portugal 1968-1973 19.8(1) 22.7(1-)
Spain : 1968-1971 21.0 22-5
Turkey- f 1968-1972 , 19.0 23.0
Yugoslavia(2) i: =- 30.7(1)
1) Represents fixed asset formation and change in stocks.
2) Source: Economic-Survev_of-Yugoslavia, OECD, 1-972-
Bolirce-: Development Plans.
Table 5
BALANCE OF PAYMENTS - TRADE _AND CURRENT BALANCE (-1967=)1
millionsoi_aoliars-
CountryTrade
Balance
.Services
andTransfers
,--
CurrentBalance
-
Greece
Portugal
Spain
Turkey
Yugoslavia ==
-697-(i)
,247(2)
..1,_78
. -162(1)
-432(1)
,
=
==
=
,
473
0 41-4
1,316
46
300
--,-
:
-222
+167
-465-
-116
-1-32
1)-Imports c.i.f.
2) Imports f.o.b.
Source:- Economic Surveys, OECD,. 1969.
zo
.
This development is bound up with important institutional
changes which will affect the way in which goals are set and
decisions taken and which. presumably, will influence policy
planning as well.
Today theleducatienal planner has more information at his
disposal on the socio-economioenvironment within which educa-
tional activities are developed. Growth targets, changes
envisaged in the social and economic structures, demographic
evolution, urbanisation movements and social and political
considerations all constitute the background necessary for
orientating the long-term educational policies and for develop=
.ing"the appropriate strategies to attain the educational
targets.
At the same time, a comprehensive approach to growth prob.,
ems provides a structural framework within which the nature
and role of education as a factor of social and economic growth
can be _recognised. Lt follows that the magnitude of the effort
and the resources to be allocated to meet the-needs in one sec-
tor will ultimately be determined with respect to the relative
impor ance of other social and economic needs.
OBJECTIVES OP THE EDUCATIONAL DEVELOPMENT POLICIES
In the framework of the development plans now being imple=
mented in all five cotintriea, special emphasis is given to
education in conjunction with the overall social and economic'
goals. The objectives of the long,terM educational, policies
are.clearly defined; and the action to be taken during the
medium-term period covered by the plans is described in some
detail in terms of educational reforms, educational growth
rates and resources ,allocated for educational development.
All five plans point tp the need to ensure a,rapid rate_ of
educational growth in response to the aspirations of
society and individuals for improved educational levels._(a)
The State, as the main provider of educational services,
assumes the responsibility of supplying the means that the
'educational systeM will need if it is to expand.
1) According to the Portuguese Development Plan (p* 458,
'Para. 9), -"The main objeotive of educational po/icy, which
dominates all other objectives, is the intensification of
the effort to generalise education and improve its quality
and effectiveness". (Footnote continued on next page)
21
4.
In Yugoslavia all education Is provided directly by the
State, but in the other four countries private schools, operat-
ing under government control, provide additional educational
facilities.
Most of the plans proviue for investment programmes for
buildings and equipment, and eso for increasing the number of
teachers who will be required for the increasing number of
pupils expected. However, the attainment of a high rate of .
educational growth is not the only-objective of the educational
development policies. The problem is not just to ensure rapid
overall increases in the numbers ofahildren at all levels of
education. Several other aspects of tie educational expansion
have also to be taken into consideration-.
Thus, in all five countries.it is-generally recognised
that planning on the national scale is net sufficient arid that
educational policies should, at the same time,_ aim at reducing_
regional-disoartties in educational participation. The adjust-
ments neessary to ensure the proper re- distribution of educa-
tional activities among the various regions are provided in the
educational programmes,- (1)
Footnote continued-from previous-page,
The Spanish Development Ilan emphasises that -"-In order togive full force to the basic principle of ensuring everySpaniard the sight and oblt;atiori to receive the-educationrequired to qualify him, individually and sociallF, withinthe limit of his abilities and to his maximUmpoten-tialities, the diffusion of education to largerinumbers ofpeople will continue to be favoured, while taking-allappropriate steps tohensure that this necessaryextensionis not achieved at the cost of a reduction in the standardof educe-tic-n.1 rovided"-, (p, 1-35-)
According to the Turkish -Plan cp. 115Y, "The-purpose ofeducaticin is to enable people to knew their environment,to react rationally, to adapt to the structural changes ofsociety, and to acquire the ability to increase both theirpersonal prosperity, happiness and_moral values and thatof their environment through the knowledge and Skill theyacquite". _
The Greek and the Yugoslav Plans also emphasise the impor-tance of education fot both social and eConomicdevelopment,
4 The Portuguese Plan provides for "the extension of theschool network ,.. in a way to increase the numbet of edu-cational establishments and to distribute them over thecountry on the basis of the best criteria of regionaldevelopment of education".
(Footnote continued on next page)
22

In most of the pla,:s, the objective of equalisation of
educational_opportunitv is clearly set out. -(1) In educational+
development policies the provision of scholarships is the most
commonly-adopted measure to meet this objective. In addition,
-other means of financial support are also proposed in some of
the plans (e.g. the granting of loans). In most of the coun-
tries, policies to extend the compulsory education period were
-----_-
Footnote continued from previous page.
The Greek, Spanish and-Turkish Plans, within the framework'
of their regional development policies, regard educationas a-means of promoting the various regions and thereforethey-provide for an adjustment of their educational_Policies _to take into account geographical diversities.Special attention will be given to the establishment ofnew= universities and-higher technical schoola in variousgeographical areas.
Started within the framework of the 1966 -71 YugoslavDevelopment Plan-a- radical refort aimed at decentralisingthe educational system is taking place. According to thereply of the YugoslaV authorities to the OECD EducationalGroWth Enquiry-, "The main competence, not only for -eduda=
tion _policy but also for the operation of the-educationsystem, lies with the Federated Socialist Republicsi asself,governing political territorial units,- and With thesocio=politi-cal and working_ nstitutions of citizens. All
-edudational legislation is firat discussed-at this level,thus-associating citizens and workers with the decision,
making proces6.1"
1) The Portuguese Plan states as an objective of the educa-tional policies "to develop social action in educationto favour studies beyond compulsory-_ education to all_
children who have the capacity to do so,- independently of
their economic- conditions ".
The Spanish Plan provides that "The present system of -aid
to students Will be improved, and will be supplemented bythe introdUction of personal loans, to be repaid -as and
When possible out of the studentts subsequent earnings.
Such assistance Will be increased in line with the objec-
tives laid down in the present Plan for the diffusion Ofeducation at various levels, in such a-way that access toeducation Will increasingly -- depend upon -the intellectual
capacity-of the individual,- rathertharrupon-hia-iownior-his=famils-=financial resources-: These- aims -will also be
served by-piromoting the oonstruction of halls of residence
and: of senior and junior colleges for students from poph=lation centres =remote from the seat of the main-educational
establishment."
The Turkish Plan states that "The Tossibility to take ad-,
vantage of the State=provided_educational facilitiestmyond 'he primary level Will be secured according - -to- -the
principle_of_equaIity--of opportunity. Accordingly=,--with-
the aid-of scholarships and schools the capablestudents will be allowed to obtain the highest levels ofeducation without being hindered by economic difficUlties
and unfavourable environmental conditions,"(Footnote continued on next page)
23

supported by th'f_ provision of free meals and teaching materials
to-encourage low-income families to send their children to
school-
All five plans emphasise the importance of education in
relation to econLmic develJument goals. It is a constant con-
eern in these countries that the shortage of skilled labour
well-educated in modern technology is ane of the principal
hindrances to their achieving faster rates of economic
growth.(J) The developing Member countries are facing serious
problems in their efforts to accelerate the desired changes in
the manpower structure and to improve the pattern of qualifisa- _
tions of the labour force. All plans envisage severe reductions
in.farm labour with subsequent rises in the urban population
and in employment in the non-agricultural sectors.
Footnote continu41 from previous page
The Greek and tne Yugoslav Plans do not refer to the,prf___-ciple of equality of educational opportunity, but in theiranswer to the OECD Educational Growth Enquiry, the Greekauthorities state that_an_objective of the Greek educa-tional policy is the "provision of education to the largestpossible number with a simultaneous effort to secureequality of educational opportunity"; the YugoslaV authorrities state that a special educational goal is-"to providefull access to education financed by the community for allYugoslav citizens, regardless of their -- financial- means, inaccordance with thg.igeneral-laws-of the- Yugoslav socialcommunity".
1) According to the Greek Development Plan, "To raise thelevel of education and technical Skill of the labour forceis an essential condition for attaining the planned highrate of increase in productivity, and it is the basis onwhich long -term development of the economy will rest".
In _Portugal, an objective of the educational developmentpolicy is "to adapt the educational system to the renuire-ments for qualified personnel" ( Development Plan, -v. 169,para. 21)-
According to the Spanish Flan,_-"Education should be a con-tinuing process throughout active and working life,_ toelloW the full development of every side.of the indivi-dual'-s personality, especially in the case of those whowere unable to attain intermediate and higher levels ofeducation, while at the same time ensuring that_profeb=.sional workers can keep abreast of scientific and technicalinnovations. A_national system of occupational and furthertraining for the populatioh is an absolute necessity toprovide workers with legitimate Opportunities of improvingtheir social status and to prepare the ground for economicdevelopment."
(Footnote continued on next page)
24

The economic prograp that the five,.developing Member1
countries haVe made so far has contributed to.reducing somewhat
the gap between them and the developed countrild,,and provides
thebaSis for achieving high rates of growth. illowever, the
margins for developMent in the'past were large enough to allow"
economic expansion to take place even with the old patterns of
production and organisation. Now that such margins of develop-
ment are almost exhausted and these countries have a morediVersi-
fied type of economy, it is becoming more and more evident that
policies for the development and better utilisation of -human
resources will be a key factor for sustaining hIthrates of
growth in the -future. Such policiea are all the mere important
in view of the rapid technological evolution in the developed
countries and the trends -which can be- observed it the latter
towards a generalisation of education at higher levels.
Thus, the development requirements for qualified Manpower
will have an important influence on the decisions taken about
the rate and type of educational expansion. To teet5thede
requirements a number-of changes are planned.: secondary tech-
nicul-education la b,..ng rapidly developed higher education
is being developeG to accommodate a high,r proportion of stud -
ents of science and technology -; nen=univeristy level higher
education is being expanded. Similarly, nOn=formal education
(adult education, on- the -job trainint, accelerated vocational
training) is also acquiring a growing importance.
In addition to the above objectives, several other impor-
tent "directiVes for long-terth educational policies are stated
in the development plans or in other official documents. Some
Footnote continued froM previous page
According to the Turkish Plan (p. 162): "The most impor,tent element in development is manpower. The success of adevelopment plan depends on the participation in the devel-.opment efforts of manpower of appropriate quality andquantity and at the appropriate time."
The Yugoslav Plan-1971T1975 states that "Resolute stepsShould be taken in work organisations to settle the prob-lem of the shortage of close to hall a million skilledpersonnel already at the present stage of the development;scientifically_ based, more skilled and more complexoperations are becoming the babic condition of efficient-production. Today it is no longer possible to make dedi=sions about production and economic policies without ascientific foundation; it is impossible to work econom-ically with complex installations without appropriateknowledge and skills." An Outline-of the Concepts_of -theSocial Plan_of-Develo men ,7Federal-Bxecutive-ounc e gra e,--January,-1* O.
25

e
of these directives, such as the development L,f education to
preserve and diffuse further the national cultural values (
to reate good citizens), are outside the scope of this report
as they are rel fed to the particular traditions and other
socio-political conditions of each country, although such
objectives can affect educational developments by influenc-Ag
curricula development or the pattern of educational expansion
(e.g. a lower rate of expansion in technical education in
favour of more humanistic studies). In the same documents,
governments are also pledged to pursue policies for ensuring
recurrent edutli174; 'far ndernising ,nrricula and teaching,'
methods; for raising the status and quality of the teaching
staff; for increasing student participation in joint wort. with
teachers; and for improving educational institutions:_ But the
real purpose of these directives is to .lentifyStrategic areas
for specific research and policy planning and to initiate
activities which will lead to the realisation uf the long -tern
educational policy'objectives, as presented above.
THE PATTERN OF EDUCATONAL EXPANSION(1)
A compai,:tive analysis of the evolution of the educational
systems in the developing Member countries is beyond the scope
of this report. Educational expansion is examined here to
ascertain the major problems specific to each country which
have arisen mainly from the evolution of the demand for educa-
tional services or from the application of longterm educational
development policies- This,- of course, does not exclude the
identification of certain common characteristics or of similar
strategic problems in the general process of educatilnal growth
in these countries over the next decade, if orl -y because they
are all now at r,ughly the same stage of social and economic
development.
All -five countries have shown a remarkable capacity to
achieftejligh.rates of educational e(pansiol, over a ra =ther short
period of time (-=1959,1969). The most important develepmPnts
have taken place in higher,and secondary education (Table
ty Developments in-pre- primary education are not examined inthis report as they are the subjeci of a separate study.The same applies to training outside the formal system such
. as apprenticpship.courses, on-the-job training, adulteducation, etc.
26

With the exception of Turkey, most of the countries did
not experience Important quantitative changes in primary educa-
tion because by 1960 they chad already reached satisfactory
levels of school attendance at this level; furthermore, in
Greece, Portugal and Spain the rate,of population increase
were low because of high emigration. Greece (six years' prim-
ary education) had attained full enrolment by the year 1961.(l)
In Portugal (four years),'the number of pupils in the 7-10 age
group Was already 93.3 per cent of the corresponding total
population in 1960.(2) In Spain (four years), the enroltent
ratio'by 1960 was 84.5 per cent,(3) and in-Yugoslavia, over a,
total eight-year period 9f primary education, it was 83 pe,.-
cent.-_(-4)'
A significant achievement-was Made by Turkey (five years
---of primary education).which, to arrive at a satisfactory sten-
art,(f.1 ha'dto face an overall increase of roughly two and a
'half million punts (100 per cent) within an_,cleVen-year period
(1959=1970), Turkey began this effort from a rather low enrol,
went ratio (around'70-per cent in 1960) and at thesame time
had to cater for large increases in school -age population,over
the lextiod owing to the very high birth rates.
In secondary general education, overall enrolment increases
over the same. period (1959-1969)mere over 134 per cent in
Yugoslavia and up to 142-per cent in Turkey Secondgry techni-
cal_and vocational-education, with the exception of Greece, has
sAp,sm a slower rate, cc expansion; as a result the proportion of
general education in total secondary education was further
increased.
In higher _education, the increase in enrolMents was equally
significant. In.Portugal, Spain and Yugoslavia enrolments in
all higher education in 197,0 were 2-3 times higher than in 1960,
in Greece ,(in 1969 -) three times higher, and in Turkey ( -in 1971)
2.4 times the 1961 level. But the branch which has shown the
1, The- Mediterranean Regional Project: __Greece-, OECD, Paris,
p. 54.
21 Demographic-Yearbook-of U.N._=-1963.
3/ The-Mediterranean-Regional Project: Spain, OECD, Paris,
4) Titjleipixsaioslavia,' OECD,
Paris, 9 5, p. 51;,
5/According to the Second-FivetYear Development Plan (Table
97, p. 194), the enrolment ratio in primary education inTurkey was 89.7 per cent for the year-1968-f969.
27

'S
most dramatic tncrease in enrdiments over. the period (aroundir
15 pet cent per year in Greece, Turkey and Yugoslavia, and
7.4 per cent and .9.0 per cent, respectively, in Spain and
Portugal) is non-university type higher education. This
branch,unch, which was'a4 negligible part of the educational struc-
ture of the filte countries in 1959, contributed substantially
to the tcal'increase in all higher education over the period
under consideration (by 48 Per cent in Turkey; 44 per cent in.
Yugoslavia, 8 per cent in Spain, 24 per cent in Portugal and
13 per cent in Greece).
It.is interesting to not that the proportion of uni-
versity students in science and technology has increased con-
siderALly in"Greece, Turkey and Yugoslavia. In Spain, there
was only aslight increase, and Portugal even showed a
decrease. By 1970 this proportion was 41 per cent in
Yugoslavia, 39 per cent in Spain, 36 per cent:in Turkey, 31 per
cent in Portugal and 25 per cent in Greece (Table 6),
By 1968, enrolment _ratios in.Spain,_ Greece and Yugoslavia
approaching full ',Atendancd for the age group"correspon-
ding to the first eight years of schooling (Table 7), Portugal
and Turkey still had to mane efforts in that dirction.
; All five countries are lagging behind the advanced Euro-
pean countries in their proportions of-the 14-17 age group
being educated (upper sec .idary bducation), The main reason
seems to (be the continuation 61 regional disparities in income
and in the Aistributior of educational'faciIities. Children
enter the labour force at an early age, especially in -the agri-
cultural areas where the labour inteRsiveness or agricultural
activities is-more.pr,pnouncee. But even in theZurban areas
-where more educat4pnal faci'itres are available, living,Aan-
dards or. the lower-income groupsare still solQw that a major
porttori of this age group is Obliged to take up work in either
industry or thb,servi,ces sectoi°.1
'Enrolment ratedfor the 18-22 age,group in Greece, Spain
and Yugoslavia were .compara4e to those pre'Vaiiing in other
advanced European countries. One possible reas on for this is
the social prestige df.higher*Peheation combined with theta. limited opportunities that.uppv-sebondary level studies pro-
..vide far better jpbs and social promd4on. In Yugoslavia, the
. two-year post4econdary schools have plaYbd an important role
I
28
lable-6
AVERAGE ANNUAL FATE OF GROIgIli AND PERCENTAGE DISTRIBUTION OF ENROLMENTSBY LEVEL OF EDUCATION
Toantry
d-eeoe :
R.1% of o'owth
- Zeroentage distribution
rortudl
-.Fate ol! grow:h
<4' - Percentage alAribution
aP212- Rate of grorth
- Percentage distribution
- Pate of growth
- Fereentage. distrib.tion
Sate of growth
itreentage distribution
Level of Rda ition nary SecondarySondra..
TechnicalAnd
VocationalTeacherColleges
Von-UniversityType
ligher Fducation
rsl ty
EnroinentTotelTotal
O'tZ.1777.777nd
Technology(1)
ta5)/60 - 1968/69 0.4 5.5 6.7 0.4 15.2 2.5 16.2 (31' 2.3
61559/0 3.6 0.2 0.2 f 1.9 (19.6) 100.0
1968/69 61.9 27.2 5.6 0.2 0.6 1.5 (25.3)(4) 100.0
1/59/60 - 1,50/70 1.3 -9.4 3.o - 0.2 9.0 10.2 5.5 2.8
1,00/60 9.6 8.4 0.'. 0.5 1.7 (39.6) 100.0
1'169/70 68.6 18., 9.1 0.3 0.0 2.7 (31.2) 100.0
190/61 - 1969/76 1.6 12.5 5.6 - 0.5 7.7 10.7 15.0 3.8
1960/61 00.4 11.6 4.0 1.0 1.1 1.9 (30.0)(2) 100.0
1969/70 66.0 23.9 4.7 0.7 1.4 3.3 '(39.1) 100.0
1969/60 - 1970/71 6.5 12.0 5.: 10.7, 15.0 7.7 9.5 7.3
1959/60 64.3 10.8 2.4 0.7 0.4 1.4 (30.1) 100.0
197u/71 77.4 17.2 2.0 1.0 17.9 1.5 (36.0) 140.0
1959/60 - 1969/70 1.0 0.6 7.3 - 1.6 15.3 6.5 7.4 1.9
1959/63 09.4 2.7 3.4 0.9 0.6 3.0 (37.2) 100.0
1969/70 84.6 5.3 5.7 0.6 2.2 4.6 (40.7) 100.0
11 The figures in brackets represent the share of science-and technology 2) Year 2959/60
in total enrol:lent* in-unisersity-type-higher-education. 3) Period 1959/60 - 1969/70.
4) Year 1969/70.
Table 7
ENROLMENT.RATIOS FOR THE DEVELOPING COUNTRIES
AND MI SELECTED EUROPECOUNTRIES
AgGroup1968-69
Greece Portugal-7e19690
Spain1969-70
Yugoslavia1970-71
Belgium1966-67
France1967-68
'an"-I1967
1011
1213141516171819.20212223
100.098.178.865.157.150.64.7.140..0
23.8..
..
..
..
100.094.884.959.3
27.725.622.820.518.515..012.28.9 ,
6.85.5
100.097.791.079.249.7'31.726.720.516.914.2
= 16..6
9.35.75.0 = _
100.099.19799.187.075.161.347.033.224.416.9
% 13.37.2
. 5.1
100.0100.0100.0-98.584.6
-62-154.539.828.319.913.29. -9
7.26.0°
99.899.899.899.890.571-953.035.3,24.217.012. -3
9.16. -4
5.5
6-13
14-17
18-22
91.0
48.7
15.4c
83.71)
21.82)
2'
9.8'')
96.0
32.4
12.4
9 4 .01)
44.02)
18.54)
99.8
67.7
19.5
99.8
59.9
16.3
99.7
62. -7
13.9
1) -AsR -group 7=14. 2) Age group 15-18;
3) -Ag..,e group 19-23. 4)Age...,:group 19=23.
Year 1968: 1970 Educational Growth Enquiry.
Sources: For Greece, Portugal, Spain ana Yugoslavia: StatisticalAppendix I; for All other countries: replieb to the
1970 Educational Growth Enquiry.
Comparable.data are not available for Turkey. The
Turkish reply to the Educational Growth Enquiry -gives
the 1968 -69 enrolment ratios,- by age group, as follows:
Agea.mro_
7 - 12
13 - 15
16 - 18
19 - 22
3030
Enrolment Ratios
91.2
31.9
17.5
7.3
in attracting students to higher studies.-(1) In Greece, an
-additional reason is that the educational requirements for many
-robs (especially in the public services and the banks) are too
high.-(2)
Information is not available for all the countries(3) on the
extent to which educational demand by _educational level was
satisfied- during the period under consideration. In most cases
entrance examinations- limit the number of new_entranta at upper
leTrns (especially, ,upper secondary and university institutions)
vhtn the number of applicants-ekceeds that of places available,
In,some cases the shortage of capacity to meet educational
demand at university_ level haeresulted-in,a large-number of
young people leaving their country to study in foreign univers,
ities.(4) This is- especially the case in Greece -( the propor,
tion of student6 studying abroad- in the total-nutber of univers-
ity students in 1971 -was 22 ,per cent) and_ to-a-lesser degree,
in Turkey (some five thousand students abroad-as-against a=
total of 95.5 thousand in the Turkish universities), However,
Tor future. planning work, the reverse-movement thould-also be
emphasized, In-addition to domestic demand for educati-onal
serVices the number of foreign students in the national
universities- has shown_ -a-rapid increase over the decade in all
five countries;(5) in 1969 its proportion of the total, number
cf-university students was, in Greece 8,2 per cent, in Portugal
2.3 lei* cent,_ in Spain 3.6 per cent, in Turkey 6.2-percent and
In Yugoslavia 2:2 -per cent.
1) Mediterranean- Regional Project:_Yugoblavia,_ OECD!, Paris,
1955-,----13\ 45: -"The-fact that the course is very specificdrutof relatively short duration, -and that_graduateecanobtain goOd-situations-as-lecturers, plant engineers, sociallworkers, -etc. =probably counts for=as much in the- ttractions
of these schools as the fact that=admission is relativelyeasy-and thatgraduates can continue their_studieb-at the
second level Opthe university. "-
a-) See Jalomon -Wald: Individual Demand for Higher Education in
Greece, OECD, kthens-,-19 4.
3) Data for Greece (see Table IIIA in -Appandix I) inditete that
there is-_a large Unsatisfiedidemand for higher-edudation.By 1969,70, of the university candidates for science and-
-technology only-33.6 per centmere-acceptedl in non -university type higher-education the corresponding proportion_
-was 39-per cent.
4) See Higher "Education in Europe, Problems-and Prospects.
Statistical- Study,- UNE800,:-1973.-
5) See Appendix I.

The rapid educational expansion has helped substantially
in meeting development requirements. The low educational stan-
dards of large masses of the rural population has been one of
the main weaknesses of the social and economic structure of the
developing countries. Rapid improvement in the agricultural
-sector is hindered by the mass of illiterate(1) or inadequately
trained people who are attached to traditional methods of
organisation and-provuction. When they move,to the cities, they
have a limited capacity to adapt themselves rapidly to new job
requirements. The progress made-in primers education throughout
the countries is now contributing to the solUtion of development
problems, especially those emerging ttom the changing relation-
ships between the rural and the other sectors -of the economy,
Technical education at secondary level expanded at a faster,
rate than industrial manpower, and thus ensured a better quail.=
tative structure of the labour force at middle level. The '
improvement was even greater at the highet education level. '
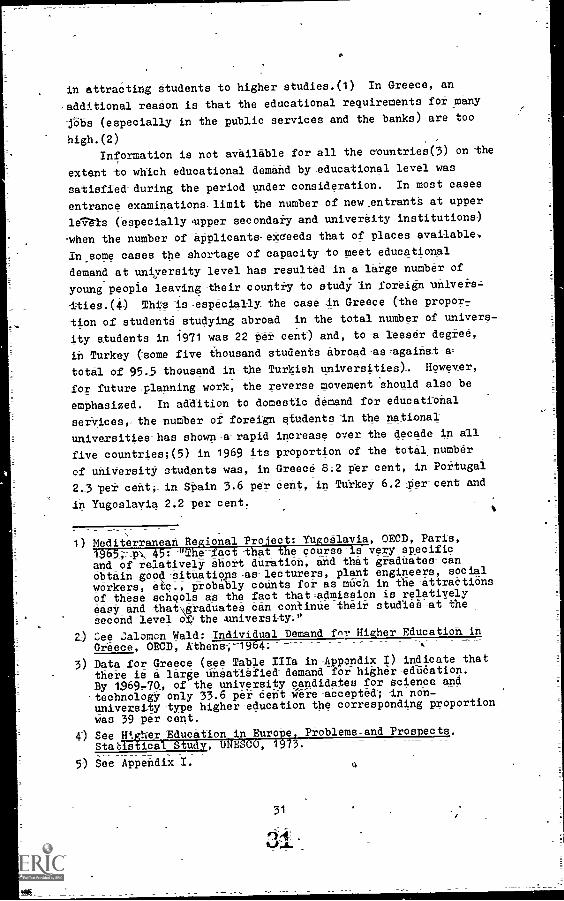
Table 8 shows that the ratio of holders of higher education
diplomas to -total manpower was substantially ibproved,in all
five developing countries. An analysis of these data reveals
that the proportion of science and technology diplomas in the
total labour force increased, in most cases, faster' than the;
proportion of total diplomas.
-A comparison with the advanced countries shows the diff-
erences which exist in social and economic structures, in tech-
nological levels and in the organisation of production and gives'
some indication, therefora, of the effort reqUired of the develr
aping countries if they are to hasten the changes desired in
manpower structure and to raise the level of qualificat.ms of
1
1-)z The illiteracy ratio in Greece is t4 per cent -(1971 popular
tion census). Accotding to the U.U. Compendium of- Social"
Statistics 1963v the illiteracy ratio-in-Spain-1(1960) was12.8 per-cent, and in Yugoslavia-(196) 21.4 per cent .(popu-
lation of 10 years of age and over)-_ In Turkey, the illit--eracy rate of the population 15 years of age and over was,-in
1960, 61.9 per cent 'TSCO Statistical_Yearbook 1970). In
Portugal, 20 per ce ,f-the-active-Population-were-iIliteratein 1960 (the MRP-PI .agal, p. 45). The largest number of
illiterates was-Souqd-in agriculture,
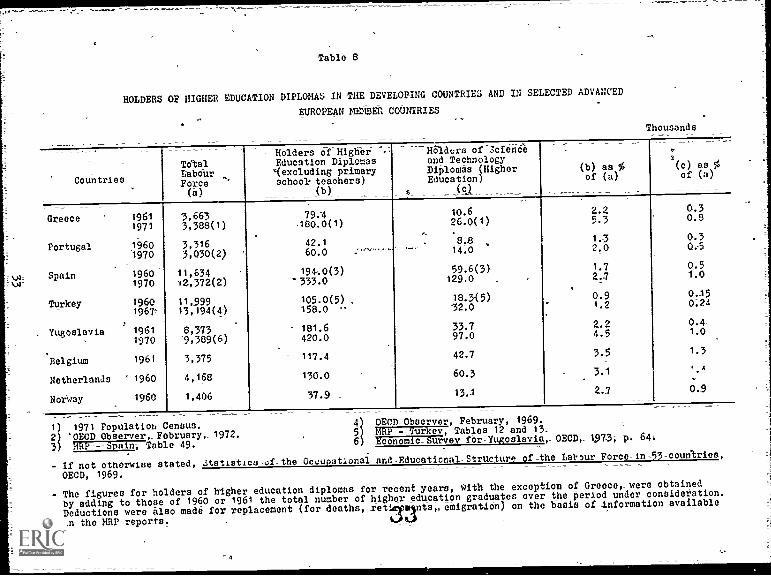
Table 8
HOLDERS OF HIGHER EDUCATION DIPLOMAS IN THEDEVELOPING COUNTRIES AND IN SELECTED ADVANCED
-EUROPEAN= MEMBER COUNTRIES
Thousands
_ .
Countries
VitalLabourForce(e)
Holders of HigherEdUcation Diplomas'°(excluding primaryschool teachers)
(b)
11Oldurs of Scienedand TechnologyDiplomas (HigherEducation)
t _ _(c1
(b) as %of (a)
.-
(c) as %of (a)
Greece 19611971
Portugal 19601970
.
Spain 19601970
Turkey 19601967,-
Yugoslavia 19611970
Belgium 1961
Netherlands ' 1960
Norway 1960
3,6633,388(1)
3,3163,030(2)
11,63412,372(2)
11,99913,194(4)
8,373'9,389(6)
3,375
4,168
1,406
79.4180.0(1)
42.1
1940(3)'333.0
105.0(5) .158.0 -
181.6420.0
117.4
130.0
37.9
10.626.0(1)
8.814.0
59.6(3)129.0
18.3(5)32.0
33.797.0
42.7
60.3
13.1
2.25.3
1.32.0
1.72.7
0.91.2
2.24.5
3.5
3.1
2.7
0.30.8
0.30:5
0.51.0
0.150;24
0.4-1.0
1.3
0.9
1=
2
3
1971 Populatioh Census.`OECD Observer,_February, 1972.
456
OECD-Observer, February, 1969.MRP-Turkevi-Tables 12 and 13.
64.7777717.717Table 49.
Economic Survey for-Yugoslavia, OECD, 1973, p.------------- --
.
If not otherwise stated, Statistics -of -the Occupational and-Educational-Structure of -the Lablur Force- in -53- countries,
OECD, 1969.
The figures-for holders of higher education diplomas for recent years, with the exception of Greener were obtained
by adding to those of 1960 or 1961 the total number of higher education graduates over the period under consideration.
Deductions were also made for replacement (for deaths, rettats, emigratien) on the basis of information available
in the MRP reports, .
_

the labour force.ii) Unfortunately, such comparisons can be
made with only a few advanced OECD countries for the years
around 1960 and for selected occupational groups. As can be
seen from Table 8, in 1969 none of the five countries had yet
reached (and only Spain and Yugoslavia were approaching) the
percentage of scientists and technologists represented in the
total labour force in Belgium and the Netherland., nine-years
before. But, as was pointed out above, the enrolment trends in
science and technology promise further improvement in the near
future--
Because of laA of information about educational develop-
ments by region, only a few specific examples can be given to
illustrate the results of the policies to reduce regional dis,
parities in educational part- icipation during the period under
consideration. In Turkey, in upper secondary education, the
highest participation rate in the year 1960-1961 was manifested
in the region "Turkey in Europe" (15.A4 the highest in all
other regions was 5.7). By 1965-1966, the participation rate
in -this region was reduced to 11.14 the proportion in the other
regions iricre'ased correspondingly42)In Yugoslavia,, the disparities which existed in 1960 in
secondary general and technical education among the regions
(Bosnia, Herzegovina, Macedonia and the autonomous region of
Kosovo had the lowest enrolment ratios) seem to have been elfin-
mated by 1960-1970; for all these regions_ participation at
the secondary level was approximately equivalent to their
respective proportion of the country -'s total population-(3)
11A-direct assessment of future developMent requirements inqualitied manpower can be h011114 in the-MRP reports. -With
regard to higher personnel, the following increases in thenumber-of holders of higher education diplomas were envisagedin these reports:
Greece (1961-1974)=: 45.5%Portugal (1-960-1975): 1- 37-2% Turkey (1960-1977): 123.0%
Spain (19601975)-: 79. -7% Yugoslavia (1960-1975):- 185,2%
On the 6asis of the data in table 8, the following increaseshave taken place over a shorter period of -bite.'
Greece (1961-1971): 126.7%Portugal (1960=1970): 42-5% Turkey (1960- 1967 -): 50.5%Spain (1960=1970)=; 71-.6% Yugoslavia (196141970): 131.5%
:) Gr-u -Pie ari-t/00-tn Edur,atinna2 Participation and Achieve=ment,--0E0D,-TaTic6 1971;-
3) Yugoslav Statistics of Higher Education 1969-1970 andMedi terranean-hegiona1=Proaect,Tugoslavia., OECD, 1960,p 50 -
34--

On the other hand, statistics available for the other
three countries would suggest a persistence of regional dispa-
rities. In Greece, in higher education, the proportion of
students,whose parents have their residence in the Athens
area to the-total number of students increased from 4
30.9 per cent in 1961-1962 to 38.-7 per cent in.1969-1970-(1) The
population of the Athens area represented 24.5 per cent of the
total population in 1961 and 31.8 per cent in 1971.
In Portugal, the region of Lisbon increased its ratio of
"liceal" enrolment to the popplation 11-18 years old: in
1955 it was the highest in Portugal (11.7) and it rose to 2..3
in 1964-1965.( -2)
Ih Spain, the Madrid_region, -With a-proportion of
8.4 per cent of the total population (1960), represented
14. -7 per cent of totalenrolment's in secondary education (the
highest in Spain in 19;8-1959). Thip rate rose to 16 per cent
in the year 1969,1970.(5)
The attainment of full attendance in primary education and
the rapid expansion of secondary education, especially of the
first cycle, has nodoubt contributed in some way to reducing
social disparities in educational participation in the'develop-
ing Member countries.Unfortunately, there_is no statistical
evidence of -the changes which have occurred during the period
under consideration in the diStribution of students by socio-
economic category in upper secondary and higher'education._;4)
Data are available only for the years close to 1960-1961 .(5)
but any analysis of this information is likely to be misleading
because of the enormous differences in Classification and
definition..
11Greek Statistics of Higher Education 1961=1962 and 1969 -1970.
2)GrouoDisparities-in,Educational-Particifoation and Achieve=
ent,-0E0Di-Taris, 1971.
3) Spanish Statistics ofSecondary Education 19 8-19 9 and
1969-1970.-
4) In Greece the number of university students who are children
of manufacturing and mining workers increased by 311 per
cent, compared with a total increase in ihe'number of uni-
versity students of 185 per cent over the peried=19591969.
Thus, their proportion to total students rose from 10.2 per
*:ent in 1959 to 1 -4.8 per cent- in 1969. (See Table IX in The
Statistical Appendix forGreece.) According to the Greek
1 -971 population census,the proportion of mining and manu-
facturing workers in the total labour force was 24 per cent
in 1971 (as against 1-7 per cent in 1961)=.
5) Zroun-Disoarities in Educational-Particioation-and_Achieve-ment,--0E0D, Paris,-1971
35

Another characteristic of educational development in the
same period is the relative increase in female_oarticipation at
all educational levelspable 9). With the exception of Turkey,
the number of girls in primary and secondary education in these
countries represented, by 1969, betw,en 45 and 55 per cent of
total enrolments. Female participation in universities
increased in the lour countries (in Turkey it remained at 23 per
centl, but it continues to be relatively low in Greece and
Spain (31 per cent and 25 per cent, respectively). The highest
participation at this level is in Portugal (45 per cent) and
Yugoslavia (38 per cent)
There has been a higher overall increase in enrolments in
the_public sector than in the private. It should be noted here
that the private sector of the educational system is important
9111/ in Spain and Portugal(1) (see Table 10). In Greece, the
private sector plays an important role in'etcondary technical
and vocational eduedtron.In Spain one of the most important
developments over the period 1959-1967 is the rapid expansion
of the public sector in secondary general education (share of
total enrolments increased from 16.9 per cent in 1959 to -
32.2 per cent in 1969)- On the other hand, private institu-
tionsAlave increased their share in non-university type
higher education in Turkey and in higher education in Portugal.
THE EVOLUTION IN RESOURCES
In view of the weaknesses of the educational systems of the
developing Member countries, as documented for the beginning of
the period under consideration,(2) it may be asked how
1 -) In Spain and Portugal chuich educational institutions repre-sent the major part of the private sector.
2)-Some of the findings of the Mediterranean Regional Project
reports for the period close to 1960 were the following:
- educational expendi=ture, as a percentage of the GNI!, was
-the lowest in Western Europe;
-.the shortage of teachers was a major problem for eduaa-
tional,expansion. , Teaching staff salaries, at all levelsof education, were found to be low, which limited thepossibilities for a rapid increase in teacher supply_;
- there was a lack of adequate facilities (classrooms,
teaching equipment, laboratories, etc.);
- repetition and dropout rates were rather high in all=five
countries.
36
36-44

Table 9
FEMME PARTICIPATION AS PERCENTAGE OF TOTAL ENHOLMENTS.
Country
Level ofEducation
Greece Portugal Spain Turkey Yugoslavia
1959-60:1969=.70-195940A969,70-1959=-60',19641-,70,195940-1-969-70195940-
, ,1969-70
._V
Primary. 47,6 47 .8 427,6 48.6 .. 50.0 37,0 42.3 -, 46.6 i_ 46.5
secondary General 40.8 45.7 46.7 47.8 -38.8 45,2 25.0 26. =1 48.7 ,- 55.8
Technical andVocational 18.0 15.7°) 29.2 36.6 ,, 22.6 38.8 40.0 E, 44.1 1: 54.0
Teacner College:: 46.6 45.3 66.1- 94.2 62.2 '55.0 25.0 46.8 66.5 = '64.1
Higher Non-University 76.2 31.0 24,4 38.8 26.3 17.9 9.9 14,9
=36.5 43.4
University 22.0 31,3 29.9 45.0 16.6 25.2 _= 23.3 23.3 28.8E 37-.9
1) Year 1968-69.
- Table 10
ENDOIMITS PRIVATE EDUCATION AS PERCENTAGE OF TOTAI EIMOLUNTS
Count; re,
Level ofEducation
Greece Portugal Spain Turkey Yugoslavia
1959-60 1969-70 1959-60 1969-70 1959-60 1969-70 1959-60 1969-70 1959-60 1969-70
Primary
Secondary General
Technical ancVocational
Teather Colleges
Higher Non-University
University
7.1
16.2
71.41)
00
-
7.1
13.2
68.42)
40
-
4.6
61.0
8.0
15.1
9.0
10.6
5.2
45.7
-
7.5
19.3
5.1
=13.0
..
83.1
12.3
. .
0.4
27.7
67.8
..
9.1
..
3.2
1.0,
7.1
2.4
1.6
1.7
0.5
3.8
1.0
25.6
1 1.7
-
-
-
-
=
-
1
-
-
1) Including non-university type higher education.
2) Year 1968-69. Including non-university type higher education.

,..
educational resources were developed to deal effectively with
the rapid increase in the demand for educational services
during-the decade.
One indication of the magnitude of educational effort in
these countries is the changes in the proportion of gross
national product devoted to total educational-expenditure -
public and private. Table 11 shows a growth of that proportion
between the years 1960 and 1968 for all countries.
Thete rates, however, continue to be of the lowest among
the European Member countries.(1) With general income levels
having been low in the developing countries and a relatively
high percentage of expenditure necessarily going for basic
needs. margins were limited tor rapid increases in educational
-expenditure. It is interesting to note, as a result of the
analysi-s of the data of Table 11, that Greece has devoted
3.8 per cent of the total increment of GNP over the period
1960-1968 to increasing educational expenditure, Portugal
2.6 per cent, Spain 2.9 pet cent, Turkey 5.2 per cent and
Yugoslavia4-0 per cent.
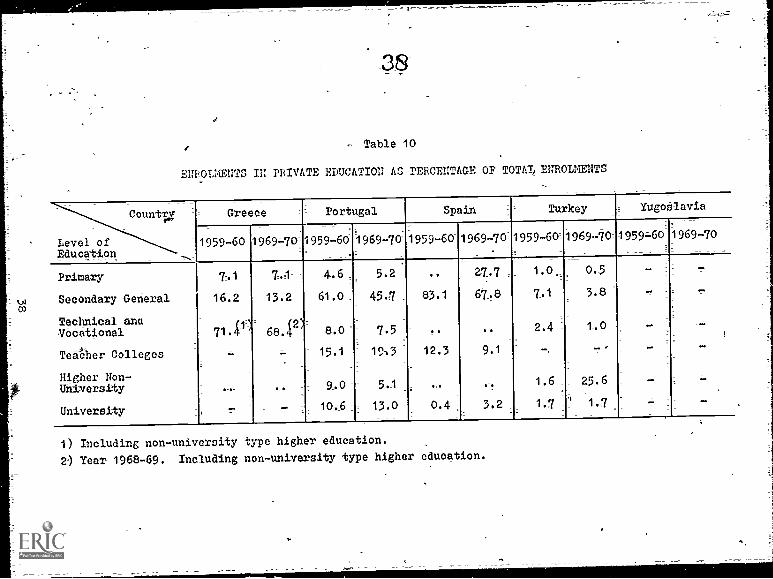
The number of teachers hat increased at a high rate over
the period at nearly all-educational levels. A comparison of
growth rates for enrolments and teachers over specified periods
can be found in Table la. Greece had to face a strong -pressure
of-numbers over the 1960's and. in spite of the fact that the
rate of increase in teaching staff exceeded that of the number
of pupils at almost all educational levels, the pupil/teacher
ratios (with the exception of teachers colleges) remained
unfavourable.(2) In Portugal, satisfactory standards were
maintained-at the upper educational levels; however, primary
education continues to be characterised-by a high pupil/teacher
ratio. Unfavourable ratios still prevail in both Spain and
1) Country replies to the OECD Educational Growth Enquiry forthe years 1968 or 1969. (Public educational expenditureonly, as a percentage of GNP, was 4.7 per cent in France,
5.0 per cent in Switzerland, 5.8 per cent in Norway, 6.0 percent in Denmark, 6.3 per cent in Finland, 6.3 per cent inthe Netherlands and 7.6 per cent in Italy).
2 -) In most of the other European MeMber countries, pupil/teacherratios in primary* aducation are below 28.0; in secondarygeneral education below 20.0: and in university education
below 12.0. See: The Teacher and Educational Change: A
New Role, Vol. II, OECD, 1974,-and Quantitative Trends inTeaching Staff in Higher Education, OECD, Paris, 1971.
39

Table 11
PUBLIC AND PRIVATE EDUCATIONAL EXPENDITURE (1960, 1968)
At current prices
Billions of local currency
Country
1960 1968
GNP-atMarket-Prices
(a -)
Educa-tionalExpen-diture(b)
(% b) as
of(a)
GNP 'atMarketPrices(a)__
Educa-tional
-Expen-diture(b).
0) ass% of(a.)
Greece' 105.6 Z.08 1.97 227.8 6.69 2.94Portugal 72.0 1.62= 2,25 460.6(1) 3.88(1) 2.42
Spain 620.4 13.38 2:16 2 010.5(1) 53.36(1) 2-65
Turkey 49.0- 1.16 2._;37 105.0 4.07 3.88
Ydgoslavia 32.4 0.96 2.96 181.9(2) 6.94(2) 3.82
1) Year t969.-
2) Year 1970, Economic Survey -for Yugoslavia, OECD, 1973, PSources: = For the Gross National- Product:
National-Aocounts-1960=1970, OECD. For Yugoslavia, theGross Domestic Product, at:market prices; the GNP figurewas not-available-for recent yearsv-but the differencebetween GNP and GDP was insignificant over the period1960j=1968 (0.4%-in 1-968)_.
- For Educational Expenditure:
For the year 1960:- Country replies to theOECDquestionnaire,LComparatiVe Analysis of EducationalW enditure"-. For Portugal data were available for onlypublic:expenditure -(1,330 million esoudos)1 on the basis
_ of Public-expenditure per pupil by educational level,,private expenditure for 1960 _was estimated at 290 millionescudos and _was added to public expenditure to obtaintotal-expenditure-.For the years-1968=1970:- For Greece, Turkey And Yugo-S lavia, replies-to-the-OECD 1970 educational growth-enquiry; for Spain and-Portugal the replies to theOECD queationnaire, "Comparative Analysis-of EducationalExpenditure"-; for Portugalthe data for private expendi=ture (1969) are found in the Appandix I of this report(Portugal, Table VIII). .
40
40,
Table 12
PERCENTAGE INCREASE IN ENROLMENTS AND TEACHERS BYLEVEL,OF EDUCATION
Educational Level
country
Primary-= Secondary
GeneralTechnical andVocational
: Teachers :
collegesNon:University:-,
151eUniversity
li,,,,41' (i)0/t3 to 190/70)2.0814.6437.2,133.15
-13.9315.8133.8133.26
(2)
28.1647.5037.7732.83
99-31145.2946.5237.80
/10.3347.0232.5e24.(t
' 40.7249.5030.4128.60
.
146.79184.1217.9713.61
(2)
159.10174.3126.1424.70
246.58124.4921.2332.77
133.73105.7816.1618.35
(1)
72.5095.9834.0930.03
42.0363.5118.6216.17
J2)52.5057.4118.0617.4(Z%,
80.7275.2611.5611.92
.
102.78
...
...
- 5.6230.33
.14.8812.50
- 2.5321.7515.8212.67
(2)
10.21-16.0617.0421.80
207.21199.3124.2424.88
-17.70-26.2314.6,16.31
-
=-
...
...
...
...
(3)
84.5879.9216.0016.42
365.88145.1513.6025.85-
315.38149.1111.82
i 19.71
120.8570.2914.4918.79
:
, 127"247
235.4239.9626.81
r...,
(4)
1'3 37110.3211.9413.25
127.00160.9613.2911.56
eb.0673.19...
134.52 '
'
Increase in enrolments .
Inn-vase in 71-175F77OTteachersYpil/teacher ratio (19/o-Nt.401/teacktfr ratio (1969/70)
Vortueal (1959/60 to 1969/70)
Increase in enr&lm;-n..-sIncrezwe In F.775717Orteacherslupil/teacnerTatio (1979/60)-Npil/teacher ratio (1969/70)
/
alOif'Increase in enrolmentslivrease in ral7n7757-teach4rsfiph/teacher ratio (beginning of period)pil/teacher ratio (end sr.period)
Turkw: (1859+60 to 1970/71) '
-.
Increase in enrolmentsIncrease in F,T.T77777teachersMpil/teacher ratio-0959160)[wiz/teacher ratio (1970/711
'
lugoolsviq (1959/60 to 1969/7 )
Irrease in enrolmentsIncrease in numb' er ol-teacheirTupil/teacher-ratio-(1959/60)
.
Mph/teacher ratio (1969/70) .
1) Technical arILd non-university 2) 1961/62 - 1970/71. 3) 1961/02 - 1967/68. 4) 1961/62 1,1969/70
type higher education.
Table 13
GRADUATES AS PERCENTAGE OF LAST-YEAR ENROLMENTS4
1. PRIMARY*IMUCATION
' Period beginning Period'ending.
Greece"
Portugal
Spain
Turkey.
Yugoslavia
Year
1959-60
140-61.
1961-62
i-62
97.9
72.6
49
90.1
Year ,
1969-7b
.1969-70._
4969-70
1969-70
I.D. SECONDARY-GENERAL EDUCATION
99.4
82,3.
95.4
.94.6
Period beginning_ 'Perlodoending
CountryYear e
/0 _Year
Greece 1959-60 78.3 , 1969-70 87.9
Portugal ' 1960-61 59.9, 1969-70 4218
Spain 1960-61 70.3 1967-68 -77,5,, ,
Turkey 1960-61 83.9 1966,67 P 85:2
Yugoslavia 1961-62 89.9 1969-70 - 97.0
__ _ _ . __
III. UNIVERSITY EDUCATION
Period beginning_ Period ending. _ _ _
-Country eYear -Year _ ,
--.
Greece 1959-60 86:5 1969=70 58.7,
Portudal..
.,
Spain 1960-61 38.5 1969-70 42-9
Turkey.. ..
Yugoslavia ,1961 62 81.1 1969-70 95.8
42
42

Table 14
REPEATERS IN THE FIRST YEAR AS PERCENTAGE
OF PtRST YEAR ENROLMENTS
I. PRIMARY EDUCATION
CountryPeriod beginning Peiod ending
Year -- Year_-_ %
Greece, -195p-60 15,8 1969=70 11_9
Portugal 1960 -61 31.4 1969=70 35.1
Spain _
Turkey 1961 -62 31.9 1966-67 3.6
Yugoslavia -1961-62 6.2 1969-70 10_5,
II. SECONDARY GENERAL EDUCATION
= Period beginning Period en ding
Year year %
Greece
PortUgal
Spain
Turkey
Yugoslavia
1959-60
_1960-61
1960-61
1961-62
13.0
11.2
15.4'
6.2
1969-70
1969-70
1966-67
1969-70
9.813.7
14.98.4
III. UNIVERSITY EDUCATION
Period beginning Period ending
Yeair14 Year
Greece
Portugal
,.SpainTurkey-
Yugoslavia-
1959-60
1961-62
17.1 -
00,14.3
1969-70
1969 -70
36.0
21.9
43

Table 15
NUMBER 0t STUDENTS ABANDONING THEIR STUDIES
AS PERCENTAGE OF TOTAL ENROLMENTS(1)
I. PRIMARY EDUCATION
CountryPeriod beginning Period ending
Year % Year %
,. Greece 1960-61(2) 0.9 1968-69(2) -. 1.2
Portugal 1960 5.2 1969 4.2_
Spain . .. ..
Turkey 1961 3.9 1966 1.9
Yugoslavia 1960-61(2) 9.4 1969 5.2
II. SECONDARY GENERAL EDUCATION
Country_Period beginning Period ending
Year Year : 794_,
Greece 1960=61(2) 9.0 1968-69(2) 10.6
Portugal 1961 9.0 1969 = 18,6
Spain'9?
_
Turkey .. 1965 ,.
Yugoslavia 1960=61(2) 111,7 1969 _10.3
III. UNIVERSITY EDUCATION
CountryPeriod beginning : -Period ending
Year ,- % Year %
Greece
Portugal (allhigher edudatIon)
O
Spain
Turkey
Yugoslavia
1960-61-(2)
1961
1960-61(2)
5.5
6.4
.' .
..
-21.7
1968,69(2)-i:
1969
1965
1968-69(2)-
5,2
10.7
..
10.4-
19,.6
1) Including drop-outs, deaths and thote returning toSchool after having left for one or more years.
2) TwO-year average. -
44
114

Turkey in primary and ,secondary general education as wdll as in
the teachers colleges. Yugoslavia e to have attained a
balanced qiiantitative expansion of enrolments nd teachers.
The number of graduates as a percenta,- if enrolments in
the final class of both primary and Recor ey education has
shown an increase in the four countries .Jr which data are
available, between 1'160 and 1969. Or the same period, the
proportionof repk _,,rs in the firs -lass, at both these
educational levels, decreased or was kept at rather low levels.
Only in primary education in Portugal does it continue to be
high. (Tables 13 and 14)-
In primary education, the proportion of pupils who abandon
their studies was reduced to a reasonable level-; in secondary
education, however, it continues_tobe quite high in the three
countries for which data are available Gable 15).
In university education, the proportion of graduates to
enrolments in the last year of studies has shown a sharp
decrease in Greece, while in Spain and Yugoslavia the propor-
tion increased. Greece and Yugoslavia have recorded a high
rate of repeaters in the first class. Final4, the proportion
of those who abandon university studies is rather high in
Yugoslavia, Turkey and Spa,.; in Greece, on the other hand,
the proportion is low.
Current information with regard to pupils per classroom,
laboratory facilities, condition of buildings, etc. is lacking.
There seems to have been an overcrowding of university institu-
tions as a result of high demand pressure at this level. Enrol-
ments in the University of Athens increased, for example, from
some nine thousand students in 1960 to almost 24 thousand in
1969; in Lisbon-Uniyersity from some? thousand in 1960 to
more than 16.5 thousand in 1971; in the University of Madrid
from s me 23 thousand in 1960 to almost 48 thousand in 1970;_
and in the University of Ankara and Istanbul from some 18 and
26 thou and, respectively, in 1960 to more than 25.6 and 37
thousand! in 1971.
An attempt to discuss the above aspects of the operation
of the educational systems in the develaping*Member countries
is made difficult because conditions and policies differ widely
troM country to country. In some cases, it appears that with
the pressure of demand the situation has worsened by- comparison
with the years around 1960 while,_in others, resources seem to
have been so used that the 1960 educational standards were
45

1'
maintained and even improved. Of course, administrative measures
.such as entrance examinations have been used in most cases to
repress demand for educational services to levels corresponding
insofar as possible to available capacity. The information
presented in this section, which covers only certain aspects of
the problem.(1) would saggest that there is still a large scope
for improvement in specific areas in each country. Existing
shortcomings together with unsatisfied demand should certainly
-be assessed in detail when planning the futare expansion of an
education system's capacity.
tO
I), It should be emphasized that all ratios given in this sectionare national averages. The MRP reports found importantregional disparities in the developing Member countries, suchas secondary schools with classes of 50 or 60 pupils orprimary schools with one class and one teacher.
46

Chapter II
° PERSPECTIVES FOR EDUCATIONAL DEVELOPMENT
DURING THE 1970s
-MAJOR STRUCTURAL CHANGES IN EDUCATION
In all five countries, the reforms enacted during the last
decade and those considered for implementation in the immediate
future are-leading to a, radical restructuring of the educational
systems within the next ten-year period. In fact, the new
structure of these systems as shaped by the reforms has con-
f,rmed,__to a large extent, to the pattern of educational ex,-
pension since the early 1960s, but it also reflects important
policy, decisions in the framework of the overall social and
economic objectives.Thus, eight-year compulsory- education is at the stage of
realisation in some of the five countries and in the others, is
one of the main educational policies to be pursued in the
19706(1).
t)- IrGreece, compulsory education was extended from six tonine years in 1964, but in 196-8 the nine -year requirementwas provisionally lifted. The Greek Development Plan(1973-1977) provides at present for the extension of com-pulsory education to cover a period of eight years.
The Portuguese Tducational Reform-1972 provides for theextension-of-compulsory-education-from six to eight years.
In Spain, eight-year compulsory education was enacted in1965.
In Turkey, the "Prithary Education law No. 222" requires aneight-year period of compulsory education, although.onlyfive years are provided at present. The Turkish ThirdFive-Year Plan provides for the extension of the durationof compulsory education to cover eight yearS (see NewStrategy-1973-1995 Ankara, 1973 p. 61).
In Yugoslavia, the eight-year compulsory education periodwas enacted as long ago as 1958.
,47

Accelerated progress in that direction is a target of strategic
importance for the overall social and economic development of
these countries. Eight years of basic studies eould be con-
sidered as the necessary minimum period'of educational prepara-
tion, at the end of which the individual should be in a position
to choose among future alternatives,- having developed an ability
to pursue further study and/or to adjust to new working
conditions or job requirements.
In Spain, Turkey and Yugoslavia(l), the eight-year com-
pulsory education is associated wi;h the establishment of an
eight-year comprehensive school. In Portugal, the first four
-years of compulsory sducation will take place in the pritary
School and the next our years in the preparatory school (which
covers two periods of two years each: the "observational course"
and the "orientation course"). In Greece, an educational
committee has been set up to study the problem.
In all above cases, children-are, or will be,- grouped in
one and the dame school, which may be considered as a_ major step
towards offering equality of educationa),,opportunity at this
level- lower technical schools will gradually be abolished or
absorbed by the new system.
The reforms provide that during the first eight years of
studies the children are offered basic, non-speciali ed educe=
tion: the need to prepare for working life for tho not wishing
to continue further studies is also provided for hrough courses
designed to impart techno-scientific knowledge, offer practical
experience and develop physical skills.
1) In Spain, "The most important objective of the-reform isthat of social integration, by the full pattitipation ofthe children of the less privileged groups all over theeightyear period of compulsory education-and by trans-forming the primary and the first cycle of secondary schoolsinto one singls General Basic Education School". This edu=cation will be free for all-. '(Spanish reply to the 1970Educational Growth Enquiry.)
In Turkey, (basic edeleation, which includes the ages of 7=-14,will be reorganiued-to constitute the lower level of theeducational system by comprising both present primary schoolsand the middle schools"-. (See National Education ReformStrategy, Ankara, 1973. p. 32).
In_ Yugoslavia, the foundations of the eight-year comprehen-siAre school were laid down by the reform of primary educa-tion in 1958. Pour- to six-year primary schools are beingmaintained (in 1969 they represented about 20 per cent ofthe total number of pupils in primary education -) until theeight-year school can be implemented all over, the country.
48
48

The reforms in upper secondary education now being imple-
mented, or planned for implementation during the next decade,
aim at reorganising this educational level either by establish-
ing one single school to prepare for both post-secondary educa-
tion and for direct entry into professions(1) or by keeping the
classical high school and, at the same time, raising the stand-
ards of the technical and vocational schools to 'permit their
graduates, in_addition to .immediate entry to given professional
activities, access to any kind of higher education.(2) These
reforms will gradually bring to an end the dispersion of educe-
tional activities into a multitude of institutions of different
standards and qualifications which characterises this sector
at present.
1) In Spain, the Educational Reform of 1970 calls for thepresent upper Cycle of secondary general education, and the
terminal class to be transforthed into a "uniform-multi-purpose bachillerato" of three years's-duration which willgradually absorb all other types Of education at this level-.This new upper secondary school is uniform in that it leads.
to a-single degree, and-multipurpoee in that It offers,apart from common and optional subjects, technico=vocational instru,:tion to prepare for occupadonal activi,
ties.
2) In Tortugal, the ultimate objective of the-Reform is thatthe upper secondary schools "take on a comprehensivecharacter, so that any normal form of secondary teaching-
cap be provided in the same institutions". At the presenttime, hoWever, a-first phase will be to consolidate alldifferent types of upper secondary schools into three types
of institution at this level: the-"Classical nigh school',the "technical high school", and the "artistic high school".
In Turkey, "secondary education institutions will be re,organised as An integrated System composed of differentschools preparing students tor life, for-work, and= higher
education..-" (See National EduPation Reform Strategy-,Ankara, 1973, p!35).
In Yugoslavia, according to the 1958 Educational Reform,the objective is "to remove the vestiges of dualism incurriculum structure and the social prestige of differentstreams of secondary education, and to ensure fuller re-alisation of the right to secondarY and higher education"(-Yugoslav reply to the 1970 OECD Educational Growth Enquiry).
In Greece,- the dual system is being kept, bUt=sn effort inbeing made to re-organise and raise the standards of uppersecondary technical and vocational education, ConcurrentlyWith the restructuring and development of the classicalschool.
49
49

In higher education, an important aspect of the reforms is
the expansion, or the establishment, of post-secondary non-
university level ins titut.ons ( "pot technics" or "short-cycle"
higher education).(11 Such institutions could satisfy at the
same time bOth ind.4vidual demand So; a large variety of speci------alisa-tiono and thy economy,-. demand for a large number of
technician and ,ther qualiflid ptr,onnel netding post-secondary
education but not necessarily at university level.
1) In Greece, the "ngherTechnical Education Centres" wereestablished as a new educational institution at past-t,.cenddr;., non- university level, separate from universities.
They are comprehensive in the sense that they embrace alarge range of disciplines-; under certain conditions,their graduates have access to university education, butthe HTEC's instruction is of a very specialised and prac,tical nature (for assistant engineers, graphic arts, para-medical professions, laborator*, workers, programming,marketing, publishing, etc.).
In Portugal, coincident with the development of the uni-versities, the reform provides for the establishment ofpolytechnics and other colleges for specialised professions(auxiliary-engineering, industrial arts, publicity andpublic relations, etc-)4 graduates from these institutions,after completion of the three -tear course, are awarded theBachelor's degree and can continue studies in the univer=sity for higher degrees (Guideline:, of the Reform ofHigher Education, Ministry of-National -Education,-Portugal, 1971-,- p. 7).
In Spain, the reform provides for the establishment of"University Collegge as post-secondary educational in-stitutions oVEhOrt duration; graduates will be entitledto continue their studies at a certain level of universityeducation (Spanish reply to the 1970 Eduojtional Growth.Enquiry).
In Turkey, "The academies and other institutions of higherlearning will turn out professionals in large quantitiesin applied sciences: whereas,- the universities will train,in required numbers,- scientists, researchers, top-level,supervisory personnel for fields of production and ser-vices, and teaching staff for higher education.,.there willbe educational institutions at different levels and withdifferent functions in thiS integrated system i f allhigher education), but there will be vertical and hori-zontal mobility between these levels for students in com-pliance with their abilities". See National- EducationReform Strategy, op.-cit., pp. 45 and 48-.-
In Yugoslavia, the two-year post-seandary schools were re-organised in the framework of the 1960 Reforth "as a newtype of higher educational institution making it possible totrain specialised cadiWon a higher vocational level inoccupations for which there were previously no higher edu-cation facilities". (Yugoslav reply to the 1970 EducationalGrowth Enquiry). The graduates of these schools may con-tinue their studies in the universities. See alsofootnote (1); p. 31 of this report.
50

Most of the governments announce their intention to in-
augurate policies for the development of recurrent education(1);
but it is still early to see concrete prograMmes for the im-
plementation of such policies,with specific targets, pre-
determined time periods, and provision of the necessary means.
The above reforms are linked to substantial changes in
the internal structures at each educational level (Such as en-
riching the. range of study options and restructuring the various
faculties or departments in the universities as inter-..
disciplinary units) in an effort to renovate the whole of their
educational systems..
A tremendbus amount of detailed work, however, will be
required for the development of new curricula and for organising
the teaching/learning process according to the new evaluation
criteria set by the reform plans. Apart froM a well- conceived
research and development effort, tt may be necessary to set up
a large pilot sector of new schools and to'proc,aed gradually
with the generalisation of this new sector to the whole School
system.
Clearly, tie crucial problem will be the training of a
teaching force capable of responding to tilt new objectives
implied by the new educational structere, The implementation of
new policies for teacher training and retraining may, in fact,
well be the test which will determine the success or failure
of the educational reform effort in these countries.
Finally, the important changes foreseen in the structure
of the educational systems are associated with the ;orresponding
extensive reforms of the educational administration at both
national and regional levels. The initiation, follow-up and
evaluation of the necessary research and development work, and
the elaboration of detailed operational plans and their im-
plethentation over a long period of time, will require
The Portuguese _Reform -Project provides that "Candidates of25 years of -age or more; who-do not possess the academicqualifications normally necessary for direct admittance tothe universities, shall be able to attend the latter ifthey pass special tests, the system of which shall be laiddown.by the universities". Guidelines -of -the Reform-ofRigher__Education, op.ci -t. The Spanish Reform (1970) -in=eludes a--simalar provision. The objective-in Yugoslavia is"to integrate education more closely with working-UTZ-andco- ordinate training with.the needs for manpower; this callsfor.-.devising...a uniform system for the continuing educa-tion outside working hours of young people and adults whoare already at work." Yugoslav reply to the 1970 EducationalGrowth Enquiry.
51

the establiohment or -the re-organisation of competent services
with personnel able to participate in and interpret tl form
effort in order to meet the desired objectives. In fak.,, such
previsions are included in all the reform project.7; in most
cases these projects often go further and make proposals for the
modernisation of the whole administrative structure, even at in=
stitutional levels.
e
ENROLMENT PORE&AST4 POR 1980(1)
The effort to re.structure the entire educational system in
all five countries will tribably have to take place under con-
ditions of continuing pressure of demand for educpional ser-
vices, especially at the upper educational levels.
This perspective is based on a number of important con-
siderations. First, there still remains a large proportion of
the population between 12 and 18 which does not attend school,4
Secondly,. the economies of all five countries are expected'
to realise a high growth rate over the next decade, ranging
between 5.5 per cent and 7.0 per cent per year. This implies
,_1) See Table 16. The technical elaboration of the enrolmentforecasts for 1980 Was made along the following lines:
IEnrolments in the first eight -years of studies, which cor-respond to the eightryear-perild-of-compulsory education,for the year 1980 were estimated on the basis of populationprojections. Total enrolments in 1980 should therefore beroughly equal to the total number of children in the cor-responding age group in the same year.
Demographic projections were also-used to estimate thenumber of pupils in upper secondary education. The estimates.were,calculated on the-basis-of enrolment ratios to beattained by 1980 taken from official documents as giveneducational targets in the countries concerned or chosen as"reasonable expectations" in the light of changing condirtions of educational development and recent experience,both within the country concerned and in other countries.
For higher education, estimates were based on expectedyear-to-year changes in the total number of students, de-rived mainly by the use of transition co-efficientsTsuchas new entrants in universities as a percentage of secondaryeducation graduates; dkop-outs and graduates as a percentageof total enrolments,- etc.).
The relevant assumptions and estimates, by country, can befound in Appendix II.
52
52

Table 16
ENROLMENT FORECASTS FOR 1980
-level of Education
-and Country
Enrolments =
(thousands)
Average annual
-rate of increase
_1960-61-1969-70 1979-80 1960 -69- 1969 -79
I. First eightyears-or studies=
Greece 1,050.3 1,145.0 1,175.0 1.0 -0.3
Portugal* -, 1,162.2 _1 ,B00.0 _- 2.6
Spain ..- 4,956.2.5,390.0 .- _ 0.9
Turkey f3-98-9-5,666.40 =9,100.0 _: 6.6 _4.8
Yugoslavia ,2,364.4 2,853.1 =3,225.0(1)i 0.2 , ; 1,3(2)
II. Upner_- secondary =
education' (General -andVocational)
Greece _ -= 185.4; 333.4- 520.0 _ 7.4 = 4.5Portugal* 129.5 : 225.0 ; 355.0 6.3 : 4.6
Spain 222.1= 471.2-1 I00.0 8.8 ; 8.8
Turkey 118.2: 313.6- 785.0 11,6 := 9.5
Yugbslavia = 334.6 657-7-1-035.0(1) 7.8 _4.2(2)
III. Non=universitv :
level highereducation
Greece 2.8 11.7 40.0 17-.6 -13.1
Portugal 5.0_ 11.6 27.0 9.8 -=8.8Spain 44.8_ 82.6= 160.0
--7.0 7.0
Turkey 18.6 61.5(3)120.0 -_1-2.7(4)- 7-.3=(5)
Yugoslavia 31,7 77%9_ 120.0(1)'10.6 : 4.0(2)
IV._ University
Greece 25.5.- 72.4 103.6 ;112,3 = 3,6
Portugal 19.8 39.3 90.0 ': 7,1 -1-8.9
Spain 77-1" 192.1 530.0 =-10.7 =10.7
Turkey 42-0 95.4(3)155.0 = 8,600- ; 5:6-5)
Yugoslavia = 108-9_ 161.8= 300.0(1' 4,5 -5.8 (2)
*- See footnotes 3, p.- 54 and 2, page 55.1= 1980-;81-.
-2- 1969-1980.-3: 1970=71.4-= 1960-1970.5= 1970-1979.
0_

iifurther important ,hanger in their economic structure(1) and a
rapid improvement in the standard of 1 wing of the population.
GNP per capita, at 1968 prices, is expected in s9mc countries
to increase between '67 v.tnd 100 per csent over the period 1968-
1930 and in other countries to more than double.(2) Such favour-
able developments are likely to generate a strung privat_
demana for educational service,s at higher levels as family in-
comes and salary levels for qualified manpower rise.
Thirdly, the'extenzion of tumpultory education to eight
years will necessarily create a higher demand for education at
upper.levels.
Finally, a "climate" fostering rapid edilcational expansionA
has already begn created in those countries Viere thert.,is,
cAr;:ent public discussion on radical education 1 reforms and
where educational plans emphasize the importance of education
as a,factor of social and economic growth. In particular, it
is being argued that high GNP growth rates will depend, to a'
large extent, on the availability of_adequately qualified
manpower. I
Por the first eight -year neriod 'Cf-_-sehoolinK,_ the overallfi
rate of enrolment growth required to ach4eve full participation
'of the corresponding age group in four of the countries -is foe-.
seen to be modest over the period 1970-1980 (between 0-3 per
cent and 1 --3 p,r cent per year) -.(3)
1) For example, the share of agriculturezin total emplo3/meniinGreece is expected to be reduced from 46.9 per cent in1970 to 32.7 per cent in 1980. The Growth -of- Out -rut1960-1980, OECD, Paris 1970.
2) GDP per capita in Greece is expected to increase fromU.S. $700 in 1968 to U.S. $1,600 in 1980 (at 1968 pricesand exchange rates); in _Portugal from $500 to 41,000, inSpain from $700.to $1.,2001 and in Turkey from $300 to 1500.(EstiMates taken from The Growth of Outnut 1960-1980,OECD, Paris, 1970, p..811.- For Yngoslavia-,---an estimate wasmade on the basis of an expected annual increase in GDPand an average annual rate of population growth of 1 percent. Thus, per capita GDP in this country should increasefroth $450 in 1967 to $960 in 1980 (at 1967 prices).
3) The estimates for Portugal are based on a recent OECD en-quiry on detographic trends which foresees a sharp de..,crease in the country's poPulatipn over the period 1970-1930 due to migration. In their preparatory work for theIV Development Plan (I7 /PF7, Portugal, 1970-1985), thePortuguese authorities foresee a higher rate of increasein enrolments in the first eight years of studieb over theperiod 1970-198u than that shown in Table 16 (2.3 percent annually as against 0.9 per cent annually).
_
54

VEnrolment ratios are already at satisfactory leve'-, while
demographic pressure is expect, to be low because ,f large emi-
gration movement. Most of the effort at this level must be
concentrated on increasing educational participation in the
seventh and eighth year:',.
Unlike the other four eountiles, Turkey's high'birth rate
makes the realisation of an eight-year compulsory edu ation
between 1970 and 19i0 very difficult. It is envisaged, therefore,
that during this period full participation w,ll be achieved for
the 'Irst five years of c-,..4)ulsory schooling and a -substantial'
imp. ,v t in the enrolment ratios will be made for the three
subset! years.(1), Even with these_ improvements, Tt(rkey will
continue to face a serious quantitative problem al the basic -
education level. although the rate'of increase in ,nrolments is''
expected to be lower than th't registered over the 1960s
(4.8,per cent pe'r year as against 6.6 per cent).
In weber se' ondal'y and higher education,
growth-raterl forecast for the decade 1970-1980 (Table 16) are
gnera]ly high for tie reasons mentioned above.. linth-tr11:76737
Greece and Yugosl.;via, enrolments in all upper'in;condary edu-
cation (general and vocational) are expected to increase at the
rate of 4.5 per cent and 4.2 per cent per year respectivly and
in university education at the,late of per cent and 5.8 per
cent per year respectively. Although still high, these rates
are lower than those realised oven the 1960s. In Portugal(2) '
and Spain, the growth of enrolments for these levels is expected
to remain about as high as during the last five or ten years
(i.e. 4.I per cent and 8.8 per cent per year respeotiydly in
upper secondary, and 8.9 per cent and 10.7 pey cent per year
'respectively in university education). These perspectives im-
ply that the Income elasticity of demand for educational ser-
vices might be higher lb countries such as Spain and Portugal
which are reaching relatively high income levels but nevertheless
1) See Mew Strategy 1973-1995, Ankara, February 1973, p.67.
In their preparatory work fur the IV Development Plan(IV/PF 7, Portugal, 1970-1985), the Portuguese authoritiesfore6es a ..ower rate of increase in enrolments in uppersecondary education (2.5 per cent pe' year) over the period1970-1980, due mainly to the provi.,ions and requirements ofthe Reform for the transition from the old to the new sys-tem uf education at this level. The estimates in Table 16show a rather "normal" growth of demand over the sameperiod (4.6 per cent per year, as was attained during thelast five years).
55

have- modest enrolment ratios for the 14-18 year age. group.
Greece and:Yugoslayla are also reaching relatively high income
levels, but the educational participation of the 14-18 year age
. group is, at present, higher. In Turkey, there have been very
important inevainees in upper secondary and university education
during the period 1960-1970, but this is explained to a large
extent by the very low participation rates at the beginning of
0 the period. For the year 1980, general income levels are ex,
pected to remain relatively low in spite of the rapid economic
growth foreseen for this country during 1970-1980. Thus, en-
rolments are expected to increase fairly rapidly but at a lower
rate than that realised during the 1960s (9.5 per cent per year
in upper secondary and 5.6 per cent per year'n university edu-
cation a against 11.6 per cent and 8.6 per cent per year for
the last decade). All five countries, of course, experience
limitations in enrolment growth due mainly to the weaknesses
whichcseem to persiSt, however small, in their social and eco=
nomic structure (such as regional disparities An income and in
social and economic infrastructure).
The proportion of non-university type higher education in
total enrolments, at presentmodest (from 0.6 per cent in
Greece to 2.2 per cent in Yugoslavia) (Table' 6), is expected-to
increase considerably.* In most of the coun "les it is anew
and rapidly developing sector: .enrolment growth rates in four
of the .countries are expected to reach between 7.7 per cent
and 130 per cent per year (Table 16).
.0n the basis of the developments in primary and secondary
education which have been discussed earlier, the following en-
rolment ratios have been worked out for age groups within the
6-18 year age bracket.
With regard to higher education (university and non-
university type) total enrolments were related to total
000ulation: in Greece, the number of students per thousand
population is expected to rise from 9.2 An 1969:70 to 14.9 in
1980; in Portugal, fr6m.5.7 to 14.0: in Spain, from 8.2 to 18.5;
in Turkey, frOM 4.5 to 6.2 and in Yugoslavia, from 12.7 to
18.4.
Due to lack of adequate information, has not been possi-
ble, w, Ain the framework of this report, to evaluate the above
developwents in relation to other objectives of the long-'term
educational policies. The qualitative dmia t of these develop-
ments on the labour force could be examined on the basis of an
.e'
56
56
MRP type of analysis. The results of such an analysis, when
compared with student.' study preferences, could facilitate the
elaboration of mure specific, realistic educational targets and
policies by broad category of discipline.
A further breakdown of total enrolment estimates for 1980
should be made by region and development centre. Such esti-
mates should be based on a regional approach to educational
problems. This form of analysip could facilitate a more com-
plete diagnOsis of the actual situation in the educational sec-
tor and the elaboration of educational investment and
operational plans.
Finally, other policies aimed at the equalisation-of edu-
cational opportunity (e.g. the applicatiol. of a scholarship/
free-board scheme) should aiso be defined quantitatively on the
basis of an assessment oftheir future effects on the social
structure of enrolments.
Table 17
ENROLMENT RATIOS
(Estimates for 1980)
Country Age Grout, '369 1980
Greece 6-13 91 10014-17 49 70
Portugal 6-13 84 (1) 10014-17 22 (2) 57
Spain 6-13 96 (3) 10014-17 32 (3) _58
TurkeY 7-15 73 88
ti
16-18 17 31
Yugoslavia 7-14 94 (3) 10015-18 44 (3) 70
1) Age group 7-14
;.%) -Age group 15-18
3) Year 1970.
EDUCATIONAL EXPENDITURE FORECASTS
To overcome existing shortcoming.; in the capacity of their
educational systems and to meet additional demands for educa-
tional expansion., the five countries have planned for a rapid
increase in edileational expenditure in the years to come. In .
57
Greece, total educational expenditure is expected to increase
by 11.6 per cent per year (period 1968-1975); in Portugal, by
13.7 per t.,nt (period 1969-1980); in Spain, by 5.8 per cent
(period 1969-1981); in Yugoslavia, by 6.1 pen cent (period 1970-
197`).(1)_ These increases are higher than the target rates of
increase in GNP which have been set in their development plans
for a four- to five-year period or forecast for the decade
1970-1980 (5.5 per cent per year-for Spain and around 7 per
cent for all other countries).(2) Therefore, in the process of
re-allocating resources for social and economic development,
al, countries have planned for the share.of educational eztvendi-.
ture in GNP to continue to increase.(3)
These estimates, however, would need to be fir -ther ela-
borated in the light of an analysis of other factors which af-
fect edue4tiConal expenditure. Table 18(4), for example shows
the estimated increase in current educational expenditure which
results from only two main factors:
i) major changes in the educational structure and incs
the number of enrolments.(5)
ii) improvements in the pupil/teacherratios.(6)_
The attainment of an eightyear compulsory education will
constitute an important facto:. in the increase in expenditure,
especially in Turkey and Portugal where enrolment ratios for
1) Replies of the national authorites to the OECD EducationalGrowth Enquiry.
2) The Growth Of OutTit 1960-1980, OECD, Paris 1970,- p. 80.For Yugoslavia, cl. The Development Plan.
3) An analysis of the data of Table 11 reveals that the annualaverage growth rate of total educational expenditure overthe 1960-1968 period was, in Greece, 1.55 times higher thanthat of GNP, 1.09 times higher in Portugal, 1_.19 times higherin Spain, 1.70 times higher in Turkey and 1.16 times higherin Yugoslavia. Based on the above mentioned GNP*growthrates foreseen for the decade 1970-1980, application of thesame elasticities attained in the 1960s would result inaverage annual growth rates of total educational expenditureas _high as some 10.8 per cent in Greece, 7.6 per cent inPortugal, 6.5 per cent in Spell., 11.9 per cent in Turkey and8.1 per cent in Yugoslavia.
4) The analysis .s based on constant 1969 prices. For the back-ground information used in the construction of this table,see Appendix III to the present 'report, "Estimates of Cur-rent Educational Expenditure".
In the elaboration of enrolment forecasts, drop-out ratioswere assumed either to remain the same or to be reduced.
The assumptiun here is that pupil/teacher ratios will not behigher in 1980 than the less favourable ratios prevailing atpresent in the advanced Member countries.
58
*. 58
5)
6)

,
Table 18
ESTIMATED INCREASE IN CURRENT EDUCATIONAL EXPENDITURE RESULTING FROM ENROLMENT INCREASES
AND ASSUMED 1"PROVEMENTS IN THE PUPIL/TEACHER RATIOS(i)
AT 1969 PRICESMillions of national currencies
Expenditure Greece i Portugal ; Spain Turkey Yugoslavia
I. Total Current Expenditure 4 850 4 660 35 315 2 642 5 690
(1969/70) '
II. Increase_in Openditure 3 675 1 67 =0 19 730 4 164 2 290(2)
770/1980) '
1. Due -to structural changes.
and enrolment increases _- (1 775)=
(1 650) 14 255 3 343 ( =2 300)
2. Due to improvements inthe pupil/teacher rati:,(based on current
.
enrolment) ; (1 900) (20) (5 475) ( 821) = ( .;. 10)
III. Total (IA- II) (- 1979/80) a 525 6 330 55 045 6 806 7 980
Ayerage Annual Rate of Increasein Current Expenditure
growth Rates_ of Total (Currentand Capital)` Educational
5.8 3.1 4.5 9.9 _= 3.2(2)
Expenditure (1970-1980)(3) 11.6(4) 13.7 5.8 11.9(5) 8,1(6)
123
See Appendix III.1970-1981.See p.57.
4) 1968 -19755) As it results from tIm income elasticity of
educacional expenditure. See footnote 3 on
pee5.61 1970-1975.

the 12-14 year age group are currently low. Since al! countries
have already reached full attendance at the primary education
level, most of the enrolment increase expected will be in the
first cycle of secondary education (or the second stage of the
eight-year basic education). In fact, with greater parti-
cipation at the upper educational levels, the overall structure
\ of enrolment increases during the decade is changing and, as a
result, the average expenditure per pupil is expected to be
correspondingly higher.
-improvement in pupil/teacher ratios will be another factor
leading to increased expenditure, especially at the primary
leel (with the exception of Yugoslavia which already enjoys
favourable ratios)-- In secondary education,- margins tor further
improvement appear to exist in Greece, Spain and Turkey; in
highereducation, in Greece and, to a lesser degree, in
Portugal. In most cases pupil /teacher ratios are much more
favourable in private schools than in public schools (see Table
B in Appendix III). proM Table 18 it can be seen that the
annual rate of increase in educational expenditure resulting froth
enrolment increases together with improveMents in the pupil/
teacher ratios would alone represent a substantial part 0f the
annual rate of increase foreseen in total expenditure. The
difference between the two rates is an indication of the mar-
gins agailable to race capital requirements and the-application of
a wide range of policies announced in the development plans and
reform schemes. Efforts to create a modern teaching force
capable of playing a-leading role in educational developMent
and innovation must necessarily be associated with both higher
expenditure for teacher training (expansion and re-organisation
of teacher training institutions) and relative improvements in
teachers' salaries (for higher qUaIlfications and longer periods
of study).
Policies designed to change the enrolment structure to en".
sure a relatively larger numbers of scientists, technologists
and technicians in order to face development requirements for
this type of qualified manpower might also lead to higher aver-
age costs per pupil. In these disciplines the pupil/teacher
ratios must be among the most favourable; in addition, the unit
costs for auxiliary personnel (laboratory assistants, etc. =) and
for space, equipment and maintenance are among the highest in
the educational sector.
Important increases in expenditure are also expected to
result from the extension of subsidy policies to cover at_least
60
60

the extended period of compulsory education. In Greece and
Yugoslavia, fret education for all is _already in practice. In
addition, policies aimed at reducing regional disparities in
educational participation will be pursued on 6 larger scale
while measures are provided to \support the studies of thosiwho
lack opportunity. The extent v such measures is still limited,
and their feasibility will have t be examined in the centext
of the broader social and economic uestions.
There is very little information available concerning the
present use of space and equipment, the condition Of school
buildings and_the contribution of construction activities in
-recent years; as a result it has not been_possible to calculate
global estimates for fixed capital expenditure for the decade
under consideration. The strong pressure on facilities which
all educational system& have experienced during the 'sixties
and the continuing rapid growth in enrOlments indicate, however,
that the five countries will be faced with the need. to elaborate
and implement vast investment programmes in the immediate future.
The problem will be more urgent at university level where tech-
nical preparation and construction are long and ^ost per student
is high.(1)
The urbanisation movement, expected .o continue at a fast
pace, Is another factor in increased expendilifre. land prices,
biliding costs, transport, etc. are rising rapidly, while the
potential freeing of resources from the decreased pressure in
the provinces is less marked. Probably one of the main reasons
for this population movement is the lack of adequate edaational
facilities in the less privileged regions.
Most of the 'plans point to the need for reducing unit costs
of education; possibilities seem limited, however, to parti-
cular items of the cost structure (e.g. unit costs of buildings)-
All plan: agreF that eduoati,nal_PYransinn should not take place
at-the ex sense of the ualit of- education; and it is very risky
to assume that, under present conditions, economies in teaching
staff (which account for the bulk of educational expenditure)
or the intensive use of space and equipment would not lead to a
deterioration in the quality of the educational services and,
consequently, of the graduates from each level of the system.
1 -)The construction cost of the University of Patras in Greecefor 6i000 students (most of them in science and technology):has been estimated at 441'million U.S. dollars, at 1968
prices.' "University of Patras", OECD, Report byJ.H. Heywood, Paris, May 1969.
61

The financing of educational expenditure varies from coun-
try to country. Generally speaking, in Portugal, Spain and
Turkey the share of the household is larger than in Greece and
Yugoslavia where education is free at all levels. The expan-
sion of private schools in some of the countries (mainly at the
primary and secondary levels) increases the burden of educa-
tional expenditure on family budgets. In Yugoslavia, the sys-
tem is being radically revised with local authorities and
communities and professional groups participating directly in
the financing of educational activities.
Since there is no information available at the present
-time with regard to (1) revenue from student fees and (ii) dir-
ect contribution of local resources, the net contribution of
the State Budget to educational expenditure cannot easily be
estiMated. It would also be important to ,know the yield of
specific taxes which are earmarked for educational activities
and the extent to which local authorities have the right to
raise local money for school construction and operation. In
turn, there is an expressed policy in many countries for the
State to encourage local authorities and/or private enterprise,
through loans and subsidies, to expand their activities in the
field of education. The rapid increase expected in educational
'expenditure makes imperative the elaboration of policies to
broaden or to mobilise new financial possibilities with refer-
ence to the potential yield of each source, i.e. State Budget,
local authorities, private sector, households. To this end, it
would be useful to establish a record of regularly supplied
information in order that the analysis of the current system of
educational financing might be made, as well as an examination
of alternative systems together with the study of resource
implications of educational development.
62
62

L
Chapter III
PRIORITY AREAS FOR LONG -TERM EDUCATIONAL
DEVELOPMENT POLICIES
THE OVERALL STRATEGY PROBLEM
As already discussed in previous sections, the five
develcTing Member countries during the 1960's experienced
important changes in thar social and economic structures:
economic growth continued at a high rate; there was a rapid
transition, linked withs.an accelerated movement towards-urban=
isation, from an agrarian to a mare diversified economy-; con=
sumption patterns changed; and there was a growing demand for
social services and pressure from the less privileged groups
for a greater share in the benefits of progress. All these
changes have given rise to serious new problems and have created
new_situations which have to he managed in new ways so as to
draw the maximum benefit from past achievements and to ensure
a steady development in the future towards a modern type of
economy and society.
Within the framework of the development plans special
emphasis is given to education in its role of serving a range
of objectives wider than in the past; however, in connection
with the extensive educational reform and development effort
these countries plan to undertake, there are two important
constraints which must be emphasized:
.i) all five countries must continue to maintain_high rates.
of economic grewth while, at the same time, facing a
strong demand pressure on resources for other components
of social policy (social security schemes, health, etc.);
ii) the possibility of reducing unit costs of education is
limited by the need to improve the auality of the
educational services in the immediate future.
63
During the 19601s, the educational systems Of all five
- countries had to face a strong pressure of numbers. Private
demand was encouraged by measures taken to generate the growth
process in education which, around 1960, was still lagging
behind other sectors of the social system. This process took
place, of course, within the general context of rapid economic
growth and consequent changes in the social and economic
structures of these countries which had a substantial impact on
their patterns of consumption: families could afford for their
children to enter employment at-a later age and they were be-
coming able to spend more on education. At the same time, the
expanding economy was in need of increasing numbers of qualified
people in the labour force.
To face the above-mentioned developments, educational
expenditure did grow faster than GNP and the increased financial
resourles thus Made available have made possible, in some cases,
the maintenance, and even the improvement,- of the standards, of
the educational services in comparison to what they were at the
beginning of the 'sixties-. In other cases, however,_ the increase
in the number,of teachers did not keep pace with that of enrol,
ments, and teacher/pupil ratios remain less favourable than in
other Member countries. Plans for quality improvements in the
teaching staff were not fully implemented, and in most of the
five countries teachers colleges are still at secondary leVel;
in many cases also the proportion of-graduates in final-class
enrolments was reduced and repeater and dropout ratios deterio:
rated. Educational institutions haVe become over-crowded,
especially in the towns, and in many cases private demand had
to be repressed, through rigid selection systems, to levels
compatible to the extent possible with the capacity available
at the time.
The general conclusion of the previous chapter is that the
high growth rates foreseen for the 19701s are bound to sustain
strong private demand for educational services at the upper
secondary a.d higher education levels :( -1) the five countries
_will_therefore continue to face significant auantitative orob-
77-n- it 7e9r- +r ncvnn, whtip Mitir.h remains also to_bedone in
1) It is also evident that the countries will be faced with agrowing demand for facilities at the pre-school and adulteducation levels, important sectors which it has not beenpossible to cover in the present analysis.
64
G-4
the direction ,f-strengthoningthe _qualitative capacity- of the
educational system through accelerated expansion of educational
facilities, increase in the number and improvement in the quality
of teachers, and the introduction' and application of modern
organisational methods and teaching techniques. While it is
generally recognised that there need be no conflict between the
pursuit of economic growth and social _development and the satis-
faction of individual demand, it is clear that, in view of th1
limited resources, giving full weight to all educational object-
ives simultaneously could lead to serious disturbances in the
educational expansion process. Therefore, these countries are
faced with a problem of strategic choices in the allocation of
resources.The Portuguese and Spanish plans do not propose procedures
for.resolving conflicting demands within the system. The Greek,
Turkish and Yugoslav plans, on the other hand, seem to attach
priority to those policies aimed at meeting qualified manpower
requirements for development.
---The-manp_ower approach is a useful tool of analysis as a
basis for policies aimed at avoiding imbalances between specific
demands and supply of qualified manpower; it is of special
importance for the developing Member countries in their efforts
to mobilize human resources to accelerate development, How-
ever, this approach should not lead to a rigid type of planning
in which the quantitative exansion of the educational system
is determined by estimates of manpower requirements.; this type
of planning might result in the appearance of shortages in
educational capacity, especially in periods of rapid increase
in private educational demand and social change.
On the other hand, a policy of marked social character can
also lead to disturbances in the process of educational growth
(e.g. a 1oWer rate of university expansion in order to provide
more grants to students, etc.).
Because education is a sector almost entirely controlled
by the State in these countries there is a serious risk that
the work of planning becomes supply biased. In fact, there is /
little or-no analysis of the magnitude and pattern of private '
demand for educational services as it_changes under -the relative
influence of various independent socio-economic factors such/as
family size and income, employment opportunities, income dis=
parities; demographic factors, urbanisation movements, etc.
65
65

The preJsure of numbers has created a serious situation
for the educational Jystems in most OECD countries calling for
a straightforward approach in the assessment of educational
growth problems and immediate action. These developments in-
dicate that once supply conditions are given, private der 'd
for e .cation exerc.sesan autonomous and direct pressure on
resources.
In a free 0...eitty, the individual cannot be coerced to
adjust his ch,_,Ice of studies to the planners'- wishes or to
refrain from spending an increasing propk,rtion of his income on
education if he so desires; as the user of services offered by
the educational system for his own benefit, he decides the length
and type of studies he will undertake Jn the basis of his actual
situation and future expectations. The role of the State should
be that of assisting individuals to attain their goals under the
best possible c-nditions. Since society's needs must also be
met through education, a rational action for the State is an
attempt thrJuz.h_a policv_of_incentives to influence individuals
to orient their aspirations in the desired direction.
The State has many powerful means at its disposal to in-
fluence the demand for educational services. It can impose
entrance txaminations In order to restrict the number entering
specific achools; it can also set course standards so high that
_nly the "best" student..; succeed in pursuing their studies. How-
ev=r. lny_ubasic_balan,e"_achievcd below aggregate private
Aomarri 4',1* or1,1 no a.Tfrpa_above,: impliiesanaccumulatt:'n
from If RA voi r f it educational capacity whir
qr. +_ -1P-0 +: undr-iroop .i.=tuations_and waste ,_f.resources.
If the State fails to fulfil its role as the main supplier of
educational services, the expansion of private schools might be
a solution (in many countries a substantial part of private
demand is met by private institutions). Alternatively, unsatis=
fied demand can result in students' leaving their home country
to study in foreign educational institutions. Even more serious,
the failure to mobilise the resources necessary for the edu-
cational system to accimmodate normal demand might also lead to
the admission f students in numbers which exceed the schools'
capacity. (How long can the authorities refuse university ad-
mission to, say, 50 per cent f the total number of candidates?)
Such an expansion, if it takes place at the expense of quality,
would jeopardise the main -bjactives -f_cduultional development
policies, including attainment f the standards of skills
necessary for building ulia m, - en economy.
66
66

.Private demand for education is engduraged by the &ate
through general subsidy policies (free edutation far all) and
equality -ox- opportunity policies (such as-Zclisiarships, loan
funds, etc.). The more selective such policies are; the fewer
the benefits to the privileged gro4s.."61.'In anyccase, a time
schedule has to be drawn up before.such.mea.duredare implemented
in order to permit the adjustments in the capOity 6f the system
necessary to accommodate additional dpmand for edugational
services,
The extent to which additional resources will be made
available for the application of policies of marked social
character dcpcnds on the importance attach'ed to education as a
factor of social development. For example, preference could
be given, in the context of income redistribution policies, to
increased educat =ional participation for low income groups
rather than to_other types of income transfers or subsidy
policies.
Although private demand estimates should be the point of
-departure in setting targets for educational expansion the
elab7ration -f rrmleo+ior ualified man ower re utrements
for development can play an important role in influencing
students' study preferences. In addition, incentive policies
which encourage individlials to opt for particular studies
(easier admission to those disciplines required to accelerate_
development) can serve as a further means for obtaining a
balance between individual interests and development needs.
In many cases these incentives could be combined with policies
to support educational participation of the less privileged
groups (e.g. scholarships for students of low-income families
in fields of study where there is a shortage of qualified man-
power).Viewed in this light, the manpower approach can offer a
basic orientation for the desired breakdown of aggregate privale
demand, for changes in the structure of the educational system
and for the diversification of curricula to meet development
needs and technological change. Furthermore, the existence of
surplus qualified manpower as a result A' educational expansion
policies can be an important incentive to private enterprise to
1) "To increase the possibility of providing equal opportunity,persons who can afford to will be urged to contribute'toexpenditures made for their own education.": Turkish Flan,
1968_to_1972, p.175.
67
67
I
0
r.
vrdate pew job eppertunitie,Jnsofar as these surpluses manifezt
' -e theM.ae-A17,e5'in areas relevant In development needs.
ThenLitdation. as outlined above, can be summed up as-
q
z I `-
ls-I matterIt,f priLrity, the public withorities have
. .,-401*caprol;kems generated by the evolution of private
-demand:',Ihis means providing educational facilities
7'T,ot study in all fields of education and'for_all
' children 04o.seek them,and'have the necessary ability.
b) The addrtiondl demand expeeted to be created by,e
educational subdIdills and by oolicies to equalise educa-
tional opporiunitV-has- to be evaluated in terms of
additional e7xpendittre_add.other resources so as to.
ensure a ,mooth process.ol: educational expansion inthe
.r
future. .
c) Manpower projecktons are necessary in order to guide
demand and educational polIcf4lannigg measures into
areas relevant to development,net..41s. *
- ,
. ' ' 1 4:2'
SPECIFIC ISSUES IN EDUCATIONAL STRuCTUAES-
The analysis clearly reveals the major changer in the
structure of the educational system which have"been taking
place in 411 five countries under the pressure of'numbers and7 -
eocio,economie developments. A review of these developments
shOws that the pressure for structural mutations will continue 0
in the future as a major policy concern in all five countries.
The following problem areas emerge as those where pressures
will be most strongly felt:
The _,-ytensi-n +TIP Derind-of comouleuly_educat'on
appcale as one of the first and main steps in meeting
both social and-economic objectives. Analysis of
-
recent. educati-mal developments indicates that in most
countries the enrolment ratio-ftr the corresronding age
group (6-13 or 7-14) has already reached a satisfactory
level and, therefore, full school _attendance for this
age group does not appear as a difficult target-to be
attained by 1980. The main problem, however, will be
4.
one of adjusting the nature of this basic education to
make it relevant to the new objectiyes of the system.
68

This will call for a major effort in the re-organisation
of the curriculum and in the training of teachers.
b) The re-or anidation of u ber secondary education has
always been,a crucial issue in the sense that the dis-
persion of educational activities at this level in
several types of educational institutions of :different
standards and qualifications, responsible t_ various
authorities, acted as a hindrance to the aPe_ication of
educational development policies for modernising the
system while, at the same time,' perpetuating and
further intensifying disparities among the various
social groups. This pro)qem will need to be examined
in conjunction with the .,eis cfthe economies -of these
countr4es for middle-level ma44.wer. Therefore, the
crucial problem at 'this level be to devise struc-
tures which reflect an optimum %.,-..bination of the
specific needs of the economy,apd.of the .Individual's
right to a fir between further study and employ-'
menu, with effective arrangements for returning to
education after some work experience and also training
facilities wi in then world of work which would enable
individuals o pursue their personal development awl,
'careers. his would indicate a flexible system of
goner and vocational.education and training; linked
overall concept such as that implied policy
for recurrent education.
c) The rapid expansion of "mivfechnics" or vocationally
ori"ented short-cycle higher education institutions is
a repent development in response to the pressure of
individual demand for new studies and of the needs for
higher qualified manpower in specialised professions.
AL clear policy regarding the purpose, status and org-
-anisation,(study options, staffing, etc.) of such in-
stitutions as well as thbir relation to,other institu-
tions 'of secondary and university level has to be
.evolved if this new sector is to contribute effectively
to a more balanced expansion of the entire educational
system.
d) The major quantitative and qvalitative problems which
have arisen in thesq,countries within the university
sector can probably be faced better by the creation of
additional modern universities in new localities, in
conjunction with regional development plans, than by
69

the expansion of existing ones. This would relieve the
pressure of numbers on the old universities, thus
improving the coneitions for refurms in their organi-
sation and operation, and would facilitate innovative
expe111
iments (new structures, institutional management
tec iques, research institutes attached to university
departments, etc.).
Some of the five countries ,re already implementing, while
the others are preparing, reform plans directed to the above
needs. In this respect special attention should be given to the
following areas:
a) the application of experimental and plot- schemes
necessary to identify the specific problems arising out
of the operation of the new schools;
b) the creation of a teaching force capable of responding
to the new objectives of the new educational structure;
o) the reform_of the educational- administration -and the
staffing of competent services with personnel able to
participate in, and interpret, the reform effort at the
implementation stage.
EDUCATIONAL PLANNING TASKS'
The developmel. )1ans of the five countries concerned lay
down in brbad lines 'the principal aims which are to be served
by education. Most often, however, little indication is given
aw tothe feasibility of the proposals (a broad list of both
general and special objectives and policies). Furthermore, as
situations are rapidly changing, the information on which
decisions are based must be continuously revised and supplemented.
A flexible tool for this purpose might be found in the labora-
tinl -f a model foi luLt91guantitative estimates of a number
of key vari,-_bles of the educational system to be used for
decision-making at the general policy, level. Such a framework,
in turn, could serve in discussing priorides for parallel or
more detailed planning work, specific research and the.programm-
ing of operational activities to be undertaken by the various
government agencies at central, local and institutional lev'el.
More specifiC-ally, resource implication studies would need
to be undertaken, with a view to arriving at total costs
70

for the implementation 0$ the reforms: _verall national growth
objectives would need to be taken into account and educational
targets incorporated explicitly into the overall national plans
and programme budgets. It is al-eo,imperative to re-examine the
mechanisms of financing educational activities in order to
consider the development of new approaches for financing the
desired rate and pattern of educational expansion, taking into
account the financial possibilities and financing mechanisms
rf the whole socio-economic system.successful planning work must,'in any event, be based on
a wide range'of information in the form ,1 basic statistics
and indicators or specific studies which illuminate important
aspects of toe development and operation )f the 'system. How-
ever., in tne five coUntres under study, a consistent, inter,
related body of educational statistical data, collected reg-
ularly by comnetent agencies, is still not availabl'a, even in
important areas such as student flows. educational expenditure
by level and branth, ete.(1)
To redress the balance t6wards more demand-oriented
planning, 2urvev7 nnl 9r.'41vPi4 _f ..fudertel ztudy_nreferences
would provide a useful basis for setting. specific targets by
level of educatiyn and discipline, enriching the range of study
options and helping -to determine incentive policies to meet
development requirements in qualified manpower.
The mannower aspect of educational growth continues to be
an important factor in the developing Member countries. Within
the framework of the Mediterranean Regional Project, a method-
ology was developed ten years ago for forecasting manpower
requirements for economic development. Studies of this type
may need to be repeated or reviewed at regular intervals in
order to assess changes in the supply of and demand for qualified
manpower: they would need to be checked against the private
demand surveys discussed above. The application of other tech-
niques for short-term planning and forecasts, e.g. industry
demand surveys, In order -to determine eventual mismatch with
-the supply of qualified manpower is also necessary as a com-
plementary tool to more traditional manpower forecasting.
I) ,tuigesti ps for a set of statistics to be used as basic
statist 1 information for facilitating decision-making atthe general policy level are included in the statistical
appendix to this report.
71

Pir/11v, vg,1 r =ind 1:ea1 odueatinnl rlanning aspects
must also be considered if a balanced distribution of educa-
tional Investment and activities is to be obtained. In view
the accelerated urbanisation movement and acc_mpanying urban.
development pr:blems, pri rity might be given t) regional
analysis and physical planing in connectipn with the changing
demand for educational services anu educational capacity in the
larger towns or cultural centres.
During the 'sixties, all the developing Member countries,
some for the first time, drew up long-term development plans
to deal with the large number of growth prublems they faced.
It would be of interest if special reviews or studies were
undertakn in order to examine:
.4a relatinohir and o,,ordination of educational
planning to the countries' overall pncio-economic
effort; -
ii) the mechanisms and procedures by which educational
plans are prepared;
iii) the type and degree of participation f those agencies
or -groups which are involved in educational activities;
iv) the relation of the planning machinery to the decision-
making process; and,
v) the methodological problems which arise.
The experience acquired from the planning procedures of
the past and from the subsequent problems f implementation
should lead to improvements in the planning mechanisms, especially
in a stren thenin sf the ractical value :f planning so as to
make it a more effective tool of long-term educational develop-
ment policies.
72
V40:7al-60

Appendix I
THE STATISTICAL FRAMEWORK'
STATISTICS FOR TOLICY-PLANNING
IN THE EDUCATION SECTOR
The tables included in this Appendix were designed in,.en
attempt to provide a structural framework of educational stati-
sties and indicators as a basis for the elaboration of periodic
educational growth reviews. Such revieirs can be. used for
facilitating decision-making at the general policy-planning
level, i.e. on general education objectives, key issues and
long-term development policies.
These types of decisions cannot be Oaken piecemeal; the
feasibility of each of them should be assessed against ether
decisions taken at the same level if a balance is to be ensured
in meeting a wide range of objectives. Statistical work,
therefore, should facilitate the identification of the major
probleMs in the field of educatz, iou and the assessment of theirt
relative importance as against educational goals and-available
resources in order to determine the type and magnitude of the
effort to,,be undertaken, over a pre-determined period of
time, for educational development.
The set of decisions taken at the general policy level
constitutes the zeneral framework within which detailed research
work, specific studies and the programming of the numerous
operational tivities will be undtrta_en by various agencies
at the-cer , and/or local and institutional levels. The
set of educ Tonal statistics proposed here will refer only to
the overall educational policy/planning work; information
sub-systems geared to the global model will serve the more
specific work reqUIred for the implementation of the general
policy decisions.

The importance attached_to education as a multi-purpose
activity and the power of the State to influence educational.-
developments should not lead.to a supply-biased educational
policy planning. Education is a sector of services supplied
by public and/or private institutions to individuals who seek
education to fulfil their own goals. The quantitative and
qualitative standards of the educational.services are related
mainly to input factors such as teachers and other personnel,
buildings, eouipment, and other-goods, i.e. all items included
in the cost structure of the educational services as defined by
the System of National Accounts (UN-OECD) (1 -)
In_fact, the body of statistics proposed here includes
data describing developments in the size and pattern of_private
demand and in the supply of educational services.- These data
could also give evidence as to the effectiveness of the system
in meeting this demand. Moreover, to take into account other
major areas of policy concern this set of statistics can faci-
litate the working out of a number of indicators-of the perfor-
mance of the system as against the_general-goals of- educational
development (manpower aspect of educational=growth.(2) reduction
of regional and-social disparities)- llnally, account is-taken
of the need to provide the basic material for theelaboration_
of models of global quantitative-estimateJ of a number of-key
variables of the -- educational system uver long,term periods in
the future, including --the assessment of resourca implications
of alternative targets of- educational growth.
Because of the high- degree of- =aggregation neededin the
synthesis of such types of study -. the statistical,baSis-sugges-
ted-here might as well be used .for-gross comparisons-at inter-
national level.
1) At this stage of the statistical effort, consideration ofother inputsf such as student participation in the educa-tional process, opportunity costs of student time, -etc.,is left to specific surveys or studies; their importance_for-general-policy decisions or planning purposes is-notignored, at least as factors influencing the-evolution ofthe basic magnitudes of the educational sector.
2) Information is provided both for following_up the trendsin specific dethand for educational services (i.e. by -fieldof study) and also foi facilitating an analysis ofproduction-manpoWer-education relationships.
76
_74

Thus, in" the following paragraphs reference is made to the
stati:Stical tables(1). presented by country at the end of this
Appendix, with regard to the following main areas of policy/
planning concern:
i) data which illustrate the relation of
educational levels to overall objectives;
ii) data which describe the nature and size of
educational growth;
iii) data on resources for education;
iv) indications on data needed for forecasting
purposes.
A' final section refers toclassification problems and
suggests practical categorisation relevant to policy/planning
purposes.
It should be noted here that for several tables included
in the initial questionnaireinformation-was'not available
It has thus been necessary to reduce their number (Mainly by
eliminating further breakdowns Of the basic tables) to what
could be considered as the minimum re'outred Sor_a body of basic
educational statistics.Nevertheless, some tables could not
be completed; they are presented in this Appendix, however,
for the purpose of suggesting a priority for future statistical
work.
INDICATORS OF EDUCATIONAL PROGRESS IN RELATION TO THE
GENERAL OBJECTIVES OF THE EDUCATIONAL DEVELOPMENT POLICIES(2)
These indicators would help towards a first appreciation
of situations in terms of educational goals. Moreover, when
related or compared to other socio-economic magnitudes, they
1} These tables -refer to the magnitudes of the educational
system itself. Needless to say, for the DurDose of thisreview use was also Made of data relevant to other Darts.1f the socio-economic system necessary for the analysis ofeducational developments (such as demographic, labour forcestatistics. national accounts. etc.) which, however, areincorporated in other sets of statistics.
2) At national level. For regional development policies thesame set of statistics proposed here could be used for thecollection of data by region.
77
Pflitr:
i

could draw the attention of policy-makers to adjustments or
changes required to ensure a balanced growth cf education and
the other sectors, thereby avoiding future bottlenecks.
The following list is not exclusive of other indicators
which could be examined In the context either of a broader
system of socio-economic indicators or of the analysis of
demand for educational services (e.g. interplay between housing
conditions in one area and education). The purpose in this
paper, however, is to attempt a selection of what eculd be con-
sidered as strategic indicators. For the same reason, no
reference is made here to partial systems of indicators related
to special subordinate problems which can be the subject of
specific studies.
a -) Enrolment ratios: Table I includes data by school-age
and level of education.
b) The educational structure of the labour fcrce:.
Tables Xi and Xla on holders of higher education
diplomas (by sector of economic activity and educational
discipline). Up-dating of this table can be made
every year through either sample surveys or estimates
of the net increase in the number of holders 4
diplomas (number of additional graduates less replace-,
ment for deaths, emigration and retirement). Sitilar
data.on the stook n' . .-,4ted people can be collected
for other educational lavas as well.
c) Social disparities in educational participation:
Table IX. on distribution of students by father's
profession. These data can be collected on an annual
basis, as every student dec\aresares his father's profession
when registered with the school.
Ail Regional disparities in educhtional participation:
Table X on distribution of students by large towns or
regions of their parents' residence. As in the case
of (c), such,data can be avail ble on an Annual basis.
a) Final coneum tion expenditure and fixed cpital
formation in education, in relation to other general
government and overall outlays:\rhe OECD National
Accounts Division recently (1971') began collecting
these data for education on an annual basis.
78

Census data can yield information on illiteracy ratios in
the case of countries where thin problem is still of importance.
DATA ON EDUCATIONA1 EXPANSION
The following type of statistics is proposed for presenting
the main fc.--..-tares of the evolution in educational demand (and
the trends in the supply of qualified manpower) and for relating
it to the movement of other magnitudes of the socio- economic
system (-income elasticities of enrolments, changes in the ratio
of employed people of school age to the corresponding population
age group, etc.).
a) Enrolments by educational level: Table II can help in
working out t4rowth rates by level of education and in identifying
the changes in the structure of enrolments. A further break-
down of this table is being made for the following purposes:
i) to show the evolution of female participation in
enrolments,
i -i) to show the relative role of the private sector in
covering part of the demand for educational services.
b -) Number of candidates, new entrants and enrolments in_ .
higher education, by field of study: The purpose of Tables
Illa (university education) and IIIb (non-university type) is
to supply evidence as to the trends in specific demands for
educational services (e.g. enrolments in or demands for science
and technology as against other disciplines). More specifi-
cally, these trends can be compared with the desired evolution
of education in relation to socio-economic development needs-
It would also be of interest to show the stock of unsatis-
fied-demand (where entry restrictions are applied) and/Or the
number of candidates who sit entrance examinations for the
second or third time.
-) Number etuder+Q s+IllyIng abroad and foreign students
in national universities: Table V can help in indicating the
changes in demand for educational services (at higher education
levels) which is channelled abroad and in foreign demand in the
country concerned (to be taken into account in expanding the
capacity of the system).
79

d) Number of graduates by educational level: Tables VI,
VIa and Vib show the output of the systems; they aan help in indi-
cating changes in the structure of graduates and in the stock
of educated people in order to compare with labour market
conditions and bong -term perspectives for qualified manpower.
e) Transition coefficients by educational level: These can
be derived from Tables VI, on Graduates, and Table III, on New
Entrants.
DATA ON EDUCATI6N4 RESOURCES
The next step is to describe how educational expansion is
met, i.e. changes in educational resources in relation to the
evolution in demand.
a) Educational expenditure. Table VIII shows expenditure
by agent of educational development, major cost item and level
of education. It can indicate the changes in the structure
of expenditure and relate these changes to the evolution in the
number of enrolments and teachers.!
time and part-time teachers by sector -_ public and private -b -) IiTeachers: Tables VII and the number of full-
-and level of education so that changes it their numbers can be
compared with the corresponding changes it enrolments. A
further breakdown of Table, VII has been mad to show the number
of teachers by field of specialisation, as a asis for the
analysis of present and future requirements in teaching staff.
c) Basic relationships with quality implica ons
The following group of ratios might offer some eleccnts for
a-first evaluation of the 'operation of the system:
i) Graduates as Percentage of Last Year Enrolments
(Can be derived from Table Tic, to enrolMents in
the last year of each educational level or branCh,-
and Table VI on the number of graduates).
ii) Repeaters in the First Year as Percentue of-First
Year Enrolments (Can be derived from Table Tic,
showing enrolments in the first year of each.educa-
tional level, and Table III on New Entrants).
iii) Number of Students abandoning their Studies, as
Percentage of Total Enrolments (Can be derived from
the combination of Tables II, on Enrolments, Table
III, on New Entrants, and VI, on Graduates: Enrol-
ments in previous year + New Entrants - Graduates in
80
previous year - Enrolments in current year).
iv) The Prcpertio+1 of punils above 4ormal Ago in Total
Fnrolments. by Educational Level (Can De derived
from Table I).
v) Pupil/Teacher Ratios (Can be derived for both public
and private sectors from the above-mentioned tables,
on Teachers and Enrolments).
J
A rough indicatisn of the situation with regard to educa-
tional facilities oar be hid, for primary and secondary educe-
tion, from data on the number of classrooms and of pupils per
classroom, on the condition of school buildings (new, adapted,
rudimentary) and 'ft the increase in space over a given period
of time. For the higher education institutions (universities,
teachers colleges, etc.) however, it would be more realistic
to have information r, the increase in capacity ;in terms of
the number of students to accommodate) either of the existing
institutions and/or from the construction of new units, in order
to compare with the increases in enrolments.
FORECASTING
The above set of educational statistics describes situations
in key areas around which policy discussions should take place
during the target-setting process. It can be used for testing
the basic assumptions and working out estimates of the extent
and pattern of educational expansion in the future and for
rapidly assessing the feasibility of major educational initia-
tives under consideration.
Statistical work should be related to the following stages
of the planning procedure:a) Following the description of the system and of the
changes which occurred in the past, as suggested in the previous
sections, estimates should be made of private demand for educe-.
tional services in the future on the basis of its current deve-
lopment under the influence of independent socio-economicActors.
b) A second step should be that of evaluating the develop -
meats foreseen, as above, against the policies envisaged to
meet educational goals and to assess the desired changes in
private demand to respond to these policies.
c).The resource implications of alternative educational
growth targets should be examined and related to the overall
R1
1.."(e%

national growth targets and forecasts of total resources to
be made available for social and economic development.
To meet the basic requirements of the above work, the
following information can be derived from the proposed set of
statistics:
a) Student flow data
i) The evolution of enrolments by level of education
(Enrolments at year X = Enrolments in the Previous
Year, Less Graduates in Previous Year, Less Number of
those who Abandon Studies, Plus New Entrants) can be
obtained by the combination of Tables II,_ on Enrolments,
VI, on Graduates, and III, on New Entrants, The net
number of those who abandon their studies every year
can be obtained as indicated in the preceding section
under (c -) (In).
ii) The flows of students from one level to another can be
obtained from Table VI, on Graduates, and Table III,
on New Entrants.
Data on the school-age pop-ulation and demographie projec-
tions by age should be available from other competent sources__;_
it would be useful, however, if they were also included in
the set of educational statistics.
b) Private- demand trends
Itansition coefficients and the structure of enrolments
might change in the future under the influence of various
socio=economic factors on private demand for education.
A first indication of the existing margins of expansion
of educational deffiand, especially at prithary and secondary
levels, is the difference between present enrolments and the
projected total number of children in the corresponding age
groups. Other indications are given by the type of inforMation
proposed above (social and regional disparities, female parti-
cipation in education, number of candidates by field of study,
tc..). For the expected rate of increase in enrolments, a
number of basic assumptions can be made in relation to expec-
tations as to the changes in the general social and economic
conditions (populatii;h structure, income levels and disparities,
employment of school.age population, qualified manpower demand,
R2
80
All these assumptions should, of course, be tested by
more detailed demand studies based on family budget surveys,
student study preference surveys, studies on women's participa-
tion in education, regional studies, etc. which can be prepared
at longer intervals.
c) Policy interventions
Governments might intervene and influence educational
developments both in their effort to provide, as suppliers of
educational services, the necessary facilities to meet educa-
tional demand as it actually develops and/or to manage demand
in line with thie goals of educational development. To this
end, the procedure suggested above could help the planning
authorities to identify -key arPas where State intervention is
necessary-. Thus, demand can be encouraged for fields of
study where manpower is short; educational expansion can be
festered in regions with lower educational participation; but
strict entrance examinations can repress demand for certain
fields or educational levels, and so on. Thus, alternative
rates and patterns of educational expansion, based on an
assessment of the effects of State intervention on the evolution
of educational demand, can be proposed for the choice of
policies and targets of educational growth in the future.
d) resource implications
Proposals for future policies to meet private deMand for
education and to meet other qualitativefaspects of educa-
tional expansion should be presented with estimates of resources
required, over a certain period of time in the future, for their
implementation.
The information which might be produced on pupil/teacher
ratios, space per pupil and expenditure by major item of the
cost structure as suggested above can help to assess rapidly
the implications of educational expansion in terms of human and
financial resources (a) from the expected increase in enrolments,
and (b) from changes in the quantitative standards of the educa-
tional services (e.g. improvement in pupil- /teacher ratios).
Here again, specific studies on costs of education-(per
pupil, teacher, space and/or' construction costs per unit of
educational institutiont,such as universities, technical
schools, etc.), on financing of education, on teachers' wages,
etc, -can furnish important material both for testLng the estimates
83
81

outlined above and fill preparing subsequent detailed programming
and project,implementation.
C1ASSIFTCATION PROBLEMS
0Once the objectives are given for the elaboration of a
set of statistics, problems of definitions and classification
have to be solved with regard to the items to be included in
the relevant tabulations. These problems have already been
treated in previous methodological work by the OECD Secretariat
(e.g. me+h-d-7_,4,,(1 7+a_ti-tinal Need for Educational Planning
and -Classification of_Educational Systems), while many practical
problems connected with the utilisation of national statistics
have been dealt with in several other OECD educational studies
and reviews based on statistical analyses.(f)
The important issue, however, which has to be considered
here is the main structure of the edv.-Itional system to be5
adopted as the basis for the collection and presentation of
the statistics.At present, national statistics by educational level are
presented for ore-primary, orimarv, secondary (general and4
technical) and higher education. More detailed information is
presented in the form of breakdowns of the above categories
while the need is recognised to present' separate data for non---formal education. Of particular importance'in discussions on
policies for post-secondary education has been the work of the
OECD Secretariat in connection with the classification and
presentation of data for the non-university Sector of higher
education (or short-cycle higher education), including the
classification of data for all higher education by field of
studY.
In addition to the above change in the structure -of educa-
ti statistics, which has covered the entire higher
edUcation sector, the trend is now to consider the first eight
"tati-+iee a our 'orce in ountr es, OECD,-- 9;
(Group Disparities in Educational-Bartle/oaf...on, OE(D,1971; StuAy on-Teachers, OECD, 1965; Quantitative Trendsin Teaching-Staff in Higher Education, OECD, 1971;bevennment of Higher Education 1950-1967, OECD, 1970.
---f +110 occilrational and Educational_ Structure
84
82

. or nine years or otodies (primary eAucation plus the first
cycle(1) of secondary) as an overa 1 stage of "Jasic education".
fIt is becoming an expressed policy in all Member countries that
all children between the ages of 6 and l'.' or 14 Ur / and 14 or
15), which corresponds to minimum of 8 to 9 years' compulsory
education, receive the same type of mainly general studies
(either in one comprehensive school sr in twc subsequent cycles),
while upper s,Oondary education is subject to separate treatment
to perform the qr le function of preparing students for
specialised vo, t. o and fo: highe' education. As pre-school
education is-st:11 treated as a separate iss,_ in most Member
,countries, a specific category for it is proposea. Non-formal
education is of growing importance in all Member countries, but
,,more developmental and analytical work is required before a firm
classification system for it can be proposed.(2)
,4 For the purpose of this review, the "basi, education" level
appear- srlv 1,) the -0-entatien ,f enrolment forecasts and of
educational expaAtliture. But, for the follow-up of develop-
ments at his level (to take into account the specific country
policies), the statistical tables refer to the pres:nt structure
in each ountry% For the upper educational levels, 'Iowever,
the OECD Classification of F.ducationalSvstems was applied.
The 01atIstical tables by country are preceded by a note
which'makei reference to a particular classification and
definition problems.
1) , When this first wit; of secondary education is pot incor-porated in an eight-year school of basic studies.,
2) Tt is thus suggested that the basic structure of educa-ta4nal statistics would refer to the following categories:
I. Higher Education:
1. University` type;'2. Non-university type
II. Secondary Educatio ,.:7aper):
1. General2. Technical and Professional
Basic Education:
1. Primary2. First cycle of secondary
IV. Pr-School Education
In to policy considerations, the above structurecan better facilitate iiternational comparability, at leastas regards aggregate figures, and makes easier the utili-sation of national statistics.
O
s5
83

,..
/
I;
,-----, -
STATISTICAL TABLES.
, 1'
.
. 84
;

GREECE
EDUCATIONAL CLASSIFICATION
The following educe.' 1 levels (and fields of study) are
preeanted by reference to the "conversion key" for Greece
(OECD classification):
1. 'Primary education
-The f-ixst six years covering compulsory education (pre-
primary education is separate from primary education as thus
defined).
2. General secondary education
Education provided in:
- Six-year courses in "Gymnasia".
- The "Scholai ecclessiastikai" (religious schools)
except for "Ecclessiastika phrontistiria" (course,
covers the two terminal years) which are classi-
fied a non-university type higher education:
3. Technical and vocational education
All the technical and vocational schools ("Technike"
technical, "Agrotikai" = agriculture, "Emborikai" = commercial,
"Oikiakis Oikonomias" domestic economy, "Parochis Koinonikon
Ypiresion" = social services, "Kallitechn.kis Ekpedefseos" =
fine arts). The following are not included:'
Those which are classified as non-university type
higher education.
- "Anoterae Technicae Scholae" (Tecnnical colleges). ,
- "Emboroploiarchon" (Training of merchant marine officers).
- "Koinonikon Ypiresion"-(Higher social service colleges).
89
85

"Phio._.ynodon" (Guide interpreter ,:choolfs).
"Ecelessiastika Phrontistiria" (Course for the two
terminal years of ecclesiastical school).
are 11,1itP, gP,t,ral secondary
school education.
- "Scholai ecelessiastikai" (Eccle.Aastical schools).
4. Teachers colleges
All teacher training colleges ("Paidagogikai Acadimiae").
5. Non-universitv type higher education
- All technical and vocational schools listed in
paragraph 3 as non-university type higher education.
- SELETE: Teacher training college ("Sc.'1oli Ekpedeftikon
Litourgon Epangelmatikis Technikis Ekpedefseos" =
technical and vocational teacher training colleges).
- SELETE civil engineering colleges fe Leachers of
technical subjects.
"Ethniki Akadimia Somatikis Agoghis" (National Adademy
of Physical Education).
- "Anotati Scholl Kalon Technon" (Academy of Pine Arts).
"Scholl Nipiagogon" Kallithea-Athens (Teacher-Child
Welfare Training Schools):
"Scholac Oikiakis Oikonomias" Kallithea-Athens and
Canoe-Crete (Schools of Domestic Economy).
6. University type higher education
- All uni!tersities: University of Athens, of
Thessalon ca, of Patras, of Jannina, Technical
University of Athens ("Etbnikon Metsovion
.Polytechnion").
- "Anotati Scholl Oikononikon ke Emborikon Epistimoe
(Higher College for Economic and Commercial Sciences) .
- "Panteios Anotati Scholi Politikon Epistimon" (Higher
College of Political Sciences).
- "Anotatac Viomichanikae Scholai" liraeus and
Thessalonica (Colleges of Advanced hidustrial Studies).

"Anotati Geopiniki Scholl" Athens (Higher College
of Agriculture).
NOTES 01! THE TABLES
TabIJ I: IhrolmentJ by cluati.nal level and veer of age and
enrolment ratios
Enrolments for children age "X" represbnt the number of
children who had attained that age at the beginning of
the school year.
Table III.a: Uniyeraitv type higher education: number of
candidates, new entrants and enrolments by field
oi study
(The following definitions which apply to Table III.a,
university type higher education, may be adapted to
other tables in which the defined terms are used.)
- Candidates: all persons seeking admission to
university type higher education.
- New entrants: first-year students registered for the
first 'Axle.
- Field of study: the OECD classification of higher
education by field of study is given on the next page.
Table IX: Distribution of university students by father's
profession
The seven occupational groups shown in this table corres-
pond to Major and Minor Croups of the International
Standard Classification of Occupations (see p. 254).
Table XI: Educati,z, 1)3, ar_tLT cf economic activity: number of
persons with university diplomas by field of study
The grouping by sector of economic activity is based on
the International standard Industrial Classification of
All Economic Activities (Isle): (see p. 2551.
ut
87
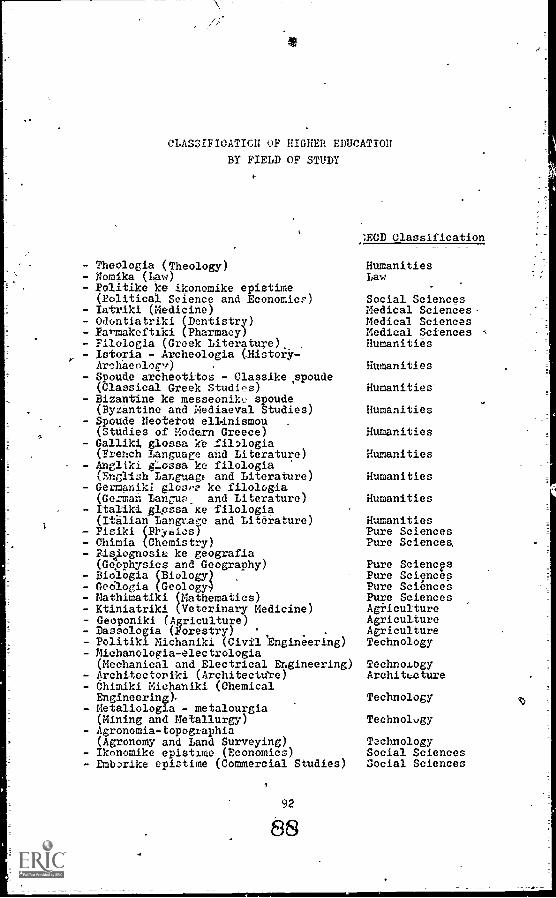
CLASSIFICATION OF HIG
BY FIELD OF S
-ER EDUCATION
UDY
Theologia (Theology)- Nomika (Law)- Politike ke ikonomike epistime
(Political Science and Economicp)- Tatriki (Medicine)
Odontiatriki (Dentistry)- Famakeftiki (Pharmacy)- Filologia (Greek Literature)- Istoria - Archeologia (Histoiy-
Archaeolocv)- Spoude archeoti -tos - Classikexioude
(Classical Greek Studies)- Bizantine ke messeonik spoude
(Byzantine and Mediaeval Studies)- Spoude Neoteou ell-inismou
(Studies of Modern Greece)- Galliki, glossa ke filologia
(French Language and Literature)Angliki Glossa ke filologia(English Language and Literature)
- Germaniki glosee ke filologia(German Iancua_ and Literature)
- ROAki glossa ice filologia(Italian Iangtage and Literature)
- Fisiki (Ph:ye.Lcs)- Chimia (Chemistry)- Fisiognosia ke geografia
(Geophysics and Geography)- Biologie (Biology)- GeOlogia (Geology)- Mathimatiki (Mathematics)- Ktiniatriki (Veterinary Medicine)- Geoponiki (Agriculture)- Dassologia (Forestry)- Politiki Michaniki (Civil 'Engineering)- Michanologia-electrologia
(Mechanical and Electrical Engineering)- Architectopiki (Architectnre)- Chimiki Michaniki (ChemicalEngineering).
- Metaliologia - metalourgia(Mining and Metallurgy)
- Agronomia-topographia(Agronomy and Land Surveying)
- Ikonomike epistime (Economics)Emberike epistime (Commercial Studies)
92
88
:HOD Classification
HumanitiesLaw
Social SciencesMedical Sciences.4edical SciencesMedical SciencesHumanities
Hui anities
Humanities
itiesHuma.
Humani
Mumanit
Humaniti
ties
ies
es
Humanitie
HumanitiesPure ScienPure Selene
eses,
Pure SciencpPure SciencesPure SciencesPure SciencesAgricultureAgricultureAgricultureTechnology
TechnoiOgyArchitecture
Technology
Technology
TechnologySocial SciencesSocial Sciences
Qi

OECD Clacsiiieation
- Politike epistime (Political Science) Social Sciences
- Dimosia diikisis (PublicAdminiStration) Social Sciences
- Biomichanike spoude (Industrial Stud-es) Social Sciences
93
89

LIST of TABLES
I. Enrolments by educational level and year of aceand enrolment ratios 96
II. Enrolments 97
I1.a Number of students in private schools (18
II.b Number of female students in public andprivate schools 98
1I.c Enrolments in the first and the last year ofstudies 99
III. New Entrants 100
III.a University type higher education: number ofcandidates, new entrants and enrolments by \
field of study 101
ITI.b Non-university type higher education: numberof candidates, new entrants and enrolments byfield of stud:, 102
IV Higher education. number of female studentsby field of study '103
V. Higher education: foreign students in the..country and nationals studying abroad byfield of study 1 104
VI. Graduates '105_
VL.a University type higher education: number ofgraduates by field of study (1st degree ofstudies) '106
VI.b Non-university type higher education: numberof graduates by field of study (1st degree ofstudies) ,. ' 107
VII. Teachers and professors by educational level. 108
VII.a Teachers and professors in private schools byeducational level '09
VII.b Teaching staff in universities by, status andfield of specialisation 110
VII.e Full-time teaching staff in secondary generaleducation by field o.i,specialication 111
ci VIII. Educational expenditure '12
IX. Distr:but.fon of university students by father'sprofession
..
X. Distribution of university students by regionof parents, residence
113
114-

XI. Education by sector of economic activity:number of persons with university diplomasby field of study iic
XI.a Education by sector of economic activity:number of persons with non-university typehigher education diplomas by field of study 116
XII. Pre-primary education 117
Sources 118
Or,

4140.4,1,
.92
7,4544-,
LNPOLMENT.3(1) 5Y ED1KASIONAL vevEL ANP YEAL O' A61
AND tNNUMEr: RATIN (1969-61)
Ttou.:ar1.
Yevr ofAgv
h-1'r . ,n1lryleneral
,eollil,414n1
vovAtlonal;ea.:I-ere'
eolle.,e,
Non-unlyeritytype Lleterelulatlon
ft,v,",., ".:ot_.1
enroll-111,
Populationof age groupat 1.1.14.1
Enroirtntrttlo_
(-)
'7.
14t.. 44.4
7 1,90 1590 14n.! y5.t
147. 4 igr_. 141. 1.1) 1.11,) 14n.) tit.' 10)0
10 ' 14'.4 141.4 14,.9
11. 14 .4 1.t _1 112.7 I4..1 1:,1
1.-J 170 l'.5 4.1 114.) 11',4 7o.o
It II,., 74. t.5 )1.7 14.4 ,,...1
1.4 71. 7.) 4..' 144._ t1.1
it ii.
.4.1,
,.,
69.'
t6.7
14.6.,
141.4
5-0.6
47.0
,I. 41.4 ..,7,4 14.1T. , 141.4
1a 1,.9 " .. 1.54 ... t.:
1,-; 1.9 ... 0.62 ... 4.5
A.. ... '.55 ... It./
1.7
4.1
.1.4 c.1
-4 ... v..7 4.4
-4-. ... 0.04 ... 2.9
... 7.01 ... 1.1
27 k over .. 3.9 ... 3.5 ,
Total 944., 421.7 741.4 7.7 9.' 71 . 1,n2).A
:narve; Tor enrolrlent,: :Avtletle41 folrb,ok for FAucatIon 14(a-19,1
For Toralaticn: 10i$,erirl.1e TrenIn In tree&a. 1950-191o. Ministry of Cc.or4iratiQ7, 1969,
1) Not Arplalltg: - priaary night ochvvia (12.517 purilft)
"teelal art 4.7nool4 (7,1,49 rypils)

GREECE Table II
NTS
Year PrimarySecondaryGeneral
Technicaland voea7tional(-1)
Teachers'. Col egos
Non-university .
type hi hereducation
Y hiversity_TotaleArolments
1959 -60 927,331 260,492 47,547 2,384 ,
2,618 23,847 1,264,219
1960-61, 912,262 274,538 48,870 2,314; 2,819 25,549 t,266,352
1961-62 :927,853 292,446 58,178 2,256, '3,451 27,927 1,312,111
1962-63 928,717 318,900 57,310 2,649 3,756 31,811 _ 1,343,143
1963-64 924,701 327,833 59,569, 2,832 4,220 39,584 1,358,739
1964-65 965,782 359,320 67,189 2,908` 4,981 49,262 1,449,440
1965 -66 975,869 375,536 71,778 2,857 9,729 53,980 1,489,749
1966-67 979,395 399,216 81,169 3,107 9,219 60,383 1,522,489
1967-68 973,912 424,635 84,069 4,307 / 11,113 67,971 1,566,007
1968-69 960,612 422,205 86,357 2,696' 9,253 70,981 1-,552,304
1969-70 948,0)1 437,535 93,696 2,524 11,702 72,362 1,565,910
1970-71 923,754 456,408(2) ... 2,794 ... ... .
4971 -72 90,,.,180 488,021(2) ... 2,47-=; .... ... ...
1) Courses of very short duration are not included.
2) Not including religious schools (Scholei ecclesiastikai).
.93

GREECE Table II.a
IN PRIVATE SCHOOLSNUMBER OF STUDENTS
Level of Education 1959-60 1969-70
Primary 65,586 67,064
Secondary General 42,326 52,910
Technical and Vocationaland non-university typehigher education 35,258 65,432 (1 -)
Teacher's' Colleges
University
1 -) 1968 -1969.
GREECE Table II.b
NUMBER OF FEMALE STUDENTS IN PUBLIC AND PRIVATE SCHOOLS
Level of Education 1959-60 1969-70
Primary
SecoAdary General
Technical and Vocational
Teachers' Colleges
Don-university typehigher education
University
1) 1968-1969.
.441,382
106,200
8,572
453,282
199,717
13,527 (1)
1,144
1,994 2,872 (1)'
5-;376 ,22,690
98
GREECETable II.c
ENROLMENTS IN THE FIRST AND THE LAST YEAR OF STUDIES
1959-60
Level of education
1969-70
First Year Last. Year First Year
Primary
Secondary General
TechniCal and Vocational
Teachers' Colleges
Von-university typehigher education
University
164,853
70,300
60
1,247
142,389
23,427 .
1,137
7,340 4,494
162,673
100,081
27,275
1,329
4,096
19,366
Last Year
1,64,537
48,137
1-4_020
1,195
2,632
13,514

GREECE
6
Table III
NEW ENTRANTS
Year PrimarySecondaryGeneral
Technicaland voca-tional
TCollegeseachelet
Non -
Universitytype highereducation
University.
1959-60 138,813 61,130 21,647 1,208 1,(,64 64081
1960-61 144,997 5),276 21,857 950 1,210 7.112
1961-62 146,352 -59,000 ....
1,201 ... 64840
1962-63 149,688 63,076 ... 1,330 ... 9,613
1963 -64 147,379 66,608 ... 1,346 ... 11,476.
1964 -65 186,519 94,243 .44 1,849 ... 20,749
1965-66 157,106 86,281 44e 1,318-
... 13,44:1
1966 -67 152,663 91,526 ... 1,556 444 12,471
1967=68 142,534 86,480 ... 1,596 044 17,377
1968-69 142,850 84,613 ... , 1,174 444 13,009 -
1969-70 145,334 90,300 . . 1,201 044 12,397
1970-71 ...103,064 .
-6

GREECE Tattle III. a
UNIVERSITY TYPE HIGHER EDUCATION:'
NUMBER OF CANDIDATES, NEW ENTRANTS AND ENROLMENTS BY FIELD OF STUDY
.
Field of
'Study.
Candidates New Entrants Enrolments
1959 -60
,1969-70 1959-60 1969-70 1959 -60 1969 -70
Pure Science
Architecture"
Techrt oa:ogy
i iculture
Total Science
(
t
,
4,_466
4-, 402
1, 217
10 085
. = 641
115
396
246
a
1,820
179
692
665
33,356
1, 645
4-16
1,726
1, 013
4, -800
=
8, 651
1, 1'86
4, 446
4, 043
18 326,
..
.
I
and Technology
Medical Sciences
Humanities
Education
Fine Arts
Law
Social Sciences
Other
---",:rc:tal.
-__?
7, -771
5, 112
-.;-
6, 550
7,,256
-
822
834
-780
2, 24-7
_ 1, 906
1, 929
--952
4,-254
.;.
'3, -976
3, 456
--
3, -823
7, 792
-
=
= 1:2, 090
8, 485
_
-: 10, 116
23, -345
-
... 36, 774 6 , 081,r,-- 12, 397 23, 847 z 72, 362

GREECE Table II1.15
NON-UNIVERSITY TYPE HIGHER EDUCATION:
NUMBER OF CANDIDATES, NEW ENTRANTS AND ENROLMENTS BY FIELD OF STUDY
Yield ofCandidate& New Entrahts Enrolments
Study 1959-60 1969-70 1959-60 = 1969=70 t959 -60 196977
Pure Science ,
Architecture o
Technology 4,68 -. 1.827 - 5,178
Agriculture
Total Science
4683 1-827 41=51778and Technology
Medical Sciences 0-0 5T) 0-0-0 1_,215 1,578
Humanities . 138 0-0-0 2-79 164
Education 0-0 137 243 366 713
Fine Arts 30 90 106: -278
Law 0-0-0
Social Science 247 *=.! 652 742
Other
Total 0-0 0-0 1,082 ,0 2,618 9,253
1) 196849
0
GREECETable IV
_,HIGHER EDUCATION; NUMBER-OF FEMALE STUDENTS BY'FIELD OF STUDY
Rield of Study
Non-university. -type higher education
1968=69195940 196940 1959 -60
Tlire Science
_Architecture
Technology
Agricuitura0v;
Total__Science
and_Technology
Medical Sciences
Humanities
Education
Fine Arts
Law
Social Science
Total
225
197
38
68
526
929
1,737
1:,017
1,167
- 481
264
540
2,891
5,414
5,836,
5,828
6,721
1,215
283
43
453
352
352
1,541
397
153
429
5.376 22,690 1994 2,872

GREECE Table V
HIGHER EDUCATION: FOREIGN STUDENTS IN THE
COUNTRY AND NATIONALS STUDYING ABROAD
BY FIELD OF STUDY
Field of Study
Foreignztucents
Nationalsstudying abroad
1959 '1969 1959 1969
Pure Sciences 174 981 893
Technology 194 816 = 4- 510
Medical Sciences 254 t,041 1 -,683
Other 710 3,110 - 1,550
Total t,332 = t5i, 948 , 8,636
104
100

GREECE . Table VI
GRADUAITS
.. -Year- , Primary Secondary
General_ : Teq cal
; ang -voca-' tic:alai
Teachers,-Colleges . ;
./Ton=univrsity ;
; type -tigher ;
edueatien
_ .
= University-.
1959 -60 ;
1960 -61 :
1961 -62-
1962-63
1563-64
1964=65
1965-66 ,
1966-67
1967 -68 f
1968 =69!
1969 -70°
139,467
133,509
132,796
-137,905,-
138,404
1-33,340 . _
137,102
139,221
: 143,274
144,161
163:490
18,347
19,950
3 22,869
i, 24,929
28,297
32,109
= 34,217
33,629
35,419
37,958
42,310
=
4,.
f
9,196
9,909
11,189
9,269
10,260
12,323
11,726
12,191
1-3,889
_ 16,130
1,128
1,228
988
1,240,',
1,422
1,466
1,430
=(1) _
2,393
1,384 ==
994
1,112
1,225
1:,1f2 ,
1,404
. 1 ,233;
1,512.
1,620 '
1,571
1,969-
1,522.
,_
=
c
_ 3,887
3,857
: 4,064
4,251,
4,311
4,530
.4,577
4,951
6,112
7,706
7,933
1) Duration of studies in Teachers' Colleges was extended in 19tA, from two,.to tlpree years -4-
-
GREECE
Table VI..a-
UNIVERSITY TYPE HIGHER EDUCATION:
NUMBER OP GRADUATES BY FIELD OF STUD(1st degree of studies)
Field ofstudy
z
1 95.1--.60 =, 1960 -61 1961 =62 :1962=63
-0 ,1963,64 '1964=b5
. \-:'1965- 66'_966 -67
:,_ 1 967 68 = 1968469_ 1969=70
Purg Szien:e : : 294 313 338 = = 355 , 392 355 590 612 -_ 780 : 1 ,080 : 1 1 ,1_91
Axci-ii-tecture 57 ! i 53 72 =^ 72 73 == 106 104 1 1 164- : 221 248
Technology = == 239 273 ' 355 = 375 - 361 == 345= 406 = 471 698 = 868 679
Agriculture' :
, Total
111 100 147 163 , 165 207 == 161 225 394 == 394_j 540,
. Science
and ,
Te7hnology , ; 701 f 739 912 = 965 = 991 , 1 ,013 = 1 ,261 1 ,439 = 2 ,036 = ,563 ! z, 2 ,658=
., . .
NeOtcal
Sciences z 631 578 653 669 , = 621 E 728 ; 735 = = 1 ,081 1 ,061 ; = 1,2 1 ,156
Huraar.itieS 742 z = 742 688_= 785 =_ 850; 786 : 670; 738 900 898 =1,160
Law = 632 : 603 = 615 = 670: 603 : 687 744: 751 : 860 ! 1 ,289 ,170
Social
Sciences
Other
= 1 ,181 i 1 ,195
=
= 1,196 :
-1 ,162
-1 ,246
-1 ,316 ; = 1 ,167 =
- tf
942
.-
= 1 ,255 = 1 ,695 =
...
; 1 ,
Total , 3 ,887 e = 3 ,857; = 4,064 f 4,251 4,,311 = 4;530` , 4,577 , = 4,951 : = 6 ,112 = 1 7 ,708 7 1933

0
GREECE Table VI.b
NON-UUIVERSITY TYPE HIGHER EDUCATION: HUMBER OP GRADUATES BY FIELD OF STUDY
(1st degree,of studies)
Yield of -:
Study1959-60i1960-61:1961-62!1962-63!1963-64-1964-65_1965-66966-67,1987-68E1968-69!1969-70
_
_- ---' =
Technology: - - 140 _i 156 162 _= 289 499 = 402 : 725 =°
Medicalsciences, 567 679 531 _i 445: 416 :- 619 =; 622 = 448 7 612 ; 511 =
Humanities 127 _ 113 100 =- 98 E- 90 ;- 85 E- 66 . 44 : 48 i, 63 =;
Education = 149 :_ 143 E 89 -= 121 125 :_ 136 178 : 192 .= 1 8 = 194 170
Fine Arts = 18 24 _ 22 = 60 316 = .53 ! 47 ,_ 51 59, 65 = 50
SocialSciences; 251 266 : 270 _= 324 402 : 330 ; 408 1 434 =, 407 E 245 --
Other - - = - - - - - -
TOTAL 1,11? :-1,225 1,152 ;:1,204 ::1,233 ,1-,512 ,=1,820 :11,571 EE1,9644 : 1-,522

GREECE Table VII
.
TEACHERS AND PROFESSORS BY EDUCATIONAL LEVEL
_
of Ed..ostici. , F,11 I'irOA otaff = Part -time staff.
_TOTAL
1962-63 = 1969-70 1962-63 =- 196970-1: '1962=63 :- 1969=7_0,
- -
Primary : 24,956 -, 28,_610 _ - = - i 24,_956 == 28,610
Secondary General(1) 9,353(2)=i 13t983(3) :
-, "9,353(2)E 13,983(3)
Technichl(4) and Voce.-tional and non - universitytype higher education 1,791(5)-_
_ -. .,1,791 (-5) i = 3,510(5)
Teacherst=Colleges -.-. -.
= 201 ! 232
University " -. 796 = 2,670
1) Number of professors in day schools (corresponding number of student.,: 84,464 in 1962-63 and400,303 in 1969-70)-.
Including the hours worked by the part-time teaching staff in equivalent number of teachers(78i.), (The total number of hours is divided by ,4-, the number of teaching hours per Week for afull-time teacher).
Including the hours worked by the part-time teaching staff in equivalent number of teachers(1,324)--
-4) Not including the teaching staff of special a =t schools (6,345 pupils in-1962763) and ofreligious schools (1-,050 pupils in 1962-63 and 1-,155 pupils in 1969-70)_,
5) _Equivalent of the hours worked by the teaching staff (-full-time and part-time) in number oflull -time teachers (15 hours per week per teacher for theoretic courses and 30 hours for practical-cureel. "el- The Tea -her and_Edu-ational_nange: A New Pole, Vol. Tr: Recent Trends inTeacher Recruitment; -OECD ,Paris,- -1974:
--
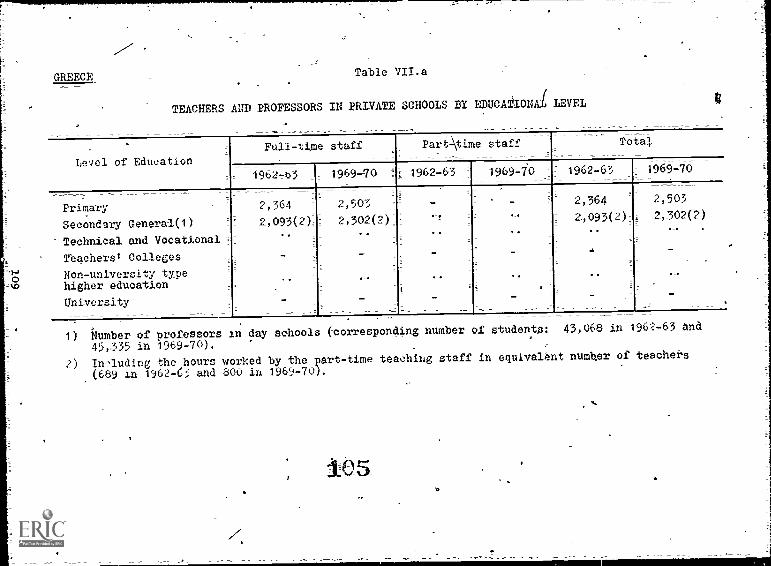
0=t0
=
GREECE Table VII.a
TEACHERS AND PROFESSORS IN PRIVATE SCHOOLS BY EDUCATIONAL LEVEL
_ _ _
Level of Education
Full-time staff Part-\time staff Total
1962,63 1969-70 !i 1962-63 I 1969-70 = 1962-63 ! 1969-70
Primary 2,364 a,_50 - - 2,364 I 2,503
Secondary General(1) 2,093(2) = 2,302(2-. ,. 2,093(2)= 2,302(2)
Technical and Vocational =, " -. .. " _.
Teachersv Colleges - - - -' -
Non- university typehigher education
_, -. ,. -. -.
University - - - - -
1) Number of professors in day schools (corresponding number of students: 43,068 in 1962-63 and
45,335 in 1969-70Y.
2) Irv!luding the hours worked by the part-time teaching staff in equivalent number of teachers
(689 in 1962-C3 and 800 in 1969-70).

GREECE Table
TEACHING STAFF IN- UNIVERSITIES BY STATUS
AND-FIELD OF SPECIAllSATION
-Field
of
Specialisation
1962-1963 1969 -1970
Senior
Level
-Middle
level Total
Senior
Level
= Middle
Level Total
-Pure Science 56 5 61 74 420 494
Technology and
-Architecture 79- 2 81 90 352- 442
Agriculture 55 47 102 76 235 311
Total Science
and Technology 190 54 244 240 1, 007 1,_247
Medical Sciences 70 219 289 95 648 743
Other 153 110 263 179 501 680
Total 413 383 796 5t4 2,156 2,670
Note: Senior level:_ This group includes "ordinary" and "extraordinaryulprofessors.
Middle- Level: All teaching staff who are not Senior Level and who, in fact, teach(- rethunerated or-hot) are included here.
a course

GREECE Table VII.c
FULL-TIME TEACHING STAFF IN SECONDARY
GENERAL EDUCATION BY FIELD 0F' SPECIALISATION
Field ofSpecialisation
Number of teaching staff
1962-1963 1969-1970
Theology 1,183 1,719
Humanities 3,860 5861
Matherhatics 1,242 1813
Physics and-Chemistry-, 984 1,6i6
Foreign Languages 598 1,073
Physical Education,835
Other 651.694
Total 9,353(1) 983(1)
t)- See-Notes 1:), 2) and 3) of Table VII.
-
10 I

EX1811DITUM11 (14.9.7(1
carr,nt
12,
st#
r.pe ,f
Eyp.nArtur, ,rrirrar;:
Se ,1141?,Gcnrir-v
Zfthnicli143
vc,atio,.1
TedAwrq4Ccilrero
Non.tiniver.1tytpe bwher.duction
,th,r ,if ..f 11-.f/, f ;
.-t1u.,,,,,nt-1
.N:
1
A. nr,i-t11 ,
,,f,nalt ,
1. ontr,1
aorsrn,tent
1. :srcrtno
excer,111ure
- renun,rat' ' . S
.1\faff 1 9t0, ,:0 1,1,004 100.C:0 15,192 10,e0 15,\.000 110.(00
... tIlt.t . r
Z. Inv,mcn. 14r.9-9 212.267 (,,919 6.4',9 1(.1
t.-mo.n.i1,,r1 and -gr..nt,3 2,5CA
1. t'-1i e'enr11 - .
Gov.rrmco,
rxpcn1r,irr.
f,i 01w0%-n
i Ie-Fia;li ie
'tirron,1. etre:1111w,-
_ ,f whI Ait r....-
mttriereicn ,,f
tefichlme, S'Aif
.
2. InveJ.ment
1) acaional cla,141 cation.Z) Par exAmpir. prr.prImary .4neaticn, eta.

1
GREECE
DISTRIBUTION OF UNIVERSITY STUDENTS(1)
BY FATRER'S.pROFESSION
,StUdents-
Father's occupation 1959760 1969-1970
Professional, technical and
relatea workers ,785 7,594
Aaministrativa, executive and
managerial workers 666 1,614
.2>'10,534Clerical workers 2,486,
Sales 26-68 1D,090
Farmers and related_ workers 6,540 \). 20,518.
Mining and manufacturing workT.
ers 2,738 11 ,255sp
Transport and communications
workers 571 2,769
Service ana -recreation workers 667. 2,2-53
Armed- Forces 205 1,056
Without occupation .
(pensioners, rent-lets, etc. -) 65.27 7,2-94
Not declared _130 1,204*
TOTAL 26 ,703 76,184
1) Students of the Teachers'- Colleges the School of Fine_Arts
and the School of Physical Education have also_been include4
113
J.
N
4

GREECE
-1
.4\Table X
DISTRIBUTION OF UN....VERSITY STUDENTS_BY REGION OF PARENTS' RESIDENCE_
O
Region of
'Parents' residence=
Population_
Census1961
'Students. 1961 -1962
. Population
Census
1971
Students197-1=4972
'Greater Athens
Central Greece and Euboea-
Peloponnesus
Ionian Islands
':Epirus
ThessaIy
Macedonia ..
'Thrace
,A-egean Islands
Crete
Net classified
Total for Greece
Foreign students
General Total
__
1 852 ,7_ 09
'9970 49
1,096 390,212 573,
352,604
689,927
1,896,112112V
356,555
477,476
483,258
8,726, (t)
2,404
3 661-V
446
843
1,9235,641
407
850
-1,494--
2,536,207
984,790
983,800,
183 633,
309,558
659,243
1 883/156
-- -1-
329 P4 297
416,475
456,208
25,770
5, 653
8,060
1 ,094
2,185,4,166,
12,656
974
1, 974
3,848
208
8 388 553-, I-
_
26,595
1, 52
8,736,367 66-, 588
5,774
27 9i7-,62`72i3
.
1) Region of Attica.

GREECE
a
Table X =I
EDUCATION BY SECTOR OF ECONOMIC_ACTIVITY:
NUMBER "OF PERSONS WITH UNIVERSITY- DIPLOMAS-BY FIELD OF STUDY
`Sector ofeconomic
-activityr=
Field- of study-
1961 1970
Agri=culture dustrl:(1)
OtherSectorP:
TotalAgri-
cultureIn=
dUstrY(1)Other Total
Sectors = .
:Pure Science
Architecture and
, Teehnologyvi
n Agriculture.
GpTotal-Science
and Technology
Medical; Sciences0.)
Humanities and
Tine-Arts
-Education=
"-Law
Social Science
Total_
1) IndustrY1 Mining)
J.
-manufacturing,- construction-and electricity._
I I

GREECE Table XI -.a
EDUCATION -BY SECTOR CF ECONOMIC ACTIVITY
-NUMBER OF-PERSONS WITH NON - UNIVERSITY TYPE HIGHER EDUCATION DIPLOMAS-BY-FIELD OF STUDY
Sector ofeconomic
activity-Field- of study
Pure Science
1961
In=dustry( 1)
1970
Architecture and
Technology1=-1
Agriculture
Total-Science
and
Technology
Medical ,Sciences.
Humanities and Fine
.-Arts
Education
Law
Social Science
Total
1-) Industry:
Other-.Sectors
TQtalAgri=
culture
Mining '-2manufacturing, construction and electricity-,
In--duStry,(1)
-.
OtherSectors
Total

GREECE Table XII
PRE - PRIMARY EDUCATION
-1959-60 1969=70
I. Enrolments.
35,579.
5 266,
-.
71-4
342
11,542
a) Public schools
b) Private schools
II. Teachers960
228
2_v259
z 369a) _Public schools
b)_ Private schools.
_
III, Expenditure
a) Central Government
= Teachers
= Subsidies tolei:al authorities
= Subsidies-topr=ivate education
= Other
b) -Private
= Teachers
=_Other
c) Lc -al authorities
, = Teachers
- , Other
1
-117-

,B3
SOURCES
- Replies of the Greek authorities.
Greek Educational-, Statistical Yearbooks1959=tiO =to 1969-10.
- Demographic Trends An Greece, 1q50=1980.
lig
114-
0A
a
1,}
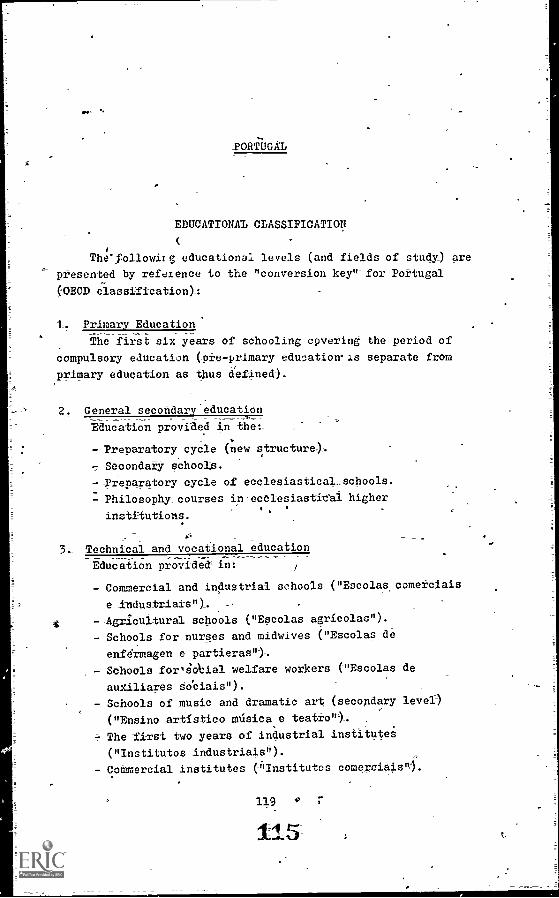
PORTUGAL
EDUCATIONAL CLASSIFICATION
The-followirg educational levels (and fields of study) are- _
presented by reference to the "conversion key"- for Portugal
OECD classification) -:
1- -Fri:nary Education.
The first six years of schooling cpvering-the-period of
compulsory education (ore-primary education separate from
primary education as thus defined).
2- General...secondary education
Education provided in the:-
Preparatory cycle .(new structure),
-= Secondary schools.
:-Preparatory cycle of ecclesiastical...Schools.
- Philosophy courses in-ecelesiastie-al higher
institutions.
3- Technical -and vocational education
Education providedin:
Commercial and industrial schools ("Escolascomerciais
e imduatriais")-
--Agricultural schools ("Escolas agricolas").
- Schools for nurses and midwives ("Escolas de
enfermagen e partieras"):.
Schools for,Aial welfare workers ("Escolas de
auxiliares doCiais").
Schools of music and dramatic art (secondary level)
("Ensino artistico mdslca e teatro"),
= The -first two years of industrial institutes
( "Institutos industrials").
Commercial institutes ("Institutos comercials".
11.9
115
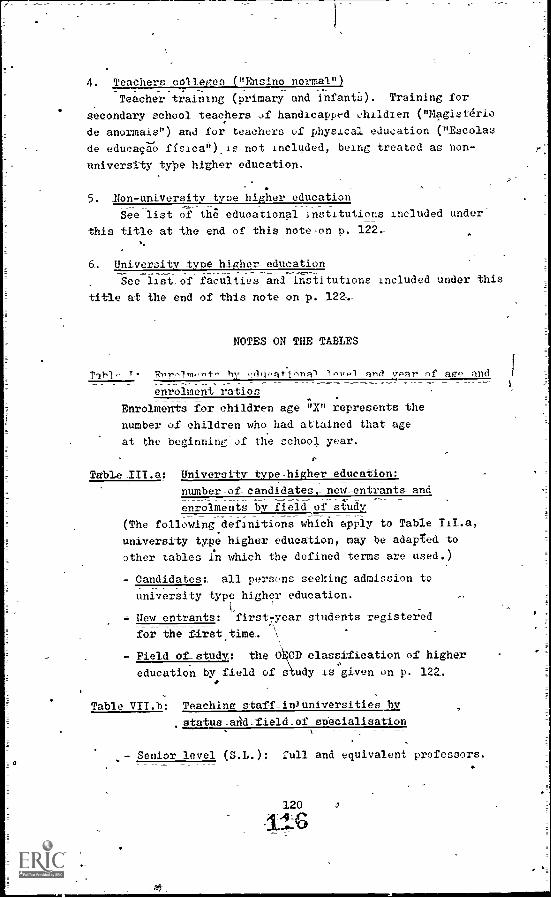
4. Teachers colleges ("Ensino normal")
Teacher training .(primary and infantS). Training for
secondary school teachers of handicapped children ("Magist4rio
de anormais") and for teachers of physical education ("Escolas
de_educaca'o fisica").is not included, being treated as non-
university type hither education.
5. Non-university type higher education
See list of the eduoational institutions included under
this title at the end of this note-on p. 122-
6- University-type higher education
See list, of faculties and institutions included under this
title at the end of this note on p. 122_,
NOTES ON THE TABLES
Pahl- F.or.-,1m,nt-_hv_o4e0ational lovp1 and voar of aae_ and I
enrolment _ratios
Enrolments for children age "X" represents the
number of children who had attained that age
at -the beginning of the school_year.
Table_III.a: University type-higher education:
number.ofcaildidates, new -- entrants and
enrolments by- field -of study
(The following definitions which apply to Table
university type higher education, may be adapted to
other tables A which the defined terms are used.)
- Candidates:. all persons seeking admission to
university type higher education.
= New entrants: first -year students registered
for the firsttime-
- Field of_study: the 0 CD classification of higher
education by field of study is given on p. 122_.
Teaching_staff_in3universities by
status -arid- field -of specialisation
- Senior-level (S.1.)=: full and equivalent professors.
120

, Junior level (J.1.): 'assistant lec,turer, auxiliairies
and other equivalent university teaching staff.
- Middle level (M.L.): those who do not belong to
either of -the two above-mentioned categories:
lecturers, senior lecturers, assistant professors.
Table IX: Distribution of university
students by father's profession-4
The seven occupational groups shown in this table
correspond to Major and Minor Groups of the
International Standard Classification zf Occupations
(see-p. 254.-
Tablt Educatiopby_sector of economic activity: number
.)f-pers_,ris with university_ dtplomas-by field of_study-.
The grouping by sector o-f'enomic activity is based
on the International Standard-Industrial
Classification -of -All Economic - Activities (ISIC),
(see p. 255).
1
121
1.4

CLASSIFICATION OF PIGHER EDUCATION
BY FIELD OF STUDY
1. University level. OECD Classification
Faculty -of- Sciences
Biologic (Biology) Pure Sciences=-Fisica (.Physics ) _Pure Sciences
Quimica (Chemistry) Pure SciencesGeologla (Geology) Pure Sciences
- Maiematica (Mathematics) Pure Sciences- Engenharia-ge'ografica
(Geographical Engineering) Technology- Geografia (parte das diaciplinas)
(Geography - certain special subjects) Social Sciences
Faculty-of Law
- Direito -law) Law*
= Complementar de ciancias juridicas_( Codblementary courses in Jurisprudence)Law
= Complementar de ciancias politico=economical __(Complementary courses inEconomics and Political Scienoes)=. Social Sciences
Facultv_of Humanities
= Filologia cIAssica(Classical Philology) Huma ties
= Filologia germAnica (German Philology) Humanities- Filologia romAnica (Roman Philology) Humani=ties= Filosofia (Philosoohy) HUmanities- Hibtoria (History). Humanities- Dibliotecdrio-arquivista-documentalista
(Librarian=Archivist- Documentalist) Humanities_- Conservador de museus
(Official custodian of museum), Humanities= Geografia (parte das disciplines)
(Geography 7 certain special subjects) Social Science..- Cianeias Pedagogicas (Educational
ScienceS) Education
Faculty_of Medicine-_Medicine (Medicine-)-
Faculty-Of-Pharmacy
- Farmacia (Tharmacy - 2 years afterthe professional course)
Faculty of Economics
= Economia-(Economics): Social Sciences
122
Medical Sciences
Medical Sciences

Higher Institute for Economicand Finance Sciences
- Economia (-Economics)- Finances (Finance)
Faculty of Technology
- Engenharia civil (Civil Engineer)- Engenharia electrotecnica
(Electro-technical Engineering)- Engenharia mecanide
(Mechanical Engineering)= Engenharia de minas
(Mining Engineering)- Engenharia qufmica
(Chemical Engineering)- Engenharia metaldrgica
(- Metallurgical Engineering)
Hig herCollegeof Veterinary Medicine
- Medicine veterinaria.(Neterinary_Medicine)
Higher Agronomic Institute
=-AgronoMia (AgroApmy)Silviculturai(Roreatry)
Academies-of_Fine Arts
- Arquitectura-(-Architecture)
The-Evora institute of- Advanced Studies
- Secgap de economial(EconomiCaSecgao de sooiologia -(Sociology)-
Military-Academy
- Engenharia (Engineering)
The Institute of Social and_PoliticalSciences for Overseas--Territories-
- -CompIementer de estudos ultratarinos(ComPlementary overseas studies)Cienclas antropologicas e etnologicas-(Anthropologidal andEthnological Studies)
- Complementar do servigo social(Cemplementary Social Service Courses)-
Technical- Institute
Engerharia civil (Civil Engineering)Engenharia electrotecnica(Electro7-technical Engineering)
- Engenhatia mecanica(Mechanical Engineering)Engenharia de minas(Mining Engineering)
- Engenharia quimica(Chemical Engineering)-
, Engenharia metaldrgia(Metafturgical Engineering)
Social SciencesSocial Sciences
Technology
Technology
Technology
Technology
Technology
Technology
Agriculture
AgricultureAgriculture
Architecture
Social SciencesSocial Sciences
Technology
Social Sciences
Social Sciences
Social Sciences
Technology
Technology
Technology
Technology
Technology
Technology

Faculty of Philosophy of Braga
- Cienciaa filosoficas(Philosophical Sciences) Humanities
- Yllosofico-humanistieoPhilosophy and Humanities) Humanities
Catholic_ University
- Teologia (Theology) Humanities
2. Non-university level
Military-Academy
- -Administrageo mil -itar- -(Military-Administtation Others- Aeronaultica-(Aeronautics) Others- Artilhatia (Artillery)- Others= Cavalaria (Cavalry), OthersInfantaria,(Infantryl Others
Naval-Schools
Adininistraa6 naval(Naval Administtation) Others
- Engenheiro maquinista naval(Mechanical Naval Engineer) Others
= Matinhe (Marinel Others
Academy -of -Pine -Arts
Pintura,(Painting) Fine Arts- Escultura:(Sculpture) Fine Atts
Institute for Languages- and Administration
- Organitagao e administracao de empresas-(Organisation and Managementof Enterprises)
- Jornalismo tjournalism)- Publicidade e telacTes pAblicas
(Publicity and Public Relations -)
Social Studies-- Institute
Social SciencesSocial Sciences.
Social Sciences
-AdMinistracao social de empresas(Social Administration of Enterprises) Social Sciences
- Polltica-social (Social Policy) Social Sciences
The Institute of Social and PoliticalScionces=for-Overseas-Terrrtories
7 Administracao ultramarine-(Overseas AdMinistration) Social Sciences
- Servico sooial _(Social Service) Social Sciences
New- Occunations Institute
- Organizacao e gest6 de empresas=Organisation and Managementof Enterprises)Relacoes pdblicas e publicidade(Public Relations and-Publicity)
1 -24
Social Sciences
Social Sciences

Sch,,,Is_and Institutes for _Nurses
- Enfermagen (Nurses)- Pisioterapia (Physiotherapy)- Terapentiea ocupacional
(Occupational Therapy)= TerapOutica da _Pala
(Orthoepy)
National Institute for Physical _Education
- Professores de educa6O fisica.(Physical Education Professors)
Catholic- Higher _Mucation InstitUte
- Professores de moral e religa'o(Moral and Religion Professors)
Teacher--Training tor-MentallyHandicatined=Ohadren------"-
125
Medical SciencesMedical Sciences
Medical Sciences
Medical Sciences
Education
0#2
Education
Education
-s

LIST OF TABLES
I. Enrolments by educational level and year ofage and enrolment ratios 128
Enrolments--------- ..... 129
11.a Number of ,etudente in priyate schoola.-. ...... 130v
II.b Number of female students in public andprivate ..... 131
II.c Enrolments in the first and the lastyear of 132
Il.d Enrolments in secondary general education.--....- 133
ills New 134
III.a University type higher education: number ofcandidates, new entrants and enrolments oyfieldof .. .......... -..-.-..-. 135
II.b Non-university type higher education: numberof candidates, new entrants and enrolments,byfield of study....,...... ..... ...... _..--.. 136
It- Higher education: number of female studentsby field of study....,..,._ .. , ..
V. Higher education: foreign students in thecountry and nationals studying-abroad byfield of ..... 138
VI. Graduates...--_.-- ..... -.-.......- ..... 139
VI.a University type higher education: number of,graduates by field of study(slut degreeof
TI-b Non,dniversity type higher education: numberof graduates by field of study-(=1st degree of studies).-..,.........-.- 141_
VII. Teachers and professor._ ly educational level-_,--,142
VII.a Teachers Pald professors in private schoolsby educatianal level.........._ ..... 143
V1I.b Teaching staff in universities by statusand field of 14 =4
fII.c Teaching staff in secondary general educationby field of ......... 145
VII:d. Teaching staff in vocational schools* by field of specialisation.e.:-....-...--. .. . 146
VIII. Educational expenditure.-- . ..... 147-
1X. , Distribution of university students byfather's
126

X. Distribution of university students bytown of parents' residence. 149
XI. Education by sector of economic activity:number of persons with universitydiplomas by field of study ....... ....... ......
XI.a Education by sector of economic activity -:number of persons with non - university typehigher education diplomas, by field of study 151
XII. Pre-primary educatl.on 152
'Sources 153
150
U
'127
,

PoRTN0A1.
124Table I
ENROLMENTS BY EDUCATIONALiEVEL_AND-YEAR-OF AGE AND ENROLMENT RATIC6 (1969-70) II
.
AgePrimary_
Secondary
General(1)
Tethnicaland-voca=tional(2)
Teachers(
Colleges(3
Non-universitytype-highereducation
UniversityTotal
Enrolments
Populationin_a-group-group
(A)
Enrolment
ratiosc.67u9-,1011.12 ' -
43 '
1415
161718192021
222324252627282930 andover
'
i
'
.
,
.
39,'25184,710163,713175 202154:377115;20087,95949,391
. -
,
-
-
---
--
-
1
,
_,4,
--
'..
-
18,67540,08046 6783650628'25920'91017:20413 795,11:0796,4205,2083,4052,3061;8011,5701,4191,201
973634
.705
3 .654
-
---
260480
4,782/1 24917'1001689217'93415'63112'7949,4576,35037442'5261'9961,9421 842f'693,l',01)1L905
1)65
4,197
.
-
- .
-
---.
151420647
.746618400227--137914949292215
n6
-
---
^
---4
1,6193,2124,4455,386
. 5,2974,7023,9703,0562,3101,8021:3961,2441,122
6,687
h 39,125184,710183,713175,202173,312195 760139:41a_97,14645,33939,702
N2;29;49223,06817,56212,846
9,8417 90466595: 6284,7453,6963,18511707
14 624_,
187200186,7.0186,20165,706164,800164,200164,200163,800163,500155,300154,900154,300154,200153,700143,700143,700143,700143;600143,600126,700126,700126 600126:600126,600
-1 111 200-.,'_ ,
'
._
0.2090 j
0.9893 ti.
0.98(60.9434 h1.05160.94050.84900.59300.27730.25560.22780.20520.18470.15000.12220.08930.06840,05500.04650.01440.03740.02920.02510.0213
Total _.rikg C7F
_ , _
265.467_ ri,,,ylei 9;687 _!! 46,540 1;441;344** ,289,100 0.1738_ _
1) Not including-804 students of-Philosoph- in h/gher,Ecclesia4.cal Schools.
'2) All students of Industrial Inktitutes-are Included-here (even those :a the last two years:_ higher-nop-university lever).
No Information on the ago distribUtion-by-year of study I's-available for-these students.
3) "Magistdrio Primdrio" and "Infantilh.
4) Figures obtaired room Esti:Datives da Popular:ire de.1961 a 1968-MetrSoola; Lisboa. Gabinete de Estudos-e-Plane4mento da
Ac4Wo*Educativa, Vol. XXv-1909, Sdrie,Estudos, Ni. 10-

PORTUGAL Table'. II
EN-ROIMENTS
Year
..
i P imary =
_=
StcondaryGeneral
Technical= andi Vocational
_ Teachersr-=Colleges :
-
: Non- =1
Universitytype higher
z- education(1)-_
University _Total-Enrolments
1959760.
1960-61
1961-62
1962 -63
1963=64
1964-65 -_
1965-.66.-
1966,67 --
1967-68 ::1968,-69
1969=70 =]
1970=71 :
-, 868,625
-] £387-,235
! 886,820 _
886,519 =_
! 883,039 =
894,195 .
, 892,603 =
--, 891,082
904,120
961,546
989,676 ,'=
= 992,446 E
107_,859(2) I
119,586 z
125;136(2) -:
137,265
146,070(2)
132,864
, 158,049
: 163,615
167,825
- 224,904 =
266,266 -_,
297,678 =
92,277/104,716
117,667
z 130,574
140,290
151,730
162,517
164,114
165,368
.146,692
-- 131,062
137,997
_
%
z
._'
= 3,783
4,383
4,683 _
, 4,447
3,625 ,
3,147 =
3,096
4 ..-2;692
2,518*
2,647
3,687
_ .4,972
4,880
5,023
5,455
-5,788
7,202
7,606
8,399
8,827
9,646
10,546
11,578
15,526
'
-
_
-.
,
-.
i
=
18,153
19,771,z
20,774 i
22,150
22,926-
25,593
27,782
29,657 f
32,396
36,894 ,
39,292`'
39,496
_.1,095,647
1,140,714
1,160,535
=1,1825,343
:1,203_,152
1,235,135
-! 1,252,446
1,259,987
f 1,291,473
-1,385,229
! 1,441,561
, 1,488,115
.1) Included here are 41 enrolments in the Industrial Institutes. According TO the OECDclassification,_ the first two classes of these Institutes are at secondaty technical and
vocational but separate data for.theSe two classes are not available.
2) With the exception of students of Ihitotophy in higher Ecclesiastical 86liools,
1 5
ti

HUMBER OF STUDENTS IN PRIVATE SCHOOLS
.
Level of Education 1954=55 1959-60 1964-65 1969-70
,
,Primary 37,805.40,365 44,090 51,918
Secondary General 33,021 E 65,840 93084 = 121,630
Technical andVocational 3,027 7,400 10,595 - 9;856
TeachersO-Colleges 230 Ez 570 792 E 711
Non- university typehigher education == 1,050 : 1,360 2,164__
2078 z=,
University 20 = 82 452
TOTAL 75,153_ 116,253 =; 150,003 _ 185,731
- 130 -
-126_

PORTUGAL Table Il.b
NNUMBER OF FEMALE STUDENTS IN PUBLIC AND PRIVATE SCHOOLS
level of Education _- 1959=60_ 1964-65 1969-70
Primary 412,708 434,810 481,310
, .
Secondary Ggnera/ 50,227 72,646 _- 127,369
Technical and .
Vocational 26,997 51,925 48,033
Teacherst Colleges 2,500(1)= 2,883 - 3,473
Non-university type
higher education 1,193 2,314 '= 4,496
University 5,421 : 9,434 17,701
Total 499,046 574,012 -682.382
1) Estimate
1 -31
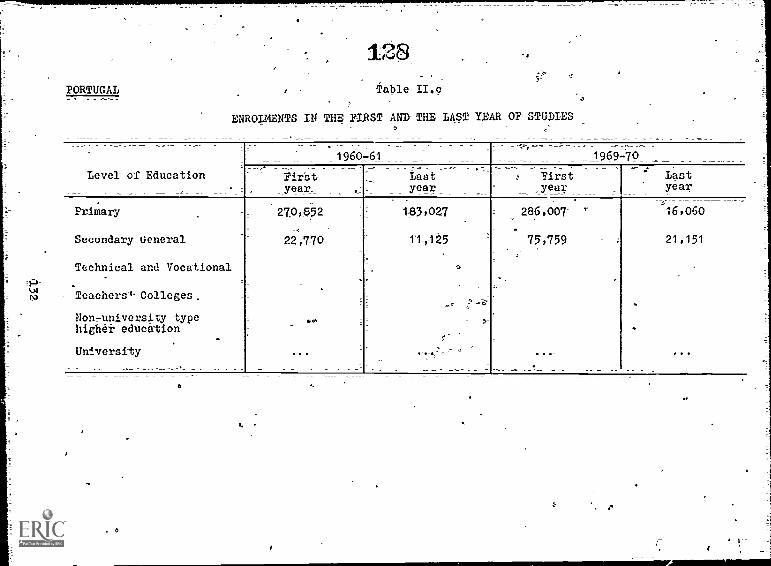
PORTUGAL Table II.o
ENROLMENTS IN THE FIRST AND- THE LAST YEAR OF STUDIES
Level of Education
1960 -61-
1969-70
-Firstyear__
Lastyear
Fkrstyear
lastyear
Primary
Secondary_ ueneral
Technical and Vocational
VCTeachers''' Colleges.
Non-university typehigher education
University
270,02
22,770
ra
1.83,027
-1 25
- -411,
r
286,007
751,759
16;060
2-1,151
i.
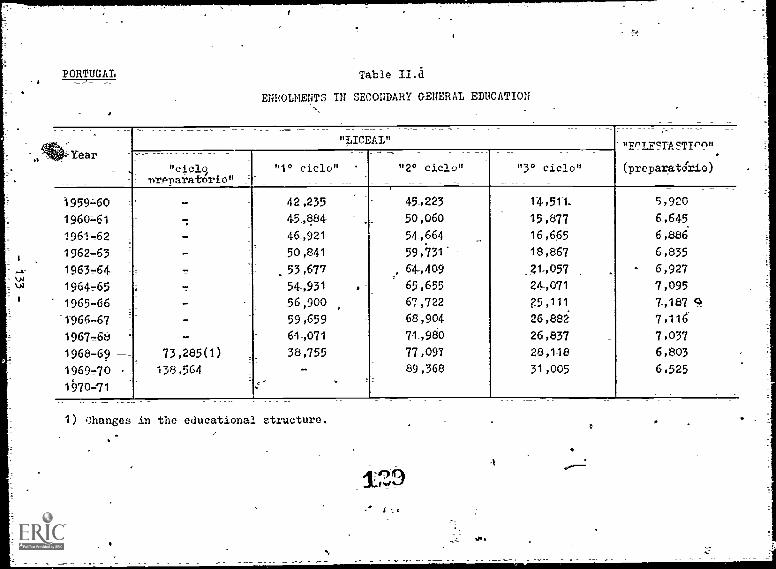
PORTUGAI Table II.d
ENROLMENTS IN SECONDARY GENERAL. EDUCATION
Year
O"LIEAI".
,
"EnIi"TAFT-7,"
(preparatdrio)A"tide =
Ilrpnarat6rie""1° ciao" "2° ciao" "3° cicio"
195940 - 42,235 45,223 14,511. 5,920
196041 45,884 50,060 15,877 6,645
1961 -62 - 46,921 54,,664 16,665 6,886
1962-63 50,841 594431' 18,867 6,835
1963 -64 = - .53,677 .64,409 .1,057 . 6,927
1964 -65 54,931 65,655 24,071 7,095
1965-66 - 56,900 67,722 25,111 7,187 4-1966-67 - 59,659 68,904 26,882 7,116
196748 - 61,071 71,960 26,837 7,037
1968-69 ___ 73,285(1) 38,755 77,097 28,118 6,803
1969 -70 = 1-38,564 !. 89,368 31,005 6,525
1970,:71
1) changes in the educational structure.

PORTUGAL_
Table,, III
NEW--ENTRANTS
Year , Primary Secondary -=
e.GeneralTechnical andVocational
Teachers'Colleges
.
Non,universitFtype higher 7
education
=
Univerdity
, t959=60
1960=61 185,847 20,-928 -_- _ -
1961 -62 180,494- 20,811 ,, . - - ,- 5,13-3
1962-63 , 17 -9,028 22,398,
22,245 1,871 .1963-64 176,038 22,869 ... 5,999
1964-65 191,747 22,852 27,699 1-,382 .-
1965-66 184-641 24,395 -... . 74913
1-966-67 181,098 25,256 25,131 1,026 :-..
1967 -68 188,856 24,600 .... 666 '.-.'
1968=69 202,174i1-0 84,97.q(2) 21,400 1,180 ,...
1969-70 185.497 91- ,644 -)-. )
36_115 5 - 2_2,094 11,370 (3)
197041 :
1) New_ entrants in the 5th _year_ of_ study
for '67/68 ,--68/69 23,75069/70 35,376
2) Of which new entrants in =preparatory cycle and.in 2nd cycle.
3) With the exception of new entrants IA'non-university level-higher. education,.

PORTUGAL Table LII,a
UNIVERSITY TYPE HIGHER EDUCATION-:
NUMBER OP CANDIDATES; NEW ENTRANTS AND -ENROLMENTS BY FIELD OF STUDY
Field of StudyOandidates __New Entrants _2nrolments___
1959=60 i- 1969-70 1959-60 1 1969,70 1959-60 -' 1969--70
,
Pure Science 2,539 3,027
Architecture 445 E86
Technology '34696 7,719
Agri_Pulture _-_____510 828L
Total Science 7,190 12,260and-Te-chnelbry
140dical S64ence-s- 3_,213 5,691
Humanities 2,500- 7,353
EduCion 1-,032 4,827
Fine Arts . -haw 2,;61 4,351
Social Science 14457 4,810
Other 7-
Total 18,153 39,292
131,

PORTUGAL f.
132Table III.b
NON-UNIVERSITY TYPE NIGHER EDUCATION:
. NUMBER OF CANDIDATES, NEW ENTRANTS AND ENROLMENTS BY FIELD OF STUDY
Field nf
Study
Candidates New Entrants Enrolments
1959=.60 1969,70 1959=60 = 1969.=70 -E 1959 -60 i -1969-70 -
Pure Science
Architecture
, -
.,
Technology 1,2450 4,-917 .
_Agriculture - -
Total- Science
= 1 -,450 4,917-and
Technology
Medical Sciences 463.. _
1 301
Humanities 760 470
Education, 128 521,
Fine Arts 609 = 815
Law -
Social Science 554 = ?,-909
Other 916 ' 645
Total 4,-880 11,578

PORTUGAL Table IV
HIGHER EDUCATION: NUMBER OF FEMAT,E STUDENTS BY FIELD OF STUDY
Pipla fq.
Study
Unkversity - ---- Non-university type higher education
1959-60 1969-70 1959-60 1969770
----.,
Pure Science 1,377 . 2,268 -
Architecture 66 184
Technology 207 983 t 117 730
Agri-culture 78 221
.
Total Science
1,728 3,656 117 730and Technology
_ -
Medical. Sciences 732 2, 1734 368 1 104
Humanities 1,796 .--5,_74
Education 627 3,519 45 725
Fine Arts,.-
= - 375 604Law- - - -
Social Science 265 1,598 288 1,333
Other -
Total 5,421 17,701 1,193 4,496
133

Table V
HIGHER EDUCATION: FOREIGN STUDENTS IN THE
COUNTRY AND NATIONALS STUDYING ABROAD
BY FIELD OP STUDY
Field of Study
Foreignstudents
Nationalsstudying abroad
1960 1970 1960 197u
Pure Sciences 10 71 -- ., ,.
Technology 9 60 z -.
Medical- Siaence6 22 E 487 -. ..
Other 58 .E 284.. -- .
Total 99 : 992 i . E .-:
138
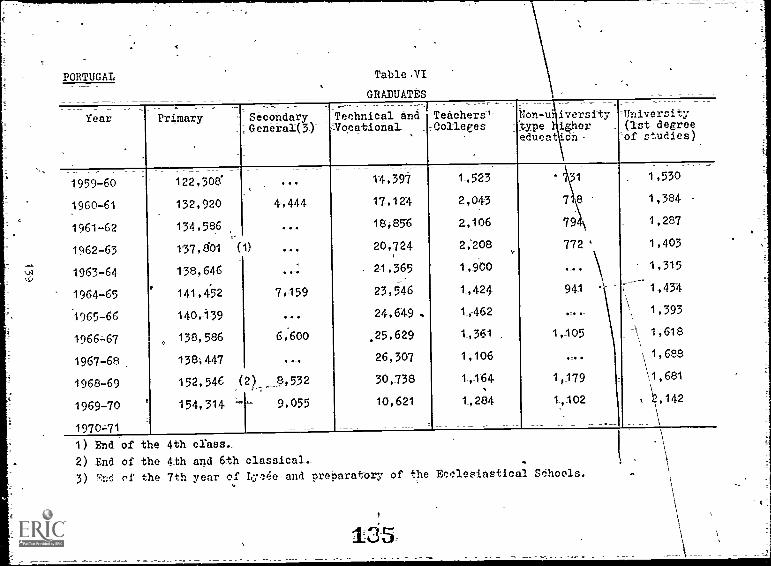
PORTUGA1, Table .VI
GRADUATES-
Year Primary -SecondaryGeneral(3)-
:Technical and:!Teachersi-zilocational =Colleges
Non-u iversitytype ighereducation
=University-(1st degreeof studias)
_______ ___ ____ ___ _ _ ____ _______
1959-60 122,308 ..- 1-4,397 1,523 ' "1 1,530
1960 -61 132,920 _ 4,444 17,124 2,043 718 1,384
1961-62- 134,586 ..- 18,856 2,106 7A _ 1=,287
1962-63 137,801 (1) .-, 20,724 2,208 772 '1-,403
1963 -64 138,646 .-- . 2-1-,365 1,900 -.. \ 1,315
1964-65 141,452 7,159 23,546 1-9424 941 ' 1,434
1965-66 140,139 . 24,649 . 1,-462 ,., 1-,393
196647 , 138,586 6;600 .25,629 t,361 .1,105 A 1618
1967-68 138047 ,_. 26,307 1,106 _.. 1,688
1968-69 152,546 (2 8,532 30,738 1_064 1,179 t,681
1969-70 ! 154,314 9,055 10,621 1-,284 1 ,102 ,142
1970=71
1) End of the 4th crass-
2) End of the 4th and-6th classical,
3) End nf the 7th year of Ly,-14e and preparatory of the Ecclesiastical SChools.
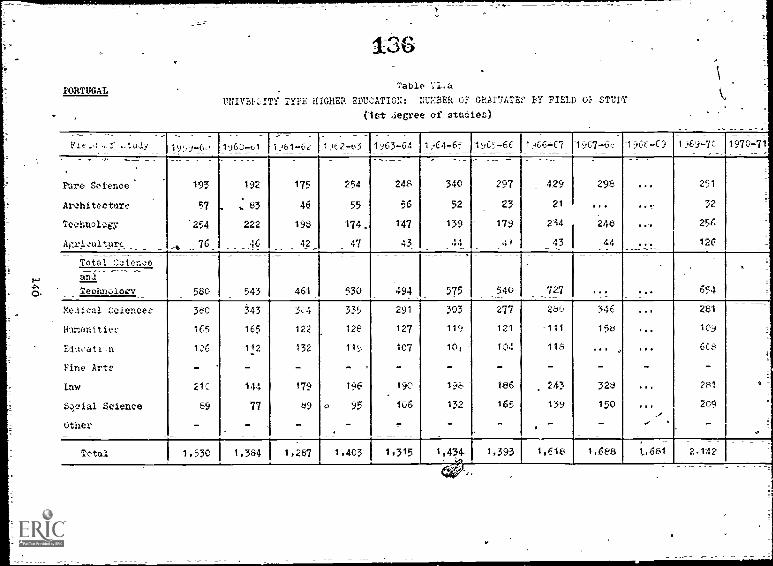
PORTUGALTable VI.a
UNIVEI,ITY TYPE HIGHER EDUCATION: NUMBER 0F GRADUATES 8Y FIELD 02 STUDY
(1st deGree of studiez)
Flv ...1 -f .-,tIldv 19, y-6 1 196.2-0 1 251-h2 2-13 1963-64 1464-6": -196',-66 1.466=67 -19t7- 96e_-.6 1369-70 7970 -71
Pure Science' 193 192 175 254 248 340 297 429 295 ... 251
Architectlirc 57 - : s3 46 55 56 52 23 21 ... 32
Technolou '254 222 198 174. 147 139 179 234 248 ... 25(
kriculturc 76 46 42 47 43 441 43 44 .., 126
Total Science
and
Technolocv 580 543 461 530 494 575 540 727 ... ... 654
Medical Calencez 35C 343 304 335 9 303 277 28Q 3.16 ... 281
Hlmanitiee 165 165 122 128 127 119 121 -111 158 ... 109
Educati_n -1,:+6 112 132 115 107 10, 1Q4 118 ... ... 668
Fine Arte - - - - - - - - - - -
Law 21C 144 179 196 190 190 186 243 328 ... 281
Social Science 09 77 89 < 95 106 132 165 139 150 ... 209."
Other - - - - - - - ... -
Tctal 1,530 1,384 1,267 1,403 1,315 1,434 1,393 1,61E, 1,688
_ __
1_,681 2.1423:1,

-PORTUGAL
S.
Table VI.
110N-UNIVER0ITY TYLF HIGHih EDUCATION? NUMBER OF GRADUATE.: BY up STUI':
(1st Jegree of atudies)
Fleld"of .:-tiidy 195v-ov l'iov!._-t,1 1961-62 1962-63 1,./6344 -1)64-0 1j65 -66 ,i66-67 1367-66 ) 6-Ci )1.9-7C 197C-71
6
Fur( ,::_ience
i c e ce:tur.2
Technology
Ari.:',11t.1.re
-
,
66
-
...
- .-
- /
--
..,
56
. .
74
-
-
.
54
- .
74.
-
-
79
-
.
92
-
102
-
-
-%
162
-
-
-
123
-
I
Total_zcience
,
66.
65
..
56
.
. _
71 54-
.
74 92 10: 102 123
_ _
'and
.ect.noogy
Nedical .'ciences.
Humanitie3
Educatii,n '
Fine Art,Law-,
Social Science
other
01
150
16 -
4-.)
272
03
176
20
59
-
61
254
83
-17d
22
93
--
53
309.
93
173
26
113
-
66
_ 30
85
150
...
116
50
320
70
16f
22
121
-
01
407
56
130
, -
137
. -"
138
345
96
14,,
36
81
-
255
399
176
...
61
131
-
142
367
139
122
95
109
91
441
120
106
120/
116.
-
267(1)
240(2) &
T.t'sl 731 71e 794 772 ... 941 )4 ... 1.105 ... 1,179 1,102/1)121
Not including graduates of cthe Hither Institute;of Applied Psychology.2) .sot including graduates of the Teacher Training school.
13.7
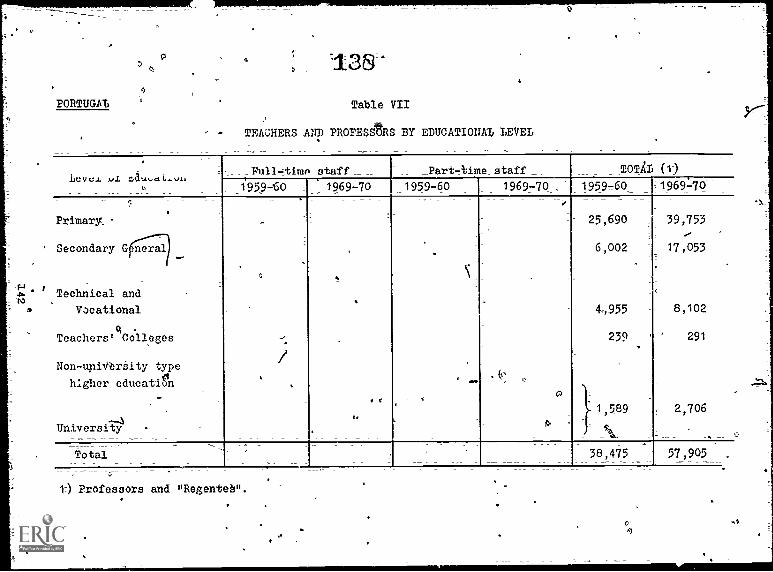
PORTUGAL Table VII
TE.L;HERS AND PROPESARS BY EDUCATIONAL LEVEL
Levers .x..1 Zdu,atr..v4,_Pull.,timp staff Part-time staff TOTAL (11
195940 1969-70 1959-60 1969-70 . 1959760- -1969.1.70
Primary.,
Secondary G neral
Technical and
Vocational
q -
Teachers' Colleges
Non-upilibrnity type
higher educatien
--.1UniversiAy -
.
...
/
.
.
.
..
, 4.
,
--
411,589
25,690
6,002 i,
.4:
4,955
239
-- ti..
39,753
17,053
8,102
291
2,706
Total 38,475 57,905= --
t) Professors and "Regentebu.

PORTUGAI Table VII.a
TEACHERS AND PROFESSORS IN PRIVATE SCHO0 BY EDUCATIONAL LEVEL
'[..vol of
Education
FU11-time_ staff _ Part-time _staff_ _TOTAL. -
1959 -60 1969-70 '19597.60 1969 -70 1959-60 1969 -70
Primar Y1,663 2,089
Secondary General.
0
4,056 8,999
Technical and .
'Vocational599 707
Teachers,,College44(1) 125
Non-university type
higher education
469 491
University
Total 6,831 12,01
1) Only "Magisterio primario".
139

PORTUGAL Table VII.b
TEACHING STAFF IN UNIVERSITIES BY STATUS AND FIELD OF SPECIALISATION
of,
Specialisation =
' ,. 1959 -1960
- - -----
1969=i970
SeniorLevel .
MiddieLeVel
JuniorLevel Total
SeniorLevel
,MiddleLevel
JuniorLevel Total
Pure Sblence
Architecture
Technology
Agriculture
Total Science
.and
I Technology
Medi-ail-Sciences
Humanities
Education
Fine Arts
Laws
Social Science
Other
,
.....
Total
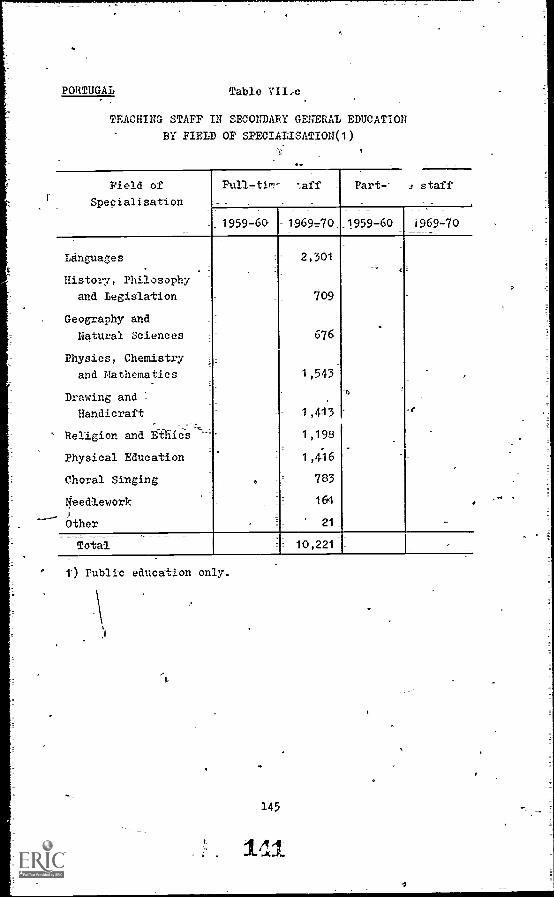
PORTUGAL Table VIIre.
TEACHING STAFF IN SECONDARY GENERAL EDUCATION
BY FIELD OF SPECIALISATION(1)
Field of
Specialisation
Full. -tip.- aff = Part--
1959-6a 1969,70 1959-60
staff
1969 -70
Languages
History,- Philosophy
and legislation
Geography and
Natural Sciences
Physics, Chemistry
and Mathematics
Drawing and -
Handicraft
Religion and Ethics
Physical Education
Choral Singing
geedlework
Other
709
676
1,543
1,413
1,198
1,4:16
783
161
' 21_
=r
Total
° 1') Public education only.
10,221
145

PORTUGAL 0 Table VII, d
TEACHING STAFF IN VOCATIONAL SCHOOLS By _FIELDS OF SPECIALISATICIT
TI :11
Specialisation
_4Full=time staff Part-time staff TOTAL
1959 -60 = 1969-70 _ 1959-60 -1969=70 1959=60 1969 -7-0
Commerce and =4,279 6,998
. Induatry(1) .
Agriculture 91- 255
Social Services 47- 53-
Nurses and
Midwives 338 642
Fine Arts 200- 154
Total ' 4, _955 = 8, 1029
1) Teachers of Commercial Institutes (number unk-,zmn) are not included. The teaching staff of theIndustrial Institutes is included in non-university higher edudatiOn.

tt
4
10(71,141:, Table -VIII
EDUCATIONAL EXPENDITURE (1970)
AT CURRENT PRICEY
Type-of
ExpenditurePrimary
Secondary
Oeneral(1)
Techni,o1and
Vocational(2)
,Teachers'
Colleges-
Don-universitytypo highereducation.
University
-Other expenditure
foreducation
Total
expenditure _
1. Central Covernsens. .,. ..
.
ir/ 11. 7 141 I If200 _ 3.4`,9.0 _ =,,:fIrr.nt-ecr,-14... ...
,=iemuneration-of
-.3.1,:.g .tAff rco,c (7,,,,- A 4_ 182.0-
i'-- h 1CA.6 4.1 1,7,9.3
Tnvestment(4120.9
±oubstdlecar4 transfers
b. ToCil_Central
Government expenditure
_tot education1,7s4.4 :
1I. Private-EducattdW
_
-: ----:---
t-434.8 (4)_cltrent-etpenditure _
--,of which: remunera=tion_of teaching staff 514,0 (4)
inves,ment _908 (4)
I/1. local Authorities
. Torrent- expenditure
--of-which: remunera-
urn or to ".
___.
_ __ .-
_7 Investment_174.0 (4)
1) ICielo-preparatorio" and ensino
Z) Including-expenditure for-the-last two years of the industrial Institutes.
3) Other expenditures-related-to-education (such as building) are not included-since they appear in-the-budgets of other ministries.
4) Year 1969.

PORTUGAL Table IX
DISTRIBUTION OF UNIVERSITY STUDENTS
BY FATHER'S PROFESSION
Father's-Profession(1)=1959-60
Students
-71969-70_ _-_
I. Professional, Technicaland Related Workers
U. Administrative, Executiveand-Managerial-Workers
= Government
. -Other
I
__
s,
III. Clerical and tales-Workers= Working Proprietors--Other
=:
t
.
IV, Agricultural and'Related-*corkers
=_Farmera, Farm_Managers
--Other_
_,
_ .
. /1
.
V.
.
-Manual Workers
- Skilled- Semi-skilled-Unskilled
. _
_ /
-VI, Service Workers _,
.
VII. Others_and_not specified =, _-
Total
1) The seven occupational groups listed here correspond tomajor and minor groups of the International StandardClassification of Occupations.
148
1.14

PORTUGAL Table X
DISTRIBUTION OF UNIVERSITY- STUDENTS BY TOWN OF PARENTS' RESIDENCE
.
Towns of more than
50,000 inhabitants
=
population
Census
1960
_
Students
1960-61Population
Census1_970
Students
1970-71
.
Rest of the country. .
Total
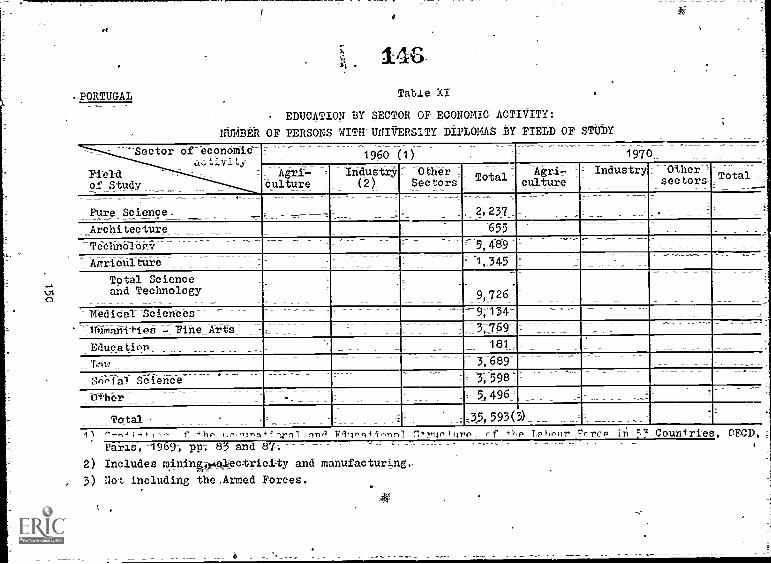
#f
-BORTUGAI
s.6=
Tabie XI
EDUCATION BY SECTOR OP ECONOMIC ACTIVITY:
NUMBER OF PERSONS WITH UNIVERSITY DIPLOMAS BY FIELD OF STUDY
Sector of economic (1) 1970,_a..; tivi ti e
Field , Agri- IndustrY -: Other = Agrir " Industry -OtherTotal:: Total culture =of Study 'Culture (2) Sec tors = sectors
- _
Pure Science ---, '', 2,237_Architecture =655 =
_
Technologv :=_ 5, 489--
Aaricul titre I, -345- ---- -
Total Scienceand Technology
_
9:713246::Medidal Sciences ; 9
Thimani-i-ies 7 Fine -Arts_ 3,_769 --
Education 181:
l',,,,,1 3, 689,
Snes Ial Se 1 ence = = 3, 598=
othbr . = 5, 496:
To fel ,35, 593(3)-f +11p_Urq ilrql-P111 V111,q+inrn_ of Countries. OECD.
Paris, 1969, p_p_ 83 and 87-;
2) Includes raining;weJlectricizty and manufacturing,
3) Not including the,Armed Forces.
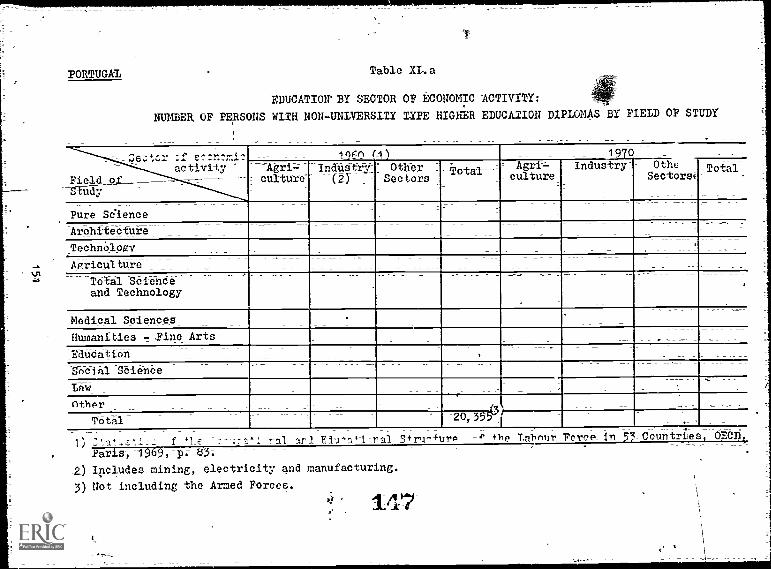
PORTUGAL; Table XI-. a
EDUCATION BY SECTOR OF ECONOMIC ACTIVITY:
NUMBER OF PERSONS WITH NON-UNIVERSITY TYPE HIGHER EDUCATION DIPLOMAS BY FIELD OF STUDY
_;
Za;tcr :f s':-:m7=1.:.activity
Togn (i 1 1970_
--Agri=;:=Induatr:-- culture --(2) _=-Sectors
Other -otal--- Agri-=.
ic ul ture-Industry-- Othe
Sectom-Total
Field_ol_____-s-tuay
_Pure Seience_
ArChitecture
lechnOlogv-
AgridultUre
Total Scienceand Technology
Medical Sciences
Humanities - -Fine Arts
JNYud-ation---
Social Science
law
nth or.
Total.,-20,3593_
Z) ZLatiC1-: ral E_1')-a4-t-ral-Sfrar +uro f Fo rce in 54_Couttries,__OECD ;
xaris,
Includes mining, electricity and manufacturing.
3) Not including the Armed Forces.
147

PORTUGAL Table XII
PRE-PRIMARY EDUCATION
1959-60 / 1964-65 1969-70
I. Enrolments
0 0a) Public schools
b) Private schools 6,126 10,350 15 153,
II. Teachers
0.
0a) Public schools
b) Private schools = 181 363 651-
III. Expenditure .
a) Central Government -_
-_. Teachers
.= Subsidies to
local
authorities
= Subsidies to
private
education
= Other
b) Private
- Teachers
- Other
.
c) local authorities
- Teachers
- Other
152

SOURCES
Replies of the Portuguese authorities.
Estatistica da Educaao published biennially since 1955
by-thA-2ortuguese National Institute of Statistics. Theinfor ation for 1959 -60, 1961-62, 1963-64, 1965466,
1967 -6 is found in the Statistical -Yearbook_of Portugal.
Development of Higher_Education_1950-1967_ =- StatisticalSurveyAOECD,_-aris_-, -1970. .
Study :n -Teachers/Etudes _sur_les_Enseignants-SetherlandsiIbrtugal,-OECD, 1968:
StatistAs-of_the Occupational ay.-A. Educational Structureof t e a our orce-in 3-Countries.- E0Di 1
4

SPAIN
EDUCATIONAL CLASSIFICATION
The following educational levels (and -fields of ,study) are
presented by refeence to the "conversion key" for Spain (OECD
clasdification)(1):
1. Primary-education(2)
The first eight years of schooling (not including pre-
primar,y, education)-.
2. G- eneral secondary education
-(Leading to the "bachillerato general"). The three cycle*
at this level are as follows_:
- Elementary cycle ("ciclo elemental")-
, Upper cycle ("cicl superior").
= -P-re- university cycle ("-ciclo preuniversitario")
3. Secondary technical- and vocational- education
Lower -level
- The cycle preparing for "grado pericial de-comercie
(Commercial technician in commercial schools)-
4 The "Escuelas de arted y oficiosartIsticosu_i "Escueles
de belles artealTonservatorio de misica" (secondary_ arts
*schools).
1) With the exception of primary education for which theclassification used in Spanish Statistics has been retained.
2) According to the 1970 Reform, an eight-year basic generaleducation school. will replace the primary schvol and theelementary cycle of the secondary general education._ Thoseof the primary schools which still operate according to theayStem prior-to the Reform include two cycles,_ each of themof 4 years! duration: the elementary cycle ("periodoelemental") an& the advanced cycle ("periudo de perfet,t.iona-Miento").
J
A
134
150

4 ,
The "Formaei4n profesimal-industrial" (Industrial
vocational training schools).
4Z The "Escuelas de niutican, "de peeca ", ;,d e capataces
agricolas" ( OautiCal,schools, iishineschools, schools
for intermediate training in agricultire).
Uoper level
- "Preparatorio de t4enias de grade medio" (Preparatory
classes for post-secondary technical schools).
"Centros d 21541Inza laboral' (Centres preparing for the
"bachiller9 :nico". (Technical baccalaUr4at).
4. Teachers cUlegZi122gisLEL.15211
Teacher training.
5. Non-university yhLiigher education
See list of the educational institutions-included under
this' title at the end of this note on p.157,
6. liVversity type hAgher education . .
See- list of Institutions included under this title at the
end-of this note Qn p.157.
NOTES ON THE TABLES
Table -I-: Enrolments Pdupatinnal IPvP1 and year of age -and
enrolment ratios
Enrolments for children age "X" represents the number of
children who had attained that age dt the beginning of the
school year. '
Table III -.a: University type higher education: numbe:r- of
candidates, new entrant's and enrolments (by field
or .
(The following defi nitions which apply to Table
university type higher education, may be adapted to other
-tables in which the defined terms are used.)
- Candidates: all persons seeking admission to university
type higher education.
- New'entrants: first-year students registered for -the
'first time.
of study
155

- Field of study: the OECD classification of higher
education by held of study is given on p.157
7at,,E PPlehirg it universities by status and
field of specialisation
- Senior level (S.J.): full and equivalent professors.
Junior level (J.L.): assistant lecturer, auxiliaries
and other equivalent university teaching staff.
- Middle_level th,se who do not belong gto either
=f The two abpe-mentioned categories: lecturers,
senior lecturers, assistant prlessOrs.
f univerc!ity stude1,ts by-father's
professionThe seven,,:,ccupati)nal groups .c,h3wn in this table corres-
pond to Major and Minor Gr -ups of the International
Standar d_ClaNsification of_Occupations(see
',A,e-afi,,n by 'PP+n,' _of er=en 'trio of number
f r- ne with university diplomas by field of study
The gr_ipillg by sector.of economic activity is based on
*he ir+P-r_a*i-ral '71-anJardoindlistrial classifi.mtin of
all Economic Activities (ISIC) (see p.255).
4 1
156
15?
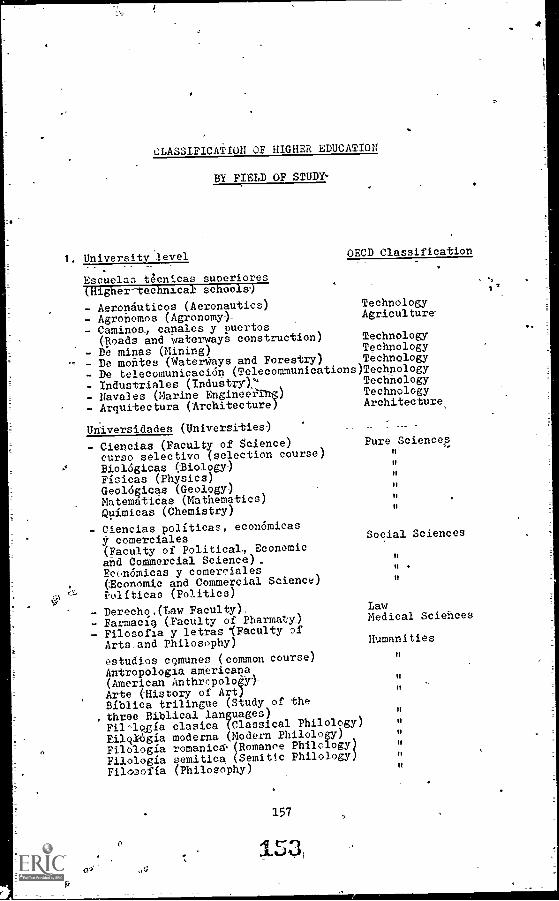
CLASSIFICATION OF HIGHER EDUCATION
BY FIELD OF STUDY-
1 University level OECD Classification
Escuelas_t4cnicas_superiores(Higher-technical schools =)
- Aeronauticos (Aeronautics)Agronomos (Agronomy -)-
- CaMinos4 canales y puertos(Floads and waterways construction)
- De minas (Mining)- De montes (Waterways and Forestry)
- De telecomunicaci4 (Telecommunications- Industriales (Industry)'- Naval es (Marine EngineeiTng)
Arquitectura (Architecture)
Universidades (Universities)
- Ciencias (Faculty of Science)curso selectivo (selection course)Biologicas (Biology -)Fisicas (Physics)GeolOgicas (Geology)Matematicas (Mathematics)Quimicas (Chemistry)
Ciencias politicas, economicasy comerciales(Faculty of Political., Economicand Commercial Science),Economicas y comerciales(Economic and Commercial Science)Politicas (Politics)
- Derechq,(Law Faculty),- Farmacia (Faculty of Pharmaty)- Filosofia y letras "(Faculty Df
Arts_and Philosophy)
estudios cgmunes (common course)
Antropologia americana(American AnthrcpologY)-Arte (History of Art)Biblica trilingue (Study of thethree Biblical languages)Filnlogla clasica (Classical Philology)
FiloI6gia moderna (Modern Philology)
Filologia romanicW(Romance PhilologyFilologia semitica (Semitic Philology
Filosolla (Philosophy)
157
ILS?;0
TechnologyAgricultura
TechnologyTechnologyTechnology
)TechnologyTechnologyTechnologyArchitecture,
Pure Sciences
11
ft
11
Social Sciences
H
II
11
LawMedical Sciehces
Humanities11

Historia (History)Historia de Amdricu (American History)Pedagogia (Pedagogy)
- 'Medlcina (Faculty of Medicine)- Veterinaria (Faculty of Veterinary
Medicine)
2. Non-university level
Humanities
Education
Medical SciencesAgriculture
tdcnicas de Te6hnologyYost- secondary technical schools with
the exception of preparatoryclasses)
Escuelas oro.,esionales de comercio Social Sciences"grado orofesional"(Commercial schools "professional grade")
Escuelas -de avudantes_t6cnico sani- tarios Medical Sciences(Training schools for-medical assistan-ts)
Escuelasdeueridad.Health an chi.- d reifare schools
Medical Sciences-;
Escuelas de bellas-artes, conservatories Fine Artsde:_mdsica_y_declamacion; escuelas-suneriores:de arte_dramatico(Academies of-Fine Arts, Schools ofMusic and Dramatic Art)-
158
154
LIST OF TABLES
c
Z. Enrolments by educational level and year of age and
enrolment ratios 161
II. Enrolments ................. ...... .. 162
II.a Humber of students in private schools......,.:........ 163II.b number of female students in public and .private
schools..... .... .................... ........ . . . . . .. 164
II.0 Enrolments in the first and the last learLf studies 165
II.d Enrolments in secondary general education... 166
Newentrants. ..... ........ ...... ........, 167
III.a University type higher education: number ofcandidates, new entrants_and enrolmants by fieldofstudy.............. .... . . 168
III.b Non-university type higher education: number ofCandidates, new entrants and enrolments by fieldof study......... . . .... 169
IV. Higher education: number of female students byfield of study............. ..... ..... .1'70
V. Higher education: foreign students in the countryand nationals studying abroad by field Of study 171
VI. Graduates. ... ........ ......VI.a University type higher education: number of graduates
by- field of study (1st degree of studies).. ..... a73
VI.b Non-univelcsity type higher education: number of
graduates by field of study (1st degree of studies) 174
VIZ. Teachers and ,professors by level of education .... . ... ...:.175
VII.a Teachers and professors in private schecl: by
educational level... ..... ,........... . ...... 176VII.b Teaching scuff in universities by status and field
of specialisation .............. . .....
VII.c Tpaching staff in non - university -type highereducation by status and field of specialisation.... .178
VII.d Teaching staff in vocational schools by field
-of specialisation. .... . ....... .4. .179
Mi. Educational ....... ................ aso
IX. Distribution of university students by father's'
profession ...... ...... ..... . . ........ 181
X. Distribution ,.f university students by tevm of
parents' residence a82
159
15r-
,

, XI. Education by sector of economic activity: number ofpersons with university diplomas by field of study... X83
Education by sector of economic activity: number ofpersons with non-university type higher educationdiplomas by field of study 184
XII. Pre-primary education 185
t, SOURCES 186
XI.a

Table I
FlIFiL"EN2 1l ErucATI0NAL LEVEL AND YEAR OP AGE AM, EEROLUNT 4A710.1 (190-70Y
MI Primary fecondaryjleneral
,
Te hnical and Vocational TeachersColleges
.
'Uon-universit-type highereducation
pniversitie._ Totalenrolments
PorAlation_(1)
'Enrolmentnotioo
(14wee level) (upper level.
6,07,260(07,260 595,081 r.0201
7 507,769 '
587,789 588,966 0.9980
o ..,- 513.439
593,437 503,040 1.0170 =
9 596,469596,469 502,393 1.0242
10 472,256 838,736 9,362612,354 593.998 01.0309
11 357,698 224,677 3,271 585,646 599.500 0.9769
12 291,203 242,972 12,787 17 546.979 601,202 0.9098
13 22c,T79 225,629 19,060 1,506 411,202 594.646 0.7926
14 57,952 11,1,674 31).1-6' 4.114 277,403 558.441 0.4971
15 1, 1 ci .5 -'7 30,693 5,493 173.723 ') 48,163- 0,3169
16 103.145 2),308 5,515 1.663 1,021 140,952 527,7171 0,2671
1718
60,02128.202
25,60520,685
4,6823,071
4.5947,396
4.815,,
9,21012,35222,06
110,L,6990.650
536,240536,961
0.20520.1689
19 14.0)9 12,837 1,631 7,782 11,402 24,196 72,147 508,142- 0.1419
2) 19.086 18,708 924 6,496 12,548 25,313 03,075 502,012 0.1655
21 10,441 295 4,470 11,074 22,691 49.171 530,370 0.0927
22 916 167 3.000 9,069 19,155 32,387 564,232 0.0574
23 655 123 2,119 6,451 16,101 25,152 -310,597 0.0499
241,649 69 3,58) 5.670 12,200 23,379 498.991 0.0468
25 10(1 62 4;196 9,412 13,050 529;115 0.0262
26 96') 13'6 6,971 6,905 14,971 504,149 0.0297
274,743 4,743 502,341 0.0094 =
283.361 3,361 4303 51 0.0079
2132 ani
,
2 OE 2,776 3`fi,922 0.0070
ovf_r,10,437 10,437(2) 505,662
-,-.1 ,7,9,144 1,,71,,/)., 22,987(2) 27,805 41,183 02,627 192,139 5,729.964 13430,248
1)'Eatimated for 1970. (intos y ctfraa de la EnsWr"ranza en gsparia, 1970 tomo )
21 Ezcluding 13,270 etivnto of Applied Arta for whom the 60 dintribution wan not available.
Erl,,aln/A 'n F.a nin 1.6 0.
157

SPAIN
S.
Table ii
ENROLMENTS,
Year Primary -_generalSecondary
_ _ _
Technics/ and 'Teachers,-_
vocational
,-Non-universit)
=colleges
_.-
tYpe higher-education
Univer- =_Totalsities :
-,
enrolments
(lower-- -(upper,pvpil 1-pvp11 _=
_1959.40 ... 448,311 ... .., -- 41,575 39,781 81,2261= ;,1_9604t : ..-. ' 474,057 -71-18,785 =- 44,450 = 43.126 44,812 77,123= ,,_1961=62 = . 564,111 _:124,967 ,z 53,609 1 43,103 45.,424 = 82,531== ..,
1962-63-- '' 622,872 -135,720 56,878 -- 45,898 46,965 88,352' ..
1965=6-4- 2,975,316 -= 682,226 T44,456 65,615 50,365 50,833 102,855= 4,069i6441964=65=1 3,184,913 _ 745,044 -161-,497 =, 76,400 58,510 53.538 __ 112,647:- 4,592,1=49-
196561= 3,331,566 834,290 '177,299 : 56,936 63,116 77,910(1) _- 1-25,879-= 4,666,9961966=67-= 3,380,218 929,589 -190,657 - 60,375 68,972 80,607 141,408-, 4,851-,826
1967 -68- 3,503,637 1,124.936 ;209,618 44,715 61-,927 , 82,715 154,285:- 5,181,853
1968-69-; 3,664,823 -1,207,006 -,226,058 . 36,883 54,541 81,546 176,4287- 5,447,2851969-70- 3,789,135 -1=,371,078 239,257 -: 27,805 41,183 82,627 1-92,159':
;crirl-._",__ 1.924.529_ 1.521_.857 _ 252.561 , _20..908,, _47,541__ _= -86,746_ _215,159:,5,743,224_6,072,301
1) Technical Education Reform: for the post=s6cOndary teChnical schools, the statistics cover allstudents following courses it the various specialisations (matriculados en los cursos de la carrera),omitting enrolments in preparatory courses for these schoolb (seiectivo de "iniciacion" and "ingreboqnot considered in the present survey as higher education. However, because of the important selective_function of these courses their elimination, by the Technical Education Reform of 1964, allowed asignificant increase of new entrants in these schools. Consequently, since 1965-66 information onpostsecondary technical schools cannot be compared with that of previous_ years,
Source: Estadistica de-la Ensenanza en Espana.

rn
SPAIN
NUMBER OF STUDENTb IN PRIVATE SCHOOLS(1)
Lev el of education
961-62
65
19 64-
9646 4
19, 69-70
19 70-71
Primary
...
774,821
941,259
1,051,601
1,097,649
)
Secondary General(2)
470,793
593,465'
826,636
929,779
979,863
Technical and vocational
,
(lower level)
.76,101
91,531
.
100,647
.,
Technical and vocational
(upper level)
..
20,922
15,634
10,337
7,-71-0-
Teachers' Colleges
5,668
10,078
10,266
3,750
3,379
Non-university type
higher education
2,555
4;714
...
.,UniNersity
610
3,794
1
7 041_
'
7,878
7,557
1) Including church sch)ols
2) Including neolegiada privada y fibre
5., de Iglesian:
3) Universities wand technical high schools
(nCentros no estatales")
159

4
SPAINTable Mb
OF FEMALE STUDENTS IN PUBLIC AND PRIVATE SCHOOLS(1)NUMBER
Level of education 1959-60 1964-65 1967 -68 t969-70
Primary GO. 1,600,042 1,765,533 1-,895,040
Secondary General 173,987 301,242 488,151 619,792
Technical and Vocational(lower level) 29,811 251528(2) 35,031(2) 49,129
Technical and Vocational'(upper level) 1,570 18,711 16,674 11,223
Teachersl- Colleges 25,854 36,231 36,589 22;666
Non - university typehigher education 10,464 11,451 13,233 14,806
University 13,464 22,229 35,487(3) 48,432
1) "Nacionales, tglesia y Privada".
z) With the exception of students of"asignaturas sueltasoin Applied Arts.
3 Of which 814 in "Escuelas de Venice Superior".

SPAINTable II.c
ENROLMENTS IN THE FIRST AND THE LAST YEAR OF STUDIES
Level of education
1960-61 1969 -70
First year last Year First Year DastrYear
Primary - 1,001,30466,960
Secondary General 112,675 19,221 355,767 99,625
Technical andvocational
Teachers' Colleges 16,455 12,821 15,828. 12,854
-Non-uniArersity TypeHigher Education 10,744 6,287 41,929 15,841
University 22,154 13,728 69,869 23,876
t
1 C1

ENROLMENTS IN SECONDARY GENERAIEDUCATION
"Grade ele ntal" "Gralo superior" "Pre-universitrio" Total enrolments
1959 -60 3'74,712 54,557 17,042 448,311
1960=61 394,629 60,.207 19,221 474,057
1961-62 469,737 74,008 20,366 564,111
1962-63 518,270 81,602 23,000' 622,872
1963-64 566,73.6 89,396 26,094 682 2261;'0\0\ 196445 622,616 .95,388 27,040 745,044
1965 -66 697,292 108,891 28,107 834,290
1966-67 775,929 123,576 30,084 929,589
1967=68 934,742 155,267 34,927 1,124,936
1968-69 998,084 172,060 36,862 1,207,006
1969-70 1,121,006 20;,413 44,659 1,371,t8
1970=71 1,228,268 241,680 51,909 1,521,857

SPIN Table III
jEW ENTRANTS
Year Primary,
-
Secondary -General -_
;Technical and
.Vocational
.
-Teachers'Colleges
:Non,'universitytype -higher,education-i =;
University(lowerlevel)
: Wiitierlevel)
1959-60 s-.
1960-61
1961=62
1962 -63
1963-64
1964 -65 .0
1965-66
..
_.
1966-67
196748 4 Z
1968=69_ .
1969-70
1970.771
,o3

Table
UNIVERSITY TYPE HIGHER EDUCATION: NUMBER OF CANDIDATES,
NEW ENTRANTS AND ENROLMENTS BY FIELD OF STUDY
,
Field of Study
Candidates New Entrants: -
Enrolments
1959-60 ,-
.
1269-70 19,59-60 1969-70
.
1959-60 1969-70
Pure Science
Architecture
Technology
Agriculture
.
-
,
12,552
18,313
, 31,724
8, 548
30,287 .
_ 4,639
Total Science
and Technology ,
30,865.
T5,198
Medical Sciences
Humanities
Education
Fine Arts
Law*0.
Social Sciences
Other
.
.
.
.
.
,
.
.
/
22,501
7,345
-
-
14,773
5,742
-
36,827
39,'04_
.
-
20,363
20,347
7
Total .81,226 192:139
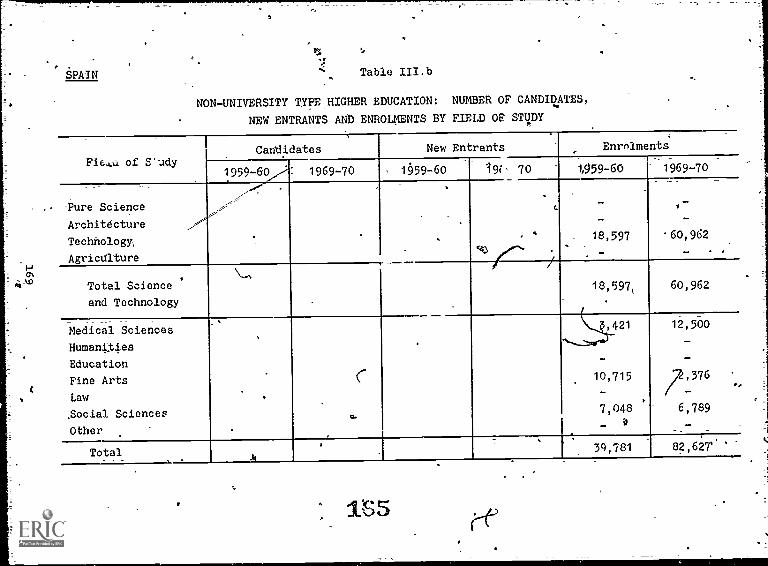
SPAIN Table III.b
NON-UNIVERSITY TYPE HIGHER EDUCATION: NUMBER OF CANDIDATES,
NEW ENTRANTS AND ENROLMENTS BY FIELD OF STUDY
Fie.,..i of S'udy
Caddidates _New Entrants Enrnlments
1959-60,,?: 1969-70 1959-60 19i 70 1,959-60 1969-70
-Pure Science --7,- - ,-
Architdcture
Technology
---
..
-
18,597.
*60,962
Agricdlture- . ,
Total Science
and Technology
18,5971 60,962
Medical Sciences 0421 12,500
Humanities
Education -
Fine Arts 10,715 7,376
Law .-
,
.Social Sciences ..7,048 6,789
Othera -
Total 39,781 82,62T
1S5
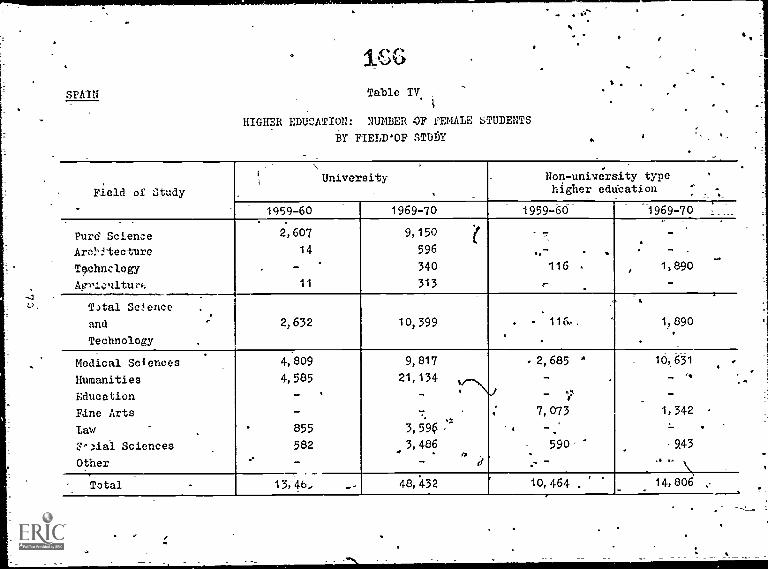
SPAIN Table IV
HIGHER EDUCATION: NUMBER -OF FEMALE STUDENTS
BY PIELD'OP STUDY
University Non - university type '
Field of Study ,higher edu'eation
,. _._
. 1959-60 1969-70 1959=60 _ 1969-70
Turd Science 2,607 9,150 -
Arc.!Itecture 14 596 ,- - - .
T9,chnclogy 340 116 . 1, 890
Agrlculturk 11 313 .-- -
T)tal SO once .
and r 2, 632 10, 399 . - 116- . 1.890
Technology . . .
,
Medical Sciences 4, 809 9, 817 . 2, 685 ' 10; 651 .
Humanities 4, 585 21, 134 . - . - ''
Education - . - - 7 -
,
Fine Arts - -:, ' . 7, 073 1, 342
Law ' 855 3, 596 ::: . - - ..
0" .)ial Sciences 582 3, 486 590 2430
Other - - ? ..-.. -
Total - 13, 46, - - 48,432 10,464 . 14, 806 ..

SPAIN Table V
.HIGHER EDUCATION: FOREIGN'STUDENTS IN THE
COUNTRY AND NATIONALS STUDYING ABROAD
BY FIELD OF STUDY
Field of Study
Pure Sciences.;
Technology
Medical Sciences
_Other
Total
t
Foreign
students
1959 . 1968
107 414
51 517
2,268 5,039
728 970
3,154 6,940
171
Nationals
studying abroad
1959 1968
'4
t

SPAIN Table VI
GRADUATES
Year
Primary Secondary GeneralTechnic al and
vocational= Teachers' =ligher=
Colleges
(2)
Non-univer-3ity type
eduriaat-ation =
(-1 st degrecstUdiee)pf studies):
Univer-sity
de»gree of
cEr
'
"Cert.Escola-ride d "
Elemen-
Lary_ .
Upper
,
"Madurez" (lower
level)
(upper
level')
_(1)
1959-60 ... ... 53,751 22,526 11,793 ... .. . . ... ... _5,856
1 960 -151 ... .,, 59, 371* 23, 570 13,505 , .. 2, 167 ..... ..- =5,288
1961-62 ... ... 67,071 26,918 14,349 ... 1,955 ... 6,671 '5-0373
1962 -63 ... ... 62,058 29,217 18,410 ... 1t772 ... 6,396 -5,846
1963 -64 170,333 23,614 71;108 28,213 15,708 15,185 4,315 7, 445 . 8,397 _6, 611
T964-65 188, 435 24, 446 76,850 31, 521 20, 337 17,719 5,110 8, 978 9,832 -7, 434
1965-66 197,818 19,877 78,956 30,737 21,741 26,842 -6,553 10,282 9,793 -7,557
1966 -67 55,142 25,352 95,54:9 35,702 23,506f 25,145 6,930 . 12,866 10,008 8,236
1967-68 84,858 56, 474 98,056 44, 479 27,450) 27, 347 7, 673 13, 487 12, 851 9, 867
1968-69 86,681 69,517 102,349 . 52,843 ' ... 23,467 ... 13,811 .11,585 11,055
1969-70 ... .. . ... ... ... ... ... 11,022 11,087 ,-72-,091
1970-71 ,
1) ,"Grado elemental y superior" of the Bachillerato Tecnico.
"Aiobados en la Prueba Final".
3) 7re-Universitario"
SPAIN Table VI.a
UNIVERSITY TYPE HIGHER EDUCATION: NUMBER OF GRADUATES BY FIELD OF STUDY
(1st degree of studies)
FieAudyld of_
1959-60 1960-61 1961-62 -1962- ;1963-64 _1964-65 1 965-66-;1966-67:1967-68_ 1968-69 69-7C _;1970#717
T-
i
Pure Science; 478 536 642- 680- 622, 1,161'° 1,005 1,190 1,346 1,524 = 1,787,
Architecture 84 93 88 81 145 180_ 191 153- 246-- 307 285.'
Technology 630 657 758 1,052 966- 1,209 1,232 1,020: 1,262 1:,640 1,774
kgricultu're 297 201 196 176 234 284 148 181 137- 322 549
Total Science'i
__
and Technology 1,489 1,487 1,684 1,999 1,967 2,834 2,576 2,544- 2,991 3,793 4,395,
Medical 1,978 1,500 1,912 1,662 2,022 2,121 2,264 2,324- 2,665 2,986 3,188
SciencesHumanities 742 828 774 859 1-,,209 1,018 1,054 1,775- 1,930
,
1,957 2,259
Education - - - - ..: - - - 4- - -
Fine Arts - - - - . - - - - - -_ -
Law 1,509 1,285 1,314 1,160 1,079 1,116 1,161 1,215 1,454 1,587 1,285
--Sot-. 1 Sciences 138 188 _189 176 334 34! 502 378- 827 732 964 _
Other --7- - - - -
.
- - -
Total 5,856 5288- 5,873 5,846 6,611- 7,434 7,557-_ 8.236- 9,867 11,0551,12,091

--SPAIN Table VI.b
NON- UNIVERSITY TYPE HIGHER. EDUCATION: NUMBER OF GRADUATES BY FIELD OF STUDY
(1st degree of studies)
Field ofstudy 1959-bu -1969761-1961-62- 1962=63_1963-64_ 1961-65_165-66 1j66 -67 1967-68 =1968-69--1969-701970-7J
Pure Science - - s. - - , ,
Architecture - - - - ,i.. - -
Technology 5,395- 3.114 4,743- 5.926 5.847- .5.885- 8.115, 6,931 6,236-
Agriculture - - - - - - __
. _
'otal Science
--na Technclogy 3,395 3,114_ 4,745- 5,926 5,847 5,885- 8,115 6,931 6,236_
Medical 2,01.6 2,125 . 2,585 2,782 2,959 5,1 -17 3,813 3,946 4,059,.Sciences
..
Humanities- - , - - - -
Education - - - - - - - - _
Pine Arts 523- 489 420 484 447 481 378' 190) 207"Law- _ - - - - - - -
Social SciencesSciences 757 638 649- 640 540 525 545 512 585
Other - - - - - - ._
Total ... ... 6,671 6.396 _- 8,397 9,832 9_,793 10,008_ 12,851 -11,585 11,0871
1) lThe students of the "Conservatories" are not included.
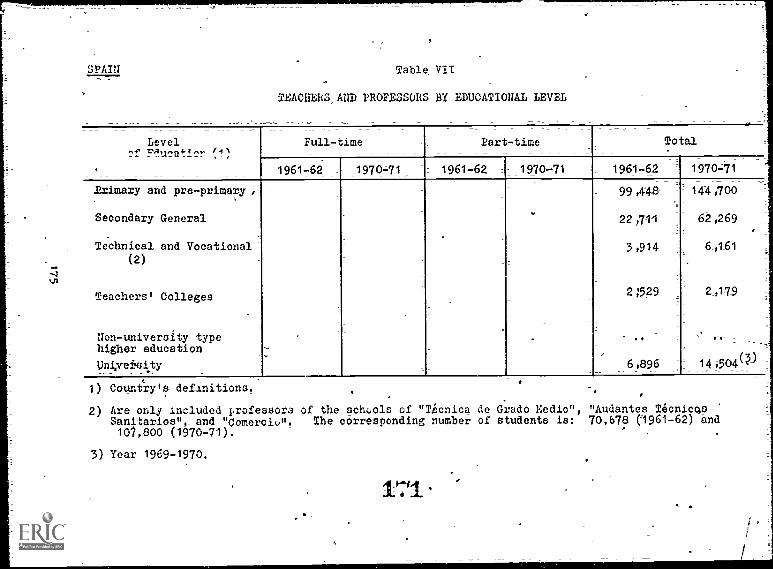
SPAIN Table VII
TEACHERS AND PROFESSORS BY EDUCATIONAL LEVEL
LevelTf FducatiTr !1)
Full-time Part -time Total
1961-62 1970=71 = 1961-62 :- 1970-71 1961-62 :_
.
1970471
Primary and pre-primary,i
Secondary General
Technical and Vocational-(2)
Teachers' Colleges
Non=university typehigher education
Unixei"sity
..
99,448- -:
22,711
3,914
2 ;529
- _.
6 896,
144,700
= 62,269
6,161
2_,179
14- 504°)_
1) Country's definitions,
2) Are only included professorsSanitarlos", and "Comercit.".107,800 (1970-71).
3) Year 1969-1970,
of the schools of "Ticnica de Grado Medio", "Audantes TecnicqsThe corresponding number of students is: 70,678 (`1961-62) and
H41
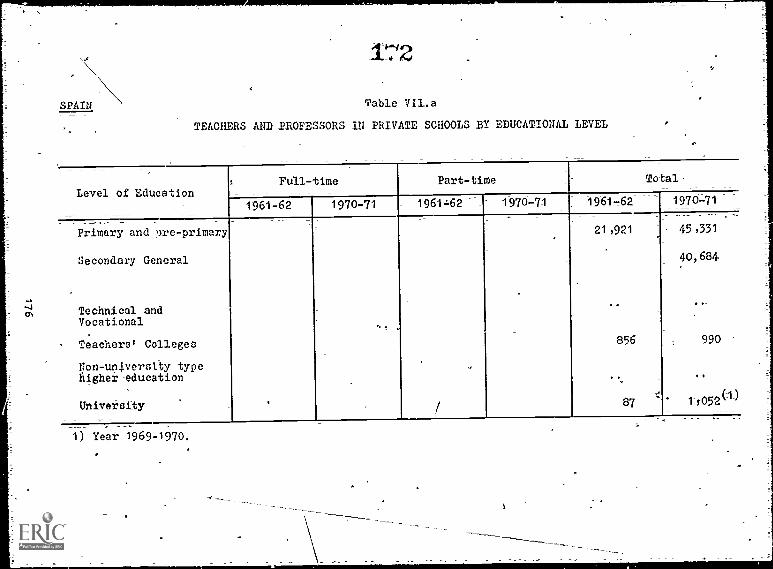
-4
SPAIN
rn
172
Table VII.a
TEACHERS AND PROFESSORS IN PRIVATE SCHOOLS BY EDUCATIONAL LEVEL
Level of EducationFull-time Part-time Total-
1961-62 1970-71 1961=62 _- 1970-71 1961,62 _1970 -71
Primary and nre-primary 21,921 45-031
Secondary General 40,684
Technical and ** *-
Vocational
Teachers' Colleges 856 990
Non-unj.versity typefiigher-education ..
University '
87 _ - 1-1052(1)
1) Year 1969-1970.

r:
SPAIN Table VILA)
TEACHING STAFF IN UNIVERSITIES
BY STATUS AND FIELD OF SPECIALISATION
Field* orSpecialisation
1959760 . 1967768
Sen1CrLevel _-
Middle -1'Level
JuniorLevel Total
Senior E_MiddleLevel -= Level
-JuniorLevel
=_
=Total
Ture Science 153 364 449 966 _ 278 .._ 1,550 =: i1 =,828
Architecture 33 30 46 109 , 65, * 460 118 -643
Technology- 218 221 443 882 314 1-640 653 =2-007
Agritulture 73 139 141 353 113 473.
206 _ 792
Total SciepceandTechnoiou . 477 754 1,379 2,310 77770 3,823 977 5,570
Medital Sciences 223 436 1,089 1,748 = 321 1,669 - 1.0_90
Humanities- '' 186 282 377 845 328 1-629' -1=1657
Education
Fine Arts.
Law 153 234 600 987 251 590 841
Social Sciences 62 75 286 423 84 462 546
Total 1 ;101 -1 ;781 3,431 6 -,313 - 1-,754_ 7 ,873 977 =
_.
10,604

SPAIN Table YU'. c
TEACHING STAFF IN NON-UNIVERSITY TYPE HIGHER EDUCATION
BY STATUS AND FIELD OF SPECIALISATION
Field- ofSpecialisation
1959-60 1967-68
_ SeniorLeVel
Middle ILevel _-
; JuniorLeVel
_
Total _
SeniorLevel
--
f Middle _
LevelJunior
, Level Total
-Pure- Science-
_Architecture
Technology
Agriculture
-
-
308
-
-
271-_\
-=
-
1,020
, -
-
1,599
194
-
-
991
-
-
1,719
-
.
-
431 --
-
-
3,1-41
_
Total Science
and Technology
\: 1,793 991 1,719 431 3,141
Medical Sciences
Humanities
EducationFine Arts
LawSocial -Sciences
(1)-,
-
-
148
- .
84
-
_ -
43
-76
-
-
\ 115
_ .
4
253
-
-
306=
-394
664
-
188
-132
493
-
'102
-
100
32 _
-
-
-
-
-
: 1,1894-, "
, -
-
290
-
232
Total 2_,746 1_075 -,414__- 463 4-035
1 -)Excluding 186 professors of "Puericultura y San dad"- for whom data by _level were not available,

co
H
SPAIN Table VII.d
TEACHING STAFF IN VOCATIONAL SCHOOLS
BY FIELD OF SPECIALISATION
i
_ Full-time staff -4 Part= time stafft$ -_Total
Field of Specialisation1961-62 _1969-70 1961 -62 --_1969-70 1961_42 _ 1969 -70
1, Technical and Vocational
(lower level) -(Total)
-11,124 13,809
- "Formacion profesional
industrial"
,
8,343 _ 11,379
- "ComerciC" (Grade "pericial" 1
916 I 657
- "Artisticas"I
/ 1,551 1,092
- "Nautico-Fesquera" I 55 _ 389
- "Capacitacion Agraria"-- -
259 292
2. Technical and Vocational.
(upper level) (Total)/
4,729 5,140
= "Bachillerato Tecnico" f3,551 4,901
- Preparatory of the "Nonicas_
de Grado Medio" 1,118 -_ 239
Total -15 853 18 949
17'5

SPAIN
wr
Table VIII
EDUCATIONAL EXPENDITURE (1969)
At current prices
Type ofExpenditure
Primary SecondaryGeneral
.
Techni,m1and
vocational
_universityTeachers'Colleges
Non-.
type
eudca tion
Univer--expendituretitles
Other
foreducation(1)
Generalexpends-
lure.
Totalexpendi-
Lure
I. Central- government ------....-.-------'--.---.._;..-----
1. Current expenditure- 15,391 2,916 1,340 2,457 -1,400 23.504
- remuneration of
teaching staff 15.071 2,235 1,036 473 - 18,816
- other 519 e 681 304 1,984 1,400 4.688
2. Investment 4,535 3,939 1,430 2,273 848 12,825
3. Subsidies and
transfers '
4. Total Central
Government expendi-
ture for eaucntion .
ILIIIItate_edaeation
1. Current evpenditurc
- of ,hich: remu-neration 6f.
tkaJlang staff -
9, Inve..tment . _ _
1Ykor 41)mple, pre-piimary dducation, special education.
Source: IL Reer.rmh Edleattva en marcha %.plicaci61 de la Ley dc Educaciell 1971).p. in,

SPAIN Table IX
DISTRIBUTION OF UNIVERSITY STUDENTS
BY FATHER'S PROFESSION
Fathees profession(1) 4
Studente
1969-701959 -60
I. Professional, Technical
and Related Workers
II. Administrative, Executive
and Managerial Workers
- Govetnment
.- Other
111. Clerical and Sales Workers
- WOrking Proprietors
= Other
IV. Agricultural and Related Workers
- Farmers, Farm Managers
- Other
V, Manual Workers
= Skilled
SeMi-skiiled
- Unskilled
VI. Service Workers
VII. Others and not specified
Total
1) The seven occupational groups shown here correspond to
major and minor groups of the International StandardClassification of Occupations.
181

SPAIN
176Table X
DISTRIBUTION OF UNIVERSITY STUDENTS
BY TOWN OF PARMSI RESIDENCE
___ _
Towns of more than
loam() inhabitants
Population
Census
1960
_
Students
1960-61
Population
Census
1970
Students
1- 970 -7 -1
.
.__
---
Rest of the country
Total

SPAIN Table- XI
EDUCATION BY SECTOR OF ECONOMIC ACaIvITY:
NUMBER OF PERSONS WITH PNIVERSJTY DIPLOMAgqi EIELD BY STUDY
-- _Sector 1pf k
.,QA,uwi,.
Field of activity
study
1964
Industry(1)
OtherSectors
Totall-u1-.
.
7,-----,_mature
1970
Industry OtherSectors Total
x
ture
Pure Scierice
Architecture an
Technology
Agriculture
. A " 41
Total Science
and Technology
Medical Sciences .
Humanities and FineArts
Education
law
Social Sciences
. .
,
Total 400 14,600 95,700 110,700 1,000 30,200 130,300 161,500__.
1) Industry: mining, manufacturing, construction and elnctricity.
1`"'9

SPAIN
1E3 0
Table XI.a
EDUCATION PY SECTOR OF ECONOMIC ACTIVITY:
NUMBER OF PERSONS WITH NON - UNIVERSITY TYPE HIGHER EDUCATION1/4DIPLOMAS BY FIELD OF STUD
_ Sector ofeconomic
Field of activity
Study -.....
1q64 7Agricul-
lure0
1970Industry
(1)Other
SectorsTotalAglIcul-
tureindustry
(l)Other
SectorsTotal
.
/
Pure Science
Archi=tecture andTechnology
Agriculture
.
-.
..
Total Science..
and-Technology
Medical SciencesHumanities and FideArtsEducation
-
Law -
:oeialPciences
,
.
0
Tota1.
2,000' 40,100' 175,200, 2)7,300 3,400 57,800 211,600 272,800
1) Industry: mining, manufacturing, construction and electricity.

SPAIN Table XII
PRE-PRIMARY EDUOATION
.,. 1959-60 1969-70 1970-71'
`I. Enrolments .
273,676
)
'353,'400,
.
362,940a) Public schools
b) Private sehools(1) 198,179 412,780 456,974
II. Teachers .
.
)
i 13,336 9,351 ...a) Public.schools --
.- 1 b) schoolsPrivate schs 10,239
1114-Expenditure-13-
,
I 'a) Central Government
- Teachers
- Subsidies to local
authorities
- Subsidies to
private education
.
- Other
b) Private
- Teachers
- Other
_ _._
.
c) Local authorities ,
- Teachers
- Other
.
1) Including church schools.
.05
1d1

SOURCES
Replyof the Spanish authorities.
0.,
Estadistica de la Ensenanza Superior_enpub is e' by t e ationa(1950/51 to 1969/70),
Estadistica(1950/51 to
EstadisticaT1950/51 to
Es alianalitute o Statistics"
de la Enserianza Media1969/10).
de la EnseSanza Primaria1.969/70) .
en Espana (T,TI)
en EspaRa
1
Anuario estadistico (for the years concerned),
Nvel^rment r,f Fri hPr Edueatinn 1950-61 - StatisticalSurvey, OE' , 19/ .
Study .m Teachers - Statistical Data - Spain, OECD, 1969.
Dhtos cifras dei
la Ensenanza en Espanaor t e years concerned).
d
it
4
186
:182
ti

S
TURKEY
EDUCATIONAL CLASSIFICATION
1
The followNg educational levels..(and fields of study) are
.presented by reference to the "conversion key" for Turkey
(OECD classification).
1. Primary-education
The first five years of schooling covering the periodof
compulsory education.
2. General- secondary education
Education provided in:
- The "Ortaokullar" (middle schools) which are the first
cycle of the secondary general edudation (3-year period
of studie.
- The "LiseIer" (high schools) which are the second cycle
of secondary general education .(alsO of 3-year duration).
- The -"Imam Hatip Okullari" (Moslem religious teacher
training schools).
'3. Secondar technical and vocational education
Includes all technical and vocational schools at secondary
level as defined in the Turkish statistics ("Mesleki ve teknik
ortadgretim pkullari ") with the exception of the yeligious
schools men,ioned above under2 and the teachel-s colleges.
4. Teachers coneges
Primary teacher training education (Ilk 6gretmen oknllari ).
5. Non-university tyae higher education
See list.of the educational institutions included under
this title at the end of this note on p.189.
187 ,
183
a

sit
6. University type higher education
See list of institutions included under this title at the
end of this note on p.189.
NOTES ON THE TABLES
Table -I: EnrelmPrits by P.bloational 1Ave1 ana ,ear of age andenrolment ratios
Enrolments for children age "X" represents the num-J:1' of
children who had attained that age at the beginning of the
school year.
Table_III.a: University -type higher education:number=of candidates, new entrants and enrolmentsby field of-study
(The following definitions which apply to Table III.a,_ uni-
versity type higher tf.ucation, may be adapted to other
tables in which the defined terms are used. -)
- Candidates: all persons seeking admission tc university
typgrhigher education.
= New entrants: first-year students registered,for the
first time.
= Yield of study: the OD= classification of higher edu-
cation by field of study is given on the next page.
Table bistribution of university students by father's pro-- fession
The seven occupational groups shown in this table corres=
pond_to Major and Nino', Groups of the International
Standard Classification of Occupations (see p.254).
Table XI: Education by sector of economic activity:number -orToersons with university diplomas -by -fieldof study
The grouping by sector of economic activity is based on
the International Stan3ar9 IndlJstrial Classification of all
Economic Activities (ISIC) (seelp.255).
188
1S4

CLASSIFICATION OF HIGHER EDUCATION
BY FIELD OF STUDY
OECD Classification'
1. University Level
Edebiyat FakUltesi (Arts Faculty)
TUrk Dili ve Edebiyati (- Turkishlanguage and Literature) Humanities
-Tarih (History)II
.
Cografya_(Geography) Social Sciences
Pelsefe (Philosophy.) .HUmanities
Ilatik'Sark Dilleri (ClassicalOriental Languages) , i.
11
Eski On-Asyo Dilleri ve KUltUrieri(Language and.Civilisation of
_Asia- Mixfor)II
Hindolili (Indian Studies)It
Sinolofti.(Chinese Studies)t,
Arkeeloji tArehaeology) ,. w
Sailat Tarihi- tHistory of Art)11
Antropoloji (Anthropology),u
Rua -dili ve Edebiyati (Russianlanguage and Lit.rature)
11
Alman dili ve Edebiyati (Germanlanguage and literature)
11
Fransiz dili ve Edebiyati (Frenchlanguage and Literature)
It
Ingiliz dili ve- Edebiyati (EnglishLanguage and Literature)
II
Italyan dili ye Edebiyati (Italian%language and Literature)
Klasik Filoloji (Classical Philology)it
KUtilphanecilik (Library Studies)Rungaroloji tHungarian Studies)
II
Tiyatrco(Theatre) -.
rt
Arap ve Tars dilleri ye edebiyatlari(=Arab and Persian language ,
and Literature)II
-Eltleik dilleri vevedebiyatlari (Classical %
languages and Literature)It
Psikeloji (Psychology)U
Tedegoji -(Pedagogy)Education ,
Sosyoloji- (Sociology)Social Sciences
Sosyal Antropoloji ve Etnoloji(Social Anthropology and Ethnology)
I,
Arkeoloji ve Prehistorya (Archaeology
and Pre-history) Humanities
Ingiliz Filolojisi (English Philology)1,

Fransiz Filolojisi (French Philology)Alman Filolojisi (German Philology)
- Fen FakUltesi (Facu%ty of Science)
Matematik (Mathematics)Kimya (Chemistry)Eizik-(Physics) .
Tabiiye (Natural Science)Fizik Milhendis (Engineering Physicist)Astronomi (Astronomy)
Botanik
eoloji GeologyZooloji Zoology
BotanyJeofizik (Geophysics)YUksek Jeoloji (Higher Geology)Biyoloji (Biology)
- Siyasal Bilgiler Faktiltesi (Facultyof Political Science).
MAliye ve Iktisat BblUmil (Finance andEconomy Section)
Siyasi sube (International RelationsSection)
'dare bUltimU (AdministrationSection)
- Hukuk FatUltesi (Law Faculty)
- Iktisat FakUltesi (Faculty of EconomicScience)
Tip FakUltesi (Faculty of Medicine)
- Eczacilik FakUltesi (Faculty ofPharmacy) .
Die Hekimligi,FakUltesi ( Faculty ofDental'Medicine)
Veteriner FakUltesi (Faculty ofVeterinary Medicine)
- Ziraat FakUltesi (Faculty of Agriculture)
Topra\ Ilmi (Soil stuaies)Gene? LiraI bilgiler (General
Agricultural Studies)_Ziraat makinalari (Agricultural
Machinery)Hayvan yetistirme ve islahi (Breeding
and improvement of cattle)Tanis bitkileri yetistirme ve islahi
(Cultivation and improvement ofcrops and root plants) .
Ziraat ekonomisi Olgrieultural Economy)-Bahc bitkileri yetistirme ve islahi
(horticultureDv-ekohomisi (Dome tick contmy)Ziraat teknOojisi (Agricultural
Technol 0-Bitki sagl i (Plant Hygiene)
Humanities
Pure Sciences11
11
11
TechnologyPure Sciences
SOcial Sciences
II
'Law
Social Sciences
Medical Sciences
Agriculture
Pure Sole es
Agriculture
11
11
Social Sciences
Agriculture

Zooteknik (Zootechnics) Agriculture
- Orman FakUltesi (Faculty of Forestry)
- Kimya FakUltesi (Faculty of Chemistry -) Pure Sciences
Note: The chemical engineers'course,previously under the juris-diction of the Faculty of Sciencein Istanbul,is now under that ofthe Faculty of Chemistry foundedin 1966-67.
Etitim FakUltesi (Faculty of Education) Education
- Isletme FakUltesi (Faculty of BusinessAdministration and Management) . Social Sciences
Ilahiyat FakUltesi (Faculty of Theology) Humanitir,
- Istanbul Teknik Universitesi (TechnicalUniversity of Istanbul)
Baektrik-FakUltesi (Faculty ofElectricity) Technology
_ r- MOcina FakUltesi (Faculty of Mechanics)
Insaat FakillteEd (Faculty of Construction) "
Maden FakUltesi (Faculty ofMining)
Mimarlik PakUltdsi (FaCillty ofArchitecture) Architecture
Kithya FakUltesi (Faculty of Uhemistry) Technology
Macka Teknik Okulu (Engineering Schoolof -"Macke)
- Ortadogu Teknik Universitesi (TechnicalUniversity of the Middle East)
MUhendislik FakUltesi (Faculty ofEngineering Science)
Idari ilimler FakUltesi (Faculty of--AxiministratiVe Sciences) Social Sciences
Mimarlik FakUltesi (Faculty ofArchitecture)
Mimarl (Architecture) ArchitectureSehir ve bilge Flanlama (Town and
Country Planning)Restoration (Restoration)
Fen ve 2debiyat FakUltest.(Faculty of_Arts and Science)
Fizik (Physics)Kimya (Chew stry)Matematik(Mathematics)Sosyal ilimler (Social Sciences)
191
187
4
Fine Arts
Pure SciencesItIt
Social Sciences
C

- Yabanci diller yUksek okullari(Higher Schools of ModernLanguages)
- Hacettepe mezuniyet sonrasl egitimyUksek okulu (Secondary TeacherTraining College for Post-graduates at Hacettepe)
GUzel Sanatlar Academisi (Fine ArtsAcademy)
YUksek resim Urawing)_YUksek heykel (Sculpture)YUksek dekora%if -(Decorative Art)YUksek mimarlik (Architecture)
Deviet Konservatuvari YUksel: Kismi(Advanced Section of StateConservatory)
- YUksek IslAm EnstitUleri (HigheInstitute of Islamic Studies
YUksek Ogretmen Okullari .(Secon aryTeaqher Training Colleges)
YUksek Teknik Ogretmen Okullari(Secondary Technical TeacherTraining Colleges)
- Titaret Ye turizme YUksek OgretmenOkulu (Secondary Teacher TrainingCollege of Tourism,and Commerce)
- "Robert Kollej" Ybksek okulu (HigherSchool - "Robert Kollej")-
- YUksek denizcilik okulu (Higher NavalCollege)
2. Nod-University Level
Iktisad/ ve ticari ilimler acadetileri(Academy of Economy and Commerce)
Tatbiki GUzel Sanatlar YUksek Okulu' 1High.gx School of Applied Art)
Egitim EnstitUleri (Pedagogic Institutes)
Tekniker YUksek okullari (HigherTechnicians Schools)
YUksek sUglik okullari (Higher HealthSchools)
Veteriner yardimcisi Okulu (School forVeterinary Assistants)
BUlge orman ve ziraat okullari (RegionalSchools of Agriculture and Foreetry)
Social Sciences
Education
Fine Arts
11
Architecture
Fine Arts
Social Sciences
Education
11
11
According toSection
Others
Social Sciences
Fine Arts
Education
Technology
Medical Science
_Agriculture
11
A v

Sosyal tizmetler academisi (Academyof Social Services) Social Sciences
Polls enrtitUsil (Higher PoliceInstitute) Others 1
Harp okullari (Higher Military Schools)
GazetecIlik okulu (School of Journalism) Social Sciences
Meek teknik okullari (Higher TechnicalSchools)
11
193
Technology \

LIST OF 1.kELES
I. Enrolments by educational level and year of age andenrolment ratios 196
II. Enrolments 197
II.a Number of students in private schools .... .....
II.b Number of female students in public and private schools198
II,c Enrolments in the first and the last year of studies 199
Il.d Enrolments in secondary general education -- 200
III. New entrants _ 201
III.a University type higher education: number of candidates,nee: entrants and enrolments by field of study 202
III.b Non-university type higher education: number of candi-dates, new entrants and enrolments by field of study 203
IV. Higher education: number of female students by fieldof study 204
V. Higher education: foreign students in the country andnationals studying abroad by field of study 205
VI. Graduates 206
VI.a University type higher education: number of graauatesby field of study (1st degree of studies) . ... . . 207
VI.b Non-university ;fp° higher education: number of gra-duates-by field of study (1st degree of studies). 208
VII, Teachers and professors by educational level 209
VII.a Teachers and professors in private schools by educa-tional level 210
VII.b Teaching staff in universities by status and field ofspecialisation 211
711.c Teaching staff in non-university type higher educationby status and field of specialisation 212
VIII. Educational expenditure 213
IX. Distri,ation of university students by father'sprofession 214
194

X. Distribution of university students by town of parents'residence 215
XI. Education by sector of economic activity: number ofpersons with university diplomas by field of study 216
XI.a Education by sector of economic activity: number ofpersons with non-university type higher education dip-
lomas by field of study 217
XII. Pre-primary education . 218
Sources 219'
t
195

TURXEY
11)2Table I
ENROLMENTO BY EDUCATIONAL LEVEL AND YEAR OF AGE
AND ENROLMENT RATI%.%
Yearof
AgePrimary
S condary,eneral
Teohni,a1and
vocational
TeachersuColleges
Non-universi *
type highereducation
I T dyST S itYTotal
enraments PopulationEnrollentratios
-7--
7----8
1011
1213141
,
1
17--Tr----
. ,..
17-20_21
222324
26-
2728
30 andover
%
-
Total

TURKEY Table II
ENROLMENTS
Year Primary.Secon,-dar -y '
General
TecAlnioreachers,' and voca-tional
Colleges
Non-
-type higheeducati9
, ,-
sity
-
Totalenrolments
=
195'9=60
1960 -61
1961=62
1962=63
1963 =64,
1964-65
1965,66
1966=67
1967 -68
1968=69
1969,70
1970 -71
i 2,514,592
2,866,501
3,147,146
3,370, 679
3,562,140
3,769,-2823,971,939
4,273,977
4,509,433
4,736,867
4,89'i , 590
5,011,926
321, 400
371,446
. 02,7095
446,243
456, 347
463, 1.53
537,032
675, 459
779,897
862,503_
966;841
I, 113, 913
71,830
79,218
82 ,501
85 ,793
101,821
107,873
109,818 _
117867-
____116 ,521
115 ,595
124 ,622
129,815
21,141
23,31,6.
26,725
31, 8476 - ='
3605-0
,42, 295
47,946
54,469
57,788
60,758
62, 584
64, 949
130156
18,609
17;_771
21,635
25,787
25, 686° )
34,86p)
42, 982)12 -5
125,647
143,279
147,
61, 478
42,037
48;081 .,
54,428 _
52 ,711 E
54,356 _
59,865
63,667 I
67,195
000
1 95, 425
2,-984,196
3,407,171
3,740,666
4,008,908
4,236,581
A468,154
4,765,268
5,231,954
5,589,286
5 ,919 002
6,193.637
6, 477, 506
1) Excluding students of Agriculture.2) Excluding students of Agriculture and Medical Sciences. .
Sources; From 1-959-60 to 1967-68, Turkish General Statistical Yearbooks.
From L968-69 to 1969-70, Turkiyede Sayisi 1960,_197477
For 1-970-71,, Milli E9Itim 1:statistikleril 0retim vill Basi 1970-71-
Replies of the Turkish authoritie-s.

TURKEY Table II.a
SCHOOLSNUMBER OF STUDENTS'IN PRIVATE
Level of Education 1959-60 1970-71
Primary 24, 785 24,349
Secondary General 22, 897(1)
42,4940j
Technical and Vocational 1,7372) 1,3342)
Teachers' Colleges
Now-university typehigher education
40,231University
Total 50,329 _ 1084_13
11 Excluding religious schools.
2) Imam schools, 1st and 2nd cycle of commercial schools, nursesschools, technician schools and schools of journalism.
Table II.b
NUMBER OF FEMALE STUDENTS IN-PUBLIC AND- PRIVATE SCHOOLS
Level of Education
-Primary
Secondary General
1959-60
Technical and Vocational
Teacher's' Colleges
Now-university typehigher education
,T_o_tal,
= 931,794
80,191
2'7 ,902
5,292
(1 ,300)
9,810
1970=71
2,120,332
: 290,370
1,056,289
51_i 6-18
30,427
9,148
22,147
2,524,042
4.

TURKEY Table II.c
ENROLMENTS IN THE FIRST AND THE LAST YEAR OF STUDIES
Level Education
__
1960-61 1970-71
ofFirst
Year
-
last
Year__-
.
First
Year
last
Year
_ .
Primary
Secondary General_
Technieal andVocational
Teachers' Colleges
Non=university typehigher education
University
IDS

TURKEY Table II. d
ENROLMENTS IN SECONDARY GENERAL EDUCATION
Year = lst cycle
"Orta Okullari"
2nd cycle
"Liselet"
Ecclesiastical schools
-"Imat hatip okullari"(Orta Okullari ye lise)
Total
.
1959 -60 254,966 62,368 4,066 321_4400
1960 -61 291,266 75,632.;., :
4,548 371 :446
1961 -62 318,138 = 88,582 . 5;37,5 ,. 412,095,-
1962=63 337,816 _ 101,387 7,040 446,243
1_96344 3444139 102_i-384 9;824, = . 4564347
1964 -765 354,257 97;935 1-0,961 4634'153
1965 -66 412,373 111-081 134478 537,032
1966-67- 515,337 _ 139,91-4 20,208 675,459
1967768 590,408 160,357 29_,132 779,897
1968-69 6424963 181-,577 37,963 862,-503
1969 -70 _ 7114008 , 2,11_,982 43,851 966,841
197041 . 810,893 253,712 49,308 : 1-013 ,913,-
197_1;772:, ,-

O
TURKEYs
Tahla III
NEW ENTRANTS
Year Primary -; SecondaryGeheraIM
Technicaland voca-
-tdonal ==
Teachers'- ,,universityColleges =ty_pe
Non-
higher_education
Univetsity
1959 -60 =
.
1960-61 657,179 _ 145,493 36_:465 5;554
1961 -62 696,708 __ 152,153 41,342 8,356
1962-63 669,976 156,388 50,919 10,184
1963-64 669,726 152,222- 66,556 9,685 s
196445 713,587 174,807 65,908 14,458 a.
1965 -66 735,881 221=,276 63,850 13,904 11-,9092)
16,046
1966 -67 888,985 272,590 -61-,874 15,872 15,2732 T. 15,077
196748 -873,566 208,611 39,711 19,172
1968-69 892,701 228,189 44,697 19,871
1969.=.70 892,782 264,718 45,090 16,878
1970 -71 / 938,156 301,724 55,242 17,759 22,174 17,619
1-) Excluding religious sclools.
2) Excluding new entrants in Agriculture-
Source :Istatistikleri, 1961-6, 1965=67, 1970-71 (Deviet Istatistik Enstittisti),
Development-of Higher EduCation,-1950-1967,-0E0D, 1970 . /
Replies of the Turkish authorities.
1.9,7

TURKEY
I 8Table III.a \\ 9
UNIVERSITY TYPE HIGHER EDUCATIkl\.
;LIMBER OF CANDIDATES, NEW ENTRANTS AND ENROLMENTS t FIELD OF STUDY
Field of Study Candidates New Entrants Enrolments_
1959=60____ :1970-71=--= 1959=60 =s1970-71 1959=60 -= 1970=71
Pure Science 423 1,976 ,.)..925 10,136
Architecture 262 _ -2 .
Technology t, 3563 769 2,63
\0 \ __ '
19 497
Agriculture _= 915 878 3,578 \ I 4,681
Total Science
and Teehnolory 2_,956_ 5,745 :-1a,645 4,314
Medical Sciences 1,254 _= 5,000 4_,976 -: 2856Humanities . ... 1,722 '5,154 11 -,64\0
Education-,
,- 763 1,249 = 3,61___---
Fine Arts , --_. 431 550 = 1,716
Law :: 1-v443.: __ 12,501 1-4,557'
Social Science ... = 1,457 i 4,753 i - 8,556Other ... 58 209 214__.
Total
__-,_ _- 17,619 = 42,03I 95,425

fuj0
TURKEY- Table !Mb
NON-UNIVERSITY TYPE HIGHER EDUCATION:
NUMBER OF CANDIDATES, NEW ENTRANTS AND ENROLMENT.; BY FIELD OF STUDY
_ ___ ____,_ _ -Field of Study Candidates
- -- -- -New Entrants
_t__ _ .........
.0 Enrolments
1959-60 ii /970-71 -i _1959-60 -i 1970-71 1959=60 1970-71
Pure Science - -
Architecture ' - ., ..
Technology ... 6-000 2,293 19,279
_Agrleulturo.
330 -.. 601 .._:
Total Science7
and Technology. .
(1)64300 2 894-/ 19-79P)
02_ -.-
Medical Sciences 155 175 579 356
Humanities - - -
Educatin - 2,639 1,775 6,722
Fine Arts - - -. -
Law - - - - I
Social Science ... 12,884 7,948 34,617
Other - 176 - 497
Total -,. 22.174 13-096 61-478
1) 'Excluding students ofAgriculture.

TURKEY
r"-^trin-(3 44
Table IV
HIGHER EDUCATION:
NUMBER OF FEMALE STUDENTS BY FIELD OF STUDY
Field of Study UniversityNonuniversity type-higher educatibn ,
1959-60 1970-71 1959=60 = 1970,71
Pure Science K
Architecture
Technology
Agriculture
1 a57
87
91
371
2,367
1 ,528
375
-
-
-
_30
..-
-
- .
1,405
...
Total Scienceand Technology
2,306 4 ,270 ._.,_ . t,405 °
Medical Sciences
Humanities
Education
Fine Arts
Law
Social Science
Other
1,022
2,584
638
135
2,492
633
6,965
4,593
1-,523
606
2,746
1,444-
..,
...,
227
=
-
392
-
299
-
2,353
-
-
, 4,259
,7
Total 9,810 22 147 / z.-/ 8,323
1= Excluding students of Agriculture.

TURKEY Table V
HIGHER EDUCATION: FOREIGN STUDENTS IN THE
COUNTRY AND NATIONALS STUDYING ABROAD
BY FIELD OF STUDY
Field of Study
Foreign
students
Nationals
studying abroad
1960 1910 1960 1970
- Pure Sciences 604
Technology 1,944
Medical Sciences 1,442
Other 1;940
Total - 5,930 -
205
201

11.)
0
TURKEY
202
Table VI
GRADUATES
Year Primary
Secondary General_Technical =
and voca- ,, Teachers'
Colleges
11,16n=.==univer--,sity-higher
--
type
= education=u"
University_-First
ofstudies
,,
,1st Cycle:: 2nd Cycle:tical
lEccleSias,_
schools -,tional
--.
1959 -60 283,790 ,__- 40,253 10,913 ,: 745 _= 18.829_ :,225 2,705 == 3,953
1960-61 304,406 42,674 11,977 .,: 701 18,323 '4,362 2,196 : 4-,020
1961-62_ '330,591 50,707 14,241) 778 19,907 - 5,150 3,156 = 4,518
1962=63 362,354 58,151 ::16,915 885 19,803_ 6,409 3,337 4,519
1963 -64 391,989 66,661 1,9,578 1,017 21,647 7,955 3,709 5,437
1964-65 447,933 73,986 23,227 1,1-A7 . 23,582 8,443 _4,008 : 6,032
11965=-66 510,397 79,583 24,795.i- -1,598 25,068' 9,729 4,268 ; 6,488
1966,67- 541,024 85,590 26,067 : 44207 31,096 1-1,622 5,775 s= 7,120
1967=68 549,464 86,388 26,536 2,727 29,002 16,558 8,163 7,500
1968=69 625,226 115,549 30,494 3,097 28,926:- 16,643 7,857 9,464
1969-70 718,01-2 ; 127,740 32,780 3,926 I- 30,663= 16,339 -10,917 10,234
1970=71 754,265 148,593 -43,459 6,696 32,033, 17,600 =12,084 10,933

ro0
TIIREEY Table 'II .a15::IVERSITY TYPE HIGUER EDUCATI0N
1110 4BER OF GRADUATES BY FIELD OF 'STUDY(1st degree of studies)
Field o: Study 19s9r60 1960-51- 1961-62 =1962-63 1963 -64 1964r65_ 1165,66 -1)66-67 =1.)67-(-2 -1,68-0 -190-70v 1970=
Tare Science 182 243' 291 384 349 71)0 541 596 776 'j93 1 ,234
Architecture,
rechnolocy
105
417
116-
473
117
445
86
348
84
419
90
475
84
419
69
476
105
438
217
906
157
697
Ae.riculture -50 503: 642 583 623 733 639 817 847 680 632
Total scienceand Technology
-1_,268 1 ;335 1 495 1_,101 1 ,47,, 2 ,cre- 1 ,683 1 ,958 2 ,166 2 ,696 2_820
relical Sciences 760 792 775 662 672 787 1, 011 1, 028 1, C6(7 1, 242 1, 102
Itumaniti ell 305 323 375 425 623 1,-069 1, 536 1, 556 1, 158 1, 151 1, 074
E tucation 269 195 309 405 6:36 420 452 633 695 851 1,026
Fine xrTa 135 135 138 180 594 273 164 192 192 183 209
law° 762 761 845 802 789, 613 k,16 1, 059 979 1, 323 2, 030
Z:r.iul ._iencek_ther -a
422
32
W,
57
556
4:,
-,7,3
66
7t,7
41
745
37
782
44
635
59
1,164
96
1,946
72
2,016
57
T.tal 3, 9 4, 220- 4 ,518 4, 519 5, 437 6, 032 6, 486 7, 120 7,500 9,_464 10, 234
203a
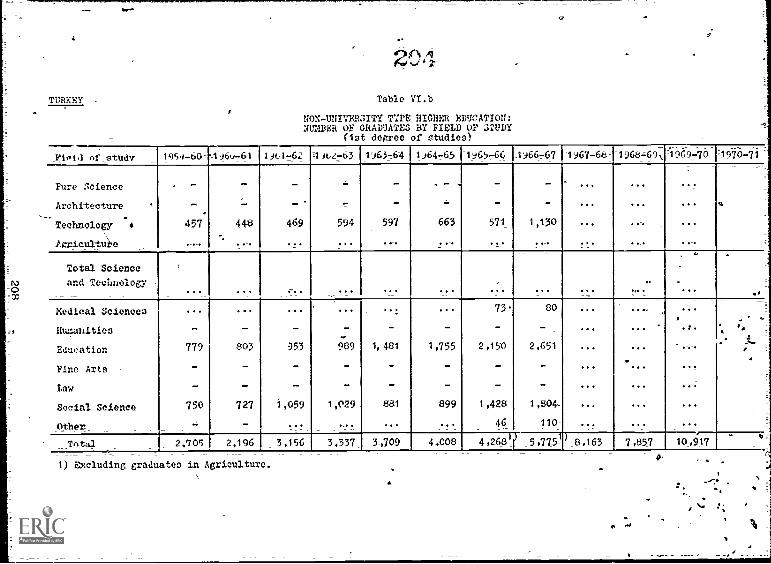
0
TURKEY
20Table VI.b
NON-UNIVERSITY T;TE HIGHER EDUCATION:NUN/ER OP GRADUATES BY FIELD OF STUDY
(1st degree of studies)
Yioid of study 1959-60-1J60.761 1961-62 E1A.2763 1)63-64 1)64-65 -165-66 1)667.67 -1967-68:1968=690969770 =1970-71:
Pure Science
Architecture-
Technology
ixriculture
-
457
---
448
-
469
...
.1..
594
...
-
597
..-
663
..-
571_
...
-
1,130
..-
...
...
--
..,
.,.
..-.!
...
Total Science
and Technology -
... ... :-.. ... ... ... ...
. .
..,_
Medical Sciences
Humanities
Education
Pine Arts -
Law
Social Science
Other
...
-
779
-
750
-
.
803
-
727
-
...
353
-
-
1,059
...
-
989
-
-
1,029
-..
...!
1, 481
-
-
eal
...
.
1,755
-
899
...
73
-
2,150
-
1,428
46
80
.
2,651
-
1,504-
110-
...
...
...
...
...
...
...
...
...
...
...
...
...
...
.s.
---.
..!
.-.;
...
...
.. '.
1.
Tntal 2.705 2,196 3,156 3,337 3,709 4,008 4,268_ 5,7751 _8,163 7,857 10_,917-A,
1) Excluding graduates in Agriculture.0,

TURKEY Table VTI
TEACHERS AND 'PROFESSORS BY EDUCATIONAL LEVEL
Level of Education Pu 11=tine staff z Tart-time staff1
Total
1959-60_. 1970=71 _ 1959=60 [ 1970=71_ _ 1959=60 1_970,71:
Primary
Secondary_-- -General
.
.54,049
15,138
132,577
3%984
Technical andVocational_
,
'
6_,209. .
a
. 10,882
Teachers' Colleges
Non - university typehigher edudation
University
. 872
970
3 _161-_ ,
!
2,610
2,378
8,_249
'
Total 80, 399.
= - 10,A80
00
Sources: Turkish General Statistical Yea-L.1000k 1a59-6o.
Milli Ekitfm _Istatistikleri _(8Aretim 1970-71._
211:"
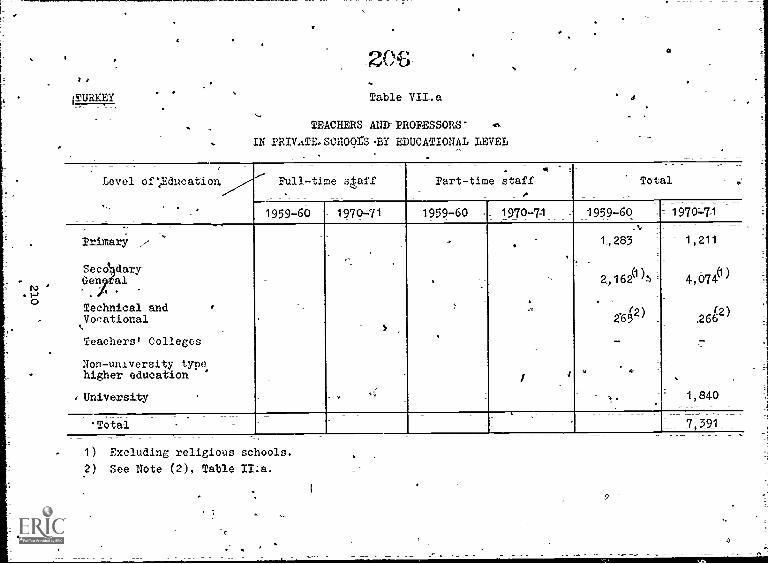
ANJRKEY
2 0
Table VII.a
TEACHERS ANDrPROFESSORS-
IN PRIVATE0SCHO6rS.BY EDUCATIONAL LEVEL
Level of*Aducation.,,,,../---
Full-time gaff. ,-
Part-time staff
'
Total
1959-60 1970.=71 1959 -60 ,_ 1970-71 1959-60 , 1970=71
Primary .,
SecidaryGen; al
Technical and .
Vocational,
Teachers' Colleges
Non-university type,higher education
University '
s
,
.
t,283
2,162(1- )=
.
2642)
.
.:=
t,211
4,0740)
42-)66
.
1,840
' Total z
__ _____ _ __
I_ 7,391_
1) Excluding religious schools.
See Note (2), Table II:a.

Table VII.b
TEACHING STAFF IN UNIVERSITIES BY STATUS AND FIELD OF SPECIAIISATION
Field ofSpecialisation. .,,`.Senior,
-- ----
1959760 1970-_.71
IeveliDeVel'_=Middle ,- Junior_`
LevelTotal:- Senior,
, levelMiddle I_Level i=
Junior ,ilevel
Total
Pure SCience
,Architecture
Technology
Agriculture
- 272
77_
316:
376:-
153
454
247 =
54 :
628.
43
'P5
t,154
_ 310
532
/2,236
600
Total Science
and Technology__. .
----..
0
-01,041 _
..,,,
854- -E -125 iz- 1;789 = 3,368
Medical Sciences
Humanities
Education
Fine Alp
flawSocial Sciences
Other
1,114
330
207 ,,
100:
132-
208-:
29f
761
225
16
114 =
14-1
103
1
550 ;=
79 -E
"39
'33
6
62
9 ,-
1,928 -I
215
240 ,
98 :
72 .
168 _
21 :,
3,239
519
295.
Q245)
219
333 .
31
Total . -. --. ... 3,161 -_ 2,215 1,5 03 . = 4,531 --=
_
8 249!
Senior Level,:
Middle _Level:
Junior Level:
"Ordinaryfts profes8r" (extraordinary professors), "Profesdr" (ordinary professors),
"Docent" (associate professor)."Ogratim OrevIisi"(full-time lecturer - who has not the status_of assistant,
associate and full professors) "OkutMan" (lecturer), "Unman" (experts).
"Asistan" (assistants), "Ogretmen" (teachers), "Vekil Ugretmen" (part -tiiue teachers).
(These last two types of staff are teaching from the primary level up to university
207

TURKEY
0 STable VII.c
TEACHING STAFF IN NON- UNIVERSITY TYPE
HIGHER EDUCATION BY STATUS AND FIELD OP SPECIALISATION
Field of Specialisation
1959-60 1970-71
= Senior --Middle= Level =Level :
= JuniorLevel
:
Total ==Senior =-
Level --LevelMiddle_
:-
Junior E=bevel_ ]E_Total--
Titre Science .7-
Architecture - - -7 = -
Technology 1 0.233 519 414 fl11166
Arriculture ... ---.. -,"
Total Science and
Technology _457 = 233 519 414 ==1,16X
Medical Selences . 2'4 49 31_4_104--
Humanities 7- 7. - -
Education 4 : 21 '399 i 424
Fine Arts -;-
-' -
Law
,Social Science
-
291
_
248
-
1110 - 649
nthc.r 7 .-. 28 -= 35
_Total ... .,- I_ 970 = 559 ' 837 982l)
-2 57u-, _
1) Excluding-teachers of Agriculture.
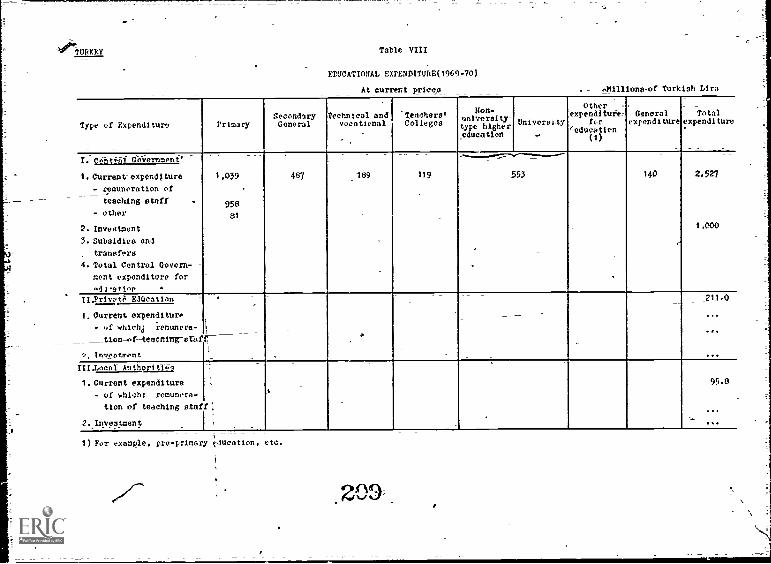
Table VIII
EDUCATIONAL EXPENDITURE(1969-70)
At current pricen_ .,Millions-of Turkish Lira
Type of Expenditure PrimarySecondaryGeneral
Technical andvocational-
Teachers'Colleges
U on-universitytype highereducation
-11 niversitY
.
Other =
expenditure-for
ieducatien(1).
Generalexpenditure
Totalexpenditure
I. central Government'
1,039
958
81
497 _189 119
_ .......__......,,,-----__--
553 140 2,527
1,000
%Current-expenditure
- remuneration of__..
teaching staff
- other
2. Investment
3. Subsidies and
transfers
4. Total Central Govern-
cent expenditure for
di-etten
II.Privot; EdUcation ' 211.0_
...
...
%Current expenditure
- of whichs iemuners-
_Lion-of-teucning-alaff
".., Tnvontrftnt
EILLocal- Authorities
,
,
95.0
...
1. Current expenditure
- of which: remunera-
Lion of teaching staff:
2. Investment
1) For example, pre-primary education, etc.
20 9

TURKEY Table. IX
DISTRIBUTION OF UNIVERSITY STUDENTS BY FATHER'S PROFESSION
O
Father's profession(1) Students
1959-60 1969 =70Technical and Related Workers
II. Administrative, Executiw. and Managerial Workers
Government--4.
r Other
III,- -Clerical and Sales Workers
- Working Proprietors
- Other
-
IV. Agricultural and Related-Workers
= Farmers, FarM Managers
-= Other
-i
V. Manual Workers
- Skilled
= Semi-skilled
- Unskilled
VT. Serviee Workera
VIT.__ Others and not specified_
TA-tal .
The seven occupat ona groups -s own ere correspond to -mayor and minor groups of -theInternational Standard Classification of Occupations 0
=

TURKEY Table X4
DISTRIBUTION OP UNIVERSITY STUDENTS
BY TOWN OF PARENTS' RESIDENCE
Towns of
more than
100,000
inhabitants
Population
Census-
= 1960
Students
' 1960-61
Population__
Census
1970
4
Students. ,
1970-71
-
.
_
Rest of the -'Country
Total '-. __
215

TURKEY
2
Table XI
EDUCATION-BY SECTOROF-ECONOMIC ACTIVITY:
_NUMBER OF PERSONS WITH UNIVERSITY DIPLOMAS BY YIELD OF STUDY
-Sector ofeconomic
autiLA1Fiel=d_of study
1960_ . _ _ ___
------ -- ----- -1970
Agricul--ture
Industry(=1)
-: Other= Sedtors;
-Total=
= Agricul-E-ture-=
Industry :
= (1)Other t
Sectors E
: Total
Pure Science 1.34== 3,-584 6,944- == 10,662
=Architecture 17 = 2,698 ; = ,5,376 - i .8,2_91
Technology t - 894- 3,305 E= 4199=
Agriculture 3,930 11 00I 7,599==E 12,539
Total Scienceand Technology-: i -44081 8,186-:- 23,424- 35,691
Medical Sciences 117 754 = 22,827 : -23,-698-
Humantties 7 231 = -5,300 = _ 3,-338-
Fine Arts - 6 ;- 363 -i 369-
Education,' 6 4 534 f 1,979- : 2,319-
law 176 718-_ 20,001 = 20,895
Social Science 41 1,720E_ '9,497 =: 11,258-
Other 354-- 1,109 10,309- ; i 11,7,72/'"_
Total 4,382 13,278 93,700 i i 1/1,760:
1) Industry: mining,= manufacturing, construction and electricity.

_ ----- TURKEY Table XI.a-
EDUCATION _BY SECTOR OF ECONOMIC- ACTIVITY:
NUMBER -OF P1RpONS WITH-NON-UNIVERSITY TYPE
HIGHER- EDUCATION= DIPLOMAS BY -FIELD-OF STUDY-
Seater ofeconomic
a_ctivity_
=Fi-eld- of study=
=
1960
.
. 1970: _
=-AgriculVture =
Industry -
= (1)-= Other= Sectors °=
=_Total _
,Agricul-ture
Industry(1)
-OtherSectors
= Total_=
-Pure Science
Architecture
Technology
Agriculture
-------Total ScienceandTechnology-
---.
Medical Sciences(Humanities
-Fine Arts
Education .
Law
.Social Science
Other__ __ _
_ _
Industry: mining, manufacturing, construction and electricity.
213

TURKEY Table -XII
PRE-PRIMARY EDUCATION
1961-62 1970-71
I. Enrolments
a)-Public schools____
172
b) =Private schools 2,720 I 4,029
II. Teachers
.. 7a) Public schools
blPrivate schoolS 102, 178
III.. Expenditure
a) Central GovernMent
= Teachers
Subsidies to local
authvities
- Subsidies toTrivate
education
- Other
b) Private-
= Teachers
Other
c) lonal authorities-
, Teachers
4==Other
218
SOURCES
Replies of the Turkish authorities.
Statistical Yearbook of Turkey (1959-60 to 1967-68).
Turkivede_Sayisi _(1960-71).
lAilli,Egitim Istatistikieri _(Devlet Istatistik Enstittisti)
(1961-1965,-1965=1967,_-1970-1971).
Development of Higher Education 1950-67 - StatisticalSurvey- OECD,= Paris, 1970.-
219
21..5.

YUGOSLAVIA
EDUCATIONAL CLASSIFICATION(1)
The following educational levels (and fields of study,) -are
presented by reference to the "conversion key"- for Yugoslavia-
(OECD ciassilication).(2)-
1 =._ Primary education
Eight years of schooling covering the period of compulsory
education.
2. General- secondary -- education
Four-year courses in the "Gimnazi3e.
3. Secondary-technical and-vocational education(3)
All technical schools giVe admiebion to higher-education
The establishments included are:
- -"Tehnicke i druge strucne skole" (Technical and other
vocational schools)_,
- "Opstetehnince-gkole" (Technical general education
schools) (after 1967-68),
) In Yugoslavia, a number of -"school centres " -provide die,ferent types of education (Secondary-general education,technical-and:vocational, skilled worker), Data-on enrol-ments in these centres (and other relevant data-such asnumber of-new entrants and graduates) -are included in thecorresponding educational levels, as _presented in thisreport.
2) With the exception of _primary education for which theYugos]av definition was retained ( -the eight-year primaryschool),
-v
3) The- schools for training skilled workers=("Skolbriakvalifikovane radnike") have not been included here becausethey_provide a "complementary"- technical and vocationaleducation. It should be noted, hoWever that these schoolsare attended-mostly-by "young students"-,(age 15,21). Datafor these schools can be found in Table XIII.
220
9.1E6rw.A.

- "Umetnince 'Lkole" (Schools of Pine Arts).
v_
- '"Skole za ostali strucni kadar" (Other schools for the
training of high-level professional staff).
4. Teachers colleges4
"Skole za obrazovanje nastavnike" (Schools for the traiii--
ing of teacher6).
5. Non-university type higher education
Post-secondary two-year schools ("Vie ;.kol-e"), See list
of thebeeducational institutions at the end of thib note on
p. 223.
6; University- -type higher- education
institutions prong courses from three to six years:
- 11Yakulteti" (Faculties)
- "Visoke ''Lole" (Higher Colleges)
- -"Uthetnine akademije- (Fine Arts Academies).
See list of these institutions at the end of this note on -p.
223.
NOTES ON THE TABLES
Table I: Enrolments by-educational level-and_year of age-and
enrolment ratios
Enrolments for children age "X" represents the number
of children who had attained that age at the beginning
of the-school year.
University type higher -- education: -- number of
candidates, new entrants -and- enrolments box
field of study
(The following definitions which apply to Table III.a,
university type higher education, may be adapted to
other-tables in which the defined tcrms are used.)
- Candidates: all persons seeking admission to
university type higher education.
- New entrants: first-year students registered for the
first time-.
-1 221

- Field of study: the OECD classification of higher
education by field i study is given on p. 223.
Table VII.a: Teaohlnp! .taff it nrivergii-i, by tatu-_ard
field of specialisation
- Senior level (S.L.): full and equivalent professors.
- Junior -level (J.1.): assistant lecturers, auxiliaries
and other equivalent university\teaching staff.
- Middle level (M.I.): those who do not belong to either
of the-two above-mentioned categories: lecturers,
senior lecturers, assistant professors-\
Table TX. Distri-butimn nf students bv_fathris prnfe,sinn. ,
This table was completed according to the Yugoslav
definitions of the occupational groups. \For future1
work, however, and for the purpose of intefnational
comparisons, it is suggested that such classification
correspond to the Major and Minor Groups rf the
Tnternalional Standard rlassi-finatinn_nfonn nations.-
as shown on p. 254. -.
Table YT Fd11,-ati,11 by ypotnr_nf prrInnmin antivi-ty number
of persons_ with university diplomas by field-of
study
The grouping by sector of economic activity is based on
the Internatinnal Staniard,Industrial frlaseifination_of
All-Economic Activities (Isle) (see p. 255).
222

CLASSI.PICATION OP HIGHER EDUCATION
BY FIELD OF STUDY
1,_ University- level
Fakulteti (Faculties)*
Filozofski (Philosophy),- Filologki (Languages)- Prtrodne-mgtematioki
(Natural Sciences and Mathethatics)- Prirodho-mateMatki i tehnologki
(Natural Sciences, Mathematicsand Technology)Za fiigku kulturu (-PhysicalEducati-on).Pravni (Law)
- Ekonomski (Economic)Travnorekonomski (Iaw-Economics)'
- FakUltet_politiaih nauk:a.-(Political Science)oljbprivredni (Agriculture)
- Sumarski (Watervays and Forestt)- PoljopriVrednoz.sumaraki
(Agriculture,Waterways and Forests)4 - Veterinarski eterinery Medicine)
- Biótehnigki.(OBiotechnolbgy)---Medicinski (Medicine)- StomatoloIki (Stomatology)= Farmaceutski (Pharmacy)- Farmaceutsko-biohemijski
(- Phartacy-BiochemistrA- Tehhicki.(Technoiogy)Arhitektonski (Architequr6)
- Arhitektonskozwrbanisticki(Architecture 'and ToWn Planning)
- Athitektonsko-gradjeVinski-geodetski(Architecture- Building andOonstruction-Surveying)Gradjevineki (Building andConstruction)Gegdetski (Surveying)Ma5inski (Engineering)
- Maginsko-brodogradjeyni'(Engineering-Ship Building)
1-.Saobradajni kTrauuport)Elektretelwnki (E16ctrotechnies)
- Elektro-masinski (Electrotechnics-Mechanics)
- laektronski (Electronics)
223
219
.
OECD _Classification
HutanitiesHumanities
Pure Sctentes
Pure Sciences
BducationLawSocial SciencesLaw '
. -Social Sciew,,sAgricultureAgriculture
- AgricultureAgricultureTechnologyMedical.SciencesMedical'ScienceaMedical Sciences
-Medical SciencesTechnoloArchite ture
Architecture "
Technology
TechnologyTechnologyTechnology
TechnologyTechnologyTechnology
TechnologyTechnology

-.Hemijsko-tehnolovski.(IndustilalChemitv)
- Tehnoloyki (Indusqial Technology)- Tehnolosko-metalurski
(Technology-MetallurgyMetalurski (Metallurgy
- Rudarski (Mine;)- Rudarskogeoloyki (Mines-Geology)"- Rudarsko-geolosko naftni
(Nature and Petrglbum Working')Rudarsko-metalurbki"(Mines-Metal;Vrgy)
- Tearoski prayoslavni'(OrthodoxTheology)
- Teologki_katoliCki '(Roman CatholicTheolo,gy)
Viboke.lkoie (Highen Colleges)/
- -Upraima--00ernment =Administration)= Pedag;oka akademija_0(Pedaegic
AcademiesDefektolo4ka-(Teachem for -spedialsdho.O1E4 .
=-2614zaka,(Music)= Induatrijsko7pedagogka ( Teachers
in_Induqtrtal Schools) 0
Za--fiziZku kUlturu (PhysicalEducation)
= SPoljne trgOvine (Foreign Trade)la:tue74-_-jalna(Commetcial Eb`onomics)
OECD classification
TechnologyTechnology
Technology 1Technology.-Technology
. Technology
Technology'
Technology
Humanities
Humanities
SoCial Sciences
-Education
EducationFine /tits
Education------
Education ,=---
Social Scrences'Sciences.
,
Umetnicmke-_akadami-je (Academtes,of=r ne,TOTETT --Y: - -,-.7""'""""' ,- ___,-
- -Akademija-likovnih umetnosti,--- 4
(Fine Arts Academy; - -,---'-- Ilne Arts- Ptimenjenfh uMetnosti (Applied Arts) line Arts-t.-MuziCka--(gusio) . 0.. Tine Arts=-Za_pozorihnu-Umetnost;cillm, radio
i televiItju (D#Amatic Art( Film,Radio, Te;eviel )"
- Za-pozorisng omen Dramatic Art'
2.i Non-univerofty f` ,'Vise rakole (Post-Post dchoole)
lage-akoie a.snremanfe nastaynikt;(Post--seconadry-teachentraining'_-schools),- -' -----w,---
- Tedagogkaakapemila (Academy ofEducatitn'i * Education
- Via pedagobka-bkole (Special,-education) y Education
- VigajedagAka--tkola=za-kon MII:Pto,doOcInatya (Home ,-xconomics)-
:"0'7
Educationq
.
- -Visa skola- za flzlcku kultur(Physical Education) ',0 Education
1
Fine ArtsFine -Arts
224

Vise pravn _i_uoravne_vskole(Post- secondary schools of-Lawand-Admiristration)
- Viva pravna skola (Law)- Visa upravna 'hole (Administiation)
Vise ekonomske gkole(Post-secondary schools cif Economics)
- Visa ekonomska ;kola (Economics,Finance, Bookkeeping, Internal andExternal Trade)
- Viga ekonomsko-komercijalna 'kola( Economics dr4 Corperce)
- Visa statisticka skola (Statistics)
Vis_ve_turistigke-i_ugostiteljske gkole(Post- secondary = schools = for- Dourismand= Hotel_Trades)
- Viga turistigkaikola (,Tourism)- Visa-turisti6ka skola ekonomskogsmera (Tourism-Economics)
Vise saobradajne-i-PTT gkole"Dost,secondarv=schoolsrfor_Post,Telecommunications Tand:-Transport)
- Vile-PTT'gkola (Post_andTelecommunications)
- Visa zeleznicko-saobradajna ;kola(4i1Ways)
= Visa-pomorska 'kola (Navy)
Vise_me-diciriske skole(Post-secondarv=schools of Medicine)
--Viga 29edicinska gkole (Medicine)- Viga-skola za medieinske sestre JCK(YgoslaV Red Voss Nurses)
- Visa Stomatoloska 'kola-(Stomatology)- Viga-'kola za sodijalne radnike
(Training of Social Welfare staff)
vVise poljoprivredne skole(Post=secondary=schoo=or'Agriculture)-
- yi-galpoijoprivredna 'kola(-Agriculture)
Vise tehnicke -gkole(Post-secondary-technical schools)
- tehnigka-gkOla (POlytechnics)Visa tehnigka gradjevinska 'kola(- Building and Censtruction)
- Viga tehnika tkola za gradjevnuindustrijn i grad-joYinarstYo(Building IlidPs-firies and Civil
Engineering)- Vida geodetska-;kola (Surveying)= Viga tehnigka 'kola za_organizaciju
rada (BuSiness Management)
225
OECD Classification
Social SciencesSocial Sciences
:,,,vial Sciences
Social SciencesSocial Sciences
Social Sciences
Social Sciences
Technology
TechnologyTechnology
Medical Sciences
Medical SciendesMedical Sciences
Medical Sciences
Agriculture
Technology
Technology
TechnologyTechnology
Technology
c.

OECD Classification
- Visa tehnicka Lola-za sigurnostpri radu-(Workerls protectionaWnst acsident9.at work -) TechnologyVisa-tehnicka masinska 6kAa(ftchonicalingineeripg) Technology
- Visa zeleznicka tehnicka skola.(R511way Engineering), TechnologyVisa hemijsko-tehnoloska skola(IOustrial Chemptry) Technology
- VisA tahnologkajskola za nemetalei gradjevinskeitaterijale (Non-ferrous MetallUrgy and building'materials) r
TechnoloVisa- `tehnicka tekstilna skola(Tptiles) TeChnology
- Vied tehhicka obuCarska_gkola(Fsotwear) TechnologyVisa grafIeka skola (Graphic Arts) Technology
226
22

LIST OP TABLES
I. Enrolments by educational -level and year of age^nd enrolment ratios 229
n. Enrolments... ... ............................. ..... 230
II.a Number of female students in public andPrivate schools 231
II.b EnrolmentS in the first.and the last year ofstudies............ ... . . ..................... . 232
III. New entrants ..... ............................ 233
III.a University type higher education: number ofcandidates, new entrants and enrolments byyield of study.. ...... ........................ 234
III.b Non-university type :.igher education: number ofcandidates, new entrants and enrolments byfield of study............. ..... 235
IV. Higher education: number of female studentsby field of study...,.............. ....... 236
V. Higher education: .foreig-n students in the countryand nationals studying abroad by field of study... 237
VI. Graduates._._._. .,._. t .........- 238,Yl.a University type higher education: number of-
graduates by field bf study ( =1st degree ofstudies }.. . ... ............. .... 239
VI.b Non-university type higher education: number ofgraduates by field of study.(1st degree ofstudieE4 ..... . ........ .... ..... ..........., 240
V -It. Teachers'and professors by educational level......... .241VII.a Teaching staff in universities by status and
field of sp ciali4,,,i. sation......4.......... ........ 242
YII.b Teaching sta in non-university type higher 4
education by status and field of specialisation 243
VII.° Teaching staff in vocational schools by fieldof specialisation............. ... ... 244
VIII. Educational expenditure....... ..... ....... ..... 245
IX. Distribution of students by father's profession 246
X. Distribution of university students by town ofparents' residence .......... ...... 247
Education by sector of economic activity:number of persons with university; diplomas byfield of study ...... . ... . 248
227

XI. a Educa Lion by sec for of economicnumber of persons with nos-t4niseraitytypehigher education diplomas -by field ofstudy = 249
XII. Pre-primary. education.. ..... . . . .. .. ...... 259
XIII. Schools for skilled workers 251
XIII.a Scho.ls for complementary education 252
Sources 253

YUG0SLA7IA Table I
ENhoLMEN'IT. by EDUCATIONAL LEVEL AND YEAR OP AGE AND ENROIMENT RATIOS (1970-71)-
Ace Primary.secondaryGeneral
School for,:killedworkers
echnicnI andvocational
TeachertoCollege,:
Non-uniJer,'
Ype IligI,_education
(1)
_versity:(I)
Totalnrol=mentr
rcl113-tion :_
- n.,
56 69,494 69.494
7 357,412 357,4128 367,211 367.211
9 370,509 370.90910 370,179 370.179
11 344,811 344:81112 328.361 328,36113 300.872 -300,872
14 256,948 10,983 11,133 10.426 383 289.87315 68,384 46.339 62,954 51.438 1.522 230,637
16 44.737 86,784 49.75 2.550 183.83017 42,969 76,546 43.973 4.084 167.59218 33,413 35.176 35,981 4,434 1.311 6,414 116.729
19 6,220 10,466 10,789 2,756 7.633 28.827 . 66.691
20 1.617 2,949 4.685 1,144 10.153 31,034 51.582
21 6,639 25,136 31-77522 4.118 20,513 24.631
23 2.528 13.664., 16,192
24 1.458 7,624 9,082,2'i
26,
.692433
2,9361.829
3.6282.262
27 291 908 1.199
28 279 800 , 1,079
29 216 562 77830 year:rei: over 2,050 3,188 5.230
Total ,2,8`14.581 186,298 286.00$ 20i,051 16,673 37.801 143,435 3,02.047
1) students of the ESR of vugoblsv4a
29'7"rst,
01

v4-0
YUGOSLAVIA Table II
ENROLMENTS
Year-Prima'''
_ SecondaryGeneral
-Technical andVocational
Teachers' =Non,university_Colleges E; type higher
educationUniversit YI
Totalenrolments
1959 -60 2,589 576 - 78,750 97,702 25,755 18,754 86,032 _2,896,569
1960,61 2,764,369 79,676 1=15,609 27,950 31,662 108,912 3,128,178
1961-62 2,895,694 94,651 137,983 30,335 40,898 117,112 34316,673-
1962=63 2,960,199 116,171 161,373 31,912 47,782 112,310 3,429,747-
1963-64 2,980,220 141,738 174,855 28,716 53,381 .107214 3,486_,124-
1964=65 2,972,225 161,630 198,203 28,942 634073 107,426 3,531=,499-
1965=66 -2,945,520 177,237 206,825 27,908 68,650 116,273 3,542,413
1966-67 '2,921,607 _ 180,303 203,376 == 26,558 75,344 120,110 3,527,298
1967 -68 2,893,624 181,328 198,903 25,718 82,5704 128,240 _3,510,383
1968=69- 2,875,075 183,360 195,622 24,233 83,947 147,497 3,509,734
1969 -70 ;2,853,069 184,068 197,464 -21,194 77,901 161°,800 -3,495,496
1970 -71 =2,834,581 186,298 _= 207,051 16,873 81_,074 180,129-,;3,506,006

YUGOSLAVIA Table II.a
NUMBER OF FEMALE STUDENTS IN PUBLIC AND PRIVATE SCH00LS(1)
Level of Education -1959-60 1969 -70 1970-71
Primary 1,205,884 1, 326,609 1,318,915
Secondary ItGeneral . _ 38,329 102, -695 103,267
Technical and 4'
Vocational 43,082 106,876 112,807c
Teachers, Colleges E 17,125 13,584 10,774
Non-university type ,,.'
Ligher education 6,-839 33,786= = 33.786
Universi-ty ; 24,799 61,314E- 69,225
Total - -1,336 058 E 1,644-864:1,648774
1) No private education in Yugoslavia
4
231

YUGOSLAVIA Table I-I.b
ENROLMENTS IN THE FIRST AND THE LAST YEAR OF STUDIES
=Level o1 Education
196142 1969^70
FirstYear
lastYear
FirstYear
LastYear
Primary 451,687 ii 203,404 418,4447 255,709
Secondary General 40,935 16,493- 59,838 38,395
Technical and_ Vocational
Teachers' Colleges
Non ,university type_higher--education
-University 55,276 15,928 /75,335 14,833_____

YUGOSLAVIA Table III
AN-ENTRANTS
Year PrSecondary -TechnicalGeneral =Vocational
andVocational
Teachers'Colleges
Non-uaiver-sity type
-highereducation
UniveraityF
1959=40 418,829 24,718 32,892°1 6,907 12,017_ 31,135
19-6061 414,949 25,275 41,439 7,255 22,682 48,134
1961 -62 423,598 38.380 51,031 9339 27,619- 47,383
1962;43 408,632 47,871 57 -,459=,-
8,869 31,184 38,881
1963=64 395,308 51-,594 58,744 7 274
-,34,487 36,658
1964=65 380,072 53,530 64,061 6,614 40,886 39,160
1965-66 386,907 57421 64,626 64 601 42,305 43,724
1966=67 379,779 52,741 56,208 5,826 43643 40,917
1967.48 386,443 54,043 54,679 6 076-, 47,331 42,484
1968 -69 381,430 t 53,556 55,112 5,203 43,952 54,975
1969.=70 374,602 54,829 61,684 3,391 45,639 58,820
1970-71 368,339 54,236 66,384 1,985 48,758 62,651
1) First-year students of Fine Arts.

YUGOSLAVIA
230Table III.a
UNIVERSITY TYPE HIGHER EDUCATION:
NUMBER OF CANDIDATES, NEW ENTRANTS AND ENROLMENTS BY FIELD OF STUDY
Field
', of study
Candidates New Entrants Enrolments
1,.64-55-1959-6v- 19b4-65-4-969-70 -1954-55 -1959=60 1964=65 =1969-70 1954-55 1J59-60 196445-19697'_
Pure Science 2,029 2,073 3,098 3,911 5,736 4,956 8,550-- 12,72
lrchrtecture 891 518 809 1,023 1,997 2,835 2,719 4,74
Technology 4,464 4,538 8,733- 13,185 10,714 15,708 24,233 36,97
Agriculture 1,775 2,565 2,910 4,955 4,765 8,543 8,543 11.,36
Total Scienceand 9,159 9,694 15,550-: 23,074 23,212 32,042 44.045 65,80
Technology
MediAl Sciences 3,767 2,166 2,898- 3,466 9,484 11,040 13,365 15,85
Humanities 5,929 5,642 5,270. 7,567 13,540 14,098 12,407 23,62,
EducatiOn 91 220 1,252 783 259 459 3,193 2,971
Fine Arts 299 365 570 710 1,233 1,412 1,980 2,351
Law 3,325 6,615 5,106 8,878 7,563 14,540 12,379 25_ 151,
Social Science 3,985 6,433 8,514 14,342 7,584 12,441 20,057- 26,02
Other - --- - _ - ,,
i
Total 26,555 31,135 39,160- 58,820 , -, 62,875 86,032 _1_07,426-= 1_61,R0(

YMA- OSIX.T.TATable "III b
s(VON-UNIVERSITY TYPE HIGHER EDUCATION:
NUMBER OF CANDIDATES, NEW ENTRANTS AND ENEOLMEATS BY FIELD OF STUDY
tr
Field of study . .7andidates New entrants Enrolaentp
1954 -55 =1959-6v 1964 -65 -1969-70 1954,55,-1959-60- 1964 -65 -196917v -1954-55- 1959 -60 -1964-65 11.)977
Pure Science - - - - 7. -
/ Architecture - - - - - - - ,
Technology 68 859 6,954-. 8,895 126= 1,118 11,517 16,29
Agriculture - - 875 1,176- .7 - 1,635 1,88
Total Science
and
Technology 68 859 7,829 10,071 126 1.118 13,152 18,17
:Medical ;;cienceo . 124 170 884 1,386 219- 619 1,459 2,79
Humanities - - 7. - - - - -
Education 3,383 5,623 12,068 14,511 6,671- 9,667' 19,867 30,08z.-.
Fine Arts - - - - - - -
Law _ - - - .7 - - - 1
Social Science- 27 5,365 20,105 19,671 106 7,350- 28,595= 28,-641
ether - - - - -
Total 3,602 12,017 40.886 45,639-_ 7,122- 18,754 63,973= _71,90i

YUGOSLAVIA Table.IV
HIGHER EDUCATION:
NUMBER OF FEMALE STUDENTS BY /ID OF STUDY
.
rrera or otutly
UniversityNon-university typehl her education
195940 1970=71f 1959=60- 1970=71_----. ,
Pure Science 1,972 6,38 - -
Architecture 902 1,66 -
Technology 1,548 7,374 42 3_,209
Agriculture - _1,201 2,771 = 302
Total science
and - Technology 5,623 18,198 :42 3-,511
Medical Sciences 3,931- 8,968\
530 2,- 375
Humanities 7,928 15, -346 -- -
Education 76 800 1 4,551 13,867-
Fine Art? 509 990 - -
Law 3,475 9, -770 7 r
SocialvScience 3,257 15,153 1,716 14,033
Other_ -
-Total ---24,799 .69,225 6,839 33,786

4 YUGOSLAVIA Table V
HIGHER EDUCATION: FOREICr "mUDENTS IN THE
COUNTRY AND NATIONALS` STUDYING ABROAD
BY FIELD OF STUDY
Field of StUdy
Foreignstudents
Nationa ).sstudying abroad
1961 '1969 1961 , 1969
Pure Sciences 19
Technology 368 a,318
Medical Sciences 195 691 -
Other 283
TOTAL 865
2"7

c
z171031.AVIA
ne
0
195)-6U 178,075
1960-61 1 "6.147
1461 -62 147,041
1962. -63 20e,739
1963-64 ,785
1964-65 237352
11965-66 .917
1966-67 237.424
1967 -64 236.156
196.-6) 241,441
1J44-7^ 39, n11
1)70-71 240.550
14.614
14,635
14,822
1.1,449
14.442
21034
26,920
30.712
32.993
3F . 216
31. 963
35. 029
Table VI_
4eeliniool and Vocational
TrAlnIng Tchnlealiligh,level ant otherrrofeo- rocatinna2
ptato
1,502 13.640
1,512
1,42
1.197
1,275
1.4.W
1.102
1,012
722
366
331
17,215
16.508.
19,830
24.581
30,116
32,859
32.454
34,387
37..405
:4.352
34. 071
.;eneralTecimicalEducation
Ublver,AV
.chockof PineArta
Total
Teacher.'collet:co
n-unives-viher
clucat
117..
153
136
t159
557
564
583
613
618
657
649
487
697
728t-
729
748
15.699
19.291
20.516
21.640
26.502
31.921
31,610
1 .129
37.925
40.121
36,183
35.304
3.49 A
4.170
4.834
4 323
4,11;>
4.664
3.E50
4.147
4,259
3.-69
4,1,4
3,757
4.690
5.945
7.226
7.727
8..450
9.278
10,510
12.125
14.i7C
16,0,16
16,785
15,683
Below 1.7t
level
4.673
5.570
r .661
5,3'42
;.286
3,389
2,165
1.674
1:664
12.92!
13.713
13 .300
13.010
12,778
12.770
13,074
13.025
14,213
14,432
9k
144
286
361
457
450
402
460
730
(66
) 10rate
227
4 :.-
264
269
513
1 .284
136
132
194
315
371
t-
O
S
tF
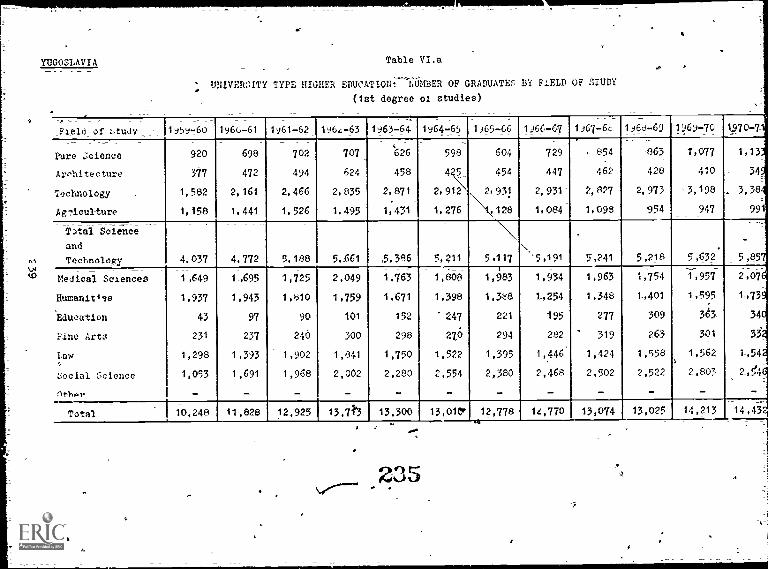
YUGOSLAVIA
AV
Table VI.a
VERSITY TYPE HOER EDUCATIoN:iiiiMBER OF GRADUATES BY FIELD OF STUDY
(1st degree of studies)
Field of Study__- 1959760 1960-61 -1961-62-1y64.-63 1963-64- =1964765-1965,66 '1)66-67-1)67,6c 1j6d-69 150_70 19707_
4
Pure :_-:cience 920 698 702 707 626 598 604 , 854 -863 7,077 1,13
Architecture 377 472 494 624 458 425 454 447 462 428 410 34_
Technology 1,582 2,161 2,466 2,835 2,871 2,912\ 2,931 2,931i_ 2,827 2,973 ,3,198 . 3,38
Aviculture 1,158 1,441 1,526 1.495 1,431 1,276 \'1,128 1,084 1,098 954 947 991
T)tal Science
and\ -
Technology 4.037 4.772 5.188 5..661 5,386 5,z11 5,117 5,191 5,241 5,218 5,632 5,85
Medical Sciences 1 ,649 1,695 1,725 2,049 1,763 1,808 1,983 1,934 1,963 1,754 1,957 2,07
Humanities 1,937 1,943 1,810 1,759 1.671 1,398 1,38 1,254 1,348 1-,401 1,595 1-,73
Education 43 97 90 101 152 247 221 195 277 309 363- 34'
Fine Arts 231 237 246 300 298 270 294 282 319 263 301 33.
Law 1,298 1,393 1,902 1,841 1,750 1,522 1,395 1,446' 1,424 1,558 1,562 t,54
Social Science 1,053 1,691 1,968 2,002 2,280 2,554 2,380 2,468 2,502 2,522 2,803 2_6'4
othpr - _ - - - - _ - - -
Total 10,248 11,828 12,923 13,713 13,300 13,010' 12,778 14,770 13,074 13,025 14,213 14,43'
235-

0
YUGOSLAVIATable VI.b
NON-UNIVERSITY TYPE HIGHER EDUCATnN: YUNBEll'OF GRADUATE3 BY FIELD OF :TTUDY
(1st degree of studieo)
_ Fi6.0 of otudv 1q5d-W_ -1JG,-61 1+6142 1962-6) 1963-64 1964-60.7, 1965-66 11 1i67-6o 1)66-69 -1./6)-70 19707'
Pure Science - -,
- -.
-
Architecture ...: - - - - - - - _--:_
Techn?logy 151 1-97 1,113 1,227 1.342 1,529 1,583 1,929 2.059- 2,160 2.480 2,2'
Ac;rIculturc - - - -81 288- 348 396 406 352 399 403 391- 3!
Total science
and :Technology 151 497 1,394 1,515 1.690 1,925 1,989 -2 .281I 2,458 2..563 2,871 2 ,54
Yo-!loal :=7c1ences 424 233 195 241 341 339 422 406 559 559 7641 75
Humanities- - - - - - - - - - -,
Eduoition 2,425 2,658 2.489 2,553 2,912 '3,432 4,250 5,419 6.749 7,87-1 7,770 Paj
iDcr Arto - - - -
=1Law- - - -
Social science 1:680 2,147 2,731 3,104 3.490 3,582 3,857 4,022 4,E.54 5,013 4,380_ 3,60
Othor - - - - - - / .. -7' -,
Total 4,680 5,535 6,-409 7,413 8,433- 9,278 10,518 12.128 14,570 16,046 15,785-i
-15,66

-YUGOSLAVIATable VII
TEACHERS AND PROFESSORS BY EDUCATIONAL LEVEL(1)
Level of Education
Full=time staff(2)
Part-' me staff Total
1959-60 1969 -70 1959 1969-70 1959-60 1969 -70
_Primary
Secondary General
Technical and VocationalrN.)
4' Teachers' Colleges
Non-universiiy typehigher education
University
70,773
3,_965
5,191
1,455
. . .
115,889
(9,389f3)
6,787-
1,230
. . .
474
670
3,578
255
1.041
(639)(3)
2,025
69
. .
72,275
4,635
8,769
1,710
1,586
6,908
116,930
10,393(4)
8,8125)
1,299-
3,951
11,964=
1) Teaching staff and teaching assistants.
2) Personnel working full-time on indefinite or fixed-term contract.
3) Distribution based on 10,028 professors.
4) Including 365 professors of the "School Centres".
5) Not including the professors of the "School Cent -a4" (see footnote 1 on p.220); the Yugoslav statistics..611/6 only a=globall
-figure for the teaching-staff of-these Centres(vo*,ch did not exist in 1961-62), i.e. both for secondary tech....all education)
and the training of skilled workers. The distribution of students of the Centres by type of education is available only-fo-ri
lhe year 1968 -69. To -facilitate-the calculation of the pupil/teacher ratio for this year, It should be noted that the numbel
of professors In the schools of secondary technical education (other than that-provided in the School Centres) Alas 9,048 inyl
1968-69 and the number of students, 131,700. 1
23 "-1

YUGOSLAVIA Table VII. a
TEACHING STAFF IN UNIVERSITIES
BY STATUS AND FIELD OP SPECIALISATION
Field ofSpecialisation
1960 -1961 1969-1970
Senior I Middle- I
le- el levelii__ or) _ __
JuniorleVel
(-2)
Total 7Senior I- Middle=level= rAA level_
l I ,
Junior:
levelf n1l .4,_
Total
-Pure Science
Architecture -and
Technology .
Agriculture
361
1,527
_ _563
= 656
2,414 f
_ 1,099
.......!--....-7-1337
1,963
770
335
2,186
619
-672
4,`=1 -49
= 1,389_
s-;.......r.7...-_ .
_295
88/
536
Total Science
and-Teehnology 1,718
I _
2,451 4,169 3,070
.
,1 d 6,210
Medical Sciences
HumanitiesEducation
Fine Arts
Law
_Social Science__ _
562
352
42
304
173
195- _
1,390
626
= 38
89
119
155
,952 .-
97 -8
80
393
292 :
f ' 350
718
193
383
'450
/ -453
1,430
547 ,
96
100
222.
279_
2,313
1i, 265
289
483
672
732
Total '3,346 -= 4;868- 8,214 : 6,150 '-- 5,814 11,964
1) Teaching staff.
2) Teaching assistants.

YUGOSLAVIA Table VII,b
TEACHING STAFF IN NON-UNIVERSITY TYPE HIGHER.EDUCATION
BY STATUS AND FIELD OF SPECIALISATION
Field ofSpecialisation =
1960-1961 1=969-1-970
fSenior=level
I)
Middle ,
leVel I
Juniorlevel
(2)
Total _ Senior El,
level
(1)
Middle ---: level EE
_
Junior--_,level Es
_ (2)
Total
-1_lure Science .
_-,--------77-----77-..-_,...----_ -------...-----&-----_.
Architecture and ;,
Technology 210 79 289 894 271- -, 1=065
Agriculture 75 _ 5 80 185 _18_ s 203
Total Science
and
_ _ Technology__ 285 84 369 14)79 289 -,_1-068_
Medical Sciences E108 53 _ 161 -155 b 106 261:
Humanities - -. 77-
Education 707 36 743 1,217 195 11,412
Fine Arts '- .7-
-Itivi- - _ .-.
Social Science 676 191 867 _- 802_ - 108 - 910
Total -1,776 364 =2,1-40_ -- 3 253 698 _3_951_
Teaching staff.
2 }t Teaching assistants.
239

N
YUGOSIAVIA Table VII.c
TEACHING STAFF IN VOCATIONAL SCHOOLS
BY FIELD OF SPECIALISATION(2)
Field ofSpecialisation
Full-time staff Part-time staff Total.
1959-60 1970-71= 1959-60 -; t970-71 1959=60: = 1_970-7-t__
Technical and other
Vocational studies 4,703 5,483 2,555 1,149 7,258 7,232
Training high-level
professional staff ; 119 24 -= 619 10 738" := 34
General Technical -
education - 33 ; - 13 - 47
Fine Arts =- - 778 942 ,- 404 256_ 1,182_ _1,198_Total _- 5,;00 6,482_ 2,016 -2i029 94178_ 8,511
1) Of which 637 non-permanent teachers (Hhonorarni").
2) See footnote to Table VII concerning the teaching staff of the School Centres.

IUGOSLAVIA Table VIII
EDUCATIONAL EXPENDITURE (1969-70) AT CURRENT PRICES
Millions in local currency
Type of-expenditure
--Secondary-erimary
_Technical:General _Vocational
fSchoolsand
-workers
forskilled _
"_Teachers,-Colleges
--
All HigherEducation -turesfor==exPenditure-sxp_
Otherexpendi-_General
education=
Tot
Z. CenCentral- Government- =- 1-,_ _ (°1)
--.---orrenIexpefliture 3 238 323 :940 270 123 892 -- 105 , 66 5._ .
=-Remuneration of-
teaching staff 2'627- 261 617 181 97 =607 64 -
T.-other 611 62 323 -= 89 26 285 41 66
2. Investment
-3. Subsidies andtransfers
4. Total Central
Government
expenditure for
education _,
II. local Authorities
1. Current expenditure
- of-which:remuneration ofteaching staff
2.- Investment
1) Adult _Education
Source : Statisticki_Godisnlak Yugoslavije, 1971, p, 244.

f
2 .42YUGOSLAVIA Table IX
OF STUDENTS B1 FATHER'S PROFESSION(1)DISTRIBUTION
Father' -s profession(2)University
Non'unive rsity type .
higher e ducation
1959-40- 1970-71_ _1959-40 1970--=-71
Agricultural, fishingand forestry workers 20 ,734 8,737
Industrial workersand craftsmen 23,385 7,465
Service workers 2,372 764
Transport workers 5,465 1,423
Protective service workers 10,659 1,963
Experts, artists, politicaland managerial personnel 30,460 4-i253
Financial and relatedworkerS 21 ,894- 3:844Other professions 13 ,053 34313
Not specified 8 ,628 1,800
Tn-Eal 141.282_ 35 ,1 -98
*Full=time students of the FSR of Yugoslavia.
2) Country's definitions,

YUGOSLAV -IA Table X
DISTRIBUTION OF UNIVERSITY- STUDENTS
BY TOWN OP PARENTS' RESIDENCE
_
Towns of more than Population
1G0,00* inhabitants Census
1960
Rest of the country
Students
1960-61
Population
Census
1970

CD
YUGOSLAVIA Table XI
EDUCATION BY SECTOR OP ECONOMIC ACTIVITY,: -
NUMBER OF PERSONS WITH UNIVERSITY DIPLOMAS BY FIELD OF STUDY
Sector of
e4V"1""
Field study
= activity
1961,_
0Agricul Industry
(1)- Inner
sectors_Total -Agricul -Industry
_
OTher,Sectors
Total
Pure Science _ 24 603 4,789 5,416
Architecture and
Te chnology (2) 231 11 ,495 7 652 19,275
Agriculture_ :3 ,904 1 ,306 3 ,788 8, 998
Total
science and
_ Technology_ _ _ 4,159 : 13,404 16,129_ 33,692
Medical Sciences 2 ,232 519' 19,832 22,583
Humanities and Fine Arts 43 524 15,968 16,535
Education 104 1,071 11,699 - 12,774
Law 223 1,527 16,800 18,550
So c ial Sol:moo (3) 178 2 ,379 6 ,192 8,749
Total _6,939 19.324 86, 620 : 112,883
1= Industry: mining, manufacturing construction and electricity.2 Engineering.3 Commerce and -Social Sciences.
'ource: ^tatistios of the rIcedpat-1 oral art Fr1,Ara+A nral '+r,Jrhlre. -,f_ +1=o TA1,,,,r _r,r--,0 iv, _c2 _Pnlyitri op_, OECD, Paris, 19694-11.118-.

YUGOSLAVIA Taole XI.a
EDUCATION BY SECTOR OF ECONOMIC ACTIVITY:__
NUMBER OP PERSONS WITH NON-UNIVERSITY TYPE HIGHER
EDUCATION DIPLOMAS BY FIELD OP STUDY
Sector of economic Eacti.vity
Field ofStudy
1961- 1970
Agricul-= tune
Judustry Other _
Sectors :
Total :Agricul=:ture
stry:_Tadu OtherSectors,:
:Total
Pure Science
Architecture and Technology
Agriculture
Total Science
and Technology
_
Medical Sciences
Humanities and Fine Arts
Education __law
Social Science
Total__ 815 6,750 53,474 , 61,0M
rz6.e.40
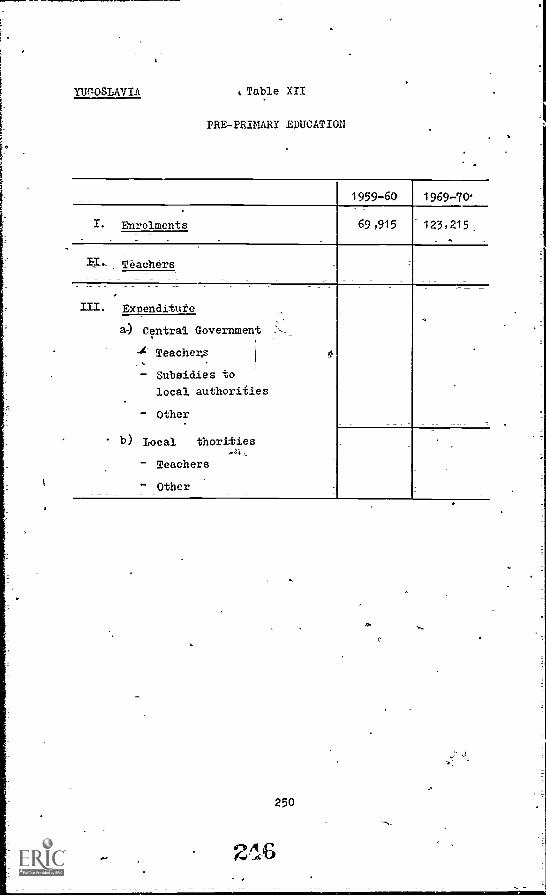
YUGOSLAVIA ' Table XII
PRE-PRIMARY EDUCATION
1959-60
I. Enrolments 69 ,915
1969-70"
123,215,
Teachers
III. Expenditure
a) central Government
A Teachers
- Subsidies to
local authorities
Other
b) Local thorities
Teachers
Other
0
.
250

YUGOSLAVIA Table XIII
SCHOOLS FOR SKILLED WORKERS
(gkole za kValifikovane radnike)
1959-60 1960-61 1961-62 1962-63 1963-64 1964-65 1965-66 1966-67 1967-68 1968-69 1969-70 1970 -71
I. Enrolments 131,384
24,277
573
9,591
...
... **
5,240
4,351
35,003
19,305
26,242
46,063
9,646
5;837
5,809,
5,403
4,24":
1,41,072
140,353
25,745
'47,528
6,697
`3,960
' 2,737
3,695
3,002
40,007
138,713
24,669
46,057
5,462
3,314
2,148
3,314
2,148
37,784
153,128
28,845
61,011
5,499
3,481
2,018
3,481
2,018
40,290
182.452
37,380
76,386
5,886
3.,697
2,189
...
...
-4-0;815-
199,301
,410480
68,067
5,353
3,864
1,489
...
...
51,298
216,979
47,332
86,359
5,555
4,120
1,435
...
...
59,273
234,044
57,059
96,780
5,705
4,363
1,342
...
...
55,922
258,114:,276,123
49,053
110,236
5,586
4,744
892
...
...
04,480
78,086
108,948
5,944
4,792
1,152
...
...
72,135
286,00
83,291
109,61
5,82
4,76
1',06
..-
.:.-
76,29
1
- female
- new entrants
:hi:T.-Teaching staff(1)
,.-
- full-time(2)
- part-time
permanent(3i
- non-permanent('4)
III.Graduates(5)'
1) Teaching staff an teachiv, assistants.
:1 Personnel working full -time on indefinite 1,1r fixed-term contract.
3) Established staff ("4alni").
4) Honorary staff ("honorarnip.
5) Certificate of "skilled wotkel7".
S'
2
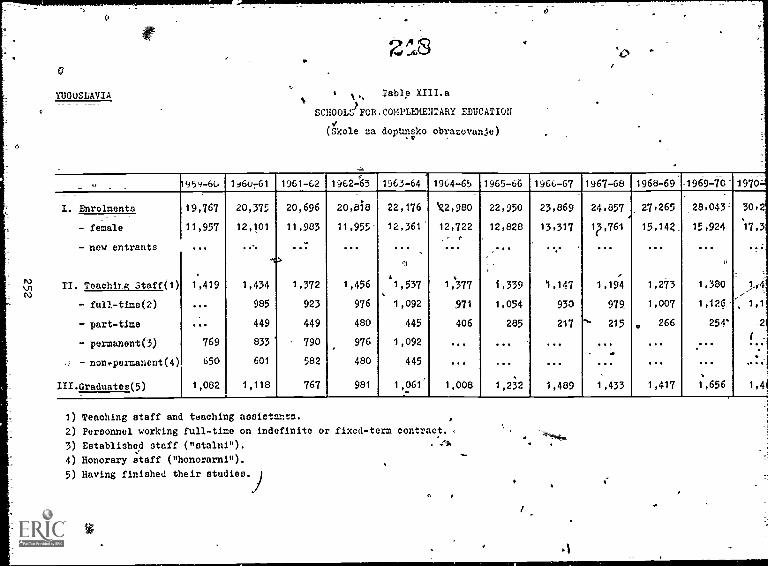
0
YUGOSLAVIA 4 N., Table XIII.a
SCHOOLS POR.COMPLEMENTARY EDUCATION
(&ole za doptmsko obrazovanje)
4
11959-60 1960761 1961-62 1962 -63 1963-64 '1964-65 1965-66 1966-67- 1967-68 1968-691969-70- 1970-.- --_
I. Enrolments 19,767 20,375 20,696 20,818 22,176 'g2,980 22,950 23,869 24.857 2_71265 30,2
- female 11,957 12,101 11,983 11,955. 12,361 12,722 12,828 13,317 1,761 15,142_
_28,043=_
15,924 17,3, ...
- new entrants ... ... ....
... ... ... . ". ... ... ... ..:
III. Teaching Staff(1) 1,419 1,434 1,372 1,456 41,537 1,377 1,339 1,147 1,194 1,273 1,380 1(4,,,
.
- full-time(2) ... 985 923 976 1,092 971 1,054 930 979 1,007 1,126_-- 1,1
- part-time ... 449 449 480 445 406 285 217''- 215 266 254' =2
- permanent(3) 769 833 790 976 1,092 ... ... ... ... ... - 1
.3 - non.permanent(4) 650 601 582 480 445 ... ... ... ....
... ... ,
. ..
I/I.Oraduates(5) 1,082 1,118 767 981 1,061,
1,008 1,232 1,489 1,433 1,417 1,656 1,4
1) Teaching staff and teaching assistants.
2) Personnel working full-time on indefinite
3) Established staff (nstalni").
4) Honorary staff ( "honorarni ").
5) Having finished their
or fixed-term contract.

SOURCES
Replies of the Yugoslav authorities.
Statisticki_Bilten,' statistical bulletins published by theFederal Institute of Statistics.
Yearbnnk -f +he Federal Republic of Yugoslavia(1968, 1969,-1970 and 1971).
Pevelpmenf f Higher Fducatinr 1qn-g7, Statis+ical Survey0E0,71970.
253
219 . .
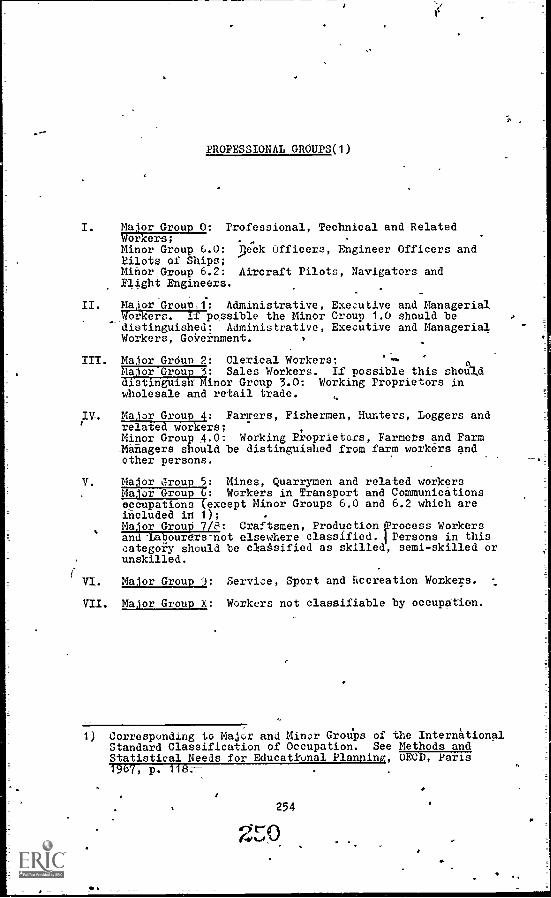
PROFESSIONAL GROUPS(1)
I. Maior Group 0: Professional, Technical and RelatedWorAers;Minor Group 6.0: Ipck Officers, Engineer Officers andPilots of Ships;Minor Group 6.2: Aircraft Pilots, Navigators andFlight Engineers.
_
II. Major Group.1: Administrative, Executive and ManagerialWorkers. li possible the Minor Group 1.0 should bedistinguished: Administrative, Executive and ManagerialWorkers, Government.
III. Major Group 2: Clerical Workers;Major Group": Sales Workers. If possible this shohddistinguish: linor Group 3.0: Working Proprietors inwholesale and retail trade.
IV. Major Group 4: Forcers, Fishermen, Hunters, Loggers andrelated workers;Minor Group 4.0: Working Proprietors, Farmers and FarmTlanagers should be distinguished from farm workers and
.a
other persons.
V. Major Group 5: Mines, Quarrymen and related workersMajor Group 6: Workers in Transport and Communicationsoccupations (except Minor Groups 6.0 and 6.2 which areincluded in 1);Ma or 'Gr01.0 7/s: Craftsmen, Production Process Workersan Iabourers-not elsewhere classified. 'Persons in thiscategory should be classified as skilled, semi=skilled orunskilled.
VI. Major Group 9: Service, Sport and Recreation Workers.
VII. Major Group X: Workers not classifiable by occupation.
1) Corresponding to Major and Minor Groups of the InternhtionalStandard Classification of Occupation. See Methods andStatistical Needs for Educational Planning, OECD, Paris1967. p.

INTERNATIONAL STANDARD INDUSTRIAL CLASSIFICATION
OF ALL ECONOMIC ACTIVITIES (ISIC)
Division Relevant Breakdowns
0. Agriculture, etc.
1. Mining and quarrying
2 -3. Manufacturing
31-32,- Chemicals)
31 -/Mnufacture of chemicals and chemicalproducts.
32 - Manufacture of products of petroleum andcoal
(34-38 - Metal products)
34 - Basic metal industries
35 - Manufacture of metal products, exceptmachinery and transport equipment
36 - Manufacture of machinery, except electricalmachinery
37 - -Manufacture of electrical machinery,apparatus, appliances and supplies
38 - Manufacture of transport equipment
(Manufacturing n.e.c.)
4. Construction
5. Electricity, gas, water and sanitary services
6. Commerce
7. Transport, storage and communication
8. Services
81 - Government services
(811 - Defence)
(812 - Public administration)
82 - Community services
(821 - Educational services)
-t (822 - Medical Etna other health services)
(823 - Research and scientific institutes)
83 - Business services
84 - Recreation services
85 - Personal services
(89 - Other services)
9. Activities not adequately described
255
261
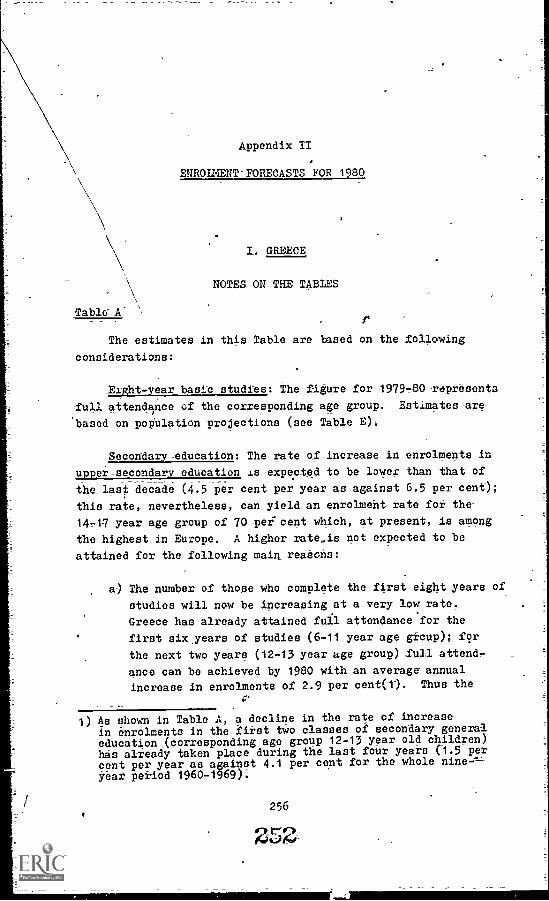
Table' A-
The estimates in this Table are based on the following
considerations:
Appendix II
ENROLMENT-FORECASTS FOR 1980
T. GREECE
NOTES ON THE TABLES
_Eight-year basic studies: The figure for 1979,80 represents
-full attendance of the corresponding age group. Estimates-are-
'based on population projections (see Table E),
Secondary-education: The rate of increase in enrolments in
upper- secondary education is- expected to be lower than that of
the last decade (4.5 per cent per year as against 6.5 per cent);;
this rate, nevertheless, can yield an enrolment rate for the-
14,17 year age group of 70 pei cent which, at present, is among
the-highest in Europe. A higher rate,is not expected to be
attained for the following main reasons:_
a-) The number of those who complete the first eight years of
studies-will now be increasing at a very low rate.
Greece has already attained full attendance for the
first six_years of studies (6-11 year age group); for
the next two years (12-13 year age group) full attend,
ance can be achieved by 1980 with an average annual
increase in enrolments of 2.9 per cent(1). Thus the
1) As shown in Table A, a decline in the rate of increasein enrolments in the first two classes of secondary generaleducation (corresponding age group 12-13 year old children)has al -ready taken place during the last four years (1.5 percent per year as against 4.1 per cent for the whole -nine=year period 1960-1969).
256
Aw

pressure on upper seconepry education will not be as
strong as in the Fast.
b) On the supply side, the Greek educational authorities,
after the rapid increase in-enrolments during the
sixties, face serious probls of capacity inadequacies
and of raising the qualitatiA standartis of the
educational services. Entranc examinations will serve
as a check to a potentially large increase in the propor-a
tion of students continuing their studies at the upper
secondary general level. In technical and vocational
education enrolments are expected to continue increas-
ing at a faster rate; entry to these schools is much
easier. Moreover, the investments made in technical-
schools and the effort to reorganibe technical educa-
tion over the 1960s (e.g. the establishment and
operation of SELBTE, the school for training professors
for technical schools) are expected to produce full
results over the next decade.
c) Agriculture will Gontinue to represent a large,,propor-
tion of the total population of-Greece in spite of
important shifts of rural manpower to other sectors
expected ;o take place over the decade. T11,7 high
degree of dispersion'"of the population in small rural
.villages, the relatively low agricultural incomes, the
large size of the agricultural family, and other social
and economic factors make for a lower participation of
the rural population at upper educafional levels.
Non-university level higher education is expected to
continue developing at high rates (13 per cent per year). It
is a new branch of higher education (representing 0.6 per cent
of total enrolments in 1969 as against 0.2 per cent in.1959).
The Greek government has decided .to establish five higher
technical education centres in the five largest towns of Greece
with a total capacity of 12,000 students. The v.vject which is
now at the implementation stage is being financed by the World
Bank. The demand for this type of education is very strong;
by 1968 the proportion of candidates for technology admitted
to the existing public institutions was 39 per cent. Private
institution are also developing very quickly in this field.
The rapid increase in enrolments in universities over the
1960s and, accordingly, the delay in expanding their capacity
257
253:
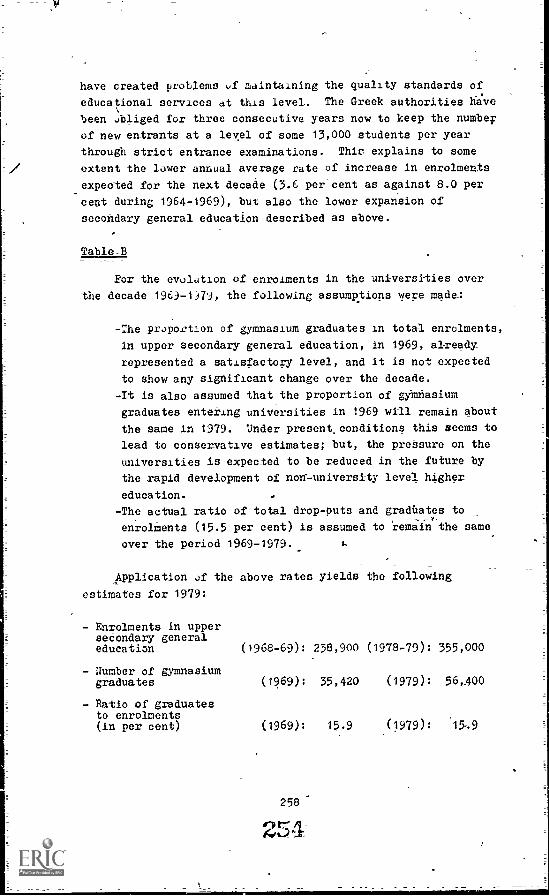
have created problems of maintaining the quality standards of
educational services at this level. The Greek authorities have
been obliged for three consecutive years now to keep the number
of new entrants at a level of some 13,000 students per year
through strict entrance examinations. Thic explains to some
extent the lower annual average rate of increase in enrolments
expected for the next decade (3.6 per'cent as against 8.0 per
cent during 1964-1969), but also the lower expansion of
secondary general education described as above.
Table B
For the evolution of enrolments in the universities over
the decade 1969-1)79, the following assumptions were made -:
-The praportion of gymnasium graduates in total enrolments,
in upper secondary general education, in 1969, already
represented a satisfactory level, and it is not expected
to show any significant change over the decade.
,It is also assumed that the proportion of gymnasium
graduates entering universities in 1969 will remain about
the same in 1979. Under present= conditions this-seems to
lead-to conservative estimates; but, the pressure on the
universities is expected to be reduced in the future by
the rapid development of noa-university level higher
education.
-The actual ratio of total drop-puts and graduates to
enrolments (15.5 per cent) is assumed to remain the same
over the period 1969 -1979.
Application of the above rates yields the following
estimates for 1979:
- Enrolments in uppersecondary generaleducation (1968-69): 238,900 (1978-79): 355,000
- Number of gymnasiumgraduates (1969): 35,420 (1979): 56,400
- Ratio of graduatesto enrolments
'15,9(in per cent) (1969): 15.9 (1979):

- New entrants touniversities (1969-70): 12,400 (1979 -80): 19,740
- Ratio of new.entrants inuniversities togrmnasiumgraduated (inper dent) (1969): 35 (1979)_: 35
Table C
The breakdown by age group of the enrolments forecast for
1979-80 (Table A) was made on the following assumptions:
For the eight-year basic studies, the 1969 proportion of
pupils beyond normal age in,total enrolments was applied
lox 1979-80; it already representsa reasonable level,
taking into account the structure of population (a large
proportion is agricultural) and its high degree of
dispersion in small distant villages. The same applies
to upper secondary general- education where only a slight
reduction in this proportion is foreseen.
- The proportion of younger students in technical and
Vocational education is expected to be higher in the
future f011owing the expansion of the educational
facilities and the general improvement of income levels.
Table D
This table is a synthesis of data on primary and secondary
educailon in Tables A and C.
259
255

GREECE Table A
ENROLMENT-FORECASTS (Year 1980)(1)
level ^f-Edu,.atim
Enrolments (in thousands) Average annualrate of increase
1960/61 1964/65 1969/70 1979/80 1960/1969 i964/1969 1969/1979
I, Firat eight-years of 1,050.3
912.3
125.0
13.0
185.4
149.5
35.9
2.8
25.5
1,150.0
965.8
171.5
12.7
243.1
187.8
55.3
5.0
49.3
1,145.0
948.1
185.4
11.5
333.4
252.1
81.3
11.7
72.4
1,175.0
520.0
370.0
150,0
40.0
103.6
1.0
0.4
4.5
-1.4
7.4
6.0
9.5
17.6
12.3
- 0.1
-0.4
1.6
- 2,0
6.5
6,0
8.0
18.0
8.0
0.3
4.5
4.0
6.3
13.1
3.6
studies
Prininry
Secondary general,first two years
Technical and1\>CN Vocational (13 years
old- and = -less)
Upper_eeoondary
General
Technical andVocational (14 yearsold and over)
III. Non-university levelnailer-education
IV. University
1) Enrolments in teachers' colleges are not included,ir the tables of this Appendix.,

-GREECE Table B
ENROLMENT FORECASTS FOR UNIVERSITY LEVEL HIGHER EDUCATION (-1980)
Year
-Enrolments
1959-60
1960-61
1961-62
24,478
25,549
27,927,
ra 1962-63 31,811ONt-J
1963-64 39,584
1964-65 49,262
1965-66 53,980
1966-67 60,383
1967-68 67,971 .
1968-69 70,981
,1969-70 72,362
1979-80
(Forecasts103,620
-Enrolmentsprevious
,real
24,478
25,549
27.927
31,811
39,584
49,262
53,980
60,383
67,971
70,981
99,270
New Elitrants Drop-outs Graduatesprevious year
Students Ter cent of
(b)
,Students er cent of
(b)
Students , Per cent of
(b)
6,081
7,112 29.0 2,154 8.8 3,887 15.9
6,840 26.8 605 2.4 3,857 15.1
9,61 -3 34.4 1,665 6.0 4,064 14.6
11,476 36.1 - 548 - 1.7 4,251 13.4
20,749 52.4 6,760 17.1 4,311 10.9
13,441 27.3 4,193 8.5 4,530 9.2
4,577 8.5
.1 .1 4,951 8.2
13,009 19.1 3,887 5.7 6,112 9.0
12,397 17.5 3,308 4.7 7,708 10.9
19,740 19.1 15 390
257

GREECE . Table C
PRIMARY AND SECONDARY EDUCATIONSTRUCTURE OF ENROMENTS BY AGE -GROUP
'Level of Education
1968-69 1979-80
Enrolments"(Thoneands)
Enrolments(Thousands)
. Primary education 948.1
5 years old
6 to 111
over 11
38.8
848.4
60.9
II. Lower_ secondary
11 years old 1.5
12 -13 155.8
n3 14 and overcr.
28.1
III, Technical and vocntkonal 11.5
(-11-13 years)
IV. Total-eight-Yect tApta attal,AD 1,145.0 100.0 1,175.0 100.0
5 years old 38.8 3.4 50.0 4.3
6,13 1,078.1 94.2 1,095.0 93.3
14 and over 28.1 2.4 3C.0 2.4
V. TeohlicjanLyosztjaaa 81,2 400.0 150.0 100.0
14-17 years 45.2 80.0 53.337.0
18 and over 44.3 54.8 70.0 46.7
VI. Upper secondary 151.1 100.0 370.0 100.0
13-years old 40.0 10:8
14-17 years -___.2778 285.0 77.0
18 and over 12.9 45.0 12.2

GREECE Table D
FRTMARY AND SECONDARY EDUCATION
ENROLMENT RATIO FORECASTS FOR THE YEAR 1980
Age group
level of Education
5 6-13- 14+47 18+ Total
Eight,year basic studies 50 1,095 30 - *1.175
Secondary general 40 285 4-5 370
Technical and vocational
(sec, level) - 80 "70 150
Higher - - ..
Total 50 1,135 400
Population 1980 1,135 570 A.
Enrolment ratio 1980 of 100 70 O. . 9
Enrolrent ratio 1969 .. 91 49 .. .
259

GREECE Table E
FORECASTS OF 10yuLATI0l: AT SCHOOL AGE
Thousands
Age 1.1.1970 1980
5 145.0 138.3
6 147.8 139.2
7 140.1 140.3
8 ' 145.0 140.7
9 142.7 141.1
10 0,:,3.7 142.9 ,
It 144.8 143.8
12 141.4 144.2
13 . 144.8 143.4
6-13 1,160.3 1,135.6
14 144.1 142.9'
15 146.7 145.2
16 141.9 137.4
17 134.1 141.9
14-17 566.8 567.4
18 139.0 139.5
19 140.4 150.1
20 139.1 140.9
21 126.5 ,137.2
22 t36.8 140.3
18=22 681.8 708.0
Source: G. Jiampes: Demographic Trends in Greece, Ministryof Co-ordination, Athens, 1919.

-II. PORTUGAL
NOTES ON THE TABLES
Table A
For the first eight years of schooling (pri ,ry education
and "ciclo preparatorio"), the acceleration of the Yr cess for
the realisation of an eight-year compulsory educatior a in
expressed policy of the Portuguese government. Since.o :'ugal
is very near to reaching full attendance in the first six years
,4studies, an intensive effort will be required at the level
of the last two years of the "ciclo nreparatorio". The dramatic
population decrease (especially in the 5 to 14 year age group)
expected to occur during the decade due to rapid emigration
(see Table E) w'll certainly make for rduced dMand pressure
at this level.
In secondary and higher education,. enrolments are assumed
to continue increasing over the decade 1970-1980 at the same
average annual rates realised over the last five-year period.
The maintenance of these rates s a feasible development for
,ae following main reasons:
a) The enrolment ratio in upper secondary education is
actually low in Portugal (22 per cent for the 15 to
18 year age group) and, therefore, the margins for a
growing partio,ipation at this level are still very large
in spite of the population dacrease foreseen for the
. decade.
b) Thq Portuguese economy is expected to realise a higher
growth rate during 1970 -1980 (7 per cent per year as
against 5.4 per cent.over 1955-1968).(1) The experience
of the 1960s in the developing Member countries proves
. that such favourable developments are likely o generate
a strong private demand for educational services at
1) The Growth of Outv,I.; 140-1980, OECD, 1970.,
265

higher levels (because f higher family incomes and
higher salaries for qualified manpower).
e) The gradual extension of compulsory education to cover
the first eight years of studies will necessarily create
a higher demand fox education at upper levels.
Table D indicates that a 5.5 per cent increase in enrol-;
ments in secondary general education is not enough to sustain
a m-.;,wth rate for university enrolments ,f 8.8 per cent per
year over the decade 1970-1980 (Table A) if the ratio of
secondary general education graduates to total enrolments and
that of new entrants in universities to secondary education
graduates remain the same. However, the number of candidates
for entry to universities is expected to increase over the
deCade: an objective of the Portuguese reform is to raise the
.standards of upper secondary technical education, thus
giving the same formal opportunities to the graduates of these
bcho,,ls to c,ntinue higher education studies.
Table B
The data for 1969-1970 were taken from Table I of Appendix
(Portugal).
A higher proportion of pupils beyond normal age is, to
. me extent, explained by the chanires provided by the reform as
to the age of entry to the primar ;hool (6 as against 7 in the
pact).
Table C
This table is a synthegis of data on primary and secondary
education presented in Tables A and B.
266
2 C2
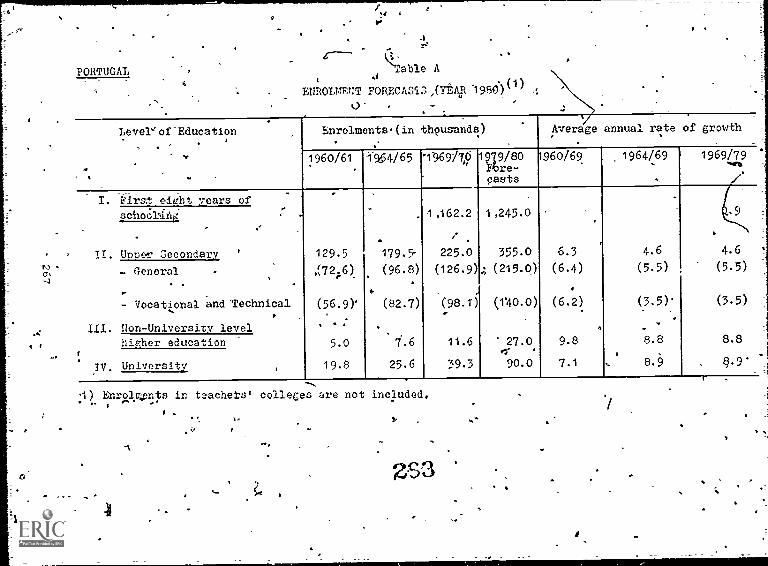
PORTUGAI
4
V.
able A
ENROLNPJIT FORECAS1S,(Y4 1980)(1)
.
Level'of-Education
,..
.
Enrolments.(in thousands)Y
Average annual rate of growth
1960/61 1964/65 '1969/7,9 1979/80Etre-casts
1960/69 1964/69-
,
1969/79...et,
I. First eight years of
schojk,ing . 1,162.2 1,245.0
. ..
II. 1/0D0 Secondary ' 129.5 179.5- 225.0 355.0 6.3 4.6 4.6
- General - .(72;.6) (96.8) (126.9); (215.0) (6.4) (5.5) (5.5)
« ..
- Vocational and'rechnical (56.9)' (82.7) (98.1') (140.0) (6.2) (3.5): (3.5)
III. Non-University level . . . .
higher education 5.0 7.6 11.6 27.0 9.8 8.8 8.8.1, .
IV. University 19.8 25.6 39.3 90.0 7.1 % 8.9 89
I) EnrolwAnts in teachers' colleges are not included.
ZS3

PORTUGAL Table B
PRIMARY AIM) SECONDARY EDUCATION
STRUCTURE OF ENROLIIEZITS BY AGE-GROUP
Level of Education 1969-1970
Enrolments(Thousands)
Primary
6 years old
7 14
4T5 and over
nodal() ;arenaratorio"
10 - t4
15 - 18
19 and over
Vocational and Technical
10 -14I. To-sal first eight years
"of schooling
6 years old
77' 14
15 and over
II. Unoer Secondary
14 and under.
15 - 18
19 and over
III. Higher(i)
(18 and under)
989.7
39.1
936.6
20.0
138.6
*127.3
6.7
4.6
33.9
1,162.2
39.1
1,091.8
31.3
225.0
42.9
122.3
59.8
6.3
100.0
-2.7
100.0
26.6
1) Including teachers, colleges.
268
Zr

PORTUGAL ' Table C
PRIMARY'AND SECONDARY EDUCATION
ENROLMENT RATIO FORECASTS-FOR THE YEAR 1980
.<
Thousands
Age group (1)
Level ofEducation
_6-13 14-17 18 + Total
First eight years of schooling 1,160 85 1,245
Upper Secondary Education . 260 100 355
Higher EdJcation(2) 5 ...
. Total 1,160 350 ...
Population 19863) 1,160 615 ... _Enrolment ratios 1980 100 57
Enrolment ratios 1969 (4) (84) (22)
1) The Portuguese reform calls for T.rimary school enrolmentsto include all children having reached 6 years of age,by31st October of the school year.
2) Includfhg teachers' colleges.
3) Estimates based on the results of an OECD enquiry ondemographic trends.
4) Refers to the 7-14 and 15-18 year age groups, respectively.
269
265

-40
PORTUGAL Table D
UNIVERSITY LEVEL HIGHER EDUCATION
ENROL FORECASTS (1970 -1980)
Thousands
Year
Enrolments
(b+p)-(d)
(a)
EnrolmentsPrevious
Year(b)
NewEntrants(i)
(c)
Drop-outs andGraduates PreviousYear(2)
_(a)'
1969-70 39.3 36.9 8.6 6.2
1970-71 41.8 39.3 9.1 -6.,6
.1971-72 44.4 41.8 9.6 7.0
1972-73 47.0 -44.4 .10.1 7.5
1975-74 49.8 47.0 10.7 7,9
1974-75 52.7 49.8 11.3 8.4
1975-76 55.7 52.7 11.9 8.9
1976-77 58,99 55.7 12.6 9.4
1977-78 62.3 58.9 13.3 "9.9
1978-79 65.8 62.3 14.0 10.5
71979-80 -69.6 65.8 14.8 11.0
1) New entrants would increase at the same rate as that foreseen for the en ments in sedcrdsrYgeneral education (5.5 per cent per year) if the following actual ratios main the same:
- that of secondary education graduates to enrolments in secondary education; 0
that of new entrants In universities to th.2 number of secondaryIgeneral education graduates.
2) The actual proportion of the total number of drop-outs and graduates to enrolments(16.8 per cent) is assumed to remain the same over the period 1970 -198d.

PORTUGAL Table E
TOTAL POPULATION PROJECTIONS
( INCLUDING MIGRATION)
Thousands
Age Group 1-1-1971 1-1-1981
0 - 4 850.7 701.7
5 - 9 883.5 709.0
10 - 14 788.1 742.4
15 - 19 763.4 783.5
20 - 24 731.2 664._9
25+ 4 ,884.0 4 ,742.2
Total , 8,900.9 8 ,342. 7
Source : Results of an OECD enquiry on demographic trends.
211
267
fa

III. SPAIN
NOTES ON THE TABLES
Table A
The Spanish government has set as a target to attain by
1960 full attendance of the 6 to 13 year age group, which
.2.orreslonds to the first eight-year period of studies.(1) The
enrolment ratio for this group was 96 per cent in 1.970. Most
of the effort will be required at the level of the last two
,years of the basic school. (The enrolment ratio of the 12 to
13 year age group was 85 per cent in 1970.)
For the 14 to 17 year age group (corresponding to secondary
education), the Spanish authorities oresee an enrolment ratio
of 60 per cent for the year i980(1) (as against 32 per cent in
1970). This target can be achieved if education at this level
continues to expand at the same fast rate as during the last
%decade, The largst part of the increase in enrolments thisthis
level is expected to be absorbed bY the uniform, multi- purpose
41Bachillerato", with which the various other types of secondary
education at present will be gradually mergea.
Forecasts for enrolments in higherc_.....:fit3.01. were also
made on the same basis (maintenance for the period 1970-1980
of the high rates of increase in enrolments over the last
decade).
Table_B
The breakdown by age group of the \enrolments foreseen for
the year 1979-1980 was made on the assupption that the propor-
tion of pupils beyond normal age in total enrolments remains
the same an the basic senool (ei.ght- year\basic general educationl.
A reduction of this proportion is expected in secondary education.
Table C\
This table is a synthesis of the data', n primary and
secondary education Vi.e6ented in Table's A and B.
1).Reply of the Spanish authorities. to the OECD EducationalGrowth Enquiry (1970).
272

SPAINTapie A
ENROLMENT FORECASTS (Year 1980)
Level of EducationEnrolments (in thousands)
Average annualrate of growth
1960-61 1969-70 1979-80 1960-1969 1969-1979
NI. Eight -year basic education
LV
4,956.2 5,390.0 0.9
II. Upper secondary222.1 471.2 1,100.0 8.8
General79.4 250.1 740.0 13.6 11.5
Vocational and Technical (14 -years andover)
142.7 221.1 360.0 5.0 5.0
III. Non=uniyersitIsma44.8 82.6 160.0 7.0 7.0
higher education
IV, ygivetilitv77.1 192.1 530.0 10.7 10.7
2P9
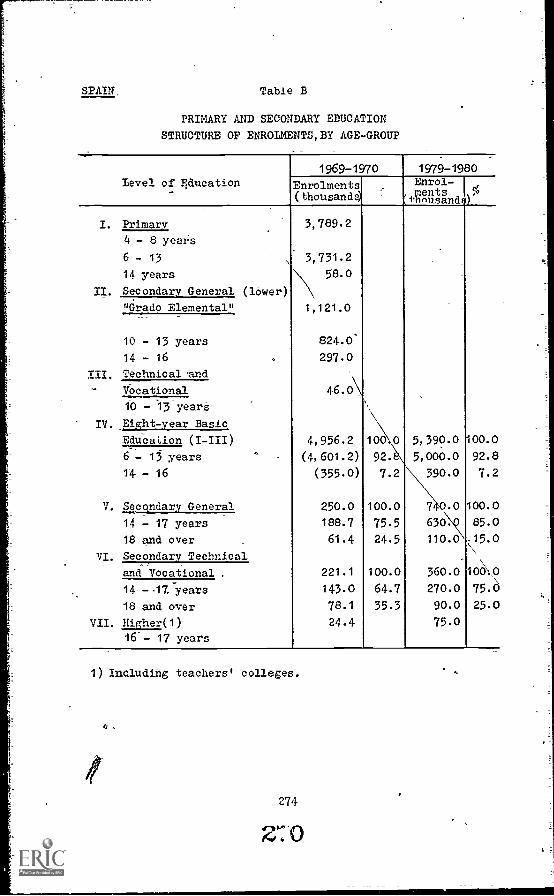
SPAIN_ Table D
PRIMARY AND SECONDARY EDUCATION
STRUCTURE OF ENROLMENTS, BY AGE-GROUP
level of Education1969-1970
Enrolments(thousands)
1979-1980Enrol-
'W1P (n
I. Primary
4 - 8 years
6 - 13
14 years
II. Secondary General (lower)
"Grado Elemental"
10 - 13 years
14 - 16
III. Technical .and
Vocational
10 - 13 yearS
IV. Eight-year Basic
Education
6 - 13 years
14 - 16
V. Secqndary General
14 - 17 years
18 and over
VI. Secondary Technical
and Vocational .
14 --17:Years
18 and over
VII. Higher(1)
16 - 17 years
3,789.2
3,731.2
58.0
1,121.0
824.0-
297.0
46.0\
4,956.2
(4,601.2)
(355.0)
250.0
188.7
61.4
221.1
143.0
78.1
24.4
100.0
75.5
24.5
100.0
64.7
35.3
5,390.0
5,000.0
390.0
7,0.0
630"
110.0
360.0
270.0
90.0
75.0
1 00.0
92.8
7.2
100.0
85.0
15.0
1000
75.6
25.0
1) Including teachers' colleges.
274
2, 0

SPAINTable C
PRIMARY AND SECONDARY EDUCATION
ENROLMENT RATIO FORECASTS FOR THE YEAR 1980
Thousands=
Age Group
level of Education
6-13 14-17 184, _total
Eight-Year Basic Education5,000 390' - 5.390
Upper Secondary General - 630 110 740
Upper Technical and Vocatiopal - 270 90 360
Higher (1)- 75 ... -..
Tota 5,000 1,365 ... ...
Population : 19805,000 2.360 --
Enrolment ratio 1980100 :58 ..- ...
Enrolment ratio 1970 96 i 32
1) Including teachers' colleges.
271

SPAIN Table D
FORECASTS OF POPULATION OF SCHOOL AGE
Thousands
Age 1970(1) 1980(2)
6 595.1 647.0
7 589.0 640.3
8 583.0 633.9
9 582.4 627.8
10 594.0 621.7
11 599.5 615.7
12 601.2 609.9
13 ,
594:6 604.1
6 - 13 4,738.8 5,000.4
14 558.4 '598.2
15 548.2 592.4
16 527.7 586.5
17 536.2 580.5
14 - 17 2,170.5 2,357.6
18 537.0 574.419 508.1 573.320 502.0 584.1
21 530.4 588.7
22 564.2 589.4
18 - 22 2,641.7 2,909.9_
Sources : 11 Datos y eifras de la- Ensetanza en Esraa, 1Q70,.omo f.
2) Reply of the Spanish authorities to the OECDEducational Growth Enquiry (1970).
276
isv (-A
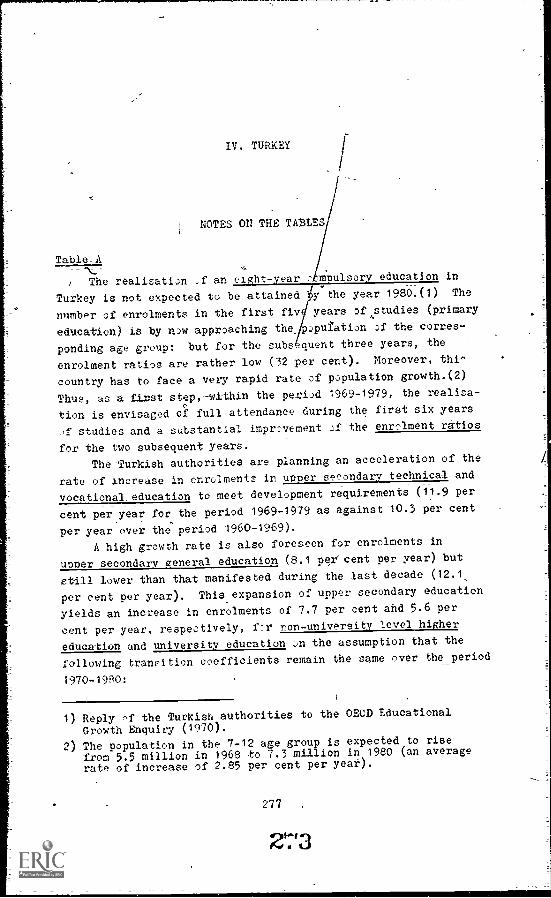
IV. TURKEY
NOTES ON THE TABLES
Table_A
mnulsory education in
ly the year 1980.(1 -) The
years of4studies (primary
opuration of the corres-
The realisation f an eight-year
Turkey is not expected to be attained
number of enrolments in the first fiv
education) is by n)w approaching the
pending age group: but for the subs,:quent three years, the
enrolment ratios are rather low (32 per cent). Moreover, thi^
country has to face a very rapid rate of population growth.(2)
Thus, as a first step,-within the period 1969-1979, the realisa-
tion is envisaged of full attendance during the first six years
if studies and a substantial improvement of the enrolment ratios
for the two subsequent years.The-Turkish authorities are planning an acceleration of the
rate of increase in enrolments in unner secondary technical and
vocational,education to meet development requirements (11.9 per
cent per year for the period 1969-1979 as against 10.3 per cent
per year over the period 1960-1969).
A high growth rate is also foreseen for enrolments in
unner secondary general education (8.1 percent per year) but
still lower than that manifested during the last decade (12.1,
per cent per year). This expansion of upper secondary education
yields an increase in enrolments of 7.7 per cent and 5.6 per
cent per year, respectively, f:r non-university level higher
education and university education on the assumption that the
following transition coefficients remain the same over the period
1970-1980:
1) Reply of the Turkish authorities to the OECD Educational
Growth Enquiry (1970).
a) The population in the 7-12 age group is expected to rise
from 5.5 million in 1968 to 7.3 million in 1980 (an averagerate of increase of 2.85 per cent per year).
277
273

a) The ratio of graduates to total enrolments in secondary
'general education.
b) The ratio of total drop-outs and graduates of higher
education institutions to total enrolments.
The ratio Df new entrants 1.,11 higher education to
Secondary general education graduates, which at present
teems to be rather high, is assumed here to be slightly
reduced:. upper secondary education is now becoming
more accessible to larger populatiA1 groups (especially
in the rural areas).
Table- B
More specifically, the estimates for university enrolments
were made on the following- assumptions (in thousands):
- Enrolments in SecondaryGeneral(1) (1969-70): 217.3 (1979-,9): 435.0
- Per cent of graduates toenrolments : 19.5 19.5
- Secondary Generalgraduates(1) (1970) : 42,3 (1979) : 84.B
- Ratio of new entrants inuniverisities to SecondaryGeneral graduates (in ';f)
- New entrants touniversities (1970) : 17.6 (1979) : 33.0
: 41.6 39.0
, Ratio of universitydrop-outs and raduatesto total enrdimpnts (in %)
Table C
: 16 16
The estimates for enrolments in non,univerz,ity level higher
education were made on the following assumptions (in thousands)-:
(1969-70): 217.3 (1978-79): 435.0- Enrolments in SecondaryGeneral
- Ratio of graduates toel)relments (in
- Skcondary Generalgraduates
- Ratio of new entrants innon-university levelhigher education toSecondary Generalgraduates (in 11
: 19.5 19.5
(1970) : 42.3 (1979) : 84.8
: 47 43
1) Including the religious high schools.
278
Avoi

- NO entrants to.non- 1
university level highereducation (1970) 1. 20.0 (1279) :
36.6
- Ratio of non-universitylevel higher education ...-
N
drop-outs and graduated i^
to total,enrolments (in 54) : 25 , 25 '
219
I

TURKtv Table A
ENROLMENT F0REOA3T5 (YEAR 1980)
Level.vf E,:acatir:n
Enrolments (in thousands,) Averag e annualrate o f growth
1960-61 1969-70 1979-80 1960-1969 1969-1979
T. First eight years cf studies 3,198.9 5,6t6.4 9,100.0 6.6 '8
1. Primary educa+i,.n 2,c66.5 4,897.6
2. Secondary general, 1st level 291.3 711.0
3. ,flechnical and vocational,1st level 37.7 24.3
4. The6logy schools, 1st level 3.4 38.5
II. Secondary General,' Upper Level 76.7 217.3 475.0 12.3 8.1
Iii. Technical and Vocational,41.5 100.3 310.0 10.3 11.97277evel
IV. Higher Education 60.6 147.0 275.0 10.3 6.5
1. Non-University Level Higher Education 18.6 (61.5)(2) 120.0 12.7 (7.7)(3)
'2. University 42.0 (95.4)(2) 155.0 8.6 (5.6)(3)
1) Enrolments in teachers' colleges are not included.
2)-Year 1970-71.
3) PeriOd 1970-1979.
O

TURKEY Table B.s,
UHI.V ERSITY LEVEL HIGHER EDUCATION
'"'ENROLMENT FORECASTS (1971 -1980)
r*.Thbusands
Year '''
Enrolments
(b+c)-(d)(a)
Enrolments _
PreviousYear
(b)
NewEntrarts
1,
Drop-outsand .Graliu,aces Pre-vious Year
'' * (d) ,
1970 -71 : 95.4 17.6 ..
1971-72 , 99.0 95.4 18.9 15:3
1972-73 103.5 99.0 20.3 15.8
1973-74 108.7 . 103:5' 21.8 16.6
1974-75. 114.7
101847
23.4 17.4
.107-16 124.4 1114.7 25.1 18.4
197677r 128.9pr.
121.4 26.9, 19.4
1977178'-'' 137.2 128.9 28.9 20.6.
1978-79 146.2 137.2 31.0 22.0
1979-80 156.0 146.2 33.0 23.2,....-W .
281
1
1

TULKEY Table C
Ncqi-oNIVr.aSITY LEVEL HIGHER EDUCATION;ZIM..11ENT FORE04::',TS (1971-19Ri
Thousands
Y..ar
z:nr,,iments
(b+e)-(d)Ea)
EnrolmentsPreviousYear
(b)
NewEntrants
(c)
Drop-outsand Gradu-atespreviousyear
(a).,..'
1970-71 61.5 ' 20.0
`1971-72 67.4 61.5 21.2 15:3
1972-73 73.2 67.4 . 22.7' 16.9
1973-74 79.2 73.2 - 24.3 18. -3.
1974-75,
85.4 79.2 26.0 19.8.4
1975-76 91.8 . 85,4 27.8 21.4
1976-77 98.5 91.8 29.7 23.0
1977-78 105.7 98.5 31.8 24.6
1978-79 113.4 105.7 34.1 26.4
1979-80 121.6' 113.4 36.6 28.4
tt
282

TURKEY Table
F0R.E0ASTS OF POrTLATIO1: AT SCHUOL AGE
Thousands
Age 1969 1980
5
6
713 .
9
10,
. 11
12
7 -12 456 7 322
13 ,. 14
15
13 - 15 2 n7 ,7 102
16 ,
17I.
18
16 - 18 1 909 2 )43.
19
20,.
21 ,22
16 - 22 . 1 999 2 ZS65
283
279

a
V. YUGOSLAVIA
NOTES ON THE TABLES
Table A
The Yugoslav authorities expect to approach full school
attendance for the 7 to 14 year age group by the year 1975.(i)
(By 1971 tile enrolment ratio for this age .group was 94 per dent.)
Estimates for enrolments in the for
1980 were based on demographic projections (Table 7)4
Another objective of the Yugoslav plan is to ensure that
"about 70 per cent of children of school age will receive
afferent forms of secondary-education" over the period 1970-
1985.(1-) Table A indicates that this target can be attained by
1380 if enrolments in secondary education increase over the
decade 1970 -1980 at a rate much lower than that realised during
the 1960s (4.2 per cent per year ap against 7.8 per cent).
Estimates for enrolments non-university level higher
educatio4 and_in the universitie: for the year 1980 were based
on the e.rr6lution of enrolments in secondary education and on
the assumption that the present transition coefficients will
remain the same over the decade 1970-1980 (Tables D and E).
Table B
The breakdown by age group of the enrolments foreseen4
for 1980 was made oh the assumption that the present proportion
of pupils beyond normal age in total enrolments will remain
the same over the decade 1970-1980.
Table C
This table is a.syDthesis of data on primary and secon-
dary education presented In Tables A andB.
1) Reply of the Yugoalav authorities to the OECD EducationalGrowth enquiry (1970).
284
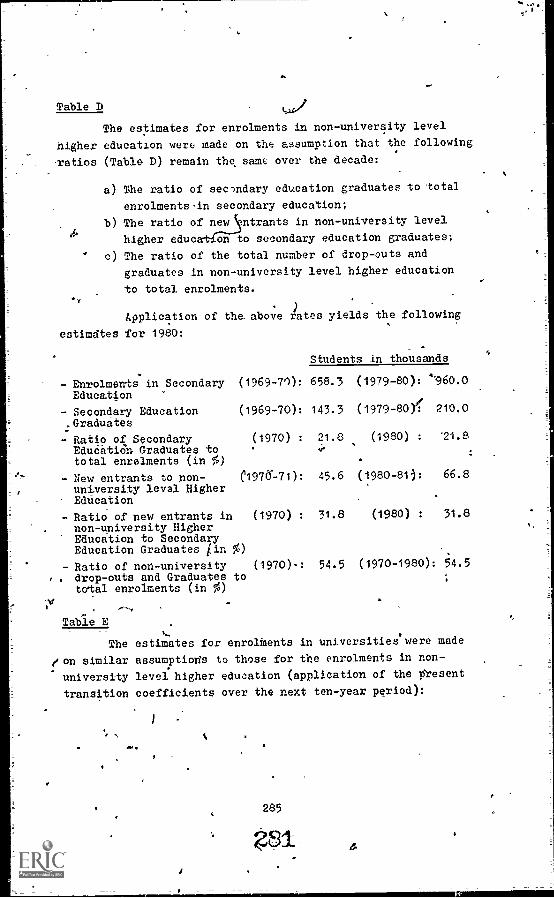
Table
The estimates for enrolments in non-university level
higher education were made on the assumption that the following
ratios (Table D) remain the same over the decade:
a) The ratio of secondary education graduates to total
enrolmentsin secondary education;
b) The ratio of new ntrants in non-university level
higher educ on to secondary education graduates;
c) The ratio of the total number of drop-outs and
graduates in non-university level higher education
to total enrolments.
Application of the abol'm rates yields the following
estimates for 1980:
Students in thousands
- Enrolments in Secondary (1969-70): 658.3 (1979-80): 960.0Education
- Secondary Education (1969-70): 143.3 (1979-80-)f 210.0
.Graduates
- Ratio of Secondary (1970) : 21.8 (1980) : '21.8
EducatiOn Graduates tototal enrolments (in %)
New entrants to non- ('1976-71): 45.6 (1980-81): 66.8
university level HigherEducation
- Ratio of new entrants in (1970) : 31.8 (1980) : 31.8
non-university HigherEducation to SecondaryEducation Graduates iin %)
Ratio of non-university (1970): 54.5 (1970-1980): 54.5drop-outs and Graduates tototal enrolments (in %)
.
Table E
The estimates for enrolMents in universities were made
eon similar assumptions to those for the enrolments in non-.
university level higher education (application of the present
transition coefficients over the next ten-year period):
285
gal

- Enrolments in Secondary (1969 -70):Education
- Secondary Education (1969-70):Graduates
- Ratio Secondary (1970):Education Graduatesto total enrolments.(in %)
- New Entrants universities(1970-71):
- Ratio of New Entrants in (1970):universities to SecondaryEducation Graduates (in %)
- Ratio,of university drop- (1970):outs and Graduates to totalenrolments (in %)
286
Students in thousands
658.3 (1979-80): 960.0
143.3 (t979 -80): 210.0
21.8 (1980): 21.8
62.7 (1980-81): 91.8
43.7 (1980): 43.7
27.4 (1970-80): 27.4

YUGOSLAVIA Table A
ENROLMENT FORECASTS (YEAR 1980) (1)
Level of EducationEnrolments (in thousands) Average annual
_rate of growth
1960/61 1964/L, 1/70 1980/81 1960/69 1964/69 196q/86
I. Primary Education (2) 2,764.4 2,972.' 2,853.1 3,225.0 0.8 -0 0.8 1.3
II. Secondary Education 334.6 542.3 657.7 1,035.0 7.8 4.0 4.2
General 79.7 161.6 184.1 290.0 9.7 2.7 4.2
Technical and vocational 115.6 198.2 197.5 6.2 ..
745.0 4.2
Skilled workers 139.3 182.5 276.1 3.1 8.7
Non-University Level
Higher Education 31.5 63.1 77.9 120.0 10.6 4.3 4.0
IV. University 108.9 107.4 161.8 300.0 4.5 8.5 5.8
1) Tea?hersi colleges arcs not included.
2) Eight years of studies
233

YUGOSLAVIATable B
PRIMARY AND SECONDARY EDUCATION
STJUJCTURE OF ENROLMENTS BY AGE GROUP
Level of Education1970 -71 1980-1981
Enrolments(thousands),
Enrolmentf(thousands)
I. Primary Education 2,834.6 100.0 3,225.0
6 years old 69.5 2.5 80.0
7 to 14 2,696.7 95.1 3,070.0
15 and over 68:4 2.4 75.0
II. Secondary Education 679.3 100.0 1,035.0
14 yea4 and less 32.5 4.8 60.0
15 - Ig- 610.1 89.8 920.0
19 and over 36.7 5.4 55.0
III. Higher Education (1)
(18 years and less) 20.7 35.0
1) Including teachers' colleges.
288
e^t
YUGOSLAVIA Table C
PRIMARY AND SECONDARY EDUCATION
ENROLMENT RATIO FORECASTS FOR THE YEAR 1981
Thousands
Ace groupLevel o..Education
o 7-14 15-18 19-23 _Total
Primary 80 3,070 75 - 3,2'0
Sel-ondary - E0 920 55 1,0351
Higher (1) - - 35 .. ..
Total 3,130 1,030 ..
Population 1,1?1 (2) 3,130 1,470 ..
i
Enrolment ratio 1981 100 70 .. ..
Enrolment ratio 1971 94 44 .. ..
1) Ineludincteacherls colleges.
2) Table F.
7289
285

YUGOSLAVIA Table D
NON - UNIVERSITY LEVEL HIGHER EDUCATION
ENROLMENT FORECASTS (1970-1980)
Thousalds
Year
Enrol-mentsg)::-
(a)
Enrol-ments
Previous
0)1)
NewEntrants
(a)
Drop-outsPrevious
(d)
GraduatesPrevious
(e)
1970-71 81.1 77.9 45.6 26.7 15.8,,
1971-72 84.3 .' 81.1 . 47.4 44.'2
1972-73 87.6 1 84.3 49.2 45.9
197-74 -91,0 87.6 51.1 47.7,
1974-75 94.5 91.0 53.1 49.6.
1975-76 98.1 94.5 55.1 51:5
1976-77 102.0 98.1 57.4 53.5
1977-78 106.0 102.0 59.6 55.6
1978-79 110.1 106.0 61.9 -57.8,
1979-80 114.4 110.1 64.3 60.0
1980-81 119.0 114.4 66.8 62.2

YUGOSLAVIA Table E
UNIVERSITY LEVEL HIGHER EDUCATION
ENROLMENT FORECASTS (1970-1980)
.Thousands
.
Year
Enrol-ments(b+c)-(d+e)(a)
Enrol-ments
PreviousYear(b)
NewEntrants
(c)
Drop-outsPrevious
Year(d)
GraduatesPreviousYear(e)
1970-71 180.1 161.8 62.7 30.0 1-4.4
1971-72 195.9 180.1 65.1 49.3
1972 -73 209.8 195.9 67.6 53.7
1973=74 222.5 209.8 70.2 57.5
1974-,7 234.4 _ 222.5 72.9 61.0
.1975=.76,, 245.9 234.4 75.7 64.2
1976 -77 257.2 245.9 78.7 67.4
1977-78 268.5 257.2 81.8 70.5
1978-79 279.9 268.5 85.0 73.6
1979-80 291.5 279.9 88.3.,
76.7,!:
196o-81 303.5 291.5 91.8 . 79.8 -
291
2 E37

YUGSOLAVIA Table F
FORECASTS OF POPULATION AT SCHOOL AGE(1)
Thousands
Age 1971 1980
6_
,
7
8
9
10
11
12
13
'14
7 -14 3 100 ' g 3 130
15
16
17
18
15 -`- 18 1 600 1 470
19
20 ,
21
22
23
19 23 .1 850 . '1, 860
1) Estimates based on population projections for 1981, foundin the Yugoslav demographic statistics, DemografskaStatistica, 4967.
292

Appendix III
FORECASTS OF CURRENT EDUCATIONAL EXPENDITURE
FOR THE YEAR 1980
NOTES ON TABLES A-E
In this Appendix an attempt has been made to work-out
forecasts of current educational expenditure for the period
1970-1980, taking into account only two of the main factors:
the changes forecast in enrolments by educational
level over the same period (see Table 16 and
Appendix II)-;
- an assumed improvement(1) in the pupil/te.cher ratio.
.
The lack of up-to=date information for most of the
countries has not permitted the elaboration of estimates of
investment expenditure for the same period.
Table A, on current public, educational expenditure
(year 1969 -70), is based on official,sources of information.
Table B (expenditure on teachersi salaries Res pupil) was
calculated on the basis of the data provided in Table A and
pupil/teacher ratios. -(2) Estimates of the averag,e annual
teacher ealary cost per pupil(3) in-the _private sector
1) The assumption here is'that pupil/teacher ratios will not be
higher in 1980 than the present less favourable ratios pre-
Veiling in the advanced Member countries.
2) These ratios were calculated from data on pupils and teachers
in public and private schools; published in the educationalstatistical yearbooks of the countries concerned, Separate
data for part-time staff were not available in many cases.
However, the risk of error is serious only in secondary'technical education where a large number of such staff is
employed-; for Greece and Yugoslavia, part-tiMe.personnel in
technical education have been converted into full-time
profe-sor equivalents.
3) Which -results from the division of the average annual teacher
salary by the number of pupils per teacher.
293
259

which data were not available) were made on the basis of pupil/
teacher ratios in the private schools and the assumption that
the yearly average of teachers' salaries in the private schools
,was the same as in the public sector.(1) The same approach was
applied for estimating future expenditure on salaries per pupil
(year 1980).
The estimates in Table C (current private educational
expenditure) and in Tables D and E (increase foreseen in ex-
penditure) were based on the costs per pupil as calculated in
Table B and. on enrolment data as shown in Table 16 (and more
a_alytically by country in Appendix II - "Enrolment Forecasts
for 1)80").
The results of these estimates are summarised in Table 18.
All expenditure forecast, for 1980 are exprersed in 1969 prices.
o
For Spain drid Turkey a breakdown of expenditure on teachers'salaries by educational level was not available. Therefore,total current educational expenditure per teacher was takenas a= -basis for the calculations.
294_

Table A
CURRENT p.41c ExporaiuRn on EDUCATIoN(1)(Year 1969 -70)
Country' and
Level of Edueation(2)
Enrolments Inpublic school°(thousands)
Expenditure in millionaof national currenc-ea
Teachers'sal aries
othercurrent
''
Total
I. Greece
Primary 880.9 1,900 .. ..
Secondary General 383.6 904 .. ..
Vocational and technical 28.9 100
University 73.6 A60 ..
other current expenditure - - _. ----
_f Totall-___ 3.364 _ _ _836 4.200
//, Portupq -
_
Primari 937.6 1,305 87 1,302
Secondary General 144.7 630 135 765
Vocational and technical 126.1 580 109
UniVeraity 42.8 182 159_609341
Other curren't_expenditure -_ _ 301 .- 301
Total 2.697 791 3.488
III. Snain
Pri4..37--ry2 737.5 13,630
-Secondary General 441.3 2,916
Vocational and technical 130.8 1,002
University 194.6 2,457
_ Cther current expenditure_1.400
Total - _ .. .. 21.40i(
IV. Turkey_
Prinary 4,600.01,039
Secondary 6173,64e7
Vocational and technical 153.1'109
All higher 97.0 553
_ _Other current expenditure - 140
Total _ _-2.40e--
V. Yuircielavia
Primary 2,853.1 2 627 612 3.239
Secondary General 184.1 261 62 3'[3
Vocational and-technical - 473.6 797 413 1,210_
All higher 239.7 637 285 922
_ uther current expenditure - - 66 66
Total _ .. 4;322 1.438 5,760--
f.
-1) Expenditure on teachers' colleges, pre-primary and adult education is.not included.
2) Countries' definitiona.4
3) Prom-a total amount of 23,595 million pesetas, an amount of 2,100 million-was deducted
as estimated expenditure on public pre-primary education and teachers' colleges.
Swam.: F Groner., Portup1 and Turkey, the replies of the-national authorities to the
3eereterint duesticnnaire. -FJrpain, La-kefor:ta EdunatIva en Narcha, Minintero
4e FiueaulOn y Oiencia, Madrid, 1377 eor Yuponlavia -Ntattatielddodtrmink-Juaoalavt:le, 1971, p. 244.
_ -
295
2"1

Zei9- Table B
EXPENDITURE oN TEACHERS. SALARIES PER PUPIL(Sear 196940)
In National Currenci
-_,unt:y 4114
Level of Education(1)
__
:ea...tavers.. ,teachere.nalaries(21
Public Sector Private SectorAverage
Public and Private_ _ __
Improved_P/T ratfor both Secto
Papiliteacher_ ..
Expend.Derte,ell
Pupil/teacherrei.
Expend.per...aril
Pu pil/teacher.rett:-_
Expend.perpun11
Pupil/teacherratio-- _
EX penperpupil-
Z. Gr.000. '
__ _ ________ ___ _ _
Primary 72,00 33.7 2.157 26.9 2.-700 33.1 2,196 28 2;596Secondary General 77,310 32.8 2,357 23.0 3,360 31.2 2,478 20 3,665
Vocational and-technical 70.930 20.5 3,460 32.9 2,156 27.9 2.542 17 4,172
University 167.500 .-.6.8 6.250 - , 26.8 6.250 15 11.167
II. Portugal .
Primary 47,190 33.9 1,392 24.5' 1,895 33.3 1,417 28 1.685
Secondary General 70,372 18.0 4,354 13.7 5,720 15.8 4.960 20 3-419
Vciati,,nal-and technical 74,784 16.4 4,560 11.0 6.336 15.7 4.763 17 4.399
Higher 100,772 23.7 4,252 6.6 15,684 20.1 5,013 15 6.718 =
III. 1..ein
f160,0541 32.3 4,980 35.6 4.518 33.3 4.030 28 5,745iriMarYZelowlary conloral 165.911 25.1 6.00 24.1 6,084 24.4 6,800 20 8;296
Vocational and technical (120,262) 15.7 7.660 15.7 7.660 15.7 7,660 17 -7474- =
IniversitY. (173.000) 13.7 12.625 , 7.9 21.900 13.3 13,000 15 11.500 f
17. 11.L1fI
Primary (8.540) 40.1 213 16.2 527 39.8 215 28 305
Jo:Aviary wneral (17.270) 31.0 557 14.1 1.225 29.3 589 20 963
Vcational and technical (16.300) 13.2 1.235 .. . 13.1 1.237 17 959
Higher (04,930) 14,8 5,700 27.8 3,055 17.7 4,798 15 5462
V. Yuc,Ilavin
Primary 22.150 24.4 920 - 28 802
3ocondary General 25.949 18. 1.418 20 1,299 =I
iocational and-technical 37,067 22.5 1,603 - - 17 2 #227' 1
4iphor 41,450 15.6 2.657 - - - 15 _2,763 =,
1) cuntrien' definitions.
2) Fn. :;pair. -and Turkey: yearly,average of total current expenditure per teacher (yearly average of teachers' ealardea pie "ether current
expenditure"): therefore, expenditure per pupil in total current expenditure per-pupil.

Table .7I
OY EIWOATUNALEXPENt,Trfil,;
(Year 1969-70)
Country and
Level of Education(1)
Enrolments in
private schools(thousands)
Expenditure tn-Millionb of National Currencies
Teachers' salaries Other-CurrentdExpenitura(2)
Total
1. Greece
.
Primary67.2 181
Secondary General52.9 178
Vocational end-technical74.3 160
*f , University_
__ _Total519 ________ _131 650 -7----
II. Portural
_
Primary51.9 98
Secondary General 114.2 652
Vocational- and-technical16.4 104
Higher .
3.2 50
Total_904 266 1,170
III. Spain
__
Primary .
1,051.6 4,751
Secondary General.
Vocational and-technical
953:1208.7
fi;483
Higher7.9
175
Other Current Expenu..
823
Total
_13i910 r
IV. Turkey'
Primary26.0
14
Secondary General 42.452
Vocational-and-technical1.3
2
Higher50.0
153
Other Current Expend.13
Total234 _-_-_--
t) Countries' definitions.
2) "Other-Current Expenditure" asranpercentage of "Total CurrentExpenditure" is assumed-to be the same-as in-the Public schools.
troti,.9
2 A:Table E
ESTIMATED INCREASE IN CURRENT EDUCATIONAL EX\PENDITURE ON THE ASSUMPTION
OF AN IMPROVED PUPIL/TEACIMR RATIO 'N969-1979)
Country -and
Level of Education_ .
mstimated
-Expendituin National Currencies (in-millions) Expenditure
on-teachers,: ,
salariesperpupil(2)
increase Inenrolments(thousands) __
Teachers' \salaries -,li
Other currentexpeenditur(1)
___ _ _
Total
-------I. Greece e
1486928-4 i
57228$215146
\-
\ ,
3,665 (3)=4,172_7,-670 (4)-11;167
- .First eight years of schoolingand Upper Secondary General
- Upper Secondary Vocaticnalandstechnical- Non=university level Higher Education
:,-. --University
-_TotAl 1,420 _ 355 1,775
II;- =Portugal-
1704215ci
.66518565144
\\
3,919 (3)_4,3995,558 (4)-6,716
- First eight,years of schoolingand:Upper Secondary General
- Upper Secondary Vocational and technical- Non- university level Higher Education--University_
Total = _1,276 175_ \ 1,650 .
III. Spain
72413977338
\7665905715\
3,890 \1,000 ",
8,296 (3):7,0749,267 (4)-11,500
-
..-First-eight years-of schooling ,-
and-Upper Secondary General- Upper - Secondary Vocational and technical- Non-university level Higher Education- University- Other-expenditure
Total --
14,255
IV. Turkey
3,434258210128
2,005223201725189
4,
584 15)_863959662
--First eight years of Schooling- Upper Secondary General- Upper Secondary Vocational and technical--Ail Higher Education_--Other current Expenditure
Total _
_ _3 343- _ \
V.--Yuposlavia(6)-
372106271Int,
300140600tOO
I602
1,2982,2272,763
.
--First eight yearo of schooling- Upper Secondary General- Upper Secondary Vocational and -technical--41I-Higher Education_- Total 1,640 - 760 _ _ 2.300 --- =I
1 ^Other current-exnenditdro as a_nercentage of *total current eXuendltur0" 13- assured cl Avernon aimendttore-oar-student of universitvand-_1
to be the same as in the public sector.
.2) See Table-13 of-thic,Appendlx:.
3) Most of the increase in-enrolments is_expected to ock.u.,In=zocondary-educetion; therefore
the-average,expenditure_per-puOil in-secondary-education-was-applied-here.
vocational education
5) -Average-expinditure-_per-pupil in primary (fIrst.6years -of schooling)-and-secondary-education-(the=three-subsequent years-of-studies).
6) Period-1969-1980.

tO
Table D
AND-P4IVATE-CuRRINT EDUCATIML-EXPE9DIT11RE
09 THt:-AESUMPTIOE-OF IMPROVED AVERAGE-PUR/L/TEACcER-RATIOS
(Year1969/70)
Country and
Level of Education(I)
local EnrolavIts
(thousands)
Expenditure in Miiiions-of National Currencies_ ____
__
Teachers' Salaries Other CurrentExpendlture(2) '!_Total
I. C-eece---_
Primary 948.1 2.4601
5econdary Oeneral436.5 1,697
Vocational and technical_ 103.2 430
University _. 73.6_ 823
=:.ta1_ _-5,400 1.350 6.750
I-1. Porugal
- T
- ---Primary
989.7, 1,668
Secondary General258.9 1,015
Vocational and=technical142.5 62d
University _ 46.0 _ 309
Total3,620 1.060 _ 4.080--_
III. 3p 1n
Primary3,769.1
21,760
Secondary General 1.394.4 11,568
Vocational and technical 3394 - 2,402
'Iniversity202.5
2:330
Other Current Expend.2;722_ ___
40.790 _
17. Tafkov
Primary4,907.0 ;
t.,497
Zeeendary General916.0 790
Vocational and-technical 154.4148
All dipher Education147.0 832
-Otter Current Expenditure196 _ _ _
__ _Total _
:31463
V. YtLgoa-
__
Prixery2,853.1 2,290
.3econdary G.noral184.1 240
1oc.st.ltmal_and technical473.6 1,055
Ali Higher Education234 1 _ 660
Total-4,245 1;435 .
5.660_ "_,---
1 Countries' definitions.
2) "Other Current Expenditure" as -a percentage of "TotalCurrent Expenditure" in assumed to be the asmo-as in
the public schools.
2(2'5

OECITSALES AGENTSDEPOSITA IRES DES PUBLICATIONS_DE L'OCDE
ARGENTINA - ARGENTINECarlos Hirsch S R L..Flops,' 16S. BIJENOSAIRES.
'2' 33.17872391 7-10,7122AUSTRALIA - AUSTRALIEB C.N. Agencies Ply. Ltd161 Stuit $t South-MELBOURNE, Vic 320S_ 22;,69.76016S8 Pittmater Road. BROOK VALE NSW 2100
28-' 938 2267AUSTRIA - AUTRICHEGerold and Co Graben 71, WIEN 1
8 S2.22 3SBELGIUM -BELGIQUELibrairit do SciencesCoudenberg 76.78. B 1003 BRUXELLES I
24' 11.37 36/12 OS 60BRAZIL BRE:5MMemo Jou 5-A . Rua Guilt); 518.Cana Postal 24090. 05039 SAO -PAULO 10,
St 256-2746/262.1609Rua Senador Dinla$19$1205-6.-RIO DEJANEIRO GB. 8=232.07 32CANADAInIormalion Canada171 Slater. OTTAWA. K IA 059,
_23_(617) 992.9738DENMARK - DANEMARKMu-nksgaards-BoghandelNdiregade 6,-116S KOBENHAVN K
* (01)_12 69-FINLAND - FI4LANDEAkateeminen KirtakauppaKeskuskatu 1,00100 HELSINKI 10 625,901
FRANCE=Bureau -des Pubbeamons de l'OCDE2- rue AndlePamal, 75775 -PARIS-CEDEX=16_ *524 $1 67
Printipaui cotreipondants13602 AIX411PROVENCE Librairie del'Univelute. '2' 26.180*38000 GRENOBLE _ B. Atthausi_*,8715-1131000 TOULCILlg.....Ermatr-2421,09 26-GERMANALEEMAGNEVerlag Weltautra G b H.D 2000 HAMBURG 36. New! Jungfernstmg-21
St 04043.62401GREECE - GRECELibrium Kauffmann, 28-rue du Stade.ATHENES 132 S. 322.21.60ICELAND -= ISLANDSSnatborn Jonsson and Co .1: J.Hafnarstram 4 and 9.-P.O.B -1171.REYKJAVIK. 22131))/14711/11936INDIA---INDEOxford Book and Stationery Co,.NF.WDELHI: Sandia House, 247)11CALCUTTA, 17 Park-Street, IS 24083IRELAND - IRLANDEEasonand _Son; 40 t order O'Connell Street.P.0 DUBLIN =L s o1,41161tsaAELErnanud BrownIS Allenby -Road. TEL AVIV 24.31049/S4032also at
'9-Shlommon HamalkaStrct1.-JERUSALEMa 2341307
411 Nahlath Benomin Stied. TEL:AVIV-It 53276
ITALY - ITALIE(Arum Commosionana SlinstoniVPi Lamarmora 45.-50121 FIRENZE IR-379751VisAlaitolini 29. zoiss-mit.ANo- S 365083Sous.depennaires
C Lrb.etu Heider.Pima Monica:maw 120. COM ROM'A
If 674628(Arena Hoipli Via Hop!. 5. 20121 MILANO,
865446Libreria Lutes. VIA Galobads 3. 1012/TORINO.
22_519274Lrddfusanadelle canon, OCDE/t indite asticuWI &Hem:bort ',brute odic C11111 piu impound.
JAPAN = JAPANOECD Publicamons Centra,Akasaka Patk Budding,2.3.4 Akasaka,MinatkuTOKYO 107 22-586-2016Maruzen Company Ltd.6 Tociichodse Nihonbashi. TOKYO :03.P-0 B. 5050. Toktoo 106.31
* 272.7211LEBANON - L1BANDoeumrnta Semnuflea/ReditoEdson Budding, Bliss Street,P-0 Boa 5641. BEIRUT 8 354429 - 344425THE NETHERLANDS - PAYS -BASW P. Van Stockum
-Bunenhof 36. DEN HAAG 2' 070-65,68 0-8NEW ZEALAND,- NOUVELLIAELANDEThe Publications OfficerGoseinment Printing OfficeMu(grase Sticet (Private Bag)WELLINGTON, '546807and Gosernment Bookshops IIAUCKLAND IP,0.11-5344) 2232 919CHRISTCHURCH (P.O B, 1721y 2250131HAMILTON 04 *80.103DUNEDIN (P.0.13,--1104), 22-78.294NORWAY - NORVEGEJohan undt Tanums Boahandd,
;K arl,Johaogate=41143. OSLCIA, *02432980PAKISTANMina _Book Agent).-6S Shahrah Ouald.E.Azam.LAHORE) *66$39PHILIPPINES vk,M.Garcta Publishing House.903 Quezon Bfsd- Ear.,QUEZON CITY. I
IMO- MANILA. 24 99PORTUGAL -Li±razta.PortugRua-do-Carmo- 7044-sLISBOA=2 - 560S8.21)SPAIN-- ESPAGNE-Libren Munch PrensaCatiello 37.:111ADR1131 *273,46,53Liblena Bastinosl-Pelayo.'52. BARCELONA *222 06 00SWEDEN = - SUEDEFriuta.K ungl.Hosbokharidd.Fredigatan a. 11152 STOCKHOLM:16,
23013/23 89 00SWITZERLAND = SUISSELibraurt Payot.-6--zue Greno.-1211 GENEVE II.
v_022.31.89,30-TAIWAN-Books and Savor.: Supplies Services,- LtdP.0.13083.- TAIPEI:TURK EY_- TURGUIELibraiim Hachette,469 Istiklal Caddo,.Eleyoalu, ISTANBUL 2344 94.20et 14- E-Zrya Gokaip CaddesiANK ARA, *12.1080UNITED KINGDOM---ROYAUME-UNIH.M_ Stationery Office. PO B. 369. - LONDONS E I 9 NH. *01-928.6977. Eta -410or-49 High HoThornLONDON _WCIV 6HB (personal callers)Branches sat- =EDINBURGH-BRISTOL.-MANCHESTER.- CARDIFF,BELFASTUNITED STATES-OF-AMERICA,OECD Publisamons Center,-Suite 1207.1750 Pennsslsania Abe, N WWASIIINGION,13.0 20006, *1202)298.875SV F..NEZUELA-Libreria dd Eve,-Asda. F-Jduanda 52.'Edifier, Apido 60 737; CARACAS 106,
S=32.2701/73 26 04/33 24 73YUGOSLAVIA---YOUGEISLAVIEJuoslovenska K ntiga. Terazne 27. P.0.13. -36.BEOGRAD, 24621.992
Les commands roman( de pays ou l'OCDE Ws pat encore destine de depositaitepeuseni hat adtosto
°COE Bureau des Publicationcl rut AndrePoca).-75775 Paris-CEDEX 16Orders and indiums from COUMITICY where sales WM% have not yet bun appointed may_be sent to
OECD. Publacamons Ofhee. 2'nit AnditPotal.-75775 Paris CEDEX16
OECD:PUBLICATIONS, 2. -rue- AndrOaical, -75775=Paris:-: Cedex:16 =--No; 32.861- 1974
PRINTE0 -1N-FRANCE