institutional order handling and broker-affiliated trading ... · 4 associated with each routing,...
TRANSCRIPT

Institutional Order Handling and Broker-Affiliated Trading Venues *
Amber Anand
Mehrdad Samadi
Jonathan Sokobin
Kumar Venkataraman
Abstract
Using detailed order handling data over the life of 330 million institutional orders, we study
whether order routing by brokers to Alternative Trading Systems (ATSs) that they own affects
execution quality. In a multivariate regression specification that controls for stock attributes, order
characteristics and market conditions, orders handled by brokers with high affiliated ATS routing
are associated with lower fill rates. Trading costs based on the implementation shortfall approach
are higher when clients select a broker with high affiliated ATS routing. Broker outcomes are
highly persistent suggesting that improved disclosures on order handling could help institutional
clients with broker selection.
Keywords: broker; intermediation; agency; venue; liquidity; trading; fund
* Anand is with Syracuse University, Samadi and Venkataraman are with the SMU Cox School of Business and
Sokobin is with FINRA. We thank Lore Aguilar, Robert Battalio, Tom Bruno, Robert Colby, Stephanie Dumont, Amy
Edwards, Alexander Ellenberg, Thomas Gira, Michael Goldstein, Charles Jones, Pete Kyle, Craig Lewis, Kapil
Phadnis, Dan Royal, Gideon Saar, Gary Stone, Laura Tuttle, Scott Trilling, David Saltiel and Ingrid Werner for their
comments. We are grateful to Shelly Bohlin, Megha Kampasi, Katie Madison and Laura Shoemaker for their generous
help with data related clarifications. Anand, Samadi, and Venkataraman are visiting economists with the Office of
Chief Economist at FINRA. The views expressed in this paper are those of the authors and do not necessarily reflect
the views of FINRA or of the authors’ colleagues on FINRA staff.
1
1. Introduction
Institutional investors account for a majority of ownership of US stocks and serve as the
primary vehicle for household investments. An important driver of institutional performance is the
ability to implement investment ideas at a low cost. Trading costs subtract from institutional
performance, erode or eliminate the value added by portfolio managers and lower the returns to
research (Wagner (1993)). Anand, Irvine, Puckett and Venkataraman (2012) show that
institutional trading costs are economically large and that broker selection is an important decision
for managing trading costs.1
Brokers make a number of decisions on behalf of their clients. It is common for brokers to
split an institutional order into smaller pieces, select among execution venues and sequence the
submission of smaller orders across venues. To monitor and evaluate the quality of executions
reported by brokers, institutional clients engage in transaction cost analysis. However, in recent
years, industry participants and regulators have noted that the complexity of the US equity market
structure makes it difficult for institutions to assess broker performance, especially since routing
data is either unavailable or difficult to decipher.2
Further, opaque reporting practices on the handling of institutional orders can obscure
potential agency conflicts that influence broker routing decisions. 3 The International Organization
of Securities Commissions (IOSCO (2017)) report identifies three incentives that may influence
1 Anand et al. (2012) estimate average institutional trading costs of 25 basis points over 1999 to 2008. ITG, Inc. reports
average US equity execution costs of 23 basis points in Q2 2017 (https://www.itg.com/assets/ITG_Global-Cost-
Review-2017Q2-Prelim-BrokerCostUpdated.pdf). Busse, Chordia, Jiang and Tang (2017) estimate that the trading
costs accumulate to 0.75% per year for actively managed mutual funds. 2 “Another substantial concern in the current market structure relates to the order routing practices of brokers,
including the ability of large institutional customers to monitor those practices.” Securities and Exchange Commission
(SEC) Chair Mary Jo White, keynote address, Securities Traders Association, September 14, 2016. 3 According to Dan Royal, global head of trading at Janus Henderson, “Often we are left at the mercy of the analysis
provided by the broker and as buy-siders we can be very skeptical of the data. Nobody will tell you if there is a conflict
of interest...” “The order routing enigma”, The Trade, October 18, 2017.

2
the broker’s handling of client orders: monetary benefits received from third parties; bundling of
other client services with executions; and affiliated venues that have benefits for brokers.
Battalio, Corwin and Jennings (2016) study the impact of monetary benefits related to
exchange pricing models. They note that fees and rebates to brokers from venues are not generally
passed on to retail clients. The study finds that routing of non-marketable retail orders to venues
with higher rebates hurts execution quality of client orders. When brokers bundle ancillary services
(‘soft dollars’) such as research and IPO allocations alongside order execution, it raises the
possibility that clients are less likely to select brokers based on the quality of executions. Consistent
with this idea, Conrad, Johnson and Wahal (2001) show that institutional orders routed to brokers
with soft dollar arrangements are associated with higher trading costs.
In this study, we examine a largely unstudied, potential source of agency conflict – routing
of client orders by brokers to Alternative Trading Systems (ATSs) that they own. We study three
questions. Do brokers show a persistent preference for routing orders to affiliated ATSs? Is there
a systematic association between routing preference and execution quality? Finally, can order
routing be explained by a preference for exchange versus ATS venues rather than affiliated versus
unaffiliated venues?
Venue ownership can influence the broker’s routing decisions in several ways. When
trading on affiliated-venues, the broker avoids paying the fees associated with trading the client’s
order on other venues.4 Depending on the ATS, market makers and other participants may also be
charged a fee for trading with order flow in ATS. Thus, matching buyers and sellers directly on an
4 ATS fees are individually negotiated between the ATS operator and the participant. NYSE estimates a fee of
$0.0010 per share for trading on an ATS (https://www.nyse.com/equities-insights#20181107). This is consistent
with fee ranges mentioned by industry participants of $0.0005 to $0.0015 per share. A similar trade-off applies to
trading the client’s order on an exchange based on the net fees (the difference between the fee and the rebate), with
the benefits of affiliated-venues being larger for liquidity demanding order on an exchange.

3
affiliated venue can generate benefits to the brokerage firm. Further, order routing decisions are
typically influenced by a venue’s market share and historical fill ratios, among other factors.
Higher trading activity on a broker’s ATS is a mark of success, which is likely to attract other
traders to the venue, thus earning additional revenues for the brokerage firm. These benefits can
create an incentive to route customer orders to affiliated ATS even when it is not optimal to do so.
On the other hand, brokers have a duty of best execution to their clients, which generally
requires brokers to seek executions that are as favorable as possible under prevailing market
conditions. Routing to an affiliated ATS can improve client executions in several ways. A broker
can efficiently source liquidity from an affiliated ATS if the ATS order book information is
available to the broker. Competing brokers may have limited access to a broker’s affiliated ATS,
thus offering the client with an additional venue. Other potential benefits to clients accrue from
the often-noted benefits of ATSs over exchanges – the opportunity to execute orders with less
information leakage, the potential for price improvement, and the ability to select which market
participants or order flow type to interact with (see IOSCO (2017)). Given these potential benefits
that clients may realize, it is unclear whether, and in which direction, routing to affiliated ATS
affects the execution quality of client orders.
To the best of our knowledge, there is no existing empirical work on the relation between
venue ownership, broker routing and execution outcomes, which is likely due to the lack of suitable
data.5 In this study, we use the FINRA Order Audit Trail System (OATS) database that provides
detailed information on broker’s handling of orders. These broker-level orders (henceforth “top
orders”) include the identity of the broker handling an order; the venue-specific routing decisions;
the venue-specific outcomes such as order executions and the execution price; and the time stamps
5 There is anecdotal evidence that ATS ownership leads brokers to route client orders to affiliated venues.
https://www.babelfishanalytics.com/news/2017/5/30/the-truth-behind-broker-routing-dont-believe-the-hype

4
associated with each routing, modification, execution or cancellation decision in an order’s
lifecycle.6 Our sample consists of over 330 million institutional top orders that are received by 43
active institutional brokers for a size-stratified sample of 273 stocks in October 2016.7 The average
size of the top order based on an aggregation at the broker-stock-day is 1,371 shares with large cap
stocks being associated with larger orders.
Our results indicate that not all brokers that own an ATS show a preference to route orders
to an affiliated ATS. Our approach to identifying brokers with a preference for affiliated ATS
routing is as follows. On a stock-day, we estimate the deviation between a broker’s proportion of
share quantity that is routed to its affiliated ATS and the aggregate proportion of share quantity
routed by all brokers as a group to their respective affiliated ATSs. We calculate the equally
weighted average of these deviations for each broker over all stock-days, and place brokers into
terciles based on average deviations over the sample period.8 Brokers with the highest proportion
of affiliated ATS routing are placed in tercile 3 (T3). For T3 brokers, routing to ATSs accounts for
64% of the routed quantity, largely attributable to affiliated ATS routing (50% of the routed
quantity), while for brokers in middle (T2) and lowest (T1) terciles, routing to ATSs (affiliated
ATS) accounts for 25% (6%) and 10% (0%) of the routed quantity, respectively.
We study the relation between affiliated ATS routes and fill rates of top orders. Fill rate
over a top order’s “lifecycle” is the ratio of the filled shares to the total shares (i.e., submitted
quantity) for a top order. Filled shares for the top order are aggregated across all the routes
6 The data are similar to those underlying the statistics created by FINRA for the tick size pilot. More details are
available at http://www.finra.org/industry/tick-size-pilot-program. The advantages of the OATS data in comparison
to NYSE TAQ data and Abel-Noser institutional trading academic data are discussed in Section 3. 7 In light of the size of the OATS data, we limit our analysis to October 2016, which represents a recent month when
we initiated the project, for the 30 largest stocks in each CRSP market cap decile. We obtain a final sample of 273
stocks after data filters, as detailed in Appendix B. 8 Our sample of active institutional brokers includes those with no affiliated ATSs. As expected, we observe a
smaller proportion of brokers with affiliated ATSs in tercile 1 than tercile 3.

5
associated with the top order regardless of the number of routes and the type of trading venue used
to achieve the fills. T3 brokers are associated with lower (17%) fill rates relative to T1 (44%) and
T2 brokers (30%). After controlling for stock attributes, order characteristics and market
conditions in a multivariate regression framework, a one standard deviation increase in affiliated
ATS routing is associated with an 11.6 percentage point decline in fill rates.
Are the lower fill rates for affiliated ATS routing offset by favorable transaction prices and
less information leakage? We estimate trading costs based on the implementation shortfall
approach, which accounts for fill rates, bid-ask spreads, market impact, and the drift in price during
an order’s lifecycle (see Perold (1988) and Wagner and Edwards (1993)).9 One limitation of the
OATS data is that client’s motivation for the trade, or the client’s instructions to the broker (e.g.,
order urgency) are not captured. We therefore report several measures of trading costs that
accommodate a range of assumptions on the opportunity costs of the unfilled portion of orders.
For institutions that incur an opportunity cost of unfilled orders, the results suggest that
higher levels of affiliated ATS routing are associated with higher implementation shortfall costs.
Affiliated routes are associated with a larger price drift over the five minutes after the end of an
order life cycle, which is not consistent with the view that affiliated routes lower market impact
due to information leakage. The differences across brokers terciles in fill rates and implementation
shortfall costs are persistent over the month.
The client’s selection of a broker is an endogenous choice that could potentially impact our
results. That is, the client’s desire to seek liquidity on ATSs is reflected in broker routing. To
9 For an order that is fully executed, implementation shortfall is calculated by comparing the weighted average trade
price with the prevailing NBBO quote midpoint at order arrival time. For orders with less than 100% fill rates, we
impute an execution for unfilled portion of the order using either the closing price of the trading day, or the
prevailing opposite NBBO quote (i.e., prevailing best quoted ask (bid) price for buys (sells)) at the time of the last
observed event in the lifecycle. We also report effective spread costs, following the terminology in Perold (1988),
which ignore the portion of the order that is unfilled, effectively assuming that opportunity cost of the unfilled
portion is zero.

6
address this issue, we compare brokers with high affiliated ATS routing with other brokers with
similar levels of ATS (but not affiliated ATS) routing on the same stock-day. By controlling for
the proportion of overall ATS routing across brokers, the analysis accounts for the client’s
unobserved potential preference to access ATS venues, thus isolating the impact of affiliated ATS
routes on execution outcomes. After controlling for market conditions and order characteristics,
brokers with high affiliated ATS routing have fill rates that are 5.6 percentage points lower and
implementation shortfall costs that are 1.13 to 1.95 basis points higher relative to matched brokers.
These estimates translate to implementation shortfall costs that are 5.3% to 19.7% higher for
brokers with high affiliated ATS routing.
In a second analysis, we account for a client’s possible preference for seeking liquidity on
ATSs by adapting the paired route “horse race” approach developed by Sofianos, Xiang and
Yousefi (2010) and Battalio, Corwin, and Jennings (2016) to our empirical setting. We pair
individual routes made by T3 brokers to affiliated ATSs with other identically priced, concurrent
routes to unaffiliated ATSs. The pairs are midpoint peg orders (a commonly used order type that
dynamically updates its limit price to the NBBO midpoint) that are open at the same time and are
submitted under similar market conditions. Our results indicate that unaffiliated ATS routes have
higher fill rates and more likely to obtain an earlier fill than matched T3 affiliated ATS routes.
Although the two analyses that explore broker selection examine a smaller sample of orders, we
do not find support for the explanation that the clients’ preference for ATSs explains our results.
Institutional investors face many challenges in measuring broker performance including
opacity in order handling and complexity in equity market structure.10 Our results indicate that
10 Institutional investors’ concerns are the impetus behind the SEC’s initiative to bring transparency to the handling
of institutional order flow (See pages 11, 33-34, SEC (2016) “The Commission preliminarily believes that market-
based efforts to provide institutional order handling transparency may not be sufficient insofar as smaller institutional
customers may lack the bargaining power or the resources to demand relevant order handling information from their

7
regulatory and industry initiatives aimed at improving order handling disclosures would help
institutions understand the impact of broker routing. We caution that ownership of a venue by itself
does not constitute evidence of routing conflicts or customer harm; indeed, not all brokers that
own an ATS show a preference for their venues. We recognize that institutional clients could
receive benefits from brokers that extend beyond execution services, or that commissions could
be systematically lower for brokers with high affiliated routing. It is also possible that clients’
preference for low commissions dictates brokers’ choice to route to low cost venues such as their
affiliated ATSs. In those cases, our study provides institutions with guidance on comparing the
value of the bundled services or commission savings with differences in execution quality
outcomes.
The rest of the paper is organized as follows. Section 2 presents the related literature while
Section 3 describes data sources, sample selection and summary statistics. In section 4, we present
the patterns of broker routing and its association with execution quality. Section 5 concludes.
2. Related literature
This study is related to the literature on brokers’ routing of order flow pursuant to monetary
benefits from third parties. Easley, Kiefer and O’Hara (1996) provide evidence that payment for
order flow arrangements siphon away uninformed order flow from public markets. Battalio (1997)
and Battalio, Greene, Hatch and Jennings (2002) do not find that purchased order flow is associated
with a deterioration in execution quality or quote competitiveness across venues. Several recent
studies examine whether order routing is impacted by the fees and rebates at exchanges. Cardella,
broker-dealers. In addition, while many institutional customers regularly conduct, directly or through a third-party
vendor, transaction cost analysis (“TCA”) of their orders to assess execution quality against various benchmarks, the
Commission preliminarily believes that the comprehensiveness of such analysis could be enhanced with more granular
order handling information”. (https://www.sec.gov/rules/proposed/2016/34-78309.pdf)).

8
Hao and Kalcheva (2017) show that venue fees impact the market share of exchanges. Anand, Hua
and McCormick (2016) and Battalio, Griffith and Van Ness (2016) document changes in order
routing to options exchanges in response to fee changes. We add to these studies by studying
whether ownership of venues impacts the order routing decision.
Our study contributes to the literature that is motivated by the growth of market share of
ATSs (Angel, Harris and Spatt (2015)). In describing the tradeoffs between exchanges and ATSs,
Zhu (2014), Buti, Rindi and Werner (2017), and Menkveld, Yueshen and Zhu (2017) posit that
exchanges offer the benefits of obtaining immediacy at a marked-up price while ATSs offer the
opportunity to obtain better prices at a higher execution risk. Empirical studies of this tradeoff and
its implications for market quality include Hendershott and Jones (2005), Ye (2010), Tuttle (2013),
Kwan, Masulis and McInish (2015), Comerton-Forde and Putnins (2015) and Reed, Samadi, and
Sokobin (2018), among others.11
Given these trade-offs, a broker’s decision to seek liquidity from an ATS venue, including
an affiliated ATS, can be the optimal strategy for certain orders. Potential benefits to clients include
the ability to trade within the bid-ask spread, to execute orders with less information leakage, and
to access a private pool of liquidity that has lower toxicity. On the other hand, agency conflicts
may lead brokers to select affiliated ATSs under circumstances that differ from those when
choosing unaffiliated ATSs. Selecting an affiliated ATS when it is not optimal to do so may lead
to missed trading opportunities on other venues.12 In the presence of agency conflicts, we predict
that a broker’s propensity to route orders to affiliated ATSs could lead to worse outcomes for
11 A related literature examines undisplayed liquidity on lit venues such as exchanges. For example, in an
experimental framework, Bloomfield, O’Hara and Saar (2015) study the effects of allowing hidden liquidity in limit
order books on trader strategies and market outcomes. Anand and Weaver (2004) and Bessembinder, Panayides and
Venkataraman (2009) provide related empirical evidence. 12 “A Suspect Emerges in Stock-Trade Hiccups: Regulation NMS”, Wall Street Journal, January 27, 2014.

9
clients.
Our work is also related to the other studies that examine the interaction between high
frequency traders (HFT), brokers and market quality. Hendershott, Jones and Menkveld (2011),
Brogaard, Hendershott and Riordan (2014), Brogaard, Hagstromer, Norden and Riordan (2015)
and Boehmer, Li, and Saar (2018) find that HFTs are associated with improved market quality and
price efficiency. However, a recent literature links the market impact of institutional orders to HFT
“back-runners” who detect order flow “footprints” and trade ahead or alongside the institutional
investor (see Yang and Zhu (2017) for theory and Kirilenko, Kyle, Samadi and Tuzun (2017), Van
Kervel and Menkveld (2018), Saglam (2018), and Korajczyk and Murphy (2018) for empirical
evidence). In this context, sub-optimal routing by a conflicted broker to an affiliated ATS could
over expose the order and increase the price impact of institutional trades.
3. Data and sample description
3.1. Data sources and sample
The primary dataset used in the study is the FINRA OATS database for the month of
October 2016. Almost every broker-dealer in the U.S. is required to report audit trail information
on equity orders to FINRA.13 For each broker-level parent order (“top order”) received from a
client, OATS provides information detailing how the broker handled the top order. The dataset
combines the identity of the broker handling the order, the beneficiary owner type, and the
submitted quantity of the broker-level order, with the audit trail of routes, venues, executions,
modifications, and cancellations associated with the order’s lifecycle.14
13 Broker-dealers in the US are required to provide an audit trail to their primary Self-Regulatory Organization
(SRO). FINRA is the largest SRO responsible for the regulation of over 3,800-member firms in 2016. 14 Werner (2003) uses an earlier iteration of OATS for an analysis of the impact of decimalization on institutional
trading costs. Relative to the older data, we note some differences: the current version of OATS is linked to routes
and executions in all venues; and the number of orders is significantly larger.

10
The OATS data are distinct from transaction level data such as the consolidated tape, or
Trade and Quote (TAQ) data in providing a complete audit trail of broker level top orders. Our
data are also distinct from institutional ticket academic data made available by Abel-Noser
Solutions that were used by Puckett and Yan (2011) and Anand, Irvine, Puckett, and Venkataraman
(2012, 2013). One limitation of OATS data is that, while it is possible to “stitch” together orders
handled by a broker for an institution (i.e., top order), it is not possible to further stitch together
orders split by the institution across multiple brokers, or submitted to the broker at a later time. An
advantage of OATS data is the detailed information on the broker’s handling of the top order and
venue-level execution outcomes, which are not available in Abel-Noser academic data.
Appendix A describes the selection of 43 large, institutional brokers that exhibit a pattern
of routing orders to a broad set of execution venues. Since order splitting is common in recent data,
it is challenging to use order size-based definitions to identify institutional flow. For this reason,
our classification differs from studies that use order size to identify institutional order flow (see
Campbell, Ramadorai and Schwartz (2009) for a review of these studies).
We identify institutional brokers based on the beneficiary owner classification field from
OATS, in combination with the institutional broker classification of Griffin, Harris, Shu, and
Topaloglu (2011). The beneficiary owner field indicates whether an order represents institutional,
individual, market maker, or proprietary interest.15,16 Griffin et al. (2011), classify institutional
brokers based on “company web pages, news media, the NASD website, and conversations with
15 FINRA rule 4512 (c) defines institutions as a “bank, savings and loan association, insurance company or registered
investment company; an investment adviser registered either with the SEC under Section 203 of the Investment
Advisers Act or with a state securities commission (or any agency or office performing like functions); or any other
person (whether a natural person, corporation, partnership, trust or otherwise) with total assets of at least $50 million”.
Agency orders that do not meet the criteria of the rule are classified as individuals. 16 Comment letters from Bloomberg LP and Fidelity encourage the SEC to use the FINRA definition of institutions
instead of a size-based cutoff to separate institutional and retail order flow. See https://www.sec.gov/comments/s7-
14-16/s71416-15.pdf, and Fidelity letter at https://www.sec.gov/comments/s7-14-16/s71416-26.pdf.

11
NASDAQ officials.” We exclude brokers that are primarily associated with internalized flow or
serve as conduits, sending 100% of received order flow to ATSs. We focus on “active” brokers
that handle at least 10,000 institutional top orders in October 2016. As a validation check, our
sample of 43 institutional brokers includes nine of the largest 10 brokers in a 2014 sample of
institutional trading data from Abel-Noser Solutions. Using the FINRA broker reference file,
which specifies the firm associated with each broker ID, we identify the brokers affiliated with
firms that also own an ATS in the FINRA ATS transparency data.17
As described in Appendix A, we do not differentiate between “directed” and “not directed”
(or “not held” orders). To provide some context, directed orders are those where the client specifies
the venue and pricing choice and limits the broker’s discretion on how the order is executed. Rule
606, which requires the disclosure of order handling statistics by brokers, excludes directed orders
from these reports. We include directed orders in our analysis because our data are not sufficiently
detailed about the extent of broker discretion associated with an order.18 To the extent that, we
incorrectly attribute venue choice to the broker, our results can be alternatively interpreted as a
reflection on institutional clients’ venue choice or some combination of the two.
Our sample consists of a size-stratified group of 273 stocks traded in October 2016.19 To
construct the sample, we form decile portfolios using CRSP data on market capitalization at the
end of December 2015 and select the 30 largest stocks from each decile. We merge the initial
17 We examine direct ownership of an ATS where potential private benefits are largest. Consortiums of institutional
participants own some ATSs. These ATSs are not classified as affiliated in our sample. 18 Conceptually, an order can be classified as directed or not-held based on who makes the routing decision but in
reality, the implementation of Rule makes it difficult to attribute the routing decision to broker or client. For
example, it appears that the rule does not differentiate between a case where the client simply uses a broker’s default
setting in an algorithm versus those where client changes the default algorithm settings to select a specific venue.
Specifically, if a client uses the default setting in a broker’s smart order algorithm, then the order is considered as a
directed order (https://www.sec.gov/interps/legal/mrslb13a.htm#q3). Further, if the order does not execute on the
venue and is rerouted by the broker, it is still considered a directed order. 19 Our sample period overlaps with the implementation period of the tick-size pilot. We obtain qualitatively similar
results when we restrict the sample to stocks unaffected by the tick-size pilot.

12
sample with the OATS database and TAQ National Best Bid and Offer (NBBO) quotes. We apply
a number of data filters to obtain a final sample of 273 stocks. The sample construction and data
filters are detailed in Appendix B. We classify stocks from the bottom three CRSP deciles as
“small”, the middle four deciles as “medium”, and the top three deciles as “large” stocks. The final
sample consists of over 330 million lifecycles of the institutional top orders received by the 43
institutional brokers in sample stocks.
3.2. Measures of execution quality
The first measure of execution quality, the fill rate is the filled quantity divided by the submitted
quantity of a top order. In the implementation shortfall approach, orders with fill rates below 100%
incur an opportunity cost for unfilled portion of an order (see Perold (1988), Wagner and Edwards
(1993)). We employ three approaches to measure opportunity costs that reasonably reflect the
idiosyncratic preferences of institutional clients. Effective spread cost assumes that institutions
incur no opportunity cost when an order is unfilled. Following Perold (1988) and Anand et. al.
(2012), the measure for order lifecycle i received by broker b is calculated as follows:
Effective spread cost(b,i) = 𝑃1(𝑏,𝑖)−𝑃0(𝑏,𝑖)
𝑃0(𝑏,𝑖)× 𝐷(𝑏,𝑖),
(1)
where 𝑃1(𝑏,𝑖) is the share volume-weighted execution price, 𝑃0(𝑏,𝑖) is the benchmark price, the
NBBO bid-ask quote midpoint at the time when the broker receives the top order, and 𝐷(𝑏,𝑖) is a
variable that equals 1 for buy orders and equals -1 for sell orders.
The next two measures impute an execution for the unfilled portion of an order. Shortfall
cross follows Harris and Hasbrouck (1996) and Handa and Schwartz (1996) and assumes that
traders cross the spread to trade at the opposite quote at the end of the life cycle:
Shortfall cross(b,i) = [𝑓(𝑏,𝑖) ×𝑃1(𝑏,𝑖)−𝑃0(𝑏,𝑖)
𝑃0(𝑏,𝑖)× 𝐷(𝑏,𝑖)] + [(1 − 𝑓(𝑏,𝑖)) ×
𝑂𝑄(𝑏,𝑖)−𝑃0(𝑏,𝑖)
𝑃0(𝑏,𝑖)× 𝐷(𝑏,𝑖)],

13
(2)
where 𝑓(𝑏,𝑖) is the fill rate and 𝑂𝑄(𝑏,𝑖) is the ask (bid) quote for buy (sell) orders at the time of the
last event in the order’s lifecycle. Shortfall close assumes that traders are able to fill the unfilled
quantities in the daily closing auction. We define shortfall close as follows:
Shortfall close(b,i) = [𝑓(𝑏,𝑖) ×𝑃1(𝑏,𝑖)−𝑃0(𝑏,𝑖)
𝑃0(𝑏,𝑖)× 𝐷(𝑏,𝑖)] + [(1 − 𝑓(𝑏,𝑖)) ×
𝐶𝑙𝑜𝑠𝑒(𝑏,𝑖)−𝑃0(𝑏,𝑖)
𝑃0(𝑏,𝑖)× 𝐷(𝑏,𝑖)],
(3)
where 𝐶𝑙𝑜𝑠𝑒(𝑏,𝑖) is the closing price obtained from CRSP. Shortfall close follows the approach in
Keim and Madhavan (1997) and Conrad, Johnson and Wahal (2001), except that these studies use
a closing price on subsequent days since the orders in their sample span several days.
We also calculate price movements during the lifecycle and after the end of the lifecycle.
Institutions are concerned that sub-optimal broker routing practices lead to information leakage on
the presence of the order. In particular, adverse price moves over the life of a top order increases
trading costs for the order itself as well as for subsequent orders for an institution that trades a
large quantity across multiple brokers and over time. We calculate the price movements during the
lifecycle as:
Drift(b,i) = 𝑃𝑇(𝑏,𝑖)−𝑃0(𝑏,𝑖)
𝑃0(𝑏,𝑖)× 𝐷(𝑏,𝑖),
(4)
where 𝑃𝑇(𝑏,𝑖) denotes the quote midpoint at the time of the last observed event in the order’s
lifecycle. Finally, an institution that trades an order by splitting it over time is concerned about the
impact of a broker’s decisions on subsequent slices of the order. We capture this effect in the post-
drift defined as:

14
Post-drift(b,i) = 𝑃𝑇+5(𝑏,𝑖)−𝑃𝑇(𝑏,𝑖)
𝑃𝑇(𝑏,𝑖)× 𝐷(𝑏,𝑖),
(5)
where 𝑃𝑇+5(𝑏,𝑖) denotes the quote midpoint five minutes after the last observed event in the order’s
life cycle. Among other things, the price drift observed during and after the order cycle captures
the liquidity premium incurred by the order and any effects of information leakage regarding the
order. The post-drift measure is similar to price impact measure used in the literature (see
Hasbrouck (2006)), except that price impact is conditional on observing a trade.
3.3. Descriptive Statistics
Table 1 describes the sample. For each broker, we calculate the weighted average of the
order and market quality measures across top orders received on a stock-day, where the weights
are the quantity of the top order. Table 1 presents equally weighted averages of broker-stock-day
observations. Thus, the reported statistics represent order characteristics and outcomes of order
handling decisions of an average broker on the average stock-day.
One notable statistic is that the size of the (client-broker) top order for our sample averages
1,371 shares, with the average for large stocks at 1,915 shares and that for small stocks at 548
shares. In comparison, the average reported trade size in the consolidated tape or Trade and Quote
(TAQ) database is less than 200 shares.20 For buy side institutions (mutual funds and pension
funds) that report to Abel Noser database, Hu (2018) reports that the size of an institutional ticket
that is distributed across brokers average 3,136 share in 2011, and that ticket size has been
declining over the 2000 – 2011 period.
20 See Angel, Harris and Spatt (2015) and O’Hara (2015). Tuttle (2013) shows that 100 share trades account for
approximately 70% of trades executed in exchanges and ATSs.

15
The average percentage quoted bid-ask spread at the time of order arrival is 37 basis points,
and ranges from 7.6 basis points for large stocks to 102.5 basis points for small stocks. Given the
large variation in liquidity across stocks, we present univariate results separately for small, medium
and large stocks, and include stock fixed-effects in the multivariate regressions. The average fill
rate across broker-stock-days is 30.3%. Fill rates range from 22.7% for small stocks to 37.7% for
large stocks, underlining the challenge in finding liquidity in small stocks.
Effective spread costs are significantly smaller (2.5 basis points) than quoted half-spreads
(18.5 basis points), the quoted cost of a one-way trade, at the time of order arrival, indicating that,
on average, institutional orders do not aggressively seek liquidity. As expected, shortfall close
yields smaller estimates of execution costs at 7 basis points, compared to 16.2 basis points for
shortfall cross.21 Smaller stocks are more expensive to trade than larger stocks. On average, prices
move adversely in the direction of the order. The average drift is 3.4 basis points and the average
post-drift is 0.7 basis points, with larger drifts observed for smaller stocks. The natural
interpretation is that post-drift measures the extent of information leakage about an order but an
alternate interpretation is that a larger post-drift captures market conditions under which orders are
more difficult to fill. This is because a limit order is more likely to be cancelled when the price
moves away from the order. In some specifications, we include post-drift as an additional measure
of market conditions to account for potential differences in order difficulty across brokers.
3.4. Venue choice statistics
Table 2 describes the average routing of our sample of brokers to three broad categories of
venues – ATSs, exchanges and firms. “Firms” refers to brokers that act as execution venues; for
21 Effective spread costs are significantly smaller than implementation shortfall costs since the effective spread costs
measure the unfilled portion of an order. Also, effective spread costs can only be calculated for top orders that
receive at least a partial fill.

16
example, large wholesalers that purchase order flow fall in this category. Table 2 shows that, across
all stocks, the proportion of executions in a venue type is strikingly different from the proportion
of routes. Although exchanges receive only 58.8% (54.8%) of the routes (routed quantity) on the
average broker-stock-day, they account for 77.8% (73.8%) of executions (executed quantity). In
contrast, ATSs receive 29.5% (32.5%) of the routes (routed quantity) but account for only 13.4%
(16.7%) of executions (executed quantity). We observe similar patterns across all stock categories.
4. Results
4.1 Affiliated ATS routing
Table 3 examines a brokers’ propensity to route orders to affiliated ATSs. For each broker-
stock-day, we calculate the proportion of routed quantity sent by the individual broker to its
affiliated ATS. The benchmark for each stock-day is the proportion of total routed quantity sent
by all brokers as a group to their respective affiliated ATSs. We calculate the deviation for a broker
from the stock-day benchmark and divide the brokers into terciles based on their average deviation
across all stock-days in our sample. Specifically, by design, Tercile 1 (T1) brokers use affiliated
ATSs less than the benchmark while tercile 3 (T3) brokers use affiliated ATSs more than the
benchmark. Table 3 presents average statistics on venue choice across the broker-stock day
observations.
Results in Table 3 indicate large differences in routing behavior across broker terciles. T1
and T2 brokers route 10.2% and 25.3% of shares to ATSs, respectively. T1 brokers do not route
to affiliated ATSs, while T2 brokers route 6.5% of shares to affiliated ATSs. In the case of T1 and
T2 brokers, 70.8% and 62.3% of shares are routed to exchanges. Approximately 77% (74.5%) of
executed quantity for T1 (T2) brokers occurs on exchanges.

17
T3 brokers differ markedly from the other two groups with 49.9% of their routed quantity
sent to affiliated ATSs, and all ATSs accounting for 63.6% of routed quantity. Furthermore, T3
brokers show a large difference between the proportion of routed quantity (49.9%) and execution
quantity (16.8%) occurring on affiliated ATSs. The majority of T3 brokers’ executions occur on
exchanges. Notably, although exchanges account for only 30.1% of T3 brokers’ routed quantity
they account for 70% of executed quantity. The differences between the routing preferences of T3
brokers versus the other groups are statistically significant in the full sample. 22
In Panel B, we examine whether the ranking of institutional brokers based on affiliated
ATS routing is persistent. Specifically, we classify brokers into terciles based on average stock-
day deviations of affiliated ATS routing during the first week of October 2016 and then report
statistics for remaining weeks in the month. We report the retention rate, which is the percentage
of brokers who continue to be classified in the same tercile in future weeks. The patterns indicate
that broker ranks based on affiliated ATS usage is highly persistent. In all future weeks, the
affiliated ATS routing statistic increases from tercile 1 to tercile 3 and the retention percentage
exceeds 80 percent indicating that brokers’ routing behavior stays similar over time.
4.2 Execution Quality: Univariate Statistics
Anand et. al. (2012) document significant variations in the trade execution costs of buy-
side institutions. Among other factors, trading costs are lower when institutions use the services
of a skilled broker, and further some brokers are able to provide low-cost executions in a persistent
manner. We extend this analysis by examining whether broker routing practices can explain
22 Order sizes for T3 brokers are smaller than T1 or T2 brokers. In an unreported analysis, we find that these
differences are driven by smaller order sizes for T3 brokers in large stocks. In medium size stocks order sizes for T2
and T3 brokers are of similar magnitude, and in small stocks orders received by T3 brokers are larger than those
received by T2 brokers. We control for order size and stock attributes in our multivariate analyses.

18
variations in trading costs across brokers. Table 4.A. presents average execution outcomes for
broker terciles formed on affiliated ATS routing. The average fill rate of orders handled by T3
brokers is significantly smaller than the fill rates for orders handled by T1 or T2 brokers. The
average fill rate across broker-stock-days is 43.5% for T1 brokers, 29.8% for T2 brokers and only
16.9% for T3 brokers. The differences in fill rates are not simply an artifact of brokers receiving
orders in different stocks, as similar patterns exist for small, medium and large stocks.
Trading costs based on the effective spread cost measure assume that the unfilled part of
the order is associated with zero opportunity costs. In the overall sample, the effective spread costs
of T3 brokers are 3.2 bps, followed by 3.1 bps for T2 brokers and 1.1 bps for T1 brokers. T3
brokers have higher costs than T1 brokers for medium and large stocks while the differences are
not statistically significant for small stocks.
Shortfall close, which assumes that the unfilled part of the order executes at the closing
price, is larger for T3 brokers at 10.7 bps than for T1 (3.2 bps) or T2 (7.5 bps) brokers. T3 brokers
have statistically significantly larger shortfall close relative to T1 and T2 brokers for the overall
sample and for small, medium and large stocks. The results are broadly similar for shortfall cross,
which assumes that the unfilled part of the order is executed at the opposite quoted price at the end
of the lifecycle. The average shortfall cross for T3 brokers is approximately 20.5 basis points,
which is significantly larger than the 10 bps for T1 brokers and 18.4 bps for T2 brokers.
Notably, adverse price movements, as captured by post-drift, are significantly larger for T3
brokers relative to T1 and T2 brokers for the overall sample, as well as sub-samples based on
market capitalization. These results don’t support the view that routing to affiliated ATSs may be
associated with lower information leakage. Price movements during the lifecycle, as captured by
drift, do not show consistent differences across broker terciles.

19
Another possibility is that institutions use T3 brokers when market conditions are difficult
to execute an order. We report the percentage quoted spreads prevailing at the time a broker
receives a top order. For the overall sample, arrival spreads are 44 bps for T3 brokers, 40 bps for
T2 brokers and 27 bps for T1 brokers. However, results in Panels B to D indicate that patterns are
quite different across market capitalization groupings. For large stocks, arrival spreads for T3
brokers are in fact statistically lower than other groups; for medium stocks, the differences are not
statistically significant, and for small stocks, arrival spreads of T3 brokers are larger than other
groups. These patterns suggest that it is important to control for stock characteristics, order
difficulty and market conditions.
4.3 Multivariate analysis of execution costs
Table 5 examines the relation between ATS executions and execution quality based on
multivariate regression specifications where control variables account for stock characteristics,
order attributes and market conditions. We estimate the following regression models:
𝑌𝑖,𝑠,𝑡 = 𝛽1%𝐴𝑓𝑓𝑖𝑙𝑖𝑎𝑡𝑒𝑑 𝐴𝑇𝑆𝑖,𝑠,𝑡 + β′𝐗 + 𝐹𝐸 + 𝜖𝑖,𝑠,𝑡,
(6)
where 𝑌𝑖,𝑠,𝑡 is the execution outcome for broker i in stock s on day t. Outcomes include: fill
rates, effective spread costs, shortfall close, shortfall cross, drift and post-drift. The variable of
interest, %Affiliated ATS, is a continuous measure of the proportion of routed quantity to affiliated
ATSs by broker i in stock s on day t. X is a vector of control variables: log of average order size
on the broker-stock-day, the average arrival percentage quoted spread on the broker-stock-day and
stock controls including the log of the stock price, log of the market capitalization and the sum of
squared five-minute mid-quote log returns (realized volatility) for each stock-day. Order size
accounts for the well-known result that order difficulty increases with order size. Arrival-time

20
spreads account for variation in market liquidity over time. Stock attributes, such as price, market
cap and volatility account for differences in the difficulty to execute orders across stocks. In
specifications (3) and (4), we use stock fixed effects instead of stock characteristics. In
specifications (2) and (4), we include the average post-drift on the broker-stock-day as an
additional measure of market conditions. As discussed earlier, to the extent that broker decisions
leads to information leakage, this approach is conservative as it is reasonable to classify post-drift
as an outcome of broker decisions. Test statistics are based on standard errors that are clustered by
stock and day.
Models 1 to 4 in Table 5 report different specifications with the fill rate as the dependent
variable. The point estimates for %Affiliated ATS indicate that brokers with higher affiliated ATS
routing obtain lower fill rates, after controlling for differences in stock attributes, order
characteristics and market conditions. In all specifications, %Affiliated ATS is highly significant at
the 1% level. The most conservative estimate (model 4), suggests that a one standard deviation
increase in %Affiliated ATS is associated with an 11.6 percentage point decline in fill rates. The
economic impact of routing orders to affiliated ATSs is substantial as the average fill rate for our
sample is 30.3%. Other control variables are of the expected sign. Fill rates are positively
associated with market cap and negatively associated with larger arrival spreads.
Effective spread costs do not show a significant association with affiliated ATS routing.
On the other hand, the results indicate that affiliated ATS routing is associated with larger
implementation shortfall as measured by both shortfall close and shortfall cross. Table 5 shows
that the coefficients for shortfall close are significant at the 1% level in all four models. We note
that the inclusion of stock fixed effects and post-drift presents a stringent robustness test for these
results. Taking the most conservative estimate, the results suggest that a one standard deviation

21
increase in %Affiliated ATS is associated with a 1.7 basis points larger shortfall close for the broker,
which translates to 24.1% of the unconditional average shortfall close in the sample.
Table 5 also shows that shortfall cross is significantly larger for brokers with higher
affiliated ATS routing. The arrival spread is significant in these models, since shortfall cross
assumes that the unfilled portion of the order is executed by crossing the spread at the end of the
order lifecycle, and arrival spreads are likely to be correlated with end of lifecycle spreads.
Shortfall cross is consistent with prior literature but imposes a large cost for unfilled orders. At the
same time, the measure assumes that the entire order can be filled at the opposite quote; that is,
orders do not “walk the book” in this measure. In economic terms, the most conservative estimate
based on model (4) suggests that a one standard deviation increase in %Affiliated ATS is associated
with a 0.9 basis point larger shortfall cross for the broker, which translates to 5.7% of the
unconditional average.
Is affiliated ATS routing associated with lower information leakage? We examine the price
drift measures (drift and post-drift) in a regression framework in Table 5. We find that the drift is
decreasing in %Affiliated ATS indicating lower price movements during the lifecycle for brokers
with higher affiliated ATS routing. However, while drift is lower on a relative basis, note that the
drift measure is positive for all broker terciles, as shown in Table 4, and in aggregate, the lower
fill rates of high affiliated ATS routing expose a larger fraction of the top orders to adverse price
movements. We find that the coefficient on post-drift is positive indicating that brokers with higher
affiliated ATS routing are associated with larger adverse price moves at the end of the lifecycle.
The results do not support the view that affiliated ATS routes are associated with smaller leakage
effects at the end of the lifecycle.
4.4 Persistence in execution outcomes

22
In Table 6, we examine whether the cross-sectional variations in execution quality that we
observe based on broker’s use of affiliated ATS are persistent. Based on affiliated ATS routing on
day t, we classify brokers into terciles and then follow execution outcomes from days t through
t+4. We first calculate the measures at the broker-stock-day observation, and then aggregate to the
broker-day observation by taking an equally-weighted average across stocks. The results on Day t
are consistent with the cross-sectional variations reported in earlier tables – T3 brokers have lower
fill rate while both, shortfall close and shortfall cross are significantly larger than T1 brokers. Fill
rates and shortfall close are also statistically larger than T2 brokers. The patterns are persistent
with almost no material change in magnitudes over the future days t+1 through t+4. An
implication is that improved transparency on brokers’ routing practices will help institutions with
broker selection that accounts for routing preferences.
4.5 Matched brokers based on ATS routing preferences
The theoretical literature points to the possibility that orders routed to ATSs differ from
orders routed to exchanges in ways that may not be entirely captured by control variables in our
analysis (see Hendershott and Mendelson (2000), Ye (2010), Zhu (2014), Buti, Rindi and Werner
(2017) and Menkveld, Yueshen and Zhu (2017), among others). For example, it is possible that
clients route orders with the intent of seeking liquidity on ATSs. It would be useful to incorporate
the client’s intent as an explanatory variable; however, transaction databases, such as TAQ,
academic Abel Noser and OATS do not capture sufficiently detailed information to measure client
intent.
In this analysis, we attempt to account for potential selection effects by matching brokers
who route to affiliated ATSs to other brokers who route to unaffiliated ATSs. Specifically, using
nearest neighbor one-to-one propensity scores, we match a T3 broker on a stock-day with a T1 or

23
T2 broker on same stock-day with similar proportion of share quantity routed to ATSs. Notably,
while the treatment (T3) and control (T1 or T2) brokers have similar proportion of ATS routing,
the treatment (T3) brokers route a significantly higher proportion of share quantity to affiliated
ATSs while the control group route a significantly higher proportion of share quantity to
unaffiliated ATSs. The analysis helps account for the client’s desire for ATS executions and
isolates the impact of affiliated versus unaffiliated ATS routing.
In comparison to the unconditional analysis reported in Table 5, we note that the matched
analysis might selectively represent market conditions that favor ATS routing. That is, on a stock
day when market conditions do not favor ATS routing, it is possible that T1 or T2 brokers route
less to ATSs than T3 brokers, and those stock days are less likely to be represented in the matched
analysis due to lack of control group observations. However, the analysis adds useful robustness
by helping control for client’s desire for ATS execution and isolates the impact of agency conflicts.
Since treatment and control brokers are matched on a stock-day, the research design helps
account for stock attributes and daily market conditions that influence both broker selection and
order handling. Using a caliper of one quarter of a standard deviation, we are able to obtain a well-
matched sample based on overall ATS routing. For the 38,548 matched broker-stock-days in the
sample, the average proportion of routed quantity to ATSs for the treatment group is 51.2% and
for the control group is 50.1%. By construction, the two groups differ on affiliated ATS routing.
Affiliated ATS routing accounts for 41.5% of routed quantity for the treatment group but only
7.2% for the control group. We estimate the following specification to examine differences in
execution outcomes for T3 brokers relative to matched brokers:
𝑌𝑖,𝑠,𝑡 = 𝛽1𝑇3𝑖,𝑠,𝑡 + β′𝐗 + 𝐹𝐸 + 𝜀𝑖,𝑠,𝑡 (7)

24
where 𝑌𝑖,𝑠,𝑡 is the execution outcome for broker i in stock s on day t. 𝑇3𝑖,𝑠,𝑡 equals one for
T3 brokers and equals zero for control brokers. The vector of control variables, X is limited to
those that vary within a stock-day, including the log of the average order size on the broker-stock-
day, the average arrival-time percentage quoted spread on the broker-stock-day, and the post-drift.
Importantly, the specification includes matched-pair fixed effects, allowing 𝑇3𝑖,𝑠,𝑡 to capture
paired differences. Test statistics are based on standard errors clustered by stock and day.
Table 7 presents the results. Fill rates for T3 brokers are significantly lower (5.6 percentage
points) than for matched brokers. Effective spread costs are 1.29 basis points lower for T3 brokers,
with estimates statistically significant at the 10% level. T3 brokers’ shortfall close and shortfall
cross are significantly larger. In the most conservative estimates, shortfall close is 1.95 basis points
larger for T3 brokers (significant at the 5% level), and shortfall cross is 1.13 basis points larger
(significant at the 10% level). The shortfall close and shortfall cross estimates correspond to
incremental costs of 19.7% and 5.3% relative to their respective unconditional means in the
matched sample. Differences in post-drift are statistically indistinguishable from zero, though drift
is also significantly larger for T3 brokers. Overall, after accounting for a client’s desire to seek
liquidity on ATS venues, we find that brokers with higher affiliated ATS routing are associated
with lower fill rates. For institutions that care about the opportunity cost of unfilled orders, the
results indicate that trading costs are higher for T3 brokers. Further, the drift in price during the
top order’s life cycle is higher for T3 brokers, which does not support the argument that T3 brokers
better manage information leakage better than matched brokers.
4.6 Matched order horse races
To further account for client intentions, we adapt the paired route “horse race” approach
developed by Battalio, Corwin, and Jennings (2016) to our empirical setting. We pair individual

25
routes made by T3 brokers to affiliated ATSs with other identically priced, concurrent routes to
unaffiliated ATSs. The pairs are midpoint peg orders sent to ATSs, which are identified for child
orders in OATS data and is a common order type at ATSs in our sample period. The limit price of
these orders are dynamically updated to equal the midpoint of prevailing NBBO. We require that
(a) the matched orders to be open at the same time, (b) the first order in the pair must be
unmodified, and not have received a fill when the second order in the pair is routed, (c) at least
one of the matched orders receives a partial or complete fill, and (d) matched pegged orders arrive
during the same NBBO price, which accounts for market conditions and execution expectations
associated with the routes. Following Battalio et al. (2016), if both orders obtain an execution
within 500 milliseconds of one another, the horse race is declared a tie.
Table 8 describes the 1,421,432 matched pairs. The average fill rate, calculated as the
executed quantity of the child order divided by the order quantity of the child order, for T3 broker
affiliated ATS routes is 41.1%, which is significantly lower than 50% fill rate for the matched
unaffiliated ATS routes.23 Further, unaffiliated ATS routes are filled earlier 53% of the time, T3
affiliated ATS routes are filled earlier 42% of the time and are tied approximately 5% of the time.
Similar patterns are observed for subsamples of large, medium and small stocks. A potential
concern with the horse race analysis is that the routes may differ in execution instructions. For
example, routes to ATSs can constrain execution to a minimum amount. We confirm that results
are qualitatively similar when we remove horserace pairs where one or both orders carry a
23 We note that these fill rates for ATS-venue routes appear high due to conditioning on at least one of matches
receiving an execution. This characteristic of horse-races can also be seen in Battalio, Corwin and Jennings (2016)
and Battalio, Griffith and Van Ness (2016).

26
“minimum quantity” instruction.24 Overall, the horse race analysis supports the results that
execution quality declines with affiliated ATS routing.
5. Conclusions and Implications
Brokers play an important role in implementation of investment ideas of fund managers.
They handle the client orders under a duty of best execution, which generally requires brokers to
route orders in a manner consistent with the best interests of their clients. However, brokers face
other incentives that may influence order handling. In an important work, Battalio, Corwin and
Jennings (2016) show that financial incentives, such as rebates and fees, influence the broker’s
choice of the routing venue, and that such incentives hurt execution quality of retail clients.
In this study, we examine whether the use of affiliated ATSs that may have benefits for the
brokerage firm affects execution quality of institutional clients. We examine FINRA’s Order Audit
Trail System (OATS) data, which provides detailed routing information and order outcomes over
the lifecycle of an institutional order. We find that brokers with high affiliated ATS routing are
associated with lower fill rates over the order’s lifecycle. For institutional clients that bear an
opportunity cost for unfilled orders, trading costs are higher when the order is handled by a broker
with high affiliated ATS routing. We do not find empirical support for the explanation that clients’
preference to access ATS venues explains our results. Routing behavior of brokers as well as order
outcomes are persistent implying that past broker behavior is informative about future outcomes.
Several caveats are noteworthy. First, and foremost, we caution that venue ownership does
not in and of itself point to agency conflicts as not all brokers who own ATS exhibit high affiliated
ATS routing. Second, the study reports the implications of affiliated ATS usage for an average
24 Unlike Battalio, Corwin and Jennings (2016), we do not include good fill ratios in our analysis. The ratios are
calculated using price movements after the execution of a route. In our analysis, the orders are pegged to a moving
NBBO which makes the measure less useful than when the limit price is fixed.

27
order to an average broker. Our results do not imply that a particular order routed to an affiliated
ATS is not in a client’s best interests. Third, it is possible that clients receive additional services
alongside order execution, or receive a reduction in explicit fees, to the extent that brokers share
the benefits of affiliated ATS ownership with clients. It is also possible that clients demand lower
commissions which then forces the broker to select the lowest possible cost venue. In these cases,
our study provides institutions with guidance on comparing the value of bundled services or
commission savings with differences in execution quality outcomes.
Finally, our data are not sufficiently detailed about client intent or the extent of broker
discretion associated with an order. The data limitation does not change the relation between
affiliated ATS usage and execution outcomes; however, it limits our ability to attribute the venue
choice decision to the broker or client. Nonetheless, the results of the study should inform
institutional clients about the trade-offs associated with venue choices. Our findings provide
empirical support for recent regulatory and industry initiatives on improved disclosures
transparency relating to order routing incentives and the handling of institutional orders.

28
References
Anand, A., Hua, J., & McCormick, T. (2016). Make-take structure and market quality: Evidence
from the US options markets. Management Science, 62, 3271-3290.
Anand, A., Irvine, P., Puckett, A., and Venkataraman, K. (2012). Performance of institutional
trading desks: An analysis of persistence in trading costs. Review of Financial Studies, 25(2), 557-
598.
Anand, A., Irvine, P., Puckett, A., and Venkataraman, K. (2013). Institutional trading and stock
resiliency: Evidence from the 2007–2009 financial crisis. Journal of Financial Economics, 108(3),
773-797.
Anand, Amber, and Weaver, D. (2004). Can order exposure be mandated? Journal of
Financial Markets 7, 405–426.
Angel, J. J., Harris, L. E., and Spatt, C. S. (2015). Equity trading in the 21st century: An update.
Quarterly Journal of Finance, 5.
Battalio, R. (1997). Third market broker-dealers: cost competitors or cream skimmers? Journal of
Finance 52, 241-252
Battalio, R., Corwin, S. A., and Jennings, R. (2016). Can Brokers Have It All? On the Relation
between Make‐Take Fees and Limit Order Execution Quality. Journal of Finance, 71(5), 2193-
2238.
Battalio, R., Greene, J., Hatch, B., and Jennings, R. (2002). Does the limit order routing decision
matter? Review of Financial Studies, 15, 159-194
Battalio, R. H., Griffith, T., and Van Ness, R. A. (2016). Do (Should) Brokers Route Standing
Limit Orders Seeking to Trade US Equity Options to Wholesalers? Working Paper.
Bessembinder, H., Panayides, M., and Venkataraman, K. (2009). Hidden liquidity: An analysis of
order exposure strategies in electronic stock markets. Journal of Financial Economics, 94, 361-
383.
Bloomfield, R., O’Hara, M., and Saar, G. (2015). Hidden Liquidity: Some New Light on Dark
Trading. Journal of Finance, 70, 2227-2276.
Boehmer, E., Li, D., and Saar, G. (2018). The competitive landscape of high-frequency trading
firms. Review of Financial Studies, 31, 6, 2227-2276.
Brogaard, J., Carrion, A., Moyaert, T., Riordan, R., Shkilko, A., and Sokolov, K. (2018). High
frequency trading and extreme price movements. Journal of Financial Economics, 128(2), 253-
265.

29
Brogaard, J., Hagstromer, B., Norden, L., and Riordan, R. (2015). Trading Fast and Slow:
Colocation and Market Quality. Review of Financial Studies, forthcoming.
Brogaard, J., Hendershott, T., and Riordan, R. (2014). High-Frequency Trading and Price
Discovery. Review of Financial Studies 27, 2267-2306.
Busse, J., Chordia, T., Jiang, L., and Tang, Y. (2017). Mutual Fund Trading Costs. Working paper.
Buti S., B. Rindi, and Werner, I. (2017). Dark pool trading strategies, market quality and welfare,
Journal of Financial Economics, 124, 244-265.
Campbell, J., Ramadorai, T., and Schwartz, A. (2009). Caught on tape: Institutional trading, stock
returns, and earnings announcements. Journal of Financial Economics, 92, 66–91.
Cardella, L., Hao, J., and Kalcheva, I. (2015). Make and take fees in the US equity
market. Working Paper.
Comerton-Forde, C., and Putniņš, T. J. (2015). Dark trading and price discovery. Journal of
Financial Economics, 118, 70-92.
Conrad, J., Johnson, K. and Wahal, S. (2001). Institutional Trading and Soft Dollars. Journal of
Finance, 56, 397-416.
Easley, D., Kiefer, N. M., and O'Hara, M. (1996). Cream‐skimming or profit‐sharing? The curious
role of purchased order flow. Journal of Finance, 51, 811-833.
Griffin, J. M., Harris, J. H., Shu, T., and Topaloglu, S. (2011). Who drove and burst the tech
bubble? Journal of Finance, 66 (4), 1251-1290.
Handa, P., and Schwartz, R. A. (1996). Limit order trading. Journal of Finance, 51(5), 1835-1861.
Harris, L., and Hasbrouck, J. (1996). Market vs. limit orders: the SuperDOT evidence on order
submission strategy. Journal of Financial and Quantitative analysis, 31(2), 213-231.
Hasbrouck, J. (2006). Empirical market microstructure: the institutions, economics, and
econometrics of securities trading, Oxford University Press.
Hendershott, T., and Jones, C. M. (2005). Island goes dark: Transparency, fragmentation and
regulation, Review of Financial Studies, 18(3), 743-793.
Hendershott, T., Jones, C. M., and Menkveld, A. J. (2011). Does algorithmic trading improve
liquidity? Journal of Finance, 66(1), 1-33.
Hendershott, T., and H. Mendelson, H. (2005). Crossing networks and dealer markets:
Competition and performance. Journal of Finance, 55(5), 2071-2115.

30
Hu, G., Jo, K., Wang, Y., and Xie, J. (2018). Institutional Trading and Abel Noser Data. Journal
of Corporate Finance 52, 143-167.
IOSCO, (2017). Order routing incentives, Final Report, FR08/2017.
Keim, D., and Madhavan, A. (1997). Transactions costs and investment style: an inter-exchange
analysis of institutional equity trades. Journal of Financial Economics, 46, 265-292.
Kirilenko, A., Kyle, A. S., Samadi, M., and Tuzun, T. (2017). The Flash Crash: High‐frequency
trading in an electronic market. The Journal of Finance, 72(3), 967-998.
Korajczyk, R.A., and Murphy, D. (2018). High-Frequency Market Making to Large Institutional
Trades. Review of Financial Studies, forthcoming.
Kwan, A., Masulis, R. and T.H. McInish (2017). Trading rules, competition for order flow, and
market fragmentation, Journal of Financial Economics 115(2), 330-348.
Menkveld, A., B. Z. Yueshen and Zhu, H. (2017). Shades of Darkness: A Pecking Order of Trading
Venues, 2017, Journal of Financial Economics 124, 503-534.
Perold, A. F. (1988). The implementation shortfall: Paper versus reality. The Journal of Portfolio
Management, 14(3), 4-9.
Puckett, A., and Yan, X. S. (2011). The interim trading skills of institutional investors. The Journal
of Finance, 66(2), 601-633.
Reed, A. V., Samadi, M., and Sokobin, J. S. (2018). Shorting in Broad Daylight: Short Sales and
Venue Choice. Working Paper.
Saglam, M. (2018), Order anticipation around predictable trades. Financial Management,
forthcoming.
SEC, 2016. Disclosure of order handling information. Securities Exchange Act Release No. 78309
(July 13, 2016), 81 FR 49432, 49434 (July 27, 2016).
Sofianos, G., Xiang, J., and Yousefi, A., Smart routing goes to the races: Venue Toxicity
comparisons. Street Smart, 41, December 2010.
Tuttle, L. (2013). Alternative trading systems: Description of ATS trading in national market
system stocks. Working Paper.
Van Kervel, V., and Menkveld, A.J., (2018). High-Frequency Trading around Institutional Orders.
Journal of Finance, forthcoming.

31
Wagner, W. (1993). Defining and measuring trading costs. In Sherrerd, K. (ed.), Execution
Techniques, True Trading Costs, and the Microstructure of Markets. Association for Investment
Management and Research, Charlottesville, VA.
Wagner, W., and Edwards, M. (1993). Best execution. Financial Analysts Journal,
January/February, 65-71.
Yang, L., and Zhu, H. (2017). Back-running: Seeking and hiding fundamental information in order
flows. Working paper, University of Toronto.
Ye, M. (2010). Non-execution and market share of crossing networks. Working Paper.
Zhu, H. (2014). Do Dark Pools Harm Price Discovery? Review of Financial Studies, 27, 747-789.

32
Appendix A
Identifying institutional brokers and order flow
We identify institutional orders handled by institutional brokers based on a combination of
broker classifications from Griffin et al. (2011) and the beneficiary owner field in the OATS data.
The beneficiary owner field is marked as institutional, individual, combined, employee, market
maker or proprietary flow, and in some cases, unknown or null. In the approach below, we
implicitly assume that brokers are unlikely to mark their own (proprietary or market making) flow
as unknown. Thus, we assume that the unknown beneficiary owner type reflects orders from
institutional or individual clients.
The institutional brokers identified by Griffin et al. (2011) serve as our starting point:
1. If Griffin et al. (2011) identify a broker as “Institutional” or “Largest Ibanks”, then we include
all of the broker’s orders marked as institutional or unknown, and exclude orders marked as
individual, proprietary or market making. The overlay of beneficiary owner type on the Griffin
et al. (2011) classification allows for the possibility that institutional brokers may handle some
other types of order flow as well.
2. If Griffin et al (2011) classify the broker as “Mixed”, at least 40% of the orders have a known
beneficiary type and at least 60% of the orders with a known type are marked as institutional,
then we examine all of the broker’s orders except those explicitly marked as one of the non-
institutional order types.
3. If Griffin et al (2011) classify the broker as “Mixed” and less than 40% of the orders have a
known beneficiary type, then we only examine those orders that are marked as institutional.

33
For “mixed” brokers with a large proportion of unknown beneficiary orders, we are less
confident that unknown beneficiary orders are likely to be institutional.
4. If Griffin et al (2011) do not classify a broker, we classify the broker based on the OATS data
alone. For a broker to be identified as institutional, we require that at least 40% of the orders
have a known beneficiary type and at least 40% of the orders with a known type are marked as
institutional. As in (3) above, for these brokers, we only include orders marked as institutional.
5. We examine top orders that originate with a broker, i.e., we exclude orders that are routed to
an institutional broker from another broker (e.g., an introducing broker). This filter allows us
to focus on order flow where the sample brokers have a direct relationship with the institutional
client and avoids any confounding issues due to the arrangements between brokers.
6. To ensure that we focus on active brokers, the number of top orders received by the broker in
October 2016 that survive the filters imposed above exceed 10,000.
7. Finally, we exclude brokers that are primarily associated with internalized flow or are likely to
serve as conduits to ATSs. Specifically, we remove brokers who execute more than 60% of
their executed quantity with non-ATS brokers, brokers who route 100% of their order flow to
affiliated ATSs, brokers who receive 50% or higher of their routed order flow from other
brokers, and well known proprietary firms and market makers.

34
Appendix B
Sample Construction and Data Filters
Our sample consists of a size-stratified group of 273 stocks traded in October 2016. To
construct the sample, we form decile portfolios of U.S. listed common shares with a share price of
at least five dollars using CRSP data on market capitalization at the end of December 2015,
selecting the 30 largest stocks from each decile. We subsequently merge the CRSP data with TAQ
National Best Bid and Offer (NBBO) data, using CUSIPs from the October 2016 TAQ Master
Files, leaving us with 283 stocks. We subsequently merge these data with OATS, matching OATS
tickers with TAQ tickers, leaving us with 279 stocks. After applying a number of data quality
filters (outlined in Appendix B), we obtain a final sample of 273 stocks.
We impose several data filters:
We remove orders received outside of trading hours.
We remove orders with more than one top order assigned to the lifecycle. This would be
the case if top orders are merged by the broker before routing. This merge makes our
attribution of order handling more difficult.
We remove stocks with a share price less than $1.
We remove orders that were received but are not associated with any routes by the broker.
We remove orders with lifecycle events that span multiple days.
We remove orders with a fill rate greater than a 100%, and shortfall costs that are greater
than 10% or lower than -10%. Fill rates can exceed 100% if the order size is increased
during the order’s lifecycle.

35
We remove orders whose time-to-execution or time-to-route was less than -2 seconds due
to clock synchronization issues.
To construct NBBO quotes, we consider NBBO quotes from the TAQ NBBO and Quote
files whose quote conditions are not equal to ‘A’,’B’,’H’,’O’,’R’,’W’, remove cancelled quotes,
remove quotes without an associated price or positive share quantity. We remove quotes
corresponding to locked and crossed markets and percentage bid-ask spreads larger than 10%.
For horse races, we remove ATS child orders with more than one “new order” event and
child orders with a fill rate greater than a 100%. We use the order handling codes “FM” and “PEG”
to identify midpoint pegged orders. We verify that at least 70% of executions for the order handling
codes for each broker used in the horse races take place at the midpoint of the NBBO.

Table 1: Descriptive statisticsThis table presents descriptive statistics for the sample. For each measure, broker-stock-day observations are constructed by taking top order quantity weighted averages of top ordersreceived by a broker on a stock-day. The tables presents equally weighted averages of the broker-stock-day observations. Statistics are presented for the overall sample and for small(smallest 30%), medium (middle 40%), and large (largest 30%) market capitalization stocks. Order size is the average order size. Rt qty/order qty is the ratio of number of shares routedduring the orders lifecycle to its top order quantity. Fill rate is the ratio of executed quantity to top order quantity. Arrival spread is the percentage quoted NBBO spread at the time anorder arrives at a broker. Effective spread cost represents the percentage difference between the order’s volume weighted average execution price and the NBBO midpoint at the timeof order arrival at the broker. Shortfall close measures the implementation shortfall using the closing price of the day as the fill price for the unexecuted portion of the order. The costsfor the executed portion of the order is measured as in effective spread costs. Shortfall cross measures the implementation shortfall by imputing a fill at the opposing NBBO quote atthe end of the order for the unexecuted portion of the order. Drift is the average signed NBBO midquote percentage return over the life of an order. The life of an order is measuredfrom order arrival to the last observed event in the orders lifecycle. Post-drift is the average signed NBBO midquote percentage return over the five minutes after the end of an orderlifecycle.
#Orders Order Rt qty/ Fill
#Brokers #Obs (mm) size order qty rate
All stocks 43 139265 331.20 1371.18 10.05 30.33%
Large stocks 43 54210 245.23 1915.08 5.61 37.68%
Medium stocks 43 57382 72.03 1254.32 9.04 27.06%
Small stocks 40 27673 13.93 548.00 20.83 22.69%
Arrival Eff. spread Shortfall Shortfall Drift Post-drift
spread (bp) cost (bp) close (bp) cross (bp) (bp) (bp)
All stocks 36.77 2.49 7.04 16.18 3.36 0.71
Large stocks 7.55 1.23 2.99 3.70 1.55 0.06
Medium stocks 32.68 2.20 6.57 14.47 3.55 0.74
Small stocks 102.48 6.21 15.95 44.19 6.50 1.92

Table 2: Venue choice statisticsThis table presents routing and execution venue choice statistics. The proportions presented are equally weighted averages of broker-stock-day observations. Statistics are presented for the overall sample and for small (smallest 30%), medium (middle 40%), and large(largest 30%) market capitalization stocks. Panel A presents the proportion of routes to different venue types, Panel B presents theproportion of executions by venue type, Panel C presents the proportion of routed share quantity by venue type, and Panel D presentsthe proportion of executed share quantity by venue type.
Panel A: Routes Panel B: Executions
ATS Exchange Firm ATS Exchange Firm
All orders 29.52% 58.81% 11.67% 13.42% 77.77% 8.82%
Large stocks 26.63% 58.78% 14.58% 12.80% 76.47% 10.72%
Medium stocks 30.51% 58.82% 10.67% 14.41% 77.57% 8.02%
Small stocks 33.13% 58.85% 8.02% 12.50% 81.36% 6.15%
Panel C: Routed qty Panel D: Executed qty
ATS Exchange Firm ATS Exchange Firm
All orders 32.50% 54.81% 12.69% 16.70% 73.82% 9.48%
Large stocks 30.60% 53.35% 16.05% 16.69% 71.85% 11.46%
Medium stocks 33.23% 55.23% 11.55% 17.59% 73.82% 8.59%
Small stocks 34.73% 56.78% 8.48% 14.56% 78.57% 6.87%

Table 3: ATS affiliation and venue choiceThis table describes venue choice and routing characteristics by broker preference for routing to affiliated ATSs. In Panel A, brokers are grouped into terciles based on abroker’s average deviation from a stock-day sample-wide affiliated ATSs routed quantity benchmark. Units of observation are broker-stock-day proportions. Rt qty/order qtyratio of number of shares routed during the orders lifecycle to its top order quantity. Order size is the average order size. Average routed share quantity proportions (rt qty)and executed share quantity proportions (ex qty) are calculated for ATSs, affiliated ATSs, unaffiliated ATSs, exchanges, and firms separately. In Panel B, brokers are sortedinto terciles based on their average deviation from a stock-day sample-wide affiliated ATSs routed quantity benchmark during the first week of the sample. Holding thistercile rank constant, brokers average routed share quantity proportion to affiliated ATSs is examined over each of the following three weeks. Retention % is the percentageof brokers that remain in the same tercile in the future week.
Panel A: Venue choice statistics by broker tercile
Rt qty/ Order %ATS %Affiliated ATS %Unaffiliated ATSBroker tercile #Obs order qty size Rt qty Ex qty Rt qty Ex qty Rt qty Ex qtyT1 (least %affiliated ATS) 47841 4.53 2183.95 10.16 5.96 0.00 0.00 10.16 5.96
T2 46408 9.41 1250.60 25.33 16.40 6.46 4.81 18.88 11.60
T3 (most %affiliated ATS) 45016 16.56 631.71 63.64 27.37 49.87 16.78 13.76 10.59
T1-T3 1552.24∗∗∗ −53.47∗∗∗ −21.41∗∗∗ −49.87∗∗∗ −16.78∗∗∗ −3.60∗∗∗ −4.63∗∗∗
T2-T3 618.89∗∗∗ −38.30∗∗∗ −10.96∗∗∗ −43.42∗∗∗ −11.97∗∗∗ 5.12∗∗∗ 1.01∗∗∗
%Exchange %FirmBroker tercile Rt qty Ex qty Rt qty Ex qtyT1 (least %affiliated ATS) 70.81 77.00 19.03 17.04
T2 62.28 74.53 12.38 9.06
T3 (most %affiliated ATS) 30.10 70.01 6.27 2.62
T1-T3 40.71∗∗∗ 6.99∗∗∗ 12.76∗∗∗ 14.42∗∗∗
T2-T3 32.19∗∗∗ 4.52∗∗∗ 6.12∗∗∗ 6.44∗∗∗
Panel B: Persistence in Venue Choice
Week
Broker Tercile Week T Week T + 1 Week T + 2 Week T + 3
Tercile 1 (least %affiliated ATS) 0.00 0.00 0.00 0.00
Retention % 100.00 90.91 97.16 95.17
Tercile 2 5.86 6.04 7.05 6.93
Retention % 100.00 80.20 90.31 95.37
Tercile 3 (most %affiliated ATS) 50.05 51.49 49.71 48.60
Retention % 100.00 83.15 88.15 100.00
T3-T1 50.05∗∗∗ 51.49∗∗∗ 49.71∗∗∗ 48.60∗∗∗
T3-T2 44.20∗∗∗ 45.46∗∗∗ 42.66∗∗∗ 41.67∗∗∗
∗p<0.1; ∗∗p<0.05; ∗∗∗p<0.01
3

Table 4: ATS affiliation and execution quality, univariate analysisThis table presents univariate statistics examining the relation between ATS affiliation and execution quality. Brokers are grouped into terciles based ontheir average deviation from a stock-day sample-wide benchmark of the proportion of routed share quantity to affiliated ATSs. Units of observation arebroker-stock-day top order quantity weighted averages. Fill rate is the ratio of executed quantity to top order quantity. Arrival spread is the percentagequoted NBBO spread at the time an order arrives at a broker. Effective spread cost represents the percentage difference between the order’s volume weightedaverage execution price and the NBBO midpoint at the time of order arrival at the broker. Shortfall close measures the implementation shortfall using theclosing price of the day as the fill price for the unexecuted portion of the order. The costs for the executed portion of the order is measured as in effectivespread costs. Shortfall cross measures the implementation shortfall by imputing a fill at the opposing NBBO quote at the end of the order for the unexecutedportion of the order. Drift is the average signed NBBO midquote percentage return over the life of an order. The life of an order is measured from orderarrival to the last observed event in the orders lifecycle. Post-drift is the average signed NBBO midquote percentage return over the five minutes after theend of an order lifecycle.
Panel A: All stocks
Fill Arrival Eff. spread Shortfall Shortfall Drift Post-driftBroker tercile #Obs rate spread (bp) cost (bp) close (bp) cross (bp) (bp) (bp)T1 (least %affiliated ATS) 47841 43.50% 26.93 1.10 3.15 9.97 2.74 −0.57
T2 46408 29.79% 39.94 3.13 7.49 18.39 3.76 0.75
T3 (most %affiliated ATS) 45016 16.87% 43.95 3.17 10.69 20.51 3.59 2.04
T1-T3 26.63%∗∗∗ −17.02∗∗∗ −2.07∗∗∗ −7.54∗∗∗ −10.54∗∗∗ −0.85∗∗∗ −2.61∗∗∗
T2-T3 12.92%∗∗∗ −4.01∗∗∗ −0.04 −3.20∗∗∗ −2.12∗∗∗ 0.17 −1.29∗∗∗
Panel B: Large stocks
Fill Arrival Eff. spread Shortfall Shortfall Drift Post-driftBroker tercile #Obs rate spread (bp) cost (bp) close (bp) cross (bp) (bp) (bp)T1 (least %affiliated ATS) 23642 47.54% 8.68 0.42 1.64 3.37 1.26 −0.24
T2 15857 38.18% 7.00 1.53 3.37 4.08 1.98 −0.01
T3 (most %affiliated ATS) 14711 21.29% 6.35 2.07 4.74 3.80 1.54 0.62
T1-T3 26.26%∗∗∗ 2.33∗∗∗ −1.65∗∗∗ −3.10∗∗∗ −0.43∗∗ −0.28 −0.85∗∗∗
T2-T3 16.89%∗∗∗ 0.65∗∗∗ −0.55∗∗∗ −1.37∗∗∗ 0.28∗∗ 0.44∗∗∗ −0.63∗∗∗
Panel C: Medium stocks
Fill Arrival Eff. spread Shortfall Shortfall Drift Post-driftBroker tercile #Obs rate spread (bp) cost (bp) close (bp) cross (bp) (bp) (bp)T1 (least %affiliated ATS) 18656 39.94% 32.86 0.85 2.89 11.43 2.97 −0.84
T2 19524 26.56% 32.89 2.56 6.87 16.15 3.98 0.94
T3 (most %affiliated ATS) 19202 15.06% 32.30 2.95 9.83 15.72 3.68 2.08
T1-T3 24.87%∗∗∗ 0.55 −2.10∗∗∗ −6.94∗∗∗ −4.30∗∗∗ −0.71∗∗ −2.92∗∗∗
T2-T3 11.50%∗∗∗ 0.59 −0.39 −2.97∗∗∗ 0.43 0.30 −1.14∗∗∗
Panel D: Small stocks
Fill Arrival Eff. spread Shortfall Shortfall Drift Post-driftBroker tercile #Obs rate spread (bp) cost (bp) close (bp) cross (bp) (bp) (bp)
T1 (least %affiliated ATS) 5543 38.28% 84.85 5.64 10.50 33.18 8.27 -1.10
T2 11027 23.44% 99.80 7.21 14.53 42.94 5.95 1.50T3 (most %affiliated ATS) 11103 14.15% 113.93 5.47 20.07 50.93 6.16 3.85T1-T3 24.13%∗∗∗ −29.08∗∗∗ 0.17 −9.58∗∗∗ −17.75∗∗∗ 2.11∗∗∗ −4.95∗∗∗
T2-T3 9.30%∗∗∗ −14.13∗∗∗ 1.74∗∗ −5.54∗∗∗ −7.99∗∗∗ −0.21 −2.36∗∗∗
∗p<0.1; ∗∗p<0.05; ∗∗∗p<0.01
4

Table 5: ATS affiliation and execution quality, multivariate regressionThis table presents results for multivariate regressions examining the relationship between ATS affiliation and execution quality. Units of observation are broker-stock-day top order quantity weighted averages. Each column corresponds to a regression specification. Dependent variables include: Fill rate, the ratio of executedquantity to top order quantity; Effective spread cost, the percentage difference between the order’s volume weighted average execution price and the NBBO midpointat the time of order arrival at the broker; Shortfall close, the implementation shortfall using the closing price of the day as the fill price for the unexecuted portion ofthe order. The costs for the executed portion of the order is measured as in effective spread costs; Shortfall cross, the implementation shortfall calculated by imputinga fill at the opposing NBBO quote at the end of the order for the unexecuted portion of the order; Drift, the average signed NBBO midquote percentage return overthe life of an order. The life of an order is measured from order arrival to the last observed event in the orders lifecycle; and Post-drift, the average signed NBBOmidquote percentage return over the five minutes after the end of an order lifecycle. Independent variables include %Affiliated ATS, the percentage of routed quantitysent to affiliated ATSs; order size, the natural log of the average order size; arrival spread, the average percentage quoted NBBO spread at the time an order arrivesat a broker; post-drift; price, the natural log of stock price; market cap, the natural log of market capitalization in thousands; and RV, the sum of squared five-minutemidquote log returns. Test statistics are obtained from standard errors clustered by stock and day.
Dependent variable:
Fill rate (%) Eff. spread cost (bp) Shortfall close (bp)
(1) (2) (3) (4) (1) (2) (3) (4) (1) (2) (3) (4)
%Affiliated ATS −37.51∗∗∗ −37.37∗∗∗ −37.44∗∗∗ −37.30∗∗∗ −0.39 −0.33 −0.39 −0.33 6.22∗∗∗ 5.77∗∗∗ 5.93∗∗∗ 5.48∗∗∗
Order size 1.33∗∗∗ 1.32∗∗∗ 1.28∗∗∗ 1.28∗∗∗ 1.04∗∗∗ 1.04∗∗∗ 1.09∗∗∗ 1.09∗∗∗ 1.78∗∗∗ 1.80∗∗∗ 1.83∗∗∗ 1.85∗∗∗
Arrival spread (BP) −0.05∗∗∗ −0.05∗∗∗ −0.06∗∗∗ −0.06∗∗∗ 0.06∗∗∗ 0.06∗∗∗ 0.04∗∗∗ 0.04∗∗∗ 0.06∗∗∗ 0.06∗∗∗ 0.03∗ 0.03∗
Post-drift (bp) −0.04∗∗∗ −0.04∗∗∗ −0.02∗ −0.02∗ 0.13∗∗∗ 0.12∗∗∗
Price −1.46∗∗∗ −1.46∗∗∗ 0.32∗ 0.32∗ 0.17 0.23
Market cap 2.27∗∗∗ 2.27∗∗∗ −0.28∗∗∗ −0.28∗∗∗ −1.42∗∗∗ −1.44∗∗∗
RV (bp) −0.00 −0.00 0.00 0.00 −0.00
Constant 2.64 2.75 −1.78 −1.73 14.84∗∗∗ 14.75∗∗∗
Stock Fixed Effects N N Y Y N N Y Y N N Y Y
Observations 139,265 139,265 139,265 139,265 122,981 122,981 122,981 122,981 139,265 139,265 139,265 139,265Adjusted R2 0.15 0.16 0.16 0.17 0.01 0.01 0.02 0.02 0.01 0.02 0.02 0.03
Dependent variable:
Shortfall cross (bp) Drift (bp) Post-drift (bp)
(1) (2) (3) (4) (1) (2) (3) (4) (1) (2)
%Affiliated ATS 3.47∗∗∗ 3.46∗∗∗ 3.00∗∗∗ 2.99∗∗∗ −3.19∗∗∗ −3.05∗∗∗ −3.10∗∗∗ −2.95∗∗∗ 3.53∗∗∗ 3.57∗∗∗
Order size 0.53∗∗∗ 0.53∗∗∗ 0.72∗∗∗ 0.72∗∗∗ 1.46∗∗∗ 1.45∗∗∗ 1.50∗∗∗ 1.49∗∗∗ −0.20∗∗ −0.19∗
Arrival spread (bp) 0.34∗∗∗ 0.34∗∗∗ 0.29∗∗∗ 0.29∗∗∗ 0.02∗∗∗ 0.02∗∗∗ 0.02∗∗∗ 0.02∗∗∗ 0.01∗ 0.01
Post-drift (bp) 0.00 0.00 −0.04∗∗ −0.04∗∗
Price 0.69∗∗∗ 0.69∗∗∗ 0.16 0.15 −0.14
Market cap −1.40∗∗∗ −1.40∗∗∗ −0.77∗∗∗ −0.77∗∗∗ −0.08
RV (bp) 0.00∗∗∗ 0.00∗∗∗ −0.00∗∗ −0.00∗∗ −0.00
Constant 18.59∗∗∗ 18.58∗∗∗ 6.18∗∗∗ 6.29∗∗∗ 2.68∗∗∗
Stock Fixed Effects N N Y Y N N Y Y N Y
Observations 139,265 139,265 139,265 139,265 139,265 139,265 139,265 139,265 139,265 139,265Adjusted R2 0.43 0.43 0.44 0.44 0.01 0.01 0.01 0.01 0.00 0.00
∗p<0.1; ∗∗p<0.05; ∗∗∗p<0.01
5
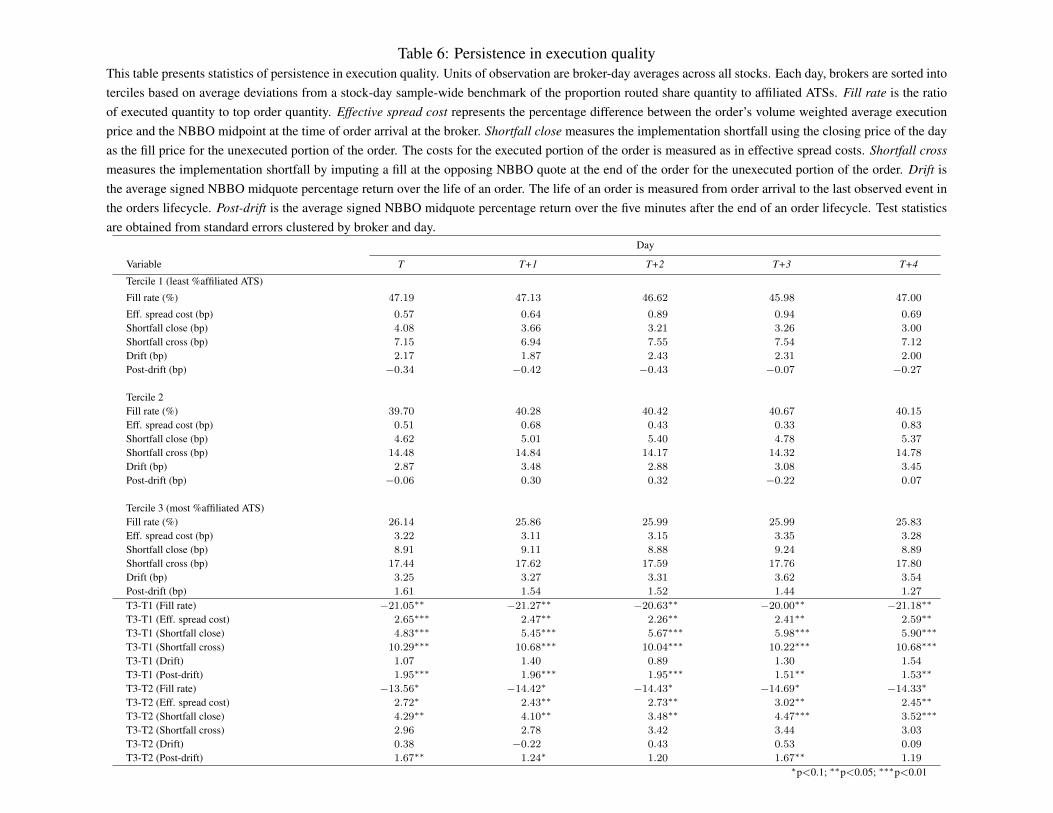
Table 6: Persistence in execution qualityThis table presents statistics of persistence in execution quality. Units of observation are broker-day averages across all stocks. Each day, brokers are sorted intoterciles based on average deviations from a stock-day sample-wide benchmark of the proportion routed share quantity to affiliated ATSs. Fill rate is the ratioof executed quantity to top order quantity. Effective spread cost represents the percentage difference between the order’s volume weighted average executionprice and the NBBO midpoint at the time of order arrival at the broker. Shortfall close measures the implementation shortfall using the closing price of the dayas the fill price for the unexecuted portion of the order. The costs for the executed portion of the order is measured as in effective spread costs. Shortfall crossmeasures the implementation shortfall by imputing a fill at the opposing NBBO quote at the end of the order for the unexecuted portion of the order. Drift isthe average signed NBBO midquote percentage return over the life of an order. The life of an order is measured from order arrival to the last observed event inthe orders lifecycle. Post-drift is the average signed NBBO midquote percentage return over the five minutes after the end of an order lifecycle. Test statisticsare obtained from standard errors clustered by broker and day.
Day
Variable T T+1 T+2 T+3 T+4
Tercile 1 (least %affiliated ATS)
Fill rate (%) 47.19 47.13 46.62 45.98 47.00
Eff. spread cost (bp) 0.57 0.64 0.89 0.94 0.69
Shortfall close (bp) 4.08 3.66 3.21 3.26 3.00
Shortfall cross (bp) 7.15 6.94 7.55 7.54 7.12
Drift (bp) 2.17 1.87 2.43 2.31 2.00
Post-drift (bp) −0.34 −0.42 −0.43 −0.07 −0.27
Tercile 2Fill rate (%) 39.70 40.28 40.42 40.67 40.15
Eff. spread cost (bp) 0.51 0.68 0.43 0.33 0.83
Shortfall close (bp) 4.62 5.01 5.40 4.78 5.37
Shortfall cross (bp) 14.48 14.84 14.17 14.32 14.78
Drift (bp) 2.87 3.48 2.88 3.08 3.45
Post-drift (bp) −0.06 0.30 0.32 −0.22 0.07
Tercile 3 (most %affiliated ATS)Fill rate (%) 26.14 25.86 25.99 25.99 25.83
Eff. spread cost (bp) 3.22 3.11 3.15 3.35 3.28
Shortfall close (bp) 8.91 9.11 8.88 9.24 8.89
Shortfall cross (bp) 17.44 17.62 17.59 17.76 17.80
Drift (bp) 3.25 3.27 3.31 3.62 3.54
Post-drift (bp) 1.61 1.54 1.52 1.44 1.27
T3-T1 (Fill rate) −21.05∗∗ −21.27∗∗ −20.63∗∗ −20.00∗∗ −21.18∗∗
T3-T1 (Eff. spread cost) 2.65∗∗∗ 2.47∗∗ 2.26∗∗ 2.41∗∗ 2.59∗∗
T3-T1 (Shortfall close) 4.83∗∗∗ 5.45∗∗∗ 5.67∗∗∗ 5.98∗∗∗ 5.90∗∗∗
T3-T1 (Shortfall cross) 10.29∗∗∗ 10.68∗∗∗ 10.04∗∗∗ 10.22∗∗∗ 10.68∗∗∗
T3-T1 (Drift) 1.07 1.40 0.89 1.30 1.54
T3-T1 (Post-drift) 1.95∗∗∗ 1.96∗∗∗ 1.95∗∗∗ 1.51∗∗ 1.53∗∗
T3-T2 (Fill rate) −13.56∗ −14.42∗ −14.43∗ −14.69∗ −14.33∗
T3-T2 (Eff. spread cost) 2.72∗ 2.43∗∗ 2.73∗∗ 3.02∗∗ 2.45∗∗
T3-T2 (Shortfall close) 4.29∗∗ 4.10∗∗ 3.48∗∗ 4.47∗∗∗ 3.52∗∗∗
T3-T2 (Shortfall cross) 2.96 2.78 3.42 3.44 3.03
T3-T2 (Drift) 0.38 −0.22 0.43 0.53 0.09
T3-T2 (Post-drift) 1.67∗∗ 1.24∗ 1.20 1.67∗∗ 1.19∗p<0.1; ∗∗p<0.05; ∗∗∗p<0.01
6

Table 7: ATS affiliation and execution quality, matched analysisThis table presents results for matched analysis controlling for ATS routing. Units of observation are broker-stock-day top order quantity weighted averages. Tercile 3 (T3, characterized by themost routing to affiliated ATSs) brokers are matched with a T1 or T2 broker on the same stock-day based on the percentage of share quantity routed to ATSs using nearest neighbor one-to-onepropensity score matching using a caliper of 0.25 of a standard deviation. Panel A presents statistics of the full and matched sample. Treatment brokers are T3 brokers and control brokers areT1 or T2 brokers. %ATS is the average percentage of routed quantity sent to ATSs. %Affiliated ATS is the average percentage of routed quantity sent to affiliated ATSs. %Unaffiliated ATS isthe average percentage of routed quantity sent to unaffiliated ATSs. Order size is the average order size. Volume is the average daily trading volume. Price is the average stock price. Marketcap is the average market capitalization. Panel B presents results for the matched regression analysis. Dependent variables include: Fill rate, the ratio of executed quantity to top order quantity;Effective spread cost, the percentage difference between the order’s volume weighted average execution price and the NBBO midpoint at the time of order arrival at the broker; Shortfall close,the implementation shortfall using the closing price of the day as the fill price for the unexecuted portion of the order. The costs for the executed portion of the order is measured as in effectivespread costs; Shortfall cross, the implementation shortfall calculated by imputing a fill at the opposing NBBO quote at the end of the order for the unexecuted portion of the order; Drift, theaverage signed NBBO midquote percentage return over the life of an order. The life of an order is measured from order arrival to the last observed event in the orders lifecycle; and Post-drift,the average signed NBBO midquote percentage return over the five minutes after the end of an order lifecycle. Independent variables include T3, an indicator variable that is equal to one fora treatment broker and zero otherwise; order size, the natural log of the average order size; arrival spread, the average percentage quoted NBBO spread at the time an order is placed with abroker; and post-drift. Test statistics are obtained from standard errors clustered by stock and day.
Panel A: Descriptive statistics
#Observations #Brokers %ATS %Affiliated ATS %Unaffiliated ATS
Control Treated Control Treated Control Treated Control Treated Control Treated
Full sample 94249 45016 34 9 17.63% 63.64% 3.18% 49.87% 14.45% 13.76%Matched sample 19274 19274 34 9 50.05% 51.20% 7.17% 41.53% 42.88% 9.67%
#Stocks Order size Volume (mm) Price ($) Market cap ($mm)
Control Treated Control Treated Control Treated Control Treated Control Treated
Full sample 273 273 1724.37 631.71 3844.41 2671.26 61.71 54.68 44599.54 30251.14Matched sample 273 273 3080.60 691.84 3239.35 3239.35 54.84 54.84 35036.66 35036.66
Panel B: Matched regression
Dependent variable:
Fill rate (%) Eff. spread cost (bp) Shortfall close (bp) Shortfall cross (bp) Drift (bp) Post-drift (bp)(1) (2) (1) (2) (1) (2) (1) (2) (1) (2) (1)
T3 −5.66∗∗∗ −5.64∗∗∗ −1.30∗ −1.29∗ 1.98∗∗∗ 1.95∗∗ 1.13∗ 1.13∗ 1.61∗∗∗ 1.63∗∗∗ 0.35
Order size 3.63∗∗∗ 3.62∗∗∗ 0.19 0.18 1.60∗∗∗ 1.63∗∗∗ 1.35∗∗∗ 1.34∗∗∗ 1.72∗∗∗ 1.71∗∗∗ −0.36
Arrival spread (bp) −0.05∗∗∗ −0.05∗∗∗ 0.04∗ 0.04∗ 0.08∗∗∗ 0.08∗∗∗ 0.30∗∗∗ 0.30∗∗∗ 0.07∗∗∗ 0.07∗∗∗ 0.01
Post-drift (bp) −0.04∗∗ −0.03 0.09∗∗ −0.01 −0.05
Match Pair Fixed Effects Y Y Y Y Y Y Y Y Y Y Y
Observations 38,548 38,548 32,502 32,502 38,548 38,548 38,548 38,548 38,548 38,548 38,548Adjusted R2 0.33 0.33 0.10 0.10 0.16 0.16 0.54 0.54 0.02 0.03 0.22
∗p<0.1; ∗∗p<0.05; ∗∗∗p<0.01
7

Table 8: Horse racesThis table presents results for horse races of ATS midpoint pegged orders. Affiliated routes of Tercile 3 (T3, characterized by the most routing to affiliatedATSs) brokers are matched with routes to unaffiliated ATSs. A horse race involves a pair of ATS midpoint pegged orders that have the same stock, date, orderside, arriving during the same NBBO price state. The first order in the order pair must still be active, unmodified, and not have obtained an execution whenthe second order in the order pair is routed. Descriptive statistics of the order pairs are presented in Panel A. Avg. affiliated fill rate is the average fill rate ofmatched affiliated child orders. Avg. unaffiliated fill rate is the average fill rate of matched unaffiliated child orders. Both fill is the percentage of horse racesin which both orders in the pair obtain a fill. Panel B presents results for horse races. Affiliated fill first is the percentage of horseraces in which the affiliatedroute filled more than 500ms prior to its paired order. For this analysis, a fill occurs when any part of the route receives an execution. Unaffiliated fill firstis the percentage of horseraces in which the unaffiliated route filled more than 500ms prior to its paired order. Tie is the percentage of horseraces in whichthe affiliated route filled within 500ms of its paired order. Results are presented for all pairs and for pairs in small (smallest 30%), medium (middle 40%),and large (largest 30%) market capitalization stocks. Signifiers ∗,∗∗ ,∗∗∗ indicate that differences between affiliated and paired outcomes are statisticallysignificant at the 10%, 5%, and 1% level, respectively. Test statistics are obtained from standard errors clustered by stock and day.
Panel A: Descriptive statistics
Matched pair # of order Avg. affiliated Avg. unaffiliated Both
type pairs fill rate fill rate fill
All horse races 1421432 41.10% 50.08%∗∗∗ 11.51%
Large stocks 1308126 41.16% 50.24%∗∗∗ 11.74%
Medium stocks 107015 40.47% 48.37%∗∗∗ 8.71%
Small stocks 6291 40.01% 45.39%∗∗ 12.19%
Panel B: Horse races
Matched pair Affiliated Unaffiliated
type fills first fills first Tie
All horse races 41.92% 53.31%∗∗∗ 4.76%
Large stocks 41.75% 53.42%∗∗∗ 4.83%
Medium stocks 43.83% 52.27%∗∗∗ 3.90%
Small stocks 45.59% 48.64% 5.77%∗p<0.1; ∗∗p<0.05; ∗∗∗p<0.01
8