institutional investors in online crowdfundingfmaconferences.org/boston/ii_lsw.pdf · lin et al.:...
TRANSCRIPT

Institutional Investors in Online Crowdfunding∗
Mingfeng Lin, Richard SiasEller College of Management, University of Arizona, Tucson, AZ 85721
[email protected], [email protected]
Zaiyan WeiKrannert School of Management, Purdue University, West Lafayette, IN 47907, [email protected]
January, 2017
The “crowd” in online crowdfunding is no longer only comprised of retail investors; in fact, debt-based
crowdfunding or peer-to-peer lending has long attracted the interest of institutional investors. Given their
expertise, institutional investors are often referred to as “smart money” in financial markets. We study
whether institutional investors are indeed better able to screen borrowers in the marketplace than, and have
any significant impacts on the behaviors of, retail investors. We find that although institutional investors
indeed behave differently in terms of portfolio size and diversification strategies, overall their portfolios do
not necessarily outperform those of retail investors. Institutional investors’ bids have significant impacts on
the investment behavior of retail investors, as well as funding outcomes. We find that this effect is driven by
the designation of “institutional investors” rather than just the size of their portfolios.
Key words : Crowdfunding, Peer-to-peer lending, Institutional investors, Retail investors, Herding
1. Introduction
The “crowd” in online crowdfunding is not only comprised of retail investors; in fact, the debt-based
crowdfunding or peer-to-peer (P2P thereafter) lending has long attracted the interest of institu-
tional investors. Particularly in recent years, as the industry matures, it is moving toward relying
on institutional instead of retail investors for the supply of capital. LendingClub.com and Pros-
per.com are the two largest P2P lending platforms for unsecured personal loans in the US. Lending
Club in September 2012 introduced a new program named “whole loans,” in which institutional
investors have the privilege to “purchase” loans in their entirety. Prosper has a similar program
launched in April 2013. Since then, the fraction of institutional investment in both platforms has
skyrocketed, e.g., two thirds of the total volume on LendingClub.com (The Economist 2013).
∗ We would like to thank Keisuke Hirano, Mo Xiao, Stanley Reynolds, and seminar participants at the Universityof Louisville, 2015 INFORMS Conference on Information Systems and Technology, the 14th International Open andUser Innovation Conference, 2015 Crowdfunding Symposium at the University of California, Berkeley for helpfulsuggestions. Comments welcome.
1

Lin et al.: Institutional Investors in Online Crowdfunding 2
Given their expertise and adequate source of capital, institutional investors are often referred
to as “smart money” in financial markets (Shleifer and Summers 1990), in the sense that these
professionals have selection ability and can yield on average higher returns from their choice of
investment (Gruber 1996, Zheng 1999). Although institutional investors are studied extensively in
the literature (Puckett and Yan (2011), Basak and Pavlova (2013) as examples of recent literature
reviews), there is surprisingly little research on the interactions between them and retail investors.
This is partly due to the lack of individual-level investors transaction data in traditional financial
markets (Barber and Odean 2011). In contrast, our context, the emerging debt-based crowdfunding,
provides us a unique research opportunity to study the interactions. We ask whether institutional
investors are indeed “smarter money” in the marketplace than, and have any significant impacts on
the behaviors of, retail investors. We study these questions by exploiting a “natural experiment”
with the identity of institutional investors on Prosper.com.
Prosper.com, the first P2P lending platform in the U.S., allowed institutional investment since its
official open to the public in February 2006. At the early stage of the platform, Prosper labeled all
investors, either institutional or retail, as a generic “Lender” on their profile pages. Starting from
May 19, 2008, Prosper suddenly changed institutional investors’ labels to “Institutional Lender.”1
Since all users’ profile pages are public on Prosper.com, it is now easy to differentiate the types
of investors directly from their labels. This change was immediately effective on the whole site,
and unanticipated by either borrowers or lenders. It provides us an opportunity to study how
institutional investment affects behaviors of retail investors, transaction outcomes, and overall
market efficiency in online consumer loan markets.
Understanding the effects of institutional investors on behaviors of smaller investors and overall
market efficiency has important managerial as well as policy implications for the broader crowd-
funding market (Agrawal et al. 2013). Particularly, the “Jumpstart Our Business Startups” (JOBS)
Act, signed by President Obama, legalized equity-based crowdfunding in the US in 2012. Only if we
understand the interactions between institutional and retail investors, especially the effect of those
financial professionals on individuals, can we design a more efficient online crowdfunding market
that matches fund raisers (either individuals in the case of debt-based crowdfunding or enterprises
in equity-based crowdfunding) and investors.
To address our research questions, we first propose a stylized model to formalize the mutual
influence between institutional and retail investors. The model allows for endogenous move (or
1 Prosper introduced other improvement of account infrastructure for institutional investors, along with the changein labels. Other improvement was primarily the functions of the online accounts for institutional investors. Theonly difference from the outside, observed by other lenders and borrowers, was the labeling of these professionals.The official announcement of the change can be found at Prosper’s corporate blog: https://web.archive.org/web/20080723134102/http://blog.prosper.com/2008/05/page/2/.

Lin et al.: Institutional Investors in Online Crowdfunding 3
endogenous entry) (Gul and Lundholm 1995, Gale 1996) by the two types of investors, and focuses
on comparing retail investors’ entry decisions when investors are anonymous versus when their
identities are observed. The model captures a trade off facing retail investors. That is, the conflict
between securing an investment opportunity (by bidding aggressively with lower interest rates)
and maximizing the returns from investment (by proposing higher interest rates) favors the latter
when all investors’ identities are public information. In addition, our model predicts that institu-
tional investors are less patient and more likely to enter earlier in a funding process, because they
generally incur high opportunity cost of waiting than retail investors. We test these predictions
using administrative data from Prosper.com.
For a comprehensive understanding of institutional investors on Prosper.com, we first character-
ize their investment choice and portfolio performance on this platform. We focus on their diversifica-
tion strategy, choice of investment,2 investment performance including loan payment outcomes and
their return on investment (ROI), and comparing to retail investors. For these characterizations,
we use all transactions on Prosper.com up to the end of 2012. We find that institutional investors
indeed had much larger portfolios than their retail counterparts, and invested in more diverse
loans in terms of risk levels. Interestingly, consistent with our conjecture, institutional investors
had smaller fractions of home-state investment in their portfolios than retail investors on Pros-
per.com, that is, less home bias. However, we do not find that these professionals’ ROI dominated
those of retail investors. This is due to the trade off between lower default rate and higher rate
of prepayment in institutional investors’ portfolios. These findings suggest that although referred
to as “smart money” in traditional markets, institutional investors are not necessarily smarter in
crowdfunding markets in terms of receiving higher ROI on average.
We continue with a systematic examination of the effect of labeling institutional investors on
retail investors’ investment strategies (entry decisions in particular), and subsequently loan-level
transaction outcomes. We use the labeling event as a “natural experiment,” which manipulates
institutional investors’ participation, to identify these effects. We construct our main sample of
loans that were posted between January 19, 2008 and September 19, 2008 on Prosper.com. We
start with the effects on institutional investors’ strategies before and after the event, including their
activeness in participation, diversification strategy, portfolio performance, and the timing of entry
in a funding process. We continue with the influence on retail investors’ bidding strategies, focusing
on the number of commitments/bids by retail investors, their committed amount of dollars, and the
number of participating retail investors. Subsequently, we examine how the labeling event affects
2 In particular, we study a phenomenon that is recently shown to exist in debt crowdfunding markets (French andPorteba 1991, Lin and Viswanathan 2016). We examine whether institutional investors have smaller weights of home-state loans in their portfolios compared to retail investors—the “home bias” conjecture.

Lin et al.: Institutional Investors in Online Crowdfunding 4
loan-level outcomes including whether a loan is funded, the contract interest rate (APR) if funded,
loan repayment outcomes (default or not), and the ROI.
Not surprisingly, we do not find evidence that the event of labeling institutional investors had
any significant effects on their bidding volume, diversification strategies, or investment performance
such as the ROI of their portfolios. However, we find that institutional investors indeed adjusted the
timing of their entries in a funding process. Predicted by our model, these professionals entered on
average earlier in the funding process after the designation of their identities. Also captured by our
model, we find that the revelation of institutional investors’ identities caused less retail investors
participating upon observing the entry of at least one institutional lender. They also submitted
less bids upon institutional investors’ participation. Furthermore, given entering after institutional
bids, a typical retail investor offered on average a smaller amount of dollars. These findings on
retail investors’ investment strategies confirm our conjecture that they are avoiding competitions
with institutional investors—the crowding-out effects. More important, these effects are unlikely
driven by the professionals’ adjustment of their entry stage upon publicizing their identities, or the
large amount of dollars they commit. About the effects on funding and payment outcomes, we find
that the crowding out of retail investors indeed led to lower funding probability, and lower interest
rate as well. However, the payment outcomes (default) or the ROI were not affected.
Our paper first contributes to the literature on institutional investors (Shleifer and Summers
1990, Sias 2004, Barber and Odean 2008, Stein 2009) by investigating the direct effects of insti-
tutional investment on retail investors investment decisions. The identification comes from an
exogenous manipulation of institutional investors’ identities on a major unsecured personal loan
market on the Internet. In addition, we study a unique setting where all investors, retail or insti-
tutional, are identified in real time. Unlike most traditional financial markets, both institutional
and retail investors are on the same side of the market in our case, making the study of their
interactions simpler and cleaner. On top of these, the availability of trader-identified transactions
data, which are not available in most other financial markets, allows us to answer our research
questions empirically. Our results add to the identification of “herding” behaviors that are observed
in various markets (Scharfstein and Stein 1990, Banerjee 1992, Bikhchandani et al. 1992, Welch
1992, Zhang and Liu 2012) by studying whether the phenomenon in P2P lending can be driven
by the existence of financial professionals. We also contribute to the broad and emerging literature
on crowdfunding across multiple disciplines (Agrawal et al. 2013, Burtch et al. 2013, Rigbi 2013,
Kawai et al. 2014, Iyer et al. 2016, Lin and Viswanathan 2016, Wei and Lin 2016).
The paper is organized as follows. We start with our research context, Prosper.com, in the next
section (Section 2). We continue with a model of (institutional and retail) investors in Section
3. We introduce the main samples constructed from Prosper’s datasets in Section 4. Section 5

Lin et al.: Institutional Investors in Online Crowdfunding 5
reports our findings on the characterization of institutional investors on Prosper.com, including
the comparisons to retail investors. The focus of the study, the impacts of institutional investment
on retail investors, is presented in Section 6. We discuss and conclude in the last section.
2. Prosper.com and Investors
Prosper.com, open to the public in February 2006, is the first debt-based crowdfunding (or P2P
lending) marketplace in the US. The platform serves as a market that matches lenders and individ-
ual borrowers all over the country to originate fixed-rate unsecured personal loans. The principal of
these loans ranges from $1,000 to $35,000, and the major use of funds includes debt consolidation,
home improvement, and small businesses. Until December 2015, more than 490,000 borrowers have
originated loans with over $6 billion, making Prosper.com the second largest platform in the US.
Prosper used an auction-based funding mechanism before December 2010 (called the “eBay for
personal loans” during the time), after which the platform switched completely to a fixed interest
rate regime (Wei and Lin 2016). In this study, we focus on a period before the website’s shutdown in
October 2008 due to conflicts with the rules of the US Securities and Exchange Commission. During
our study period the funding processes were also auction-based. A typical process starts with the
borrower posting a loan request on the platform. The borrower indicates the amount requested
and the maximum interest rate at which he or she is willing to accept. Prosper adds verified
financial information about the borrower collected from Experian—one of the three traditional
credit bureaus. Upon observing the loan request, any lender, be it institutional or retail, can submit
bids by specifying a certain amount of dollars and the lowest interest rate at which he or she is
willing to lend. The amount can be any portion of the loan demand, and the interest rate cannot be
greater than the borrower’s pre-determined rate. The auction process finishes after a pre-specified
duration expires (typically 7 days before 2009). The winners are lenders that specified the lowest
interest rates, and the total amount proposed will cover the borrower’s requested amount. The
loan request can fail to be funded if there is not enough fund offered. Once it raises full funding
and transfers to a personal loan, it will be fully amortized into monthly payments over three years
typically. The borrower is subject to late fees and can suffer a substantial decrease in his or her
credit score. For more details of Prosper auctions and the P2P lending market in general, Lin et
al. (2013) provide more thorough summaries. Here we focus on the most relevant part.3
3 On December 20, 2010 Prosper.com eliminated this auctions model, and switched the whole website to a fixed-rateregime. Under the new posted-price type mechanism (Wei and Lin 2016), the borrower no longer gets to choose areserve interest rate. Instead, the platform assigns the interest rate based on the borrower’s credit profile and loancharacteristics. The implication is that the rate will be fixed over the funding and the subsequent repayment (iffunded) process. Therefore, lenders do not propose their own interest rates either. Instead, their commitments areonly comprised of some dollar amount. However, the repayment process stays the same, and borrowers are subjectto the same consequences of the payment outcome.

Lin et al.: Institutional Investors in Online Crowdfunding 6
Institutional investors are allowed to lend on Prosper.com since its inception in 2006. Accord-
ing to their corporate profile, most of the institutional investors are money managers or agents
working for pension funds or life insurance companies. These institutions differ in size, ranging
from small companies with annual revenue of $10,000, to large firms with $1.6 trillion in assets
under management.4 Before May 19, 2008, all lenders, either institutional or retail, were labeled
as a generic “Lender” on the website. After that, Prosper enhanced the account infrastructure for
institutional investors. The most important and prominent aspect of the improvement was that
Prosper started labeling institutional investors as “Institutional Lender,” keeping the label of other
investors unchanged.5
This policy change has potentially substantial impacts on other investors’ investment strategies
and the funding outcomes. The auction mechanism used by Prosper.com was in an open format,
in the sense that a potential bidder (lender) was able to observe all previous bidders’ identities,
bidding amount, and in some cases the proposed interest rate.6 The implication is that after May
19, 2008, if an institutional investor participates in an auction, all other lenders will be able to
observe its identity. Figure 1 shows the screenshot of an institutional investor’s profile page. The
label of “Institutional Lender” is now public under the “Role” section, particularly observed to all
other lenders during a funding process. The participation of institutional investors endorses the
borrower’s creditworthiness and repayment ability, which arguably has potential impacts on other
lenders’ investment decisions and therefore subsequent transaction outcomes.
3. A Model of Investors
In this section we develop a model of the mutual influence between institutional investors and retail
investors. The model allows for two scenarios in which investors’ identities do or do not influence the
equilibrium investment decisions. We also extend from the benchmark of a simultaneous move game
to allow for endogenous move (or entry) by investors. Our model is an adaptation from Banerjee
(1992), Bikhchandani et al. (1992), Gul and Lundholm (1995), and Gale (1996). The purpose is
to provide testable predictions about institutional investors’ entry decisions—early or late—in a
funding process, and more importantly retail investors’ responses in investment strategies upon
observing the participation of institutional investors—more or less likely to enter.
4 Small institutional investors, such as those with very small annual revenue, are not distinguishable from some retailcounterparts. In our main empirical analysis, we ignore this set of institutional investors.
5 All users of Prosper.com have labels of their identities, either borrower, lender, or both. This identity informa-tion is public on the website. Particularly, Prosper changed the label for lenders and differentiated them as either“Institutional Lender” or a generic “Lender.”
6 Lenders may be outbid in Prosper auctions. It happens when other lenders’ proposed rates are strictly lower andtheir aggregate amount satisfies the borrower’s funding needs. Once a lender is outbid, his or her interest rate will bemade public on the loan listing page.

Lin et al.: Institutional Investors in Online Crowdfunding 7
Figure 1 Screenshot of an Institutional Investor’s Profile Page on Prosper.com
For simplicity, we assume that there are two potential investors i= 1, 2. Without loss of gen-
erality, we let investor 1 be the institutional investor, and 2 the retail competitor. Each investor
observes a private signal, θi, independently drawn from the distributions Gi(·) (or gi(·) the PDF)
on [−1, 1]. We assume that the expected value of both θi is zero, i.e., Ei[θi] = 0 for i= 1, 2. We
interpret the private signal as the investor’s expected profit (in percentage) from a particular per-
sonal loan, that is, the difference between the expected return on investment and the unit cost
of funds. It is also worth noting that we do not assume that the distributions Gi(·) are identical,
because the two types of investors have different ability in assessing a particular investment, let
alone that institutional investors have more information in many cases. For example, it is likely
that G1(·) has a smaller variance than G2(·) because institutional investors generally have more
precise estimations of a personal loan’s expected profit. The assumption of private value (instead
of affiliated values) is motivated by the observation that notes were not allowed to transact during
our study period. Conditional on the private signal, each investor makes a binary choice, investing
or not investing. We let xi = 1 to denote investing, and xi = 0 not investing.
The actual profit from investment will be the value of a profit function f(θ1, θ2). We assume
that the function satisfies f(θ1, θ2)≤max{θ1, θ2} and f(θ1, θ2)≥min{θ1, θ2}. This assumption is

Lin et al.: Institutional Investors in Online Crowdfunding 8
to capture the possibility that the loan can fail to be funded, therefore the expected profit cannot
exceed the most optimal signal among the investors. One example of these functions is f(θ1, θ2) =
ω1θ1 + ω2θ2, where ω1, ω2 ∈ [0, 1] and ω1 + ω2 = 1, namely a weighted average of the two private
values. Although the actual profit depends on the signals of both investors, the signals are private
themselves. Therefore, each investor will make a decision under incomplete information.
Simultaneous Move Game: The simplest scenario is where the two investors make the partic-
ipation decisions simultaneously, and their identities are irrelevant. This represents a simultaneous
move, one-shot game with private information. In this case, the unique equilibrium is that each
investor invests if and only if θi ≥ 0, because given θi the expected value of the other signal is zero
since E [θ−i|θi] =E−i[θ−i] = 0. It follows that the expected profit E [f (θi, θ−i)]≥E [min{θi, θ−i}]≥
0. The first-best optimal decision is for both investors to invest if and only if f (θ1, θ2)≥ 0 which
allows for cases where θ1 ≥ 0 but θ2 ≤ 0, and vice versa. In this sense, the simple simultaneous
move game provides a sub-optimal solution of the investment game.
The Benchmark: The simultaneous move game omits an obvious and important feature of
the funding mechanisms on Prosper.com, namely investors can choose when to enter a particular
funding process. This endogenous move or entry by investors offers extra insights into participation
strategies and funding outcomes. Let us first consider the benchmark scenario where the identity
of investors remains uncovered and irrelevant throughout the funding process. Suppose that the
time is divided into two periods, and each investor decides to enter in either period, with the only
restriction that the investment is irreversible. If an investor decides to enter in the first stage, the
decision will be solely based on his or her own private signal. But if he or she waits until the second
period, there is the possibility that he or she gets additional information from the actions of the
other investor in the first period. However, there is also a cost of waiting. We assume that the
investors discount the future earning by a discount factor δ ∈ (0, 1).
If an investor participates in the first period, his or her expected profit from the investment
will be θi. If he or she waits until the second period, the cost of delaying the entrance will be the
difference between the profit of investing in the first period and the discounted profit in the second
period, namely θi − δ · θi = (1− δ) · θi. It is straightforward to see that the investor with a higher
signal will be more impatient to invest and less likely to wait until the second period. The investor
with a lower signal will be more patient in contrast. It is also not hard to see that an investor will
not enter in the first stage if θi < 0, and may wait if θi is only slightly positive. Suppose that there
is a threshold of the signal value above which the investor will participate immediately in the first
period, but wait if below. Let θ̄ denote this threshold.
For an investor to delay the entry until the second period, there has to be some option value of
the decision. As we pointed out, an investor enters immediately if and only if θi ≥ θ̄. If he or she

Lin et al.: Institutional Investors in Online Crowdfunding 9
waits and the other investor −i does not enter either in the first stage, the focal investor i’s profit
of investing at the second date will be ωiθi + ω−iE[θ−i|θ−i < θ̄
]. The probability of this event is
Pr(θ−i < θ̄
). We interpret the option value of delaying as the expected loss that investor i avoids
by not entering in the second period. At the threshold value θ̄, the investor is indifferent between
investing in the first stage and delaying until the second period. For this type of investor, the cost
and benefits of delaying balance out, i.e.,
(1− δ) · θ̄=−δ ·Pr(θ−i < θ̄
)·{ωiθ̄+ω−iE
[θ−i|θ−i < θ̄
]}.
It is straightforward to show that there exists a unique θ̄ satisfying this equation. To see this,
first notice that the left-hand side of the equation (LHS) is increasing in θ̄, while the right-hand
side (RHS) is decreasing in θ̄. With θ̄ taking values in [0, 1], RHS(θ̄= 0
)> LHS
(θ̄= 0
)= 0, and
RHS(θ̄= 1
)< 0< LHS
(θ̄= 1
), there exists a unique value of θ̄ ∈ (0, 1) where LHS
(θ̄)
= RHS(θ̄).
Investors’ Identity: Now let us extend from the benchmark case. We let investor 1 be the
institutional investor, and 2 the retail investor. Each investor knows his or her own identity, there-
fore, the other investor’s identity as well since there are only two investors. To capture the idea
that institutional investors generally have lower cost of funds and higher precision of evaluation,
we assume from now on θ1 > θ2. For our purpose, we are going to show that given investor 1 par-
ticipates in the first period, the probability of investor 2 not entering in the second stage is larger
compared to the benchmark case.
We start with the probability that investor 2 not entering at all in either the first or second stage,
and investor 1 participating at the first date in the benchmark situation. The probability of this
event is Pr(ω1E [θ1|θ1 > 0] +ω2θ2 < 0, θ1 > θ̄ > θ2
)= Pr
(θ2 < (−ω1E [θ1|θ1 > 0]/ω2) , θ1 > θ̄
). In the
benchmark case, we assume that θ1 and θ2 are independent. In sharp contrast, when investors’
identities are now common knowledge, θ1 and θ2 are no longer independent. As we assumed, θ1 > θ2.
Although the event still happens when θ2 < (−ω1E [θ1|θ1 > 0]/ω2) and θ1 > θ̄, the probability will
be different because the joint distribution of θ1 and θ2 is now different. It is straightforward to
show that the probability of investor 2 not entering at all and investor 1 entering at date one
is strictly smaller in the benchmark case.7 That is, compared to the benchmark where investors’
identity is not revealed and irrelevant, the likelihood that the retail investor does not participate
while the institutional investors enters early is higher when the identity is public information.
To summarize, the key takeaways from the model are: (1) the institutional investor, with a
higher value of his or her private signal, is more impatient and less likely to wait until the second
7 To show this, we are going to prove that the density function of the joint distribution of θ1 and θ2 is smaller in thebenchmark case on the support θ1 ∈ [−1, 1] and θ2 ∈ [−1, θ1]. Let the joint distribution in the benchmark be gB(·),and gI(·) for the case when the identity is public. It is easy to show that gI (θ1, θ2)> gB (θ1, θ2). To see this, noticethat
∫ 1
−1
∫ 1
−1gB (θ1, θ2)dθ1dθ2 =
∫ 1
−1
∫ 1
θ2gI (θ1, θ2)dθ1dθ2 = 1, so gI (θ1, θ2)> gB (θ1, θ2).

Lin et al.: Institutional Investors in Online Crowdfunding 10
stage; and (2) the probability that the institutional investor enters in the first period and the retail
investor never enters is larger, when their identities are made public. The intuition behind the
mathematical exercise is that first, institutional investors, with significantly lower cost of funds,
incurs strictly greater opportunity cost of waiting compared to retail investors. Second, given the
signals of both types of investors, it is now more likely that retail investors are in inferior positions,
because they realize that they are not able to make larger profits than institutional investors due
to the higher cost of their funds. Therefore, given retail investors’ private signals, they are going
to find a particular loan less profitable when they observe institutional investors’ entry.
4. Data and Sample
We user administrative data from Prosper.com to test our model predictions and for other empir-
ical analysis. Prosper provides public access to its application program interface (API) service
containing all its administrative data. The dataset includes all (both failed and successful) loan
requests that were posted on the website up to the data collection date. It also records all bids
made in all auctions, or individual investment in the fixed interest rate regime. Prosper also makes
the verified credit profile, collected from Experian, available to registered Prosper lenders. We thus
have access to all the credit information about a borrower, such as the range of credit score, credit
usage information, detailed credit history, and so on. For funded loans, we are able to track the
monthly payment history and payment outcomes (e.g., default or early payoff).
We construct two samples for our empirical analyses from the dataset. For characterizing insti-
tutional investors on Prosper.com, we focus on all transactions happened on the platform up to
the end of 2012. This sample contains 444,639 loan requests with a total of 11,705,705 unique
bids submitted. We are able to observe the lender identity (esp. institutional or retail), proposed
amount, and in some cases the interest rate for all sampled bids. This allows us to differentiate the
loan requests (thus funded loans also) with or without institutional investors.
Since the focus is the effects of institutional investment on investment strategies of retail investors
and transaction outcomes, as mentioned above, we make use of the exogenous change in the label
of institutional investors to empirically answer our research questions. We construct the second
and our main sample including all transactions within a short period before and after the labeling
event. Specifically, the sample contains all loan requests between January 19, 2008 and September
19, 2008, an eight months window. We remove the listings that were posted before the change but
ended afterwards. These listings comprise a negligible subset of the sample, less than 5% in total.
After the elimination, we have 98,395 loan requests in profile with 2,234,092 bids submitted to
these loans. Among these listings, 9,722 were funded and transformed to unsecured personal loans.
With monthly payment data, we are able to calculate the return on investment for 9,292 funded

Lin et al.: Institutional Investors in Online Crowdfunding 11
loans. Less than 5% of personal loans have missing values of ROI due to data incompleteness or
absence. Table 1 reports the descriptive statistics for key variables. It is easy to see that the set of
loan requests did not change dramatically after the labeling event in terms of loan characteristics
and borrowers’ credit profile. In other words, the demand side stayed constant before and after
Prosper labeling institutional investors.
Table 1 Summary Statistics of All Loan Requests Posted January 19, 2008 - September 19, 2008
Before May 19, 2008 After May 19, 2008
Variables:a Mean sd Mean sd t-Statistic p-Value
Amount Requested ($) 7433.320 6438.256 7145.494 6341.980 -0.849 0.408# Bids 23.280 77.220 22.163 71.337 0.845 0.411Borrower Maximum Rate (%) 20.928 9.575 26.476 9.599 0.731 0.474Estimated Loss (%) 15.231 9.649 14.645 9.154 -0.154 0.8781(Borrower is Homeowner) 0.381 0.486 0.383 0.486 0.922 0.3701(Funded) 0.094 0.292 0.103 0.304 0.838 0.415Listing Effective Days 5.769 3.029 5.641 2.390 -0.111 0.912Bankcard Utilization (%) 63.137 41.915 62.277 41.505 -0.668 0.513Current Credit Lines 8.840 6.186 8.545 6.118 -0.514 0.612Current Delinquencies 2.858 4.588 2.594 4.416 -0.724 0.478Delinquencies Last 7 Years 9.368 15.449 9.117 15.732 0.532 0.601Inquiries Last 6 Months 3.572 4.344 3.223 3.914 -0.902 0.380Open Credit Lines 7.757 5.481 7.722 5.564 -0.461 0.649Public Records Last 10 Years 0.577 1.181 0.521 1.093 -0.007 0.994Public Records Last 12 Months 0.073 0.336 0.066 0.306 0.863 0.400Total Credit Lines 26.097 14.829 25.668 14.930 0.845 0.410Total Open Revolving Accounts 6.002 5.016 5.913 5.059 -0.650 0.5231(With Institutional Lender) 0.025 0.155 0.120 0.325 0.386 0.703
Num. obs. 47,813 50,582
a This table presents the summary statistics of key variables for loan requests that were postedbetween January 19, 2008 and September 19, 2008 included. It is easy to see that the listing char-acteristics and borrower credit profile do not change after the labeling event on May 19, 2008.
5. Institutional Investors on Prosper.com
Institutional investors on Prosper.com are mostly money managers or agents working for pension
funds and life insurance companies. The number of active institutional investors, who were con-
secutively competing in personal loan requests, was growing over the past few years. Institutional
investors generally have much larger funds under management compared to retail investors. Do they
also have much larger investment in P2P lending? We compare the ratio between the number of
institutional investors and that of retail investors, with the ratio of institutional funds versus retail
funds. We find that the funds ratio was significantly larger than the investor count ratio (Figure
2). Not surprisingly, institutional investments are large in volumes relative to retail investments.
They are still the “big fish” in the emerging online consumer loan market.

Lin et al.: Institutional Investors in Online Crowdfunding 12
0.0
0.3
0.6
0.9
2006 2008 2010 2012Listing Post Date
Rat
io
Ratio of investors count Ratio of investment amount ($)
Figure 2 The Funds Ratio versus the Counts Ratio (Institutional/Retail) until 2012
Institutional investors usually invest in diverse assets to balance off the profits and risk. On
Prosper.com, the personal loans are categorized based on their estimated loss rate and loan char-
acteristics such as the term and if the borrower is a returning borrower. Figure 3 shows the dis-
tributions of funded loans according to borrowers’ credit grades. We do observe that institutional
investors had more diverse portfolios across risk levels, relative to the profile of personal loans on
Prosper.com. In terms of loan purposes, Figure 4 shows that compared to the portfolio on Pros-
per.com, institutional investors were more likely to invest in Loans for debt consolidation, small
businesses, or home improvement.
AA A B C D E HR
Credit Grade
Fra
ctio
n
0.0
0.1
0.2
0.3
0.4
0.5
Personal loan requestsWith IIALL
Figure 3 Distributions of Loan Requests by Borrowers’ Credit Grades up to 2012

Lin et al.: Institutional Investors in Online Crowdfunding 13
Debt consolidation Business Personal loan Home Auto Student loan Other
Category
Fra
ctio
n
0.0
0.1
0.2
0.3
0.4
Personal loan requestsWith IIALL
Figure 4 Distributions of Loan Requests by Categories (Loan Purpose) up to 2012
“Home bias” is a well documented phenomenon in extensive literature, referring to the ten-
dency that transactions are more likely to occur between parties from the same geographic location
(French and Porteba 1991, Lin and Viswanathan 2016). Although P2P lending is generally con-
sidered as a means to overcome information asymmetries between parties involved in exchanges,
Lin and Viswanathan (2016) still find the home bias phenomenon in this market. Institutional
investors are considered to have more precise and objective estimates about the creditworthiness of
a particular borrower than retail investors. This suggests that institutional investors should be less
likely to invest in the borrowers from the same geographic area. To examine if this conjecture holds
in the setting of P2P lending, we use a measure of home bias similar to Feng and Seasholes (2008)
and compare institutional investors with their retail counterparts. Specifically, we first calculate a
state’s market portfolio as the fraction of total funds ever invested in the state on Prosper.com. For
example, as shown in Table 2 the total amount of funds for personal loans in California accounts for
15.5% of all funds (ever invested on Prosper.com until 2012). Then for institutional investors and
retail investors separately, we calculate the weighted (by dollar amount) average fraction of funds
ever invested in the home state. By this calculation, as in Table 2 the weighted average fraction for
institutional investors in California was about 14.6%, and 18.6% for California’s retail investors in
contrast. Similar comparisons show up in most other states. Due to the space restriction, Table 2
reports only the top 11 states, which account for around 60% of the market portfolio. Consistent
with our conjecture, we find that institutional investors indeed have smaller fractions of home state
investment compared to retail investors on Prosper.com.
Given their expertise, institutional investors often have better performance than retail investors
in terms of securing returns from their investment. Prosper’s rich dataset allows us to calculate
Lin et al.: Institutional Investors in Online Crowdfunding 14
Table 2 Home Bias: Institutional Investors versus Retail Investors
Weight of local Weighted average Weighted averageloans in Prosper’s fraction of II portfolio fraction of RI portfolio
States:a portfolio invested locallyb invested locally
California 0.155 0.146 0.186Florida 0.064 0.050 0.080Texas 0.060 0.060 0.064Illinois 0.059 0.056 0.074Georgia 0.059 0.043 0.080New York 0.057 0.054 0.059Ohio 0.033 0.015 0.046Michigan 0.032 0.076 0.049Maryland 0.030 0.013 0.045Virginia 0.030 0.036 0.034Washington 0.030 0.014 0.045
a This tables reports only the largest eleven states as measured by their marketvalues. Together they account for 60.9% of the market portfolio on Prosper.com
b “II” abbreviates for institutional investors, and “RI” for retail investors. Thisapplies to all subsequent tables and figures.
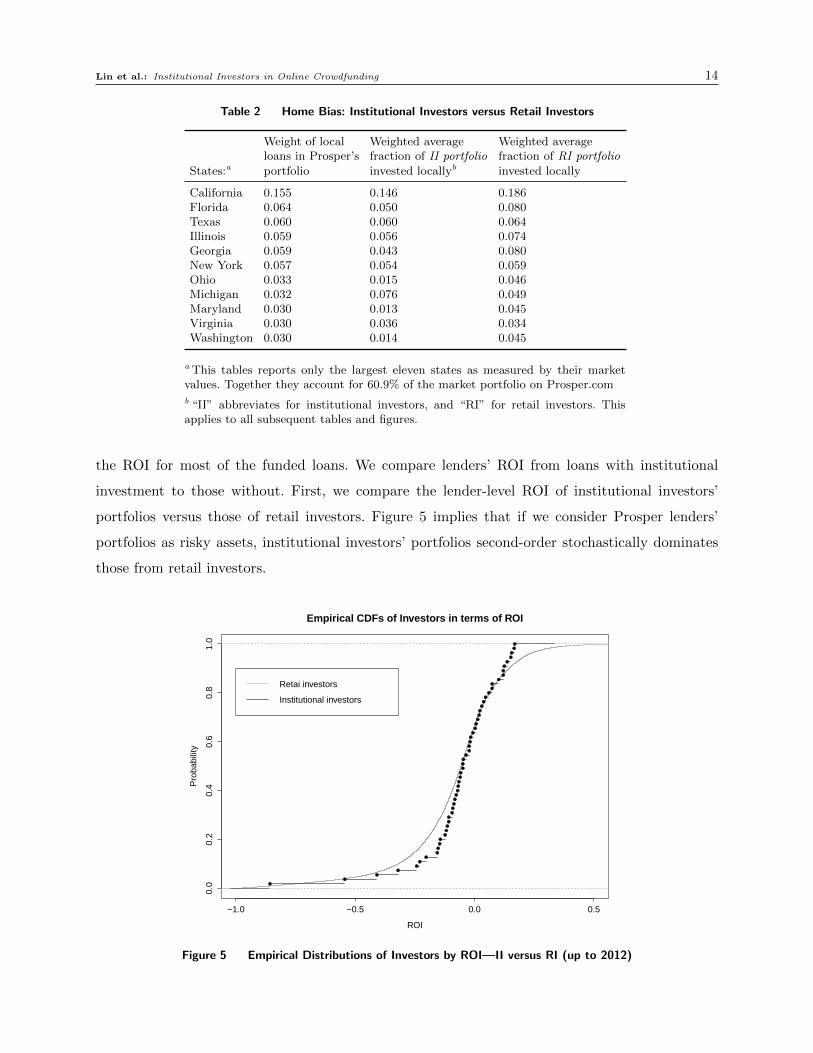
the ROI for most of the funded loans. We compare lenders’ ROI from loans with institutional
investment to those without. First, we compare the lender-level ROI of institutional investors’
portfolios versus those of retail investors. Figure 5 implies that if we consider Prosper lenders’
portfolios as risky assets, institutional investors’ portfolios second-order stochastically dominates
those from retail investors.
−1.0 −0.5 0.0 0.5
0.0
0.2
0.4
0.6
0.8
1.0
Empirical CDFs of Investors in terms of ROI
ROI
Pro
babi
lity
Retai investors
Institutional investors
Figure 5 Empirical Distributions of Investors by ROI—II versus RI (up to 2012)

Lin et al.: Institutional Investors in Online Crowdfunding 15
More formally, we match each personal loan with institutional investor(s) to those without
institutional investors based on the interest rate (or APR) and being funded in a same period
of time (e.g., the same week). In addition to the ROI, we also examine the difference in default
rate and prepayment rate,8 which determine the rate of return along side the interest rate. The
average rates (of default, prepayment, or return) and t-test results are reported in Table 3 through
5. Interestingly, the average rate of default from the loans with institutional investors are slightly
(not statistically significant) lower than those without (Table 3), while the rate of early payoff is
much higher in loans with institutional investors (Table 4). The tradeoff between lower default
rate and higher prepayment rate boils down to the lower average rate of return for loans with
institutional investors (Table 5). Therefore, at the loan level,9 although often referred to as “smart
money” in traditional financial markets, institutional investors are not outperforming their retail
counterparts on average.
Table 3 Comparing the Default Rate of Funded Loans
With II Without II
Matching Mean Mean t-Statistic p-Value
Exact 0.346 0.359 -0.975 0.330≤ 0.01% 0.346 0.347 -0.068 0.946≤ 0.02% 0.346 0.348 -0.014 0.889≤ 0.05% 0.346 0.339 0.622 0.534
Table 4 Comparing the Prepayment Rate of Funded Loans
With II Without II
Matching Mean Mean t-Statistic p-Value
Exact 0.619 0.592 2.074 0.038≤ 0.01% 0.619 0.602 1.324 0.185≤ 0.02% 0.619 0.602 1.398 0.162≤ 0.05% 0.619 0.610 0.788 0.431
8 We define a loan being paid early if the borrower pays off the loan before the expiration date. For robustness checks,we explore other definitions of early payoff such as being paid within the first 12 months or 24 months since thebeginning of the payment process. Results are qualitatively similar.
9 We also directly compare ROIs at the lender level. Specifically, we calculate the weighted (in participation amountof dollars) average ROI for each individual investor from all his or her investment up to 2012. Regular t-tests fail toreject the null that an institutional investor’s ROI is significantly higher than that of a retail investor. This confirmsour conjecture that institutional investors do not necessarily outperform retail investors on this platform.

Lin et al.: Institutional Investors in Online Crowdfunding 16
Table 5 Comparing the ROI of Funded Loans
With II Without II
Matching Mean Mean t-Statistic p-Value
Exact 0.183 0.212 -2.116 0.034≤ 0.01% 0.183 0.213 -2.231 0.026≤ 0.02% 0.183 0.217 -2.577 0.010≤ 0.05% 0.183 0.216 -2.568 0.010
6. Labeling Institutional Investors on Prosper.com
Our main empirical analysis is motivated by the absence in the literature about the interactions
between institutional and retail investors, as well as predictions about investment behaviors from
the theory of information cascading (Scharfstein and Stein 1990, Zhang and Liu 2012). For the
purpose of comprehensive understanding, we start with whether and how institutional investors
adjust their investment and entry strategies before and after the labeling event. We compare
institutional investors’ “activeness” and lending strategies before and after the labeling event. Our
focus is how the change in retail investors’ bidding behavior upon observing institutional investment
differs after the labeling event. Last but not least, we compare the transaction outcomes before and
after the “natural experiment,” including funding outcomes (whether funded and interest rates if
funded) and payment results (whether defaulted and lenders’ ROI from funded loans).
6.1. Institutional Investors
Potentially, institutional investors have incentives to adjust their investment and bidding strategies
after the platform starts revealing their identities to the public. However, we do not find significant
changes in their lending “activeness” (measured by the frequency of participation), or investment
choices including diversification strategies and portfolio performance. In contrast, institutional
investors adjust the timing of entry by submitting their bids earlier than before.
We first notice that after May 19, 2008, the number of registered or active institutional investors
witnessed a rapid growth. During our study period, the number of active institutional investors
rose by 200% after the labeling event.10 Similarly, the (daily) fraction of institutional bids increased
dramatically after the labeling event (Figure 6). These seem to suggest that individual institutional
investors became more “active” in lending with their identities revealed to the public. However, it
is observed that these changes were driven by the set of new institutional investors who registered
after May 19, 2008. In sharp contrast, we do not find significant changes in the activeness in lending
for “old” institutional investors that joined the platform before the labeling event (Figure 7).
10 One may have a concern that our main empirical findings are driven by the entry of new institutional investors. Inone of the robustness checks in Section 6.4, we focus only on the “old” institutional investors. The results are highlyconsistent with our main findings.

Lin et al.: Institutional Investors in Online Crowdfunding 17
0.00
0.01
0.02
2008-03-01 2008-05-01 2008-07-01 2008-09-01Bid Creation Day
Fra
ctio
n
Labeling Institutions:
Before
After
Figure 6 Daily Fraction of Bids by Institutional Investors before and after May 19, 2008
0.000
0.025
0.050
0.075
2008-03-01 2008-05-01 2008-07-01 2008-09-01Bid Creation Day
Fra
ctio
n
Labeling Institutions:
Before
After
Figure 7 Daily Fraction of Bids by Institutional Investors Registered before Labeling
before and after May 19, 2008
We also examine whether institutional investors’ investment strategies—choices and outcomes—
changed dramatically. Is it the case that the new set of institutional investors have different prefer-
ence over the personal loans on Prosper.com? Overall they are similar to those “old” institutional
investors in maintaining a similar portfolio across risk levels. We find that although they invest
slightly more in riskier loans, the difference in the composition of personal loans was far from sig-
nificant (Figure 8). About the performance of their portfolios, we first calculate the rate of return
on investment for each funded loan taking into account early payoff and default. Figure 9 depicts
the empirical distributions (smoothed by Gaussian processes) of loans with institutional investors
before and after the labeling event. It suggests that, on average, institutional investors’ gains (or

Lin et al.: Institutional Investors in Online Crowdfunding 18
losses) did not change dramatically after May 19, 2008. A standard two-sided t-test also fails to
reject the null of equal means in the two samples before and after the labeling event.
AA A B C D E HR
Credit Grade
Fra
ctio
n
0.0
0.1
0.2
0.3
0.4
0.5
Labeling institutional investors (May 19, 2008):Before
After
Figure 8 Distributions of Funded Loans with Institutional Investment before and after May 19, 2008
0.0
0.5
1.0
1.5
2.0
-1.0 -0.5 0.0 0.5 1.0Return on Investment
De
ns
ity Labeling institutions:
No
Yes
Figure 9 Distributions of Loans (of ROI) with Institutional Investment before and after May 19, 2008
Although institutional investors’ activeness in lending, diversification strategy, or the return on
investment did not change dramatically before and after, they might adjust the lending strategies
in light of the fact that the their participation in a funding process, due to the revelation of
their identities, convey information to other investors. We find that institutional investors enter
on average earlier in the funding process after Prosper labeling them. We measure their entry
stage by the percentage of funds needed, the number of bids submitted, and the prevailing interest

Lin et al.: Institutional Investors in Online Crowdfunding 19
rate when entering. Estimates in the first three columns of Table 6 suggest that, on average, after
the labeling event institutional investors are more likely to participate when more funds needed,
less bids submitted, and with higher prevailing interest rate. All these results imply that these
professionals participate earlier than they do without identity revelation. Upon participating, the
amount and proposed interest rate of institutional bids serve as signals of their estimates about the
borrower’s creditworthiness. We find that institutional investors became more conservative after
Prosper labeling their identities, by offering smaller amount of dollars on average (the last column
of Table 6).
Table 6 Effects of Labeling Institutional Investors on Their Lending Strategies
OLS Estimates
Med. cumulative Med. Med. prevailing Med. biddingDep. var.: amount fundeda # Bids interest rate amount
1 (Labeling institutional investors) -2.039∗∗∗ -26.759∗∗∗ 2.602∗∗∗ -0.382∗∗∗
(0.308) (3.747) (0.163) (0.051)
Loan characteristics Yes Yes Yes YesBorrower’s credit profile Yes Yes Yes YesCredit grade FE Yes Yes Yes YesState FE Yes Yes Yes Yes
Adjusted R2 0.323 0.314 0.670 0.059Num. Obs. 7,238 7,238 7,238 7,238
***p < 0.01, **p < 0.05, *p < 0.1
a The dollar amounts are in $1,000. The first three dependent variables are evaluated at the time ofinstitutional bids. As an example, the variable “med. cumulative amount funded” calculates the medianof the cumulative amount funded among all institutional bids. The last dependent variable is the medianamount in all institutional bids. We repeat all estimates with the mean value of each variables, and resultsare fairly close.
6.2. Effects on Retail Investors
The participation of institutional investors in a funding process serves as an endorsement of the bor-
rower’s creditworthiness. As professionals in financial markets, institutional investors have arguably
advantage over their retail counterparts in terms of estimating the profits, taking into account
the likelihood of default. For example, given a personal loan, institutional investors generally have
more precise predictions about the borrower’s ability to pay back. In addition, they have more
information about the consumer loan market overall, and how the market conditions affect borrow-
ers’ payment likelihood. Therefore, investing in the loan requests with institutional investors does
not seem to be an inferior choice. This is the “herding” effect. However, due to the nature of the
auction mechanism on Prosper.com, institutional investors do not only choose the dollar amount,
but also propose an interest rate based on their estimates of the borrower’s creditworthiness. With
more diverse portfolios and larger funds available, institutional investors are more likely to assign

Lin et al.: Institutional Investors in Online Crowdfunding 20
lower interest rates in order to secure a lender position, given that they find it profitable and decide
to participate. The consequence is that the interest rates can be too low, for retail investors, to
compensate for their risks. Therefore, it is likely that retail investors are “crowded out” by the
participation of institutional investors. With this tradeoff facing retail investors in mind, we empir-
ically test which effect, herding or crowding out, dominates their lending decisions upon observing
institutional investors.
6.2.1. Empirical Strategies Our main empirical strategy is a differences-in-differences (DID
or diff-in-diff) design utilizing the “natural experiment.” To test our hypotheses H??, H??, and
H??, we construct our outcome variables accordingly and examine the effects on the number of
participating retail investors, retail investor bids, and the total amount of dollars offered by retail
investors respectively.
We explore the intertemporal relationships between the outcomes variables in a certain period
of time (e.g., a day or an hour), and whether observing institutional bids in the previous period.
This is similar to the idea of measuring herding proposed by Zhang and Liu (2012). They study
intertemporal correlations between funds received in the current and previous period, and show
whether and how much subsequent lenders herd into certain loan requests. Our main empirical
specification is based on this model, and adjusted to incorporate the diff-in-diff design. Our baseline
model is
yit = µi +β1 ·DIi,t−1 ·D
Labelingi +β2 ·DI
i,t−1 + b′3 ·Xi,t−1 +ωt + εit, (1)
where yit is the dependent variable such as the number of participating retail investors in the listing
i at date t, or the total amount of funds offered by retail investors for listing i at date t; DIi,t−1
is a dummy variable indicating whether institutional investors bid in the listing i at the previous
date t− 1; DLabelingi indicates whether the listing i was posted after May 19, 2008. The control
variables Xi,t−1 contain all covariates as in Zhang and Liu (2012), in particular the cumulative
funds received by the end of the date t− 1, the prevailing interest rate up to date t− 1, and the
cumulative number of bids until the end of date t− 1. We also include the individual listing fixed
effects (µi) and the day of listing fixed effects (ωt) to control for any unobserved characteristics
within a listing and a particular date.
By the construction, estimates of β1 in Equation (1), which is the coefficient of the interaction
term (between the dummy for institutional participation and the dummy for the labeling event),
capture the causal effects of institutional investment on the outcome variables. We could have
included an extra term for the indicator DLabelingi only. However, it is straightforward to see that
this variable is multicollinear with the individual listing fixed effects µi and not identified.

Lin et al.: Institutional Investors in Online Crowdfunding 21
6.2.2. Findings Estimates of the main specification, Equation (1), are reported in Table 7.
Notice that in our main specifications, we treat a date t as a single day in the funding processes. We
conduct a robustness check (in Section 6.4) by comparing the main results to specifications where
a date t means an hour during a funding process. The control variables include the cumulative
amount of dollars received by the end of date t− 1, the percentage of requested amount remained
unsatisfied until t−1, the prevailing or minimal interest rate by t−1, the cumulative number of bids
submitted until t−1, and an interaction term between the cumulative funds and the percentage of
funds needed. These variables are included to control for confounding effects such as unobserved
heterogeneity across listings, payoff externality, and irrational herding (Zhang and Liu 2012).
Table 7 Effects of Labeling Institutional Investors on the Retail Investor Behaviors
OLS Estimates
# RIt # RI bidst Total funds by RIta
Dep. var.: (1) (2) (3)
1 (With II)t−1 · 1 (Labeling II) -1.627∗ -2.141∗∗ -0.282∗∗∗
(0.928) (1.020) (0.085)1 (With II)t−1 6.306∗∗∗ 7.045∗∗∗ 0.650∗∗∗
(0.864) (1.950) (0.080)Cum. fundst−1 6.784∗∗∗ 7.604∗∗∗ 0.436∗∗∗
(0.066) (1.073) (0.006)Percent neededt−1 0.053∗∗∗ 0.034∗∗∗ 0.003∗∗∗
(0.004) (1.005) (0.412e-03)Min. ratet−1 0.028 -0.038 -0.006
(0.045) (1.049) (0.004)# bidst−1 -0.579∗∗∗ -0.636∗∗∗ -0.036∗∗∗
(0.005) (1.006) (0.482e-03)Cum. fundst−1 ·Percent neededt−1 0.013∗∗∗ 0.010∗∗∗ 0.001∗∗∗
(0.001) (1.001) (0.919e-04)
Listing FE Yes Yes YesDay of Listing FE Yes Yes YesWeekday FE Yes Yes Yes
Adj. R2 0.274 0.340 0.321Num. Obs. 188,254 188,254 188,254
***p < 0.01, **p < 0.05, *p < 0.1
a The total funds offered by retail investors at date t are evaluated at $1,000.
Column (1) in Table 7 reports the estimates when the dependent variable is the number of
participating retail investors at date t. The estimate of β1, associated with DIi,t−1 ·D
Labelingi , suggests
that upon knowing that there were institutional investors participating in the last period, less
retail investors participate in the current period. On average, the participation of institutional
investors in the previous stage leads to around 1.6 less retail investors entering the auction process.
Retail investors are essentially avoiding competitions with those big institutions. This observation
supports the prediction in our model (Section 3) that retail investors are less likely to enter upon

Lin et al.: Institutional Investors in Online Crowdfunding 22
observing institutional investors participating in the previous period. Similar results on the quantity
of retail bids also lend supports to our conjecture that small lenders shy away from the listings
with institutional investment. Column (2) of Table 7 shows that the participation of institutional
investors causes around 2.1 less number of bids by retail lenders. Given retail investors’ decisions to
enter after institutional investors, we find that they are going to commit smaller amount of dollars,
which is confirming our conjecture that institutional investors are crowding out retail investors
(column (3) of Table 7).
6.3. Transaction Outcomes
Findings in the previous sections suggest that the labeling event has significant effects on lending
strategies of both institutional and retail investors. These changes directly affect the transaction
outcomes of the loan requests, e.g., whether a loan is successfully funded and the interest rate if
funded. They have impacts on loan payment outcomes and lenders’ portfolio performances indi-
rectly by affecting the loan terms such as interest rates.
6.3.1. Empirical Strategy We are interested in how the difference in transaction outcomes
between loans with institutional investment and those without changes after the “natural experi-
ment” on institutional investors’ identities. As an example, we consider whether a loan request is
funded or not. We compare, before and after the labeling event, the difference in funding likeli-
hood for loans with institutional investors and those without. Other outcomes under considerations
include, given a loan is successfully funded, the interest rate (or APR), whether a loan is delinquent,
and the ROI for lenders.
In the analysis of the effects on retail investor lending strategies as in Section 6.2, we focus
on the subgroup of loan requests with institutional investment. Instead, due to the nature of
comparing loans with and without institutional investors, we examine all requests and funded loans
(with and without institutional investors) for analyzing the effects on transaction outcomes. The
main specification we estimate is, therefore, different from Equation (1). The main equation for
estimating how the labeling event affects transaction outcomes is,
yist = β0 +β1 ·DLabelingist ·DI
ist +β2 ·DIist + b′3 ·Xist +β4 · IStates +β5 · IWeek
t + εist, (2)
where yist are the transaction outcomes as mentioned early. The dummy variable DIist indicates
whether a loan has institutional funds or not. Note that the term for DLabelingist is also omitted
with the inclusion of week fixed effects. The coefficient, β1, of the interaction term reveals how the
difference in outcomes is correlated with the labeling event.

Lin et al.: Institutional Investors in Online Crowdfunding 23
6.3.2. Findings The transaction outcomes we are interested in include whether a loan is
funded, the APR or contract interest rate if funded, the payment result and ROI for funded loans.
Estimates of the key coefficients in Equations 2 are reported in Tables 8. We include the same set
of control variables as in Table 6.
Table 8 Effects of Labeling Institutional Investors on Transaction Outcomes
OLS estimatesa
Dep. var.: 1(Funded) APR 1(Defaulted) ROI
1 (Labeling II)× 1 (With II) -0.167∗∗∗ -0.586∗∗ 0.013 -0.001(0.009) (0.275) (0.022) (0.033)
1 (Labeling II) 0.011∗∗∗ 1.985∗∗∗ -0.013 0.062(0.002) (0.144) (0.012) (0.018)
1 (With II) 0.415∗∗∗ 0.472∗∗ -0.028 0.032(0.008) (0.233) (0.019) (0.028)
Loan characteristics Yes Yes Yes YesBorrower’s credit profile Yes Yes Yes YesCredit grade FE Yes Yes Yes YesState FE Yes Yes Yes Yes
Adjusted R2 0.203 0.593 0.095 0.043Num. Obs. 98,395 9,722 9,722 9,292
***p < 0.01, **p < 0.05, *p < 0.1
a Results are qualitatively similar using other specifications such as probit (orlogit) regressions for 1(Funded) and 1(Defaulted), and Tobit regression for APRand ROI.
In Section 6.2, we find that the event of labeling institutional investors causes retail investors
to bid smaller amount and less participating retail investors. Consistently, estimates in the first
column of Table 8 suggests that, after the labeling event, the difference in funding probability
between loans with institutional investment and those without became smaller. How does the
crowding out effect affects the interest rate given a loan is funded? The estimate of β1 in column 2
of Table 8 suggest that, after labeling institutional investors, the difference in the contract interest
rate between funded loans with institutional funds and those without dropped by more than 50
basis points.
Meanwhile, it is important to examine the treatment effect on loans’ payment results. All funded
loans in our sample have completed their payment cycles. This allows us to study the effects on
default rate, as well as the overall ROI for lenders. We first look at the effect on the probability
of default, which we define as either “Charge-off” or “Defaulted” in the data. Economic theory
suggests that contract interest rates are positively correlated with default rate (Stiglitz and Weiss
1981). Our findings are consistent with this prediction. The effects of the labeling event has a
negative correlation with the difference in the probability of default for loans with and without
institutional funds (column 3 of Table 8).

Lin et al.: Institutional Investors in Online Crowdfunding 24
From the lenders’ points of views, it is also important to examine the effect of labeling insti-
tutional investors on the return from their investment. Prosper provided the detailed monthly
payment results as well as each and every additional payment borrowers made for most of the per-
sonal loans.11 We are then able to calculate the detailed ROI at each payment cycle, particularly
the overall ROI at the end of the payment period. We find that, on average, the labeling event
does not have statistically significant effect on the ROI. Estimates in the last columns of Table 8
are not signifiant under common significance levels.
6.4. Robustness Checks and Placebo Tests
There are potentially three major concerns that might deteriorate the validity of our empirical
results about the effects on retail investors and transaction outcomes. As mentioned, we observe
a large number of institutional investors entering the market after the labeling event. This raises
the question whether the new set of institutional investors have different investment behaviors and
thus distinct effects on retail investors and transaction outcomes. Another concern is related to the
elimination of interest rate caps on Prosper.com on April 15, 2008 (Rigbi 2013). Recall that our
main sample contains the loan requests that were posted between January 2008 and September
2008, which covers the policy change of usury law restrictions. This policy change can potentially
contaminate our empirical results as well. A third set of concerns are about our definition of date
or a period in Table 7. Would a different segmentation of observations lead to different or even
reverse results about the effects on retail investor behaviors? As a quick preview, our main findings
are robust to these potential concerns.
“Old” Institutional Investors: We check the first concern about the incoming of new institutional
investors by examining the effect of institutional investors that registered and participated before
May 19, 2008. More specifically, we focus on a subsample that contains all listings with these “old”
institutional lenders as well as those without any institutional investment. In this subsample, there
are altogether 25 institutional investors and 93,718 loan requests. We estimate the treatment effect
on both retail investor behaviors and transaction outcomes as in Equation 1 and 2. Estimation
results are reported in Table 9 and 10. We do not find significantly different effects compared to
those from our main sample. This result is sensible since the new set of institutional investors are
not totally different from those registered earlier.
Usury Law: As a robustness check to the second concern about the change in usury law restric-
tions, we construct another subsample that contains all loan requests originated in states without
interest rate cap restrictions before April 15, 2008. Prosper provided detailed usury law restrictions
11 We are able to calculate the ROI for 9,292 out of 9,722 personal loans. The rest are discarded due to dataincompleteness or absence.

Lin et al.: Institutional Investors in Online Crowdfunding 25
Table 9 Robustness I - Effects on the Retail Investor Behaviors with “Old” Institutional Investors
OLS Estimates
# RIt # RI bidst Total funds by RItDep. var.: (1) (2) (3)
1 (With II)t−1 · 1 (Labeling II) -3.137∗∗∗ -2.704∗∗ -0.118(1.126) (1.234) (0.101)
Covariatesa Yes Yes YesListing FE Yes Yes YesDay of Listing FE Yes Yes YesWeekday FE Yes Yes Yes
Adj. R2 0.271 0.252 0.224Num. Obs. 164,454 164,454 164,454
***p < 0.01, **p < 0.05, *p < 0.1
a Covariates are as in Table 7.
Table 10 Robustness I - Effects on Transaction Outcomes with “Old” Institutional Investors
OLS estimatesa
Dep. var.: 1(Funded) APR 1(Defaulted) ROI
1 (Labeling II)× 1 (With II) -0.032∗∗∗ -1.766∗∗∗ -0.007 -0.004(0.010) (0.327) (0.026) (0.039)
1 (Labeling II) 0.004∗∗ 2.084∗∗∗ -0.012 0.063(0.002) (0.148) (0.012) (0.018)
1 (With II) 0.419∗∗∗ 0.395∗ -0.029 0.029(0.008) (0.236) (0.019) (0.028)
Loan characteristics Yes Yes Yes YesBorrower’s credit profile Yes Yes Yes YesCredit grade FE Yes Yes Yes YesState and Week FE Yes Yes Yes Yes
Adjusted R2 0.186 0.592 0.099 0.042Num. Obs. 93,718 8,147 8,147 7,786
***p < 0.01, **p < 0.05, *p < 0.1
a This table presents the effect estimates on loan-level transaction outcomes fora subsample of loan requests. In this subsample, we only include the listingswith institutional investors who had registered prior to May 19, 2008 and listingswithout institutional investment.
for all states on their website.12 There are altogether 12 states always setting the highest interest
rate caps at 36%. This leads to a subsample of 31,433 loan requests from our main sample. We use
this subsample to estimate the treatment effects as above. Results are reported in Table 11 and
12. Again, we do not find significant different treatment effects of labeling institutional investors
on retail investor behaviors or transaction outcomes.
12 Prosper’s webpage listing the usury law restrictions, particularly interest rate caps for all US states, is parsed byArchive.org. An example can be found at https://web.archive.org/web/20070315112811/http://www.prosper.
com/public/legal/states_and_licenses.aspx.

Lin et al.: Institutional Investors in Online Crowdfunding 26
Table 11 Robustness II - Effects on the Retail Investor Behaviors in States without Usury Law Restrictions
OLS Estimates
# RIt # RI bidst Total funds by RItDep. var.: (1) (2) (3)
1 (With II)t−1 · 1 (Labeling II) -10.511∗∗∗ -11.955∗∗∗ -1.127∗∗∗
(1.736) (1.914) (0.163)
Covariatesa Yes Yes YesListing FE Yes Yes YesDay of Listing FE Yes Yes YesWeekday FE Yes Yes Yes
Adj. R2 0.321 0.300 0.246Num. Obs. 128,523 128,523 128,523
***p < 0.01, **p < 0.05, *p < 0.1
a Covariates are as in Table 7.
Table 12 Robustness II - Effects on Transaction Outcomes for States without Usury Law Restrictions
OLS estimatesa
Dep. var.: 1(Funded) APR 1(Defaulted) ROI
1 (Labeling II)× 1 (With II) -0.157∗∗∗ -0.780∗ 0.031 0.401e-03(0.014) (0.434) (0.035) (0.055)
1 (Labeling II) -0.025∗∗∗ 1.304∗∗∗ -0.005 0.055∗
(0.004) (0.245) (0.020) (0.031)1 (With II) 0.407∗∗∗ 0.752∗∗ -0.045 0.041
(0.012) (0.347) (0.028) (0.044)
Loan characteristics Yes Yes Yes YesBorrower’s credit profile Yes Yes Yes YesCredit grade FE Yes Yes Yes YesState and Week FE Yes Yes Yes Yes
Adjusted R2 0.209 0.583 0.089 0.043Num. Obs. 31,433 3,626 3,626 3,476
***p < 0.01, **p < 0.05, *p < 0.1
a This table presents the treatment effect estimates on loan-level transaction out-comes for a subsample of loan requests. In this subsample, we only include the listingsin the states with no usual law restrictions. In these states, the interest rate cap isuniformly set at 36%.
Hourly Observations: Table 7 reports all the estimates of Equation (1) based on the segmentation
of the data by days. A valid concern is whether the choice of segmentation, or the definition of
a period, is too random to reveal the true effects of labeling institutional investors. For example,
retail investors may respond fairly quick to the participation of institutional investors. They will
not wait until the next day to offer larger amount of funds than they would have without seeing
institutional investment. Therefore the interactions or the dynamic processes happen in a shorter
period of time. We check this possibility by repeating all estimations in Table 7, but with hourly
segmentations. Specifically, the date or a period defined in Table 13 is one hour during the funding

Lin et al.: Institutional Investors in Online Crowdfunding 27
process of an open loan request. The directions of all effects are exactly the same as in Table 7,
and the magnitudes are also comparable (although smaller in absolute values due to the shorter
period of time). Again, results from our main specifications are fairly robust.
Table 13 Robustness III - Effects of Labeling Institutional Investors on the Retail Investor Behaviors (Hourly)
OLS Estimates
# RIt # RI bidst Total funds by RIta
Dep. var.: (1) (2) (3)
1 (With II)t−1 · 1 (Labeling II) -1.404∗∗∗ -1.546∗∗∗ -0.129∗∗∗
(0.191) (1.195) (0.016)
Listing FE Yes Yes YesDay of Listing FE Yes Yes YesWeekday FE Yes Yes Yes
Adj. R2 0.198 0.198 0.182Num. Obs. 772,410 772,410 772,410
***p < 0.01, **p < 0.05, *p < 0.1
a The total funds offered by retail investors at date t are evaluated at $1,000.
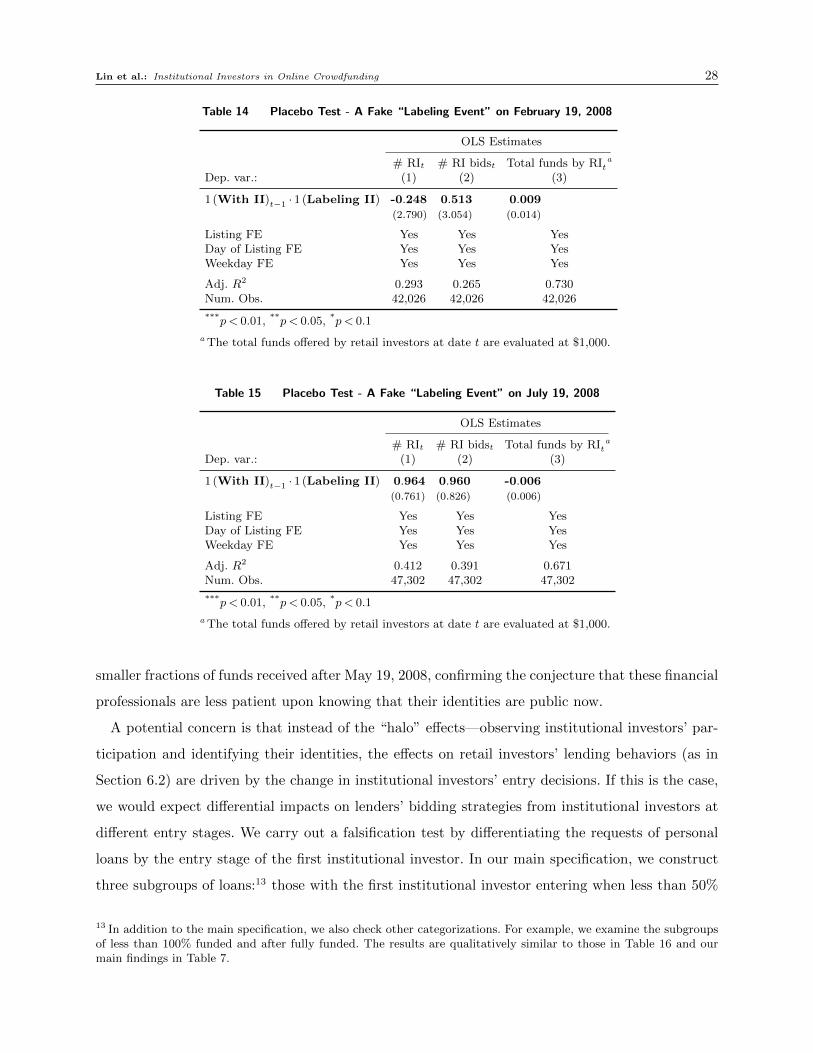
In addition, we carry out a placebo test to confirm that it is the labeling event driving our
findings of the crowding-out effects. Specifically, we construct new subsamples of transactions that
were not posted around the labeling event on May 19, 2008. The idea is that if the labeling event
did not cause the changes in retail investors’ entry decisions we have found, we would have observed
similar crowding-out effects by treating a random date, different from the labeling event on May
19, 2008, as if it were the date of the labeling event. More specifically, we choose February 19, 2008
and July 19, 2008 as if these were the dates of the labeling event, and repeat our main empirical
analysis as in Section 6.2 for the two dates separately. For each of the subsamples, we include
all transactions that were posted one month before and one month after the fake labeling event.
Estimates of β1 in Equation 1 are reported in Table 14 and 15 respectively. It is apparent that the
fake “labeling events” do not have any significant effects on retail investors investment behavior.
6.5. Entry Decisions by Institutional Investors
As predicted by our model in Section 3, institutional investors tend to enter earlier in a funding
process, given that they decide to participate, after the labeling event. As can be seen from the
analysis in Section 6.1, the median institutional investor, among all that participate, enters when
less funds received, less bids submitted, and higher prevailing interest rate offered. Figure 10
provides a more intuitive presentation of this observation, by depicting the distributions of loan
requests (with at least one institutional investor) in terms of the entry stage of the first institutional
investor, before and after the labeling event. Apparently, more institutional investors enter when
Lin et al.: Institutional Investors in Online Crowdfunding 28
Table 14 Placebo Test - A Fake “Labeling Event” on February 19, 2008
OLS Estimates
# RIt # RI bidst Total funds by RIta
Dep. var.: (1) (2) (3)
1 (With II)t−1 · 1 (Labeling II) -0.248 0.513 0.009(2.790) (3.054) (0.014)
Listing FE Yes Yes YesDay of Listing FE Yes Yes YesWeekday FE Yes Yes Yes
Adj. R2 0.293 0.265 0.730Num. Obs. 42,026 42,026 42,026
***p < 0.01, **p < 0.05, *p < 0.1
a The total funds offered by retail investors at date t are evaluated at $1,000.
Table 15 Placebo Test - A Fake “Labeling Event” on July 19, 2008
OLS Estimates
# RIt # RI bidst Total funds by RIta
Dep. var.: (1) (2) (3)
1 (With II)t−1 · 1 (Labeling II) 0.964 0.960 -0.006(0.761) (0.826) (0.006)
Listing FE Yes Yes YesDay of Listing FE Yes Yes YesWeekday FE Yes Yes Yes
Adj. R2 0.412 0.391 0.671Num. Obs. 47,302 47,302 47,302
***p < 0.01, **p < 0.05, *p < 0.1
a The total funds offered by retail investors at date t are evaluated at $1,000.
smaller fractions of funds received after May 19, 2008, confirming the conjecture that these financial
professionals are less patient upon knowing that their identities are public now.
A potential concern is that instead of the “halo” effects—observing institutional investors’ par-
ticipation and identifying their identities, the effects on retail investors’ lending behaviors (as in
Section 6.2) are driven by the change in institutional investors’ entry decisions. If this is the case,
we would expect differential impacts on lenders’ bidding strategies from institutional investors at
different entry stages. We carry out a falsification test by differentiating the requests of personal
loans by the entry stage of the first institutional investor. In our main specification, we construct
three subgroups of loans:13 those with the first institutional investor entering when less than 50%
13 In addition to the main specification, we also check other categorizations. For example, we examine the subgroupsof less than 100% funded and after fully funded. The results are qualitatively similar to those in Table 16 and ourmain findings in Table 7.

Lin et al.: Institutional Investors in Online Crowdfunding 29
0.00
0.01
0.02
0.03
0 25 50 75 100Funded Ratio before the 1st Institutional Investment
Den
sity
Labeling institutional investors: Before After
Figure 10 Distributions of Loans by the Entry Stage of the First Institutional Investor
before and after May 19, 2008
of funds satisfied, those with less than 100% but more than 50% funded, and those after the loan
receives full funding.14
The estimation results are reported in Table 16. Each column represents the impacts on the
corresponding dependent variable, and a row stands for a specific subgroup. Therefore, every cell
in the table is the estimate of the coefficient β1 in Equation 1 from one regression. We can tell
that the effects of labeling institutional investors are universally negative for all outcome variables
and across all subgroups. We do not observe strong evidence that the impacts of the labeling event
are different for loans where institutional investors enter at different stages. Although institutional
investors adjust their entry decisions after the labeling event, their impacts on retail investors are
not likely driven by this adjustment.
6.6. “Big” Retail Investors
Compared to retail investors, we observe that institutional investors invest significantly larger
amount of dollars in more diverse personal loans on Prosper.com (Section 5). Although much
smaller in volume on average, there exist some retail investors comparable to the institutional
counterparts in terms of investment volume. For instance, we find that at least 800 retail investors
are similar in investment volume to institutional investors in 2007. A potential explanation of
the effects we observe so far is that retail investors are following large investment instead of the
identities of the investors. Therefore, even if the identities of institutional investors are not known,
their large commitment can still crowd out the smaller investors.
14 Recall that in Prosper auctions, potential lenders, be it institutional or retail, can still participate in the competingprocess even after the borrower receives full funding, as long as the funding process has not expired. In order to winthe auction, lenders just need to choose a more competitive (lower) interest rate.

Lin et al.: Institutional Investors in Online Crowdfunding 30
Table 16 Effects of Labeling Institutional Investors on the Retail Investor Behaviors
by the Entry Stage of the First Institutional Investor
OLS estimates ofthe coef. for 1 (With II)t−1 · 1 (Labeling II)
# RIt # RI bidst Total funds by RItDep. var.: (1) (2) (3)
First II entry stage: % needed up to t− 1
> 50% -6.608∗∗∗ -7.520∗∗∗ -0.673∗∗∗
(0.909) (0.991) (0.082)
(0%,50%] -4.923∗∗∗ -5.573∗∗∗ -0.539∗∗∗
(0.946) (1.031) (0.085)
< 0% (fully funded) -3.763∗∗ -5.057∗∗ -0.641∗∗∗
(1.870) (2.056) (0.174)
Covariatesa Yes Yes YesListing FE Yes Yes YesDay of Listing FE Yes Yes YesWeekday FE Yes Yes Yes
***p < 0.01, **p < 0.05, *p < 0.1
a Covariates are as in Table 7.
We conduct a placebo test to make sure that our results are free from such concerns. Specifically,
we first look for the “matched” retail investors (to institutional investors). We match the investors
by the total amount of dollars invested, the number of loans invested, and the average amount
of dollars invested in funded loans up to 2007. As a result, we find about 800 retail investors
comparable to the institutional investors in our main sample. We repeat our main analysis as in
Section 6.2, the only difference being that we replace the institutional investors with those “big”
retail investors. More specifically, we include the loans with the “big” retail investors and those
without institutional investors or the “big” retail investors.
The results of estimating Equation 1 are reported in Table 17. Interestingly, the investment
by those “big” retail investors has no significant impacts on the bidding strategies of other retail
investors. The estimates in the first row indicate that after labeling institutional investors, the
changes upon observing a “big” retail investor’s entry are not significantly different from the
changes before the labeling event. Therefore, small retail investors are crowded out by the entry of
institutional investors because of their identities, not the large commitment they submit.
7. Conclusions
Although institutional investors themselves are well studied in traditional financial markets, there
is surprisingly little research on the interactions between them and retail investors. An important
reason is the lack of individual-level investors’ transaction data in traditional financial markets.
The nascent online consumer loan market, the debt-based crowdfunding or P2P lending market,

Lin et al.: Institutional Investors in Online Crowdfunding 31
Table 17 Effects of the “Big” Retail Investors on Other Retail Investors
OLS Estimates
# RIt # RI bidst Total funds by RItDep. var.: (1) (2) (3)
1 (With big RI)t−1 · 1 (Labeling II) 0.834 0.969 0.077(0.854) (0.930) (0.077)
1 (With big RI)t−1 0.714∗ 0.698 0.036(0.429) (0.468) (0.039)
Cum. fundst−1 6.241∗∗∗ 6.920∗∗∗ 0.348∗∗∗
(0.068) (0.074) (0.006)Percent neededt−1 0.002 -0.016∗∗∗ -0.287e-03
(0.004) (1.004) (0.376e-03)Min. ratet−1 -0.043 -0.115∗∗ -0.115∗∗∗
(0.043) (0.047) (0.004)# bidst−1 -0.464∗∗∗ -0.505∗∗∗ -0.024∗∗∗
(0.005) (1.006) (0.488e-03)Cum. fundst−1 ·Percent neededt−1 0.036∗∗∗ 0.034∗∗∗ 0.003∗∗∗
(0.001) (1.001) (0.878e-04)
Listing FE Yes Yes YesDay of Listing FE Yes Yes YesWeekday FE Yes Yes Yes
Adj. R2 0.278 0.258 0.218Num. Obs. 179,630 179,630 179,630
***p < 0.01, **p < 0.05, *p < 0.1
provides us a unique opportunity to study the interactions. In particular, it provides a unique set-
ting where all other investors are identified in real time. We exploit Prosper’s “natural experiment”
with the identity of institutional investors to study if and how institutional investors influence the
investment decisions of retail investors.
Although we do not find evidence that institutional investors adjust their choice of investment,
or their portfolios generate different rates of returns, we are able to document that publicizing
institutional investors’ identities have significant effects on retail investors’ lending strategies and
subsequently loan-level transaction outcomes. Most important, we find that retail investors are
crowded out by the participation of institutional investors in the first place; and once participating,
their activeness in terms of bidding amount is also significantly lower. The findings are robust
to several concerns, in particular, we find that the crowding-out effects are unlikely driven by
institutional investors adjusting their entry stages after the labeling event. In addition, it is the
“halo effect” from institutional investors’ identities instead of their large investment amount driving
the results.
Our paper is among the first to systematically investigate the interactions between institutional
and retail investors in the context of debt-based crowdfunding. The behavior of market participants
is fundamental to transaction outcomes and market efficiency. Institutional and retail investors are
widely existing in all types of financial markets. Thus our results have both policy and managerial
implications for other types of financial markets as well, particularly other types of crowdfunding.

Lin et al.: Institutional Investors in Online Crowdfunding 32
Especially with the burgeoning of debt-based and reward-based crowdfunding and the upcoming
equity-based crowdfunding in the US, this paper has important implications for market makers as
well as policy makers.

Lin et al.: Institutional Investors in Online Crowdfunding 33
References
Agrawal, A., C. Catalini, and A. Goldfarb. 2013. The Simple Economics of Crowdfunding. Innovation Policy
and the Economy Volume 14. University of Chicago Press.
Banerjee, A. V.. 1992. A Simple Model of Herd Behavior. Quarterly Journal of Economics 75(4): 797–817.
Barber, B. M., and T. Odean. 2008. All That Glitters: The Effect of Attention and News on the Buying
Behavior of Individual and Institutional Investors. Review of Financial Studies 21(2): 785–818.
Barber, B. M., and T. Odean. 2011. The Behavior of Individual Investors, Handbook of the Economics of
Finance 2: 1533–1570.
Basak, S. and A. Pavlova. 2013. Asset Prices and Institutional Investors. American Economic Review 103(5):
1728–1758.
Bikhchandani, S., D. Hirshleifer, and I. Welch. 1992. A Theory of Fads, Fashion, Custom, and Cultural
Change as Informational Cascades. Journal of Political Economy 100(5): 992–1026.
Burtch, G., A. Ghose, and S. Wattal. 2013. An Empirical Examination of the Antecedents and Consequences
of Contribution Patterns in Crowd-Funded Markets. Information Systems Research 24(3): 499–519.
Burtch, G., A. Ghose, and S. Wattal. 2015. The Hidden Cost of Accommodating Crowdfunder Privacy
Preferences: A Randomized Field Experiment. Management Science 61(5): 949–962.
Carlin, B. I. and G. Manso. 2011. Obfuscation, Learning, and the Evolution of Investor Sophistication.
Review of Financial Studies 24(3): 754–785.
Chamley, C. 2004. Delays and Equilibria with Large and Small Information in Social Learning. European
Economic Review 48(3): 477–501.
Feng, L., and M. S. Seasholes. 2008. Individual Investors and Gender Similarities in an Emerging Stock
Market. Pacific-Basin Finance Journal 16(2008): 44–60.
French, K. R., and J. M. Poterba. 1991. Investor Diversification and International Equity Markets American
Economic Review 81(2): 222–226.
Gale, D. 1996. What Have We Learned from Social Learning? European Economic Review 40(3): 617–628.
Gompers, P. A. and A. Metrick. 2001. Institutional Investors and Equity Prices. Quarterly Journal of Eco-
nomics 116(1): 229–259.
Gruber, M. J. 1996. Another Puzzle: The Growth in Actively Managed Mutual Funds. Journal of Finance
51(3): 783–810.
Gul, F. and R. Lundholm. 1995. Endogenous Timing and the Clustering of Agents’ Decisions. Journal of
Political Economy 103(5): 1039–1066.
Iyer, R., A. Khwaja, E. Luttmer, and K. Shue. 2016. Screening Peers Softly: Inferring the Quality of Small
Borrowers. Management Science 62(6): 1554–1577.

Lin et al.: Institutional Investors in Online Crowdfunding 34
Kawai, K., K. Onishi, and K. Uetake. 2014. Signaling in Online Credit Markets. Working Paper.
Lakonishok, J. and E. Maberly. 1990. The Weekend Effect: Trading Patterns of Individual and Institutional
Investors. Journal of Finance 45(1): 231–243.
Lin, M., N. R. Prabhala, and S. Viswanathan. 2013. Judging Borrowers by the Company They Keep: Friend-
ship Networks and Information Asymmetry in Online Peer-to-Peer Lending. Management Science
59(1): 17–35.
Lin, M. and S. Viswanathan. 2016. Home Bias in Online Investments: An Empirical Study of an Online
Crowdfunding Market. Management Science. 62(5): 1393–1414.
Nofsinger, J. R. and R. W. Sias. 1999. Herding and Feedback Trading by Institutional and Individual
Investors. Journal of Finance 54(6): 2263–2295.
Puckett, A. and X. Yan. 2011. The Interim Trading Skills of Institutional Investors. Journal of Finance
66(2): 601–633.
Rigbi, O. 2013. The Effects of Usury Laws: Evidence from the Online Loan Market. Review of Economics
and Statistics 95(4): 1238–1248.
Scharfstein, D. S. and J. C. Stein. 1990. Herd Behavior and Investment. American Economic Review 80(3):
465–479.
Sias, R. W. 2004. Institutional Herding. Review of Financial Studies 64(4): 1517–1548.
Shleifer, A. and L. H. Summers. 1990. The Noise Trader Approach to Finance. Journal of Economic Per-
spectives 4(2): 19–33.
Stiglitz, J. E., and A. Weiss. 1981. Credit Rationing in Markets with Imperfect Information. American
Economic Review 71(3): 393–410.
Stein, J. C. 2009. Sophisticated Investors and Market Efficiency. Journal of Finance 17(1): 165–206.
The Economist. 2013. Crowdfunding in America - End of the Peer Show. The Economist June 1, 2013.
Wei, Z., and M. Lin. 2016. Market Mechanisms in Online Peer-to-Peer Lending. Management Science. Forth-
coming.
Welch, I. 1992. Sequential Sales, Learning, and Cascades. Journal of Finance 47(2): 695–732.
Yan, X., and Z. Zhang. 2009. Institutional Investors and Equity Returns: Are Short-Term Institutions Better
Informed? Review of financial Studies 22(2): 893–924.
Zhang, J. 1997. Strategic Delay and the Onset of Investment Cascades. RAND Journal of Economics 28(1):
188–205.
Zhang, J., and P. Liu. 2012. Rational Herding in Microloan Markets. Management Science 58(5): 892–912.
Zheng, L. 1999. Is Money Smart? A Study of Mutual Fund Investors’ Fund Selection Ability. Journal of
Finance 54(3): 901–933.

Lin et al.: Institutional Investors in Online Crowdfunding 35
Appendix A: List of Control Variables
In this appendix, we list the control variables in our estimations of Equations 2.
Listing characteristics:
1. Borrower’s requested amount of dollars
2. Borrower’s asking interest rate (not controlled for if the dependent variable is the APR)
3. The loan term in months
4. Whether the loan is endorsed by a lender group
5. Whether the borrower provides descriptions
6. Whether the borrower provides photos
Verified credit information:
1. The status of homeownership
2. Debt to income ratio (DTI)
3. Whether the DTI is top coded at 1,000%
4. An interaction between DTI and homeownership
5. Amount delinquent
6. Bankcard utilization (%)
7. Current credit lines
8. Current delinquencies
9. Delinquencies in last 7 yeas
10. Inquiries in last 6 months
11. Monthly income
12. Public records last year
13. Public records in last 10 years
14. Revolving credit balance
15. Total credit lines
Other information:
1. Dummies for loan categories, such as debt consolidation, home improvement, and small business
2. Borrower’s state dummies
3. Dummies for the week of posting date
4. Dummies for credit grades (including seven grades: “AA,” “A,” “B,” “C,” “D,” “E,” and “HR.”)