institutional barriers to small- and medium-sized enterprise operations in transition countries
TRANSCRIPT

Institutional Barriers to
Small- and Medium-Sized
Enterprise Operations in
Transition Countries Ruta Aidis
ABSTRACT. Building on institutional theory and onexisting literature regarding barriers to private businessesin transition countries, this paper examines the inter-related effect of nineteen factors grouped into four typesof barriers (formal, informal, environmental and skills) onexisting small- and medium-sized enterprise operations inLithuania. Regression analyses on a sample of 332 busi-ness owners indicate that perceived formal barriers areassociated with perceived informal barriers such as cor-ruption and perceived environmental barriers are associ-ated with perceived skill barriers such as managementproblems. The transition effect based on business start-update was not found to play a significant role.
KEY WORDS: transition, economics, SMES.
JEL SUBJECT CLASSIFICATION: M13, P20, P30, P39.
1. Introduction
Small- and medium-sized enterprise (SME) devel-opment is seen as a key to economic growth,innovations and market competition in mostadvanced western economies (Acs and Audretsch,1990). In countries undergoing economic transi-tion, the role of SMEs is of no lesser importance.Not only are SMEs important for the role theyplay in sustaining the ideology of the freemarket, SME’s are also a crucial source of
innovative potential and job creation possibilities(Johnson and Loveman, 1995). Many transitioncountries today continue to wrestle with persis-tently high unemployment rates even after beingon the ‘transition’ path for over a decade. Astrong SME sector could provide further employ-ment opportunities and contribute to economicgrowth as well as the development of a competi-tive market system.
In general, and taking into account that thereis considerable variation between countries, thecharacteristics of private businesses in transitioncountries are not necessarily different than inmature market economies; yet they are uniquebecause they tend to take on extreme proportions(Smallbone and Welter, 2001). In many cases,private businesses in transition countries mustcontend with governmental interference, corrup-tion and environmental changes on a much largerscale than in advanced western economies.
Previous studies of private businesses in transi-tion countries have identified a multitude of bar-riers affecting business operations. The mostimportant barriers seem to be formal barrierssuch as the high level of taxes (Bohata and Mla-dek, 1999; Hashi, 2001; Bartlett and Bukvic,2001) and the general regulatory environment(Brunetti et al., 1998; Hashi 2001). Informal bar-riers such as the implementation of regulations(Jancauskas, 2000; Bartlett and Bukvic, 2001),corruption (Bohata and Mladek, 1999) andunfair competition from the large informal econ-omy (Muent et al., 2001). Environmental barrierssuch as lack of financing (Pissarides et al., 2000;Hashi, 2001; Bartlett and Bukvic, 2001) and lowpurchasing power (Jancauskas, 2000) furtherinterfere with SME development. Lack of quali-
Small Business Economics (2005) 25: 305–318 � Springer 2005
DOI 10.1007/s11187-003-6463-7
Final version accepted on December 12, 2003
Contact address: R. Aidis, SSEES/UCL, Senate House,Malet Street, London WC1E 7HU UKSchool of Slavonic and East European StudiesUniversity College LondonUKE-mail: [email protected]
fied workers (Bohata and Mladek, 1999) and latepayment by clients (Bartlett and Bukvic, 2001)form additional environmental barriers. Skillbased barriers such as the lack of business-relatedskill development stem from the lack of previousprivate business experience in transition countries(Roberts and Tholen, 1998). Though privatebusiness owners may not be aware of their skillshortcomings, lack of adequate business skillscan impede with the survival and growth ofprivate businesses in transition countries.
A number of studies currently exist on SMEsand business barriers in transition countries how-ever, none of the available studies explore theinter-related effect that may exist between differ-ent types of business barriers. In order to explorethis issue, we use institutional theory and focuson the subjective perceptions of existing SMEowners. Empirical research conducted in Swedenhas indicated that subjective opinions or ‘reality-as-perceived’ by the business owner has an influ-ence on both growth motivation and directbehavior (Davidsson, 1991). Furthermore, theo-retical support for the effect of perceptions onactual behavior is an integral part of institutionaltheory. As North writes: Individual perceptionsabout the fairness and justice of the rules of thegame obviously affect performance… (1997:3). Inthis sense, subjective opinions (i.e., ideologicalattitudes) are valuable not only because they pro-vide insights, but because they have an effect oneconomic performance. Descriptive statistics andregression analyses are used to address thecentral question:
Are the perceived barriers to business operations thatexisting SME owners face inter-related?
Though business barriers can be examined in iso-lation of one another, exploring their interrelated-ness can provide a deeper level of understandingwith regards to the interactions between businessbarriers. For example, if formal barriers are inter-related with informal barriers then a change toformal barriers may imply effects to informal bar-riers and vice versa. By studying this relationship,it may be possible to improve the predictions ofthe broader, inter-related effects that changes tocertain types of business barriers may bringabout.
In this paper, we provide two contributions tothe existing research: First, utilizing institutionaltheory, we develop a model for conceptualizingthe effect of business barriers on existing SMEoperations in transition countries. Second, weempirically test the inter-related effect of per-ceived business barriers on existing SME opera-tions.
The results of our analysis indicate that thereis significant perceived inter-relatedness betweenbusiness barriers especially between formal andinformal barriers on the one hand, and environ-mental and skill barriers on the other.
Lithuania provides an excellent case study of atransition country that has chosen to rapidlyswitch from a centrally planned economy to amarket-based economy. As in other formerSoviet Union countries, no forms of legal privatebusiness ownership were previously allowed inSoviet Lithuania until the mid 1980s. In the late1980s limited forms of cooperative style enter-prises were permitted. A year after regainingindependence in 1991, Lithuania embarked on anambitious stabilization and reform program sup-ported by the International Monetary Fund andthe World Bank which allowed for all forms ofprivate enterprises. The Lithuanian case depictssome of the institutional conflicts that canemerge during the process of transition as aresult of the clash between new and old laws,values and practices.
This paper is structured as follows: a presenta-tion of the conceptual model and three hypothe-ses to be tested are developed in section two.Section three describes the data used and samplecharacteristics. Section four presents the method-ology used and section five presents the results.A discussion of the results is given in section sixand conclusions are presented in section seven.
2. The model
Institutional theory has been used by a numberof authors to explain the stalled or even stag-nated economic development occurring in transi-tion countries (North, 1997; Feige, 1997;Dallago, 1997; Yeager, 1999). We propose amodel to conceptualize the four main influenceson existing SME operations in transition coun-tries as shown in Figure 1. In our model, the
306 Ruta Aidis

role of the state exerts its influence both interms of formal and informal rules. The distinc-tions made between formal and informal rulesare based on Institutional theory as introducedby North (1990). Our model shows that formalrules such as tax policies and business legislationare associated with the role of the state. Thoughinformal rules can be attributed to a muchbroader range of issues, we limit informal rulesto those practices associated with the role of thestate. These include both the unofficial accept-able governmental culture such as various formsof corruption as well as issues related to thefailure of formal rule enforcement. Corruption-related factors include the ‘implementation ofbusiness regulations’ and the ‘number of taxinspections’ since these represent ‘official means’for obtaining bribes. Issues related to lack offormal rule enforcement results in informal bar-riers such as ‘late payment by clients’ and‘Mafia and racketeering’ activities.
We further extend North’s institutionalapproach to include environmental and skill fac-tors which are both important in the transitioncontext. Environmental barriers capture the over-whelming impact of transition that has funda-mentally changed the entire ‘playing field’ forbusiness activities and includes factors such as‘low purchasing power’ and ‘lack of information’.In addition, the transition process has broughtgreat demands on the individual skills of SMEowners who generally have no private businessexperience and have limited access to formalbusiness training programs (as opposed to thecase in many western developed economies).
Though our model shows formal, informal,environmental and skill barriers to be distinctcategories, we would also expect that the effect ofcertain barrier groups to be inter-related. A studyby Djankov et al. (2002) based on 85 countriesindicated a link between highly regulated busi-ness environments (formal barriers) and corrup-tion (informal barriers). This leads us toformulate our first hypothesis:
H1: Perceptions of formal business barriers will beassociated with perceptions of informal business barri-ers especially corruption-related informal barriers.
We would also expect that informal barriers willbe associated with formal barriers. SME owners
who are not able to circumvent informal barrierssuch as corruption through their networks andcontacts, are likely to also be affected by formalbarriers such as tax level and business legislation.In essence, the more restricted the ability forSME owners to not comply with formal rules,the greater likelihood that formal rules will beperceived as barriers to business operations.
H2: Perceptions of informal business barriers will beassociated with perceptions of formal business barriers.
In transition countries, the ability to continueSME business operations under uncertain andoften hostile macroeconomic environment (Small-bone and Welter, 2001) is likely to place highdemands on a SME owner’s management capa-bilities as well as their ability to grow into newmarkets. We therefore would expect that the per-ception of skill barriers will also be associatedwith the perception of environmental barriersand this leads to our third hypothesis:
H3: SME owners perceptions of environmental busi-ness barriers will be associated with perceptions of skillbusiness barriers.
Significant interrelations between perceived busi-ness barriers can be affected by a number of fac-tors. We control for factors such as transitionstages, and the business and personal characteris-tics of the SME owners. In terms of transitionstages, in Lithuania, we control for two distincttransition periods: before 1994 and after 1994.The period 1990–1994 was characterized by tran-sition chaos and a general lack of a regulatoryframework and the period after 1994, was charac-terized by increasing macroeconomic stabilizationbut also over regulation.1 These environmentalchanges had a potentially significant effect onSME owners who started their businesses beforeor in 1994.2 In order to control for the potentialinfluence of the ‘transition effect’, we include thisvariable in all our models.3
Studies on SME owners in advanced westerncountries have demonstrated that there are signif-icant differences between male and female SMEowners.4 In transition countries studies haveshown that there are significant differencesbetween male and female business owners interms of business size (Hisrich and Fulop, 1994;
307Institutional barriers to small- and medium-sized enterprise operations
Zapalska 1997; Aidis, 2003), business turnoverand lack of management skills (Hisrich andFulop, 1994). In order to control for the influ-ence of sex on perceived business barriers, weinclude this variable in all our regression models.
Human capital variables were included con-trolling for owner’s education level, previousbusiness-related experience, previous managementexperience and owner’s age which have beenshown to affect business performance (Becker,1975; Honig, 1998). As in Hashi (2001), we alsocontrol for business sector.
Transition related control variables includedwere under-reporting of earnings, facility owner-ship, home-based businesses and business loca-tion. A study by Johnson et al. (2000) has foundthat hiding output amongst businesses in Poland,Slovakia and Romania is significantly associatedwith high bureaucratic corruption. In our model,we include a variable measuring under-reportingof business earnings.5 Dummy variables for busi-ness facility ownership6 and home-based busi-nesses were further included since they both serveas indicators for ownership of business premises.7
Location in terms of rural or urban business set-ting was not found to be significant for businessgrowth aspirations in Norway (Kolvereid, 1992),but it may be important for the effect of businessbarriers. In Lithuania as in other transition coun-tries, a large gap exists between economic devel-opment in urban centers and in smaller cities orrural areas.
3. Data set and sample characteristics
Our analysis is based on survey data collected bythe author in Lithuania8 (Aidis, 2003). Approxi-mately three–fourths of the SME respondentswere male. The vast majority of the SME respon-dents were highly educated, which is also a char-acteristic observed in other transition economies(Smallbone and Welter, 2001) but is significantlyhigher than was found by a study of businessowners conducted by the Lithuanian Departmentof Statistics (LDS) (Jancauskas, 2000). However,survey method may have influenced these differ-ences in outcome.9 Our sample is based on a mailsurvey which may have resulted in a higher pro-portion of more highly educated respondents.10
Our survey asked the respondents to identifythe main ‘perceived’ barriers that they encounterin their business operations from a list of nine-teen variables. The respondents were given sixoptions according to a Likert scale (Babbie,1998). The responses given by SME owners arebased on their subjective viewpoints with regardsto the barriers they encounter in their day-to-daybusiness operations.
4. Methodology and identification of dependent
variable groups
In order to analyze the relationship between bar-rier groups and other independent variables, weused Ward’s grouping method for hierarchicalclustering,11 logit and multinomial logit models.Hierarchical cluster analysis is a procedure usedto identify relatively homogenous groups of indi-vidual cases based on selected characteristics,using an algorithm that starts with each case in aseparate cluster and combines clusters until onlyone case is left12 (see Appendix I for furtherdescription). The four new variables formedusing Ward’s grouping method for hierarchicalclustering shown in Table I, distinguish betweenSME owners affected by formal, informal, envi-ronmental and skills barriers groups.
The formal and skill barrier categories provideclear and distinct categories for SME owners per-ceived to be affected by these categories. How-ever for informal and environmental categories,three non-categorical groups were created,respectively. Informal barriers group 1 representsthe individuals most affected by corruption at alllevels. Informal barriers group 2 represents indi-viduals affected by weak bargaining position.Similarly, environmental barriers group 1 repre-sents individuals affected by all the environmen-tal barriers (excluding lack of information) whileenvironmental barriers group 2 represents thoseindividuals specifically affected by low purchasingpower. The four barrier groups formed (Table I)are used as the dependent variables in our regres-sion analysis.
Logit regression models were used to test theprobability of SME owners perceiving themselvesto be affected by formal and skill barriers.13
Multinomial logit models14 were used to test theprobability of an SME owner perceiving them-
308 Ruta Aidis

selves to be affected by informal and environ-mental barriers.
To test our hypotheses, barrier variables rep-resenting the nineteen individual possible barri-ers were used as explanatory variables. Wecontrol for human capital (business owner’seducation, previous business experience, previousmanagement experience and business owner’sage) and business characteristics (business sector,business facility ownership, home-based busi-
nesses, beginning the business from scratch,business location and under-reporting of busi-ness earnings) further described in Appendix II.Special emphasis was placed on the possibleinfluence of the transition effect as measured bybusiness start-up date and business owner sex.These two control variables were included in allour model’s results. Other variables wereincluded in our final models only if they con-tributed significantly to our model.
TABLE I
Ward’s grouping method for hierarchical clustering of barrier types
Formal Barriers
(n ¼ 277)
Group 1:
Formal barriers
(n ¼ 114)
Group 2:
No pattern to
responses
(n ¼ 163)
Taxes too high X –
Frequent changes to tax policies X –
Ambiguity of tax policies X –
Business Legislation X –
Informal Barriers
(n ¼ 253)
Group 1:
Corruption at all
levels
(n ¼ 37)
Group 2:
Weak bargaining
position
(n ¼ 79)
Group 3:
No pattern to
responses
(n ¼ 137)
Implementation of Business Regulations – – –
Too many tax inspections X – –
National governmental corruption X X –
Regional governmental corruption X – –
Time spent negotiating with local officials
and inspectors
X X –
Late payment by clients – X –
Tax inspector corruption X X –
Mafia, racketeering – – –
Environmental barriers (n=277) Group 1:
Environmental
barriers
(n=49)
Group 2:
Low purchasing
power only
(n=120)
Group 3:
No pattern to
responses
(n=108)
Low purchasing power X X –
Lack of funds for business investment X – –
Competition from illegal businesses X – –
Lack of information – – –
Competition from legal businesses X – –
Skill barriers (n ¼ 293) Group 1:
Skill barriers
(n ¼ 100)
Group 2:
No pattern to
responses
(n = 193)
Inability to grow into new markets X –
Management problems X –
X: SME owners do not disagree that this variable is a barrier to their business.
309Institutional barriers to small- and medium-sized enterprise operations

5. Regression results
The interrelationship between barrier types toexisting SME operations is analyzed using regres-sion models. Whether an SME owner perceivesan identified factor as a barrier (as shown inTable 1) affecting their business operations iscontrolled for in each model by the same set ofindependent variables. The model shown includesthe effects of significant individual barrier vari-ables and control variables.15 In addition, theeffect of SME owner sex and the transition effectare included in all the models shown.
The interpretation of the logit model regres-sion results is straightforward though interpretingthe effect of the independent variable may becomplicated in a multinomial logit model. There-fore we include the relative risk ratio (RRR)which indicate the ratio of relative risk for a one-unit change of the explanatory variable relativeto the base category. In our case, the relative riskratios indicate the relative contribution of thevariables to the explanatory power of the model.
5.1. Formal barriers model
As Table II shows, two groups of SME ownerscan be distinguished: those perceived to beaffected by formal barriers and those who per-ceive not be affected by formal barriers. Theprobability of perceiving to be affected by formalbarriers is significantly related to the probabilityof perceiving to be affected by informal barrierssuch as the implementation of business regula-tions, too many tax inspections, and nationalgovernmental corruption. Individuals who per-ceived that ‘lack of information’ presents an envi-ronmental barrier had a higher probability ofperceiving to be affected by formal barriers thanthe sample as a whole.
Our control variables indicate that SME own-ers who rent their business facilities and thosewhose businesses are located in smaller cities orrural areas were found to be significantly moreaffected by formal barriers than businesseslocated in urban areas16 or SME owners whoown their business facilities. Both sex of theSME owner and the transition effect were notsignificant to our model.
These results provide support for our firsthypothesis that perceived formal barriers willbe associated with informal barriers such ascorruption. National governmental corruptionand implementation of business regulations areboth informal barriers that are highly signifi-cant in our model and are both corruption-related.
5.2. Informal barriers model
As Table III shows, three groups of SME ownerscan be distinguished: those perceived to beaffected by corruption at all levels (group 1),those individuals who perceive to be affected bya weak bargaining position17 (group 2) and thoseindividuals who show no clear pattern to theirresponses (group 3). In comparison with the basecategory (group 3), the probability of individualsperceiving to be affected by corruption at all lev-els (group 1) was strongly associated with formalbarriers such as ‘taxes too high’; and environ-mental barriers such as ‘competition from illegalbusinesses’. SME owners who perceive illegalcompetition as a barrier are four times morelikely to be affected by corruption. In addition,
TABLE II
Logit regression model – formal barriers
Dependent variable
Y1 ¼ Affected by all formal barriers – response variable0 ¼ no clear pattern to responses
�
Variables Coefficient SE
Constant )2.24*** 0.53
(I) Implementation of business regulations 0.97*** 0.30
(I) Too many tax inspections 0.61* 0.33
(I) Natl govt corruption 0.84** 0.38
(E) Lack of information 0.60** 0.29
Own facilities )0.70** 0.30
Rural location 0.70** 0.30
Transition effect -Bf 1994 0.08 0.38
Sex 0.16 0.33
SE: Robust standard errors.
(F): formal barrier; (I): informal barrier; (E): environmental
barrier; (S): skill barrier.
Probability values: ***: p-value significant at the 1% test
level, **: 5% test level, *: 10% test level.
Pseudo R2: 0.11.
Total number of observations: 277.
310 Ruta Aidis

SME owners perceiving to be affected by corrup-tion at all levels had a lower likelihood of per-ceiving to be affected by ‘lack of information’.Though this result was significant, it contributedrather weakly to our model.
The likelihood of perceiving to be affected bycorruption at all levels was also strongly associ-ated with the control variables for home-basedbusinesses and SME owners who under-reporttheir business earnings. SME owners with ahome-based business were six times as likely toperceive corruption at all levels (group 1) thanSME owners that did not have a home-based
business. Those SME owners that under-reporttheir business earnings were four times as likelyto perceive corruption at all levels as a businessbarrier than SME owners that did not under-report their earnings. Further, older SME ownersdisplayed a significantly higher probability ofperceiving to be affected by informal barriersthan younger SME owners.18 A lower rate ofannual turnover for 1999 was also significant butcontributed weakly to our overall model.
Similar to group 1 individuals, those individu-als affected by weak bargaining position (group 2)were significantly associated with the likelihood of
TABLE III
Multinomial logit regression – informal barriers
Variables Coefficient SE RRR SE RRR
Group 1: Most affected by corruption at all levels (response variable)
Constant )12.47** 5.16 – –
(F) Taxes too high 1.33* 0.68 3.77* 2.54
(E) Illegal competition 1.44*** 0.51 4.20*** 2.14
(E) Lack of information )1.34** 0.53 0.26** 0.14
Business experience )0.56 0.48 0.57 0.28
Age 0.55* 0.29 1.73* 0.51
Age squared )0.01** 0.00 0.99** 0.00
Home-based business 1.86*** 0.71 6.44*** 4.58
Under-report earnings 1.49*** 0.50 4.44*** 2.23
Business turnover )0.61*** 0.21 0.54*** 0.11
Sex 0.30 0.58 1.35 0.78
Transition effect – Bf 1994 )0.79 0.69 0.45 0.31
Group 2: Weak bargaining position (response variable)
Constant )4.70 3.44 – –
(F) Taxes too high 1.64** 0.69 5.19** 3.55
(E) Illegal competition 1.05*** 0.34 2.86*** 0.97
(E) Lack of information 0.12 0.34 1.13 0.38
Business experience )1.17*** 0.36 0.31*** 0.11
Age 0.13 0.15 1.14 0.18
Age squared )0.00 0.00 1.00 0.00
Home-based business 0.40 0.66 1.04 0.69
Under-report earnings 0.07 0.34 1.07 0.37
Business turnover )0.15 0.14 0.86 0.12
Sex 0.36 0.41 1.43 0.58
Transition effect – Bf 1994 0.41 0.54 1.50 0.82
SE: robust standard errors.
RRR: relative risk ratio.
SE RRR: robust standard errors for relative risk ratio.
(F): formal barrier; (I): informal barrier; (E): environmental barrier; (S): skill barrier.
Probability values: ***: p-value significant at the 1% test level, **: 5% test level, *: 10% test level.
Total number of observations: 239.
Dependent variable Y1 ¼ most affected by corruption2 ¼ affected by some corruption and late payment of clients3 ¼ no clear pattern to responses (base category)
8<:
311Institutional barriers to small- and medium-sized enterprise operations
perceiving to be affected by taxes and illegal com-petition. In terms of control variables, those SMEowners without previous business-related experi-ence were also more likely to perceive to beaffected by some corruption and late payment ofclients than the sample as a whole. SME ownersex or the transition effect were not found to besignificant in this model.
Our results provide some support for our sec-ond hypothesis that SME owners affected byinformal barriers will also be affected by formalbarriers since ‘high tax rate’, a formal barrier ishighly significant in our model.
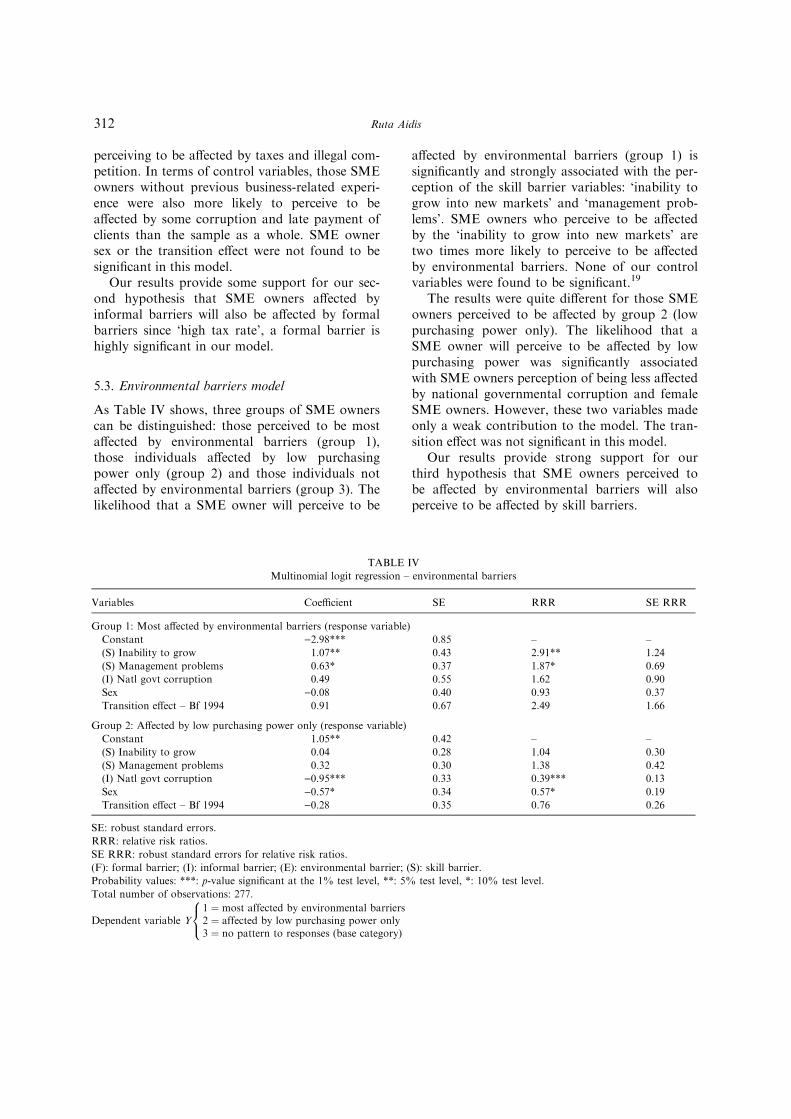
5.3. Environmental barriers model
As Table IV shows, three groups of SME ownerscan be distinguished: those perceived to be mostaffected by environmental barriers (group 1),those individuals affected by low purchasingpower only (group 2) and those individuals notaffected by environmental barriers (group 3). Thelikelihood that a SME owner will perceive to be
affected by environmental barriers (group 1) issignificantly and strongly associated with the per-ception of the skill barrier variables: ‘inability togrow into new markets’ and ‘management prob-lems’. SME owners who perceive to be affectedby the ‘inability to grow into new markets’ aretwo times more likely to perceive to be affectedby environmental barriers. None of our controlvariables were found to be significant.19
The results were quite different for those SMEowners perceived to be affected by group 2 (lowpurchasing power only). The likelihood that aSME owner will perceive to be affected by lowpurchasing power was significantly associatedwith SME owners perception of being less affectedby national governmental corruption and femaleSME owners. However, these two variables madeonly a weak contribution to the model. The tran-sition effect was not significant in this model.
Our results provide strong support for ourthird hypothesis that SME owners perceived tobe affected by environmental barriers will alsoperceive to be affected by skill barriers.
TABLE IV
Multinomial logit regression – environmental barriers
Variables Coefficient SE RRR SE RRR
Group 1: Most affected by environmental barriers (response variable)
Constant )2.98*** 0.85 – –
(S) Inability to grow 1.07** 0.43 2.91** 1.24
(S) Management problems 0.63* 0.37 1.87* 0.69
(I) Natl govt corruption 0.49 0.55 1.62 0.90
Sex )0.08 0.40 0.93 0.37
Transition effect – Bf 1994 0.91 0.67 2.49 1.66
Group 2: Affected by low purchasing power only (response variable)
Constant 1.05** 0.42 – –
(S) Inability to grow 0.04 0.28 1.04 0.30
(S) Management problems 0.32 0.30 1.38 0.42
(I) Natl govt corruption )0.95*** 0.33 0.39*** 0.13
Sex )0.57* 0.34 0.57* 0.19
Transition effect – Bf 1994 )0.28 0.35 0.76 0.26
SE: robust standard errors.
RRR: relative risk ratios.
SE RRR: robust standard errors for relative risk ratios.
(F): formal barrier; (I): informal barrier; (E): environmental barrier; (S): skill barrier.
Probability values: ***: p-value significant at the 1% test level, **: 5% test level, *: 10% test level.
Total number of observations: 277.
Dependent variable Y1 ¼ most affected by environmental barriers2 ¼ affected by low purchasing power only3 ¼ no pattern to responses (base category)
8<:
312 Ruta Aidis
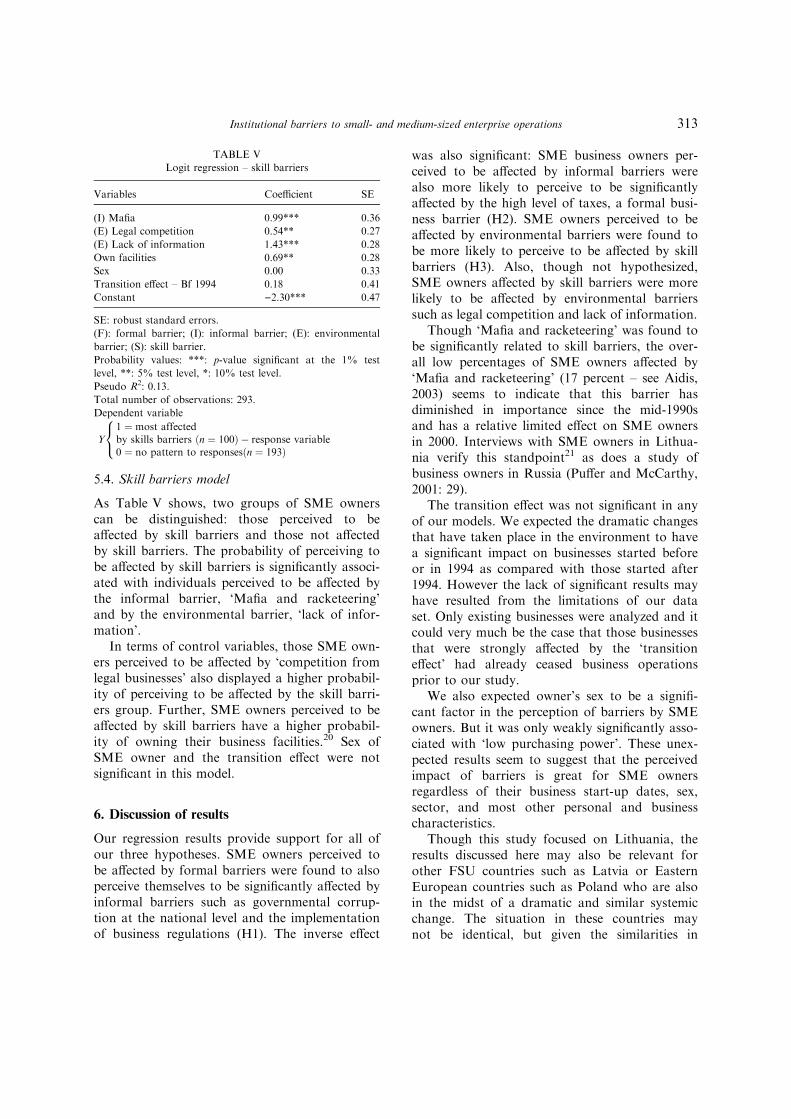
5.4. Skill barriers model
As Table V shows, two groups of SME ownerscan be distinguished: those perceived to beaffected by skill barriers and those not affectedby skill barriers. The probability of perceiving tobe affected by skill barriers is significantly associ-ated with individuals perceived to be affected bythe informal barrier, ‘Mafia and racketeering’and by the environmental barrier, ‘lack of infor-mation’.
In terms of control variables, those SME own-ers perceived to be affected by ‘competition fromlegal businesses’ also displayed a higher probabil-ity of perceiving to be affected by the skill barri-ers group. Further, SME owners perceived to beaffected by skill barriers have a higher probabil-ity of owning their business facilities.20 Sex ofSME owner and the transition effect were notsignificant in this model.
6. Discussion of results
Our regression results provide support for all ofour three hypotheses. SME owners perceived tobe affected by formal barriers were found to alsoperceive themselves to be significantly affected byinformal barriers such as governmental corrup-tion at the national level and the implementationof business regulations (H1). The inverse effect
was also significant: SME business owners per-ceived to be affected by informal barriers werealso more likely to perceive to be significantlyaffected by the high level of taxes, a formal busi-ness barrier (H2). SME owners perceived to beaffected by environmental barriers were found tobe more likely to perceive to be affected by skillbarriers (H3). Also, though not hypothesized,SME owners affected by skill barriers were morelikely to be affected by environmental barrierssuch as legal competition and lack of information.
Though ‘Mafia and racketeering’ was found tobe significantly related to skill barriers, the over-all low percentages of SME owners affected by‘Mafia and racketeering’ (17 percent – see Aidis,2003) seems to indicate that this barrier hasdiminished in importance since the mid-1990sand has a relative limited effect on SME ownersin 2000. Interviews with SME owners in Lithua-nia verify this standpoint21 as does a study ofbusiness owners in Russia (Puffer and McCarthy,2001: 29).
The transition effect was not significant in anyof our models. We expected the dramatic changesthat have taken place in the environment to havea significant impact on businesses started beforeor in 1994 as compared with those started after1994. However the lack of significant results mayhave resulted from the limitations of our dataset. Only existing businesses were analyzed and itcould very much be the case that those businessesthat were strongly affected by the ‘transitioneffect’ had already ceased business operationsprior to our study.
We also expected owner’s sex to be a signifi-cant factor in the perception of barriers by SMEowners. But it was only weakly significantly asso-ciated with ‘low purchasing power’. These unex-pected results seem to suggest that the perceivedimpact of barriers is great for SME ownersregardless of their business start-up dates, sex,sector, and most other personal and businesscharacteristics.
Though this study focused on Lithuania, theresults discussed here may also be relevant forother FSU countries such as Latvia or EasternEuropean countries such as Poland who are alsoin the midst of a dramatic and similar systemicchange. The situation in these countries maynot be identical, but given the similarities in
TABLE V
Logit regression – skill barriers
Variables Coefficient SE
(I) Mafia 0.99*** 0.36
(E) Legal competition 0.54** 0.27
(E) Lack of information 1.43*** 0.28
Own facilities 0.69** 0.28
Sex 0.00 0.33
Transition effect – Bf 1994 0.18 0.41
Constant )2.30*** 0.47
SE: robust standard errors.
(F): formal barrier; (I): informal barrier; (E): environmental
barrier; (S): skill barrier.
Probability values: ***: p-value significant at the 1% test
level, **: 5% test level, *: 10% test level.
Pseudo R2: 0.13.
Total number of observations: 293.
Dependent variable
Y1 ¼ most affectedby skills barriers ðn ¼ 100Þ � response variable0 ¼ no pattern to responsesðn ¼ 193Þ
8<:
313Institutional barriers to small- and medium-sized enterprise operations
institutional change and the relative newness ofthe SME sector, issues such as the conflictbetween new formal rules and existing informalrules seem to be generally applicable.
Causality between dependent and indepen-dent variables in our regression models shouldbe interpreted with caution and our resultsshould be viewed as descriptive rather thancausal. For example, our regression results indi-cate that business owners who do not ownbusiness facilities or have home-based busi-nesses are significantly more affected by formalbarriers (for own facilities), or informal andenvironmental barriers (for home-based). But itmay also be the case that the reason theseSME owners have home-based businesses or donot own their business facilities is due to lowerlevels of business acumen. Since we do notcontrol for this effect, our results simply estab-lish that there is a relationship between thedependent and independent variables.
As with most surveys, our survey has itslimitations. It was a cross-sectional study andas such may have excluded high-growth busi-nesses (i.e., gazelles) from our sample as wellas businesses that have ceased business opera-tions. The consequences of these exclusionscould have resulted in the insignificance of thetransition effect. Also, though our models pro-vide explanatory value for our dependent vari-ables, the generally low R2 values for ourregression models indicate that we have notcompletely captured all the influences on thedependent variable.
7. Conclusion
The inter-relatedness of business barriers is animportant area for research since it addressesbusiness barriers not in isolation but analyzestheir interlinked effects. Our analysis exploredthe inter-related nature of four business barriersgroups: formal, informal, environmental and skillbarriers on existing SME operations. The signifi-cance of these barriers was based on the percep-tions of the SME owners. Though perceptionsare not objective measures, perceptions or real-ity-as-perceived have been shown to influencebusiness growth motivation and direct behavior(Davidsson, 1991).
In this study, nineteen possible barriers toexisting SME business operations were analyzed.An institutional framework was operationalizedand extended to include environmental and skillbarriers. The dataset based on a mail survey sam-ple of 332 SME owners in Lithuania indicatesthat when tested for importance and significancethe most significant barriers are formal barriersrelated to frequent changes to taxes, the tax level,ambiguity of tax policies and environmental bar-riers related to low purchasing power and lack offunds for business investment. The nineteen pos-sible barriers were further grouped into four bar-rier groups (formal, informal, environmental andskill barriers) using the Ward’s grouping methodfor hierarchical clustering.
SME owner’s perceptions regarding the fourtypes of barriers have been analyzed by way ofregressions. The main results provide support forour three hypotheses that stipulate that the per-ceived effect of formal barriers will be associatedwith informal barriers (H1 and H2); and, the per-ceived effect of environmental barriers will beassociated with skill barriers (H3). In addition,personal and business characteristics such asfacilities ownership, location, turnover and SMEowner’s age were also significant factors to theperceived effect of different business barriers. Theinterrelations between business barriers makeclear that change in one type of barrier may leadnot only to a change in the perception of thisbarrier but also in the perception of other typesof barriers.
Even though this study focused on Lithuania,the results discussed here may also be relevantfor transition countries. The situation in thesecountries may not be identical, but given the sim-ilarities in institutional change and the relativenewness of the SME sector, issues such as theconflict between new formal rules and existinginformal rules seem to be generally applicable.
A number of relevant issues are beyond thescope of this paper. Our results show the signifi-cant effect of ownership of business facilities onthe perception of formal, environmental and skillbarriers. This is an area for further research. Acomparison between start-up enterprises andexisting SMEs may shed more light on thechanging effect of business barriers as SMEsdevelop. Also cross-country comparisons between
314 Ruta Aidis

transition countries are essential in order toobtain more insight as to specific national andregional characteristics.
Appendix I: Hierarchical clustering using
Ward’s method
Hierarchical clustering is a method that startswith each object describing a cluster, and thencombines them into more inclusive clusters untilonly one cluster remains. If two objects orgroups P and Q are to be united one obtains thedistance to another group (object) R by thefollowing distance function:
dðR;PþQÞ ¼ d1dðR;PÞ þ d2dðR;QÞ þ d3dðP;QÞþ d4 dðR;PÞ � dðR;QÞj j
The dj ‘s are weighting factors that lead to differ-ent agglomerative algorithms
d1 ¼nR þ nP
nR þ nP þ nQ
d2 ¼nR þ nQ
nR þ nP þ nQ
d3 ¼�nR
nR þ nP þ nQ
d4 ¼ 0
where nP ¼Pn
i¼1 Iðxi 2 PÞ is the number ofobjects in group P. The values of nQ and nR aredefined analogously.
Ward (1963) proposed a clustering procedureseeking to form the partitions Pk;Pk�1; . . . ;P1 ina manner that minimizes the loss associated witheach grouping and quantifies that loss in readilyinterpretable form. Information loss is defined byWard in terms of an error sum-of-squares (ESS)criterion. ESS is defined as the following
ESS ¼XKk¼1
Xxi2Ck
Xpj¼1ðxij ¼ �xkjÞ2
with the cluster mean, �xkj ¼ ð1=nkÞP
xi2Ckxij
where xij denotes the value for the i-th individualin the j-cluster, k is the total number of clustersat each stage, and nj is the number of individualsin the j-th cluster. The main difference betweenthe Ward method and other hierarchical cluster-ing methods is in the unification procedure. TheWard method does not put together groups withthe smallest distance, but it joins groups that donot increase too much a given measure of heter-ogenity. The aim of the Ward method is to unifygroups such that the variation inside thesegroups is not increased too drastically. Thisresults groups in clusters that are as homoge-neous as possible.
APPENDIX II
Explanatory variables
Variable name Definition N Mean SD
Own facilities One if the respondent owned their business facilities, zero otherwise. 327 0.58 0.49
Home-based One if the respondent ran their business from their home, zero otherwise. 323 0.12 0.33
Scratch One if business was started from nothing, zero otherwise. 331 0.82 0.38
Manuf One if business is engaged in manufacturing, zero otherwise. 332 0.22 0.41
Trade One if business is engaged in trade, zero otherwise. 332 0.42 0.49
Rural One if business is located in a small city or rural area, zero if located in a big city
(Vilnius, Kaunas, Klaipeda) or medium city (Siauliai, Panevezys, Alytus).
329 0.27 0.44
Transition effect One if the business was started before or in 1994, zero otherwise. 326 0.83 0.38
Under-report One if the respondent agreed that in order to survive and grow, many firms in
their industry misreport their operational and financial results, zero otherwise.
The response to this question is considered a proxy for the respondent’s
own behaviour.
327 0.49 0.50
Business turnover Ordinal variable indicating annual business turnover for 1999. Five categories
were possible: (1) up to 100 000 Lt; (2) 100 001–500 000 Lt;
(3) 500 001–1 000 000 Lt; (4) 1 000 001–5 000 000 Lt; (5) more than 5 000 000 Lt
321 2.73 1.31
Sex One if female, zero if male. 332 0.27 0.44
315Institutional barriers to small- and medium-sized enterprise operations

Acknowledgements
I would like to thank Ingrid Verheul, CecileWetzels, and Michael Ellman for helpful com-ments on draft versions of this paper. Also, Iwould especially like to thank W.F. Sleegers forassistance with hierarchical clustering.
Notes
1 See Aidis (2003) for further description.2 From this point further we refer to these categories asbefore or after 1994, which implicitly compares
businesses, started in or before 1994 to businesses startedafter 1994.3 To avoid full correlation between duration of firmoperations and the transition effect, the new dummyvariable created is dichotomous, i.e., the business dura-tion before or after 1994 is not taken into consideration.4 See Brush (1992) for an overview.5 Though SME owners will be reluctant to reveal thelevel of their own under-reporting, we presume that SMEowners will most often respond based on their own expe-riences, and with caution we believe the responses can beinterpreted as indicating the SME owner’s own behavior(see Johnson, et al., 2000).6 Business premises ownership as opposed to rental ofbusiness facilities seems to provide a more stable business
APPENDIX II
Continued.
Variable name Definition N Mean SD
Education One if university educated, zero otherwise. 329 0.69 0.46
Business exp. One if the respondent had previous job-related work experience in their
business’s current activities, zero otherwise.
325 0.46 0.50
Mngt. exp. One if the respondent had previous work-related management experience,
zero otherwise.
327 0.50 0.50
Age Age in years. 326 43 8.86
Age squared Age variable squared. 326 1895 798
Formal barriers One if the respondent was affected by formal barriers, zero otherwise. 277 0.41 0.49
Taxes One if the respondent completely agreed or agreed that ‘taxes are too high’
formed a main barrier to their business, zero otherwise.
330 0.86 0.34
Ambiguity of
tax pol
One if the respondent completely agreed or agreed that ‘ambiguity of
tax policies’ formed a main barrier to their business, zero otherwise.
331 0.84 0.37
Informal barriers Non-categorical variable with 3 possibilities: (1) No pattern to responses,
(2) Affected by some corruption and late payment by clients;
(3) Most affected by corruption
253 1.60 0.73
Implementation One if the respondent completely agreed or agreed that ‘implementation of
business regulations’ formed a main barrier to their business, zero otherwise.
325 0.56 0.50
Tax inspections One if the respondent completely agreed or agreed that ‘too many tax
inspections’ formed a main barrier to their business, zero otherwise.
328 0.68 0.47
Natl govt
corruption
One if the respondent completely agreed or agreed that ‘governmental corruption
on at national level’ formed a main barrier to their business, zero otherwise.
329 0.74 0.44
Mafia One if the respondent completely agreed or agreed that
‘Mafia and racketeering’ formed a main barrier to their business, zero otherwise.
320 0.16 0.37
Environmental
barriers
Non-categorical variable with 3 possibilities: (1) No pattern to responses, (2) Affected
by low purchasing power only; (3) Affected by all environmental barriers.
277 1.79 0.72
Information One if the respondent completely agreed or agreed that ‘lack of information’
formed a main barrier to their business, zero otherwise.
329 0.39 0.49
Legal competition One if the respondent completely agreed or agreed that ‘competition
from legal businesses’ formed a main barrier to their business, zero otherwise.
329 0.42 0.49
Illegal competition One if the respondent completely agreed or agreed that ‘competition from
illegal businesses’ formed a main barrier to their business, zero otherwise.
326 0.52 0.50
Skill barriers One if the respondent was affected by skill barriers, zero otherwise. 293 0.34 0.47
Growth One if the respondent completely agreed or agreed that ‘inability to grow
into new markets’ formed a main barrier to their business, zero otherwise.
328 0.59 0.49
Management One if the respondent completely agree or agreed that ‘management
problems’ formed a main barrier to their business, zero otherwise.
325 0.33 0.47
N = total number of observations.
SD = standard deviation.
316 Ruta Aidis

environment given the frequent changes to legislation andproblems with the enforcement of contracts that charac-terize the transition process.7 Businesses started from privatized assets are morelikely to also be embedded in the existing informal net-works than businesses started from scratch and this mayeffect the perception of business barriers.8 A total of 1011 valid questionnaires were sent out and505 completed questionnaires were returned of which 332were SME business owners. Due to the inability toobtain accurate lists of operating SMEs, the survey wasnot a random sample and most addresses were obtainedfrom the membership lists of entrepreneurship organiza-tions. This may have resulted in a bias for businesses thatare older and have higher turnovers than the averageSME in Lithuania.9 The LDS results are based on structured personal inter-views. The raw data from this survey was not available.10 Previous studies have shown that better educatedprofessionals are more likely to return questionnaires(Miller, 1991).11 Factor analysis was not performed since the assump-tion of equal distribution of responses was violated byour data set.12 More often used in regional economics, hierarchicalclustering is used for the identification of regions for cli-mate studies (DeGaetano, 1996), communities (Stimsonet al., 2001) and the sectorisation (Valios, 2000).13 The logit estimation model is a binary linear proba-bility model that allows for two values for the dependentvariable. The logit model takes the form of:
logProb(affected)
1� Prob(affected)
¼ b1 þ b2Z2 þ � � � þ bkZkm
where the Z’s represent the business owner characteristicsgiven in Appendix I and Prob (affected) represents theprobability of a business owner being affected by a groupof business barriers.14 Multinomial logit models were chosen since we hadthree categories in our dependent variable without a clearorder. The multinomial logit model specifications are asfollows:
The probability that a business owner will not displayany clear pattern of responses (i.e., not affected by groupsof business barriers) can be expressed as a conditionalexpectation function, PðY ¼ kjXÞ ¼ pki, where k = 1, 2 ifindividual belongs to group 1 or 2, respectively, and X is avector of individual characteristics and other factors thatare believed to affect barrier perception. The probabilitythat individual i experiences group 1 as a barrier is
p1i ¼expðXib1Þ
1þ expðXib1Þ þ expðXib2Þ
and the probability that the business owner experiencesgroup 2 is
p2i ¼expðXib2Þ
1þ expðXib1Þ þ expðXib2Þ
The indicated specification requires independence of thethree barrier states, where no clear pattern to responses(group 1) is taken as the base category.15 Each model has first been tested for the effect of thecontrol variables on the dependent variable.16 Using control variables only, having a home-basedbusiness and not having previous business-related experi-ence was significantly associated with the likelihood ofperceiving to be affected by formal barriers.17 Corruption and late payment of clients.18 Using control variables only, age of SME owner wasnot significant.19 Using control variables only, home-based businessesand higher business turnover were associated with thelikelihood of an SME owner perceiving to be affected byenvironmental barriers.20 Using control variables only, ownership of businessfacilities was no longer significantly associated with thelikelihood of an SME owner perceiving to be affectedby skill barriers. While SME owners engaged in themanufacturing sector were significantly associated withthe likelihood of perceiving to be affected by skill bar-riers.21 Though there are exceptions, Mafia and racketeeringoperations have become less threatening to the businessowner because in many cases their activities have become‘legitimized’ through legally registered private securitycompanies (see Aidis, 2003).
References
Acs, Z. J. and D. B. Audretsch, 1990, Innovation andSmall Firms, Cambridge, MA: MIT Press.
Aidis, R., 2003, By law and by custom: Factors affectingsmall and medium-sized enterprises during the transitionin Lithuania. Amsterdam: Thela Thesis.
Babbie, E., 1998, The Practice of Social Science Research,London: Wadsworth Publishing Company.
Bannock, G. and A. Peacock, 1989, Government andSmall Business, London: Paul Chapman.
Bartlett, W. and V. Bukvic, 2001, ‘Barriers to SMEGrowth in Slovenia’, MOCT—MOST 11, 177–195.
Becker, G., 1975, Human Capital, New York: NationalBureau of Economic Research.
Bohata, M. and J. Mladek, 1999, ‘The Development ofthe Czech SME Sector’, Journal of Business Venturing14, 461–473.
Brunetti, A., G. Kisunko and B. Weder, 1998, ‘How busi-nesses see government: responses from private sectorsurveys in 69 countries’, World Bank Discussion Paper,Washington DC: The World Bank.
Brush, C., 1992, ‘Research on Women Business Owners:Past Trends, a New Perspective and Future Direc-tions’, Entrepreneurship, Theory and Practice, 5–30.
317Institutional barriers to small- and medium-sized enterprise operations

Dallago, B., 1997, ‘The Economic System, Transition andOpportunities for Entrepreneurship’, in Entrepreneur-ship and SMEs in Transition Economies, The VisegradConference, Paris: OECD, pp. 103–124.
Davidsson, P., 1991, ‘Continued entrepreneurship: Ability,need, and opportunity as determinants of small firmgrowth’, Journal of Business Venturing 6, 405–429.
DeGaetano, A., 1996, ‘Delineation of climate regions inthe northeastern United States’, in J. Hom, R. Birdseyand K. O’Brien (eds.), Proceedings, 1995 Meeting ofthe Northern Global Change Program, Pittsburgh, PA:Department of Agriculture, Forest Service.
Djankov, S., R. La Porta, F. Lopez-de-Silanes andA. Shleifer, 2002, ‘The Regulation of Entry’, TheQuarterly Journal of Economics 67, 1–37.
Feige, E., 1997, ‘Underground Activity and InstitutionalChange: Productive, Protective, and Predatory Behav-ior in Transition Economies’, in C. Tilly, J. Nelsonand L. Walker (eds.), Transforming Communist Politi-cal Economies, Washington DC: National AcademyPress, pp. 21–34.
Hashi, I., 2001, ‘Financial and Institutional Barriers toSME Growth in Albania: Results of an EnterpriseSurvey’, MOCT—MOST 11, 221–238.
Hisrich, R. and G. Fulop, 1994, ‘The Role of WomenEntrepreneurs in Hungary’s Transition Economy’,International Studies of Management and Organisation24(4), 100–117.
Honig, B., 1998, ‘What determines success? Examining thehuman, financial and social capital of Jamaican mic-roentrepreneurs’, Journal of Business Venturing 13,371–394.
Jancauskas, E., 2000, Verslo Pletra: Lietuvoje ir VidurioEuropoje, Vilnius: Lietuvos Respublikos Ukio Ministe-rija, Statistikos Tyrimai.
Johnson, S. and G. Loveman, 1995, Starting Over in East-ern Europe: Entrepreneurship and Economic Renewal,Cambridge: Harvard Business School Press.
Johnson, S., D. Kaufman, J. MacMillan and C. Wood-ruff, 2000, ‘Why Do Firms Hide? Bribes and UnofficialActivity after Communism’, Journal of Public Econom-ics 76, 495–520.
Miller, D., 1991, Handbook of research design and socialmeasurement, Newbury Park, CA: Sage.
Muent, H., F. Pissarides and P. Sanfey, 2001, ‘Taxes, Com-petition and Finance for Albanian Enterprises: Evi-dence from a Field Study’, MOCT—MOST 11, 239–251.
North, D., 1990, Institutions, institutional change and eco-nomic performance, New York: Cambridge UniversityPress.
North, D., 1997, The Contribution of the New InstitutionalEconomics to an Understanding of the TransitionalProblem, Helsinki: Wider Annual Lectures, UnitedNations University World Institute for DevelopmentEconomics Research.
Pissarides, F., M. Singer and J. Svejnar, 2000, ‘Objectivesand constraints of entrepreneurs: Evidence from smalland medium-sized enterprises in Russia and Bulgaria’,London: European Bank for Reconstruction andDevelopment.
Puffer, S. and D. McCarthy, 2001, ‘Navigating the hostilemaze: A framework for Russian entrepreneurship’, TheAcademy of Management Executive 15, 24–38.
Roberts, K. and J. Tholen, 1998, ‘Young Entrepreneursin East-Central and the Former Soviet Union’, IDSBulletin 29, 59–64.
Smallbone, D. and F. Welter, 2001, ‘The Distinctivenessof Entrepreneurship in Transition Economies’, SmallBusiness Economics 16, 249–262.
Stimson, R., 2001, ‘A typology of community opportunityand vulnerability in metropolitan Australia’ Papers inRegional Science 80(1), 45–66.
Valios, J.P., 2000, ‘Robust approach to hierarchicalclustering: Application to the sectorisation of an oilfield’, in H. Kiers, (ed.), Data Analysis, classification,and related methods, New York: Springer, pp. 95–100.
Ward, J.,1963, ‘Hierarchical grouping to optimize anobjective function’, Journal of American StatisticalAssociation 58, 236–244.
Yeager, T., 1999, Institutions, Transition Economics andEconomic Development, Oxford: Westview Press.
318 Ruta Aidis