institute for public policy research the state of pay demystifying the gender pay gap 3 summary...
TRANSCRIPT

Institute for Public Policy Research
THE STATE OF PAYDEMYSTIFYING THE
GENDER PAY GAP
Catherine Colebrook,Charlotte Snelling andSarah Longlands
May 2018
WOMEN AND THE ECONOMY

ABOUT IPPRIPPR, the Institute for Public Policy Research, is the UK’s leading progressive think tank. We are an independent charitable organisation with our main offices in London. IPPR North, IPPR’s dedicated think tank for the North of England, operates out of offices in Manchester and Newcastle, and IPPR Scotland, our dedicated think tank for Scotland, is based in Edinburgh.
Our purpose is to conduct and promote research into, and the education of the public in, the economic, social and political sciences, science and technology, the voluntary sector and social enterprise, public services, and industry and commerce.
IPPR 14 Buckingham Street London WC2N 6DF T: +44 (0)20 7470 6100 E: [email protected] www.ippr.org Registered charity no: 800065 (England and Wales), SC046557 (Scotland)
This paper was first published in May 2018. © IPPR 2018
The contents and opinions expressed in this paper are those of the authors only.
The progressive policy think tank

IPPR | The state of pay Demystifying the gender pay gap 1
CONTENTS
Summary .......................................................................................................................3
1. Introduction .............................................................................................................6The drivers of the gender pay gap ..................................................................... 7
2. The UK’s gender pay gap: Whole economy data ............................................8Pay and pay gaps by occupation ........................................................................9Pay and pay gaps by industry ........................................................................... 13The pay gap by age ..............................................................................................14The pay gap by region ......................................................................................... 15Conclusions ........................................................................................................... 15
3. The UK’s gender pay gap: Organisation-level data .....................................16The new gender pay gap reporting requirements .......................................16Key results at the level of the organisation ..................................................16Employers’ narrative reporting ........................................................................24Conclusions ..........................................................................................................28
Recommendations ...................................................................................................29
References .................................................................................................................31
Glossary ......................................................................................................................33

IPPR | The state of pay Demystifying the gender pay gap2
ABOUT THE AUTHORSCatherine Colebrook is chief economist at IPPR.
Charlotte Snelling was a research fellow at IPPR during the drafting of this report.
Sarah Longlands is a senior research fellow at IPPR North.
This report reflects the views of the named authors only.
ACKNOWLEDGEMENTSThe authors would like to thank IPPR colleagues Tom Kibasi for comments and direction, Carys Roberts and Joe Dromey for comments, and Jack Hunter for the case study data analysis in Chapter 3. Paul Trenell and Lauren Probert from the Government Equalities Office provided helpful insight on the reporting requirements. Matthew Percival from the Confederation of British Industry provided reactions to our draft recommendations.
Supported by:
Deloitte is a leading global provider of audit and assurance, consulting, financial advisory, risk advisory, tax and related services. The firm has taken a visible position on gender pay gap reporting, having voluntarily reported since 2015, and recognises the critical role that reporting plays in achieving greater gender balance within organisations.
DownloadThis document is available to download as a free PDF and in other formats at:http://www.ippr.org/research/publications/the-state-of-pay
CitationIf you are using this document in your own writing, our preferred citation is:Colebrook C, Snelling C and Longlands S (2018) The state of pay: Demystifying the gender pay gap, IPPR. http://www.ippr.org/research/publications/the-state-of-pay
Permission to shareThis document is published under a creative commons licence: Attribution-NonCommercial-NoDerivs 2.0 UK http://creativecommons.org/licenses/by-nc-nd/2.0/uk/ For commercial use, please contact [email protected]

IPPR | The state of pay Demystifying the gender pay gap 3
SUMMARY
60-SECOND SUMMARYThe UK has a gender pay gap: within industries, within occupations, and within organisations, women earn less per hour, on average, than men. A small proportion of this gap may be the result of unequal pay for the same work within a firm – which is illegal on the grounds of gender and other protected characteristics1 – but the majority is a consequence of the sort of jobs that women do, their level of seniority, and their working patterns.
New firm-level data, published in April 2018 to meet new government reporting requirements, suggests that most large employers have a gender pay gap, although organisations' pay gaps tend to be smaller than the pay gap for the industry in which they operate. Closing the gender pay gap within organisations would not, therefore, eliminate the economy-wide pay gap altogether. But employers do have an important part to play, and should make every effort to ensure that their pay, progression and flexible working policies help both men and women to combine work and caring commitments, and do not unconsciously bias the balance of who progresses, and who doesn’t.
It is possible for an employer to have a large gender pay gap and be working hard to promote gender equality; it is also possible for an employer to have a small gap and pay women (and men) poorly. Further, some measures to promote gender equality may actually increase the pay gap in the short-term – for example, the recruitment of more female graduate trainees. We should therefore be cautious in attributing too much importance to the pay gap data in isolation. We would encourage more firms to publish short, accessible narrative reports alongside their pay gap results in future.
KEY FINDINGS At the level of the economy:• The UK has a gender pay gap of 18.4 per cent: Women earn, on average, 18.4
per cent less per hour than men. The pay gap is 9.1 per cent for full-time work, and -5.1 per cent for part-time work. Part-time work still contributes to the overall pay gap, however, as it tends to be lower-paid, and is overwhelmingly done by women.
• The pay gap has six drivers: occupational segregation (more men than women working in certain higher-paid occupations); seniority (women tending to be in less senior roles than men); the maternity penalty; the lower level of part-time pay; historical skills gaps between men and women; and discrimination and bias.
• Occupational segregation explains some, but not all, of the gap: 81 per cent of occupations have a pay gap, even at a very granular level of detail. Within-occupation differences in roles, such as differences in seniority, are therefore a significant driver of the pay gap.
• The pay gap tends to be lower when pay itself is lower: this means that tackling the pay gap in isolation will not be sufficient to ensure that women are engaged in good, well-paid work.
1 As defined by the Equality Act 2010. In 2017, 22,531 equal pay claims were brought to tribunal - 11 per cent of all jurisdictional complaints (MOJ 2018).
IPPR | The state of pay Demystifying the gender pay gap4
• The pay gap is largest for women over the age of 40, and persists for the rest of a woman's working life.
At the level of the organisation:• The 10,019 employers that have reported have an average pay gap within their
organisations of 12 per cent, with 78 per cent reporting a pay gap of some level. Just over half of employers have a gap of between 0 and 20 per cent.
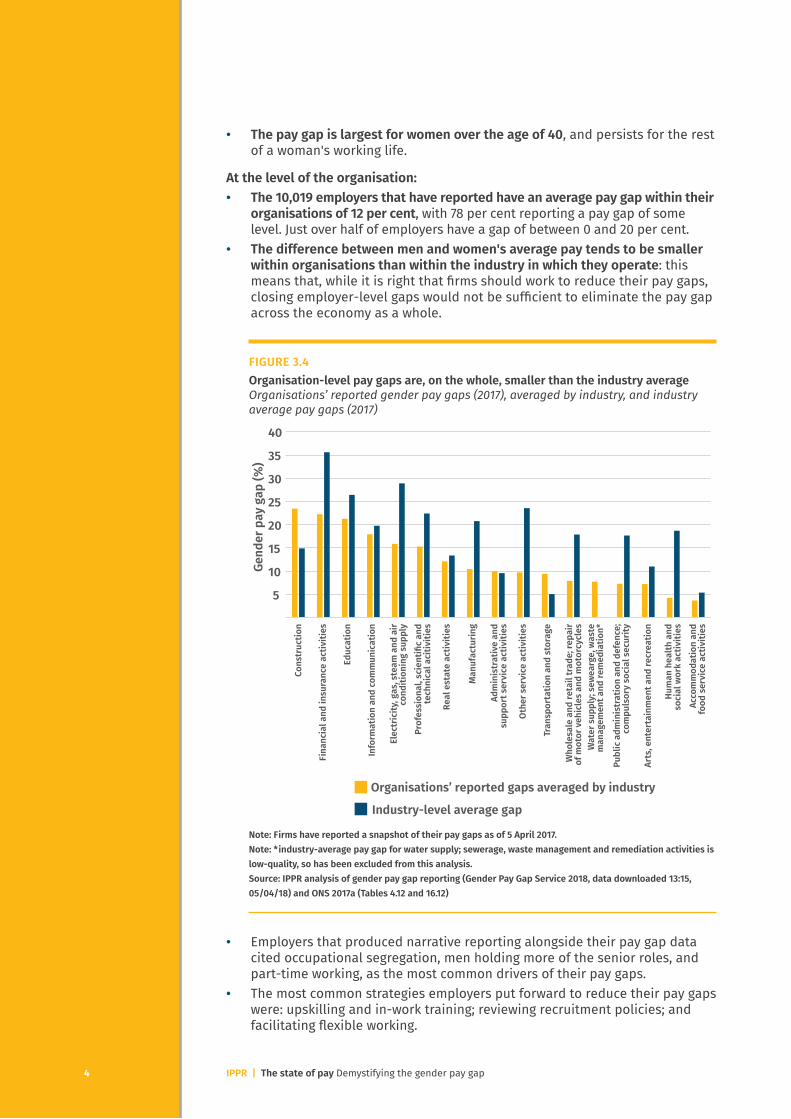
• The difference between men and women's average pay tends to be smaller within organisations than within the industry in which they operate: this means that, while it is right that firms should work to reduce their pay gaps, closing employer-level gaps would not be sufficient to eliminate the pay gap across the economy as a whole.
FIGURE 3.4 Organisation-level pay gaps are, on the whole, smaller than the industry averageOrganisations’ reported gender pay gaps (2017), averaged by industry, and industry average pay gaps (2017)
Note: Firms have reported a snapshot of their pay gaps as of 5 April 2017. Note: *industry-average pay gap for water supply; sewerage, waste management and remediation activities is low-quality, so has been excluded from this analysis. Source: IPPR analysis of gender pay gap reporting (Gender Pay Gap Service 2018, data downloaded 13:15, 05/04/18) and ONS 2017a (Tables 4.12 and 16.12)
• Employers that produced narrative reporting alongside their pay gap data cited occupational segregation, men holding more of the senior roles, and part-time working, as the most common drivers of their pay gaps.
• The most common strategies employers put forward to reduce their pay gaps were: upskilling and in-work training; reviewing recruitment policies; and facilitating flexible working.
5
10
15
20
25
30
35
40
Gend
er p
ay g
ap (%
)
Organisations’ reported gaps averaged by industry
Industry-level average gap
Cons
truc
tion
Fina
ncia
l and
insu
ranc
e ac
tiviti
es
Educ
atio
n
Info
rmat
ion
and
com
mun
icat
ion
Elec
tric
ity, g
as, s
team
and
air
cond
ition
ing
supp
lyPr
ofes
sion
al, s
cien
tific
and
tech
nica
l aci
tiviti
es
Real
est
ate
activ
ities
Man
ufac
turin
g
Adm
inis
trat
ive
and
supp
ort s
ervi
ce a
ctiv
ities
Oth
er s
ervi
ce a
ctiv
ities
Tran
spor
tatio
n an
d st
orag
e
Who
lesa
le a
nd re
tail
trad
e; re
pair
of m
otor
veh
icle
s an
d m
otor
cycl
esW
ater
sup
ply;
sew
earg
e, w
aste
m
anag
emen
t and
rem
edia
tion*
Publ
ic a
dmin
istr
atio
n an
d de
fenc
e;
com
puls
ory
soci
al s
ecur
ity
Arts
, ent
erta
inm
ent a
nd re
crea
tion
Hum
an h
ealth
and
so
cial
wor
k ac
tiviti
esAc
com
mod
atio
n an
d fo
od s
ervi
ce a
ctiv
ities
4

IPPR | The state of pay Demystifying the gender pay gap 5
• In many cases, it would be possible for an employer to reduce its pay gap by taking action that could be detrimental to women, such as outsourcing its low-paid work. The pay gap is a blunt instrument, which should be interpreted in context and with caution.
RECOMMENDATIONSIn this discussion paper we make a small number of initial recommendations targeted at employers. Future work will explore the potential to refine the reporting requirements.1. Employers should rethink policies around pay negotiation. Women have a lower propensity to negotiate salary both when starting a new job and when in post (see Leibrandt and List 2014). There are four contrasting ways that organisations could tackle women’s lower propensity to negotiate:
– They could rule out the possibility of negotiation altogether – They could state explicitly in job advertisements that salaries
are negotiable – They could offer successful candidates the option of a colleague
to negotiate on their behalf – They could mirror or match salary offers, ensuring that all employees
on the same level earn at least as much as any new recruit.
2. Employers should introduce a more structured approach to progression.To tackle women’s women's lower propensity to put themselves forward for progression opportunities, employers could take a more rigid approach to progression, and automatically consider employees for a step up after a given length of time in post. Firms could also consider a policy of committing to interview all internal candidates for a post, alongside encouraging more women to apply for internal promotions as part of a more structured approach to development.
3. Employers should encourage more men to work flexibly, and to take time out for caring responsibilities.
Changing men’s working behaviour is a crucial component of closing the gender pay gap. To reduce the gender stratification of full and part-time roles, and reduce the maternity penalty, employers could look to introduce dedicated, paid paternity leave offered on a ‘use it or lose it’ basis, to advertise roles as flexible by default, and to encourage men to partake in job share arrangements.
4. Employers should commit to publishing narrative reports alongside their pay gaps.
Some firms have taken the initiative and published narrative reporting materials alongside their pay gap data in their first year of reporting. We would like to see more organisations committing to do this alongside their 2019 releases to place their gender pay gaps in context, and facilitate a more balanced discussion among users of the data.
55

IPPR | The state of pay Demystifying the gender pay gap6
1. INTRODUCTION
It is illegal to pay a woman less than a man for the same work, and has been since the Equal Pay Act was introduced in 1970. However, women in work across the economy overall continue to be paid less, on average, than men.
The gender pay gap is the key summary statistic for comparing men and women’s pay. It is calculated as the difference between men and women’s median2 gross hourly earnings, expressed as a percentage of men’s median gross hourly earnings (ONS 2018a).3 However, it doesn’t take into account any of the drivers of different pay levels, such as age, qualifications, experience or seniority, or type of work. As such, a firm-level gender pay gap does not indicate discriminatory practices, and is not unlawful.
This report analyses two types of data on gender pay: the economy-wide data produced by the ONS, and new organisation-level data published for the first time in April 2018 by more than 10,000 large employers, following the introduction of new reporting requirements.
We supplement this data analysis with a review of a sample of the narrative reporting that some firms have published alongside their gender pay gap data, to find out what employers think are the causes of their pay gaps, and what they plan to do about them.
Finally, we propose actions that employers could take to promote gender equality within their organisations.
2 The mid-point salary for women employees.3 The gender pay gap can also be calculated using mean hourly pay. We use the median throughout this
report, unless otherwise stated. See glossary on page 33 for fuller definitions of all terms used.
IPPR | The state of pay Demystifying the gender pay gap 7
DRIVERS OF THE GENDER PAY GAP
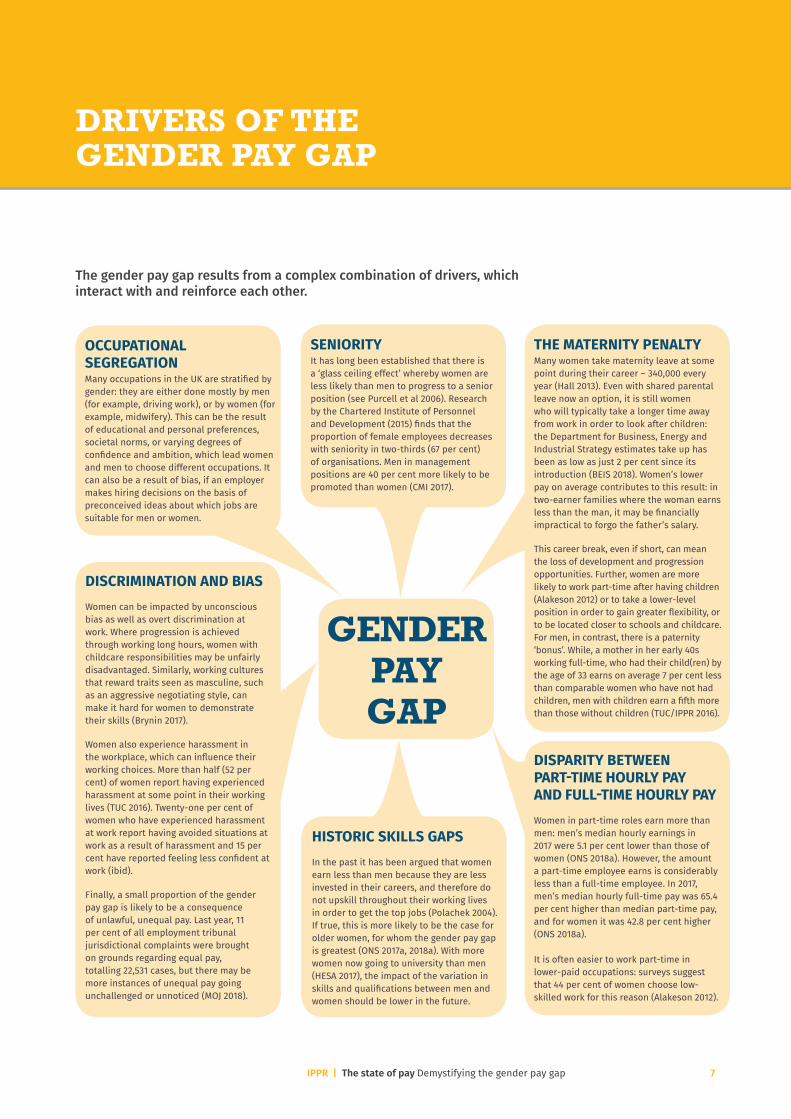
The gender pay gap results from a complex combination of drivers, which interact with and reinforce each other.
OCCUPATIONAL SEGREGATION Many occupations in the UK are stratified by gender: they are either done mostly by men (for example, driving work), or by women (for example, midwifery). This can be the result of educational and personal preferences, societal norms, or varying degrees of confidence and ambition, which lead women and men to choose different occupations. It can also be a result of bias, if an employer makes hiring decisions on the basis of preconceived ideas about which jobs are suitable for men or women.
SENIORITYIt has long been established that there is a ‘glass ceiling effect’ whereby women are less likely than men to progress to a senior position (see Purcell et al 2006). Research by the Chartered Institute of Personnel and Development (2015) finds that the proportion of female employees decreases with seniority in two-thirds (67 per cent) of organisations. Men in management positions are 40 per cent more likely to be promoted than women (CMI 2017).
THE MATERNITY PENALTYMany women take maternity leave at some point during their career – 340,000 every year (Hall 2013). Even with shared parental leave now an option, it is still women who will typically take a longer time away from work in order to look after children: the Department for Business, Energy and Industrial Strategy estimates take up has been as low as just 2 per cent since its introduction (BEIS 2018). Women’s lower pay on average contributes to this result: in two-earner families where the woman earns less than the man, it may be financially impractical to forgo the father’s salary.
This career break, even if short, can mean the loss of development and progression opportunities. Further, women are more likely to work part-time after having children (Alakeson 2012) or to take a lower-level position in order to gain greater flexibility, or to be located closer to schools and childcare. For men, in contrast, there is a paternity ‘bonus’. While, a mother in her early 40s working full-time, who had their child(ren) by the age of 33 earns on average 7 per cent less than comparable women who have not had children, men with children earn a fifth more than those without children (TUC/IPPR 2016).
DISPARITY BETWEEN PART-TIME HOURLY PAY AND FULL-TIME HOURLY PAYWomen in part-time roles earn more than men: men’s median hourly earnings in 2017 were 5.1 per cent lower than those of women (ONS 2018a). However, the amount a part-time employee earns is considerably less than a full-time employee. In 2017, men’s median hourly full-time pay was 65.4 per cent higher than median part-time pay, and for women it was 42.8 per cent higher (ONS 2018a). It is often easier to work part-time in lower-paid occupations: surveys suggest that 44 per cent of women choose low-skilled work for this reason (Alakeson 2012).
HISTORIC SKILLS GAPSIn the past it has been argued that women earn less than men because they are less invested in their careers, and therefore do not upskill throughout their working lives in order to get the top jobs (Polachek 2004). If true, this is more likely to be the case for older women, for whom the gender pay gap is greatest (ONS 2017a, 2018a). With more women now going to university than men (HESA 2017), the impact of the variation in skills and qualifications between men and women should be lower in the future.
DISCRIMINATION AND BIASWomen can be impacted by unconscious bias as well as overt discrimination at work. Where progression is achieved through working long hours, women with childcare responsibilities may be unfairly disadvantaged. Similarly, working cultures that reward traits seen as masculine, such as an aggressive negotiating style, can make it hard for women to demonstrate their skills (Brynin 2017).
Women also experience harassment in the workplace, which can influence their working choices. More than half (52 per cent) of women report having experienced harassment at some point in their working lives (TUC 2016). Twenty-one per cent of women who have experienced harassment at work report having avoided situations at work as a result of harassment and 15 per cent have reported feeling less confident at work (ibid).
Finally, a small proportion of the gender pay gap is likely to be a consequence of unlawful, unequal pay. Last year, 11 per cent of all employment tribunal jurisdictional complaints were brought on grounds regarding equal pay, totalling 22,531 cases, but there may be more instances of unequal pay going unchallenged or unnoticed (MOJ 2018).
GENDER PAY GAP

IPPR | The state of pay Demystifying the gender pay gap8
2. THE UK’S GENDER PAY GAP
The following analysis uses individual-level data published through the Office for National Statistics Annual Survey of Hours and Earnings (ONS ASHE) (ONS 2017a), which provides gender pay gap figures for the whole economy. Reported pay gaps, unless otherwise stated, refer to the median gender pay gap.
The UK has a gender pay gap for full-time work of 9.1 per cent, which means that the median female full-time employee earns 9.1 per cent less per hour, excluding overtime, than the median male full-time employee. The gender pay gap has narrowed over time, but that progress looks to have stalled (see figure 2.1).
If we include part-time workers in the calculation, the gender pay gap widens to 18.4 per cent (ONS 2018a). This is because women are more likely to work part-time – they account for three-quarters of the part-time workforce (ONS 2018b) - and part-time work pays less per hour than full-time work, on average. The low level of part-time pay explains the counter-intuitive result that the part-time pay gap is negative – women working part time earn more than men – yet including part-time work in the calculation makes the overall pay gap larger.
FIGURE 2.1The UK has a persistent gender pay gapMedian gender pay gap (%), 1997 to 2017, by type of contract
Source: ONS 2017a
The UK’s gender pay gap is large relative to other countries. In 2016, the OECD average gender pay gap was 14.1 per cent, with countries such as France, Belgium, and Denmark4 reporting gaps of just 9.9, 4.7, and 5.8 per cent, respectively (OECD 2017). It is important to note, however, that a smaller gender pay gap does not necessarily imply greater gender equality. Greece and Italy, for example, have low gender pay gaps at least in part because they have relatively low rates of female labour market participation (OECD 2018).
4 Belgium data from 2015.
-10
-5
0
5
10
15
20
25
30
1997
1998
1999
2000
2001
2002
2003
2004
2004
2005
2006
2006
2007
2008
2009
2010
2011 20
1120
1220
1320
1420
1520
1620
17
All median Full-time median Part-time median
WHOLE ECONOMY DATA
IPPR | The state of pay Demystifying the gender pay gap 9
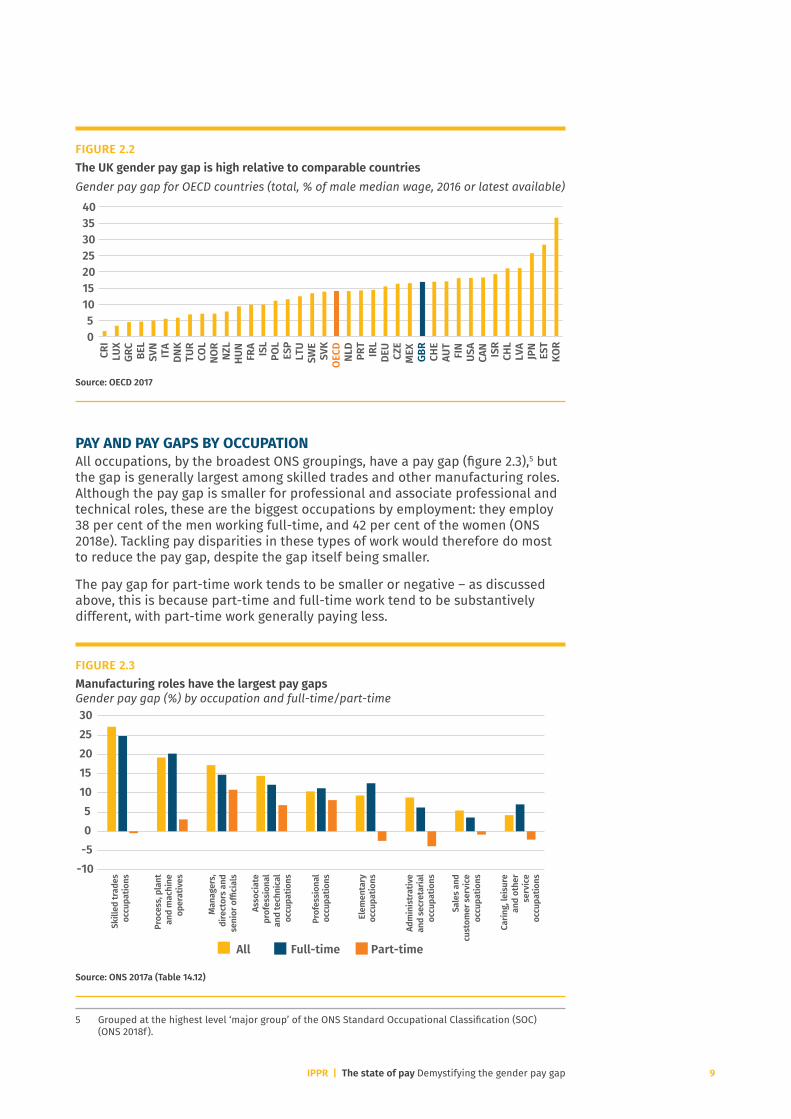
FIGURE 2.2The UK gender pay gap is high relative to comparable countriesGender pay gap for OECD countries (total, % of male median wage, 2016 or latest available)
Source: OECD 2017
PAY AND PAY GAPS BY OCCUPATIONAll occupations, by the broadest ONS groupings, have a pay gap (figure 2.3),5 but the gap is generally largest among skilled trades and other manufacturing roles. Although the pay gap is smaller for professional and associate professional and technical roles, these are the biggest occupations by employment: they employ 38 per cent of the men working full-time, and 42 per cent of the women (ONS 2018e). Tackling pay disparities in these types of work would therefore do most to reduce the pay gap, despite the gap itself being smaller.
The pay gap for part-time work tends to be smaller or negative – as discussed above, this is because part-time and full-time work tend to be substantively different, with part-time work generally paying less.
FIGURE 2.3 Manufacturing roles have the largest pay gapsGender pay gap (%) by occupation and full-time/part-time
Source: ONS 2017a (Table 14.12)
5 Grouped at the highest level ‘major group’ of the ONS Standard Occupational Classification (SOC) (ONS 2018f).
05
10152025303540
CRI
LUX
GRC
BEL
SVN
ITA
DNK
TUR
COL
NOR
NZL
HUN
FRA ISL
POL
ESP
LTU
SWE
SVK
OEC
DNL
DPR
TIR
LDE
UCZ
EM
EX GBR
CHE
AUT
FIN
USA
CAN ISR
CHL
LVA
JPN
EST
KOR
-10-505
1015202530
All Full-time Part-time
Skill
ed tr
ades
oc
cupa
tions
Proc
ess,
pla
nt
and
mac
hine
op
erat
ives
Man
ager
s,
dire
ctor
s an
d se
nior
offi
cial
s
Asso
ciat
e pr
ofes
sion
al
and
tech
nica
l oc
cupa
tions
Prof
essi
onal
oc
cupa
tions
Elem
enta
ry
occu
patio
ns
Adm
inis
trat
ive
and
secr
etar
ial
occu
patio
ns
Sale
s an
d cu
stom
er s
ervi
ce
occu
patio
ns
Carin
g, le
isur
e an
d ot
her
serv
ice
occu
patio
ns

IPPR | The state of pay Demystifying the gender pay gap10
The pay gap is highly correlated with the proportion of men within the occupational grouping. It is largest among skilled trades occupations6 and process, plant and machine operatives – both of which are predominantly ‘male’, manufacturing occupations – and lowest in sales and customer services and caring, leisure and other service occupations – which are predominantly female.
FIGURE 2.4The gender pay gap is largest where the representation of women in the workforce is lowestOccupations’ gender pay gaps (2017), and men as % of all employees (April-June 2017)
Source: ONS 2017a (Table 14.12), ONS 2018e
There is gender stratification7 within these broad occupational groupings, which may in part account for the gaps. Within skilled trades, a male-dominated area where women comprise only 11 per cent of all employees, 67 per cent of these women work in food preparation and hospitality, which pays a median wage of £8.83 an hour. The majority of men working in the same (major) occupational grouping, in contrast, work in skilled metal, electrical and electronic trades (57 per cent), which pays £13.73 an hour (ONS 2018e; ONS 2017d).
To try and control for the effect of occupational segregation on the gender pay gap, figure 2.5 below presents pay gaps by the most granular level of the Standard Occupational Classification (SOC) detail available (see ONS 2018f). This data is less robust than the broader occupational data above. But it suggests that, even controlling for the type of work, women earn less on average than men. Eighty-one per cent of occupations have a gender pay gap. This points to seniority as a critical driver of the pay gap: for most occupations, men are in more senior, high-pay versions of the role than women.
6 Comprising skilled agricultural and related trades, skilled metal, electrical and electronic trades, skilled construction and building trades, and textiles, printing and other skilled trades.
7 See glossary for a definition of this term.
0
20
40
60
80
100
0 5 10 15 20 25 30
Men
as
% o
f all
empl
oyee
s
Gender pay gap (%)
IPPR | The state of pay Demystifying the gender pay gap 11
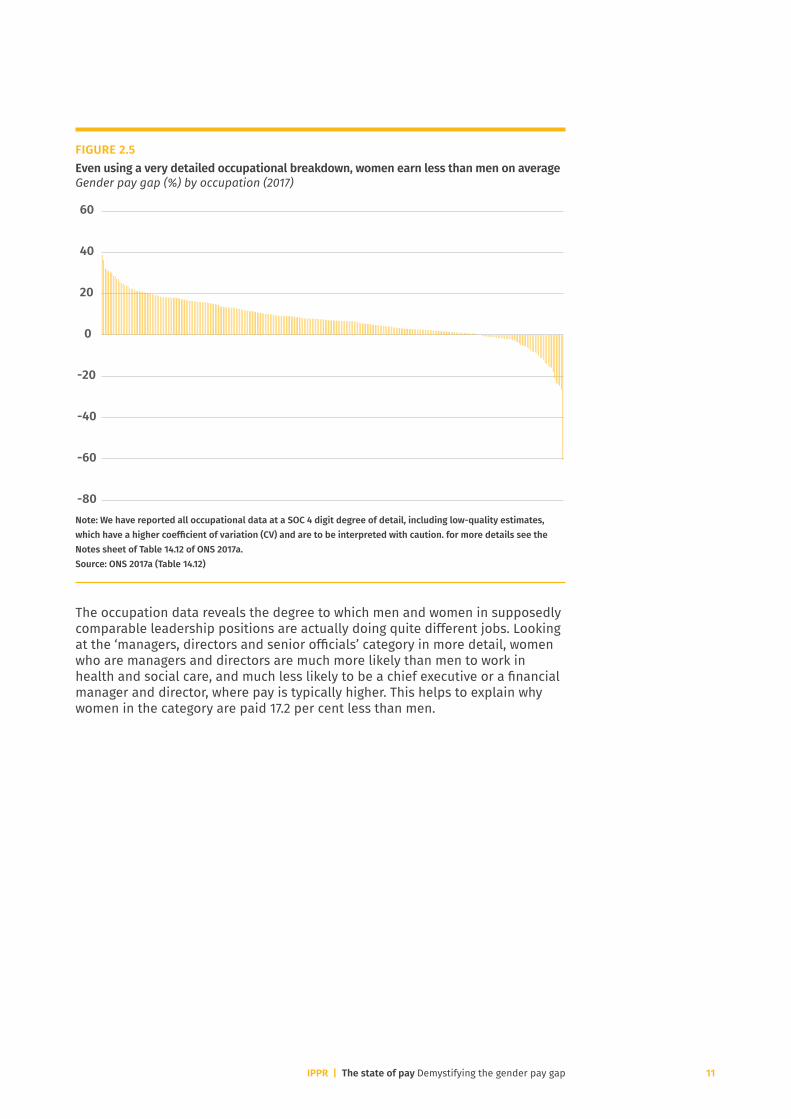
FIGURE 2.5Even using a very detailed occupational breakdown, women earn less than men on averageGender pay gap (%) by occupation (2017)
Note: We have reported all occupational data at a SOC 4 digit degree of detail, including low-quality estimates, which have a higher coefficient of variation (CV) and are to be interpreted with caution. for more details see the Notes sheet of Table 14.12 of ONS 2017a. Source: ONS 2017a (Table 14.12)
The occupation data reveals the degree to which men and women in supposedly comparable leadership positions are actually doing quite different jobs. Looking at the ‘managers, directors and senior officials’ category in more detail, women who are managers and directors are much more likely than men to work in health and social care, and much less likely to be a chief executive or a financial manager and director, where pay is typically higher. This helps to explain why women in the category are paid 17.2 per cent less than men.
-80
-60
-40
-20
0
20
40
60

IPPR | The state of pay Demystifying the gender pay gap12
FIGURE 2.6The lower-paid types of managerial role tend to be done by womenPercentage of women in roles within ‘managers, directors and senior officials’ (April-June 2017), and median hourly pay for the occupation (2017)
Source: ONS 2018e, ONS 2017c (Table 14.6a)
Even within occupations that are more female on aggregate, women are more likely to occupy the lower-paid roles. For example, within sales and customer service work, women make up two-thirds of the assistants and cashiers – the sub-occupation offering the lowest hourly wage.
FIGURE 2.7Even in predominantly female occupational groups, women are over-represented within the lowest-paying sub-groups Percentage of women in roles within ‘sales and customer service’ (April-June 2017), and median hourly pay for the occupation (2017)
Source: ONS 2018e,8 ONS 2017c (Table 14.6a)
8 Numbers of women employed as senior officers in protective services were unavailable and are therefore not presented.
051015202530354045
0102030405060708090
Med
ian
hour
ly p
ay (£
)
Wom
en in
wor
kfor
ce (%
)
Women as a % of the workforce (LHS) Median hourly pay (£, all employees, RHS)
Managers and
proprietors
in health
and care se
rvice
s
Health and so
cial s
ervice
s
managers and dire
ctors
Managers and proprie
tors
in other servi
ces
Managers and
proprietors
in hospita
lity
and leisu
re servi
ces
Functi
onal managers
and directo
rs
Managers and dire
ctors
in
retail and w
holesale
Chief exe
cutiv
es
and senior o
fficials
Financial in
stitutio
n
managers and dire
ctors
Managers and
proprietors
in agricultu
re
related servi
ces
Managers and dire
ctors
in
transp
ort and lo
gistics
Production m
anagers
and directo
rs
0
2
4
6
8
10
12
14
16
0
10
20
30
40
50
60
70
sales a
ssista
nts
and retail
Cashiers
Customer s
ervice
occupatio
ns
Customer s
ervice
managers and
supervi
sors Sales
supervi
sors
Sales related
occupatio
ns
Med
ian
hour
ly p
ay (£
)
Wom
en in
wor
kfor
ce (%
)
Women as a % of the workforce (LHS) Median hourly pay (£, all employees, RHS)

IPPR | The state of pay Demystifying the gender pay gap 13
PAY AND PAY GAPS BY INDUSTRYAll but two industry sectors pay women less than men on average, according to the ONS data. Of the two sectors that report negative pay gaps, one is the household sector (i.e. households’ activities as employers and producers of goods and services), and the other is water supply, sewerage and waste management, which is a lower-quality estimate.9
FIGURE 2.8Only two industry sectors have negative gender pay gapsGender pay gap (%) by industry (2017)
Note: *low-quality estimate; Mining and quarrying is excluded from this analysis as the estimate is of insufficient quality. Source: ONS 2017a
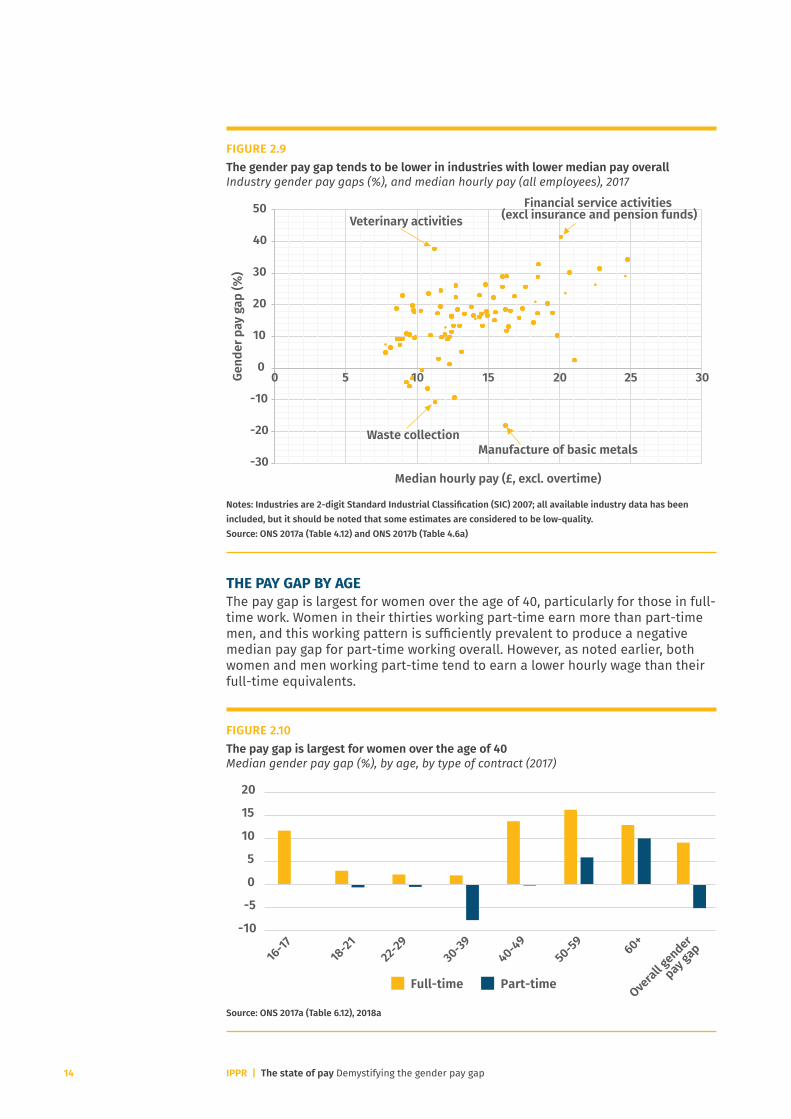
The gender pay gap tends to be lower when pay itself is lower. In part, this is the result of narrower salary ranges within lower paid industries and occupations. Looking at a higher level of industry detail, none of the industries that have a negative pay gap are found to pay more than £17 an hour, while the four industries that pay more than £20 an hour all have pay gaps in excess of 30 per cent.
9 Quality of estimate reported by ONS according to size of the coefficient of variation for corresponding male and female earnings estimates. For more information, see ONS 2017a.
-505
10152025303540
Financial a
nd insu
rance
activit
ies
Electrici
ty, gas, s
team and air
conditio
ning supply
Educatio
n
Other servi
ce acti
vities
Professional, s
cientifi
c and
technica
l acit
ivitie
s
Manufacturin
g
Informatio
n and communica
-tio
n
Human health and so
cial w
ork
activit
ies
Wholesale and re
tail trade;
repair of m
otor vehicl
es and
motorcycle
s
Public administ
ration and
defence; co
mpulsory
socia
l
secu
rity
Constructi
on
Real esta
te activit
ies
Agricultu
re, forestr
y and fish
ing
Arts, e
ntertainment a
nd
recreatio
n
Administrativ
e and support
servi
ce acti
vities
Accommodatio
n and food
servi
ce acti
vities
Transp
ortatio
n and storage
Water supply;
sewearge, w
aste
management and re
mediation
activit
y*
Activit
ies of h
ouseholds a
s
employers;
undifferentia
ted
goods-and se
rvice
s-produc-
ing activit
ies of
households f
or
own use
Fina
ncia
l and
insu
ranc
e ac
tiviti
es
Elec
tric
ity, g
as, s
team
and
air
cond
ition
ing
supp
ly
Educ
atio
n
Oth
er s
ervi
ce a
ctiv
ities
Prof
essi
onal
, sci
entifi
c an
d te
chni
cal a
citiv
ities
Man
ufac
turin
g
Info
rmat
ion
and
com
mun
icat
ion
Hum
an h
ealth
and
so
cial
wor
k ac
tiviti
esW
hole
sale
and
reta
il tr
ade;
repa
ir of
m
otor
veh
icle
s an
d m
otor
cycl
esPu
blic
adm
inis
trat
ion
and
defe
nce;
co
mpu
lsor
y so
cial
sec
urity
Cons
truc
tion
Real
est
ate
activ
ities
Agric
ultu
re, f
ores
try
and
fishi
ng
Arts
, ent
erta
inm
ent a
nd re
crea
tion
Adm
inis
trat
ive
and
supp
ort s
ervi
ce a
ctiv
ities
Acco
mm
odat
ion
and
food
ser
vice
act
iviti
es
Tran
spor
tatio
n an
d st
orag
e
Wat
er s
uppl
y; s
ewea
rge,
was
te
man
agem
ent a
nd re
med
iatio
n ac
tivity
*
Activ
ities
of h
ouse
hold
s as
em
ploy
ers
-10
IPPR | The state of pay Demystifying the gender pay gap14
FIGURE 2.9The gender pay gap tends to be lower in industries with lower median pay overallIndustry gender pay gaps (%), and median hourly pay (all employees), 2017
Notes: Industries are 2-digit Standard Industrial Classification (SIC) 2007; all available industry data has been included, but it should be noted that some estimates are considered to be low-quality. Source: ONS 2017a (Table 4.12) and ONS 2017b (Table 4.6a)
THE PAY GAP BY AGEThe pay gap is largest for women over the age of 40, particularly for those in full-time work. Women in their thirties working part-time earn more than part-time men, and this working pattern is sufficiently prevalent to produce a negative median pay gap for part-time working overall. However, as noted earlier, both women and men working part-time tend to earn a lower hourly wage than their full-time equivalents.
FIGURE 2.10The pay gap is largest for women over the age of 40Median gender pay gap (%), by age, by type of contract (2017)
Source: ONS 2017a (Table 6.12), 2018a
-30
-20
-10
0
10
20
30
40
50
0 5 10 15 20 25 30Gend
er p
ay g
ap (%
)
Median hourly pay (£, excl. overtime)
Financial service activities (excl insurance and pension funds)Veterinary activities
Manufacture of basic metalsWaste collection
-10
-5
0
5
10
15
20
16-17
18-21
22-2
9
30-39
40-49
50-59
60+
Overall g
ender
pay gap
Full-time Part-time

IPPR | The state of pay Demystifying the gender pay gap 15
THE PAY GAP BY REGIONThe gender pay gap varies across the nations and regions of the UK, and is likely to reflect regions’ different sectoral mixes, as well as the fact that company head offices are clustered in London and the South East. The pay gap is negative where pay itself is lowest – Northern Ireland – and highest where pay is highest, although in general, the relationship between the level of pay, and the size of the pay gap, looks weak. London has a high mean pay gap because a small number of employees are extremely well-remunerated, which skews the average.
FIGURE 2.11The pay gap varies significantly by regionMedian and mean gender pay gap, and median hourly gross earnings, by UK region (2017)
Source: ONS 2017a (Table 7.12 and Table 12 (for median earnings))
CONCLUSIONSThe UK has a gender pay gap. Even within the same tightly-defined occupation, across the economy as a whole, women earn less, on average, than men. This suggests that the solution lies in ensuring that women are given every opportunity to keep pace with male counterparts at work, through enlightened pay and progression policies.
Although occupational stratification is not the sole cause of the pay gap, it is one driver: women are over-represented in low-pay occupations. To tackle this ‘horizontal’ segregation, more young women need to be encouraged and supported to pursue high-pay occupations early on, and it needs to become easier to switch occupations mid-career.
The gender pay gap tends to be lower in industries where pay itself is also lower. This suggests that asking firms to focus on the pay gap in isolation will not be sufficient to ensure that women are engaged in good work that pays well.
The pay gap opens up at the age of 40 – the period when the demands of childcare are at their height – and persists for the remainder of a woman’s working life. Reducing the gender pay gap therefore requires an equalisation of the lifetime hours that men and women work, through both better return-to-work policies, and more men taking time out of the labour market and working flexibly, to distribute caring responsibilities more evenly.
Median Mean Median hourly pay
South East
East Midlands
South West
East
West Midlands
Yorksh
ire and
the Humber
North East
London
North W
est
Wales
Scotla
nd
Northern
Ireland 10
11
12
13
14
15
16
17
18
19
-5
0
5
10
15
20
25
Med
ian
full-
time
gros
s ho
urly
ear
ning
s (£
)
Gend
er p
ay g
ap (%
)

IPPR | The state of pay Demystifying the gender pay gap16
3. THE UK’S GENDER PAY GAPORGANISATION-LEVEL DATA
THE NEW GENDER PAY GAP REPORTING REQUIREMENTSNew legislation came into force in April 2017, which places a duty on all employers with more than 250 employees to publish their gender pay gap data every year. The first reporting deadline was 4 April 2018 (30 March 2018 for public sector employers), by which time employers were required to report a ‘snapshot’ of their payroll as of 5 April 2017 (Government Equalities Office 2017). This new data complements existing individual-level gender pay gap data, published through the Annual Survey of Hours and Earnings and analysed above.
Employers are required to report six pieces of information: the mean and median gender pay gap within their organisations; the mean and median bonus gap; the proportion of men and women that received a bonus; and the proportion of men and women in each pay quartile.
All employers have the option to provide a ‘supporting narrative’ document which provides context to the figures, and sets out what the organisation is doing to reduce its gender pay gap.
KEY RESULTS AT THE LEVEL OF THE ORGANISATIONThe 10,019 employers that have reported have an average pay gap of 12 per cent.10 Seventy-eight per cent report a gender pay gap, while 843 employers, 8 per cent of the total, report a pay gap of zero. Just 14 per cent report that median pay for women is higher than for men.
FIGURE 3.1 78 per cent of employers report a gender pay gapDistribution of median gender pay gap (%), reported by employers, 2017
Source: IPPR analysis of gender pay gap reporting (Gender Pay Gap Service 2018, data downloaded 13:15, 05/04/18)
10 All data correct as reported and available for download as of 5 April 2018
-200
-150
-100
-50
0
50
100
IPPR | The state of pay Demystifying the gender pay gap 17
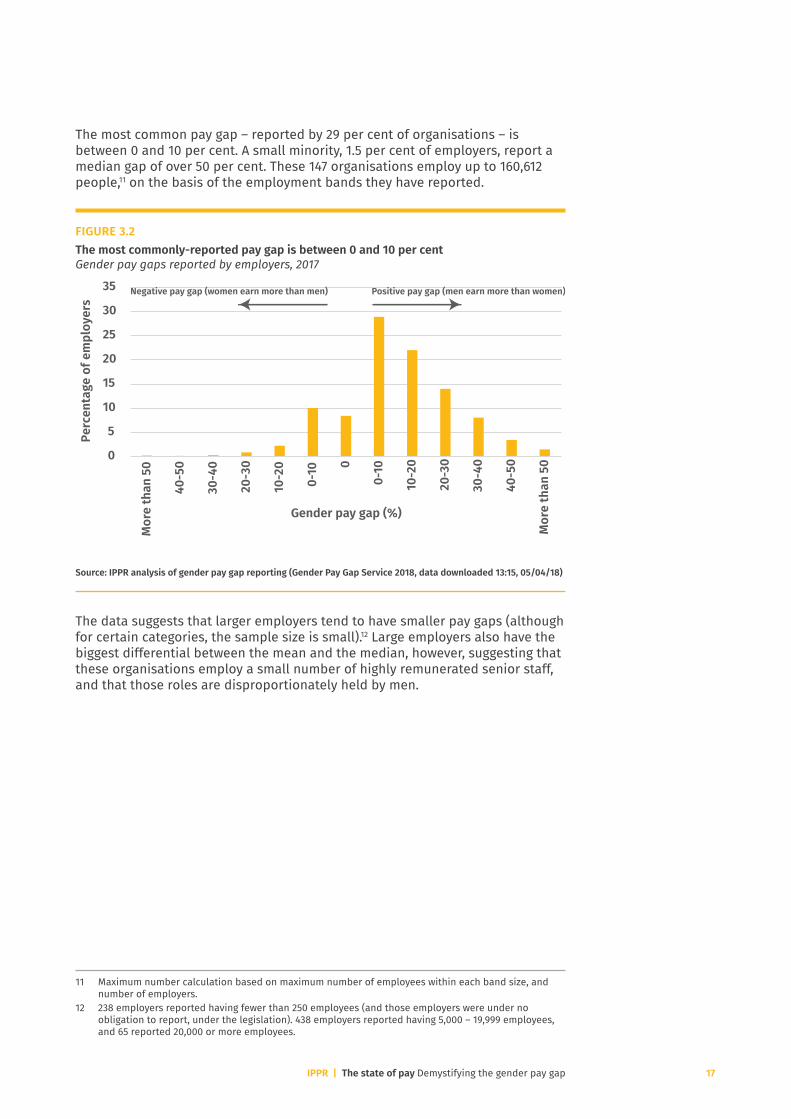
The most common pay gap – reported by 29 per cent of organisations – is between 0 and 10 per cent. A small minority, 1.5 per cent of employers, report a median gap of over 50 per cent. These 147 organisations employ up to 160,612 people,11 on the basis of the employment bands they have reported.
FIGURE 3.2 The most commonly-reported pay gap is between 0 and 10 per cent Gender pay gaps reported by employers, 2017
Source: IPPR analysis of gender pay gap reporting (Gender Pay Gap Service 2018, data downloaded 13:15, 05/04/18)
The data suggests that larger employers tend to have smaller pay gaps (although for certain categories, the sample size is small).12 Large employers also have the biggest differential between the mean and the median, however, suggesting that these organisations employ a small number of highly remunerated senior staff, and that those roles are disproportionately held by men.
11 Maximum number calculation based on maximum number of employees within each band size, and number of employers.
12 238 employers reported having fewer than 250 employees (and those employers were under no obligation to report, under the legislation). 438 employers reported having 5,000 – 19,999 employees, and 65 reported 20,000 or more employees.
0
5
10
15
20
25
30
35
Mor
e th
an 5
0
40-5
0
30-4
0
20-3
0
10-2
0
0-10 0
0-10
10-2
0
20-3
0
30-4
0
40-5
0
Mor
e th
an 5
0
Perc
enta
ge o
f em
ploy
ers
Gender pay gap (%)
Positive pay gap (men earn more than women)Negative pay gap (women earn more than men)
IPPR | The state of pay Demystifying the gender pay gap18
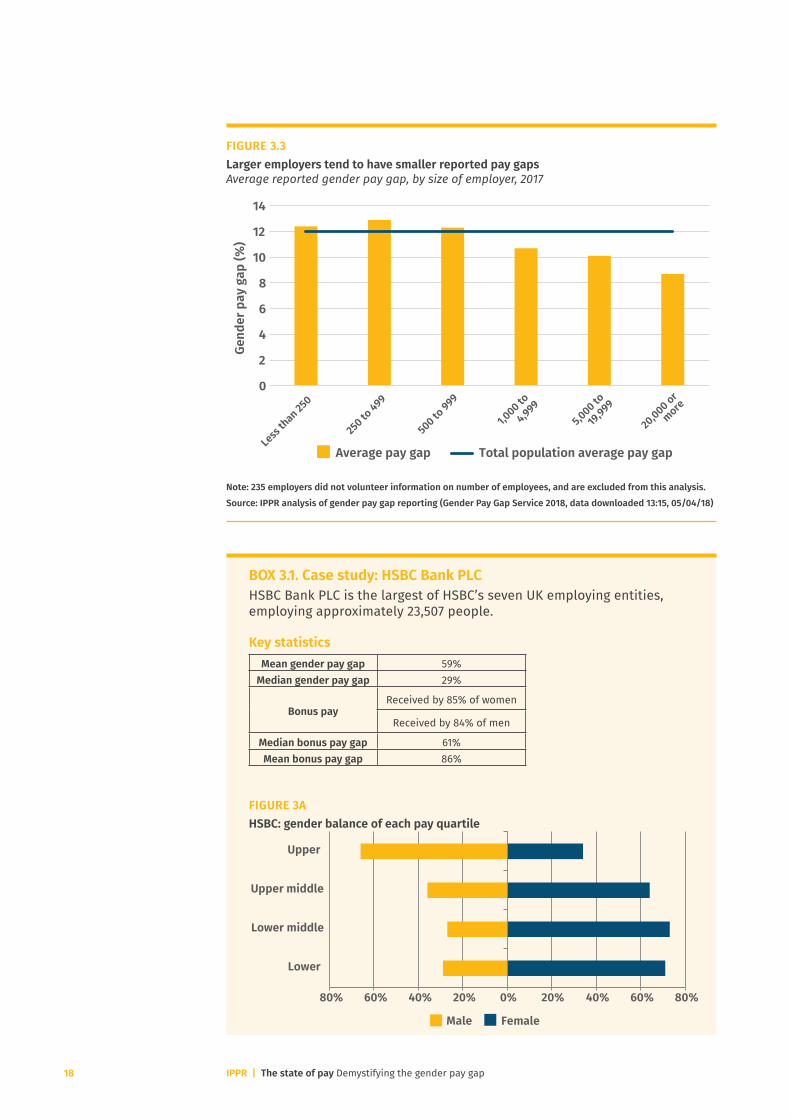
FIGURE 3.3 Larger employers tend to have smaller reported pay gapsAverage reported gender pay gap, by size of employer, 2017
Note: 235 employers did not volunteer information on number of employees, and are excluded from this analysis. Source: IPPR analysis of gender pay gap reporting (Gender Pay Gap Service 2018, data downloaded 13:15, 05/04/18)
BOX 3.1. Case study: HSBC Bank PLCHSBC Bank PLC is the largest of HSBC’s seven UK employing entities, employing approximately 23,507 people.
Key statisticsMean gender pay gap 59%
Median gender pay gap 29%
Bonus payReceived by 85% of women
Received by 84% of men
Median bonus pay gap 61% Mean bonus pay gap 86%
FIGURE 3AHSBC: gender balance of each pay quartile
0
2
4
6
8
10
12
14
Less
than 250
250 to
499
500 to 999
1,000 to
4,9995,000 to
19,999
20,000 or
more
Gend
er p
ay g
ap (%
)
Average pay gap Total population average pay gap
80% 60% 40% 20% 0% 20% 40% 60% 80%
Lower
Lower middle
Upper middle
Upper
FemaleMale
IPPR | The state of pay Demystifying the gender pay gap 19
Drivers of the gender pay gap HSBC has a pay gap because there are fewer women in senior leadership; the majority of its female staff are in more junior and lower-paid roles; and there is a higher prevalence of part-time working among women. The firm’s most senior roles are based in the UK, which explains why the mean pay gap is significantly larger than the median.
Although a similar proportion of men and women receive a bonus, part-time employees’ bonuses are calculated pro-rata, which means the bonus pay gap is larger than the hourly pay gap.
Company responseThe company has committed to the following actions to address its pay gap:• Signing up to the 30 per cent club: the campaign has a target of 30
per cent of senior leadership roles to be held by women by 2020. HSBC has also committed to creating gender-diverse shortlists for all senior leadership roles.
• Developing female talent to strengthen the leadership pipeline: it now looks for gender balance among its UK graduate intake, and encourages balanced representation in its internal progression programme for high-potential staff.
• Support for flexible working arrangements: through a new Flex Employee network, and the provision of parental leave ‘coaching’.
ConclusionHSBC is a large employer with a relatively gender-balanced workforce, but where the majority of the lowest-paid workers (in relative terms) are women. It could make an immediate difference to its pay gap by employing more men in junior roles, but by far the better response for long-run gender equality would be to focus on bringing more women into senior positions. That may, in the short-run, increase the pay gap, if it results in more female graduate trainees.
Aggregating gender pay gap data by industry13 suggests that for most sectors, the pay gaps within firms are smaller than for the industry in which they operate.
There are many possible reasons for this. Only large employers have to report their pay gaps, while the ONS ASHE covers all employers, and it may be that smaller firms have larger pay gaps (as this data set suggests). Organisations may specialise in particular occupations within an industry sector, reducing within-firm pay variation. Firms may also outsource low-paid elements of their work, which if predominantly done by women would act to reduce their gender pay gaps.
This result is significant because it suggests that tackling pay inequality at the level of the firm, although desirable, will not be sufficient to close the gender pay gap across the economy as a whole.
13 Note that the industry information is drawn from Companies House records, and is self-reported. It may be prone to inaccuracies, meaning our conclusions are tentative.

IPPR | The state of pay Demystifying the gender pay gap20
FIGURE 3.4 Organisation-level pay gaps are, on the whole, smaller than the industry average Organisations’ reported gender pay gaps (2017), averaged by industry, and industry average pay gaps (2017)
Note: *industry-average pay gap for water supply; sewerage, waste management and remediation activities is low-quality, so has been excluded from this analysis. Source: IPPR analysis of gender pay gap reporting (Gender Pay Gap Service 2018, data downloaded 13:15, 05/04/18) and ONS 2017a (Tables 4.12 and 16.12)
BOX 3.2. Case study: Walkers Snack Foods Ltd Walkers Snack Foods Ltd is one of four ‘employing entities’ against which its parent company, Pepsico, reports its gender pay gap. As of 5 April 2017, it employed 2,827 people in the UK, 77 per cent of which were male, 23 per cent female.
Key statisticsMean gender pay gap -8.1%
Median gender pay gap 10.1%
Bonus payReceived by 15.8% of women
Received by 8.4% of menMedian Bonus gender pay gap -20% Mean Bonus gender pay gap -74%
5
10
15
20
25
30
35
40Ge
nder
pay
gap
(%)
Organisations’ reported gaps averaged by industry
Industry-level average gap
Cons
truc
tion
Fina
ncia
l and
insu
ranc
e ac
tiviti
es
Educ
atio
n
Info
rmat
ion
and
com
mun
icat
ion
Elec
tric
ity, g
as, s
team
and
air
cond
ition
ing
supp
lyPr
ofes
sion
al, s
cien
tific
and
tech
nica
l aci
tiviti
es
Real
est
ate
activ
ities
Man
ufac
turin
g
Adm
inis
trat
ive
and
supp
ort s
ervi
ce a
ctiv
ities
Oth
er s
ervi
ce a
ctiv
ities
Tran
spor
tatio
n an
d st
orag
e
Who
lesa
le a
nd re
tail
trad
e; re
pair
of m
otor
veh
icle
s an
d m
otor
cycl
esW
ater
sup
ply;
sew
earg
e, w
aste
m
anag
emen
t and
rem
edia
tion*
Publ
ic a
dmin
istr
atio
n an
d de
fenc
e;
com
puls
ory
soci
al s
ecur
ity
Arts
, ent
erta
inm
ent a
nd re
crea
tion
Hum
an h
ealth
and
so
cial
wor
k ac
tiviti
esAc
com
mod
atio
n an
d fo
od s
ervi
ce a
ctiv
ities
IPPR | The state of pay Demystifying the gender pay gap 21
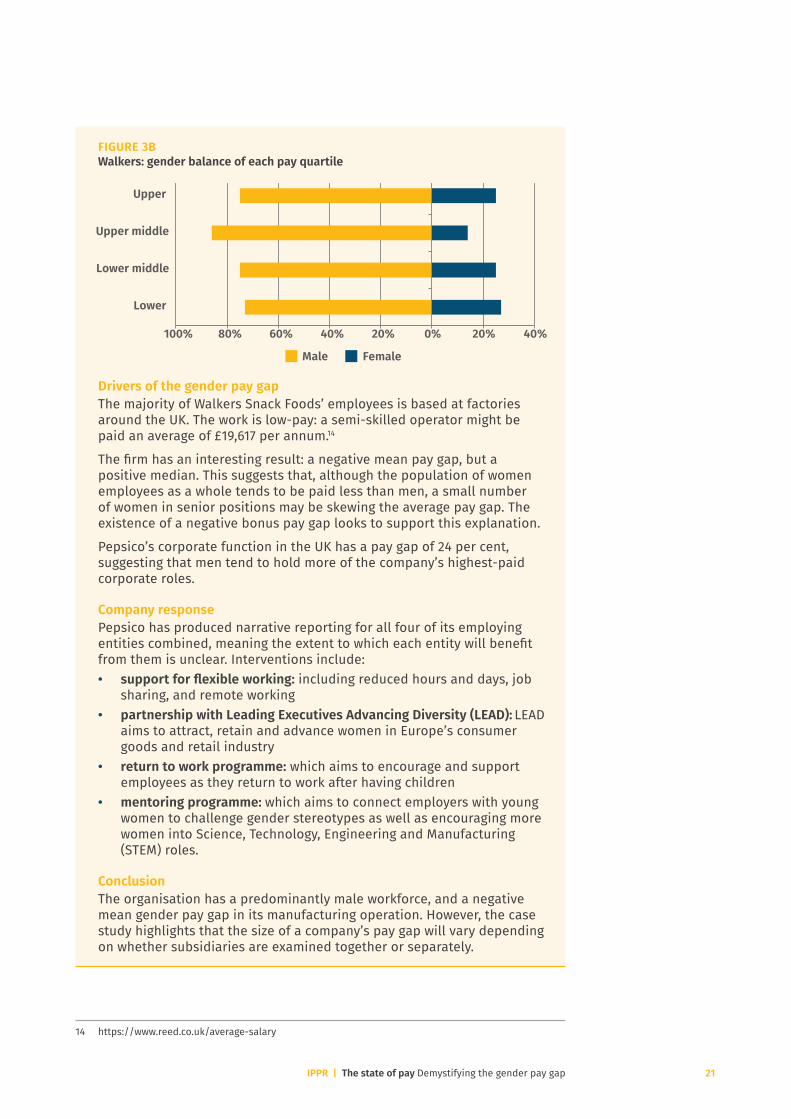
FIGURE 3B Walkers: gender balance of each pay quartile
Drivers of the gender pay gapThe majority of Walkers Snack Foods’ employees is based at factories around the UK. The work is low-pay: a semi-skilled operator might be paid an average of £19,617 per annum.14
The firm has an interesting result: a negative mean pay gap, but a positive median. This suggests that, although the population of women employees as a whole tends to be paid less than men, a small number of women in senior positions may be skewing the average pay gap. The existence of a negative bonus pay gap looks to support this explanation.
Pepsico’s corporate function in the UK has a pay gap of 24 per cent, suggesting that men tend to hold more of the company’s highest-paid corporate roles.
Company responsePepsico has produced narrative reporting for all four of its employing entities combined, meaning the extent to which each entity will benefit from them is unclear. Interventions include:• support for flexible working: including reduced hours and days, job
sharing, and remote working • partnership with Leading Executives Advancing Diversity (LEAD): LEAD
aims to attract, retain and advance women in Europe’s consumer goods and retail industry
• return to work programme: which aims to encourage and support employees as they return to work after having children
• mentoring programme: which aims to connect employers with young women to challenge gender stereotypes as well as encouraging more women into Science, Technology, Engineering and Manufacturing (STEM) roles.
ConclusionThe organisation has a predominantly male workforce, and a negative mean gender pay gap in its manufacturing operation. However, the case study highlights that the size of a company’s pay gap will vary depending on whether subsidiaries are examined together or separately.
14 https://www.reed.co.uk/average-salary
100% 80% 60% 40% 20% 0% 20% 40%
Lower
Lower middle
Upper middle
Upper
FemaleMale
IPPR | The state of pay Demystifying the gender pay gap22
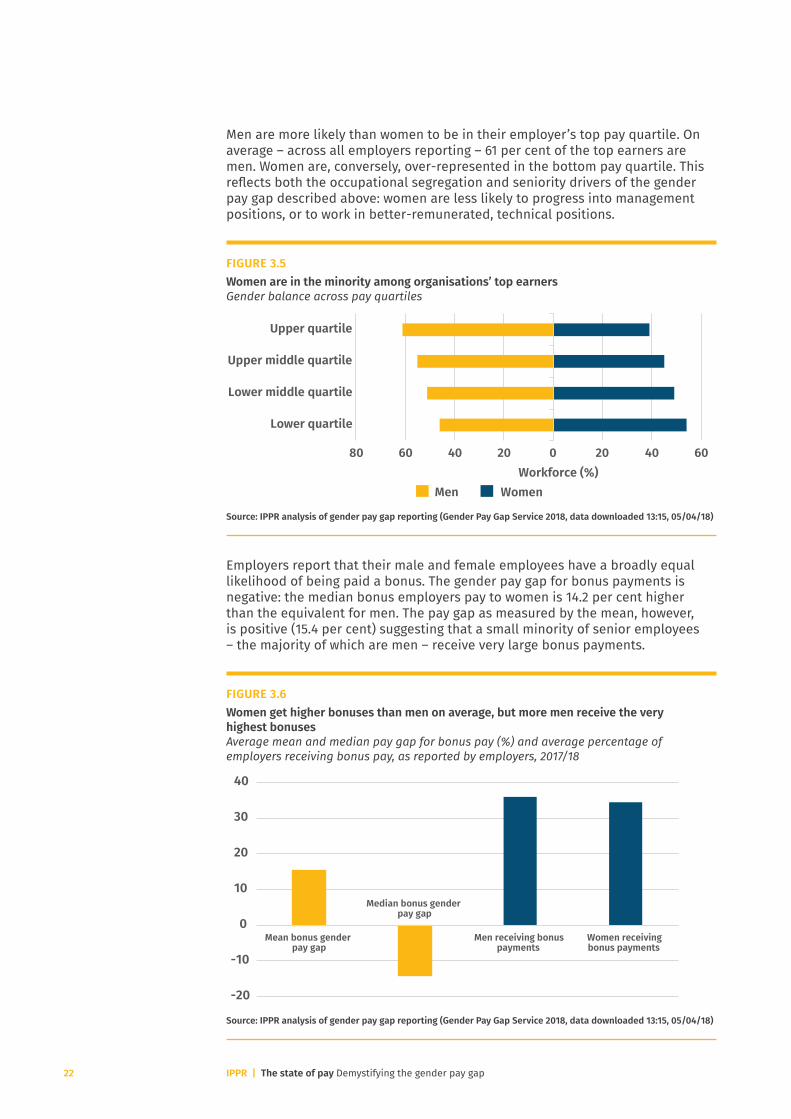
Men are more likely than women to be in their employer’s top pay quartile. On average – across all employers reporting – 61 per cent of the top earners are men. Women are, conversely, over-represented in the bottom pay quartile. This reflects both the occupational segregation and seniority drivers of the gender pay gap described above: women are less likely to progress into management positions, or to work in better-remunerated, technical positions.
FIGURE 3.5 Women are in the minority among organisations’ top earnersGender balance across pay quartiles
Source: IPPR analysis of gender pay gap reporting (Gender Pay Gap Service 2018, data downloaded 13:15, 05/04/18)
Employers report that their male and female employees have a broadly equal likelihood of being paid a bonus. The gender pay gap for bonus payments is negative: the median bonus employers pay to women is 14.2 per cent higher than the equivalent for men. The pay gap as measured by the mean, however, is positive (15.4 per cent) suggesting that a small minority of senior employees – the majority of which are men – receive very large bonus payments.
FIGURE 3.6 Women get higher bonuses than men on average, but more men receive the very highest bonuses Average mean and median pay gap for bonus pay (%) and average percentage of employers receiving bonus pay, as reported by employers, 2017/18
Source: IPPR analysis of gender pay gap reporting (Gender Pay Gap Service 2018, data downloaded 13:15, 05/04/18)
80 60 40 20 0 20 40 60
Lower quartile
Lower middle quartile
Upper middle quartile
Upper quartile
Workforce (%)WomenMen
-20
-10
0
10
20
30
40
Mean bonus genderpay gap
Median bonus genderpay gap
Men receiving bonuspayments
Women receivingbonus payments

IPPR | The state of pay Demystifying the gender pay gap 23
BOX 3.3. Case study: Deloitte UKDeloitte UK, a professional services firm, has two employment entities that it reports against: Deloitte LLP and Deloitte MCS Ltd. The table shows the figures for the whole of Deloitte UK which combines both legal entities as well as other employees who are managed by Deloitte UK but are not within the scope of the mandated disclosure.
Key statisticsMean gender pay gap 15.3%
Median gender pay gap 18.2%
Bonus payReceived by 62.4% of women
Received by 39.1% of menMedian Bonus gender pay gap 39.1% Mean Bonus gender pay gap 50.9%
FIGURE 3CDeloitte: gender balance of each pay quartile
Drivers of the gender pay gap As Deloitte has identified in its own analysis, the key driver of the gender pay gap is the lower representation of women at the top of the organisation: just 19 per cent of the firm’s partners are women. This helps to explain why the median bonus gap is large, and the mean larger: bonuses are generally higher the more senior the recipient.
Company responseIn 2012, Deloitte established a set of targets designed to ensure greater gender equality across the organisation. It set a target for 25 per cent of its partners to be women by 2020, rising to 30 per cent by 2025. In 2014, Deloitte published its ‘Women in Leadership’ gender balance action plan. This sets out a comprehensive strategy to drive gender equality including: • A focus on culture: including initiatives such as its Time Out scheme
(which enables employees to take four weeks' unpaid leave each year) and encouraging 'agile' working,15 as well as focusing on the inclusivity of the working environment
• Reviewing recruitment processes: to ensure that hiring processes at both entry level and for experienced hires successfully attract an equal share of women and men
15 More scope to work in a non-standard way, such as from home, on the move, or by adjusting hours informally.
80% 60% 40% 20% 0% 20% 40% 60%
Lower
Lower middle
Upper middle
Upper
FemaleMale

IPPR | The state of pay Demystifying the gender pay gap24
• Programmes targeted at 'pain points': including a Return to Work internship programme; a transitions coaching programme for primary carers returning from maternity/ parental leave; sponsorship programmes for senior female staff; and development of a talent pipeline for senior grades.
ConclusionThe organisation was an early adopter of measures designed to promote gender equality. Its experiences suggest that interventions take time to work – Deloitte set a modest target for partner representation at an eight-year horizon. This implies that those attempting to increase gender equality in their organisations should prepare to make a long-term effort, and not simply focus on year-to-year changes in their pay gap.
EMPLOYERS’ NARRATIVE REPORTING Some employers have published supplementary, narrative reporting alongside the data they are obliged to submit. The informational content of this additional information is variable: some employers have simply offered a repeat of the required figures; others have provided a more detailed narrative, offering both explanations for their gaps, and their proposed responses.
We have analysed a random sample of 20 employers’ additional reporting materials.16 The average pay gap for these employers is 14.8 per cent – higher than the pay gap for the employer population as whole. They also tend to have fewer women in the top pay quartile: 29 per cent, compared with a population average of 39 per cent. These details could indicate that employers with greater gender imbalance are more likely to provide additional materials accounting for their gender pay gaps, although the difference between the average pay gaps is not statistically significant.17 The sample’s pay gaps are shown in figure 3.7.
FIGURE 3.7 Our sample of employers had a higher average pay gap than the populationGender pay gaps of random sample of employers that provided supporting materials
Source: IPPR analysis of gender pay gap reporting (Gender Pay Gap Service 2018, data downloaded 13:15, 05/04/18)
16 Employers listed alphabetically with random number generator used to select 20 cases.17 Student’s t-test of the difference between the sample mean, and the population mean, with 19
degrees of freedom.
-5
0
5
10
15
20
25
30
35
Gend
er p
ay g
ap (%
)
Reported pay gaps of sample (n=20) Sample average
Population average

IPPR | The state of pay Demystifying the gender pay gap 25
Among the sample, the most popular reasons given for the existence of a gender pay gap, using the classification of factors described above, were seniority, occupational segregation, and part-time working. One employer referred to ‘lifestyle choices and career breaks’ as contributing factors – a veiled reference to women’s higher likelihood of taking time out of the labour market, or reducing their working hours, to care for children.
FIGURE 3.8The most common explanations given for a gap were seniority and occupational segregationFrequency of explanations for gender pay gap
Source: IPPR analysis of gender pay gap supplementary reporting
Employers also used their supplementary reporting to refer to strategies and activities for improving their gender pay gap. The most common actions they proposed are:• Reviewing recruitment policies, thinking about where and how vacancies
are advertised, who is involved in shortlisting and interviewing candidates, and routes into the sector or occupation: such measures could address occupational stratification, and tackle the pay gap that results from differing seniority of men and women. They would be even more effective if done alongside actions to change the nature of the roles themselves, such as offering them on a flexible basis by default.
• Schools-based programmes, to encourage girls to consider technical occupations and STEM careers: again, this could help to address occupational stratification. Such efforts may have a significant impact, but they would have a long incubation time, and they perhaps require a coordinated effort across a sector, rather than action by a single employer. They will not necessarily change the cultural characteristics of the STEM sectors, however, which may be off-putting to women otherwise qualified to take up a STEM job.
• In-work training and upskilling, with access to leadership and development programmes, skills training, and professional networks: these interventions would specifically target the seniority gap, as well as addressing historical skills gaps.
0
2
4
6
8
10
12
Num
ber o
f em
ploy
ers
Seniority
Occupatio
nal segregatio
n
Part-tim
e working
Motherhood pay penalty
Human capita
l
Discrim
ination and bias
IPPR | The state of pay Demystifying the gender pay gap26
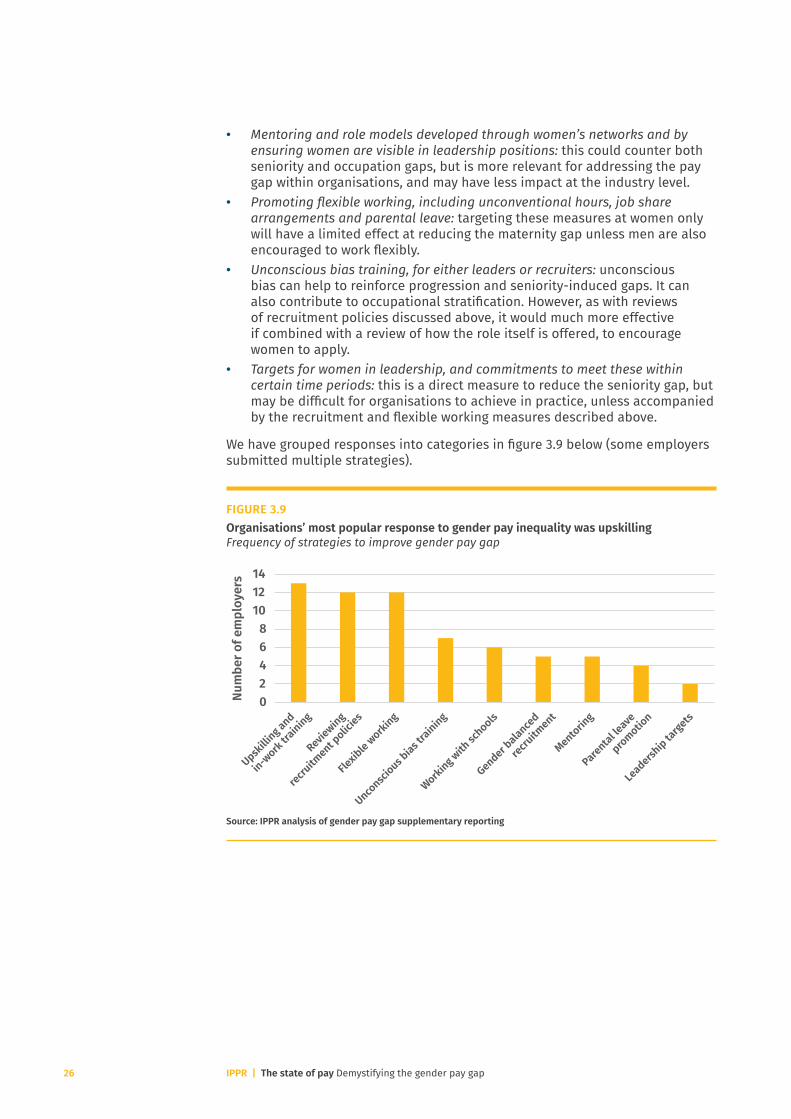
• Mentoring and role models developed through women’s networks and by ensuring women are visible in leadership positions: this could counter both seniority and occupation gaps, but is more relevant for addressing the pay gap within organisations, and may have less impact at the industry level.
• Promoting flexible working, including unconventional hours, job share arrangements and parental leave: targeting these measures at women only will have a limited effect at reducing the maternity gap unless men are also encouraged to work flexibly.
• Unconscious bias training, for either leaders or recruiters: unconscious bias can help to reinforce progression and seniority-induced gaps. It can also contribute to occupational stratification. However, as with reviews of recruitment policies discussed above, it would much more effective if combined with a review of how the role itself is offered, to encourage women to apply.
• Targets for women in leadership, and commitments to meet these within certain time periods: this is a direct measure to reduce the seniority gap, but may be difficult for organisations to achieve in practice, unless accompanied by the recruitment and flexible working measures described above.
We have grouped responses into categories in figure 3.9 below (some employers submitted multiple strategies).
FIGURE 3.9Organisations’ most popular response to gender pay inequality was upskillingFrequency of strategies to improve gender pay gap
Source: IPPR analysis of gender pay gap supplementary reporting
02468
101214
Num
ber o
f em
ploy
ers
Upskilli
ng and
in-work tr
aining
Reviewing
recruitm
ent polic
ies
Flexib
le working
Unconsci
ous bias t
raining
Working with
schools
Gender balance
d
recruitm
ent
Mentoring
Parental leave
promotion
Leadersh
ip targets

IPPR | The state of pay Demystifying the gender pay gap 27
BOX 3.4. Case study: Phase EightPhase Eight is a British women’s fashion design and retail business. Over the last ten years, it has grown significantly and now has more than 430 stores globally, all selling its design-led branded products. The company’s reported turnover in 2016 was £198 million.
Key statisticsMean gender pay gap 64.8%
Median gender pay gap 54.5%
Bonus payReceived by 75% of womenReceived by 18.2% of men
Median bonus pay gap 62.4% Mean bonus pay gap 22%
FIGURE 3DPhase Eight: gender balance of each pay quartile
Drivers of the gender pay gapPhase Eight’s workforce is predominantly female, with a smaller number of senior, well-paid men, the majority of whom are based at its head office in London. As of 5 April 2017, Phase Eight employed 1754 people, 44 of which were male (2.5 per cent of the workforce) – and 39 are based at the company’s head office. Head office jobs tend to pay more than shop floor roles.
It is important to note that the problem is not a lack of women in leadership roles: women are well-represented in the top pay quartile. The pay gap is the size it is because senior staff are only a small proportion of the female workforce – it is the large, predominantly female shop floor workforce that drives the pay differential. Phase Eight’s centralised corporate structure, and the concentration of top jobs in London, may constrain the potential to promote shop floor staff to corporate roles, although there is movement between the two types of role.
Company responseThe company argues that the main barrier to reducing the gender pay gap is the concentration of its male workforce in more senior, corporate roles, and demonstrates that removing corporate staff from the calculations means the gender pay gap is positive in women’s favour. However, the pay gap is not about balance at the top: it’s the result of a female shop floor workforce.
20% 0% 20% 40% 60% 80% 100%
Lower
Lower middle
Upper middle
Upper
FemaleMale
IPPR | The state of pay Demystifying the gender pay gap28
Phase Eight sets out a number of actions to tackle its current gender pay gap:• more actively promoting policies on flexible working and
shared parental leave• providing additional training and development to
encourage progression• providing unconscious bias training to employees• ensuring that pay decisions are appropriately moderated.
ConclusionPhase Eight has a pay gap because it is a predominantly female employer, with the few men that do work there employed in corporate rather than shop floor roles. It is right to want to increase the number of women at the top of the organisation. But this is unlikely to make much of a difference to the pay gap. To do that, the company would need to either ‘level up’, and raise the wages of shop floor staff, ‘level down’, and either reduce the pay of the senior staff or employ more men on the shop floor (which the limited number of applications renders impractical), or to outsource or franchise out the lowest-paid work. Only the first of these options would be desirable from a gender equality perspective.
CONCLUSIONS The first year of organisation-level reporting has revealed that 78 per cent of large employers have a gender pay gap.
For most industry sectors, the average pay gap within a firm was smaller than the pay gap across the sector as a whole. Although this result is tentative, it is significant because it suggests that relying on firms to reduce the gender pay gap will not fully address gender pay inequality.
A deep-dive on a small number of employers highlights the pitfalls of focusing on the gender pay gap to the exclusion of all other metrics of gender equality. In many cases, it would be possible for a firm to reduce its pay gap by taking action that could be detrimental to women, such as outsourcing low-wage work, or hiring fewer women graduate trainees.
The pay gap is a very blunt instrument; the potential for ‘gaming’ is therefore high, and could be an unintended consequence of sensationalist reporting of individual organisations’ pay gaps.

IPPR | The state of pay Demystifying the gender pay gap 29
RECOMMENDATIONS
Below we consider the actions firms could take in response to the information now available to them as a result of the new reporting requirements, over and above the sorts of interventions they have pledged to take, which we sampled above.
We believe it is vital that firms consider the spirit of the regulations, rather than focusing exclusively on the small number of summary statistics they are asked to report. This may mean experiencing a widening of the gender pay gap in the short-term, to bring about greater equality in the long-run.
Our recommendations are tentative at this stage. We would like to undertake further work to explore them in more depth. A future project will consider the changes we might wish to see to the pay gap reporting requirements.
1. Employers should rethink policies around pay negotiation Women are less likely to negotiate on pay, both upon being offered a job, and once within an organisation (Leibrandt and List 2014). Given that negotiation will result in a higher salary at least some of the time, this contributes to the gender pay gap.
There are four contrasting ways that organisations could tackle women’s lower propensity to negotiate:
– They could rule out or limit the possibility of negotiation: if men are more likely to negotiate than women, then a ‘no negotiation’ policy would eliminate the risk that negotiation unfairly benefits one gender over another. This would mean an employer advertising a precise salary during a recruitment process, rather than a range or a minimum. The civil service uses a version of this approach: recruiters cannot offer more than 20 per cent above the advertised salary without getting approval from the Civil Service Commission (CSC 2018).
– They could state explicitly in job advertisements that salaries are negotiable: a recent randomised control trial (RCT) found that women were equally likely to negotiate on salary as men where the possibility of negotiation was made explicit (Leibbrandt and List 2014). Firms could therefore consider adding a line to their adverts inviting negotiation.
– They could introduce a policy of proxy negotiations: the same study found that if women were asked to negotiate salaries on behalf of other women, differences in pay between men and women were reduced (ibid). Of course, such an approach may not be welcomed by all women, who feel themselves perfectly able to negotiate on their own behalf, so would need to be optional rather than mandatory.
– They could mirror or match salary offers made to men: by committing to pay all existing employees, or employees at the same level as the appointee, at least as much as they pay the new recruit, employers would both increase the cost of agreeing to the higher salary, and reduce the role that negotiation plays in the pay gap.
2. Employers should introduce a more structured approach to progressionAnalysis of the gender pay gap by occupation pointed to the differing level of seniority within occupations – or vertical segregation – as being a key driver of the gender pay gap. One reason for this is women’s lower propensity to put themselves forward for senior roles (Gino et al 2015).
IPPR | The state of pay Demystifying the gender pay gap30
Employers propose leadership targets in their narrative materials as a way of getting more women into senior roles, but another way could be to reduce the ad hoc approach to promotion and progression, to ensure that employees are automatically considered for a step up after a given length of time in post. Firms could also consider a policy of agreeing to interview all internal candidates for a post, alongside encouraging more women to apply for internal promotions, through mentoring and other developmental support. The Confederation of British Industry has recommended that managers be appraised on their performance at developing their staff - an idea we support.18
3. Employers should encourage more men to work flexibly, and to take time out for caring responsibilitiesThe gap between full-time versus part-time pay, and the greater likelihood of women to want to work part-time and take time out of the labour market, are mutually reinforcing drivers of the gender pay gap. If more men were to work non-standard hours, and to take time out of the labour market, it would start to normalise flexible working, and eliminate the substantive differences between the sorts of roles done on a part-time basis, versus those that tend to be done full-time.
This sits in contrast to the usual policies around flexible working, which tend to focus on women rather than men. But this misses the reality of the maternity penalty, which is that it reflects, at least in part, differences in the hours ‘clocked up’ at work by men relative to women – which allowing women to work flexibly will not address. Reducing that difference requires movement in both directions: better, more accessible return-to-work opportunities for women, and men taking a greater share of caring responsibilities.
The latter could take the form of policies like dedicated, paid paternity leave offered on a ‘use it or lose it’ basis, advertising roles as flexible by default to ‘normalise’ the idea of flexible working, and encouraging men, and senior men in particular, to partake in job share arrangements.
4. Employers should commit to publishing narrative reports alongside their pay gapsThe pay gap data provides only one, porthole-sized window on the nature of gender equality within a firm. An employer can have a small pay gap within one of its employing entities, yet still have a large gap across its business as a whole (which it is not required to report). It may be able to reduce its gap by taking its low-paid work ‘off book’ and outsourcing. And conversely, desirable behaviours that would promote genuine equality over the long run, such as recruiting more women graduate trainees, may increase the pay gap for a period of years, before causing it to narrow.
To ensure that users of the firm-level data do not focus exclusively on the pay gap numbers, we recommend that firms take the initiative, and publish a short report to place their figures in context. Some firms have done this in their first year of reporting; we would like to see more firms committing to do this alongside their next release, in 2019. This will be particularly important in future years, as firms feel the pressure to demonstrate an improvement in their pay gap over time.
We would also like to see firms reporting additional workforce data – such as the numbers of men and women working flexibly (to support the previous recommendation), the numbers of men and women employed overall, and the average length of service and turnover for men and women.
18 See: http://www.cbi.org.uk/time-for-action-/Recommendations.html

IPPR | The state of pay Demystifying the gender pay gap 31
REFERENCES
Alakeson C (2012) The price of motherhood: women and part-time work, Resolution Foundation. http://www.resolutionfoundation.org/publications/price-motherhood-women-part-time-work/
Brynin M (2017) The gender pay gap, EHRC. https://www.equalityhumanrights.com/sites/default/files/research-report-109-the-gender-pay-gap.pdf
Chamberlain A (2016) Demystifying the gender pay gap: evidence from Glassdoor salary data, Glassdoor. https://www.glassdoor.com/research/app/uploads/sites/2/2016/03/Glassdoor-Gender-Pay-Gap-Study.pdf
Chartered Institute of Personnel and Development [CIPD] (2015) ‘Gender diversity in the boardroom’. https://www.cipd.co.uk/knowledge/fundamentals/relations/diversity/boardroom-report
Chartered Management Institute [CMI] (2017) A broken pipeline: men in management jobs are more likely to be promoted than women. http://www.managers.org.uk/~/media/Files/PDF/Infographics/Gender-Salary-Survey-Infographic-2016.pdf
Civil Service Commission [CSC] (2015), 'Recruitment Principles 2018'. http://civilservicecommission.independent.gov.uk/civil-service-recruitment/
Costa Dias M, Joyce R and Pardodi F (2018) The gender pay gap in the UK: children and experience in work, Institute for Fiscal Studies. https://www.ifs.org.uk/publications/10356
Department for Business, Energy and Industrial Strategy [BEIS] (2018) ‘New ‘Share the joy’ campaign promotes shared parental leave rights for parents’, 12 February 2018. https://www.gov.uk/government/news/new-share-the-joy-campaign-promotes-shared-parental-leave-rights-for-parents
Equal Pay Act 1970. http://www.legislation.gov.uk/ukpga/1970/41/section/1/enacted Equality and Human Rights Commission [EHRC] (2015) Pregnancy and maternity-related
discrimination and disadvantage first findings: surveys of employers and mothers, EHRC. https://www.equalityhumanrights.com/en/publication-download/pregnancy-and-maternity-related-discrimination-and-disadvantage-first-findings
Equality and Human Rights Commission [EHRC] (2017) Closing the gap: enforcing the gender pay gap regulations, EHRC. https://www.equalityhumanrights.com/sites/default/files/gender-pay-gap-enforcing-the-regulations.pdf
Equality and Human Rights Commission [EHRC] (2018) ‘Equal pay for equal work: what the law says’. https://www.equalityhumanrights.com/en/advice-and-guidance/equal-pay-equal-work-what-law-says
Gender Pay Gap Service (2018) ‘Gender pay gap data, 2017-2018’. https://gender-pay-gap.service.gov.uk/viewing/download
Gino F, Wilmuth C and Wood Brooks A (2015) ‘Compared to men, women view professional advancement as equally attainable, but less desirable’, PNAS, 112(40) pp12354–12359
Government Equalities Office (2017) ‘Guidance. Gender pay gap reporting: overview’. https://www.gov.uk/guidance/gender-pay-gap-reporting-overview
Hall M (2013) ‘Up to 50,000 women a year can’t return to jobs after maternity leave, study finds’, The Telegraph, 27 August 2013. https://www.telegraph.co.uk/finance/personalfinance/10267223/Up-to-50000-women-a-year-cant-return-to-jobs-after-maternity-leave-study-finds.html
Higher Education Statistics Agency [HESA] (2017) ‘What is the gender breakdown in higher education?’. https://www.hesa.ac.uk/data-and-analysis/students
Leibbrandt A and List J A (2014) ‘Do Women Avoid Salary Negotiations? Evidence from a Large-Scale Natural Field Experiment’. Management Science, 61( 9) pp2016-2024
IPPR | The state of pay Demystifying the gender pay gap32
Ministry of Justice [MOJ] (2018) ‘Tribunals and gender recognition certificate statistics quarterly: October to December 2017 - Annex C: Employment Tribunal receipts tables’. https://www.gov.uk/government/statistics/tribunals-and-gender-recognition-certificate-statistics-quarterly-october-to-december-2017
OECD (2017) ‘Gender wage gap’. https://data.oecd.org/earnwage/gender-wage-gap.htm OECD (2018) ‘LFS by sex and age – indicators’. https://stats.oecd.org/Index.
aspx?DataSetCode=LFS_SEXAGE_I_R Office for National Statistics [ONS] (2017a) ‘ASHE 1997 to 2017 selected estimates’.
https://www.ons.gov.uk/employmentandlabourmarket/peopleinwork/earningsandworkinghours/datasets/ashe1997to2015selectedestimates
Office for National Statistics [ONS] (2017b) ‘Industry (2 digit SIC) - ASHE: Table 4’. https://www.ons.gov.uk/employmentandlabourmarket/peopleinwork/earningsandworkinghours/datasets/industry2digitsicashetable4
Office for National Statistics [ONS] (2017c) ‘Occupation (4 digit SOC) - ASHE: Table 14’. https://www.ons.gov.uk/employmentandlabourmarket/peopleinwork/earningsandworkinghours/datasets/grossweeklyearningsbyoccupationearn06
Office for National Statistics [ONS] (2017d) Table 14.5a of 'Occupation (4 digit SOC) - ASHE: Table 14'. https://www.ons.gov.uk/employmentandlabourmarket/peopleinwork/earningsandworkinghours/datasets/occupation4digitsoc2010ashetable14
Office for National Statistics [ONS] (2018a) ‘Understanding the gender pay gap in the UK’. https://www.ons.gov.uk/employmentandlabourmarket/peopleinwork/earningsandworkinghours/articles/understandingthegenderpaygapintheuk/2018-01-17
Office for National Statistics [ONS] (2018b) ‘EMP01 SA: Full-time, part-time and temporary workers (seasonally adjusted)’. https://www.ons.gov.uk/employmentandlabourmarket/peopleinwork/employmentandemployeetypes/datasets/fulltimeparttimeandtemporaryworkersseasonallyadjustedemp01sa
Office for National Statistics [ONS] (2018c) ‘EARN06: Gross weekly earnings by occupation’. https://www.ons.gov.uk/employmentandlabourmarket/peopleinwork/earningsandworkinghours/datasets/grossweeklyearningsbyoccupationearn06
Office for National Statistics [ONS] (2018d) ‘EMP13: Employment by industry’. https://www.ons.gov.uk/employmentandlabourmarket/peopleinwork/employmentandemployeetypes/datasets/employmentbyindustryemp13
Office for National Statistics [ONS] (2018e) ‘EMP04: Employment by occupation’. https://www.ons.gov.uk/employmentandlabourmarket/peopleinwork/employmentandemployeetypes/datasets/employmentbyoccupationemp04
Office for National Statistics [ONS] (2018f) ‘ONS Standard Occupational Classification (SOC) Hierarchy’, https://onsdigital.github.io/dp-classification-tools/standard-occupational-classification/ONS_SOC_hierarchy_view.html
Polachek S (2004) How the human capital model explains why the gender wage gap narrowed, IZA Institute for the Study of Labor. http://ftp.iza.org/dp1102.pdf
Purcell (2006) Looking through the glass ceiling: a detailed investigation of the factors that contribute to gendered career inequalities, Warwick Institute for Employment Research. https://warwick.ac.uk/fac/soc/ier/research/completed/ltgc/ esfreportfinal.pdf
TUC (2016) Still just a bit of banter?, TUC. https://www.tuc.org.uk/research-analysis/reports/still-just-bit-banter
TUC/IPPR (2016) The motherhood pay penalty, TUC. https://www.tuc.org.uk/sites/default/files/MotherhoodPayPenalty.pdf
Woodhams C, Lupton B, and Cowling M (2014) ‘The presence of ethnic minority and disabled men in feminised work: intersectionality, vertical segregation and the glass escalator’, Sex Roles, 72(7-8), pp277-293

IPPR | The state of pay Demystifying the gender pay gap 33
GLOSSARY
Equal pay: Men and women in the same employment performing equal work must receive equal pay, as set out in the Equality Act 2010.
Flexible working: Any type of working pattern which is different from full-time working within a standard pattern for a given occupation or sector. It can include: job sharing (holding a post with another employee), compressed hours (working fewer days but the same number of hours), flexi-time (working a set number of hours at any time convenient, sometimes with core hours defined), working from home, or working part-time.
Full-time hours: A working pattern of 30 or more hours per week.
Gender pay gap: Measure of the difference between men’s and women’s average earnings across an organisation or the labour market, expressed as a percentage of men’s earnings. It is most commonly calculated as the difference between men and women’s median gross hourly earnings, expressed as a percentage of men’s median gross hourly earnings. A positive pay gap means men are paid more than women, on average; a negative pay gap means women are paid more, on average, than men.
Maternity pay penalty: The pay gap between working mothers and women with similar characteristics, but without dependent children.
Mean gross hourly earnings: Average of all employees’ hourly before-tax earnings in a given sample or population, calculated as the sum of all employees’ hourly before-tax earnings, divided by the number of employees in the sample or population.
Median gross hourly earnings: Mid-point of all employees’ hourly before-tax earnings in a given sample or population, when ordered from lowest to highest.
Occupational stratification/segregation by gender: The phenomenon that certain roles are predominantly done by one gender. Examples include driving work (which is a predominantly male occupation), and midwifery (predominantly done by women).
Population: All employees or employers from which a sample can be drawn and results generalised to.
Sample: Sub-section of the population on which analysis has been conducted.
Unconscious bias: Occurs when people favour others who look like them and/or share their values, based on stereotypes or prejudices people are not aware that they have or that they are acting upon.

IPPR | The state of pay Demystifying the gender pay gap34

IPPR | The state of pay Demystifying the gender pay gap 35

IPPR | The state of pay Demystifying the gender pay gap36
Institute for Public Policy Research

GET IN TOUCHFor more information about the Institute for Public Policy Research, please go to www.ippr.org
You can also call us on +44 (0)20 7470 6100, e-mail [email protected] or tweet us @ippr
Institute for Public Policy ResearchRegistered Charity no. 800065 (England & Wales), SC046557 (Scotland), Company no, 2292601 (England & Wales)
The progressive policy think tank