institut fÜr technische optik annual report … · institut fÜr technische optik, ... spectrum of...
TRANSCRIPT
INSTITUT FÜRTECHNISCHE OPTIKUNIVERSITÄT STUTTGART
annual report2 0 1 1 / 2 0 1 2
INSTITUT FÜR TECHNISCHE OPTIKUNIVERSITÄT STUTTGART
Prof. Dr. W. Osten
ANNUAL REPORT 2011/2012
Pfaffenwaldring 9D-70569 Stuttgart
Tel.: +49(0)711 685-66075Fax: +49(0)711 685-66586
http://www.uni-stuttgart.de/ito

RESEARCH PROJECTS
Research projects INSTITUT FÜR TECHNISCHE OPTIK, ANNUAL REPORT 2011/2012
67
Optical methods for assessment of transport and age induced damages on artworks ............................................................................... 68 Supported by: DFG (OS 111/34-1)Project: „Die materielle Veränderung von Kunst durch Transporte“
High resolution 3D microscopy using opposed-view dark-field digital holography ........................................................................................... 69 Supported by: DFG (OS 111/32-1)Project: “High resolution 3D microscopy using opposed-view dark-field digital holography”
3D UV holographic microscope for biomedical imaging .............................................. 72 Supported by: DFG (OS111/19-3)Project: “Digitale Holographie mit adaptiver Wellenfrontformung zur hochauflösenden Untersuchung von 3D-Mikrostrukturen im tiefen UV-Bereich”
Knowledge management in virtual labs and remote experiments ................................ 73 Supported by: Ministerium für Wissenschaft, Forschung und Kunst Baden-Wuerttemberg (MWK)Project: „BW-eLAB“
Compression of digital holograms ................................................................................. 75
Nanometric in-plane displacement measurement using phase singularities ............... 76 Supported by: DAAD
Short temporal coherence digital holography with a femtosecond frequency comb laser for optical sectioning .......................................... 77
Holographic recording of incoherently illuminated or self-luminous objects ............... 78 Supported by: Alexander von Humboldt foundation
Phase retrieval with resolution enhancement by using random-phase illumination ...... 79 Supported by: Alexander von Humboldt foundation
Structured illumination for resolution enhancement and autofocusing in digital holographic microscopy ..................................................... 80 Supported by: Alexander von Humboldt foundation
Coherent Metrology
INSTITUT FÜR TECHNISCHE OPTIK, ANNUAL REPORT 2011/2012 Research projects
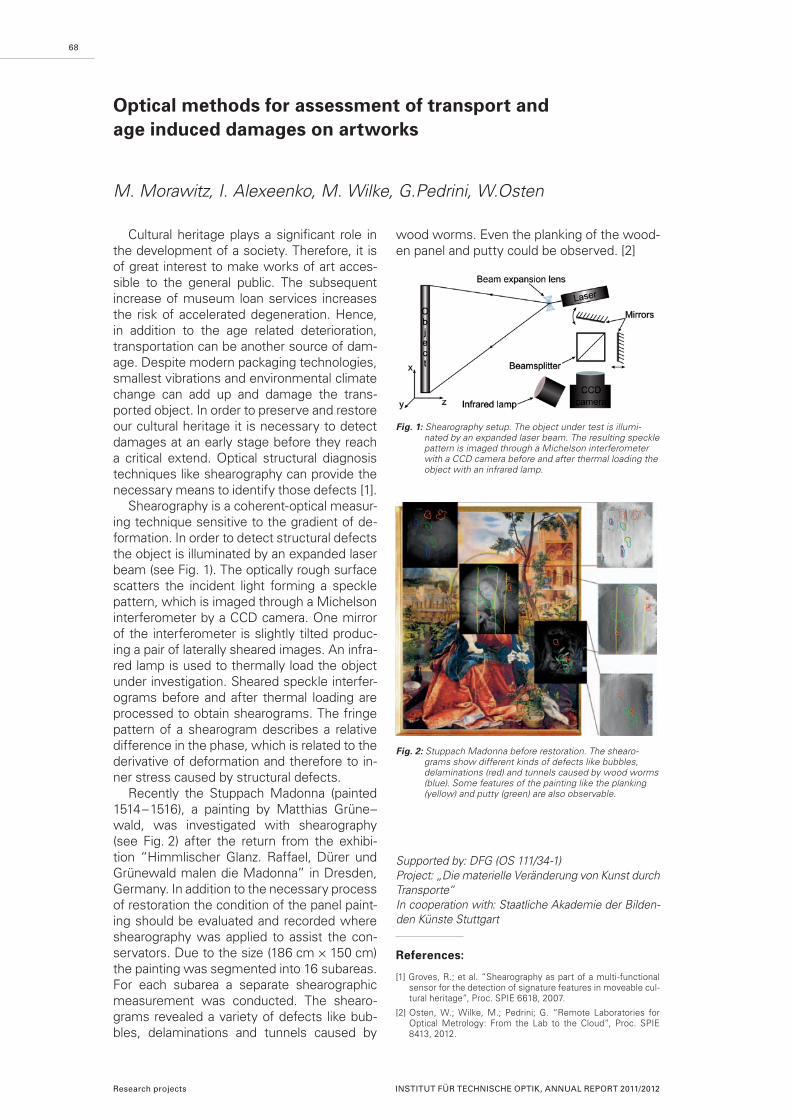
Cultural heritage plays a significant role in the development of a society. Therefore, it is of great interest to make works of art acces-sible to the general public. The subsequent increase of museum loan services increases the risk of accelerated degeneration. Hence, in addition to the age related deterioration, transportation can be another source of dam-age. Despite modern packaging technologies, smallest vibrations and environmental climate change can add up and damage the trans-ported object. In order to preserve and restore our cultural heritage it is necessary to detect damages at an early stage before they reach a critical extend. Optical structural diagnosis techniques like shearography can provide the necessary means to identify those defects [1].
Shearography is a coherent-optical measur-ing technique sensitive to the gradient of de-formation. In order to detect structural defects the object is illuminated by an expanded laser beam (see Fig. 1). The optically rough surface scatters the incident light forming a speckle pattern, which is imaged through a Michelson interferometer by a CCD camera. One mirror of the interferometer is slightly tilted produc-ing a pair of laterally sheared images. An infra-red lamp is used to thermally load the object under investigation. Sheared speckle interfer-ograms before and after thermal loading are processed to obtain shearograms. The fringe pattern of a shearogram describes a relative difference in the phase, which is related to the derivative of deformation and therefore to in-ner stress caused by structural defects.
Recently the Stuppach Madonna (painted 1514 – 1516), a painting by Matthias Grüne–wald, was investigated with shearography (see Fig. 2) after the return from the exhibi-tion “Himmlischer Glanz. Raffael, Dürer und Grünewald malen die Madonna” in Dresden, Germany. In addition to the necessary process of restoration the condition of the panel paint-ing should be evaluated and recorded where shearography was applied to assist the con-servators. Due to the size (186 cm × 150 cm) the painting was segmented into 16 subareas. For each subarea a separate shearographic measurement was conducted. The shearo-grams revealed a variety of defects like bub-bles, delaminations and tunnels caused by
wood worms. Even the planking of the wood-en panel and putty could be observed. [2]
Supported by: DFG (OS 111/34-1)Project: „Die materielle Veränderung von Kunst durch Transporte“ In cooperation with: Staatliche Akademie der Bilden-den Künste Stuttgart
References:
[1] Groves, R.; et al. “Shearography as part of a multi-functional sensor for the detection of signature features in moveable cul-tural heritage”, Proc. SPIE 6618, 2007.
[2] Osten, W.; Wilke, M.; Pedrini; G. “Remote Laboratories for Optical Metrology: From the Lab to the Cloud”, Proc. SPIE 8413, 2012.
68
Optical methods for assessment of transport and age induced damages on artworks
M. Morawitz, I. Alexeenko, M. Wilke, G.Pedrini, W.Osten
Fig. 2: Stuppach Madonna before restoration. The shearo-grams show different kinds of defects like bubbles, delaminations (red) and tunnels caused by wood worms (blue). Some features of the painting like the planking (yellow) and putty (green) are also observable.
Fig. 1: Shearography setup. The object under test is illumi-nated by an expanded laser beam. The resulting speckle pattern is imaged through a Michelson interferometer with a CCD camera before and after thermal loading the object with an infrared lamp.
Research projects INSTITUT FÜR TECHNISCHE OPTIK, ANNUAL REPORT 2011/2012
69
The aim of this DFG project is to develop a label-free three-dimensional microscopy sys-tem to enhance the spatio-temporal resolu-tion and the contrast in imaging of complex biological samples. The lateral resolving pow-er of an optical system is diffraction-limited according to Abbe Criterion. Considering the fact that complex specimens consist of dif-ferent materials in various layers, there are some practical obstacles that prevent achiev-ing the theoretical resolution, e.g. the diffrac-tion patterns coming from the upper layers. Here, we are developing a coherent micros-copy method to overcome this limitation us-ing an opposed-view approach.
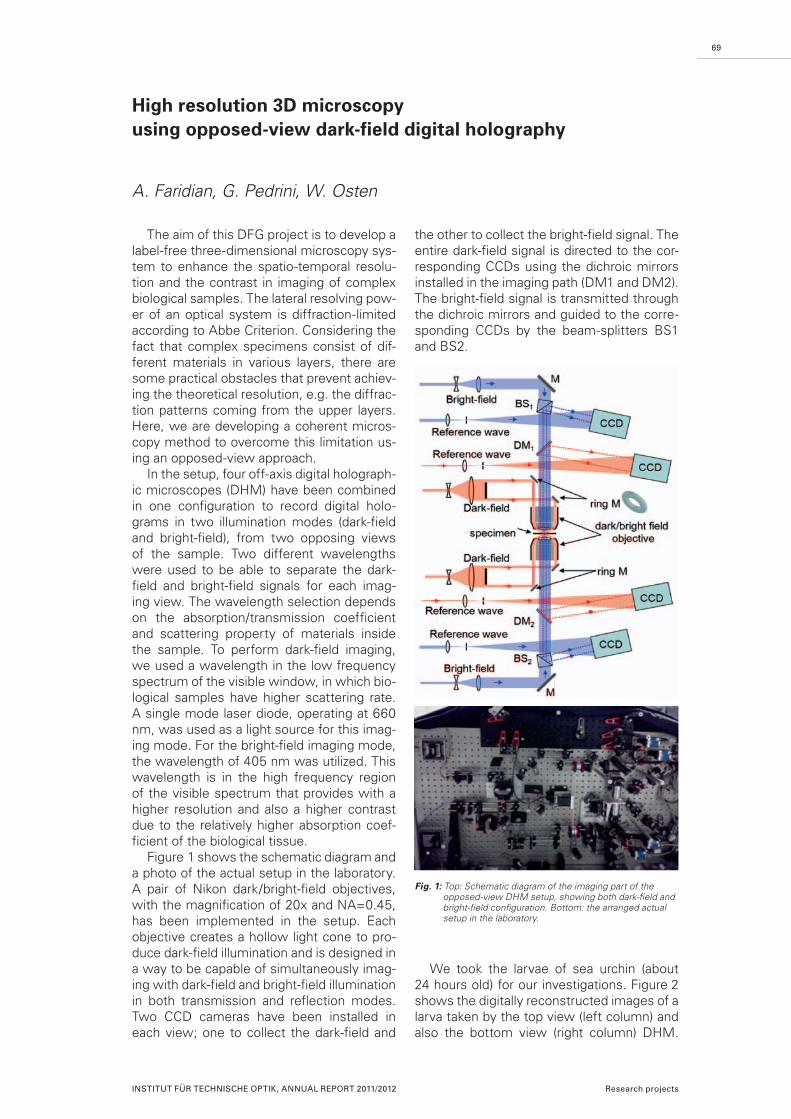
In the setup, four off-axis digital holograph-ic microscopes (DHM) have been combined in one configuration to record digital holo-grams in two illumination modes (dark-field and bright-field), from two opposing views of the sample. Two different wavelengths were used to be able to separate the dark-field and bright-field signals for each imag-ing view. The wavelength selection depends on the absorption/transmission coefficient and scattering property of materials inside the sample. To perform dark-field imaging, we used a wavelength in the low frequency spectrum of the visible window, in which bio-logical samples have higher scattering rate. A single mode laser diode, operating at 660 nm, was used as a light source for this imag-ing mode. For the bright-field imaging mode, the wavelength of 405 nm was utilized. This wavelength is in the high frequency region of the visible spectrum that provides with a higher resolution and also a higher contrast due to the relatively higher absorption coef-ficient of the biological tissue.
Figure 1 shows the schematic diagram and a photo of the actual setup in the laboratory. A pair of Nikon dark/bright-field objectives, with the magnification of 20x and NA=0.45, has been implemented in the setup. Each objective creates a hollow light cone to pro-duce dark-field illumination and is designed in a way to be capable of simultaneously imag-ing with dark-field and bright-field illumination in both transmission and reflection modes. Two CCD cameras have been installed in each view; one to collect the dark-field and
High resolution 3D microscopy using opposed-view dark-field digital holography
A. Faridian, G. Pedrini, W. Osten
the other to collect the bright-field signal. The entire dark-field signal is directed to the cor-responding CCDs using the dichroic mirrors installed in the imaging path (DM1 and DM2). The bright-field signal is transmitted through the dichroic mirrors and guided to the corre-sponding CCDs by the beam-splitters BS1 and BS2.
We took the larvae of sea urchin (about 24 hours old) for our investigations. Figure 2 shows the digitally reconstructed images of a larva taken by the top view (left column) and also the bottom view (right column) DHM.
Fig. 1: Top: Schematic diagram of the imaging part of the opposed-view DHM setup, showing both dark-field and bright-field configuration. Bottom: the arranged actual setup in the laboratory.
INSTITUT FÜR TECHNISCHE OPTIK, ANNUAL REPORT 2011/2012 Research projects
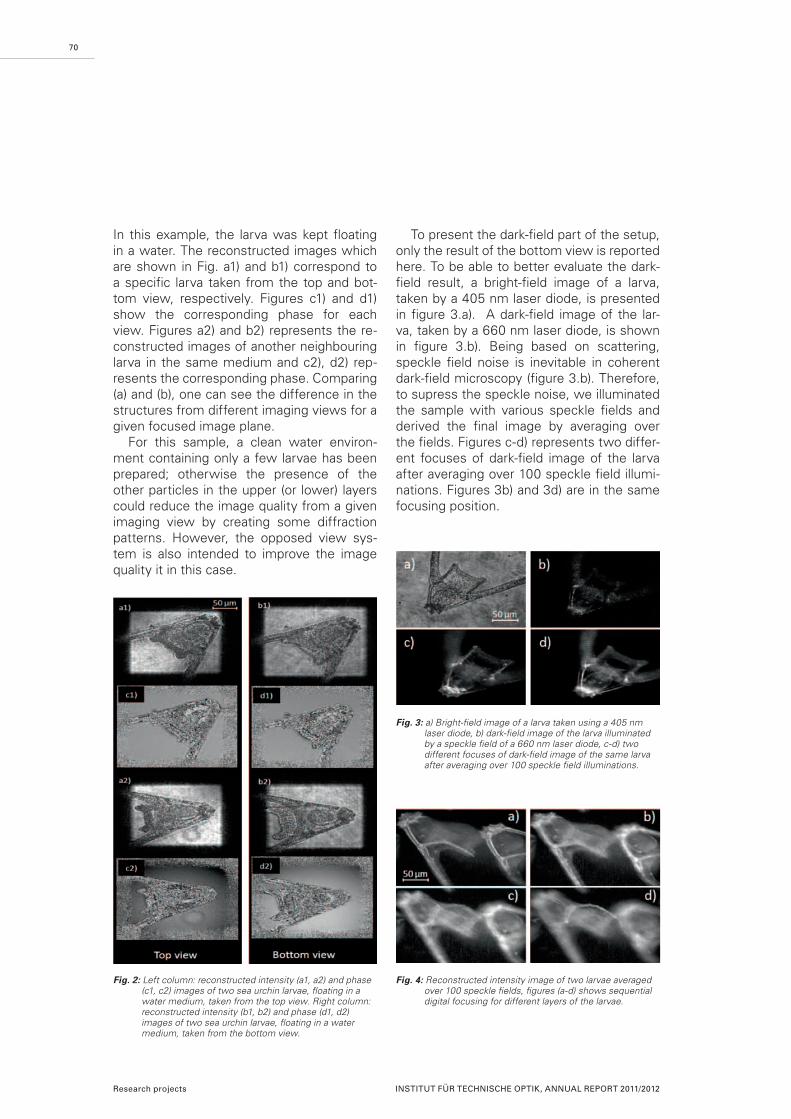
In this example, the larva was kept floating in a water. The reconstructed images which are shown in Fig. a1) and b1) correspond to a specific larva taken from the top and bot-tom view, respectively. Figures c1) and d1) show the corresponding phase for each view. Figures a2) and b2) represents the re-constructed images of another neighbouring larva in the same medium and c2), d2) rep-resents the corresponding phase. Comparing (a) and (b), one can see the difference in the structures from different imaging views for a given focused image plane.
For this sample, a clean water environ-ment containing only a few larvae has been prepared; otherwise the presence of the other particles in the upper (or lower) layers could reduce the image quality from a given imaging view by creating some diffraction patterns. However, the opposed view sys-tem is also intended to improve the image quality it in this case.
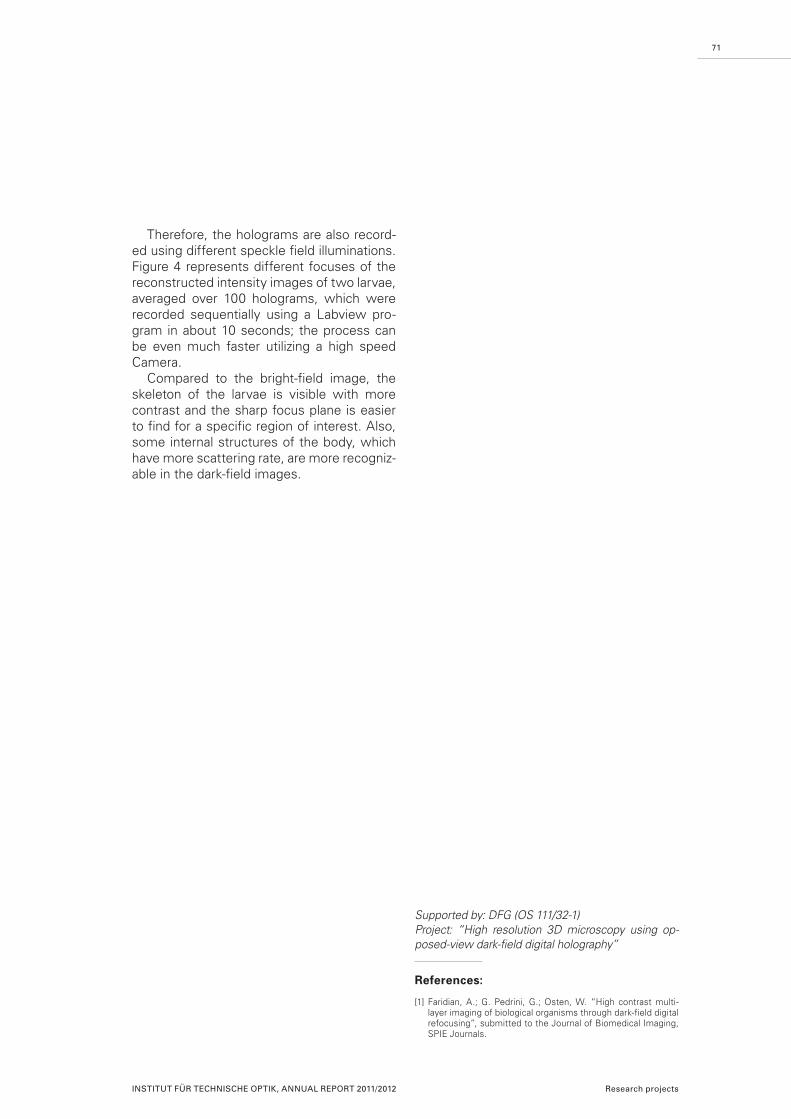
To present the dark-field part of the setup, only the result of the bottom view is reported here. To be able to better evaluate the dark-field result, a bright-field image of a larva, taken by a 405 nm laser diode, is presented in figure 3.a). A dark-field image of the lar-va, taken by a 660 nm laser diode, is shown in figure 3.b). Being based on scattering, speckle field noise is inevitable in coherent dark-field microscopy (figure 3.b). Therefore, to supress the speckle noise, we illuminated the sample with various speckle fields and derived the final image by averaging over the fields. Figures c-d) represents two differ-ent focuses of dark-field image of the larva after averaging over 100 speckle field illumi-nations. Figures 3b) and 3d) are in the same focusing position.
70
Research projects INSTITUT FÜR TECHNISCHE OPTIK, ANNUAL REPORT 2011/2012
Fig. 2: Left column: reconstructed intensity (a1, a2) and phase (c1, c2) images of two sea urchin larvae, floating in a water medium, taken from the top view. Right column: reconstructed intensity (b1, b2) and phase (d1, d2) images of two sea urchin larvae, floating in a water medium, taken from the bottom view.
Fig. 3: a) Bright-field image of a larva taken using a 405 nm laser diode, b) dark-field image of the larva illuminated by a speckle field of a 660 nm laser diode, c-d) two different focuses of dark-field image of the same larva after averaging over 100 speckle field illuminations.
Fig. 4: Reconstructed intensity image of two larvae averaged over 100 speckle fields, figures (a-d) shows sequential digital focusing for different layers of the larvae.
71
Therefore, the holograms are also record-ed using different speckle field illuminations. Figure 4 represents different focuses of the reconstructed intensity images of two larvae, averaged over 100 holograms, which were recorded sequentially using a Labview pro-gram in about 10 seconds; the process can be even much faster utilizing a high speed Camera.
Compared to the bright-field image, the skeleton of the larvae is visible with more contrast and the sharp focus plane is easier to find for a specific region of interest. Also, some internal structures of the body, which have more scattering rate, are more recogniz-able in the dark-field images.
INSTITUT FÜR TECHNISCHE OPTIK, ANNUAL REPORT 2011/2012 Research projects
Supported by: DFG (OS 111/32-1)Project: “High resolution 3D microscopy using op-posed-view dark-field digital holography”
References:
[1] Faridian, A.; G. Pedrini, G.; Osten, W. “High contrast multi-layer imaging of biological organisms through dark-field digital refocusing”, submitted to the Journal of Biomedical Imaging, SPIE Journals.
Digital holographic microscopy (DHM) is a combination of holography and microscopy and has the ability to extract essential 3D in-formation from a single recording. With the help of numerical reconstruction and digital focusing DHM has become a new tool for biomedical imaging.
Like in conventional microscopy, in DHM the diffraction-limited lateral resolution, intro-duced by the Abbe’s criterion (λ / NA), can be increased either by increasing the NA of the optical system or by using shorter wave-lengths.
The main purpose of our investigations is to increase the resolution and the contrast for the imaging of live cells. For this purpose we built an off-axis DHM set-up using high NA objective (0.75) and UV light sources in the range of 193 nm to 355 nm. To avoid stray reflections and aberrations least possible op-tical components are used.
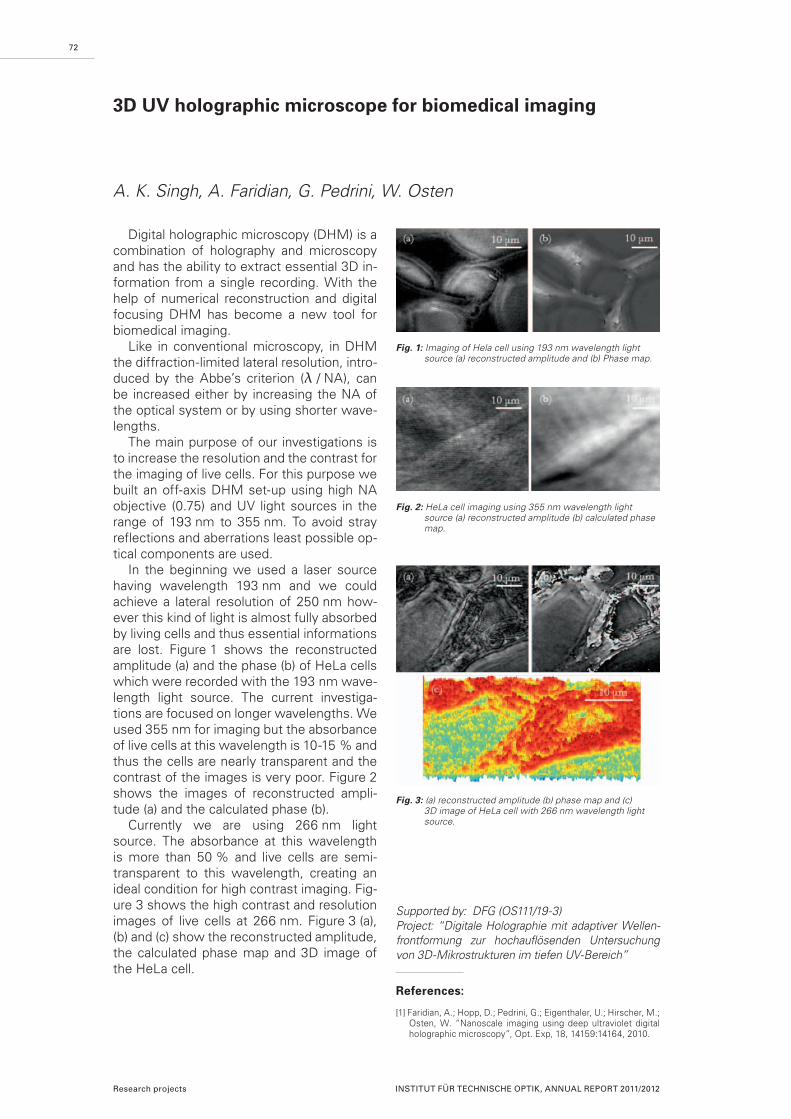
In the beginning we used a laser source having wavelength 193 nm and we could achieve a lateral resolution of 250 nm how-ever this kind of light is almost fully absorbed by living cells and thus essential informations are lost. Figure 1 shows the reconstructed amplitude (a) and the phase (b) of HeLa cells which were recorded with the 193 nm wave-length light source. The current investiga-tions are focused on longer wavelengths. We used 355 nm for imaging but the absorbance of live cells at this wavelength is 10-15 % and thus the cells are nearly transparent and the contrast of the images is very poor. Figure 2 shows the images of reconstructed ampli-tude (a) and the calculated phase (b).
Currently we are using 266 nm light source. The absorbance at this wavelength is more than 50 % and live cells are semi-transparent to this wavelength, creating an ideal condition for high contrast imaging. Fig-ure 3 shows the high contrast and resolution images of live cells at 266 nm. Figure 3 (a), (b) and (c) show the reconstructed amplitude, the calculated phase map and 3D image of the HeLa cell.
Supported by: DFG (OS111/19-3)Project: “Digitale Holographie mit adaptiver Wellen-frontformung zur hochauflösenden Untersuchung von 3D-Mikrostrukturen im tiefen UV-Bereich”
References:
[1] Faridian, A.; Hopp, D.; Pedrini, G.; Eigenthaler, U.; Hirscher, M.; Osten, W. “Nanoscale imaging using deep ultraviolet digital holographic microscopy”, Opt. Exp, 18, 14159:14164, 2010.
72
3D UV holographic microscope for biomedical imaging
A. K. Singh, A. Faridian, G. Pedrini, W. Osten
Fig. 1: Imaging of Hela cell using 193 nm wavelength light source (a) reconstructed amplitude and (b) Phase map.
Fig. 2: HeLa cell imaging using 355 nm wavelength light source (a) reconstructed amplitude (b) calculated phase map.
Fig. 3: (a) reconstructed amplitude (b) phase map and (c) 3D image of HeLa cell with 266 nm wavelength light source.
Research projects INSTITUT FÜR TECHNISCHE OPTIK, ANNUAL REPORT 2011/2012
73
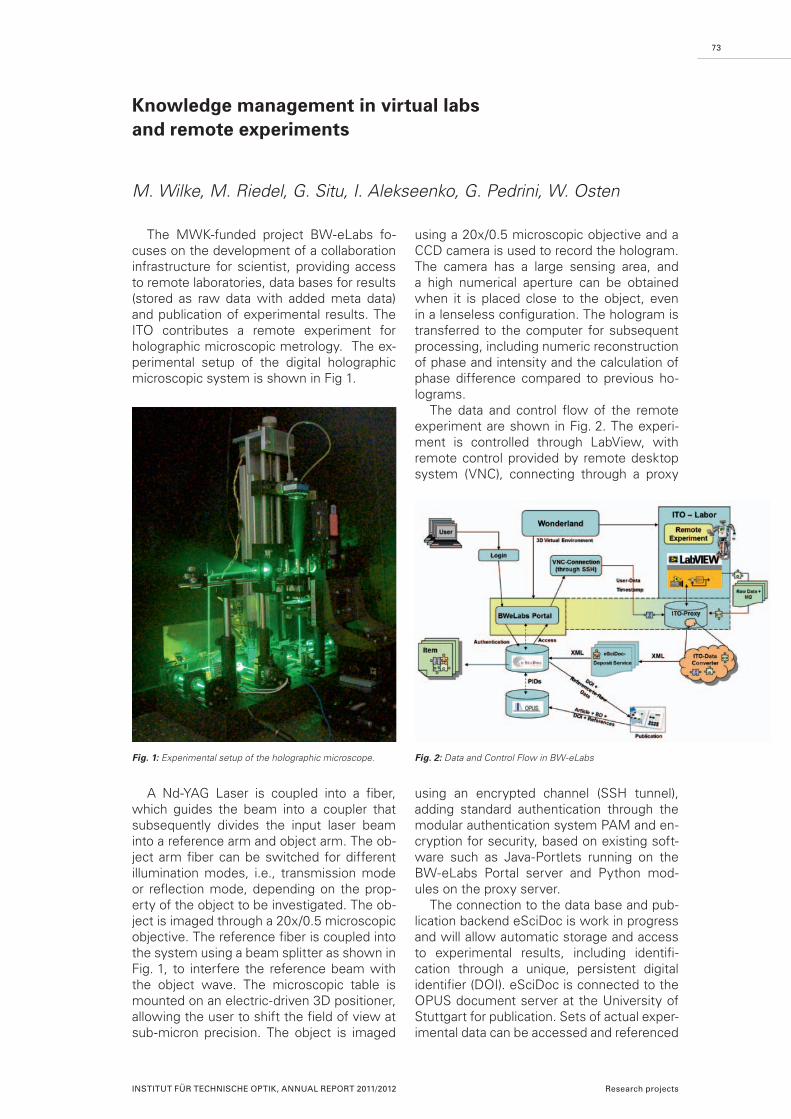
The MWK-funded project BW-eLabs fo-cuses on the development of a collaboration infrastructure for scientist, providing access to remote laboratories, data bases for results (stored as raw data with added meta data) and publication of experimental results. The ITO contributes a remote experiment for holographic microscopic metrology. The ex-perimental setup of the digital holographic microscopic system is shown in Fig 1.
A Nd-YAG Laser is coupled into a fiber, which guides the beam into a coupler that subsequently divides the input laser beam into a reference arm and object arm. The ob-ject arm fiber can be switched for different illumination modes, i.e., transmission mode or reflection mode, depending on the prop-erty of the object to be investigated. The ob-ject is imaged through a 20x/0.5 microscopic objective. The reference fiber is coupled into the system using a beam splitter as shown in Fig. 1, to interfere the reference beam with the object wave. The microscopic table is mounted on an electric-driven 3D positioner, allowing the user to shift the field of view at sub-micron precision. The object is imaged
Knowledge management in virtual labs and remote experiments
M. Wilke, M. Riedel, G. Situ, I. Alekseenko, G. Pedrini, W. Osten
using a 20x/0.5 microscopic objective and a CCD camera is used to record the hologram. The camera has a large sensing area, and a high numerical aperture can be obtained when it is placed close to the object, even in a lenseless configuration. The hologram is transferred to the computer for subsequent processing, including numeric reconstruction of phase and intensity and the calculation of phase difference compared to previous ho-lograms.
The data and control flow of the remote experiment are shown in Fig. 2. The experi-ment is controlled through LabView, with remote control provided by remote desktop system (VNC), connecting through a proxy
using an encrypted channel (SSH tunnel), adding standard authentication through the modular authentication system PAM and en-cryption for security, based on existing soft-ware such as Java-Portlets running on the BW-eLabs Portal server and Python mod-ules on the proxy server.
The connection to the data base and pub-lication backend eSciDoc is work in progress and will allow automatic storage and access to experimental results, including identifi-cation through a unique, persistent digital identifier (DOI). eSciDoc is connected to the OPUS document server at the University of Stuttgart for publication. Sets of actual exper-imental data can be accessed and referenced
Fig. 1: Experimental setup of the holographic microscope. Fig. 2: Data and Control Flow in BW-eLabs
INSTITUT FÜR TECHNISCHE OPTIK, ANNUAL REPORT 2011/2012 Research projects
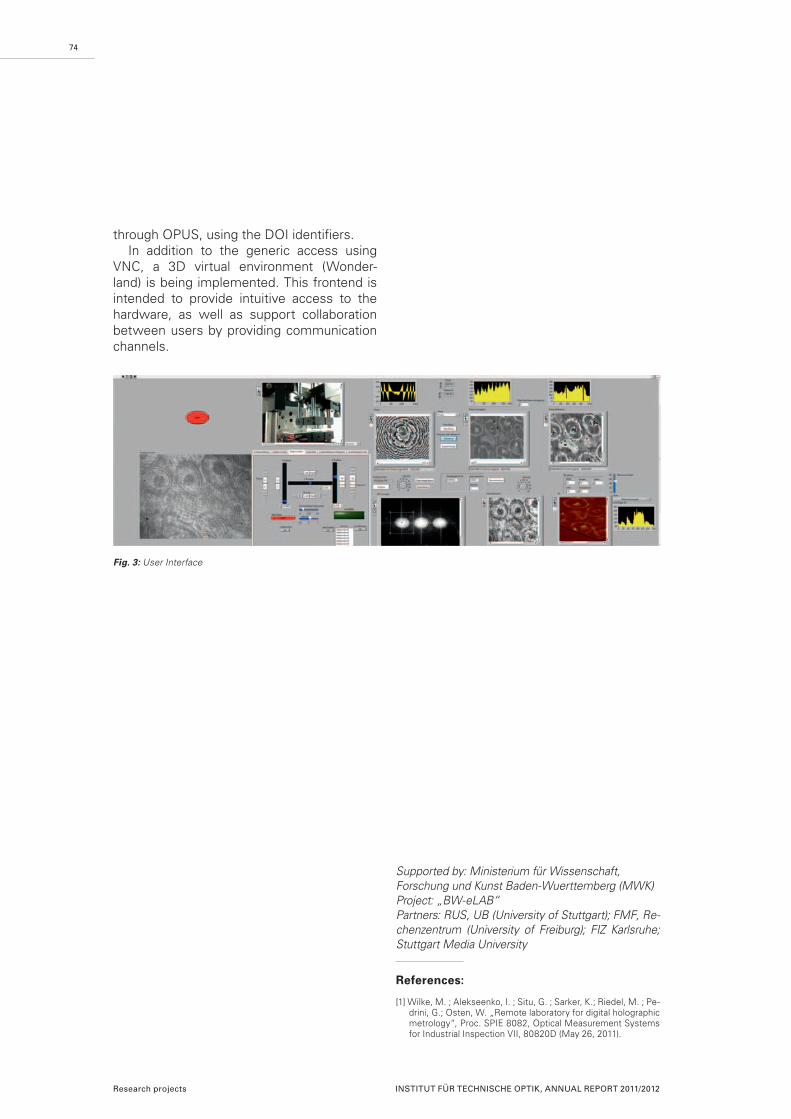
through OPUS, using the DOI identifiers. In addition to the generic access using
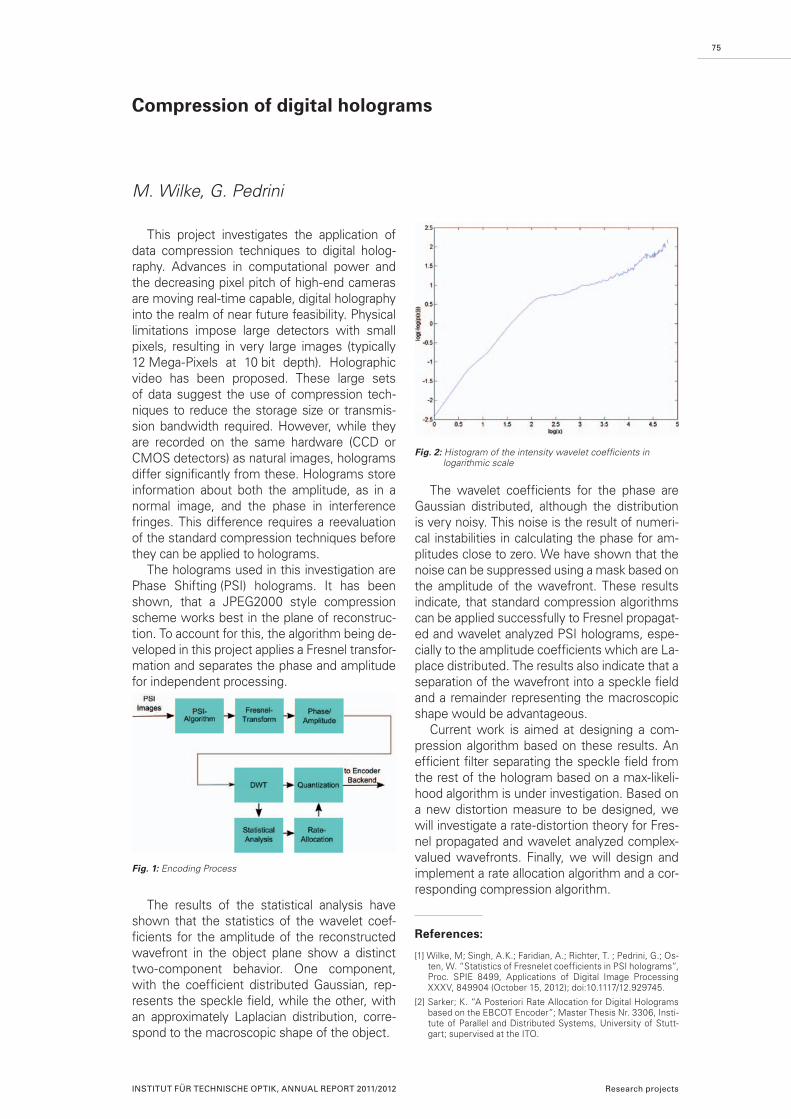
VNC, a 3D virtual environment (Wonder-land) is being implemented. This frontend is intended to provide intuitive access to the hardware, as well as support collaboration between users by providing communication channels.
74
Research projects INSTITUT FÜR TECHNISCHE OPTIK, ANNUAL REPORT 2011/2012
Supported by: Ministerium für Wissenschaft, Forschung und Kunst Baden-Wuerttemberg (MWK)Project: „BW-eLAB“ Partners: RUS, UB (University of Stuttgart); FMF, Re-chenzentrum (University of Freiburg); FIZ Karlsruhe; Stuttgart Media University
References:
[1] Wilke, M. ; Alekseenko, I. ; Situ, G. ; Sarker, K.; Riedel, M. ; Pe-drini, G.; Osten, W. „Remote laboratory for digital holographic metrology“, Proc. SPIE 8082, Optical Measurement Systems for Industrial Inspection VII, 80820D (May 26, 2011).
Fig. 3: User Interface
This project investigates the application of data compression techniques to digital holog-raphy. Advances in computational power and the decreasing pixel pitch of high-end cameras are moving real-time capable, digital holography into the realm of near future feasibility. Physical limitations impose large detectors with small pixels, resulting in very large images (typically 12 Mega-Pixels at 10 bit depth). Holographic video has been proposed. These large sets of data suggest the use of compression tech-niques to reduce the storage size or transmis-sion bandwidth required. However, while they are recorded on the same hardware (CCD or CMOS detectors) as natural images, holograms differ significantly from these. Holograms store information about both the amplitude, as in a normal image, and the phase in interference fringes. This difference requires a reevaluation of the standard compression techniques before they can be applied to holograms.
The holograms used in this investigation are Phase Shifting (PSI) holograms. It has been shown, that a JPEG2000 style compression scheme works best in the plane of reconstruc-tion. To account for this, the algorithm being de-veloped in this project applies a Fresnel transfor-mation and separates the phase and amplitude for independent processing.
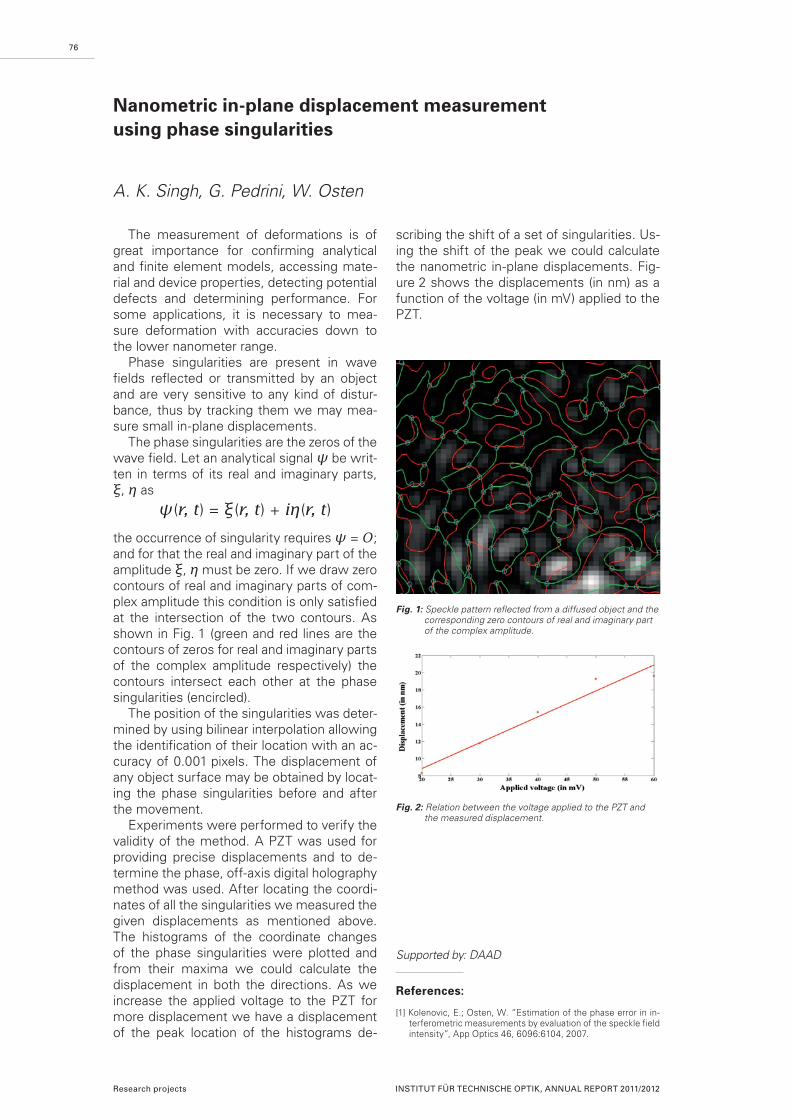
The results of the statistical analysis have shown that the statistics of the wavelet coef-ficients for the amplitude of the reconstructed wavefront in the object plane show a distinct two-component behavior. One component, with the coefficient distributed Gaussian, rep-resents the speckle field, while the other, with an approximately Laplacian distribution, corre-spond to the macroscopic shape of the object.
The wavelet coefficients for the phase are Gaussian distributed, although the distribution is very noisy. This noise is the result of numeri-cal instabilities in calculating the phase for am-plitudes close to zero. We have shown that the noise can be suppressed using a mask based on the amplitude of the wavefront. These results indicate, that standard compression algorithms can be applied successfully to Fresnel propagat-ed and wavelet analyzed PSI holograms, espe-cially to the amplitude coefficients which are La-place distributed. The results also indicate that a separation of the wavefront into a speckle field and a remainder representing the macroscopic shape would be advantageous.
Current work is aimed at designing a com-pression algorithm based on these results. An efficient filter separating the speckle field from the rest of the hologram based on a max-likeli-hood algorithm is under investigation. Based on a new distortion measure to be designed, we will investigate a rate-distortion theory for Fres-nel propagated and wavelet analyzed complex-valued wavefronts. Finally, we will design and implement a rate allocation algorithm and a cor-responding compression algorithm.
References:
[1] Wilke, M; Singh, A.K.; Faridian, A.; Richter, T. ; Pedrini, G.; Os-ten, W. “Statistics of Fresnelet coefficients in PSI holograms”, Proc. SPIE 8499, Applications of Digital Image Processing XXXV, 849904 (October 15, 2012); doi:10.1117/12.929745.
[2] Sarker; K. “A Posteriori Rate Allocation for Digital Holograms based on the EBCOT Encoder”; Master Thesis Nr. 3306, Insti-tute of Parallel and Distributed Systems, University of Stutt-gart; supervised at the ITO.
75
Compression of digital holograms
M. Wilke, G. Pedrini
INSTITUT FÜR TECHNISCHE OPTIK, ANNUAL REPORT 2011/2012 Research projects
Fig. 1: Encoding Process
Fig. 2: Histogram of the intensity wavelet coefficients in logarithmic scale
The measurement of deformations is of great importance for confirming analytical and finite element models, accessing mate-rial and device properties, detecting potential defects and determining performance. For some applications, it is necessary to mea-sure deformation with accuracies down to the lower nanometer range.
Phase singularities are present in wave fields reflected or transmitted by an object and are very sensitive to any kind of distur-bance, thus by tracking them we may mea-sure small in-plane displacements.
The phase singularities are the zeros of the wave field. Let an analytical signal ψ be writ-ten in terms of its real and imaginary parts, ξ, η as
the occurrence of singularity requires ψ = O; and for that the real and imaginary part of the amplitude ξ, η must be zero. If we draw zero contours of real and imaginary parts of com-plex amplitude this condition is only satisfied at the intersection of the two contours. As shown in Fig. 1 (green and red lines are the contours of zeros for real and imaginary parts of the complex amplitude respectively) the contours intersect each other at the phase singularities (encircled).
The position of the singularities was deter-mined by using bilinear interpolation allowing the identification of their location with an ac-curacy of 0.001 pixels. The displacement of any object surface may be obtained by locat-ing the phase singularities before and after the movement.
Experiments were performed to verify the validity of the method. A PZT was used for providing precise displacements and to de-termine the phase, off-axis digital holography method was used. After locating the coordi-nates of all the singularities we measured the given displacements as mentioned above. The histograms of the coordinate changes of the phase singularities were plotted and from their maxima we could calculate the displacement in both the directions. As we increase the applied voltage to the PZT for more displacement we have a displacement of the peak location of the histograms de-
scribing the shift of a set of singularities. Us-ing the shift of the peak we could calculate the nanometric in-plane displacements. Fig-ure 2 shows the displacements (in nm) as a function of the voltage (in mV) applied to the PZT.
76
Nanometric in-plane displacement measurement using phase singularities
A. K. Singh, G. Pedrini, W. Osten
Research projects INSTITUT FÜR TECHNISCHE OPTIK, ANNUAL REPORT 2011/2012
Supported by: DAAD
References:
[1] Kolenovic, E.; Osten, W. “Estimation of the phase error in in-terferometric measurements by evaluation of the speckle field intensity”, App Optics 46, 6096:6104, 2007.
Fig. 1: Speckle pattern reflected from a diffused object and the corresponding zero contours of real and imaginary part of the complex amplitude.
Fig. 2: Relation between the voltage applied to the PZT and the measured displacement.
ψ(r, t) = ξ(r, t) + iη(r, t)
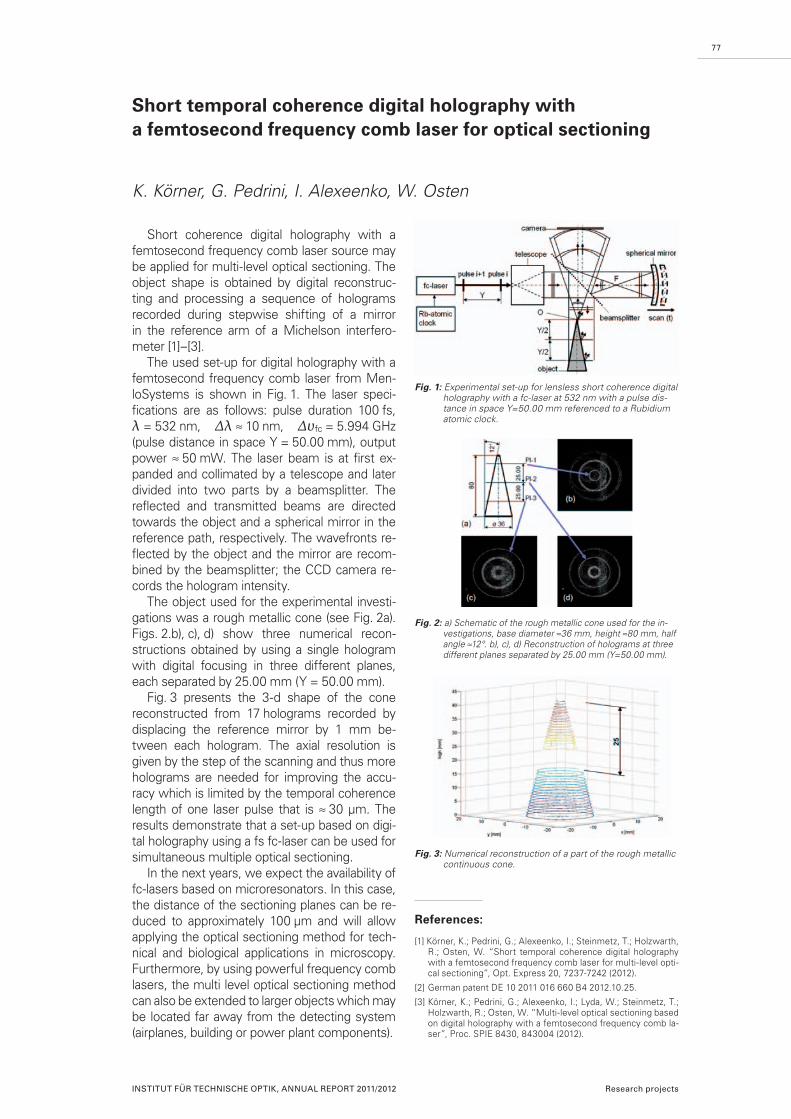
Short coherence digital holography with a femtosecond frequency comb laser source may be applied for multi-level optical sectioning. The object shape is obtained by digital reconstruc-ting and processing a sequence of holograms recorded during stepwise shifting of a mirror in the reference arm of a Michelson interfero- meter [1]–[3].
The used set-up for digital holography with a femtosecond frequency comb laser from Men-loSystems is shown in Fig. 1. The laser speci-fications are as follows: pulse duration 100 fs, λ = 532 nm, Δλ ≈ 10 nm, Δυfc = 5.994 GHz (pulse distance in space Y = 50.00 mm), output power ≈ 50 mW. The laser beam is at first ex-panded and collimated by a telescope and later divided into two parts by a beamsplitter. The reflected and transmitted beams are directed towards the object and a spherical mirror in the reference path, respectively. The wavefronts re-flected by the object and the mirror are recom-bined by the beamsplitter; the CCD camera re-cords the hologram intensity.
The object used for the experimental investi-gations was a rough metallic cone (see Fig. 2a). Figs. 2.b), c), d) show three numerical recon-structions obtained by using a single hologram with digital focusing in three different planes, each separated by 25.00 mm (Y = 50.00 mm).
Fig. 3 presents the 3-d shape of the cone reconstructed from 17 holograms recorded by displacing the reference mirror by 1 mm be-tween each hologram. The axial resolution is given by the step of the scanning and thus more holograms are needed for improving the accu-racy which is limited by the temporal coherence length of one laser pulse that is ≈ 30 µm. The results demonstrate that a set-up based on digi-tal holography using a fs fc-laser can be used for simultaneous multiple optical sectioning.
In the next years, we expect the availability of fc-lasers based on microresonators. In this case, the distance of the sectioning planes can be re-duced to approximately 100 µm and will allow applying the optical sectioning method for tech-nical and biological applications in microscopy. Furthermore, by using powerful frequency comb lasers, the multi level optical sectioning method can also be extended to larger objects which may be located far away from the detecting system (airplanes, building or power plant components).
References:
[1] Körner, K.; Pedrini, G.; Alexeenko, I.; Steinmetz, T.; Holzwarth, R.; Osten, W. “Short temporal coherence digital holography with a femtosecond frequency comb laser for multi-level opti-cal sectioning”, Opt. Express 20, 7237-7242 (2012).
[2] German patent DE 10 2011 016 660 B4 2012.10.25.
[3] Körner, K.; Pedrini, G.; Alexeenko, I.; Lyda, W.; Steinmetz, T.; Holzwarth, R.; Osten, W. “Multi-level optical sectioning based on digital holography with a femtosecond frequency comb la-ser”, Proc. SPIE 8430, 843004 (2012).
77
Short temporal coherence digital holography with a femtosecond frequency comb laser for optical sectioning
K. Körner, G. Pedrini, I. Alexeenko, W. Osten
INSTITUT FÜR TECHNISCHE OPTIK, ANNUAL REPORT 2011/2012 Research projects
Fig. 1: Experimental set-up for lensless short coherence digital holography with a fc-laser at 532 nm with a pulse dis-tance in space Y=50.00 mm referenced to a Rubidium atomic clock.
Fig. 3: Numerical reconstruction of a part of the rough metallic continuous cone.
Fig. 2: a) Schematic of the rough metallic cone used for the in-vestigations, base diameter ≈36 mm, height ≈80 mm, half angle ≈12°. b), c), d) Reconstruction of holograms at three different planes separated by 25.00 mm (Y=50.00 mm).
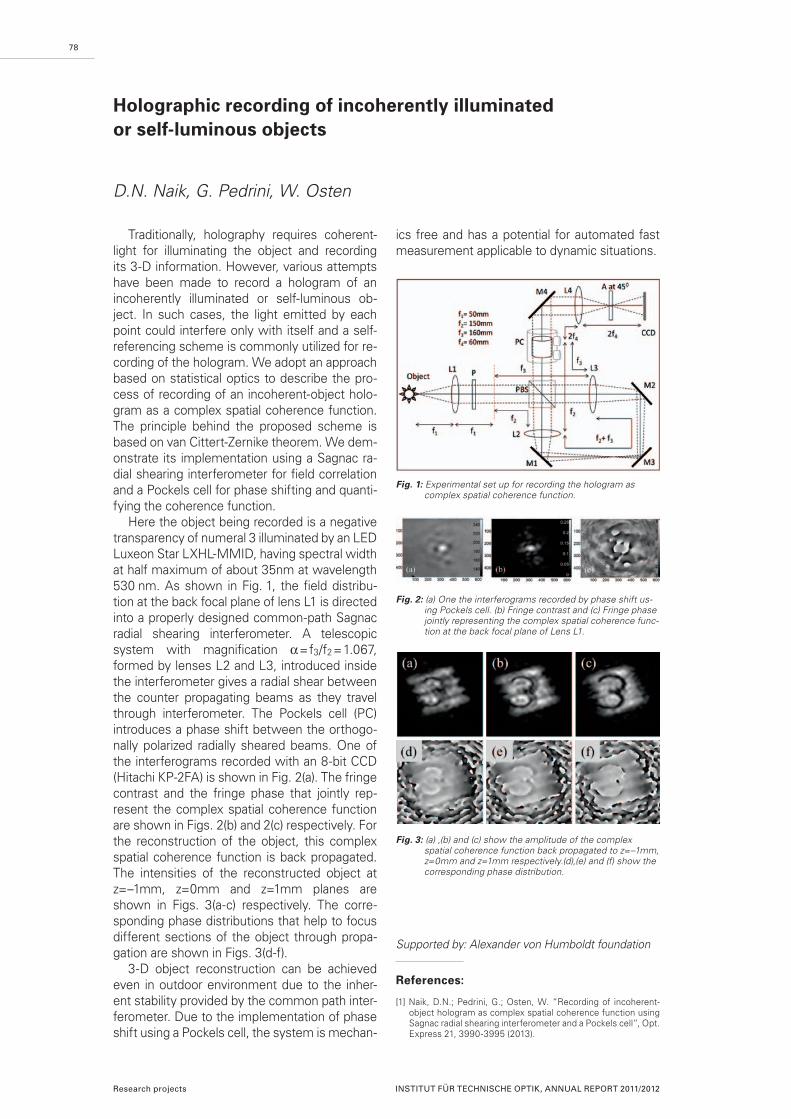
Traditionally, holography requires coherent-light for illuminating the object and recording its 3-D information. However, various attempts have been made to record a hologram of an incoherently illuminated or self-luminous ob-ject. In such cases, the light emitted by each point could interfere only with itself and a self-referencing scheme is commonly utilized for re-cording of the hologram. We adopt an approach based on statistical optics to describe the pro-cess of recording of an incoherent-object holo-gram as a complex spatial coherence function. The principle behind the proposed scheme is based on van Cittert-Zernike theorem. We dem-onstrate its implementation using a Sagnac ra-dial shearing interferometer for field correlation and a Pockels cell for phase shifting and quanti-fying the coherence function.
Here the object being recorded is a negative transparency of numeral 3 illuminated by an LED Luxeon Star LXHL-MMID, having spectral width at half maximum of about 35nm at wavelength 530 nm. As shown in Fig. 1, the field distribu-tion at the back focal plane of lens L1 is directed into a properly designed common-path Sagnac radial shearing interferometer. A telescopic system with magnification = f3/f2 = 1.067, formed by lenses L2 and L3, introduced inside the interferometer gives a radial shear between the counter propagating beams as they travel through interferometer. The Pockels cell (PC) introduces a phase shift between the orthogo-nally polarized radially sheared beams. One of the interferograms recorded with an 8-bit CCD (Hitachi KP-2FA) is shown in Fig. 2(a). The fringe contrast and the fringe phase that jointly rep-resent the complex spatial coherence function are shown in Figs. 2(b) and 2(c) respectively. For the reconstruction of the object, this complex spatial coherence function is back propagated. The intensities of the reconstructed object at z=–1mm, z=0mm and z=1mm planes are shown in Figs. 3(a-c) respectively. The corre-sponding phase distributions that help to focus different sections of the object through propa-gation are shown in Figs. 3(d-f).
3-D object reconstruction can be achieved even in outdoor environment due to the inher-ent stability provided by the common path inter-ferometer. Due to the implementation of phase shift using a Pockels cell, the system is mechan-
ics free and has a potential for automated fast measurement applicable to dynamic situations.
Supported by: Alexander von Humboldt foundation
References:
[1] Naik, D.N.; Pedrini, G.; Osten, W. “Recording of incoherent-object hologram as complex spatial coherence function using Sagnac radial shearing interferometer and a Pockels cell”, Opt. Express 21, 3990-3995 (2013).
78
Holographic recording of incoherently illuminated or self-luminous objects
D.N. Naik, G. Pedrini, W. Osten
Research projects INSTITUT FÜR TECHNISCHE OPTIK, ANNUAL REPORT 2011/2012
Fig. 1: Experimental set up for recording the hologram as complex spatial coherence function.
Fig. 2: (a) One the interferograms recorded by phase shift us-ing Pockels cell. (b) Fringe contrast and (c) Fringe phase jointly representing the complex spatial coherence func-tion at the back focal plane of Lens L1.
Fig. 3: (a) ,(b) and (c) show the amplitude of the complex spatial coherence function back propagated to z=–1mm, z=0mm and z=1mm respectively.(d),(e) and (f) show the corresponding phase distribution.
79
Phase retrieval with resolution enhance-ment is obtained by using random-phase il-lumination generated by a spatial light modu-lator.
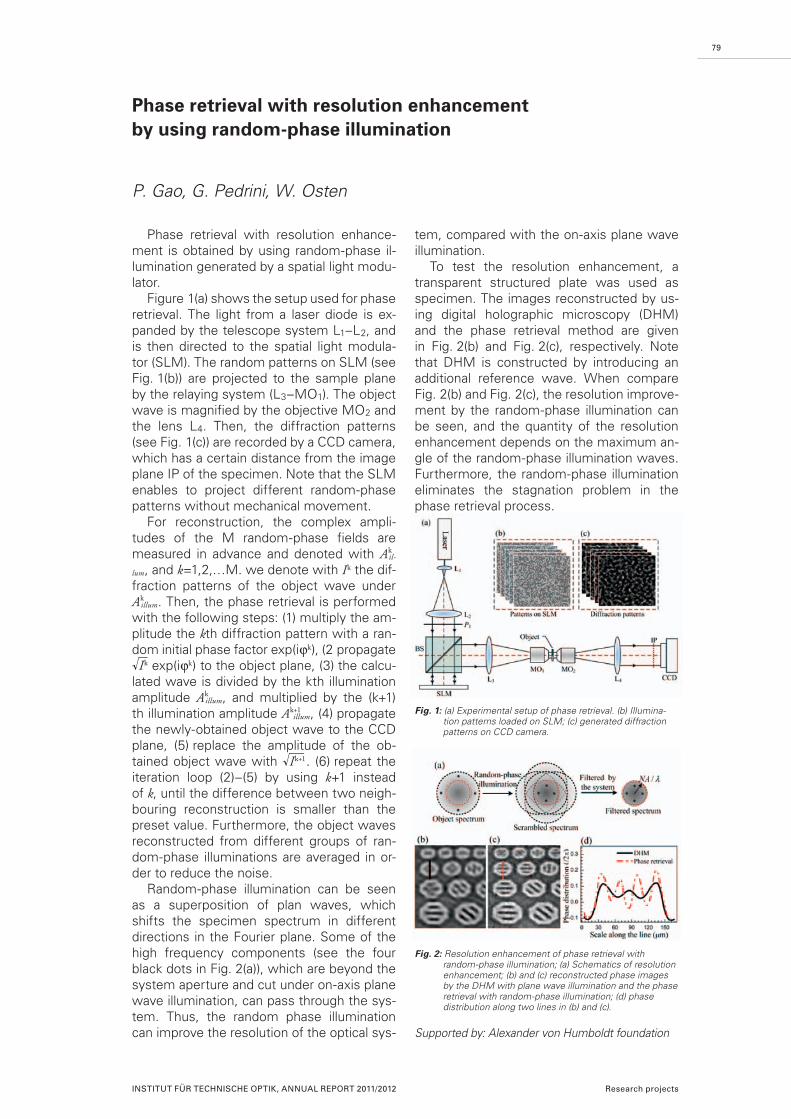
Figure 1(a) shows the setup used for phase retrieval. The light from a laser diode is ex-panded by the telescope system L1–L2, and is then directed to the spatial light modula-tor (SLM). The random patterns on SLM (see Fig. 1(b)) are projected to the sample plane by the relaying system (L3–MO1). The object wave is magnified by the objective MO2 and the lens L4. Then, the diffraction patterns (see Fig. 1(c)) are recorded by a CCD camera, which has a certain distance from the image plane IP of the specimen. Note that the SLM enables to project different random-phase patterns without mechanical movement.
For reconstruction, the complex ampli-tudes of the M random-phase fields are measured in advance and denoted with Ak
il-
lum, and k=1,2,…M. we denote with Ik the dif-fraction patterns of the object wave under Ak
illum. Then, the phase retrieval is performed with the following steps: (1) multiply the am-plitude the kth diffraction pattern with a ran-dom initial phase factor exp(iϕk), (2 propagate Ik exp(iϕk) to the object plane, (3) the calcu-
lated wave is divided by the kth illumination amplitude Ak
illum, and multiplied by the (k+1)th illumination amplitude Ak+1
illum, (4) propagate the newly-obtained object wave to the CCD plane, (5) replace the amplitude of the ob-tained object wave with Ik+1. (6) repeat the iteration loop (2)–(5) by using k+1 instead of k, until the difference between two neigh-bouring reconstruction is smaller than the preset value. Furthermore, the object waves reconstructed from different groups of ran-dom-phase illuminations are averaged in or-der to reduce the noise.
Random-phase illumination can be seen as a superposition of plan waves, which shifts the specimen spectrum in different directions in the Fourier plane. Some of the high frequency components (see the four black dots in Fig. 2(a)), which are beyond the system aperture and cut under on-axis plane wave illumination, can pass through the sys-tem. Thus, the random phase illumination can improve the resolution of the optical sys-
Phase retrieval with resolution enhancement by using random-phase illumination
P. Gao, G. Pedrini, W. Osten
tem, compared with the on-axis plane wave illumination.
To test the resolution enhancement, a transparent structured plate was used as specimen. The images reconstructed by us-ing digital holographic microscopy (DHM) and the phase retrieval method are given in Fig. 2(b) and Fig. 2(c), respectively. Note that DHM is constructed by introducing an additional reference wave. When compare Fig. 2(b) and Fig. 2(c), the resolution improve-ment by the random-phase illumination can be seen, and the quantity of the resolution enhancement depends on the maximum an-gle of the random-phase illumination waves. Furthermore, the random-phase illumination eliminates the stagnation problem in the phase retrieval process.
INSTITUT FÜR TECHNISCHE OPTIK, ANNUAL REPORT 2011/2012 Research projects
Supported by: Alexander von Humboldt foundation
Fig. 1: (a) Experimental setup of phase retrieval. (b) Illumina-tion patterns loaded on SLM; (c) generated diffraction patterns on CCD camera.
Fig. 2: Resolution enhancement of phase retrieval with random-phase illumination; (a) Schematics of resolution enhancement; (b) and (c) reconstructed phase images by the DHM with plane wave illumination and the phase retrieval with random-phase illumination; (d) phase distribution along two lines in (b) and (c).
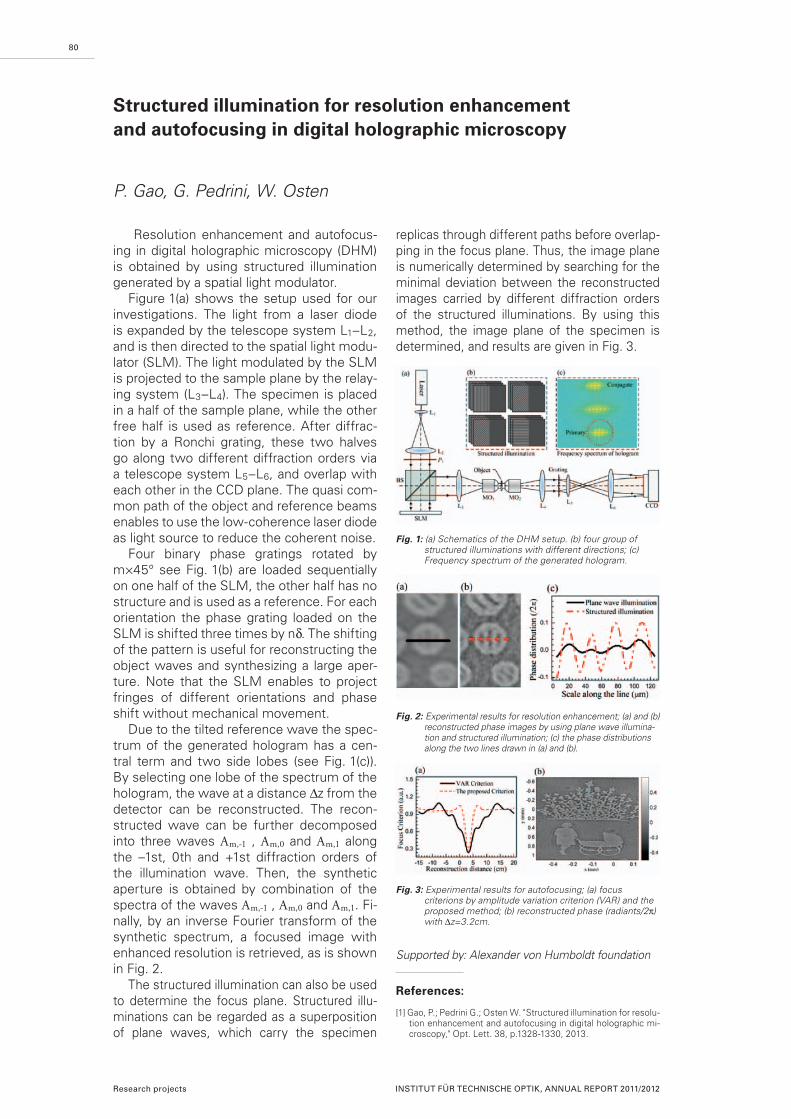
Resolution enhancement and autofocus-ing in digital holographic microscopy (DHM) is obtained by using structured illumination generated by a spatial light modulator.
Figure 1(a) shows the setup used for our investigations. The light from a laser diode is expanded by the telescope system L1–L2, and is then directed to the spatial light modu-lator (SLM). The light modulated by the SLM is projected to the sample plane by the relay-ing system (L3–L4). The specimen is placed in a half of the sample plane, while the other free half is used as reference. After diffrac-tion by a Ronchi grating, these two halves go along two different diffraction orders via a telescope system L5–L6, and overlap with each other in the CCD plane. The quasi com-mon path of the object and reference beams enables to use the low-coherence laser diode as light source to reduce the coherent noise.
Four binary phase gratings rotated by m×45° see Fig. 1(b) are loaded sequentially on one half of the SLM, the other half has no structure and is used as a reference. For each orientation the phase grating loaded on the SLM is shifted three times by nδ. The shifting of the pattern is useful for reconstructing the object waves and synthesizing a large aper-ture. Note that the SLM enables to project fringes of different orientations and phase shift without mechanical movement.
Due to the tilted reference wave the spec-trum of the generated hologram has a cen-tral term and two side lobes (see Fig. 1(c)). By selecting one lobe of the spectrum of the hologram, the wave at a distance Δz from the detector can be reconstructed. The recon-structed wave can be further decomposed into three waves Am,-1 , Am,0 and Am,1 along the –1st, 0th and +1st diffraction orders of the illumination wave. Then, the synthetic aperture is obtained by combination of the spectra of the waves Am,-1 , Am,0 and Am,1. Fi-nally, by an inverse Fourier transform of the synthetic spectrum, a focused image with enhanced resolution is retrieved, as is shown in Fig. 2.
The structured illumination can also be used to determine the focus plane. Structured illu-minations can be regarded as a superposition of plane waves, which carry the specimen
replicas through different paths before overlap-ping in the focus plane. Thus, the image plane is numerically determined by searching for the minimal deviation between the reconstructed images carried by different diffraction orders of the structured illuminations. By using this method, the image plane of the specimen is determined, and results are given in Fig. 3.
Supported by: Alexander von Humboldt foundation
References:
[1] Gao, P.; Pedrini G.; Osten W. "Structured illumination for resolu-tion enhancement and autofocusing in digital holographic mi-croscopy," Opt. Lett. 38, p.1328-1330, 2013.
80
Structured illumination for resolution enhancement and autofocusing in digital holographic microscopy
P. Gao, G. Pedrini, W. Osten
Research projects INSTITUT FÜR TECHNISCHE OPTIK, ANNUAL REPORT 2011/2012
Fig. 1: (a) Schematics of the DHM setup. (b) four group of structured illuminations with different directions; (c) Frequency spectrum of the generated hologram.
Fig. 2: Experimental results for resolution enhancement; (a) and (b) reconstructed phase images by using plane wave illumina-tion and structured illumination; (c) the phase distributions along the two lines drawn in (a) and (b).
Fig. 3: Experimental results for autofocusing; (a) focus criterions by amplitude variation criterion (VAR) and the proposed method; (b) reconstructed phase (radiants/2π) with Δz=3.2cm.
ISBN 978-3-923560-73-8