installation of polaris, a software of keygraph · a free basic manual (version e-0) of polaris,...
TRANSCRIPT

A free basic manual (version E-0) of Polaris, that is a piece of KeyGraph software Yukio Ohsawa, The University of Tokyo
==========================================================
Installation of Polaris, a software of KeyGraph
=========================================================
1. For installation of Polaris, just decompress the zipped file polaris-0.19alpha-e.zip on a Windows (of XP
or later) so that you will find the following three, which should be put in one folder you create.
- polaris.exe
- keygraph_analyze.dll
- textimport.dll
That is all - your next step is to double click the icon of polaris.exe.
==========================================================
Use of KeyGraph, on Polaris - a basic manual (under revisions)
==========================================================
1. Make the target data (X.csv or Y.txt): Give that you have the data as in Fig.1, which you like to
visualize using KeyGraph. The data may be from the sales of commercial items (V51, V48 may mean
items such as “notebook” and “pen”, and “dummy1” maybe some event that occurred at the time the
customer bought these two items).
Fig.1: The data in the PC of use
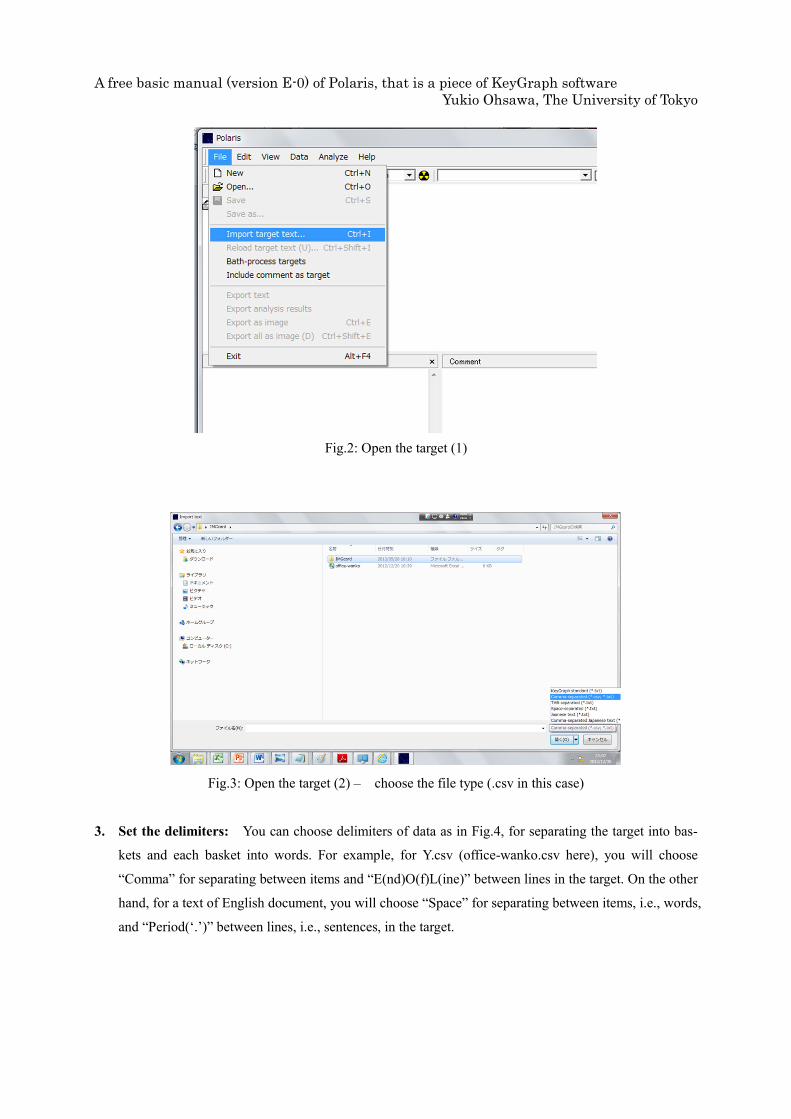
2. Read (import) the data: Choose "import target text" instead of "open" from the menu (Fig.2), to be
guided to a window for choosing the file type (the right bottom of Fig.3) and then the target from the
listed files of the chosen type (center of Fig.3).
A free basic manual (version E-0) of Polaris, that is a piece of KeyGraph software Yukio Ohsawa, The University of Tokyo
Fig.2: Open the target (1)
Fig.3: Open the target (2) – choose the file type (.csv in this case)
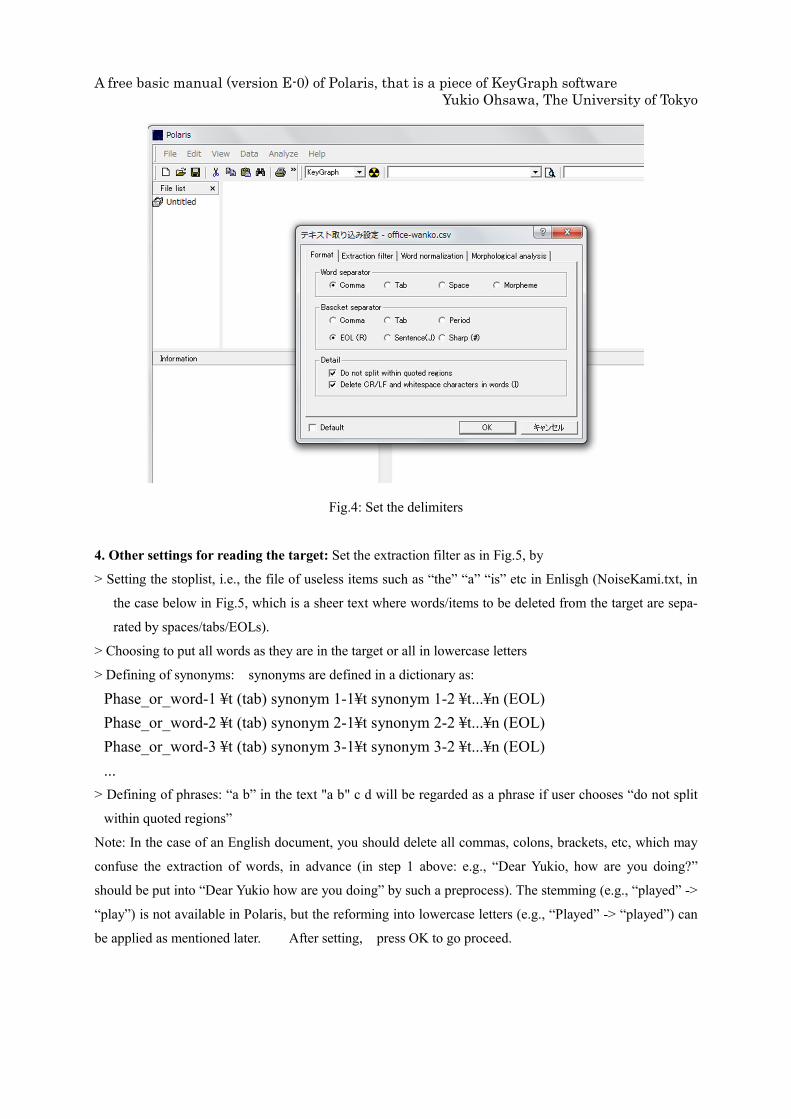
3. Set the delimiters: You can choose delimiters of data as in Fig.4, for separating the target into bas-
kets and each basket into words. For example, for Y.csv (office-wanko.csv here), you will choose
“Comma” for separating between items and “E(nd)O(f)L(ine)” between lines in the target. On the other
hand, for a text of English document, you will choose “Space” for separating between items, i.e., words,
and “Period(‘.’)” between lines, i.e., sentences, in the target.
A free basic manual (version E-0) of Polaris, that is a piece of KeyGraph software Yukio Ohsawa, The University of Tokyo
Fig.4: Set the delimiters
4. Other settings for reading the target: Set the extraction filter as in Fig.5, by
> Setting the stoplist, i.e., the file of useless items such as “the” “a” “is” etc in Enlisgh (NoiseKami.txt, in
the case below in Fig.5, which is a sheer text where words/items to be deleted from the target are sepa-
rated by spaces/tabs/EOLs).
> Choosing to put all words as they are in the target or all in lowercase letters
> Defining of synonyms: synonyms are defined in a dictionary as:
Phase_or_word-1 ¥t (tab) synonym 1-1¥t synonym 1-2 ¥t...¥n (EOL)
Phase_or_word-2 ¥t (tab) synonym 2-1¥t synonym 2-2 ¥t...¥n (EOL)
Phase_or_word-3 ¥t (tab) synonym 3-1¥t synonym 3-2 ¥t...¥n (EOL)
...
> Defining of phrases: “a b” in the text "a b" c d will be regarded as a phrase if user chooses “do not split
within quoted regions”
Note: In the case of an English document, you should delete all commas, colons, brackets, etc, which may
confuse the extraction of words, in advance (in step 1 above: e.g., “Dear Yukio, how are you doing?”
should be put into “Dear Yukio how are you doing” by such a preprocess). The stemming (e.g., “played” ->
“play”) is not available in Polaris, but the reforming into lowercase letters (e.g., “Played” -> “played”) can
be applied as mentioned later. After setting, press OK to go proceed.

A free basic manual (version E-0) of Polaris, that is a piece of KeyGraph software Yukio Ohsawa, The University of Tokyo
Fig.5: Read the file of the stop list, of which the content is such as “a the is that …” where useless words
are included with being separated by spaces
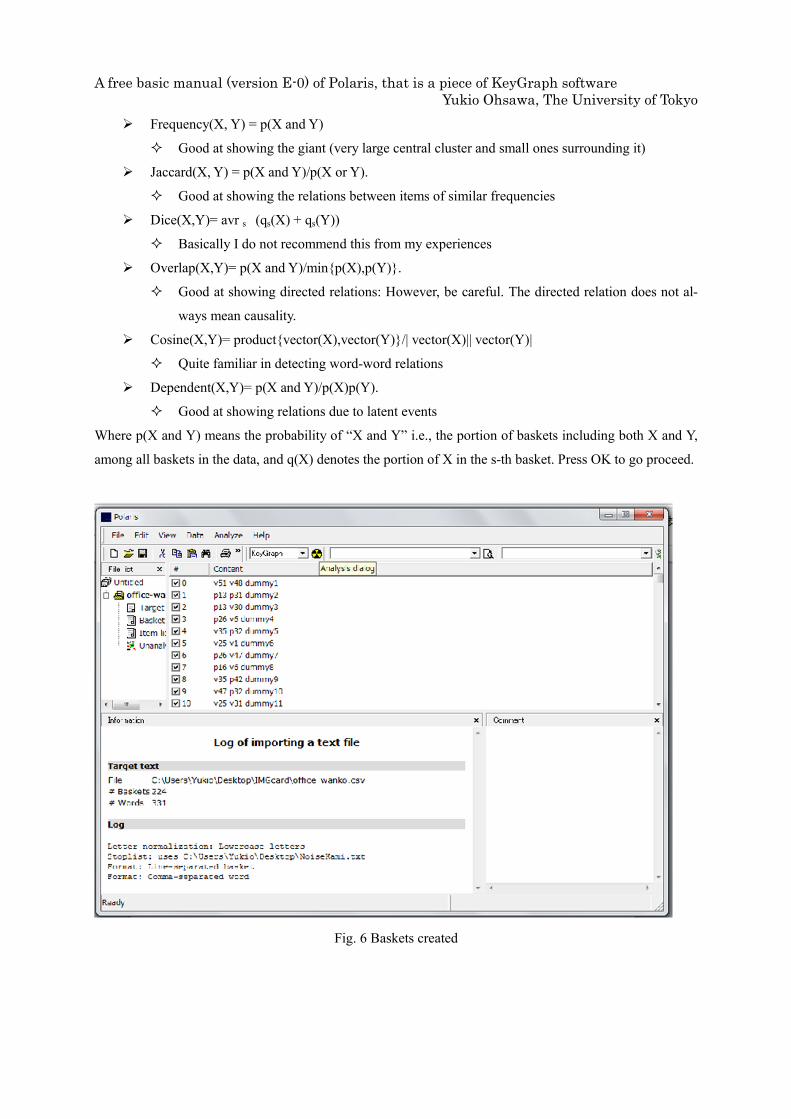
As a result, the baskets are obtained from the target data as in Fig.6. As in the upper right, each line repre-
sents one basket. In the bottom left, the number of unique items/words, of baskets, and other important
information are displayed. If these values are shown as 0, some error is occurring. By clicking the “analyze”
button in the menu, user will find the window as in Fig.7, where parameters for visualization are to be set.
The Parameters are:
Number of nodes and links:
- bn: No. of black nodes. I.e., the bn most frequent items/words in data shall be included as nodes in the
graph.
- bl: No. of red nodes. I.e., the bn most strongly connected (co-occurring in the sense defined later) pairs
of items/words in data shall be reflected to lines in the graph.
- rn: No. of red nodes. I.e., rn items/words of the strongest effect to connect multiple clusters in data
shall be included as red nodes in the graph, if they do not belong to black nodes i.e., if they are rare in
the target data.
- gn: No. of green nodes. I.e., gn items/words of the strongest effect to connect multiple clusters in data
shall be included as green nodes in the graph, even if they belong to black nodes.
Functions defining the link strength: For evaluating the strongly connected pairs (X, Y) of items/words and
the (node X’s) effect to connect one cluster (e.g., Y) to others above, strength(X,Y) shall be defined ac-
cording to user’s choice of function strength(X,Y) as follows. Here, strength(X: item, Y: item) is exten-
sively applied to strength(X: item,Y: cluster) by rewriting items in cluster Y into item “Y”.
A free basic manual (version E-0) of Polaris, that is a piece of KeyGraph software Yukio Ohsawa, The University of Tokyo
� Frequency(X, Y) = p(X and Y)
� Good at showing the giant (very large central cluster and small ones surrounding it)
� Jaccard(X, Y) = p(X and Y)/p(X or Y).
� Good at showing the relations between items of similar frequencies
� Dice(X,Y)= avr s (qs(X) + qs(Y))
� Basically I do not recommend this from my experiences
� Overlap(X,Y)= p(X and Y)/min{p(X),p(Y)}.
� Good at showing directed relations: However, be careful. The directed relation does not al-
ways mean causality.
� Cosine(X,Y)= product{vector(X),vector(Y)}/| vector(X)|| vector(Y)|
� Quite familiar in detecting word-word relations
� Dependent(X,Y)= p(X and Y)/p(X)p(Y).
� Good at showing relations due to latent events
Where p(X and Y) means the probability of “X and Y” i.e., the portion of baskets including both X and Y,
among all baskets in the data, and q(X) denotes the portion of X in the s-th basket. Press OK to go proceed.
Fig. 6 Baskets created

A free basic manual (version E-0) of Polaris, that is a piece of KeyGraph software Yukio Ohsawa, The University of Tokyo
Fig. 7 Setting for analysis: In this case definition of both the black and the red links are set to Jaccard
co-efficient.
4. The output and feedback to new setting:
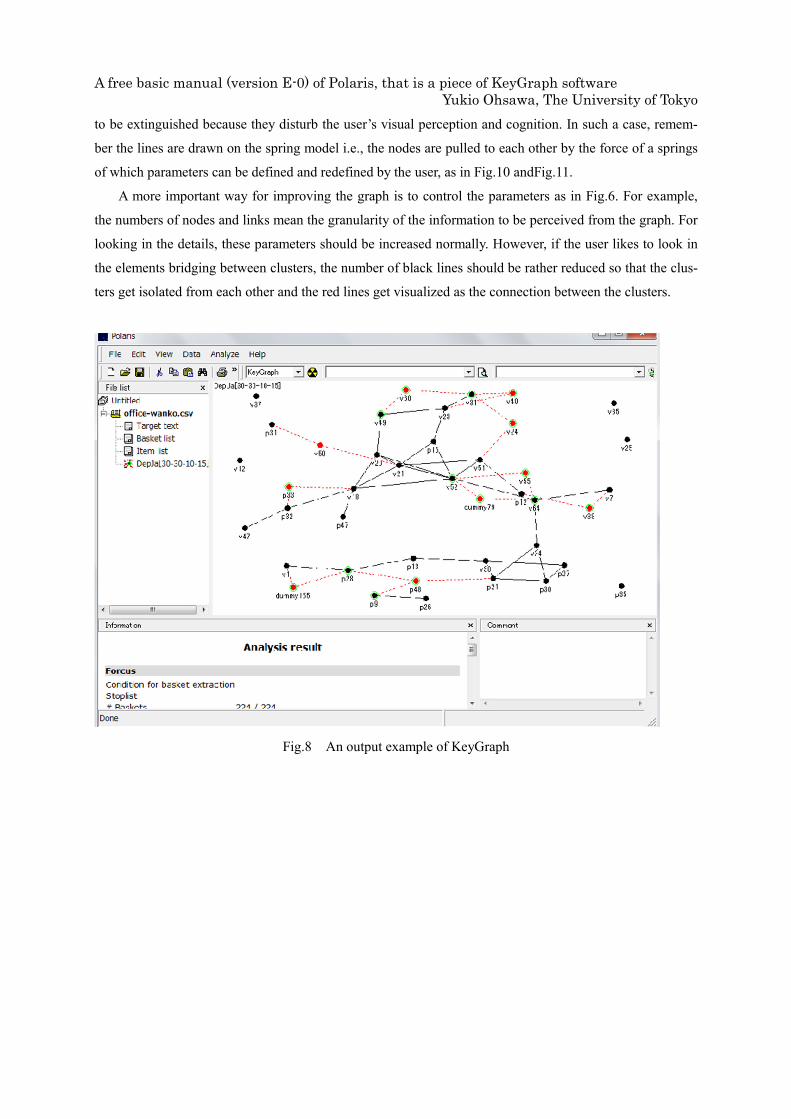
As in Fig.8, the graph will be visualized as a result. The black nodes and black lines represent the frequent
items and their co-occurrences, implying an established trend in the data, and the red nodes and red lines
the bridges which may trigger the fusion of the clusters or some phenomena such as transition of events
from one to other clusters: Imagine, for example, scientists working in the labo may shift from a shelf of
books to another of stationery, because of encountering a book on which one likes to draw a marking line
with a pen. In that case, the marking pen may appear as a red node where the books and stationery appear
as different clusters isolated from each other.
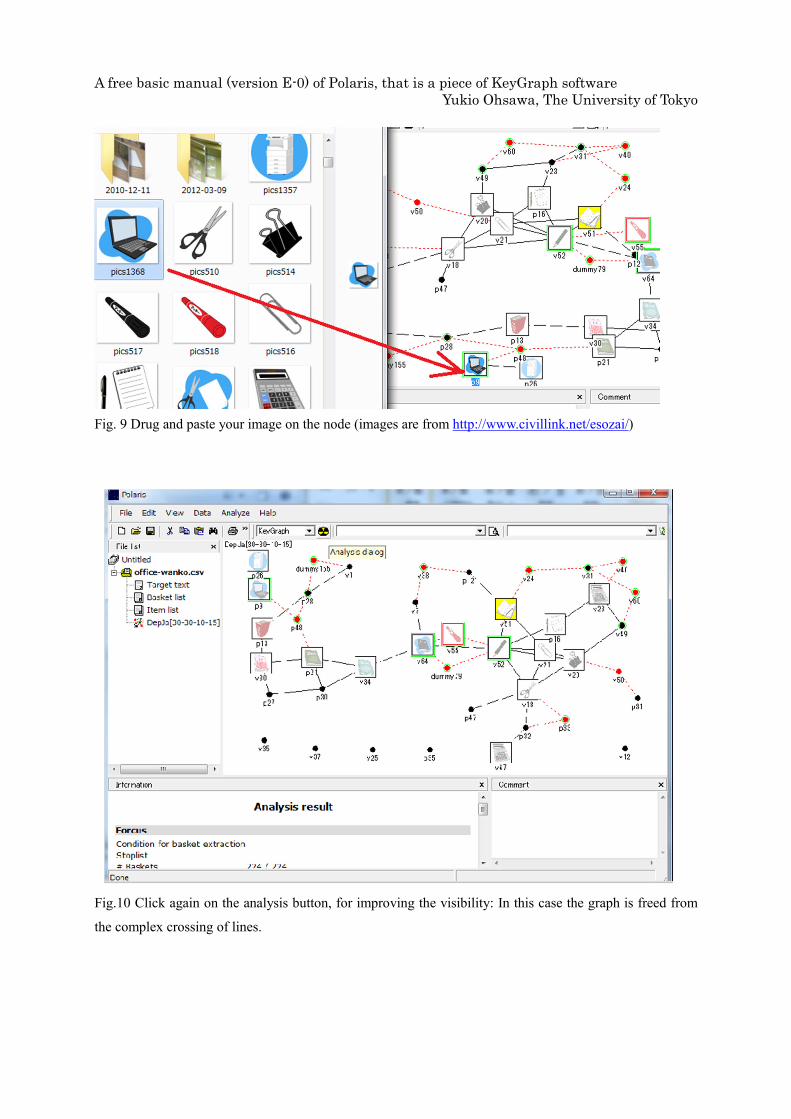
As in Fig.9, if the graph is not easy to catch intuitively, image files in user’s hand can be used for im-
proving the visibility, by simply dragging the image in the user’s PC folder to a node in the graph. As a
result, user finds the red marking pen in the right end of the figure plays a role to bridge between the books
and the stationary. In this case, the user is pasting the image of PC onto a node. After his moment, the user
puts the image of a cup of coffee on the node p48 (between the PC and books), which means one who reads
the book may be (although not necessarily) expected to use PC for searching relevant information (tech-
nical dictionary etc), taking a long, thoughtful time with coffee.
In order to make this kind of interpretation of the output, the complex crossing of links may be desired
A free basic manual (version E-0) of Polaris, that is a piece of KeyGraph software Yukio Ohsawa, The University of Tokyo
to be extinguished because they disturb the user’s visual perception and cognition. In such a case, remem-
ber the lines are drawn on the spring model i.e., the nodes are pulled to each other by the force of a springs
of which parameters can be defined and redefined by the user, as in Fig.10 andFig.11.
A more important way for improving the graph is to control the parameters as in Fig.6. For example,
the numbers of nodes and links mean the granularity of the information to be perceived from the graph. For
looking in the details, these parameters should be increased normally. However, if the user likes to look in
the elements bridging between clusters, the number of black lines should be rather reduced so that the clus-
ters get isolated from each other and the red lines get visualized as the connection between the clusters.
Fig.8 An output example of KeyGraph
A free basic manual (version E-0) of Polaris, that is a piece of KeyGraph software Yukio Ohsawa, The University of Tokyo
Fig. 9 Drug and paste your image on the node (images are from http://www.civillink.net/esozai/)
Fig.10 Click again on the analysis button, for improving the visibility: In this case the graph is freed from
the complex crossing of lines.
A free basic manual (version E-0) of Polaris, that is a piece of KeyGraph software Yukio Ohsawa, The University of Tokyo
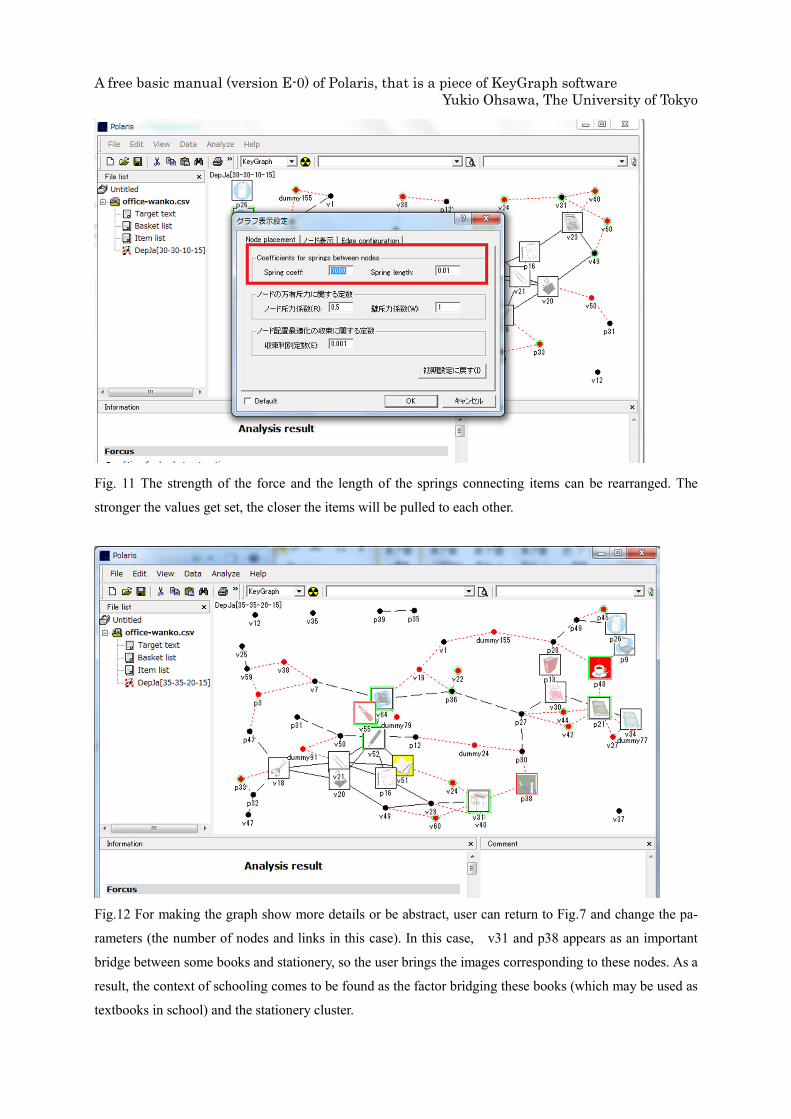
Fig. 11 The strength of the force and the length of the springs connecting items can be rearranged. The
stronger the values get set, the closer the items will be pulled to each other.
Fig.12 For making the graph show more details or be abstract, user can return to Fig.7 and change the pa-
rameters (the number of nodes and links in this case). In this case, v31 and p38 appears as an important
bridge between some books and stationery, so the user brings the images corresponding to these nodes. As a
result, the context of schooling comes to be found as the factor bridging these books (which may be used as
textbooks in school) and the stationery cluster.
A free basic manual (version E-0) of Polaris, that is a piece of KeyGraph software Yukio Ohsawa, The University of Tokyo
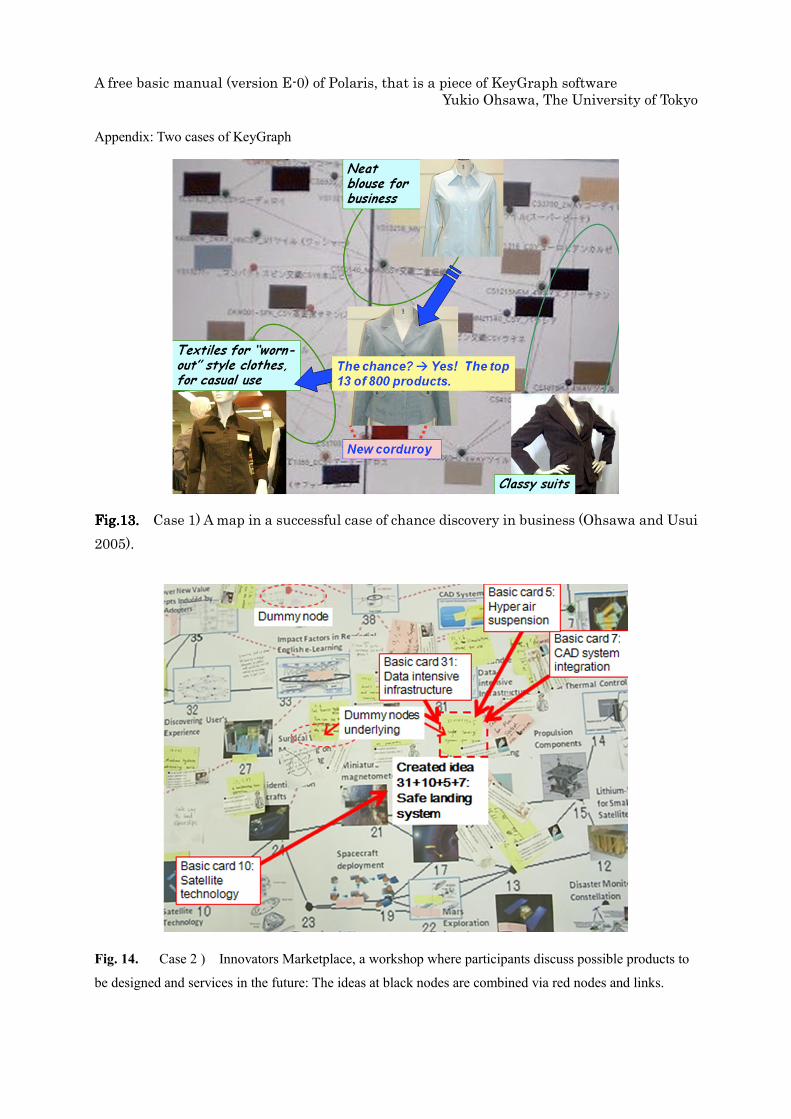
Appendix: Two cases of KeyGraph
Fig.Fig.Fig.Fig.13131313.... Case 1) A map in a successful case of chance discovery in business (Ohsawa and Usui
2005).
Fig. 14. Case 2 ) Innovators Marketplace, a workshop where participants discuss possible products to
be designed and services in the future: The ideas at black nodes are combined via red nodes and links.