insights into the charge carrier terahertz mobility in
TRANSCRIPT
Insights into the Charge Carrier Terahertz Mobility in Polyfluorenesfrom Large-Scale Atomistic Simulations and Time-Resolved TerahertzSpectroscopyNenad Vukmirovic,*,† Carlito S. Ponseca, Jr.,‡ Hynek Nemec,§ Arkady Yartsev,‡ and Villy Sundstrom‡
†Scientific Computing Laboratory, Institute of Physics Belgrade, University of Belgrade, Pregrevica 118, 11080 Belgrade, Serbia‡Division of Chemical Physics, Lund University, Box 124, 221 00 Lund, Sweden§Institute of Physics, Academy of Sciences of the Czech Republic, 182 21 Prague, Czech Republic
*S Supporting Information
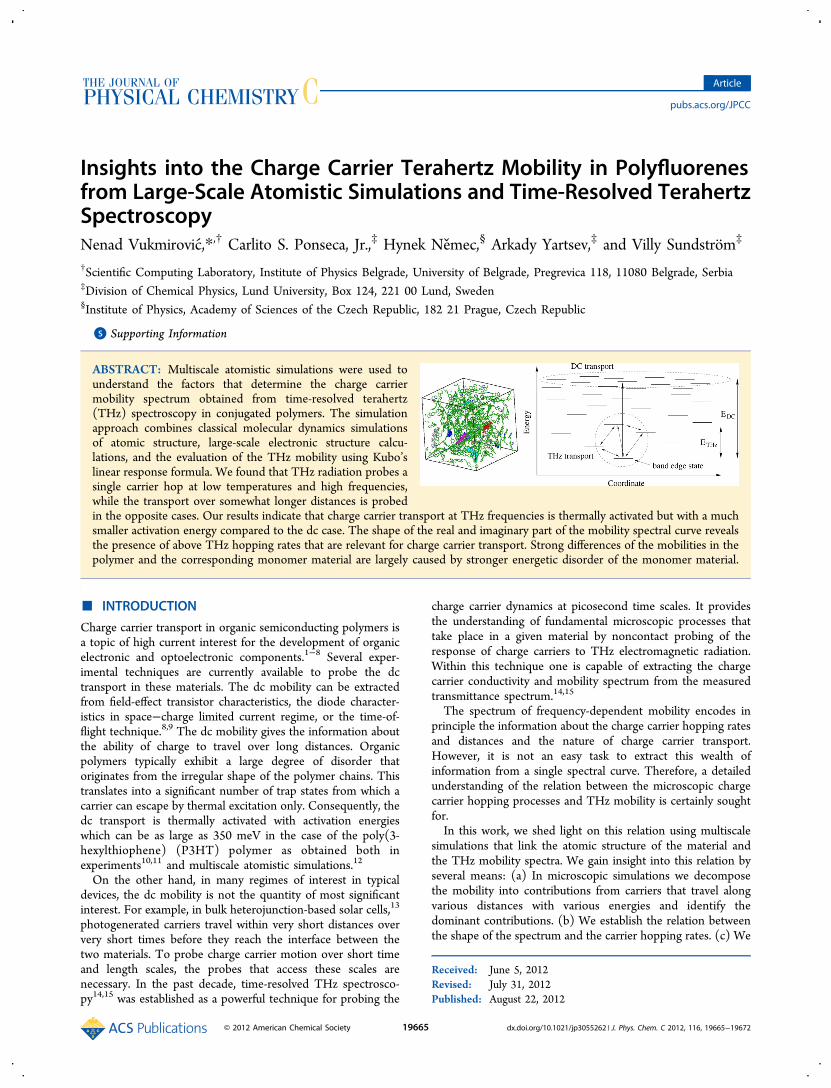
ABSTRACT: Multiscale atomistic simulations were used tounderstand the factors that determine the charge carriermobility spectrum obtained from time-resolved terahertz(THz) spectroscopy in conjugated polymers. The simulationapproach combines classical molecular dynamics simulationsof atomic structure, large-scale electronic structure calcu-lations, and the evaluation of the THz mobility using Kubo’slinear response formula. We found that THz radiation probes asingle carrier hop at low temperatures and high frequencies,while the transport over somewhat longer distances is probedin the opposite cases. Our results indicate that charge carrier transport at THz frequencies is thermally activated but with a muchsmaller activation energy compared to the dc case. The shape of the real and imaginary part of the mobility spectral curve revealsthe presence of above THz hopping rates that are relevant for charge carrier transport. Strong differences of the mobilities in thepolymer and the corresponding monomer material are largely caused by stronger energetic disorder of the monomer material.
■ INTRODUCTION
Charge carrier transport in organic semiconducting polymers isa topic of high current interest for the development of organicelectronic and optoelectronic components.1−8 Several exper-imental techniques are currently available to probe the dctransport in these materials. The dc mobility can be extractedfrom field-effect transistor characteristics, the diode character-istics in space−charge limited current regime, or the time-of-flight technique.8,9 The dc mobility gives the information aboutthe ability of charge to travel over long distances. Organicpolymers typically exhibit a large degree of disorder thatoriginates from the irregular shape of the polymer chains. Thistranslates into a significant number of trap states from which acarrier can escape by thermal excitation only. Consequently, thedc transport is thermally activated with activation energieswhich can be as large as 350 meV in the case of the poly(3-hexylthiophene) (P3HT) polymer as obtained both inexperiments10,11 and multiscale atomistic simulations.12
On the other hand, in many regimes of interest in typicaldevices, the dc mobility is not the quantity of most significantinterest. For example, in bulk heterojunction-based solar cells,13
photogenerated carriers travel within very short distances oververy short times before they reach the interface between thetwo materials. To probe charge carrier motion over short timeand length scales, the probes that access these scales arenecessary. In the past decade, time-resolved THz spectrosco-py14,15 was established as a powerful technique for probing the
charge carrier dynamics at picosecond time scales. It providesthe understanding of fundamental microscopic processes thattake place in a given material by noncontact probing of theresponse of charge carriers to THz electromagnetic radiation.Within this technique one is capable of extracting the chargecarrier conductivity and mobility spectrum from the measuredtransmittance spectrum.14,15
The spectrum of frequency-dependent mobility encodes inprinciple the information about the charge carrier hopping ratesand distances and the nature of charge carrier transport.However, it is not an easy task to extract this wealth ofinformation from a single spectral curve. Therefore, a detailedunderstanding of the relation between the microscopic chargecarrier hopping processes and THz mobility is certainly soughtfor.In this work, we shed light on this relation using multiscale
simulations that link the atomic structure of the material andthe THz mobility spectra. We gain insight into this relation byseveral means: (a) In microscopic simulations we decomposethe mobility into contributions from carriers that travel alongvarious distances with various energies and identify thedominant contributions. (b) We establish the relation betweenthe shape of the spectrum and the carrier hopping rates. (c) We
Received: June 5, 2012Revised: July 31, 2012Published: August 22, 2012
Article
pubs.acs.org/JPCC
© 2012 American Chemical Society 19665 dx.doi.org/10.1021/jp3055262 | J. Phys. Chem. C 2012, 116, 19665−19672

compare the mobility spectra of a polymer to its monomer withand without alkyl side chains and consequently gain insight intothe role of chemical structure of the material. (d) We comparethe simulated mobility spectra to experimental data obtainedusing time-resolved THz spectroscopy and gain insights thatcan be obtained by merging the conclusions from theory andexperiment.As a material for this case study, we have chosen a
polyfluorene copolymer poly[2,7-(9,9-dioctyl-fluorene)-alt-5,5-(4′,7′-di-2-thienyl-2′,1′,3-benzo-thiadiazole)] (APFO-3). Thestructural formula of this polymer is shown in Figure 1. One
period of the polymer consists of a fluorene unit and thebenzothiadiazole acceptor unit sandwiched between the twothiophene donor units. This material and its applicability fororganic photovoltaics have been studied in the past.16−19 Thepresence of a donor−acceptor−donor part in the copolymerleads to a relatively low band gap of the polymer whichtranslates into the ability to absorb a large part of the solarspectrum. On the other hand, the fluorene unit enables goodelectrical transport characteristics typical for polyfluorenes.18
Promising characteristics of solar cells based on this materialhave been reported.17 Recent time-resolved THz spectroscopystudies20,21 of the APFO-3 material blended with fullereneshave provided a wealth of experimental data that can becompared with simulations presented here and furtherinterpreted with the aid of simulation results.
■ SIMULATION METHODOLOGYIn this section, we describe the simulation methodology that weused to link the atomic structure of the material to its mobilityat THz frequencies. The general simulation strategy, schemati-cally illustrated in Figure 2, consists of several steps. At first, we
construct the atomic structure of the material of the size ∼5 nm×5 nm ×5 nm (left panel in Figure 2) from classical moleculardynamics (MD) simulations using a simulated annealingprocedure. For this part of the material, we then calculate theenergies and the corresponding wave functions of hole statesand the probabilities for the hole to hop between differentstates. However, to get reliable information about the carriermobility in the material, a larger simulation cell is necessary.Therefore, we repeat the previous calculation many (∼50)times and construct a larger ∼20 nm ×20 nm ×20 nm system(right panel in Figure 2). On the basis of the calculated hoppingprobabilities, we finally calculate the hole mobility using Kubo’slinear response formula. The details of this general strategy areoutlined below.Although the approach in which classical MD simulations are
combined with quantum mechanical electronic structurecalculations has been used in several studies,22−30 its extensionsto the simulation of dc mobility are rather scarce,12,31,32 and ithas not yet been extended to the treatment of ac mobility.
Simulation of the Atomic Structure of the Material.Atomic structure of the material was obtained from classicalMD using a simulated annealing procedure, in a similar manneras was done previously for polythiophene28,33 and poly(aryl-ethynylene)34 polymers. In the MD simulation, we haveconsidered a system of 11 304 atoms (the system consists of 12chains, each 10 monomer units long, with octyl side chainsattached). Initially, the system is placed in a large box (sidelength of 20 nm) at a high temperature (1000 K). The boxdimensions are then first gradually decreased down to 5.14 nm(which corresponds to the experimental35 density of thematerial of 1 g/cm3). Finally, the system is cooled to roomtemperature and relaxed to a local minimum.In the MD simulations, we have used the CFF91 force
field,36,37 whose parameters were modified as follows. Bondlengths and angles were changed to reproduce the onesobtained from quantum chemical calculations [based on densityfunctional theory (DFT) with the hybrid B3LYP functional38,39
and the 6-31G basis set] of the monomer. Atomic charges inthe force field were taken as the charges of the motifs used inthe charge patching method (this method will be describedbelow). A deficiency of many general classical force fields(including the CFF91) is their inability to properly describe theinterring torsion potentials. Therefore, we have modified theinterring torsion potential terms to reproduce the onesobtained from quantum chemical calculations. The details ofthe modification of the force field and the validation of themodified force field are given in the Supporting Information.MD simulations were performed using the LAMMPS code,40,41
while the B3LYP calculation was performed using theNWChem42 code.
Calculation of the Electronic Structure of the Materi-al. The atomic structure obtained using the procedure outlinedin the previous section was then used as input for thecalculation of electronic structure of the material. Electronicstructure of the material was obtained using the charge patchingmethod (CPM)28,43 and the overlapping fragments method(OFM).33,44
The CPM is a method for obtaining the electronic chargedensity of the system which has the accuracy similar to that ofDFT in the local density approximation (LDA). It is based onthe idea that the electronic charge density around an atomdepends only on its local environment and that it is the same insome small prototype system and in the large system that we
Figure 1. Chemical formula of APFO-3 polymer.
Figure 2. Scheme of the multiscale simulation procedure. Left: theprobability density isosurfaces of several top states in the valence bandfor the 11 304 atom portion of the material. The isosurfacescorrespond to 50% probability of finding the charge inside the surface.The HOMO level is shown in blue, HOMO − 1 in red, HOMO − 2in pink, HOMO − 3 in light blue, and HOMO − 4 in gray. Thecorresponding eigenenergies (in eV) are, respectively, 7.303, 7.227,7.140, 7.102, 7.096. Right: the 4 × 4 × 4 system used for thecalculation of mobility.
The Journal of Physical Chemistry C Article
dx.doi.org/10.1021/jp3055262 | J. Phys. Chem. C 2012, 116, 19665−1967219666

are interested in. The electronic charge density of the largesystem is therefore obtained by simply adding the contributionsof individual atoms (these contributions are called motifs). Themotifs were extracted from DFT/LDA calculations for amonomer. Once the electronic charge density is obtained, onecan also get the single-particle potential experienced by anelectron in the system.Since CPM is an approximation to a full DFT/LDA
calculation, it is desirable to verify its accuracy on some smallersystem where it is still feasible to perform a DFT/LDAcalculation. The test that verifies the accuracy of the CPM isgiven in the Supporting Information.The OFM is the method for the diagonalization of a single-
particle Hamiltonian, for example, the one obtained using theCPM. It is based on the division of the system into (mutuallyoverlapping) fragments and the representation of theHamiltonian in the basis of eigenfunctions of these fragments.The details of the application of the OFM method to theAPFO-3 polymer system and the verification of its accuracy aregiven in the Supporting Information.The wave functions and eigenenergies of several top states in
the valence band for one realization of the 11 304 atom systemare given in Figure 2, left panel. The wave functions arelocalized due to a disordered shape of the chains, and thecharge carrier transport in the system takes place by carrierhopping between such localized states.Calculation of Hopping Probabilities between Hole
States. The probability for downhill hopping between states iand j in a unit of time should in principle be calculated bytaking into account the interaction with all phonon modesas12,45
∑πω
ω δ ε ε ω=| |
ℏ + − − ℏα
α
αα αW N[ ( ) 1] ( )ij
iji j
,2
(1)
where ij,α = ⟨ψi|∂H/∂να|ψj⟩ is the electron−phonon couplingconstant between electronic states i and j due to phonon modeα, ∂H/∂να is the change of the single-particle Hamiltonian dueto atomic displacements according to phonon mode α, ℏωα isthe energy of that mode, N(hωα) = (exp(hωα/kBT) − 1)−1 isthe phonon occupation number given by the Bose−Einsteindistribution at a temperature T, and εi is the energy ofelectronic state i.However, such calculations for the 11 304 atom system
would be too computationally demanding, because they requirethe calculation of the change of the single-particle Hamiltonianwith respect to displacement of each atom in the system.Fortunately, we have recently shown in the case of P3HTpolymer that the expression given by eq 1 can be reasonablywell approximated with the expression
β ε ε ε= +W N D[ ( ) 1] ( )/ij ij ij ij ijmodel 2 2
ph (2)
which assumes that ij,α is simply proportional to the overlapij = ∫ d3r|ψi(r)|·|ψj(r)| of the wave function moduli. In eq 2,
Dph(E) is the phonon density of states normalized such that∫ 0∞Dph(E) dE = 1, εij = |εi − εj|, and β is the proportionality
factor.We find that the same expression can be used in the case of
the APFO-3 polymer as well. The density of phonon states wascalculated from the same classical force field used in MDsimulations and is shown in Figure 7 in the SupportingInformation. To extract the factor β for APFO-3, we have
performed the calculation of Wij (eq 1) using the methodologyof ref 12 for the 2360 atom system where it is still feasible to dothe calculation of all electron−phonon coupling constants. Wefind that the best agreement betweenWij andWij
model is achievedwith the parameter β = 3.7 × 10⁶ eV s−1/2. The comparison ofWij and Wij
model for this value of β is given in Figure 8 in theSupporting Information. A discussion of the validity of theapproximation where Wij is replaced by Wij
model is also given inthe Supporting Information.With hopping rates between different states at hand, one can
derive the formula for the ac mobility in the system. However,our electronic structure calculations were performed for a boxof ∼5 nm size and the simulated charge motion would beartificially restricted to the box size. Despite the fact that THzradiation probes the carrier motion over short distances, wefind that these distances need to be larger than ∼5 nm. Thissuggests that we need to go one length scale further in oursimulation and construct a larger, say 4 × 4 × 4, system. Thecalculations for the ∼5 nm boxes were therefore repeated 50times, and each of the cells in the 4 × 4 × 4 system correspondsto one ∼5 nm box, randomly chosen and randomly oriented.The intracell hopping rates in the 4 × 4 × 4 system are availablefrom the calculation in the ∼5 nm box, while the intercellhopping rates were approximated in the same manner as in ref12.
Derivation of the Formula for ac Mobility in aHopping Model. With hopping rates between different statesat hand, one can evaluate the ac mobility for carrier hoppingtransport as follows.The system consists of a set of sites i with spatial coordinates
Ri and energies Ei. With the probability that the carrier hopsfrom site i to site j in a unit of time given as Wij, rate equationsfor evolution of populations of states ni in time are
∑=nt
A ndd
i
jij j
(3)
where
∑δ= −A W Wij ji ijk
ik(4)
The carrier that is initially (at t = 0) placed at a certain site willhop to other sites as time evolves. Let Δ2(t) be the mean squarespread of the position of the carrier at time t. The ac mobility ofthe carrier is related to Δ2(t) by Kubo’s formula15,46,47
∫μ ω ω= − ⟨Δ ⟩α
α ω
→
∞−
k Tt t( )
e2
lim d e e ( )t t2
B 0 0
i 2
(5)
which is valid for carriers in thermal equilibrium at atemperature T. The factor e−αt can be interpreted as a weakcoupling of the system and the rest of universe.46 This factorensures the convergence of the integral in eq 5. For a carrierinitially placed at site a, the mean square spread of its positionat time t is given as
∑⟨Δ ⟩ = −R Rt n t( ) ( )( )i aai
ia2 2
(6)
where nia(t) is the solution of the system of equations (eq 3)
with the initial condition ni(0) = δia. To calculate ⟨Δ2(t)⟩ fromeq 5 one has to average ⟨Δ2(t)⟩a (eq 6) over all possible initialstates as
The Journal of Physical Chemistry C Article
dx.doi.org/10.1021/jp3055262 | J. Phys. Chem. C 2012, 116, 19665−1967219667

∑⟨Δ ⟩ = ⟨Δ ⟩t w t( ) ( )a
a a2 2
(7)
where
=−
∑ −w
E k TE k T
exp( / )exp( / )a
a
i i
B
B (8)
One therefore obtains the following expression for the mobility
∫∑μ ω ω= − −α
α ω
→
∞−R R
k Tw t n t( )
e2
( ) lim d e e ( )i ai a
at t
ia
2
B ,
2
0 0
i
(9)
If we denote the last integral of the above expression as
∫=α
α ω
→
∞−I t n tlim d e e ( )ia
t tia
0 0
i(10)
and perform the integration by parts, we obtain
∑ω ω
= +In
A I(0)
i1
iiaia
jij ja
(11)
Since nia(0) = δia, the last equation in matrix form reads
ω ω= +I A I[ ]
1i
1i
[ ][ ](12)
and therefore
ω= − −I A[ ] (i [ ]) 1(13)
The final expression for the mobility therefore reads
∑μ ω ω ω−= − − −R Rk T
w A( )e
2( ) [(i [ ]) ]i a
i aa ia
2
B ,
2 1
(14)
■ RESULTS AND DISCUSSIONMobility of Holes in APFO-3. The ac mobility of holes in
APFO-3 was calculated by modeling the transition ratesbetween the states using eq 2 and calculating the mobilityfrom eq 14. The calculations were repeated for 100 differentrealizations of the 4 × 4 × 4 system, and the final mobility istaken as the average over these realizations. The real part of themobility for 100 different realizations of the 4 × 4 × 4 system isshown in Figure 9 in the Supporting Information. These resultsindicate that fluctuations of the mobility for differentrealizations of the system are not large and that the averageof these values can be reliably taken as the mobility of the bulkmaterial.The frequency dependence of the mobility for several
different temperatures is shown in Figure 3. We find that thereal part of the mobility is positive and increases when thefrequency increases, while the imaginary part of the mobility isnegative and decreases (becomes more negative) when thefrequency increases. Experimental time-resolved THz spectrameasured by our group showed similar shape of spectra forboth real and imaginary part of the mobility.20,21 In theliterature, this type of response is typically assigned to carriersthat are localized.14,15 Such a behavior differs from the Druderesponse of delocalized carriers, which exhibits a real partdecreasing with frequency and positive imaginary part ofmobility. Below we discuss the nature of the “localized”response and we draw additional conclusions on the relationbetween carrier transport and shape of the mobility spectrum.
First of all, the shape of the spectrum in the THz rangeshows that there are hopping rates well above THz frequenciesthat are highly relevant for the transport in the system. This wassuggested in conjunction with a very simple model consideringan exponential distribution of hopping times over a constantdistance.48 Here we investigate a more sophisticated toy modelincluding a Gaussian distribution of energy levels and, namely,the relation between the distribution of hopping rates and themobility spectrum. In such a simple model one can easilychange the form of the hopping rates and consequentlyunderstand their effect on the mobility spectrum. In Figure 4,
we first show the mobility spectrum when downhill hoppingrates take the Miller−Abrahams form Wij = W0 exp(−αrij/a),with α = 4.5, where W0 = 1014 s−1. In this case (labeled as case1), the largest hopping rates are between nearest neighbors andare approximately Wij = 1012 s−1. In case 2 shown in Figure 4,W0 is assumed to take the form W0 = 10r s−1, where r is arandom number uniformly distributed between 12 and 16. Case1 represents the case where there is no large dispersion in thevalues of hopping rates, while in case 2 the hopping rates varyby at least 4 orders of magnitude. In both cases, we find thatthere is a characteristic frequency ∼maxWij/(2π). At thisfrequency, there is a negative peak in the imaginary part whilethe real part saturates above this frequency. These resultstherefore suggest that the mobility spectrum encodes theinformation about the maximal relevant hopping rates in thesystem. Consequently, the increasing real part and the negative
Figure 3. Frequency dependence of the mobility of holes in APFO-3polymer at several temperatures.
Figure 4. Charge carrier mobility in a simple one-dimensional hoppingmodel. The lattice spacing is a = 1 nm, the temperature is T = 300 K.Site energies are assumed to have a Gaussian distribution withstandard deviation σ = 0.1 eV. Downhill hopping rates are assumed tobe of the form Wij = W0 exp(−αrij/a), with α = 4.5, where W0 = 1014
s−1 (case 1) or W0 = 10r s−1 (case 2), where r is a random numberuniformly distributed between 12 and 16.
The Journal of Physical Chemistry C Article
dx.doi.org/10.1021/jp3055262 | J. Phys. Chem. C 2012, 116, 19665−1967219668

(almost linearly decreasing) imaginary part in the APFO-3material at THz frequencies clearly indicate that there areabove-THz hopping rates that strongly contribute to the carriermobility spectrum. We note that we have used this toy modelonly to understand the relation between hopping rates and themobility spectrum. In the rest of the paper, we will present theresults obtained from a detailed atomistic multiscale simulationmethodology.Deeper understanding of the type of carrier motion that leads
to the measured mobility spectra is certainly sought for. Hand-waving arguments suggest that THz radiation probes themotion of carriers over short distances because the carrier doesnot have enough time to cross large distances during oneperiod of the wave. However, there is a need to quantify thelength of these short distances. To achieve this, we decomposeeq 14 into contributions from individual terms. We then classifythese terms according to the travel distance |Ri − Ra| of thecarrier. In that way, we get the distance-resolved mobility,which we show in Figure 5. At low temperatures, the carriers
probed by 1 THz radiation travel to the distances of the orderof ∼3 nm only, which corresponds to one or two hops only. Onthe other hand, as the temperature increases, the probedcarriers travel over larger distances. When the change ofdistance-resolved mobility with frequency is concerned, one cansee from Figure 6 that higher frequencies probe the motion ofthe carriers over shorter distances, leading eventually to theprobing of a single hop at a frequency which is high enough.Figure 6 indicates that at frequencies above ∼1 THz the largestcontribution comes from travel distances of the order of ∼3 nmregardless of the frequency of probing radiation. This suggeststhat at these frequencies one has entered the regime where the
ac mobility is dominated by a single carrier hop. Consequently,the maximum of distance-resolved mobility will stay at the sameposition with further increase in frequency. On the other hand,at frequencies below 0.1 THz one expects that the maximum ofdistance-resolved mobility will shift to larger distances.However, to perform simulations at these frequencies, oneneeds a larger supercell and the simulations become computa-tionally too expensive. Overall, the simulation results indicatethat at low temperatures and high frequencies the THz mobilityessentially represents the dynamics of hopping rates. On theother hand, at high temperatures and low frequencies, it is thetransport over ∼(5−10) nm distances that gives the dominantcontribution to the mobility spectrum. Transient absorptionmeasurements previously reported by our group showed thatthe electron−hole separation distance right after photo-excitation is 3.4 nm for APFO-3:[60]PCBM and 4.6 nm forAPFO-3:[70]PCBM.19 This estimate can be interpreted as thedistance traveled by a hole within the polymer chain whereelectrons in PCBM are less mobile than holes in the polymer.21
The fact that transport distances probed by THz radiation aresimilar to travel distances in the process of charge generationmakes time-resolved THz spectroscopy an excellent tool toinvestigate the process of charge generation in organicphotovoltaics.To further understand the calculated mobility spectra, and in
particular its temperature dependence, we also define theenergy-resolved mobility by classifying the terms in eq 14according to the energy of the initial state Ea. Thisdecomposition of the mobility is shown in Figure 7. The
results indicate that, as the temperature increases, thecontributions from energies deeper below the top of thevalence band states become increasingly important. This, inturn, leads to the increase of mobility at higher temperatures ascan be seen from Figure 3. Nevertheless, this increase is muchsmaller than for dc mobility. To quantify this difference we haveperformed also the simulation of dc mobility of the APFO-3polymer using similar multiscale methodology for dc transportintroduced in ref 12. We find that a rise in temperature from200 to 400 K leads to an increase of THz mobility by a factor of30, while at the same time the dc mobility increases by a factorof 1300.On the basis of the results of the simulations, we can provide
the following simplified picture (Figure 8) that can be used to
Figure 5. Distance-resolved mobility of holes in APFO-3 polymer atseveral temperatures and f = 1 THz.
Figure 6. Distance-resolved mobility of holes in APFO-3 polymer atseveral frequencies and T = 300 K.
Figure 7. Energy-resolved mobility of holes in APFO-3 polymer atseveral temperatures and f = 1 THz. The electronic density of states isalso given as the reference.
The Journal of Physical Chemistry C Article
dx.doi.org/10.1021/jp3055262 | J. Phys. Chem. C 2012, 116, 19665−1967219669

understand the results obtained. The figure represents thedistribution of carriers in space (x-axis) and energy (y-axis)which is typical for a disordered material. At low temperaturesalmost all carriers are in the ground state and can possibly hoponly to some of the very few neighboring states. As aconsequence, the mobility spectrum essentially describes thedynamics of single carrier hops. On the other hand, atsomewhat larger temperatures the carriers start to occupyhigher energy states. These are more abundant, and therefore,the carriers at these energies are capable of traveling overdistances that correspond to more than a single carrier hop.The scheme from the figure also demonstrates the reason ofmuch smaller activation energy for THz mobility in comparisonto dc mobility. For THz mobility, it is sufficient to have thecarriers excited to energies where a relatively large number ofneighboring states exist. On the other hand to get significantvalues of dc mobility one must excite the carriers to a band ofdelocalized states, or at least to the energies where the localizedstates are dense enough so that a percolating path can beformed. This simplified picture can be also used to understandthe frequency dependence of mobility obtained in Figure 3,where the magnitudes of both the real and imaginary parts ofmobility are an increasing function of frequency. When probedby high-frequency radiation, the carriers can travel only oververy short distances during the period of the wave. Therefore,the probability that the carriers will be trapped at some statesfrom the tail of the density of states is rather low andconsequently their high-frequency mobility is high. This is nolonger the case when carriers are probed by low-frequencyradiation: in this case, they travel over longer distances, andtherefore they get frequently trapped in tail states during theperiod of the wave, which makes their low-frequency mobilitylow.The simulations presented are based on Kubo’s linear
response formula which assumes that charge carriers havereached thermal equilibrium at the time of probing. In thisparagraph we discuss the range of validity of such anassumption, which clearly depends on the experimentalconditions. If the pump−probe delay is longer than the carrierequilibration time then the carriers are in equilibrium at thetime of probing. Several studies in the past49,50 demonstratedthat the equilibration time of charge carriers strongly dependson the degree of disorder and temperature, where strongdisorder and small temperatures favor large equilibration times.Our recent time-resolved THz spectroscopy studies51 ofpolymer−fullerene blends at room temperature indicate thatat higher photon flux the transient THz conductivity exhibits afast (several picoseconds) decay, followed by a slower decay
(hundreds of picoseconds to nanoseconds). At lower photonflux the fast decay disappears, but the slow decay remainspresent. The fast decay was assigned to originate from chargepair annihilation process present at high excitation densities,while it remains unclear whether the slower decay originatesfrom charge carrier cooling or trapping. These results suggestthat a certain type of quasi-equilibrium is formed severalpicoseconds after the excitation and that the assumption ofthermal equilibrium is likely to be valid then.
Comparison of Mobilities in the Material Consistingof Polymers and Monomers. To understand the differencesbetween the mobility of APFO-3 polymer material and theAPFO-3 monomer material, we have performed detailedsimulations for both of these. In contrast to APFO-3 polymersin our samples, that have octyl side chains attached to the mainpolymer chain, the monomers in our samples do not have theside chains. As a consequence, two effects lead to differences inthe measured mobilities of the two samples: polymer versusmonomer effect and the side chain effect. Concerning thepolymer versus monomer effect, it is expected that the samplewith polymers will exhibit a higher mobilitycarriers are freeto move along long polymer chainswhereas such a transportis inhibited in monomers. However, it is not straightforward topredict whether octyl side chains act to reduce or increase themobility. On the one hand, octyl side chains act as insulatingbarriers, and as a consequence one may expect that they inhibitthe transport since they prevent the interchain carrier hopping.On the other hand, the presence of octyl side chains alsoincreases the distance between the main polymer chains. Thisacts to reduce the disorder introduced by other main polymerchains on a particular chain. Reduced disorder leads to anincrease of carrier mobility.To distinguish between the effect of side chains and the
polymer versus monomer effect we have also performed thesimulation on a system that consists of APFO-3 monomerswith side chains. In Figure 9, we compare the mobilities of the
three systems that we studied. APFO-3 polymer with sidechains exhibits a higher mobility than APFO-3 monomer withside chains, which clearly demonstrates the role of polymerversus monomer effect. The comparison of mobilities ofmonomer with and without side chains indicates that thepresence of side chains increases the mobilityin other wordstheir role in reducing the disorder is more pronounced thantheir action as insulating barriers.
Figure 8. Schematic description of THz and dc transport in adisordered system. ETHz and Edc correspond to rough estimates ofactivation energies for THz and dc transport. The energy scale isreversed in comparison to Figure 7.
Figure 9. Frequency dependence of the mobility at T = 300 K for thematerial consisting of APFO-3 polymers, APFO-3 monomers withoctyl side chains, and APFO-3 monomers without alkyl side chains.
The Journal of Physical Chemistry C Article
dx.doi.org/10.1021/jp3055262 | J. Phys. Chem. C 2012, 116, 19665−1967219670

To verify this conclusion about the importance of disorder,in Figure 10 we compare the density of electronic states of the
three systems studied. We find that the tail of the density ofstates in the monomer material with side chains is narrowerthan in the case of monomer without side chains, whichsuggests that the disorder is stronger in the material withmonomers without side chains, in agreement with the previousconclusion. The strength of the disorder originates from thepresence of built-in electric dipoles in the donor−acceptor partof the system. In a disordered system, these dipoles arerandomly oriented and each of them creates an electrostaticfield which causes the fluctuations in the single-particlepotential through space.Results of THz time-resolved experiments on the APFO-3
monomer without side chains and the APFO-3 polymer, bothblended with PCBM, showed 6 times difference in theirtransient photoconductivity. We were able to show that, forAPFO-3 monomer blend, the THz radiation probes the motionof electrons in PCBM, while for APFO-3 polymer blend it isthe mobility of holes in the polymer that is probed.21 This isconsistent with the calculation where the hole mobility for themonomer is 3 orders of magnitude less than the hole mobilityin the polymer. Furthermore, by increasing the number ofrepeat units in the polymer from 26 to 150, we obtained asystematic increase in the hole THz mobility.21 This is also inagreement with the calculation results where less disorder(longer polymer chain) is associated with higher holemobility.21
■ CONCLUSIONSIn conclusion, we have used atomistic multiscale simulations tounderstand the origin of the carrier mobility spectrum indisordered organic polymers at THz frequencies and theinformation that can be extracted from such experimentalspectra. We find that at high frequencies and low temperaturesthe THz radiation probes essentially a single carrier hop, whileotherwise it probes the carrier transport over somewhat longer(∼5−10 nm) distances. This leads to a temperature depend-ence with much smaller activation energy in comparison to dctransport. The shape of the real and imaginary part of themobility spectrum suggests that hopping rates at frequencieshigher than THz are also of high relevance for the transport in
the system. Comparison of the mobilities of monomer andpolymer material indicates that better transport in polymermaterial originates not only from the ability of the carrier totravel over longer distances in polymer material but also fromthe higher energetic disorder in the monomer material. Ourresults decipher the information encoded in the THz mobilityspectrum, contribute to better understanding of charge carrierdynamics in disordered conjugated polymers, and provideguidelines for the interpretation of measured THz mobilityspectra.
■ ASSOCIATED CONTENT*S Supporting Information(1) Description of the procedure for fitting of the interringtorsion terms in classical force field, (2) the comparison ofCPM and DFT/LDA results, (3) the details of the applicationof the OFM and the verification of its accuracy, (4) the densityof phonon states, (5) the comparison of transition ratesobtained by two approaches, and (6) THz mobility spectra fordifferent realizations of the system. This material is availablefree of charge via the Internet at http://pubs.acs.org.
■ AUTHOR INFORMATIONCorresponding Author*E-mail: [email protected] authors declare no competing financial interest.
■ ACKNOWLEDGMENTSN.V. is supported by European Community FP7 Marie CurieCareer Integration Grant (ELECTROMAT), Serbian Ministryof Science (project ON171017), and FP7 projects PRACE-1IP,PRACE-2IP, HP-SEE, and EGI-InSPIRE. The Swedish EnergyAgency (STEM), the Swedish Research Council, the Knut &Alice Wallenberg foundation and the European ResearchCouncil (Advanced Investigator Grant to V.S., 226136-VISCHEM) are also acknowledged.
■ REFERENCES(1) Forrest, S. R. Nature (London) 2004, 428, 911−918.(2) Berggren, M.; Nilsson, D.; Robinson, N. D. Nat. Mater. 2007, 6,3−5.(3) Kim, Y.; Cook, S.; Tuladhar, S. M.; Choulis, S. A.; Nelson, J.;Durrant, J. R.; Bradley, D. D. C.; Giles, M.; McCulloch, I.; Ha, C.-S.;Ree, M. Nat. Mater. 2006, 5, 197−203.(4) Klauk, H.; Zschieschang, U.; Pflaum, J.; Halik, M. Nature(London) 2007, 445, 745−749.(5) Yan, H.; Chen, Z.; Zheng, Y.; Newman, C.; Quinn, J. R.; Dotz, F.;Kastler, M.; Facchetti, A. Nature (London) 2009, 457, 679−686.(6) Rogers, J. A.; Someya, T.; Huang, Y. Science 2010, 327, 1603−1607.(7) Giri, G.; Verploegen, E.; Mannsfeld, S. C. B.; Atahan-Evrenk, S.;Kim, D. H.; Lee, S. Y.; Becerril, H. A.; Aspuru-Guzik, A.; Toney, M. F.;Bao, Z. Nature (London) 2011, 480, 504−508.(8) Coropceanu, V.; Cornil, J.; da Silva Filho, D. A.; Olivier, Y.;Silbey, R.; Bredas, J.-L. Chem. Rev. 2007, 107, 926−952.(9) Tiwari, S.; Greenham, N. C. Opt. Quantum. Electron. 2009, 41,69−89.(10) Tanase, C.; Meijer, E. J.; Blom, P. W. M.; de Leeuw, D. M. Phys.Rev. Lett. 2003, 91, 216601.(11) Craciun, N. I.; Wildeman, J.; Blom, P. W. M. Phys. Rev. Lett.2008, 100, 056601.(12) Vukmirovic, N.; Wang, L.-W. Nano Lett. 2009, 9, 3996−4000.(13) Bredas, J. L.; Norton, J. E.; Cornil, J.; Coropceanu, V. Acc. Chem.Res. 2009, 42, 1691−1699.
Figure 10. Comparison of the density of hole states of the materialconsisting of (a) APFO-3 polymers, (b) APFO-3 monomers with octylside chains, and (c) APFO-3 monomers without alkyl side chains. Thelines serve as a guide to the eye to demonstrate different widths of thetail of the density of states.
The Journal of Physical Chemistry C Article
dx.doi.org/10.1021/jp3055262 | J. Phys. Chem. C 2012, 116, 19665−1967219671

(14) Ulbricht, R.; Hendry, E.; Shan, J.; Heinz, T. F.; Bonn, M. Rev.Mod. Phys. 2011, 83, 543−586.(15) Nemec, H.; Kuzel, P.; Sundstrom, V. J. Photochem. Photobiol., A2010, 215, 123−139.(16) Kitamura, C.; Tanaka, S.; Yamashita, Y. Chem. Mater. 1996, 8,570−578.(17) Inganas, O.; Zhang, F.; Andersson, M. R. Acc. Chem. Res. 2009,42, 1731−1739.(18) Inganas, O.; Svensson, M.; Zhang, F.; Gadisa, A.; Persson, N. K.;Wang, X.; Andersson, M. R. Appl. Phys. A: Mater. Sci. Process. 2004, 79,31−35.(19) Pal, S. K.; Kesti, T.; Maiti, M.; Zhang, F.; Inganas, O.;Hellstrom, S.; Andersson, M. R.; Oswald, F.; Langa, F.; Osterman, T.;Pascher, T.; Yartsev, A.; Sundstrom, V. J. Am. Chem. Soc. 2010, 132,12440−12451.(20) Nemec, H.; Nienhuys, H.-K.; Zhang, F.; Inganas, O.; Yartsev, A.;Sundstrom, V. J. Phys. Chem. C 2008, 112, 6558−6563.(21) Ponseca, C. S., Jr.; Nemec, H.; Vukmirovic, N.; Fusco, S.; Wang,E.; Andersson, M.; Chabera, P.; Yartsev, A.; Sundstrom, V. J. Phys.Chem. Lett. 2012, 3, 2442−2446.(22) Yang, H.-C.; Hua, C.-Y.; Kuo, M.-Y.; Huang, Q.; Chen, C.-L.ChemPhysChem 2004, 5, 373−381.(23) Kilina, S.; Batista, E.; Yang, P.; Tretiak, S.; Saxena, A.; Martin, R.L.; Smith, D. ACS Nano 2008, 2, 1381−1388.(24) Yang, P.; Batista, E. R.; Tretiak, S.; Saxena, A.; Martin, R. L.;Smith, D. L. Phys. Rev. B 2007, 76, 241201.(25) McMahon, D. P.; Troisi, A. Chem. Phys. Lett. 2009, 480, 210−214.(26) Ruhle, V.; Kirkpatrick, J.; Andrienko, D. J. Chem. Phys. 2010,132, 134103.(27) Cheung, D. L.; McMahon, D. P.; Troisi, A. J. Am. Chem. Soc.2009, 131, 11179−11186.(28) Vukmirovic, N.; Wang, L.-W. J. Phys. Chem. B 2009, 113, 409−415.(29) Zhang, G.; Pei, Y.; Ma, J.; Yin, K.; Chen, C.-L. J. Phys. Chem. B2004, 108, 6988−6995.(30) Zhang, G.; Ma, J.; Wen, J. J. Phys. Chem. B 2007, 111, 11670−11679.(31) Vukmirovic, N.; Wang, L.-W. Phys. Rev. B 2010, 81, 035210.(32) Zhang, X.; Li, Z.; Lu, G. Phys. Rev. B 2010, 82, 205210.(33) Vukmirovic, N.; Wang, L.-W. J. Phys. Chem. B 2011, 115, 1792−1797.(34) Granadino-Roldan, J.; Vukmirovic, N.; Fernandez-Gomez, M.;Wang, L.-W. Phys. Chem. Chem. Phys. 2011, 13, 14500−14509.(35) Anselmo, A. S.; Lindgren, L.; Rysz, J.; Bernasik, A.; Budkowski,A.; Andersson, M. R.; Svensson, K.; van Stam, J.; Moons, E. Chem.Mater. 2011, 23, 2295−2302.(36) Hwang, M. J.; Stockfisch, T. P.; Hagler, A. T. J. Am. Chem. Soc.1994, 116, 2515−2525.(37) Maple, J. R.; Hwang, M.-J.; Stockfisch, T. P.; Dinur, U.;Waldman, M.; Ewig, C. S.; Hagler, A. T. J. Comput. Chem. 1994, 15,162−182.(38) Becke, A. D. J. Chem. Phys. 1993, 98, 5648.(39) Stephens, P. J.; Devlin, F. J.; Chabalowski, C. F.; Frisch, M. J. J.Phys. Chem. 1994, 98, 11623−11627.(40) LAMMPS Molecular Dynamics Simulator; http://lammps.sandia.gov (accessed September 3, 2012).(41) Plimpton, S. J. J. Comput. Phys. 1995, 117, 1−19.(42) Bylaska, E. J.; et al. NWChem, A Computational ChemistryPackage for Parallel Computers, version 5.1; Pacific Northwest NationalLaboratory: Richland, WA, 2007.(43) Vukmirovic, N.; Wang, L.-W. J. Chem. Phys. 2008, 128, 121102.(44) Vukmirovic, N.; Wang, L.-W. J. Chem. Phys. 2011, 134, 094119.(45) Vukmirovic, N.; Wang, L.-W. Appl. Phys. Lett. 2010, 97, 043305.(46) Scher, H.; Lax, M. Phys. Rev. B 1973, 7, 4491−4502.(47) Grozema, F. C.; Siebeless, L. D. A. Int. Rev. Phys. Chem. 2008,27, 87−138.(48) Nemec, H.; Nienhuys, H.-K.; Perzon, E.; Zhang, F.; Inganas, O.;Kuzel, P.; Sundstrom, V. Phys. Rev. B 2009, 79, 245326.
(49) Bassler, H. Phys. Status Solidi B 1993, 175, 15−56.(50) Movaghar, B.; Grunewald, M.; Ries, B.; Bassler, H.; Wurtz, D.Phys. Rev. B 1986, 33, 5545−5554.(51) Ponseca, C. S., Jr.; Yartsev, A.; Wang, E.; Andersson, M. R.;Vithanage, D.; Sundstrom, V. J. Am. Chem. Soc. 2012, 134, 11836−11839.
The Journal of Physical Chemistry C Article
dx.doi.org/10.1021/jp3055262 | J. Phys. Chem. C 2012, 116, 19665−1967219672

Supporting information for: Insights into the charge
carrier terahertz mobility in polyfluorenes from
large-scale atomistic simulations and time-resolved
terahertz spectroscopy
Nenad Vukmirovic,∗,† Carlito S. Ponseca Jr.,‡ Hynek Nemec,¶ Arkady Yartsev,‡
and Villy Sundström‡
Scientific Computing Laboratory, Institute of Physics Belgrade, University of Belgrade,
Pregrevica 118, 11080 Belgrade, Serbia, Division of Chemical Physics, Lund University, Box
124, 221 00 Lund, Sweden, and Institute of Physics, Academy ofSciences of the Czech Republic,
182 21 Prague, Czech Republic
E-mail: [email protected]
∗To whom correspondence should be addressed†Scientific Computing Laboratory, Institute of Physics Belgrade, University of Belgrade, Pregrevica 118, 11080
Belgrade, Serbia‡Division of Chemical Physics, Lund University, Box 124, 22100 Lund, Sweden¶Institute of Physics, Academy of Sciences of the Czech Republic, 182 21 Prague, Czech Republic
S1

Fitting of the interring torsion terms in the classical force field
A deficiency of many general classical force fields (including the CFF91) is their inability to prop-
erly describe the interring torsion potentials. The most important torsion angles that actually deter-
mine the shape of the polymer chains are the angles S456 and 123S denoted in Figure 1. Therefore,
we have modified the interring torsion potential terms to reproduce the ones obtained from quan-
tum chemical calculations according to the following procedure.
First, a quantum chemical calculation of the total energy ofthe monomer structure shown in
Figure 1 was performed for different values of the torsion angle S456, while all other internal
coordinates of the molecule were kept fixed. The quantum chemical calculation was based on
density functional theory (DFT) with the hybrid B3LYP functional1,2 and the 6-31G basis set.
From this calculation one obtains the quantum chemical torsion potential profileE1(α), shown
in dots in Figure 2, whereα is the torsion angle. Next, the dependence of the energy of the
structure on the same torsion angleE′1(α) was calculated using a classical force field, where all
interring torsion potentials were removed from the force field. The differenceE1(α)−E′1(α) was
then fitted to an expressionf1(t) = a0+a1 · t +a2 · t2+a3 · t3+a4 · t4, wheret = cosα. The best
fit was obtained with the parametersa0 = 9.1371kcalmol , a1 = −0.0092351kcal
mol , a2 = −6.7663kcalmol ,
a3 = 1.5724kcalmol , a4 =−0.68487kcal
mol .
SS
N
NS
12 3 4 5
6
Figure 1: Chemical structure of APFO-3 polymer. The relevantinterring torsion angles 123S andS456 are denoted in the figure.
Next, the same procedure was repeated where the angle 123S was changed, rather than S456.
The difference between quantum chemical energyE2(α) (shown in dots in Figure 3) and classical
force field without the interring potentials energyE′2(α) was again fitted to the expressionf2(t) =
S2

0 30 60 90 120 150 180First torsion angle (degrees)
0
0.05
0.1
0.15
0.2
0.25
Ene
rgy
(eV
)
B3LYP calculationClassical force field calculation
Figure 2: The dependence of the energy of the structure on thefirst torsion angle (the angle denotedas S456 in Figure 1).
0 30 60 90 120 150 180Second torsion angle (degrees)
0
0.05
0.1
0.15
Ene
rgy
(eV
)
B3LYP calculationClassical force field calculation
Figure 3: The dependence of the energy of the structure on thesecond torsion angle (the angledenoted as 123S in Figure 1).
a0+a1 ·t+a2 ·t2+a3 ·t3+a4 ·t4 and the best fit was obtained with the parametersa0 = 4.5795kcalmol ,
a1 = 0.59555kcalmol , a2 =−7.0008kcal
mol , a3 =−0.65038kcalmol , a4 = 2.4305kcal
mol .
Finally, to obtain the modified force field for use in this work, all interring torsion terms were
removed and the termsf1(α) and f2(α) were added for each angle of the type S456 and 123S,
respectively. Such a force field was then used in all molecular dynamics simulations performed in
this work.
S3

To verify that the modified force field reproduces well the interring torsion potentials, we have
calculated the dependence of the energy of the structure on torsion angles S456 (solid line, Figure
2) and 123S (solid line, Figure 3). As seen, the modified forcefield reproduces well the results
from a quantum chemical calculation.
Verification of the accuracy of the charge patching method
Since CPM is an approximation to a full DFT/LDA calculation, it is desirable to verify its accuracy
on some smaller system where it is still feasible to perform aDFT/LDA calculation. Therefore,
we have compared the results obtained by CPM and DFT/LDA for a 462 atom system (the system
consists of 3 chains, each is 2 monomers long, with pentyl side chains). The comparison of the
density of states obtained in these calculations is given inFigure 4. A good agreement between
the results obtained by the two methods verifies that CPM provides the accuracy similar to that of
DFT/LDA.
-15 -10 -5 0 5 10Energy (eV)
1
2
3
4
Den
sity
of s
tate
s (a
rb. u
nits
)
DFT calculation
1
2
3
4 CPM calculation
Fermi level
Fermi level
Figure 4: The comparison of the density of states of the 462 atom system calculated using thedirect DFT/LDA calculation and the CPM.
S4

The details of the application of the overlapping fragments method
and the verification of its accuracy
The OFM is the method for the diagonalization of a single particle Hamiltonian – for example the
one obtained using the CPM. It is based on the the division of the system into (mutually overlap-
ping) fragments and the representation of the Hamiltonian in the basis of eigenfunctions of these
fragments. The accuracy of the methodology crucially depends on the proper choice of fragments
and the number of orbitals per fragment. The scheme for the division of the system into fragments
in the OFM is shown in Figure 5. The basis consisting of one HOMO orbital per each fragment
was used in the OFM.
SS
N
NS
[ ] n
S
N
NS
SS
N
NS
S
S
S
N
NS
. . .
. . .
Figure 5: The scheme for the division of the system into fragments in the OFM. The basis consist-ing of one HOMO orbital per each fragment was used.
Since OFM is an approximation to the exact numerical diagonalization of the Hamiltonian,
one has to verify its accuracy by comparing to the results of the diagonalization in the plane wave
representation, which can be considered to give numerically exact values. The comparison was
performed for a 2360 atom system (5 chains, each 5 monomers long, with octyl side chains) where
plane wave diagonalization is still feasible. The results of the comparison, given in Figure 6, show
that the OFM provides satisfactorily accurate eigenenergies.
S5

6.7 6.8 6.9 7 7.1 7.2E
PW (eV)
6.7
6.8
6.9
7
7.1
7.2
EO
FM (
eV)
Figure 6: The comparison of eigenenergies obtained by diagonalization in the plane wave basis(EPW) and the ones obtained by the OFM (EOFM)
The density of phonon states
0 0.1 0.2 0.3 0.4Phonon energy (eV)
0
2
4
6
8
Pho
non
dens
ity o
f sta
tes
(eV
-1)
Figure 7: The density of phonon states of APFO-3 polymer.
The density of phonon states of the APFO-3 polymer was calculated from the same classical
force field used in MD simulations and is shown in Figure 7.
S6

The comparison of transition rates obtained by two methods
The comparison betweenWi j andWmodeli j for various transitions in the 2360 atom system is shown
in Figure 8. We note that the largest discrepancy betweenWi j andWmodeli j is by a factor of 30, while
for 90% of the points the discrepancy is smaller than by a factor of 10. The average discrepancy
defined as 10〈|log10(Wi j /Wmodeli j )|〉 (where〈. . .〉 denotes the average value) is equal to a factor of 3.8.
In our previous work3 we have tested the applicability of the approximate expression for tran-
sition ratesWmodeli j in comparison toWi j in the case of P3HT polymer. A similar degree of dis-
crepancy betweenWi j andWmodeli j was obtained there (left panel of Figure 4 in that paper). Never-
theless, the temperature and electric field dependencies ofthe mobilities obtained using these two
different models for transition rates were nearly identical (within few per cent, see Figures 3a and
3b in that paper). These results indicated that the transport properties are not very sensitive to the
details of the individual transitions and that the approximation used is an excellent approximation
if one wishes to model transport properties, as we do here.
11 12 13 14 15 16log
10(W/s
-1)
11
12
13
14
15
16
log 10
(Wm
odel/s
-1)
Figure 8: The comparison of transition ratesW calculated by taking into account the interactionwith all phonon modes and the transition ratesWmodel calculated using the model that considersonly the wavefunction moduli overlap.
S7

Frequency dependent mobility for different realizations of the
system
0.1 1 10f (THz)
0.1
1
10R
e µ
(cm
2 /Vs)
Figure 9: Frequency dependence of the real part of the mobility at a temperature of 300 K for 100different realizations of the 4×4×4 system.
References
(1) Becke, A. D.J. Chem. Phys.1993, 98, 5648.
(2) Stephens, P. J.; Devlin, F. J.; Chabalowski, C. F.; Frisch,M. J.J. Phys. Chem.1994, 98, 11623–
11627.
(3) Vukmirovic, N.; Wang, L.-W.Appl. Phys. Lett.2010, 97, 043305.
S8