insights into app engagement: q1 2015 – how (and how much) users use their apps
TRANSCRIPT

Insights Into App Engagement
Q1 2015
© App Annie 2015

Insights Into App Engagement: Q1 2015
Table of Contents
1. Introduction
2. Communication Forms the Core of Smartphone App Usage
3. Asia Dominates Mobile Gaming
4. South Korea Leads Mobile Data Use
5. Summary
Appendix A: App Usage Top Charts
Appendix B: Game Usage Top Charts
USE RESTRICTIONS: The information, materials, data, images, graphics, and other components of this report ("Report") are
copyrighted and owned or controlled by App Annie unless otherwise noted. Unauthorized use of the Report may violate
copyright, trademark and/or other intellectual property rights of App Annie and may give rise to a claim for damages and/or be a
criminal offense. The Report may not be modified, copied, distributed, republished, uploaded, posted, decompiled, or
transmitted in any way, without the prior written consent of App Annie.
http://www.appannie.com/intelligence/
© 2015 App Annie | Do Not Distribute 1
Insights Into App Engagement: Q1 2015
1. Introduction
The mobile app economy continues to grow at a phenomenal pace. In 2014, revenue from
app stores and inapp advertising were both around 70% higher than the previous year . For app publishers looking to make the most of the opportunities available in the app economy,
understanding the way the users interact with apps on their devices is a key component of
forming an effective app strategy.
App Annie is excited to offer insight into the way these apps are being used with our first
spotlight on app usage. In this report, we dive into five key app markets around the world
the United States, United Kingdom, Germany, Japan and South Korea to compare and
contrast how apps are shaping the way people use their mobile devices. We focus on the
categories and individual apps that dominated the use of iOS and Android mobile devices in
Q1 2015.
App usage data, provided through App Annie Usage Intelligence , is sourced from the industry's largest iOS and Android datasets, providing unprecedented insights into app usage
across millions of users in 60 countries. When combined with App Annie’s industrystandard
Store Intelligence and Audience Intelligence , it provides a 360degree view of the mobile app economy.
For deeper insight into the use of apps around the globe, including additional markets, device
breakdowns and usage metrics, request a demo of the App Annie Intelligence suite today.
http://www.appannie.com/intelligence/
© 2015 App Annie | Do Not Distribute 2
Insights Into App Engagement: Q1 2015
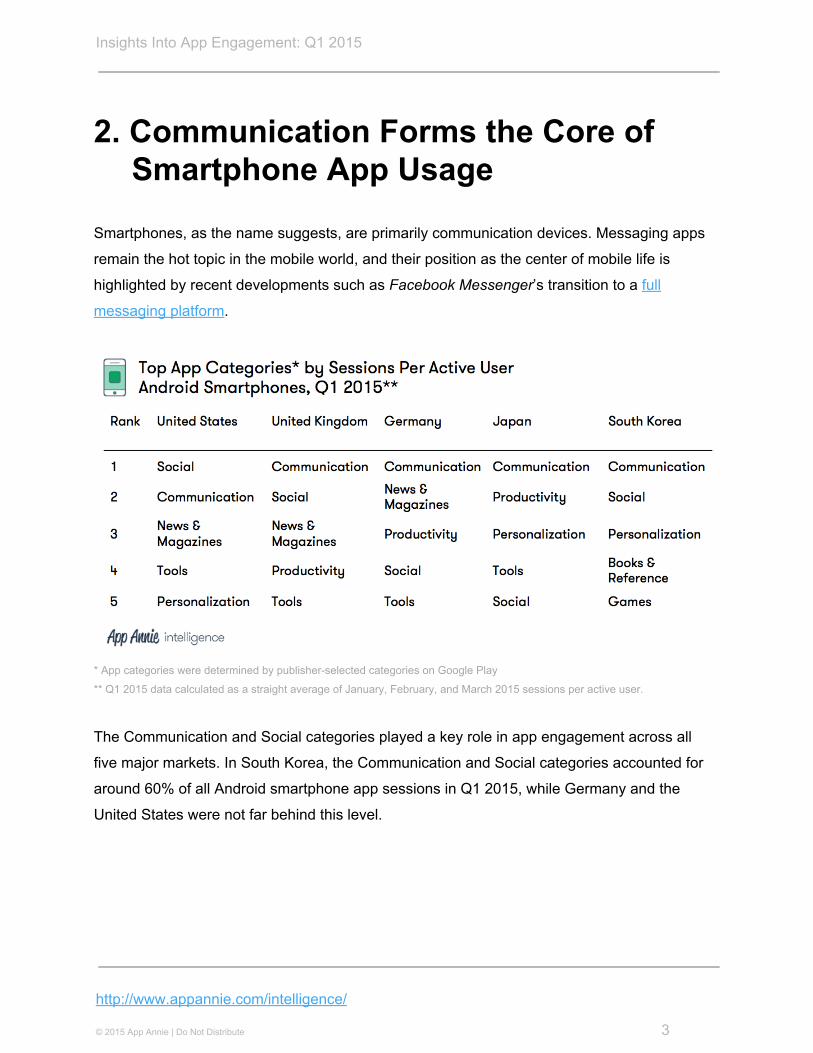
2. Communication Forms the Core of Smartphone App Usage
Smartphones, as the name suggests, are primarily communication devices. Messaging apps
remain the hot topic in the mobile world, and their position as the center of mobile life is
highlighted by recent developments such as Facebook Messenger ’s transition to a full messaging platform .
* App categories were determined by publisherselected categories on Google Play ** Q1 2015 data calculated as a straight average of January, February, and March 2015 sessions per active user.
The Communication and Social categories played a key role in app engagement across all
five major markets. In South Korea, the Communication and Social categories accounted for
around 60% of all Android smartphone app sessions in Q1 2015, while Germany and the
United States were not far behind this level.
http://www.appannie.com/intelligence/
© 2015 App Annie | Do Not Distribute 3

Insights Into App Engagement: Q1 2015
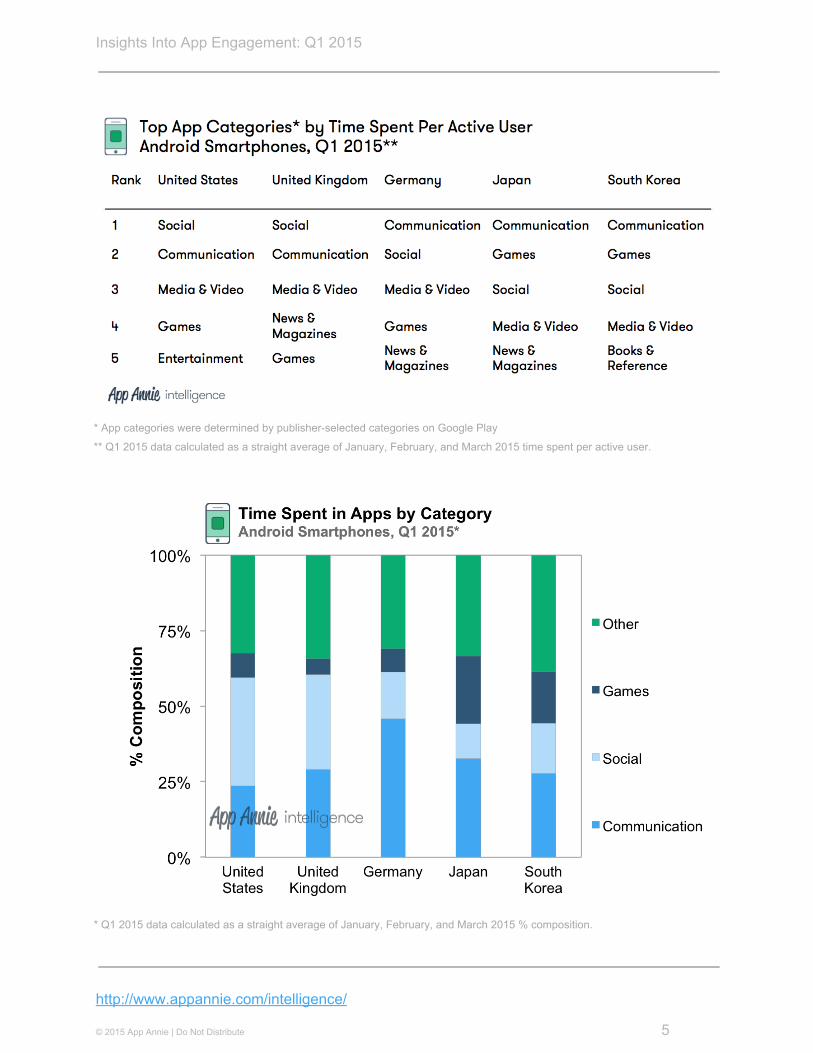
* Q1 2015 data calculated as a straight average of January, February, and March 2015 % compositions.
Similarly, time spent in apps by Android smartphone users was also dominated by the Social
and Communication categories. In the United States and Germany, these two categories
combined accounted for approximately 60% of time spent in apps on Android smartphones. In
South Korea and Japan, the proportion of time spent in Social and Communication apps is
slightly lower, but still accounted for 45% of total time spent in apps on Android smartphones
in Q1 2015.
http://www.appannie.com/intelligence/
© 2015 App Annie | Do Not Distribute 4
Insights Into App Engagement: Q1 2015
* App categories were determined by publisherselected categories on Google Play ** Q1 2015 data calculated as a straight average of January, February, and March 2015 time spent per active user.
* Q1 2015 data calculated as a straight average of January, February, and March 2015 % composition.
http://www.appannie.com/intelligence/
© 2015 App Annie | Do Not Distribute 5

Insights Into App Engagement: Q1 2015
As publishers select the categories in which their apps are listed, there can be considerable
overlap in functionality between the Social and Communication categories, especially among
the top apps where social networks and messaging apps dominate. However, the top apps
across these categories reveal some small but key differences in app use between different
countries.
* Q1 2015 data calculated as a straight average of January, February, and March 2015 sessions per active user.
All markets saw strong influence from large social networks such as Facebook and Twitter , messaging apps such as WhatsApp Messenger , LINE and KakaoTalk, and web browsers such as Chrome Browser and Daum . However, it is notable that the United States saw Facebook dominate Android smartphone sessions, whereas the other markets all saw more sessions from messaging apps. Likewise, by time spent in apps, the social networks
Facebook and Instagram led in the United States whereas messaging apps were more prominent in other markets.
http://www.appannie.com/intelligence/
© 2015 App Annie | Do Not Distribute 6

We hope you found the provided information
helpful.
Click below to download the full PDF.
Download