inside australian online shopping - auspost.com.au · in 2018 alone, the number of online purchases...
TRANSCRIPT

Inside AustralianOnline Shopping
2019 eCommerce Industry Report

Home
Overview
Fashion
Variety Stores
Health & Beauty
Hobbies & Recreational
Goods
Cross border
The technology evolution
& AppliancesHomewares
This is the fourth edition of the Inside Australian Online Shopping Industry Report; an in-depth study into consumer online buying behaviour and trends.
The report has been prepared using 2017 and 2018 deliveries data recorded by the Australia Post Group, unless otherwise stated. Commentary in this report relating to online shopping is based on an extrapolation of this data. Year on year growth numbers are based on actual or extrapolated transaction volumes.
This edition also examines the trends of domestic and international frequent online shoppers. The cross-border analysis is based on findings of a global survey conducted by International Post Corporation.
About this report

Home
Overview
Fashion
Variety Stores
Health & Beauty
Hobbies & Recreational
Goods
Cross border
The technology evolution
& AppliancesHomewares
Contents
04 Foreword
05 Executive summary
06 eCommerce overview
Key consumer trends 08
What are Australians buying online? 18
Who’s buying? 21
24 Category overviews
Fashion 24
Variety Stores 30
Health & Beauty 36
Homewares & Appliances 42
Hobbies & Recreational Goods 48
54 Cross border
64 The technology evolution
Virtual assistants 65
Visual search 66
Augmented reality 67
Shopping is getting personal 68
The evolution of the chatbot 69
New ways to pay 70
72 Methodology
73 References
74 Contacts

Home
Overview
Fashion
Variety Stores
Health & Beauty
Hobbies & Recreational
Goods
Cross border
The technology evolution
& AppliancesHomewares
Foreword Welcome to Australia Post’s Inside Australian Online Shopping Report for 2019.
This report provides a comprehensive analysis of the latest trends in online buying behaviour, as well as insights into cross-border eCommerce and how technology is fundamentally shifting the shopping habits and expectations of Australians.
Almost three quarters of all Australian households are now shopping online and we expect that around 12% of all consumer spending will be conducted online by 2021.
Christine Holgate Group Chief Executive Officer & Managing Director Australia Post
In 2018 alone, the number of online purchases grew by more than 13% year on year in every State and Territory, with the national average growing over 20%. While Australia’s major metro cities still dominate online purchasing, there is also rapid growth in online shopping in regional areas. Even in remote areas of Australia, it’s clear that the households that shop online are doing so more frequently and they are buying a wider variety of products.
With more people choosing to buy and sell online, we at Australia Post are consistently setting new records for the amount of parcels we are delivering. In 2018, Australia Post Group including StarTrack delivered more than 3.3 billion items to more than 12 million addresses across the country.
From an international perspective, China is continuing to drive much of the overseas demand for Australian goods. As the Chinese middle-class continues to swell, Australian businesses are well positioned to capitalise on this booming growth market because of our reputation for producing clean, safe and premium-quality products.
This report again highlights the growing consumer expectation around rapid or time-specific delivery options. It also points to the reassurance online shoppers gain from having access to an easy and free returns service.
Online retailers that offer speedy delivery and reliable returns are winning market share. For that reason, it’s absolutely vital that retailers work hand-in-glove with their logistics partner to provide the kind of seamless experience today’s consumers expect.
We hope this report helps Australian businesses to understand the changes that are happening in the market; plan strategically for the future; and take advantage of the next wave of customer opportunities.
Foreword 04

Home
Overview
Fashion
Variety Stores
Health & Beauty
Hobbies & Recreational
Goods
Cross border
The technology evolution
& AppliancesHomewares
Executive summary Australia is embracing eCommerce at an accelerated rate, with online goods spend reaching 10% of total retail at the end of 2018, two years ahead of our prediction.
Ben Franzi General Manager, Parcel & Express Services/Intermediaries Australia Post
The surge in eCommerce was largely driven by the popularity of sales events, Marketplaces and innovative buy now, pay later (BNPL) payment options.
2018 was the year Australians fully embraced America’s Black Friday / Cyber Monday tradition, and is now the biggest week in our eCommerce history. These events have shifted what is usually our peak Christmas shopping period to November, with shoppers now expecting substantial discounts during this time.
Marketplaces are dominating the eCommerce market, as consumers hunt for the best deals and the convenience of a one-stop-shop. The number of Marketplace purchases grew by 31.2% year on year, indicating that more sellers are turning to Marketplaces to broaden their customer base and grow brand awareness.
BNPL continues to accelerate, particularly in the Fashion sector, which is largely driven by the younger demographic. The consumption rate is set to increase, with more of this generation entering the workforce. As this payment method continues to mature, we expect to see greater adoption into other sectors.
Retailers are also increasingly looking for ways to stand out from their competitors. Speed of service is being used as a competitive marketing tool to convert more sales and retain loyalty. As more retailers provide faster fulfilment and delivery, shoppers’ expectations will continue to grow.
As the eCommerce landscape is constantly evolving, retailers must adopt new ways to grow their market share. The future of eCommerce is an interconnected physical and digital world, providing consumers with the ability to purchase when, where and how they choose.
Executive summary 05

Home
Overview
Fashion
Variety Stores
Health & Beauty
Hobbies & Recreational
Goods
Cross border
The technology evolution
& AppliancesHomewares
Overview 06
More than 73% of Australian households shopped online in 2018
eCommerce overview

Home
Overview
Fashion
Variety Stores
Health & Beauty
Hobbies & Recreational
Goods
Cross border
The technology evolution
& AppliancesHomewares
eCommerce in Australia is growing rapidly, with online spend reaching 10% of total retail sales in 2018, taking its share to two percentage points higher than the previous year1. Australians spent $27.5 billion buying goods online, an increase of 24.4% year on year (YOY)2.
In comparison, total retail spend excluding cafes, restaurants and takeaway food services, recorded a modest 3% growth to reach $275.3 billion3.
When it comes to the number of purchases made online, purchases were up 20.2%, one percentage point higher than in 2017. While every month experienced double-digit growth, the first and last quarters grew above the national average.
More than 73% of Australian households shopped online in 2018. Given the strong up-take to shop online, we predict that eCommerce penetration will reach 12% of retail spend within the next three years.
According to our consumer research, shoppers plan to continue or increase their online spend in 2019.
Overview 07
Retail spend
$275.3B
Online goods spend
$27.5B
10% of total retail spend

Home
Overview
Fashion
Variety Stores
Health & Beauty
Hobbies & Recreational
Goods
Cross border
The technology evolution
& AppliancesHomewares
Key consumer trends 2018 was the ‘year of the sale’, with online sales events driving a spike in eCommerce growth. We also saw the continued rise of BNPL usage, Marketplace and mobile shopping, and a growing demand for express delivery.
Overview 08

Home
Overview
Fashion
Variety Stores
Health & Beauty
Hobbies & Recreational
Goods
Cross border
The technology evolution
& AppliancesHomewares
Year of the sale The five weeks from 11 November to 15 December accounted for almost 15% of all eCommerce transactions. The peak for this period was Black Friday / Cyber Monday, which was the biggest online shopping week in Australia’s history, recording strong growth of over 28% YOY.
Number of purchases
SALE SALE SALE SALE SALE
11–17 November
18–24 November
25 November –01 December
02–08 December
09–15 December
Click Frenzy week
YOY growth
13.6%YOY growth
The week of Click Frenzy was the second largest shopping event and the fifth largest week by volume.
Online goods purchases grew 13.6% YOY.
Variety Stores and Fashion purchases accounted for over 65% of the total, with almost equal share between them.
Lead up to Black Friday
23.6%YOY growth
This was the fourth largest week of the year as it fell either side of the two largest shopping events, providing shoppers with extended sales promotions.
Purchases were up 23.6% YOY.
Black Friday / Cyber Monday
week
28.7%YOY growth
Black Friday was the biggest week for eCommerce purchases in Australia, up 28.7% YOY.
This period also includes the Cyber Monday sales event.
Marketplaces accounted for a fifth of all purchases, growing by 41.2% for this period.
3 weeks prior to Christmas
17%YOY growth
As Black Friday sales continued into this week, shoppers were still grabbing a bargain with purchases up 17% YOY.
Traditionally this was the number one shopping period by volume, however sales events in the lead up to this week in 2018 shifted it to third place.
2 weeks prior to Christmas
26.2%YOY growth
As shoppers prepared for Christmas, online purchases spiked, making this the second largest week, up 26.2% YOY.
Overview 09

Home
Overview
Fashion
Variety Stores
Health & Beauty
Hobbies & Recreational
Goods
Cross border
The technology evolution
& AppliancesHomewares
In search of a bargain More shopping mayhem in May May Mayhem has taken this traditionally quiet sales period to the 12th largest week for online goods purchases, growing at 25.1% YOY. Nearly a third of the purchases were Fashion related, growing by 29.4% YOY. Health & Beauty recorded strong growth during this week, at 50.7%.
Direct marketing triggers sales As more and more retailers participate in sales events, capturing consumer attention has never been more important. According to our consumer research4,
the most effective marketing channel was email, with 39% of shoppers reporting that they heard about a promotion via this channel.
Over 15% of respondents indicated that social media was the second most effective channel, followed by web advertising at just 11%, which declined 46% YOY.
Personally-addressed physical mail is also gaining popularity and has seen an increase of 16.6% YOY. Personalised communication is now a vital part of capturing and maintaining shopper attention.
Overview 10

Home
Overview
Fashion
Variety Stores
Health & Beauty
Hobbies & Recreational
Goods
Cross border
The technology evolution
& AppliancesHomewares
The need for speed Online shoppers increasingly expect faster service and some savvy retailers are now offering quicker fulfilment and shipment. This competitive edge potentially helps retailers stand out and convert more sales. Next-day deliveries has grown by 31.7% and more than 62% of these are Fashion related.
For instance, Cotton On provides a $2 express service for customers who meet a minimum spend amount. The Iconic also provides a highly competitive service where certain items are shipped within three to five hours.
The week before Christmas was Australia’s peak week for express shipping, accounting for nearly 32% of all deliveries compared to an average of 19% across all other weeks.
As more retailers provide faster service, shopper expectations for time and day-specific delivery will become the norm.
Overview 11

Home
Overview
Fashion
Variety Stores
Health & Beauty
Hobbies & Recreational
Goods
Cross border
The technology evolution
& AppliancesHomewares
Seamless customer experience It is becoming increasingly important to connect the physical and digital shopping experience to create a seamless environment for the consumer.
Some retailers are providing consumers with a more holistic approach when purchasing their products. Click and Collect brings shoppers into a physical store, which in turn promotes and encourages additional impulse buying. Conversely, some retailers provide in-store shoppers with the ability to purchase from their online store when a product is unavailable.
The experience is enhanced with access to iPads or sales assistants who can complete the transaction on the spot.
Alternatively, the consumer is provided with a free shipping code to make the purchase in their own time.
Some online-only retailers are also testing the market with pop-up stores to increase their brand awareness.
While the “phygital” customer experience is still evolving, this holistic approach to customer service is the way of the future.
Overview 12
Home
Overview
Fashion
Variety Stores
Health & Beauty
Hobbies & Recreational
Goods
Cross border
The technology evolution
& AppliancesHomewares
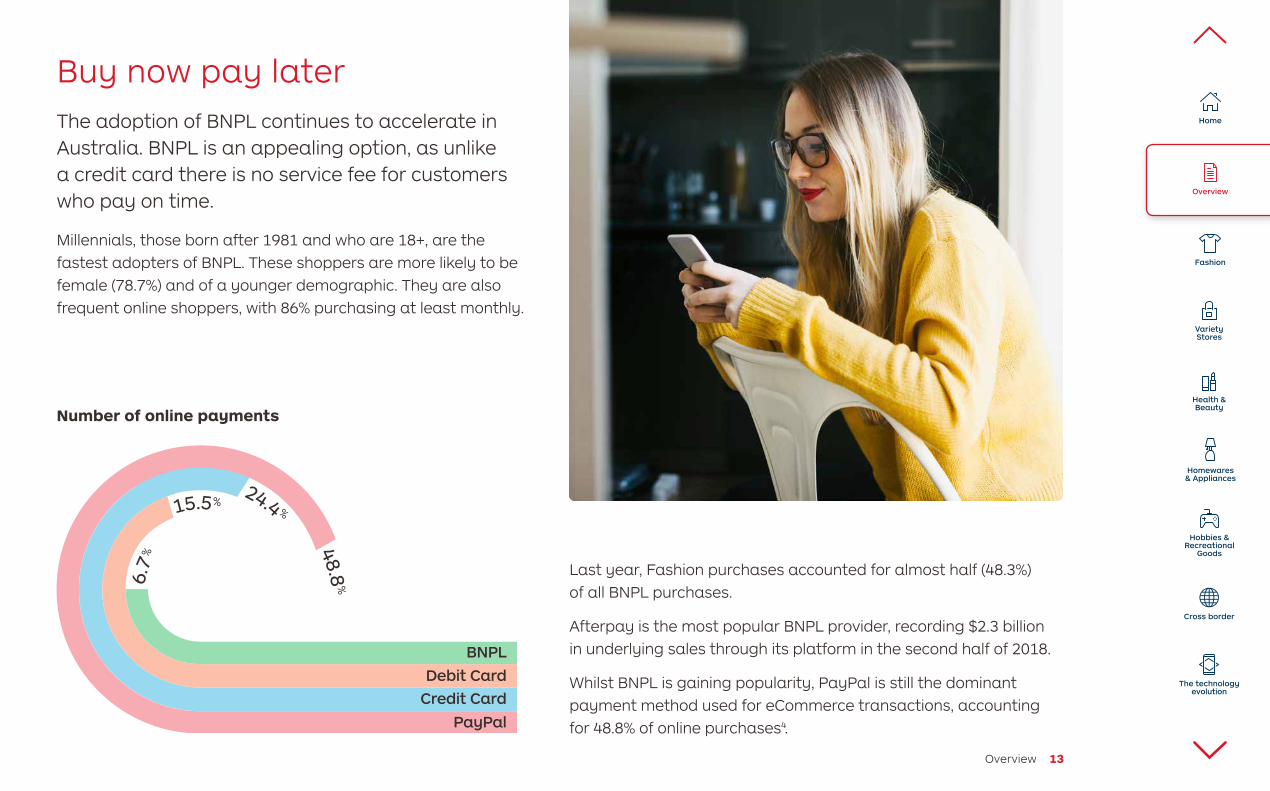
Buy now pay later The adoption of BNPL continues to accelerate in Australia. BNPL is an appealing option, as unlike a credit card there is no service fee for customers who pay on time.
Millennials, those born after 1981 and who are 18+, are the fastest adopters of BNPL. These shoppers are more likely to be female (78.7%) and of a younger demographic. They are also frequent online shoppers, with 86% purchasing at least monthly.
Last year, Fashion purchases accounted for almost half (48.3%) of all BNPL purchases.
Afterpay is the most popular BNPL provider, recording $2.3 billion in underlying sales through its platform in the second half of 2018.
Whilst BNPL is gaining popularity, PayPal is still the dominant payment method used for eCommerce transactions, accounting for 48.8% of online purchases4.
Number of online payments
Debit Card Credit Card
PayPal
BNPL
6.7
%
15.5% 24.4 %
48.8%
Overview 13

Home
Overview
Fashion
Variety Stores
Health & Beauty
Hobbies & Recreational
Goods
Cross border
The technology evolution
& AppliancesHomewares
Marketplaces are dominating There are more players in the Australian Marketplace than ever before.
Newer entrants including Amazon, Catch Group and Myer, have now been in operation for over 12 months. In the second half of 2018, Catch Group reported that its gross transaction values rose by 62%.
Last year the number of purchases through Marketplaces grew by 31.2% YOY, indicating that Marketplaces are still dominating in Australia.
Smaller retailers could take advantage of these platforms to help build brand awareness and increase sales.
Overview 14

Home
Overview
Fashion
Variety Stores
Health & Beauty
Hobbies & Recreational
Goods
Cross border
The technology evolution
& AppliancesHomewares
Shopping later in the day Browsing online using multiple devices continues to shape the eCommerce world. However, more consumers are choosing to complete a transaction via their smartphones, up 28.8%, a six percentage point increase from the previous year.
Furthermore, consumers are more likely to be shopping later in the day, with 32% of purchases made between 7–10pm. 21% occurred between 2–5pm4.
Consumers now expect a seamless and secure experience, regardless of the channel they are ordering from.
When purchases are made
Early Mid Lunch Early Mid Late After morning morning time Afternoon evening evening evening midnight 6:00 to 9:00 to 12:00 to 2:00 to 5:00 to 7:00 to 10:00 to 12:00 to 8:59am 11:59am 1:59pm 4:59pm 6:59pm 9:59pm 11:59pm 5:59am
32.2%
20.6%
8.4%
1.5%
15.6%
2.6% 7.3%
11.8%
How purchases are made
Mobile
Laptop
32.8%
-5.1%
YOY growth
27.3%
Desktop
-11%
YOY growth
26.4%
28.8%
YOY growth
Overview 15

Home
Overview
Fashion
Variety Stores
Health & Beauty
Hobbies & Recreational
Goods
Cross border
The technology evolution
& AppliancesHomewares
Empowering consumers to buy online The top deterrent to online shopping is not having access to the fit, feel and quality of a product. To minimise this barrier and drive revenue, retailers need to ensure they provide a user-friendly returns policy.
According to our consumer survey, 29% said it was too much effort to organise a return. Also, 34% indicated it was too expensive to return a product4.
Wez Byett, CEO and Founder at Princess Polly said,
“To simplify the returns process, we provide free returns to our customers who choose to exchange items for a store credit. We also include a returns label in every parcel. Customers do return items more frequently but we are also acquiring new customers.
In the first three months of introducing this policy, we noticed that orders increased by nearly 10% and the return rate only increased by 2%. This is a great outcome for us and our customers.”
Return tips
Clear and up-front returns policy with a reasonable
returns timeframe
Provide returns label or access to labels
Provide convenient drop-off locations
Perhaps consider providing a store credit
instead of a refund
Utilise packaging that can be repurposed for returns
Consider providing discounted or free postage
Overview 16

Home
Overview
Fashion
Variety Stores
Health & Beauty
Hobbies & Recreational
Goods
Cross border
The technology evolution
& AppliancesHomewares
The rise of the conscious consumer As consumers are more aware of social and environmental impacts, many are choosing to purchase from ethical companies that align to their personal values.
Environmental impact As the vast majority of parcels are delivered to the home, consumers are tasked with disposing of packaging. A global survey found 60% of shoppers would like their eCommerce packaging to be sustainable, and 50% said they would pay the equivalent of 15 cents if it was offered5.
In Australia, our research shows that 49% of online shoppers would choose to buy products from businesses that are taking action to reduce their impact on the environment. Impressively, over 50% said they would choose to purchase from retailers that offset the carbon emissions incurred from shipping4.
Know your supply chain There is growing awareness and need for transparency around product origin and supply chain. Consumers are increasingly aware of the use of underpaid labour, especially in the fast-paced Fashion industry.
As consumers become more ethically conscious, it’s important for retailers to adopt ethical and sustainable business practices.
Overview 17
60% 50% want parcels would pay with sustainable 15 cents for packaging sustainable
packaging

Home
Overview
Fashion
Variety Stores
Health & Beauty
Hobbies & Recreational
Goods
Cross border
The technology evolution
& AppliancesHomewares
What are Australians buying online? Fashion continues to lead the way in number of online purchases. Variety Stores and Marketplaces also continue to attract shoppers, providing a one-stop-shop experience for the purchase of a variety of items. When it comes to categories to look out for, Specialty Food & Liquor experienced 11.6% YOY growth after flat growth in the previous year. By far, the stand out in terms of growth is Health & Beauty, at almost 30% YOY.
Fashion continues to be the main category purchased online, accounting for 27% of purchases. The category grew by 20.4% YOY, on par with the national average. Activewear had the strongest growth, up 37.5% YOY and Footwear grew by 23.8%.
BNPL remains the most popular payment option, accounting for 48.3% of all Fashion purchases4. Retailers that were once focused only on Fashion are expanding their range to include complementary products such as Cosmetics and Homewares.
Variety Stores offer a one-stop-shop for online shopping. These include large retailers, online Marketplaces and low-cost / Discount Stores. They accounted for 35.6% of all online purchases and grew by 21.5% YOY. The most common purchases from Variety Stores last year were Fashion and Consumer Electronic items, representing over 40% of purchases4. Baby Products also grew strongly at 34% YOY.
Health & Beauty recorded the strongest growth across all categories, up 29.4% YOY. Beauty and Cosmetics made up over half of these purchases and grew 36.4%. Black Friday / Cyber Monday was the busiest week for Beauty products and also recorded strong growth, rising 54% YOY.
More and more players are moving into the Beauty category, with many Fashion retailers now stocking Cosmetic products.
Homewares & Appliances had another solid year, growing 11.7%. While this is below the national average, when we add in Homewares & Appliances purchased through Variety Stores, this category’s market share almost doubles to 22.2%.
Over half the purchases in this category are Homewares and Consumer Electronics, with both growing more than 14% YOY. Consumer Electronics were also the highest spend per purchase, increasing 6.1% YOY4.
Overview 18

Home
Overview
Fashion
Variety Stores
Health & Beauty
Hobbies & Recreational
Goods
Cross border
The technology evolution
& AppliancesHomewares
Hobbies & Recreational Goods cover a diverse range of products. Automotive Parts & Accessories, Sporting Goods and Games & Toys make up over 60% of all purchases in this category. Outdoor Goods grew strongly, at 17.4%, followed by Games & Toys at 15.5%. Automotive Parts grew more than 12% with average spend up 9.1% YOY, making it the third highest spend per transaction for online goods4.
Media products are predominantly Books (80% of purchases), but also include Stationery and Prints. As traditional and independent book retailers enhance their online presence, we can expect the growth of 10.5% to continue. It’s also encouraging to see the average spend on Books grow by 4.7% YOY, ahead of CPI4.
Specialty Food & Liquor includes Wine, Liquor and Non-perishable Groceries. After a flat 2017, this category grew 11.6% YOY. Wine and Liquor purchases accounted for over 70% of purchases and grew by 5.2% YOY. As craft breweries and independent distillers have found new channels for direct sales, we expect this growth to continue. Wine and Liquor purchases are now the second highest spend per transaction4.
Non-perishable Goods and Organic Products in particular showed the strongest growth, rising 28.8% on the back of new dietary trends.
Overview 19

Home
Overview
Fashion
Variety Stores
Health & Beauty
Hobbies & Recreational
Goods
Cross border
The technology evolution
& AppliancesHomewares
Share of online purchases
8.4% 35.6% 27% 11.5% 7.3% 6.7% 3.5%
Year on year growth by specialty retailers
29.4%
21.5% 20.4% 20.2%
National average YOY growth
11.7% 11.6%10.5% 8.5%
Hobbies &Variety Homewares & Health & SpecialtyFashion Media RecreationalStores Appliances Beauty Food & LiquorGoods
Overview 20Overview 20

Home
Overview
Fashion
Variety Stores
Health & Beauty
Hobbies & Recreational
Goods
Cross border
The technology evolution
& AppliancesHomewares
Who’s buying? Top 12 buying locations by volume
Rank Locality Growth (%)
1 Point Cook, 3030 27.5
2 Toowoomba, 4350 21.1
3 Mackay, 4740 20.5
4 Liverpool, 2170 22.4
5 Cranbourne, 3977 26.7
6 Gosford, 2250 21.8
7 Hoppers Crossing, 3029 21.8
8 Campbelltown, 2560 20.5
9 Bundaberg, 4670 20.2
10 Wyong, 2259 25.5
11 Rouse Hill, 2155 28.5
12 Cairns, 4870 16.5
20.2%National average YOY growth
7
10
4
11
8 1 6
3
9
12
5
2
Queensland New South Wales Victoria
Above average growth
Lower than average growth
Point Cook in Melbourne’s West was the number one online shopping suburb in Australia for the fourth year running, and continues to grow above the national average. Point Cook residents also increased their frequency of online purchase above the national average, indicating they are not only buying more online, but also more often.
The top twelve buying locations are again dominated by suburbs that have seen an influx of young families, particularly through residential developments in new growth corridors such as Cranbourne in Melbourne’s South-East and Hoppers Crossing in the West.
Point Cook, Toowoomba and Liverpool are major centres, with populations above one hundred thousand6. In contrast, Wyong and Rouse Hill have smaller populations but their residents were amongst the most frequent online shoppers, with over 77% of households shopping online.
Overview 21

Home
Overview
Fashion
Variety Stores
Health & Beauty
Hobbies & Recreational
Goods
Cross border
The technology evolution
& AppliancesHomewares
State and Territory In every State and Territory, the number of online purchases grew more than 13% YOY and the stand-out performers were Tasmania, Victoria and Queensland. Although Tasmania represents just 2.5% of online goods purchases, the State recorded growth of almost four percentage points above the national average. In 2018, over 74% of households in Tasmania shopped online.
Online shopping frequency increased 9.4% across Australia in 2018. With Tasmania, New South Wales and the Australian Capital Territory making the most frequent purchases per household.
Online shopping growth
20.2%
National average YOY growth
Tasmania
23.9% Territory
13.7% Victoria
22.2% Wales
19.3% Australia Queensland
NorthernNew SouthSouth
20.9%21%
Australian Capital Territory
16.3%
Western Australia
16.6%
Overview 22

Home
Overview
Fashion
Variety Stores
Health & Beauty
Hobbies & Recreational
Goods
Cross border
The technology evolution
& AppliancesHomewares
Major cities and regional Australia Inner-regional areas such as Toowoomba and Ballarat experienced the highest growth in online goods purchases, at 21.4% YOY. Major cities still dominate, with 70% of goods purchased online and growing in line with the national average.
Households in remote and very remote Australia that do shop online are doing so more frequently. The rate of purchase is 1.2 times the national average. It is likely households in remote regions depend on online shopping to access a wider range of products, given the distance to their nearest shopping centre.
Overview 23
Major cities of Australia
Inner regional Australia
Outer regional Australia
Remote Australia
Very remote Australia
Online shopping growth 20.2% National average YOY growth
20%
21.4%
19.7%
16.3%
15.1%
Home
Overview
Variety Stores
Health & Beauty
Hobbies & Recreational
Goods
Cross border
The technology evolution
& AppliancesHomewares
Fashion
Industry overview
Fashion
Fashion 24

Home
Overview
Variety Stores
Health & Beauty
Hobbies & Recreational
Goods
Cross border
The technology evolution
& AppliancesHomewares
Fashion
Overview Fashion purchases are growing from strength to strength, achieving double-digit growth for the seventh consecutive year. In 2018, the number of Fashion related items grew by 20.4% YOY, staying ahead of the national average.
Online Fashion retail purchases represented 27% of all eCommerce purchases. When Fashion purchases are combined with Variety Store Fashion purchases, this market share increased to an impressive 35.2%4.
Almost half of BNPL purchases are Fashion related, indicating this payment option now plays an important role in the competitive Fashion retail market.
Fashion 25
Share of online purchases YOY growth
27%
Fashion
35.2%
20.2%
2018 YOY growth
National online average 8.2%
Variety Stores
20.4%

Home
Overview
Variety Stores
Health & Beauty
Hobbies & Recreational
Goods
Cross border
The technology evolution
& AppliancesHomewares
Fashion
Digging deeper While Activewear makes up a small share of Fashion purchases, it was the fastest growing category in 2018, growing 37.5% YOY. Women’s Fashion has continued to perform strongly, growing 22.6% nationally and accounted for 28.6% of Fashion purchases.
However, Women’s Fashion has been overtaken in terms of growth by both Men’s Fashion and Footwear, growing by 24.9% YOY and 23.8% YOY respectively.
Fashion highlights
Unisex Brands
55.8%
Women’s Fashion
28.6%
Activewear
37.5%
Highest growth Biggest contributor Strong performer
(Share) (Share) (YOY)
Fashion 26

Home
Overview
Variety Stores
Health & Beauty
Hobbies & Recreational
Goods
Cross border
The technology evolution
& AppliancesHomewares
Fashion
Regional growth
13.3%
10.5%
Inner regional Australia
Major cities of Australia
Outer regional Australia
Remote Australia
Very remote Australia
20.4%Fashion average YOY growth
20.3%
22.3%
19%
State and regional growth In total, 73.9% of online Fashion purchases were made in metro areas. However purchases in inner regional areas are growing faster than the national average for Fashion, at 22.3% YOY.
Almost 80% of eCommerce Fashion purchases were made in just three States: New South Wales with 36.4% of purchases, Victoria with 26% and Queensland with 17.2%.
Queensland had the highest year on year growth of all States at 22%, particularly purchases of Activewear which grew 43.6% YOY, and Footwear which grew 28.2% YOY. South Australia was the fastest growing State for Fashion purchases in 2017, but its growth of 20.1% YOY in 2018 was just below the national average.
State and Territory growth
Fashion 27
New South Wales
Northern Territory
11.1%
20.4%
Fashion average YOY growth
Western Australia
14.8%20.4%Victoria
21.4%
South Australia
20.1%Tasmania
21.7%Queensland
22.2%
Australian Capital Territory
19.6%

Home
Overview
Variety Stores
Health & Beauty
Hobbies & Recreational
Goods
Cross border
The technology evolution
& AppliancesHomewares
Fashion
Who’s buying? Top 12 buying locations by volume
Rank Locality Growth (%)
1 Point Cook, 3030 25.6
2 Liverpool, 2170 23.5
3 Toowoomba, 4350 25.7
4 Cranbourne, 3977 27.9
5 Rouse Hill, 2155 26.3
6 Mackay, 4740 25.6
7 Hoppers Crossing, 3029 27.6
8 Campbelltown, 2560 23.1
9 Grovedale, 3216 21.8
10 Gosford, 2250 25.5
11 Ballarat, 3350 19.1
12 Craigieburn, 3064 35.7
20.4% Fashion average YOY growth
6
3
1
7
11
12
4
9
2
5
8 10
Queensland New South Wales Victoria
Above average growth
Lower than average growth
Point Cook in Victoria’s Southwest has knocked Liverpool in New South Wales from the top spot and is now the top location for online Fashion purchases in Australia. With a large population and limited access to large shopping hubs, Point Cook has above average household engagement. Liverpool however, had above average purchase frequency, meaning those households who were buying Fashion goods online did so more often.
With only half the population of the top two suburbs, Rouse Hill in Sydney entered the top 12 for the first time. This is due to a high household engagement and high purchasing frequency, resulting in more households buying more often.
In contrast to Rouse Hill, Hoppers Crossing in Victoria had low household engagement and low buying frequency. Despite this, we predict Hoppers Crossing will continue to
grow, given household engagement is still low and population growth is high, 3.4 times higher than the national average. Hoppers Crossing also has a younger population, with a median age of 31 compared to the national median age of 386. Craigieburn in Melbourne’s North was also a standout suburb, that grew 35.7% YOY. This was 7.8 percentage points higher than the next fastest growing suburb of Cranbourne, also in Melbourne.
Fashion 28

Home
Overview
Variety Stores
Health & Beauty
Hobbies & Recreational
Goods
Cross border
The technology evolution
& AppliancesHomewares
Fashion
Key trends November is peak Fashion month.
Fashion continues to lead the way in number of online purchases. This is the second consecutive year that November was the largest month, which peaked during the Black Friday / Cyber Monday sales events. There was also a significant growth two weeks prior to and two weeks after these events. What made Fashion different to most other categories was purchases were strongest during the lead up to Black Friday / Cyber Monday, with the second busiest week being Click Frenzy. For all other categories, the second busiest week was two or three weeks prior to Christmas.
The strong performance of this period in November accounted for 9% of all Fashion purchases in 2018. A surprising trend in December was the final week before Christmas, which had strong growth of 36.7% YOY. This demonstrated a surge in last minute purchases before the holiday. Due to this strong growth and the large volume in the first two weeks of the month, December was the second largest month for Fashion purchases.
Busiest months
1st 2nd
November December
19.7%
YOY growth
16.7%
YOY growth
Fashion 29
Busiest weeks
Busiest 2nd busiest 3rd busiest week week week
16.6% YOY growth
Click Frenzy Week
18.2% YOY growth
Black Friday / Cyber Monday
16.7% YOY growth
Lead up to Black Friday

Home
Overview
Fashion
Variety Stores
Health & Beauty
Hobbies & Recreational
Goods
Cross border
The technology evolution
& AppliancesHomewares
Industry overview
Variety Stores
Variety Stores 30

Home
Overview
Fashion
Variety Stores
Health & Beauty
Hobbies & Recreational
Goods
Cross border
The technology evolution
& AppliancesHomewares
Overview Variety Stores and Marketplaces continue to attract shoppers, accounting for 35.6% of all Australian eCommerce purchases in 2018.
This diverse group includes sellers offering a variety of goods including Clothing, Baby Products, Homewares and Electronics. They also include popular one-stop-shop Marketplace platforms, and online channels for traditional Department Stores and Discount Stores. Variety Stores experienced the second highest growth by category, after Health & Beauty, and grew 21.5% YOY.
Share of online purchases
10.7%
Homewares & Appliances
35.6% 8.2%
Fashion
2.6%
Health & Beauty
14.1%
Other
Variety Stores 31
YOY growth
20.2% National online average
2018 YOY growth 21.5%

Home
Overview
Fashion
Variety Stores
Health & Beauty
Hobbies & Recreational
Goods
Cross border
The technology evolution
& AppliancesHomewares
Digging deeper The most common purchases from Variety Stores last year were Fashion and Consumer Electronics, representing over 40% of purchases.
Marketplaces, which provide a platform for third-parties to sell their products directly to consumers, accounted for more than half of all Variety Store purchases. After surging in 2017, YOY growth has slowed somewhat, but remains well above the average at 31.2%.
Major and Discount Stores grew 38.2% YOY, the fastest ahead of the average category growth. This is a vast improvement compared to 2017, where the growth was almost flat year on year. Although they did not account for a large share of purchase volume, we also saw Baby Product retailers grow by 34.3% YOY.
Variety Stores highlights
Biggest Highest growth Up and channel channel coming
Marketplaces
56.4%
(Share)
Major and Discount Stores
38.2%
(YOY)
Baby Products
34.3%
(YOY)
Variety Stores 32

Home
Overview
Fashion
Variety Stores
Health & Beauty
Hobbies & Recreational
Goods
Cross border
The technology evolution
& AppliancesHomewares
Regional growth
Outer regional Australia
Inner regional Australia
Remote Australia
Major cities of Australia
Very remote Australia
21.5% Variety Stores average YOY growth
20.7%
23.3%
23.6%
21.3%
18.6%
Tasmania
29.9% Queensland
24.2%
Western Australia
22.8%
21.5%
Victoria
22.2%
Variety Stores 33
Northern Territory
15.7%
New South Wales
18.8%
South Australia
21.9%
Capital Territory
12.8%
Variety Stores average YOY growth
Australian
State and regional growth Tasmania had the strongest YOY growth at 29.9%, 8.5 percentage points ahead of the national growth of Variety Stores. This was followed by Queensland, Western Australia and Victoria, which also had above average growth. The Eastern States accounted for 77.8% of all Variety Store purchases.
Western Australia and Queensland have been increasingly turning to Marketplaces for their purchases, with purchases growing by over 35% YOY in both States, well above the national Marketplace average.
Metro areas made up over two thirds of all Variety Store purchases. However regional areas have been picking up the pace with purchases growing 23.3% YOY in inner regional Australia, and an even higher 23.6% YOY in outer regional Australia. This is in comparison to 20.7% growth YOY for metro areas, highlighting the overall impact of regional shoppers.
State and Territory growth

Home
Overview
Fashion
Variety Stores
Health & Beauty
Hobbies & Recreational
Goods
Cross border
The technology evolution
& AppliancesHomewares
Who’s buying? Top 10 buying locations by volume
Rank Locality Growth (%)
1 Point Cook, 3030 26
2 Liverpool, 2170 21.1
3 Toowoomba, 4350 22.2
4 Hoppers Crossing, 3029 27.3
5 Cranbourne, 3977 32.3
6 Campbelltown, 2560 21.9
7 Gosford, 2250 24.6
8 Bundaberg, 4670 22.8
9 Mackay, 4740 20.7
10 Wyong, 2259 27.7
9
8
3
2
10
6 7
1
4
9
5
21.5% Variety Stores average YOY growth
Queensland New South Wales Victoria
Above average growth
Lower than average growth
The top three suburbs for Variety Store purchases remained unchanged from 2017, with Point Cook, Liverpool and Toowoomba keeping their positions. Despite its large population, Toowoomba had below average household engagement and purchase frequency.
Sitting in number 10 for the second year in a row, the New South Wales suburb of Wyong showed well above average household engagement and purchase frequency with the latter increasing 70% above the national growth rate. Cranbourne in Melbourne’s Southeast is a location to watch, recording above average household engagement. Although the average purchasing frequency is low, this is starting to increase.
Cranbourne also experienced significant population growth between the last two censuses, 3.6 times higher than the national average6. Due to the frequency of purchases and its population growth, we predict Variety Store purchases in Cranbourne will continue to grow in 2019.
Variety Stores 34

Home
Overview
Fashion
Variety Stores
Health & Beauty
Hobbies & Recreational
Goods
Cross border
The technology evolution
& AppliancesHomewares
Key trends Bucking the trend with a seasonal peak in December.
Almost a quarter of purchases from Variety Stores were made in the last two months of 2018, indicating Christmas shoppers still depend on Variety Stores as a one-stop-shop for their holiday purchases. Starting with Click Frenzy in November, Variety Store sales steadily increased through Black Friday / Cyber Monday into the second week of December, when they reached their annual peak.
This is a different story to all other categories, which peaked during the Black Friday / Cyber Monday week and purchases slowed towards Christmas. The continued growth in purchases after Black Friday / Cyber Monday reinforces that shoppers heavily depend on Variety Stores for Christmas shopping. Marketplaces were the main online sales channel in Variety Stores and largely contributed to the year on year growth in this category, with 42 out of 52 weeks of the year having above average growth.
Throughout the year, Marketplaces accounted for between 47.6% and 62.7% of Variety Store purchases each week. The peak occurred during the final week of the End of Financial Year Sales. This week saw a 107.9% increase in Marketplace purchases YOY, more than double the rate of overall Variety Stores growth for the same period. It’s possible this was due to changes in GST legislation, which took effect from July 1 2018 and saw a rush of Marketplace purchases before this date.
Busiest months
1st 2nd
November December
25%
YOY growth
22%
YOY growth
Variety Stores 35
Busiest weeks
Busiest 2nd busiest 3rd busiest week week week
31.8% YOY growth
Black Friday / Cyber Monday
23.5% YOY growth
3 weeks prior to Christmas
55.9% YOY growth
2 weeks prior to Christmas
Home
Overview
Fashion
Variety Stores
Health & Beauty
Hobbies & Recreational
Goods
Cross border
The technology evolution
& AppliancesHomewares
Health & Beauty 36
Industry overview
Health & Beauty

Home
Overview
Fashion
Variety Stores
Health & Beauty
Hobbies & Recreational
Goods
Cross border
The technology evolution
& AppliancesHomewares
Overview Online purchases of Health & Beauty products boomed in 2018, growing faster than any other category at 29.4% YOY.
This was the fourth consecutive year of double-digit growth for this category. Health & Beauty represented 8.4% of all eCommerce purchases. When combined with Health & Beauty purchases from Variety Stores, the category’s overall share increased to 11%.
As the name suggests, Health & Beauty comprises two distinct purchase types. Health purchases include Vitamins, Supplements and Pharmaceutical Goods, which tend to be purchased by consumers on a more frequent replenishment cycle. Beauty purchases are predominantly Cosmetics and are typically purchased more impulsively by younger consumers.
Health & Beauty shoppers increasingly prefer to split their payments, with 11.6% of BNPL purchases attributed to this category. Cosmetic and Beauty Goods accounted for 70% of these Health & Beauty BNPL transactions4.
Share of online purchases
8.4%
Health & Beauty
11%
2.6%
Variety Stores
Health & Beauty 37
YOY growth
20.2% National online average
2018 YOY growth 29.4%

Home
Overview
Fashion
Variety Stores
Health & Beauty
Hobbies & Recreational
Goods
Cross border
The technology evolution
& AppliancesHomewares
Digging deeper Beauty products had a standout year in 2018 with 36.4% YOY growth, representing 54.6% of Health & Beauty purchases. This was the second highest growth category for the year behind Activewear and was largely driven by sales events. Health purchases also showed strong growth, up 21.8% YOY, which accounted for 45.4% of Health & Beauty purchases. These strong performances were the driving factor in this industry’s eCommerce growth in 2018.
Health & Beauty highlights
Biggest Strong contributor performer
Beauty
54.6% Health
45.4%
(Share) (Share)
36.4% 21.8%
YOY growth YOY growth
Health & Beauty 38

Home
Overview
Fashion
Variety Stores
Health & Beauty
Hobbies & Recreational
Goods
Cross border
The technology evolution
& AppliancesHomewares
Major cities of Australia
Inner regional Australia
Outer regional Australia
Remote Australia
Very remote Australia
Regional growth 29.4% Health & Beauty average YOY growth
31.1%
27.6%
22.4%
20.5%
11%
State and regional growth Major cities grew the fastest of all regions in Australia, growing 31.1% YOY in 2018. This region also accounted for 70.9% of Health & Beauty purchases. Inner regional Australia was the next fastest, up 27.6% YOY.
New South Wales, Victoria and Queensland accounted for 77% of all Health & Beauty purchases. Purchases in Tasmania grew 30.9% YOY, above the national average, suggesting that shoppers in this State seek a broader product selection online than what is available locally. After below average growth in 2017, South Australia’s Health & Beauty purchases rose 31.1%, while growth in Queensland went the opposite way, and slowed after above average growth in 2017.
State and Territory growth
29.4%
Health & Beauty average YOY growth
Northern Territory
18.7%
Western Australia
22.2%
New South Wales
29.6% Victoria
32.6%
South Australia
31.1% Tasmania
30.9% Queensland
28.5%
Australian Capital Territory
30.6%
Health & Beauty 39

Home
Overview
Fashion
Variety Stores
Health & Beauty
Hobbies & Recreational
Goods
Cross border
The technology evolution
& AppliancesHomewares
Who’s buying? Top 10 buying locations by volume
Rank Locality Growth (%)
1 Toowoomba, 4350 25.3
2 Point Cook, 3030 33.7
3 MacKay, 4740 23.1
4 Upper Coomera, 4209 40.6
5 Mandurah, 6210 14.3
6 Cranbourne, 3977 37.7
7 Bundaberg, 4670 27.2
8 Liverpool, 2170 31.5
9 Gosford, 2250 27.8
10 Hoppers Crossing, 3029 -13.1
3
4 1
7 8
9
Queensland New South Wales
Above average growth
Lower than average growth
29.4% Health & Beauty average YOY growth
2
10
6
5
Victoria Western Australia
Located in the growth corridor between the Gold Coast and Brisbane, Upper Coomera debuted in the top 10 Health & Beauty suburbs, growing at 40.6% YOY.
Having only one third to half the population compared to the other top 10 suburbs, Upper Coomera had above average household engagement and purchase
frequency. We predict it will continue to grow, given its population growth is 4.5 times higher than the national average and it has a younger demographic profile6.
Bundaberg in Queensland is another new entrant to the top 10 list due to its high purchase frequency. Its household engagement is still low but is set to grow.
With below average household engagement and below average purchase frequency, Toowoomba and Hoppers Crossing achieved high eCommerce purchases in Health & Beauty. Their high rankings were mainly driven by their large populations.
Health & Beauty 40

Home
Overview
Fashion
Variety Stores
Health & Beauty
Hobbies & Recreational
Goods
Cross border
The technology evolution
& AppliancesHomewares
Key trends Stunning spikes for sales events.
November was the stand out month for Health & Beauty purchases in 2018, growing a whopping 40.1% YOY and accounting for 11% of purchases for the year. December was close behind, with 32.3% growth in purchases and a total of 10% of purchases.
Sales events largely stimulated this significant growth, with some sales weeks having the strongest Health & Beauty growth of the year. For example, Black Friday / Cyber Monday week was the number one week for Health & Beauty volume, surging 53.5% YOY. Whilst not the largest month for the year, the May Mayhem sale also grew more than 50% YOY which was well above the average Health & Beauty growth of 29.4% in 2018.
Health & Beauty 41
Busiest months
1st 2nd
November December
32.2%
YOY growth
40.1%
YOY growth
Busiest weeks
Busiest 2nd busiest 3rd busiest week week week
63.3% YOY growth
Lead Up to Black Friday
53.5% YOY growth
Black Friday / Cyber Monday
32.4% YOY growth
2 weeks prior to Christmas

Home
Overview
Fashion
Variety Stores
Health & Beauty
Hobbies & Recreational
Goods
Cross border
The technology evolution
& AppliancesHomewares
Homewares & Appliances 42
Industry overview
Homewares & Appliances
Home
Overview
Fashion
Variety Stores
Health & Beauty
Hobbies & Recreational
Goods
Cross border
The technology evolution
& AppliancesHomewares
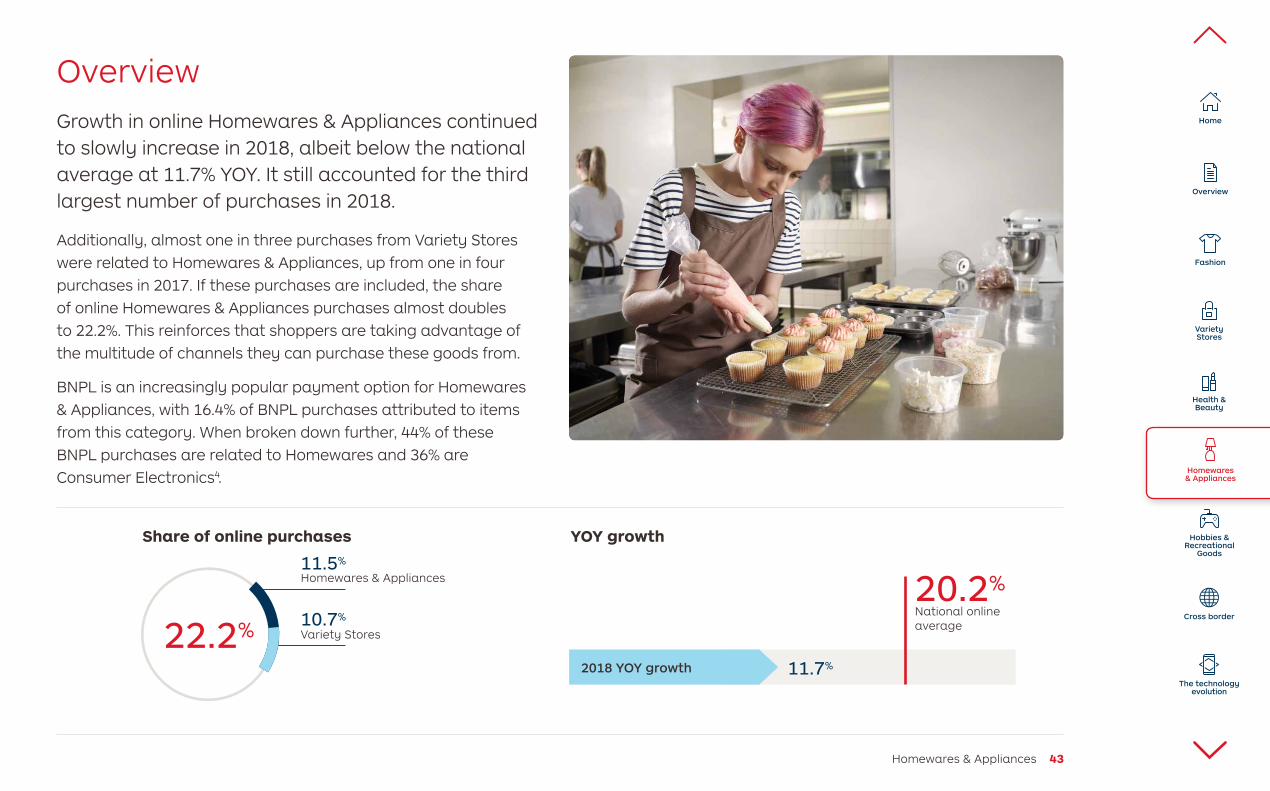
Overview Growth in online Homewares & Appliances continued to slowly increase in 2018, albeit below the national average at 11.7% YOY. It still accounted for the third largest number of purchases in 2018.
Additionally, almost one in three purchases from Variety Stores were related to Homewares & Appliances, up from one in four purchases in 2017. If these purchases are included, the share of online Homewares & Appliances purchases almost doubles to 22.2%. This reinforces that shoppers are taking advantage of the multitude of channels they can purchase these goods from.
BNPL is an increasingly popular payment option for Homewares & Appliances, with 16.4% of BNPL purchases attributed to items from this category. When broken down further, 44% of these BNPL purchases are related to Homewares and 36% are Consumer Electronics4.
Share of online purchases
11.5%
Homewares & Appliances
10.7%
Variety Stores 22.2%
YOY growth
11.7%2018 YOY growth
20.2%National online average
Homewares & Appliances 43

Home
Overview
Fashion
Variety Stores
Health & Beauty
Hobbies & Recreational
Goods
Cross border
The technology evolution
& AppliancesHomewares
Digging deeper Homewares captured the highest share in this category, with 37.3% of purchases, and achieved above average growth of 15.8% YOY.
It was closely followed by Consumer Electronics, with a 24.7% share, growing 14.5% YOY. Online purchases of Tools, while a relatively small sub-category, also grew strongly at 12.6%. As major retailers continue to invest in online platforms for selling Hardware this will be an area to watch.
The next up-and-coming sector to watch is the Pet category. Purchases of Pet Products accounted for 10.2% of Homewares & Appliances in 2018.
Homewares & Appliances highlights
Top Strong Up and performer growth coming
Consumer Electronics
Pet Products
Homewares
10.2% 37.3% 24.7%
(Share) (Share) (Share)
15.8% 14.5%
YOY growth YOY growth
Homewares & Appliances 44

Home
Overview
Fashion
Variety Stores
Health & Beauty
Hobbies & Recreational
Goods
Cross border
The technology evolution
& AppliancesHomewares
Major cities of Australia 12.8%
Inner regional Australia 10.4%
Outer regional Australia 8.5%
Remote Australia 7.3%
Very remote Australia 8.8%
11.7%Homewares & Appliances average YOY growth
Regional growth
State and regional growth Victoria was again the fastest growing State for Homewares & Appliances in 2018, up 14.4% YOY. Following closely behind was Tasmania, growing 13.7% YOY. The Australian Capital Territory also grew at an above average rate of 12.4% YOY. Despite on par growth in New South Wales and below average growth in Queensland, these two States combined with Victoria account for almost 80% of all Homewares & Appliance purchases in Australia.
Major cities accounted for two thirds of purchases in 2018, and was the fastest growing region at 12.8% YOY. Inner regional areas grew at a modest 10.4%, 1.3 percentage points below the national average.
State and Territory growth
Homewares & Appliances 45
Northern Territory
5.9%
Western Australia
6.7%
New South Wales
11.8%Victoria
14.4%Tasmania
13.7%Queensland
10.5%
South Australia
12%
Australian Capital Territory
12.4%
11.7%
Homewares & Appliances average YOY growth

Home
Overview
Fashion
Variety Stores
Health & Beauty
Hobbies & Recreational
Goods
Cross border
The technology evolution
& AppliancesHomewares
Who’s buying? Top 11 buying locations by volume
Rank Locality Growth (%)
1 Point Cook, 3030 32
2 Toowoomba, 4350 7.7
3 Mackay, 4740 12.1
4 Gosford, 2250 9.2
5 Bundaberg, 4670 -0.1
6 Cranbourne, 3977 18.5
7 Hoppers Crossing, 3029 21.9
8 Wyong, 2259 13.4
9 Liverpool, 2170 17.6
10 Cairns, 4870 7
11 Rouse Hill, 2155 24.4
11.7% Homewares & Appliances average YOY growth
3
2
1
7
6
5
10
11
8
9
4
Queensland New South Wales Victoria
Above average growth
Lower than average growth
New growth corridors dominated the top 11 buying locations, including last year’s strong buying locations Point Cook and Hoppers Crossing, whose YOY growth was substantially higher than the national average for Homewares & Appliances.
Gosford represents a relatively mature suburb for Homewares & Appliances purchases. The growth is minimal across
online purchases, buying frequency and population. It did however maintain its high ranking due to its slightly above average household engagement and purchase frequency, combined with its moderately large population.
Rouse Hill in Sydney’s booming Northwest ranked 11 in Homeware & Appliance purchases and is a suburb to watch.
It had well above average household engagement and its purchase frequency grew 1.7 times higher than the national average. With population growth 2.1 times above national growth6, we predict its online purchases in Homewares & Appliances will continue to grow.
Homewares & Appliances 46

Home
Overview
Fashion
Variety Stores
Health & Beauty
Hobbies & Recreational
Goods
Cross border
The technology evolution
& AppliancesHomewares
Key trends November was the busiest month for the purchase of Homewares & Appliances, with 10.4% of the annual share.
It was followed closely by December with 9.4%. However, growth in both months was lower than the average of 11.7% for 2018. The five largest volume weeks fell in the sales events period prior to Christmas, starting with Click Frenzy and peaking in Black Friday / Cyber Monday, before tapering off towards the second week of December.
The growth of Homewares was stronger than Consumer Electronics in all five top growth weeks except Black Friday / Cyber Monday, which had a slightly stronger growth in Consumer Electronics. Homewares & Appliances showed strong growth of 23.7% during Black Friday / Cyber Monday, compared to average category growth of 11.7%.
May Mayhem was another successful sales event for Homeware retailers, with purchases growing 37.8% YOY. This was after a noted increase in the number of Homeware offers in the May Mayhem sale, complementing its focus on Fashion and Beauty items in previous years.
Busiest months
1st 2nd
November December
8.1%
YOY growth
10.9%
YOY growth
Busiest weeks
Busiest 2nd busiest 3rd busiest week week week
23.7% YOY growth
Black Friday / Cyber Monday
10.7% YOY growth
3 weeks prior to Christmas
6.4% YOY growth
2 weeks prior to Christmas
Homewares & Appliances 47

Home
Overview
Fashion
Variety Stores
Health & Beauty
Hobbies & Recreational
Goods
Cross border
The technology evolution
& AppliancesHomewares
Industry overview
Hobbies & Recreational Goods
Hobbies & Recreational Goods 48

Home
Overview
Fashion
Variety Stores
Health & Beauty
Hobbies & Recreational
Goods
Cross border
The technology evolution
& AppliancesHomewares
Overview Automotive parts make up the majority of Hobbies & Recreational Goods, accounting for 25.7% of purchases and growing 12.2% YOY.
This diverse category includes Games & Toys, Outdoor Goods, Sporting Equipment, Automotive Parts and Gaming and grew a modest 8.5% and accounted for 6.7% of online purchases in 2018.
This is a decrease in both share and growth compared to 2017. As some major players consolidate and invest in their online channels, we expect to see growth in this category in 2019.
Share of online purchases
6.7%
Hobbies & Recreational Goods 49
YOY growth
20.2%National online average
8.5%2018 YOY growth

Home
Overview
Fashion
Variety Stores
Health & Beauty
Hobbies & Recreational
Goods
Cross border
The technology evolution
& AppliancesHomewares
Digging deeper Automotive Parts and Sporting Equipment collectively contributed 45.3% to online purchases of Hobbies & Recreational Goods.
The strongest growth was in Outdoor Goods, growing 17.4% YOY, followed by Games & Toys which grew by 15.5%.
After a standout year in 2017, purchases of Musical Instruments and Accessories declined 5.5% YOY in 2018.
Hobbies & Recreational Goods highlights
Top Highest Second highest performer growth contributor
Sporting Equipment
Automotive Parts
19.6% 25.7%
Outdoor Goods
17.4%
(Share) (Share) (YOY)
Hobbies & Recreational Goods 50

Home
Overview
Fashion
Variety Stores
Health & Beauty
Hobbies & Recreational
Goods
Cross border
The technology evolution
& AppliancesHomewares
Tasmania
11.9%
Hobbies & Recreational Goods average YOY growth
Australian Northern Territory
1.9% Victoria
11.6%
Hobbies & Recreational Goods 51
Western New South South Australia
6.7% Wales
7.8% Queensland
7.8% Australia
9%
Capital Territory
5%
State and regional growth Over a third of all Hobbies & Recreational goods purchases were delivered to regional areas in Australia, which experienced higher growth at 10.1% compared to metro areas which grew 7.8% YOY.
Once again, New South Wales, Victoria and Queensland accounted for the majority of Hobbies & Recreational Goods purchases in 2018, contributing 76.9% in total. Tasmania was again the fastest growing State in 2018, growing 11.9% YOY. This was followed closely by Victoria which also retained its place from 2017, growing 11.6% YOY. South Australia jumped up the rankings in 2018, up 9% YOY.
State and Territory growth
8.5%
Inner regional Australia
Outer regional Australia
Major cities of Australia
Remote Australia
Very remote Australia
Regional growth
6.7%
2.5%
8.5% Hobbies & Recreational Goods average YOY growth
7.8%
10.8%
10%

Home
Overview
Fashion
Variety Stores
Health & Beauty
Hobbies & Recreational
Goods
Cross border
The technology evolution
& AppliancesHomewares
Who’s buying? Top 10 buying locations by volume
Rank Locality Growth (%)
1 Toowoomba, 4350 11.1
2 Point Cook, 3030 16.1
3 Mackay, 4740 8.5
4 Bundaberg, 4670 8.6
5 Wyong, 2259 8.6
6 Gladstone, 4680 4
7 Cranbourne, 3977 17.3
8 Gosford, 2250 4.4
9 Campbelltown, 2560 7.6
10 Sanctuary Point, 2540 9.8
3
2
7
1
4
6
10
5
9
8
8.5% Hobbies & Recreational Goods average YOY growth
Queensland New South Wales Victoria
Above average growth
Lower than average growth
Point Cook has leapt from fifth to second place for Hobbies & Recreational Goods purchased online. With its rapid population growth and above average income, we predict Point Cook will continue to grow in this category.
Although it has below average household engagement and below average purchase frequency, Toowoomba secured first place in this category due to its population size of over one hundred thousand6.
Cranbourne, which grew its Hobbies & Recreational Goods purchases 17.3% YOY, has also experienced high population growth and has above average household engagement. With its shopping frequency below the national average, there is room for additional growth in the years ahead.
Hobbies & Recreational Goods 52

Home
Overview
Fashion
Variety Stores
Health & Beauty
Hobbies & Recreational
Goods
Cross border
The technology evolution
& AppliancesHomewares
Key trends November and December were the peak purchase months for Hobbies & Recreational Goods, with an almost even 10.9% and 10.1% share respectively. The sales peak followed overall online shopping trends, with Black Friday / Cyber Monday taking the number one spot and growing above average at 10.5% YOY. This was followed by the second and first weeks of December.
The week before Christmas saw the largest sales leap at 25.3% YOY, whilst being the fifth highest in terms of number of purchases. Games & Toys accounted for 36.1% of purchases in that week, growing over 50% YOY, highlighting the importance of last minute Christmas shopping in this category.
End of Financial Year Sales was another strong sales event, that stimulated the sale of Outdoor Goods and Games & Toys. Purchases of Outdoor Goods increased 33.7% YOY during the sale and Games & Toys grew 24.2% YOY, both well above the overall category growth in 2018.
Busiest months
1st 2nd
November December
7.2%
YOY growth
6.8%
YOY growth
Busiest weeks
Busiest 2nd busiest 3rd busiest week week week
10.5% YOY growth
Black Friday / Cyber Monday
4.8% YOY growth
3 weeks prior to Christmas
3.9% YOY growth
2 weeks prior to Christmas
Hobbies & Recreational Goods 53

Home
Overview
Fashion
Variety Stores
Health & Beauty
Hobbies & Recreational
Goods
The technology evolution
& AppliancesHomewares
Cross border
Cross border
Cross border 54

Home
Overview
Fashion
Variety Stores
Health & Beauty
Hobbies & Recreational
Goods
The technology evolution
& AppliancesHomewares
Cross border
Cross-border eCommerce trends The global online goods market is forecast to reach USD $3.43 trillion by 2023, taking the share to 17% of total retail7.
eCommerce has no borders, therefore there is a significant opportunity for Australian businesses to expand overseas.
In this section, we examine the findings of a global survey conducted by International Post Corporation (IPC), which studied frequent cross-border online shoppers, including 1,037 Australian and 798 overseas shoppers whose most recent purchases were from Australia. It was the largest-ever global consumer survey focused on cross-border eCommerce5.
Cross border 55
14.8% Compound Annual Growth Rate 2018 to 2023
Global online goods market
USD in trillions
$3.43T 2023
2022
2021
2020
2019
$1.72T 2018

Home
Overview
Fashion
Variety Stores
Health & Beauty
Hobbies & Recreational
Goods
The technology evolution
& AppliancesHomewares
Cross border
Australians buying from abroad 40% of Australian shoppers’ most recent purchases were from China.
The number one overseas market for inbound eCommerce purchases is China, capturing 40% of Australian online shoppers’ most recent purchases. The United States, which has declined in share over the past two years, represents 21%, and the United Kingdom 14%.
Top source countries Most recent purchase
China 40%
United States 21%
United Kingdom 14%
Hong 6% Kong
New 3% Zealand
Cross border 56

Home
Overview
Fashion
Variety Stores
Health & Beauty
Hobbies & Recreational
Goods
The technology evolution
& AppliancesHomewares
Cross border
Purchase categories A quarter of Australia’s inbound eCommerce purchases were Fashion related. Sport & Leisure and Home & Garden products are trending upwards, at least two percentage points increase from 2017.
Most recent purchases
Largest 2nd Largest 3rd Largest
Fashion
25% (Share)
Consumer Electronics
17% (Share)
Health & Beauty
15% (Share)
Growth categories
Up and Up and coming coming
(Ranking)
Sport & Leisure
6th
Home & Garden
8th (Ranking)
Cross border 57

Home
Overview
Fashion
Variety Stores
Health & Beauty
Hobbies & Recreational
Goods
The technology evolution
& AppliancesHomewares
Cross border
Most popular purchasing sites eBay, with 44% share of Australia’s inbound eCommerce purchases, is clearly the most popular international online shopping platform. This is followed by Amazon with 9% and Wish with 8% share.
Largest 2nd Largest 3rd Largest
eBay
44% Amazon
9% Wish
8% (Share) (Share) (Share)
Cross border 58

Home
Overview
Fashion
Variety Stores
Health & Beauty
Hobbies & Recreational
Goods
The technology evolution
& AppliancesHomewares
Cross border
Average order value Two thirds of Australian respondents spent on average under $70, with 46% spending under $35 per transaction.
Returns preference Australian online shoppers prefer to return their international purchases at the Post Office (51%), with 21% preferring a delivery driver pick-up from home. This is similar to responses in 2017.
Delivery driver pick-up from home
21%
Drop off at Post Office
51%
46% of Australians spent under $35 per transaction on international purchases.
Cross border 59

Home
Overview
Fashion
Variety Stores
Health & Beauty
Hobbies & Recreational
Goods
The technology evolution
& AppliancesHomewares
Cross border
Overseas shoppers buying from Australia Other than domestic purchases, Australian products were most likely to be purchased by consumers based in New Zealand (accounting for 29% of Australian exports), China (15%) and India (11%).
Purchase categories Australian Health & Beauty and Baby Products are in demand. Compared to the 41 markets surveyed, Australia is over-represented in these categories.
When it comes to the number of purchases, Fashion products are our leading eCommerce export, 31% of purchases are Fashion related on par with the global average.
Top destination countries Most recent purchase
29%
15%
11%
4%
4%
New Zealand
China
India
South Korea
Singa- pore
Top purchase categories Growth categories Highly
Largest 2nd largest 3rd largest sought after Over-represented
Health & Beauty
28% Compared to 17% globally
Baby & Kids Products
12% Compared to 5% globally
Consumer Electronics
13% (Share)
Health & Beauty
28% (Share)
Fashion
31% (Share)
Cross border 60

Home
Overview
Fashion
Variety Stores
Health & Beauty
Hobbies & Recreational
Goods
The technology evolution
& AppliancesHomewares
Cross border
China’s most recent cross-border purchases Online shoppers from China are turning to Australia for trusted and authentic products, 12% of respondents said they had made their most recent purchase from Australia. Japan and America held the largest share at 23% and 14% respectively. Hong Kong came in third, with a share slightly above Australia.
Japan
23%
Australia United States
14% (Share) (Share)
12% (Share)
New Zealand’s most recent cross-border purchases In New Zealand, only China captured a larger share of their most recent online purchases than Australia.
China
33%
Australia
22% (Share) (Share)
United States
19% (Share)
India’s most recent cross-border purchases Online shoppers in India, expressed a stronger preference for goods from the United States at 26%, followed by China then Australia.
Australia
8%
China
23% (Share) (Share)
United States
26% (Share)
Cross border 61

Home
Overview
Fashion
Variety Stores
Health & Beauty
Hobbies & Recreational
Goods
The technology evolution
& AppliancesHomewares
Cross border
21% of international shoppers spent over $150 per transaction on Australian products.
Most popular websites for Australian products The most commonly used websites for outbound Australian eCommerce purchases were Amazon (23%), eBay (13%), Alibaba (9%) and JD.com (5%).
Largest 2nd Largest 3rd Largest 4th Largest
eBay
13% Alibaba
9% JD.com
5% Amazon
23% (Share) (Share) (Share) (Share)
Average order value International online shoppers spend above average on Australian products. 22% spending between $35 and $69 per transaction, while 21% spent over $150 with 10% spending more than $300.
Cross border 62
<$15 6%
$15–34 18%
22%
19%
13%
11%
10%
$35–69
$70–104
$105–149
$150–299
$300+

Home
Overview
Fashion
Variety Stores
Health & Beauty
Hobbies & Recreational
Goods
The technology evolution
& AppliancesHomewares
Cross border
Global shopping preferences Overseas online shoppers are more likely to buy on their smartphones (39%), followed by a laptop (27%). Furthermore, 61% expressed interest in sustainable packaging, and 54% are willing to pay 15 cents if this was offered.
39%
Buy on smartphone
27%
Buy on laptop
Returns preferences Online shoppers buying from Australia are typically younger, and live in urban Asian cities. They prefer their returns parcels to be picked up by a courier, rather than having to drop them off.
19% of Australian eCommerce products are returned, which is significantly higher than the global average of 8%.
There are several factors behind this, Australia is exporting more valuable products than average, and Australian online retailers are more likely to provide return labels.
Delivery driver pick-up from home
34%
Delivery driver pick-up from office / workplace
13%
Drop off at Post Office
21%
Cross border 63

Home
Overview
Fashion
Variety Stores
Health & Beauty
Hobbies & Recreational
Goods
Cross border
The technology evolution
& AppliancesHomewares
The technology evolution
The technology evolution 64
Meeting the needs of the modern-day shopper Growth in technology has fundamentally shifted eCommerce shopping behaviour, as consumers now expect more convenience and choice when shopping online.

Home
Overview
Fashion
Variety Stores
Health & Beauty
Hobbies & Recreational
Goods
Cross border
The technology evolution
& AppliancesHomewares
Virtual assistants More than ever, we are seeing an increase in the use of virtual assistants, whether they are embedded in a smartphone such as Siri or Google Assistant or a stand-alone smart speaker such as Alexa or Google Home.
As Australians continue to adopt the use of this technology, it is important that retailers ensure their content is optimised for ‘Voice’, to help maximise sales opportunities in Australia’s fast growing direct-to-consumer channel.
Almost 1.35 million Australian consumers now have a smart speaker, with ownership growing 200% between July and November 2018 – smashing global records for uptake8.
Woolworths is already ahead of this trend, with the development of the Woolworths Assistant App for Google home, making it easy for consumers to create and add to their shopping lists on the go.
By 2020 it is estimated 30% of all searches will be completed without a screen9. This makes accurate product tagging increasingly important for eCommerce retailers.
The technology evolution 65
30% of all searches will be completed without a screen by 2020.
Smart speaker ownership 1.35M
July 2018 November 2018 (200% growth)

Home
Overview
Fashion
Variety Stores
Health & Beauty
Hobbies & Recreational
Goods
Cross border
The technology evolution
& AppliancesHomewares
Visual search Visual search is also becoming increasingly sophisticated, enabling shoppers to take and upload pictures of an outfit they like and find similar products available for purchase. Online Fashion retailer The Iconic, is a great example of how this technology can be used.
The Iconic gives users the ability to upload a picture of an outfit they have seen in a store, online or in real life. Once the image is uploaded, the app provides a list of similar items available for purchase on the site, significantly reducing the search time and making it a more personalised shopping experience.
For smaller retailers, it may be a case of embracing these new areas of technology via the Marketplaces that offer them.
The technology evolution 66

Home
Overview
Fashion
Variety Stores
Health & Beauty
Hobbies & Recreational
Goods
Cross border
The technology evolution
& AppliancesHomewares
Augmented reality Augmented reality is revolutionising the way we shop, by providing consumers the ability to ‘virtually’ try a range of products and styles before making a decision.
In the beauty sector, L’Oréal is one of many leading the way with its augmented reality app Modiface. Consumers can use the app to test and try L’Oréal beauty products online. From lipstick shades to different styles of makeup, consumers can instantly see what products work best for their style and skin tone.
Ikea has been a pioneer in this space. The Ikea Place app enables you to virtually experiment with a range of products and styles to suit any space.
As we are spending more time than ever online and are increasingly time poor, augmented reality is a trend that is set to grow.
The technology evolution 67

Home
Overview
Fashion
Variety Stores
Health & Beauty
Hobbies & Recreational
Goods
Cross border
The technology evolution
& AppliancesHomewares
Shopping is getting personal More than ever, consumers expect a personalised shopping experience, with products and offers relevant to them.
That’s a challenge United States-based Stitch Fix is rising to. By using algorithms and data-driven insights to reinvent the styling experience, they are creating a virtual ‘store-for-one’ to deliver the perfect fit for their customers.
Whilst we are seeing shoppers responding to sales events, perhaps ultimately ‘fit’ could be more important to consumers than price.
Netflix is a great example of a business that is using algorithms to offer personalised viewing recommendations; based on the user’s previous viewing. The algorithm is constantly being updated to ensure it provides the most relevant information.
Retailers who use algorithms and data-driven insights to deliver experiences relevant to the consumer may have an advantage. This may ultimately lead to better customer engagement and conversion.
The technology evolution 68
'Fit' could be more important to consumers than price.

Home
Overview
Fashion
Variety Stores
Health & Beauty
Hobbies & Recreational
Goods
Cross border
The technology evolution
& AppliancesHomewares
The evolution of the chatbot With continual improvements in language processing, AI-enabled chatbots offer the convenient, 24/7 personalised shopping experience consumers now expect. Chatbots can proactively give product recommendations and guide the conversation – just as a human sales assistant would do in a store.
The Australia Post chatbot was responding to more than 2,000 customer queries every business day, within just seven months of launching. Customers access the chatbot by clicking on the “Ask Australia Post” icon on the Tracking or Help and Support page.
Chatbots are an exciting opportunity for retailers, as they meet customer expectations for immediate support, in a cost-effective way.
The technology evolution 69

Home
Overview
Fashion
Variety Stores
Health & Beauty
Hobbies & Recreational
Goods
Cross border
The technology evolution
& AppliancesHomewares
68% Consumers believe biometric payments will become more common.
New ways to pay The average eCommerce website requires shoppers to click 22 times before completing their purchase10. However this is set to change with the use of biometric technology, which helps to eliminate fraud and speeds up the checkout process.
Research indicates 68% of consumers in Australia, the United States and the United Kingdom believe biometric payments will become more common within the next two to five years11.
Régis Bauchiere, General Manager Identity Services at Australia Post said;
“The sensors we need to capture biometric data are embedded in our smartphones, making them the best tool to encourage different types of transactions, including eCommerce.
For high value transactions, or restricted goods (such as medication or alcohol), or when you need certainty of delivery; biometrics can verify the buyer is who they say they are, and is eligible to buy that product,” explains Bauchiere.
Margo Stephen, Australia Post’s Head of Digital ID™ said;
“By linking biometrics with valid documentation, we can create a reusable digital identity, giving retailers more confidence in knowing customers are who they say they are.”
As online shoppers continue to embrace new technology, their habits change quickly, and so do their expectations of a speedier, more intuitive online shopping experience.
The technology evolution 70

Home
Overview
Fashion
Variety Stores
Health & Beauty
Hobbies & Recreational
Goods
Cross border
The technology evolution
& AppliancesHomewares
The technology evolution 71
Biometric technology couldhelp eliminate fraud and speed up the checkout process.

Methodology The main sections of this report are based on analysis of 2017 and 2018 deliveries data recorded by the Australia Post Group, unless otherwise stated. Commentary in this report relating to online shopping is based on an extrapolation of this data. Household penetration and year on year growth numbers are based on actual or extrapolated transaction volumes.
The data and insights are reported at postcode, State and Territory, major city and regional Australia levels. For ease of reference, postcodes are substituted with suburb or locality names where appropriate. In instances where more than one suburb share a postcode, one location name is referenced.
The tables in the ‘Who’s buying?’ sections are based on modelled figures representing the top buying locations by transaction volume. The analysis excludes central business district (CBD) locations and postcodes with low household counts.
Specialty retailers are segmented into product categories; Fashion, Variety Stores, Health & Beauty, Homewares & Appliances, Hobbies & Recreational Goods, Media, and Specialty Food & Liquor.
The report also draws on: modelled estimates from Australia Post consumer surveys, statistics from the Australian Bureau of Statistics (ABS), online retail environment data from Quantium and publicly available information.
References to sales events and weeks are based on the dates below compared to the equivalent periods in 2017:
• Click Frenzy week data from 11–17 November.
• Lead up to Black Friday data from 18–24 November
• Black Friday / Cyber Monday data from 25 November to 1 December
• 3 weeks prior to Christmas data from 2–8 December
• 2 weeks prior to Christmas data from 9–15 December
The ‘cross border’ section is based on the findings of a global survey conducted by International Post Corporation (IPC). The survey covered 41 countries: Australia, Austria, Belgium, Brazil, Canada, China, Cyprus, Denmark, Finland, France, Germany, Greece, Hong Kong, Hungary, Iceland, India, Indonesia, Ireland, Italy, Japan, Latvia, Luxembourg, Malaysia, Mexico, the Netherlands, New Zealand, Norway, the Philippines, Portugal, Russia, Saudi Arabia, Singapore, Slovenia, South Korea, Spain, Sweden, Switzerland, Thailand, the United Kingdom, the United States and Vietnam.
The survey targeted frequent cross-border online shoppers, who had bought physical goods online at least once in the last three months and had made a cross-border online purchase in the past year.
The section examines the key findings relating to 1,037 Australian and 798 foreign-based online shoppers whose most recent cross-border purchase was from Australia. It also draws on market figures from Euromonitor International.
Methodology 72
Home
Overview
Fashion
Variety Stores
Health & Beauty
Homewares & Appliances
Hobbies & Recreational
Goods
Cross border
The technology evolution

References Home1. Online Physical Goods Index (produced by Quantium), and Australian Bureau of Statistics (ABS)
retail turnover excluding cafes, restaurants and takeaway food services, 2019
2. Online Physical Goods Index (produced by Quantium), March 2019
3. ABS, Retail turnover (excluding cafes, restaurants and takeaway food services), 2019
4. Australia Post Consumer Survey, 2018
5. International Post Corporation (IPC), Cross border eCommerce shopper survey, 2018
6. ABS, Census, 2016
7. Euromonitor International, Global online goods market figures, 2018
8. Versa, The Voice Report - Australian Voice ownership and usage report, 2019
9. Gartner Predicts 30% Of Searches Without A Screen In 4 Years, December 2016
10. Payments.com, Checkout Conversion Index, April 2018
11. Mobile Payments Today, Study - Consumers unsure about biometric payments, August 2018
Overview
Fashion
Variety Stores
Health & Beauty
Homewares & Appliances
Hobbies & Recreational
Goods
Cross border
The technology evolution
References 73

Contacts Australia Post’s analytics team provides a range of data solution services, and is responsible for putting together the insights in this report. If you have any questions or would like to know more, please contact your Australia Post Account Manager (if you have one) or contact us at [email protected]
Authors Rose Yip Head of eCommerce Data Analytics
Edward Jones Senior Data Analyst
Special acknowledgments
Stephanie Hewish Meijuan Zhao Celestine Airey Mark Harrington
To access past reports, go to auspost.com.au/einsights
Home
Overview
Fashion
Variety Stores
Health & Beauty
Homewares & Appliances
Hobbies & Recreational
Goods
Cross border
The technology evolution
Contacts 74
Home
Overview
Fashion
Variety Stores
Health & Beauty
Hobbies & Recreational
Goods
Cross border
The technology evolution
& AppliancesHomewares

About Australia Post With an unrivalled retail and delivery network, we’re making it easier for you to connect with your customers, and find new ones both here and overseas.
Through our suite of eCommerce-driven logistics, supply chain and parcel delivery solutions, we can help you to provide seamless eCommerce delivery experiences, from checkout to delivery.
To find out how we can help your business go further, sooner, visit us online at auspost.com.au
This report is provided for general information purposes only and is not intended to be specific advice for your business.