- oracle · performance fundamentals for oracle database 10g and 11g graham wood, uri shaft, john...
TRANSCRIPT

<Insert Picture Here>
Performance Fundamentals for Oracle Database 10g and 11g Graham Wood, Uri Shaft, John BeresniewiczOracle Corporation Sept 2008

The following is intended to outline our general product direction. It is intended for information purposes only, and may not be
incorporated into any contract. It is not a commitment to deliver any material, code, or functionality, and should not be relied upon
in making purchasing decisions.The development, release, and timing of any
features or functionality described for Oracle’s products remains at the sole
discretion of Oracle.

Oracle’s Complete Enterprise Software StackBuilt-in & Integrated Manageability
• Leader in the complete enterprise application stack
• Built-in manageability in every tier
• Integrated manageability across the entire stack

• Manage applications top-down, from the business perspective by understanding user experiences and business impact of IT issues
• Manage entire application lifecycle to increase business agility with comprehensive application quality management and compliance solutions
• Reduce operational coststhrough intelligent diagnostics and automated IT processes
Oracle Enterprise ManagerIncreases Business Efficiency

Agenda
• Time• Database Time and Average Active Sessions
• Techniques• The DB Time Method
• Tools• ADDM• EM Performance User Interface• Reports

Oracle Tuning Methods: A History
• Prehistoric (v5)• Debug code
• Dark Ages (v6)• Counters/Ratios• BSTAT/ESTAT• SQL*Trace
• Renaissance (v7/v8)• Introduction of Wait Event instrumentation• Move from counters to timers• STATSPACK
• Modernity (v10)• DB Time Tuning – Tuning using fundamental notion of time spent in database• Multiple scoping levels • Always on, non-intrusive• Built into infrastructure: instrumentation, ASH, AWR, ADDM, EM

Why Do We Care About Time?
• Human time is critical to the enterprise
• Systems performance affects business goals• Human time + technology resource time
• “Time is money”
• Performance improvement means doing things faster
Performance is always and only about time

<Insert Picture Here>
Database Time and Average Active Sessions

Database Time (DB Time)
• Total time in database calls by foreground sessions
• Includes CPU time, IO time and non-idle wait time
• DB Time <> response time
• New lingua franca for Oracle performance analysis
Database time is total time spent by user processes either actively working or actively
waiting in a database call.

Single session with Database Black Box server
Browse
Books
Read Reviews
For One BookAdd to
CartCheckout
TIME= time spent in database
A Single Session

Active Session = Session currently spending time in a database call
Database Time (DB Time) =Total time session spent in all database calls
Average Activity of the Session (% Activity) =The ratio of time active to total wall clock time
Browse
Books
Read Reviews
For One BookAdd to
CartCheckout
TIME= time spent in database
Fundamental Concepts


= time spent in database
Multiple Sessions
TIME
User 1
User 2
User 3
User n
t
At time t we have 2 active sessions
DB Time = Sum of DB Time Over All Sessions
Avg. Active Sessions = Sum of Avg. Activity Over All Sessions
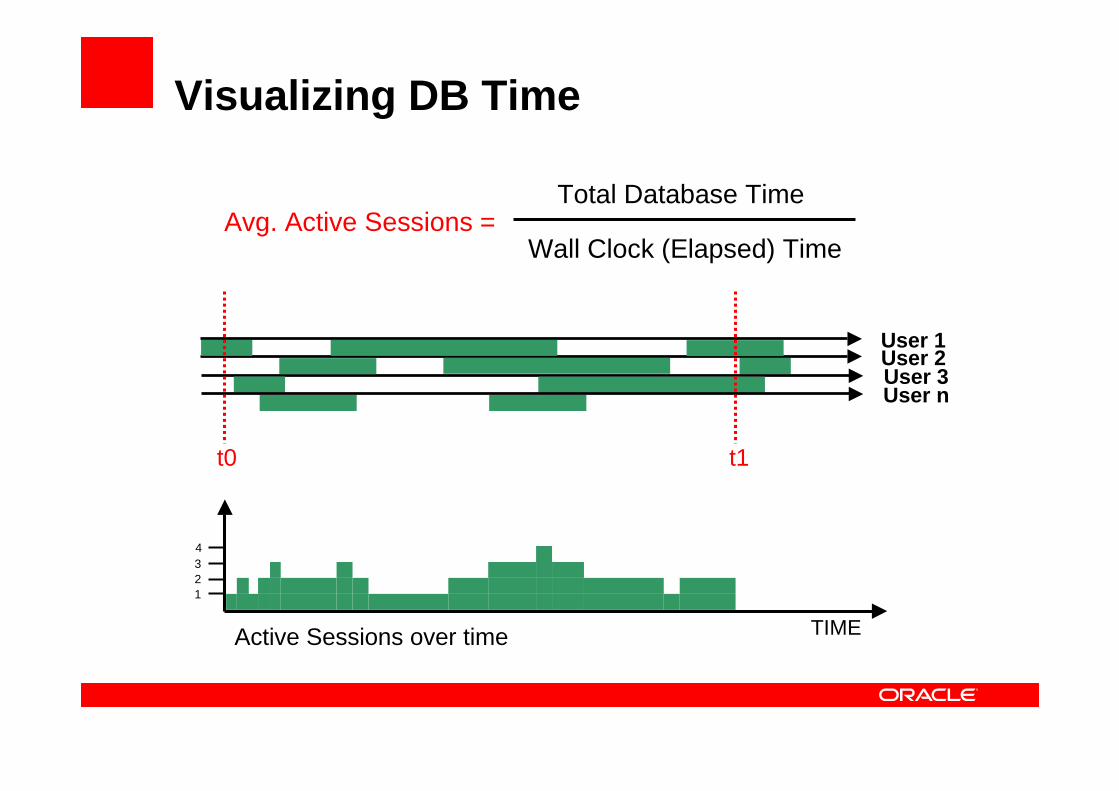
Avg. Active Sessions =Wall Clock (Elapsed) Time
Total Database Time
Visualizing DB Time
TIME
User 3User 2User 1
User n
t0 t1
1234
Active Sessions over time

EM Performance Page
• Active Sessions by wait class over time• Colored area = amount of DB time• “Click on the big stuff”
<Insert Picture Here>
DB Time and System Performance

System Load and DB Time
• More users• => More calls
• => DB time increases
• Larger transactions• => Longer calls
• => DB time increases
DB time increases as system load increases.
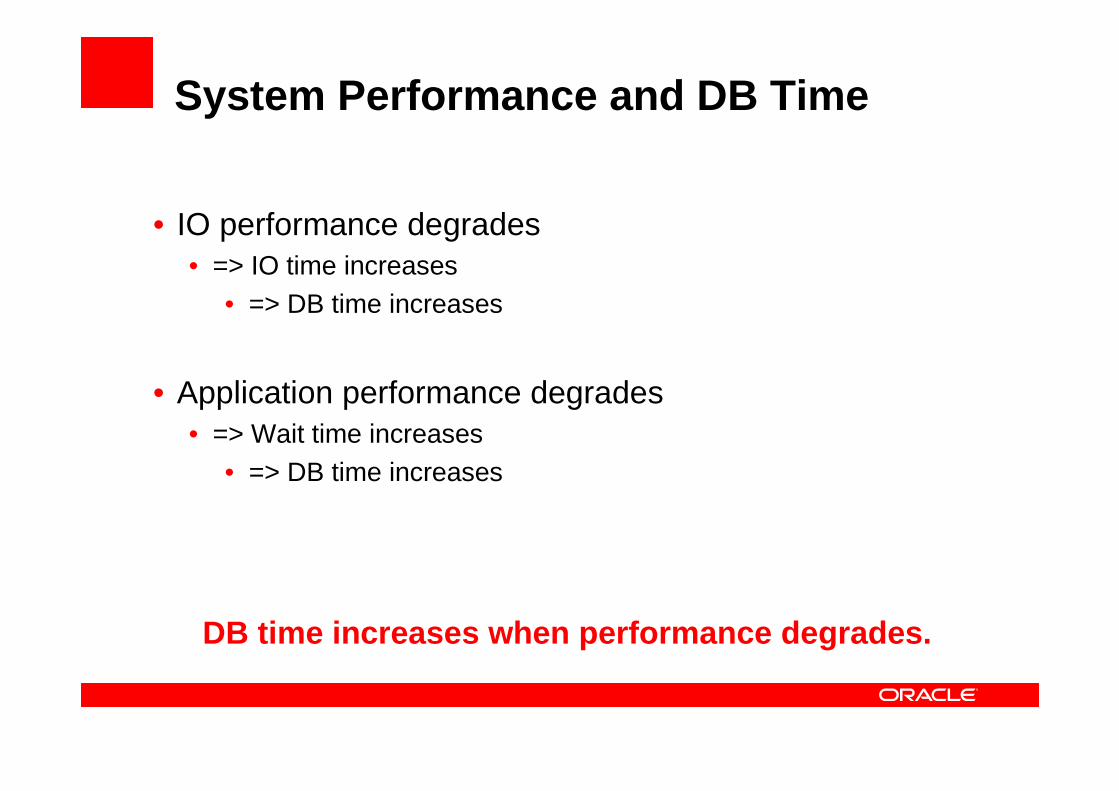
System Performance and DB Time
• IO performance degrades • => IO time increases
• => DB time increases
• Application performance degrades• => Wait time increases
• => DB time increases
DB time increases when performance degrades.

Host Performance and DB Time
• Host is CPU-bound• => foregrounds accumulate active run-queue time
• => wait event times are artificially inflated• => DB time increases
Tune for CPU before waits when CPU constrained

CPU Run-queue and DB Time
Db file sequential read
Run-queueOn CPU Db file sequential read
Run-queueOn CPU
DB time is inflated when host is CPU-bound
User 1
Actual wait time Actual wait time
Recorded wait time Recorded wait time

System performance and DB time
CPU or I/O problem?
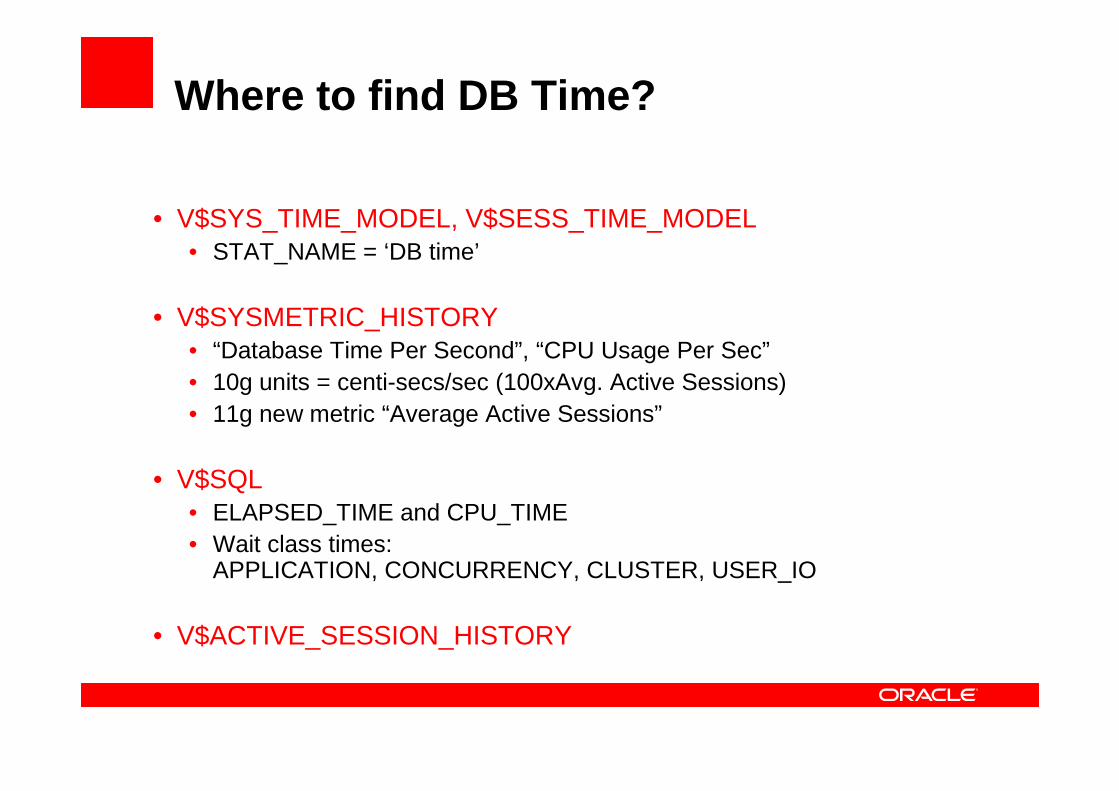
Where to find DB Time?
• V$SYS_TIME_MODEL, V$SESS_TIME_MODEL• STAT_NAME = ‘DB time’
• V$SYSMETRIC_HISTORY• “Database Time Per Second”, “CPU Usage Per Sec”• 10g units = centi-secs/sec (100xAvg. Active Sessions)• 11g new metric “Average Active Sessions”
• V$SQL• ELAPSED_TIME and CPU_TIME• Wait class times:
APPLICATION, CONCURRENCY, CLUSTER, USER_IO
• V$ACTIVE_SESSION_HISTORY

<Insert Picture Here>
Active Session History

Active Session History (ASH)
• All ‘Active’ sessions captured every second• Foregrounds and backgrounds are sampled• Active foregrounds contribute to DB Time
• In-memory: V$ACTIVE_SESSION_HISTORY • Sampling interval = 1 second
• On-disk: DBA_HIST_ACTIVE_SESS_HISTORY• Sampling interval = 10 second
• ASH is a system-wide record of database activity

timet0 t1
Active Sessions and DB Time
Active sessions
∆t = 1 sec
ASH sample count is value of active sessions function at sample times
DB Time
DB time is area under curve

Estimating DB Time with ASH
• ASH sample counts = DB Time in seconds• Low sample counts are less reliable
• Enables DB Time analysis over many dimensions• Sqlid, session id, instance, service, module, action• 10gR2
• Blocking_sid (10gR2) • XID
• 11g• Row source• Execution ID• Operation type
• Connect• Java/SQL/PLSQL• parse, bind, execute/fetch, close

Example: DB Time by SQL IDselect sql_id
, count(*) DBTime, round(count(*)*100/sum(count(*))
over (), 2) pctloadfrom v$active_session_history
where sample_time > sysdate - 1/24/60and session_type <> 'BACKGROUND‘
group by sql_idorder by count(*) desc;

Example: DB Time by SQL IDselect sql_id
, count(*) DBTime, round(count(*)*100/sum(count(*))
over (), 2) pctloadfrom v$active_session_history
where sample_time > sysdate - 1/24/60and session_type <> 'BACKGROUND'
group by sql_idorder by count(*) desc;
SQL_ID DBTIME PCTLOAD ------------- --------- -------6bmxrabnwwsxd 60 63.83 azzsynmz43nrr 8 8.51 28pb73sbwhmm8 5 5.32 58psyvgau23s2 3 3.19 amrq8hk767tuz 2 2.13 2r5qhb3fb63vm 1 1.06 f3919usqp5wj2 1 1.06

DB Time: ASH vs Time Model

Where is DB Time used?
• ADDM
• EM Performance page and drill downs
• ASH report
• AWR and AWR compare periods reports
• SYSMETRICS and Server-generated Alerts

<Insert Picture Here>
Techniques:
The DB Time Method

The DB Time Method: Short Course
Determine where database time is spent, and reduce it!
orjust ask ADDM

The DB Time Method: Process
1. Identify performance issue2. Scope the issue3. Set goals4. Data capture (NO OP)5. Investigate DB time distribution
• Identify the largest potential for improvement
6. Modify system to tune for largest gain7. Evaluate against goals
• Repeat from step 4 if goals not met
Performance tuning by removing excess DB time

Investigate DB Time Distribution
• Identify uneven distributions of DB time (skew)• => Largest potential improvement within scope
• System scope:• Resource limits – is problem outside the DB?
• Application scope:• Service, module, action• Resource contention (e.g. latches)• SQLID, rowsource
• Session scope:• Long running SQL• Resource contention (e.g. enqueues)

DB time

Identify Potential Solutions
• Session contention issues• Kill session• Fix application
• SQL issues• SQL Tuning Advisor => Indexes, SQL profile• Re-write SQL
• Design issues• Access Advisor => Indexes, physical layout
• System issues• Initialization parameters• Add resources

Modify System
• Start with the largest DB time issues first• Address root causes, not symptoms
• Match solution scope to problem scope• Don’t tweak optimizer parameters before tuning SQL
• Proceed iteratively one fix at a time• Concurrent fixes should be orthogonal
• Measure and validate results at each successive step
• Stop when goals are met

The DB Time Method: Advantages
• Tunes the one thing that affects users: Time
• Data capture scoping not necessary• ‘Always on’ data collection• No requirement to reproduce problem
• Works for concurrency problems such as locking
• Combines best of current methods• Less intrusive, more inclusive

Method Summary
• DB time is the fundamental performance metric
• The method allows DB time analysis at many scopes• Proper scoping of problems and solutions is critical to success
• DB time based diagnosis removes value judgments• Scientific method, not sorcerer’s magic
• Performance improvement means doing the same work in less DB Time

<Insert Picture Here>
Tools:
ADDM
Enterprise Manager
Reports

Tools for Applying DB Time Method
Two use-cases, one method:
1. Tuning steady-state performance• Improve overall workload throughput or response time• Best practice: use ADDM
2. Diagnosing transient performance problems• Confirm and investigate reported performance issues• Best practice: use EM real-time screens

Best Practice: Use ADDM
• Embedded expert system using the DB time method• Identifies root causes behind the symptoms
• Variably scoped: • Host to instance to SQL and even database block• Scoped to database for RAC (new in 11g)
• Findings prioritized by impact on DB time• Finding history allows flexible time scoping• Directives can filter findings
• Recommendations by benefit (reduction) to DB time


Best Practice: EM Real-time Interface
• Transient (sub-hour) or immediate time scope• Requires interactivity of UI
• ‘Click on the big stuff’• Data visualizations display skew directly
• Takes some expertise to separate symptoms from root causes


Selected Additional Enterprise Manager Sessions
• Tuesday Sept 23• 11:30 a.m. Advanced Performance Diagnostics: What the GUI
Doesn't Tell You Moscone West Rm 2003• 1:00 p.m. Demystifying SQL Tuning: Tips and Techniques for
SQL Experts Moscone South Rm 303• 1:00 p.m. Oracle Enterprise Manager Hands-on Lab: - Database
Performance Diagnostics and Tuning Marriott Golden Gate B3 • Wednesday Sept 24
• 11:30 a.m. Oracle Enterprise Manager Hands-on Lab: -Database Performance Diagnostics and Tuning Marriott Golden Gate B3
• 1:00 p.m. SQL Tuning Roundtable with the Experts MosconeWest Rm 2001
• Thursday Sept 25• 1:30 p.m. Proactive Performance Monitoring with Baselines and
Adaptive Thresholds Moscone South Rm 303
