insar monitoring of land deformation - infrastructure risk ... · 15/02/2015 · insar monitoring...
TRANSCRIPT

www.mdacorporation.com
INSAR Monitoring of Land Deformation
- Infrastructure Risk Assessment and Mitigation GWF Hyderabad, January 2018
MDA Geospatial Services Inc. / DigitalGlobe

Use, duplication or disclosure of this document or any of the information or images contained herein is subject to the restrictions on the title page of this document. COPYRIGHT ©2017 MDA
Background
• Space-borne INSAR as effective, reliable monitoring technology to detect ground movement
• Movement detected at cm / mm level at both horizontal and vertical directions
• Such land deformation poses risk to infrastructure assets, such roads, bridges, buildings
• Alert of movement allows organizations opportunity of early mitigation
2

Use, duplication or disclosure of this document or any of the information or images contained herein is subject to the restrictions on the title page of this document. COPYRIGHT ©2017 MDA
Outline
• Intro to Land Deformation in Infrastructure Context
• Intro to INSAR
• Case#1: Seattle SR99 Bored Tunnel
• Case#2: High Speed Railway China
3

Use, duplication or disclosure of this document or any of the information or images contained herein is subject to the restrictions on the title page of this document. COPYRIGHT ©2017 MDA
Infrastructures and Urban Land Deformation
4

Use, duplication or disclosure of this document or any of the information or images contained herein is subject to the restrictions on the title page of this document. COPYRIGHT ©2017 MDA
Land Deformation – In Context of Infrastructure
5

Use, duplication or disclosure of this document or any of the information or images contained herein is subject to the restrictions on the title page of this document. COPYRIGHT ©2017 MDA
Winnipeg, New Residential Development
Extreme subsidence in a Winnipeg residential
area, consistent with slumping of the riverbank.
+1 cm/yr
-1 cm/yr
RADARSAT-2 Data and Products © MacDonald, Dettwiler and Associates Ltd. (2012). All Rights
Reserved. RADARSAT is an official mark of the Canadian Space Agency.
Source: GoogleEarth Streetview
Linear rate
6

Use, duplication or disclosure of this document or any of the information or images contained herein is subject to the restrictions on the title page of this document. COPYRIGHT ©2017 MDA
Infrastructure Types
7
Type Characteristics
Buildings • Vertical surfaces -> layover, cast radar shadows • Thermally active (vertical elongation of tall buildings,
horizontal spreading of metal roofed industrial buildings)
Bridges • Multiple deformation sources (thermal expansion, vehicle loading, wind)
• Complex radar return (e.g. double bounce off water)
Roads • Low radar backscatter from asphalt -> increases measurement noise -> requires filtering
• May be cluttered by traffic parked cars, trees
Tunnels • Not directly observable • Overburden relaxation, groundwater removal may result in
deformation of surface infrastructure within zone of influence
Others • Rail, dikes, airports, port facilities, …

Use, duplication or disclosure of this document or any of the information or images contained herein is subject to the restrictions on the title page of this document. COPYRIGHT ©2017 MDA
Deformation Drivers
8
Deformation driver Examples
Dewatering (underground water extraction)
Beijing, China
Dewatering (construction related)
Vancouver water filtration tunnel, Seattle SR99 tunnel
Sinkhole formation Limestone karst region of Pennsylvania, USA
Excavation Cut-and-cover sections of Vancouver ‘Canada Line’ project
Construction induced loading New construction in alluvial areas
Unstable slopes Urbanized hillsides – e.g. La Paz Bolivia

Use, duplication or disclosure of this document or any of the information or images contained herein is subject to the restrictions on the title page of this document. COPYRIGHT ©2017 MDA
Introduction to InSAR
9

Use, duplication or disclosure of this document or any of the information or images contained herein is subject to the restrictions on the title page of this document. COPYRIGHT ©2017 MDA
What does a SAR Sensor See?
10

Use, duplication or disclosure of this document or any of the information or images contained herein is subject to the restrictions on the title page of this document. COPYRIGHT ©2017 MDA
InSAR can measure surface changes of a few millimeters using SAR phase information.
InSAR calculates the change in surface height between two imaging times, by using radar to measure the distance from the satellite to the surface.
11
How SAR Detects Ground Movement?

Use, duplication or disclosure of this document or any of the information or images contained herein is subject to the restrictions on the title page of this document. COPYRIGHT ©2017 MDA 12
InSAR concept

Use, duplication or disclosure of this document or any of the information or images contained herein is subject to the restrictions on the title page of this document. COPYRIGHT ©2017 MDA
Using SAR to Measure Surface Movement
13

Use, duplication or disclosure of this document or any of the information or images contained herein is subject to the restrictions on the title page of this document. COPYRIGHT ©2017 MDA
Phase and amplitude change analysis
14
Analysis of the phase change of each pixel over time provides a time series of surface
movement measurements with mm accuracy.
Phase Change Analysis (InSAR)
A series of SAR images collected with the same
viewing geometry is used to perform either
phase change or amplitude change
analysis.
SAR data stack
Analysis of the amplitude change of each pixel information about the appearance or
disappearance of objects and features.
Amplitude Change Analysis
Changes at different times
New or missing objects
Time
Phase and amplitude change analysis

Use, duplication or disclosure of this document or any of the information or images contained herein is subject to the restrictions on the title page of this document. COPYRIGHT ©2017 MDA
Demonstrate Absence of Deformation
• Analysis over a five year period using natural targets
• InSAR used to confirm absence of deformation over gas storage reservoir field
• Showed that technology worked by measuring ground movement in adjoining EOR field
• Ground movement at gas storage field very small and related to moisture variations during rainy/dry conditions
Vertical deformation ~4 year period

Use, duplication or disclosure of this document or any of the information or images contained herein is subject to the restrictions on the title page of this document. COPYRIGHT ©2017 MDA
16
Monitoring Trends Over Time

Use, duplication or disclosure of this document or any of the information or images contained herein is subject to the restrictions on the title page of this document. COPYRIGHT ©2017 MDA
Line-of-sight measurements
17
• Actual deformation is a 3D vector quantity • InSAR measures projection of deformation along sensor line-of-sight a 1D quantity
• 2 (or more) view geometries can be combined to measure other dimensions
Actual deformation
Unmeasured component
Measured component

Use, duplication or disclosure of this document or any of the information or images contained herein is subject to the restrictions on the title page of this document. COPYRIGHT ©2017 MDA
West Actual
E-W Axis
N-S
Axis
100 200 300 400 500
100
200
300
400
500
North Actual
E-W Axis
N-S
Axis
100 200 300 400 500
100
200
300
400
500
Up Actual
E-W Axis
N-S
Axis
100 200 300 400 500
100
200
300
400
500West Estimate
E-W Axis
N-S
Axis
100 200 300 400 500
100
200
300
400
500
North Estimate
E-W Axis
N-S
Axis
100 200 300 400 500
100
200
300
400
500
Up Estimate
E-W Axis
N-S
Axis
100 200 300 400 500
100
200
300
400
500West Error
E-W Axis
N-S
Axis
100 200 300 400 500
100
200
300
400
500
North Error
E-W Axis
N-S
Axis
100 200 300 400 500
100
200
300
400
500
Up Error
E-W Axis
N-S
Axis
100 200 300 400 500
100
200
300
400
500
Deformation
E-W Axis
N-S
Axis
100 200 300 400 500
100
200
300
400
500
3. Vector decomposition
Estimating 2D deformation with InSAR
18
Erro
r A
ctu
al
Esti
mat
ed
East/West North/South Up/down
LOS - SLA23Des
E-W Axis
N-S
Axis
100 200 300 400 500
100
200
300
400
500
LOS - SLA9Asc
E-W Axis
N-S
Axis
100 200 300 400 500
100
200
300
400
500
LOS - SLA23Des
E-W Axis
N-S
Axis
100 200 300 400 500
100
200
300
400
500
LOS - SLA9Asc
E-W Axis
N-S
Axis
100 200 300 400 500
100
200
300
400
500
Ascending Descending
3D deformation 1. Simple example of dewatering deformation
2. Line-of-sight InSAR measurements (apparent east/west shift)
West Error
E-W Axis
N-S
Axis
100 200 300 400 500
100
200
300
400
500
North Error
E-W Axis
N-S
Axis
100 200 300 400 500
100
200
300
400
500
Up Error
E-W Axis
N-S
Axis
100 200 300 400 500
100
200
300
400
500
+ 1.0
- 1.0
Normalized deformation
Ascending Descending

Use, duplication or disclosure of this document or any of the information or images contained herein is subject to the restrictions on the title page of this document. COPYRIGHT ©2017 MDA
Case Study: Seattle Tunneling Project
19

Use, duplication or disclosure of this document or any of the information or images contained herein is subject to the restrictions on the title page of this document. COPYRIGHT ©2017 MDA
SR99 Tunnel Project • 3.2 km bored tunnel under downtown Seattle, U.S.A. • 17.5 m diameter tunnel boring machine ‘Big Bertha’ • TBM failed after 10% completion of tunnel • Repair involves 24 m wide x 37 m deep rescue shaft with
significant dewatering required potential for surface displacement
N
20

Use, duplication or disclosure of this document or any of the information or images contained herein is subject to the restrictions on the title page of this document. COPYRIGHT ©2017 MDA
SR99 Tunnel Project Timeline
Inspection dewatering (1500 L/min.)
2012 2013 2014 2015
Access shaft dewatering (3000 L/min.)
Boring Preparations for boring.
RADARSAT-2 dataset: 79 Spotlight mode images (Ascending and Descending) Ongoing RADARSAT-2 acquisitions
Cutter head failure
21

Use, duplication or disclosure of this document or any of the information or images contained herein is subject to the restrictions on the title page of this document. COPYRIGHT ©2017 MDA
RADARSAT-2 data
SLA9_Asc SLA23_Des Study Area
Rescue shaft Completed
Planned
Stack Start Day End Day Number of
Scenes Incidence
angle (degrees)
SLA9 Ascending 2012/06/06 2015/02/15 41 37.0
SLA23 Descending 2012/06/06 2015/02/15 38 46.7
22

Use, duplication or disclosure of this document or any of the information or images contained herein is subject to the restrictions on the title page of this document. COPYRIGHT ©2017 MDA
Descending Ascending
+3.5 cm
-3.5 cm
+3.5 cm
-3.5 cm
Line-of-sight deformation
Cumulative (2012/06/06 – 2015/02/15)
23
+ 1.0
- 1.0
LOS - SLA23Des
E-W Axis
N-S
Axis
100 200 300 400 500
100
200
300
400
500
LOS - SLA9Asc
E-W Axis
N-S
Axis
100 200 300 400 500
100
200
300
400
500
LOS - SLA23Des
E-W Axis
N-S
Axis
100 200 300 400 500
100
200
300
400
500
LOS - SLA9Asc
E-W Axis
N-S
Axis
100 200 300 400 500
100
200
300
400
500
Ascending Descending
Normalized deformation
Same east/west pattern shift from example…
Use, duplication or disclosure of this document or any of the information or images contained herein is subject to the restrictions on the title page of this document. COPYRIGHT ©2017 MDA
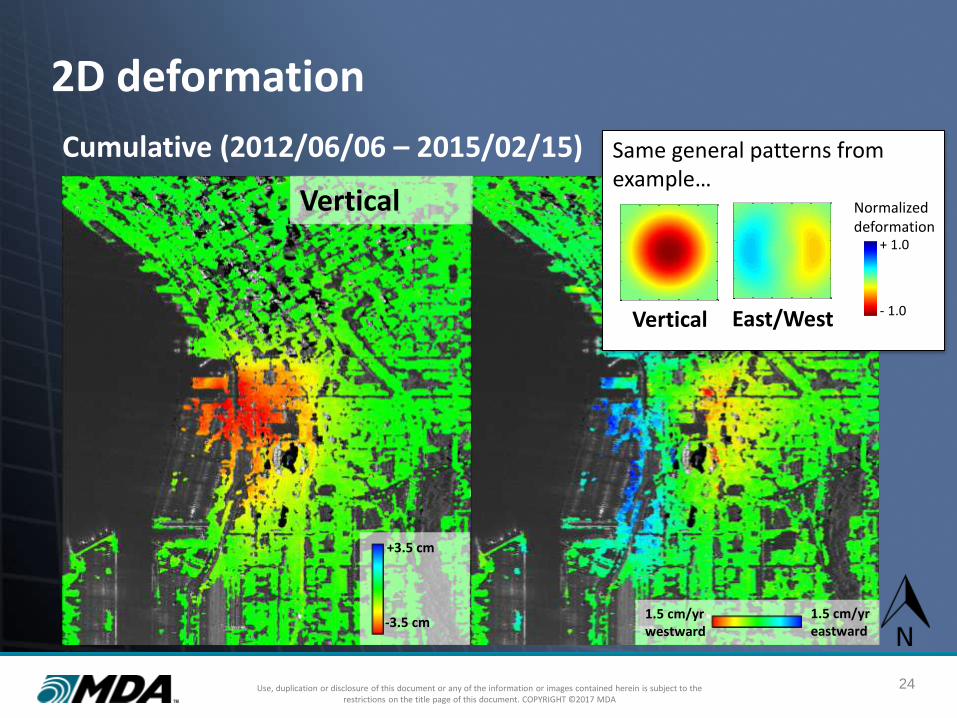
2D deformation
Cumulative (2012/06/06 – 2015/02/15)
East/West Vertical
+3.5 cm
-3.5 cm
24
+ 1.0
- 1.0 Vertical East/West
Normalized deformation
Same general patterns from example…
West Estimate
E-W Axis
N-S
Axis
100 200 300 400 500
100
200
300
400
500
North Estimate
E-W Axis
N-S
Axis
100 200 300 400 500
100
200
300
400
500
Up Estimate
E-W Axis
N-S
Axis
100 200 300 400 500
100
200
300
400
500
West Estimate
E-W Axis
N-S
Axis
100 200 300 400 500
100
200
300
400
500
North Estimate
E-W Axis
N-S
Axis
100 200 300 400 500
100
200
300
400
500
Up Estimate
E-W Axis
N-S
Axis
100 200 300 400 500
100
200
300
400
500
1.5 cm/yr eastward
1.5 cm/yr westward

Use, duplication or disclosure of this document or any of the information or images contained herein is subject to the restrictions on the title page of this document. COPYRIGHT ©2017 MDA
Pre-dewatering linear deformation
(2012/06/06 – 2014/09/24)
East/West Vertical
+0.5 cm/yr
-0.5 cm/yr 0.5 cm/yr eastward
0.5 cm/yr westward
25
Significant areas of long term (since June 2012) subsidence in area corresponding with infill of historic waterfront.

Use, duplication or disclosure of this document or any of the information or images contained herein is subject to the restrictions on the title page of this document. COPYRIGHT ©2017 MDA
Pre-dewatering linear deformation
(2012/06/06 – 2014/09/24)
East/West Vertical
+0.5 cm/yr
-0.5 cm/yr 0.5 cm/yr eastward
0.5 cm/yr westward
26
Westward deforming building shows external signs of damage and reinforcement.

Use, duplication or disclosure of this document or any of the information or images contained herein is subject to the restrictions on the title page of this document. COPYRIGHT ©2017 MDA
Dewatering correlated deformation
2012/06/06 – 2014/11/01 : no deformation 2014/11/01 – 2015/02/15 : linear deformation
East/West Vertical
+15 cm/yr
-15 cm/yr 5 cm/yr eastward
5 cm/yr westward
27
Dewatering correlated deformation is spatially consistent with localized dewatering induced deformation (both in vertical and east/west directions). Pattern centered ~200 m south-east of rescue shaft.

Use, duplication or disclosure of this document or any of the information or images contained herein is subject to the restrictions on the title page of this document. COPYRIGHT ©2017 MDA
Case Study: High Speed Railway Line Subsidence
28

Use, duplication or disclosure of this document or any of the information or images contained herein is subject to the restrictions on the title page of this document. COPYRIGHT ©2017 MDA
Example: JingJin High Speed Rail (HSR) China
Water pumping Subsidence Zone
29

Use, duplication or disclosure of this document or any of the information or images contained herein is subject to the restrictions on the title page of this document. COPYRIGHT ©2017 MDA
Using RADARSAT-2 High Resolution Images Allows Detection of Stable Reflections from Rail Posts
30

Use, duplication or disclosure of this document or any of the information or images contained herein is subject to the restrictions on the title page of this document. COPYRIGHT ©2017 MDA
Stable Reflections from the Rail Posts as Visible in the SAR Imagery
Green: stable
reflection in 5
scenes, usable
for InSAR (CTM)
31

Use, duplication or disclosure of this document or any of the information or images contained herein is subject to the restrictions on the title page of this document. COPYRIGHT ©2017 MDA
Yizhuang Railway Station (at 21.3 km) Significant Deformation Signal (~5 cm)
-0.1
-0.09
-0.08
-0.07
-0.06
-0.05
-0.04
-0.03
-0.02
-0.01
0
20000 20500 21000 21500 22000 22500 23000
Distance starting at Beijing S. Station (m)
Defo
rmati
on
(m
)RADARSAT-2 Data and Products ©MacDonald Dettwiler and Associates Ltd 2012 – All Rights Reserved. RADARSAT is an official mark of the Canadian Space Agency
32

Use, duplication or disclosure of this document or any of the information or images contained herein is subject to the restrictions on the title page of this document. COPYRIGHT ©2017 MDA
33
Subsidence Profile Along HSR Maximum rates of approximately 10 cm per
year
-0.16
-0.14
-0.12
-0.1
-0.08
-0.06
-0.04
-0.02
0
0.02
0.04
0 5000 10000 15000 20000 25000 30000
Distance starting at Beijing S. Station (m)
Defo
rmati
on
(m
)
A
RADARSAT-2 Data and Products ©MacDonald Dettwiler and Associates Ltd 2012 – All Rights Reserved. RADARSAT is an official mark of the Canadian Space Agency

Use, duplication or disclosure of this document or any of the information or images contained herein is subject to the restrictions on the title page of this document. COPYRIGHT ©2017 MDA
Conclusion
34

Use, duplication or disclosure of this document or any of the information or images contained herein is subject to the restrictions on the title page of this document. COPYRIGHT ©2017 MDA
Benefits of INSAR-based Monitoring
• Inteferometry is a proven technique which can measure mm of surface movement
• Surface movement measurements from InSAR can be readily integrated with other measurement program used such as GPS, or in-situ survey etc.
• Satellites provide wide area routine monitoring
• Regular monitoring can be used as an alert for growing subsidence problems, and targeting engineering / maitanence resources

Use, duplication or disclosure of this document or any of the information or images contained herein is subject to the restrictions on the title page of this document. COPYRIGHT ©2017 MDA
Organizations Benefiting from the Information
• Highway / Railway companies monitoring infrastructure assets
• State / Municipality governments monitoring its areas of responsibility

Use, duplication or disclosure of this document or any of the information or images contained herein is subject to the restrictions on the title page of this document. COPYRIGHT ©2017 MDA
Thank You
• Vivienne Wu, MDA Geospatial Services Inc., [email protected]; +1 (604) 231 2607
• Srinibas Patnaik, DigitalGlobe India, [email protected], +91 99161 39761
• N.S. Shankaranarayana, DigitalGlobe India, shankans@digitalglobe, +91 98455 45661
37

Use, duplication or disclosure of this document or any of the information or images contained herein is subject to the restrictions on the title page of this document. COPYRIGHT ©2017 MDA
Image Credits and Disclaimer Language
RESTRICTION ON USE, PUBLICATION OR DISCLOSURE OF PROPRIETARY INFORMATION AND IMAGES This document contains information and images that are proprietary to MacDonald, Dettwiler and Associates Ltd. (“MDA”), to its subsidiaries, and/or to third parties to which MDA may have legal obligations to protect such information or images from unauthorized disclosure, use or duplication. Any disclosure, use or duplication of this document or of any of the information or images contained herein is expressly prohibited. The statements contained herein are based on good faith assumptions and provided for general information purposes only. These statements do not constitute an offer, promise, warranty or guarantee of performance. The products depicted are subject to change, and are not necessarily production representative. Actual results may vary depending on certain events or conditions. This document should not be used or relied upon for any purpose other than that intended by MDA. COPYRIGHT © 2017 MacDonald, Dettwiler and Associates Ltd., subject to General Acknowledgements for the third parties whose images have been used in permissible forms. All rights reserved. GENERAL ACKNOWLEDGEMENTS Certain images contained in this document are property of third parties.
38