insar monitoring guidelines: using simple to use decision
TRANSCRIPT

InSAR monitoring guidelines: using simple to use decision
trees – an owner’s perspective
M Desjardins De Beers, Canada
PJH de Graaf De Beers Group, Anglo American, Australia
Abstract
Interferometric synthetic aperture radar (InSAR) application has recently benefited from an increased number
of service providers (with more diverse satellite constellations), advances in algorithm processing methods
and, with reductions in costs, is becoming a widely accepted method of surface deformation monitoring in
the mining industry. InSAR monitoring is consequently being applied to a wide array of mine infrastructure
and geotechnical risk management scenarios ranging from construction to operating and closed mines,
including natural slopes traversed by mine access roads, rail and pipelines, to engineered open pits, waste
dumps and tailings dams, as well as identification of subsidence and onset of potential collapse due to either
active or legacy underground mining and/or karstic terrain sinkhole development. With this increased interest
from a growing array of diverse technical disciplines, it has been shown that InSAR monitoring is complex and
there are many variables to consider and levels of monitoring possible. Furthermore, making sense of vendors’
claims on system deliverables versus demonstrated outcomes can be challenging. These aspects need to be
considered and aligned with the anticipated mode of instability, size, magnitude and rate of movement, and
the business risk. Using a premium InSAR product (as high resolution data with two look directions and high
frequency reports) when budget is not a limiting factor or using a budget constrained product (such as low
resolution freely available Sentinel data), unless appropriately matched to the business risk profile (and
deformation characteristics), will likely lead to underwhelming and possibly misleading results.
This paper describes how decision trees were developed to assist in selecting the level of InSAR monitoring
considering the asset infrastructure risk and the physical characteristics of the area of interest. The decision
trees were built such that the user, without extensive technical knowledge of how InSAR functions, can make
an independent evaluation of what InSAR product is adequate. A simple cost versus risk trade-off tool is
discussed, outlining how the decision trees were developed to determine whether InSAR would be a viable
solution at the site and what the appropriate resolution, acquisition frequency, report frequency, and orbit/s
should be. This provides a consistent framework for firstly evaluating and matching monitoring rigour with
geotechnical risk, secondly a process to facilitate alignment and ideally optimisation of monitoring outcomes
between disciplines, and finally for communicating these to management to demonstrate an effective
business case for monitoring.
Keywords: InSAR, slope stability, tailings dams, displacement monitoring, risk management, decision tree
1 Introduction
Interferometric synthetic aperture radar (InSAR) application has recently benefited from an increased
number of service providers (with more diverse satellite constellations), advances in algorithm processing
methods and with reductions in costs is becoming a widely accepted method of surface deformation
monitoring in the mining industry. InSAR monitoring is consequently being applied to a wide array of mine
infrastructure and geotechnical risk management scenarios ranging from construction to operating and
closed mines, including natural slopes traversed by mine access roads, rail and pipelines, to engineered open
pits, waste dumps and tailings dams, as well as identification of subsidence and onset of potential collapse
due to either active or legacy underground mining and/or karstic terrain sinkhole development. With this
increased interest from a growing array of diverse technical disciplines, it has been shown that InSAR
SSIM 2021 - PM Dight (ed.)© Australian Centre for Geomechanics, Perth, ISBN 978-0-6450938-1-0
SSIM 2021 185
doi:10.36487/ACG_repo/2135_10
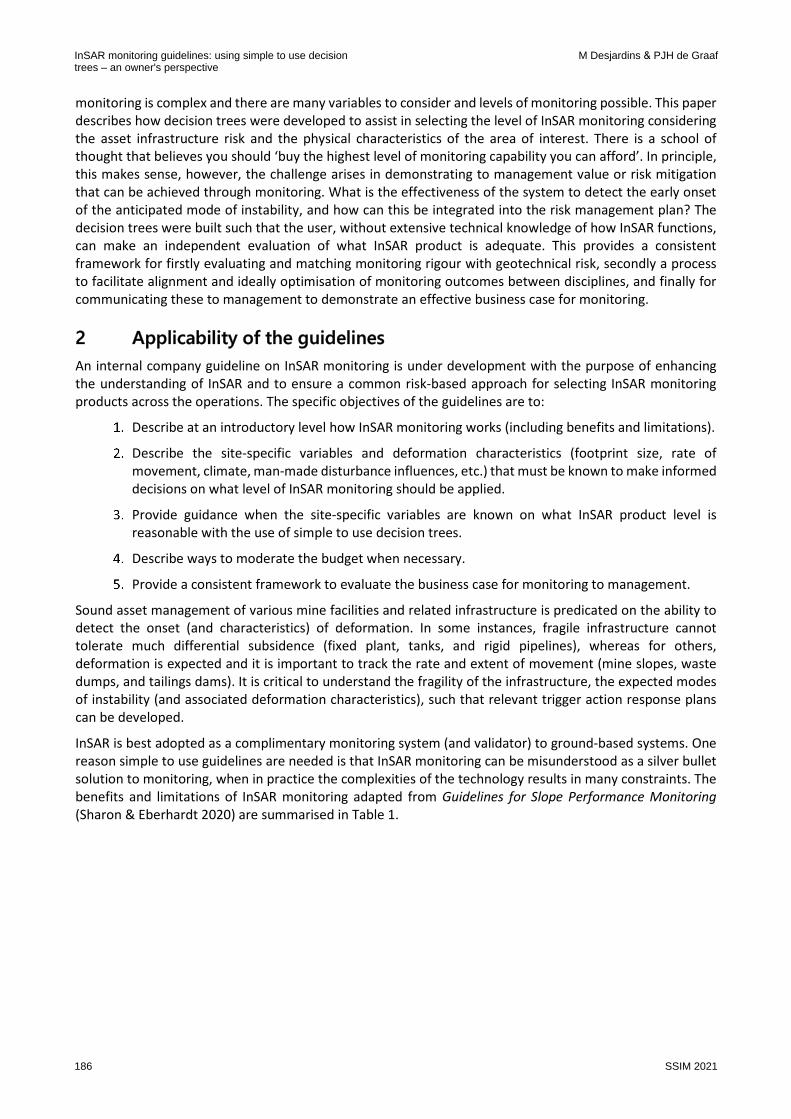
monitoring is complex and there are many variables to consider and levels of monitoring possible. This paper
describes how decision trees were developed to assist in selecting the level of InSAR monitoring considering
the asset infrastructure risk and the physical characteristics of the area of interest. There is a school of
thought that believes you should ‘buy the highest level of monitoring capability you can afford’. In principle,
this makes sense, however, the challenge arises in demonstrating to management value or risk mitigation
that can be achieved through monitoring. What is the effectiveness of the system to detect the early onset
of the anticipated mode of instability, and how can this be integrated into the risk management plan? The
decision trees were built such that the user, without extensive technical knowledge of how InSAR functions,
can make an independent evaluation of what InSAR product is adequate. This provides a consistent
framework for firstly evaluating and matching monitoring rigour with geotechnical risk, secondly a process
to facilitate alignment and ideally optimisation of monitoring outcomes between disciplines, and finally for
communicating these to management to demonstrate an effective business case for monitoring.
2 Applicability of the guidelines
An internal company guideline on InSAR monitoring is under development with the purpose of enhancing
the understanding of InSAR and to ensure a common risk-based approach for selecting InSAR monitoring
products across the operations. The specific objectives of the guidelines are to:
Describe at an introductory level how InSAR monitoring works (including benefits and limitations).
Describe the site-specific variables and deformation characteristics (footprint size, rate of
movement, climate, man-made disturbance influences, etc.) that must be known to make informed
decisions on what level of InSAR monitoring should be applied.
Provide guidance when the site-specific variables are known on what InSAR product level is
reasonable with the use of simple to use decision trees.
Describe ways to moderate the budget when necessary.
Provide a consistent framework to evaluate the business case for monitoring to management.
Sound asset management of various mine facilities and related infrastructure is predicated on the ability to
detect the onset (and characteristics) of deformation. In some instances, fragile infrastructure cannot
tolerate much differential subsidence (fixed plant, tanks, and rigid pipelines), whereas for others,
deformation is expected and it is important to track the rate and extent of movement (mine slopes, waste
dumps, and tailings dams). It is critical to understand the fragility of the infrastructure, the expected modes
of instability (and associated deformation characteristics), such that relevant trigger action response plans
can be developed.
InSAR is best adopted as a complimentary monitoring system (and validator) to ground-based systems. One
reason simple to use guidelines are needed is that InSAR monitoring can be misunderstood as a silver bullet
solution to monitoring, when in practice the complexities of the technology results in many constraints. The
benefits and limitations of InSAR monitoring adapted from Guidelines for Slope Performance Monitoring
(Sharon & Eberhardt 2020) are summarised in Table 1.
InSAR monitoring guidelines: using simple to use decisiontrees – an owner's perspective
M Desjardins & PJH de Graaf
186 SSIM 2021

Table 1 Pros and cons of InSAR monitoring at mine sites
Pros Cons
Safe, uninterrupted, continuous surveillance Not real-time
Site-wide displacement monitoring Not suitable for measuring volumetric changes
Low annual cost per measurement point Not recommended as a replacement for
ground-based instrumentation and inspections
Sub-centimetre precision is often achievable Limited for detecting horizontal displacement in
the north–south direction
Safety of life applications Blind spots can occur due to terrain and slope
orientation (e.g. geometric distortion)
Integration into existing geotechnical monitoring
systems
Limited in vegetated areas, unless lower-precision/
longer-wavelength data are used (i.e. coherence)
Economical monitoring of closed sites Limited on terrain with lingering ice and/or snow
(i.e. coherence)
A decision-making tool for locating ground-based
instrumentation
Varying sensitivity to displacement, depending on
terrain
Rapid displacement can go undetected if
movement exceeds range thresholds (i.e. phase
ambiguity)
External surface influences (human and other) can
obscure true surface deformations
The Norwegian Geotechnical Institute (NGI) (Norwegian Geotechnical Institute 2011) provides some useful
guidance on selection of remote-sensing methods with details of their accuracy, data availability, costs, and
technological limitations. As indicated in Figure 1, satellite InSAR monitoring is identified as a suitable
monitoring method for slow ground movements which may help with early identification of failures at the
mine site. At higher ground velocities, problems related to the period between scans and ambiguity of the
signal wavelength are a limiting factor. It is noted that the industry is changing rapidly with innovative data
processing techniques and with the increasing constellations being launched (some with daily revisit times).
It is feasible in some cases to track faster ground displacement rates than what is indicated by NGI. Because
of the satellite revisit time typically in the range of days to weeks, the objective of InSAR monitoring should
not be for front-line safety where fast-moving instabilities need to be managed in near real-time.
Slope monitoring and its interpretation
SSIM 2021 187

Figure 1 Suitable ground velocities for InSAR monitoring as per Norwegian Geotechnical Institute (2011)
Predicting the time of failure of slope instabilities and tactical monitoring of surface deformations has
become common practice in the mining industry thanks to technologies such as ground-based slope stability
radars and robotic total stations. InSAR has now joined the portfolio of monitoring solutions thanks to its
capabilities of extending the monitoring scale to the entire mine site facilitating strategic monitoring (Morgan
et al. 2020).
Due to the aforementioned limitations, InSAR should be complemented with other terrestrial and/or
subsurface monitoring solutions as applicable. Examples of mine-related infrastructure amenable for aerial
surface deformation monitoring are listed in Table 2.
InSAR monitoring guidelines: using simple to use decisiontrees – an owner's perspective
M Desjardins & PJH de Graaf
188 SSIM 2021

Table 2 Mine related infrastructure that can be monitored with InSAR
Mine infrastructure (active and closed facilities) Natural hazards
Pit slopes (and interfaces with natural slopes) Natural slopes above or below mine
infrastructure
Waste dumps and stockpiles Karstic terrain with sinkhole development
(often exacerbated by mine dewatering/
reinjection programs) Tailings dams
Mine infrastructure (e.g. fixed plant or processing plants
near pit crests)
Access routes (road, rail, and pipelines)
Undermined land planned versus unexpected subsidence
(crown pillars, planned cave breakthrough etc.)
Groundwater abstraction subsidence (mine dewatering)
3 Decision trees: a tool for selecting the correct InSAR product
Decision trees were developed to guide the interested operation to a suitable InSAR product considering the
asset infrastructure risk and the physical characteristics of the area of interest (AOI). The decision trees were
built such that the user, without extensive technical knowledge of how InSAR functions, can make an
independent evaluation of what InSAR products are adequate. To use the guideline decision trees, some
basic information is required for each of the assets to be monitored onsite with the highest risk structure
dictating the minimum requirement. An understanding of the following site-based information is required to
navigate the decision trees:
• Detailed understanding of mode/s of instability:
○ Expected area of ground movement.
○ Rate of expected ground movement.
○ Whether horizontal movement is expected.
• Overall slope angles if the AOI is an open pit or dump and the aspect (direction) with respect to the
satellite orbit.
• Structure or asset risk rating value from 1–5 (such as from a 5 × 5 risk matrix).
• Whether or not there is an extended period during the year with snow or ice cover.
• Degree of vegetation cover on the AOI/s.
• Frequency and extent of extraneous ground disturbance (e.g. grading or reshaping of slopes, etc.).
3.1 InSAR applicability
As discussed, InSAR monitoring can greatly enhance monitoring capabilities and improve asset management,
however, there are several limitations that must be considered. The following site-specific variables are used
to direct whether InSAR should be considered as a viable monitoring solution at the operation:
• Size and shape of expected movement area (m²).
• Rate of expected movement (m/year).
• Vegetation cover on the AOI or regular surface disturbance (regrading, dragging pipelines,
construction works, or blowing sand/erosion).
Slope monitoring and its interpretation
SSIM 2021 189

Figure 2 shows the decision tree for determining InSAR applicability for an asset.
Figure 2 InSAR applicability
3.2 Resolution
Resolution is defined as the size of the area over which the satellite gathers one measurement value. A higher
resolution results in an increase in the number of measurement points. Lower resolution does not mean
poorer accuracy as both low and high resolution InSAR can achieve sub-centimetre vertical accuracy. The
difference is the number of data points captured per unit area. It is important to understand the relative size
of data point with respect to the mode of instability. “Higher spatial resolution offers the opportunity to
distinguish comparatively smaller areas of significant movement” (Morgan et al. 2020). It should also be
noted that satellite coverage is not equal across the globe and in certain locations either low or high
resolution synthetic aperture radar (SAR) might not be available or may not be available from both look
directions.
The Sentinel-1 satellite sensor resolution is 20 × 5 m (rectangular cells) and is considered the lowest practical
resolution to use at a mining project. The data collected is publicly available and it is therefore categorised
as ‘standard’ or ‘low’ resolution in the InSAR industry. Any pixel size of approximately 3 × 3 m or better (such
as TerraSAR-X) is considered ‘high resolution’. There are options for better resolutions described here as ‘very
high resolution’ with approximately 1 × 1 m pixels using ‘spotlight mode’. Although there are even finer
resolutions available that are typically used for civil applications, they are not discussed in these guidelines
because they are typically not practical in the mining industry. This is because, as resolution increases, the
area coverage decreases (see dataframe in Table 3) and the cost to cover the entire mine site becomes
prohibitive.
InSAR monitoring guidelines: using simple to use decisiontrees – an owner's perspective
M Desjardins & PJH de Graaf
190 SSIM 2021
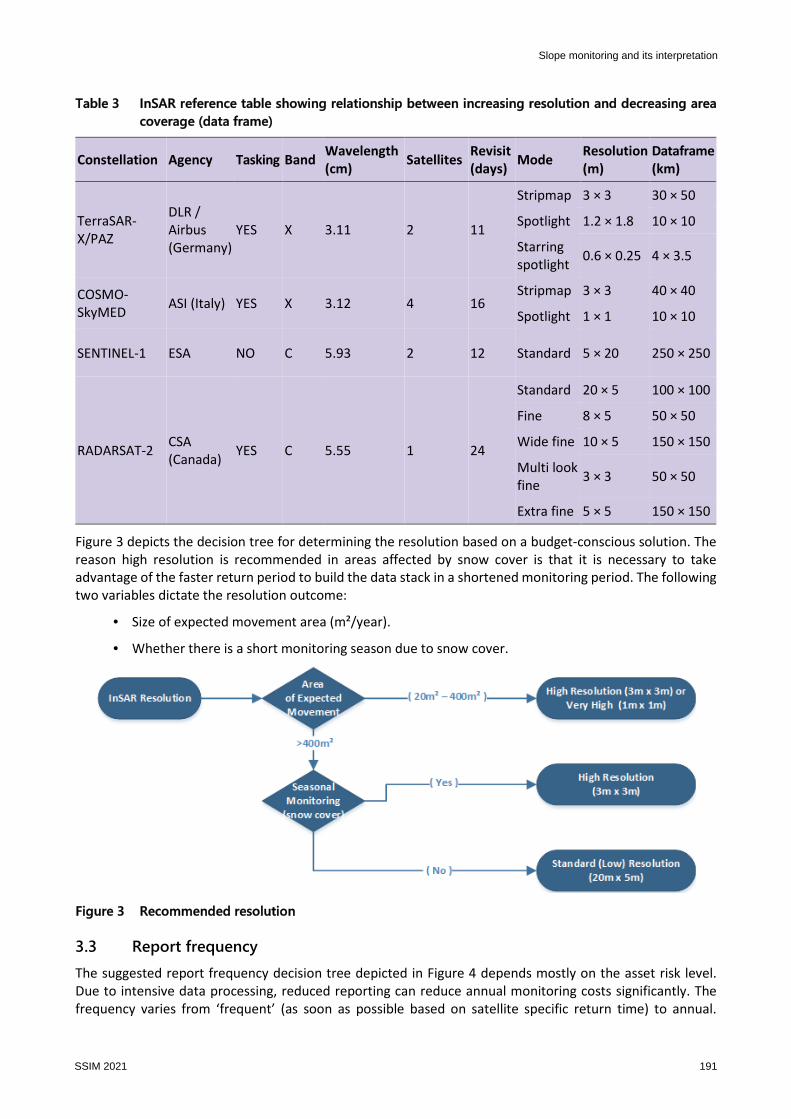
Table 3 InSAR reference table showing relationship between increasing resolution and decreasing area
coverage (data frame)
Constellation Agency Tasking Band Wavelength
(cm) Satellites
Revisit
(days) Mode
Resolution
(m)
Dataframe
(km)
TerraSAR-
X/PAZ
DLR /
Airbus
(Germany)
YES X 3.11 2 11
Stripmap 3 × 3 30 × 50
Spotlight 1.2 × 1.8 10 × 10
Starring
spotlight 0.6 × 0.25 4 × 3.5
COSMO-
SkyMED ASI (Italy) YES X 3.12 4 16
Stripmap 3 × 3 40 × 40
Spotlight 1 × 1 10 × 10
SENTINEL-1 ESA NO C 5.93 2 12 Standard 5 × 20 250 × 250
RADARSAT-2 CSA
(Canada) YES C 5.55 1 24
Standard 20 × 5 100 × 100
Fine 8 × 5 50 × 50
Wide fine 10 × 5 150 × 150
Multi look
fine 3 × 3 50 × 50
Extra fine 5 × 5 150 × 150
Figure 3 depicts the decision tree for determining the resolution based on a budget-conscious solution. The
reason high resolution is recommended in areas affected by snow cover is that it is necessary to take
advantage of the faster return period to build the data stack in a shortened monitoring period. The following
two variables dictate the resolution outcome:
• Size of expected movement area (m²/year).
• Whether there is a short monitoring season due to snow cover.
Figure 3 Recommended resolution
3.3 Report frequency
The suggested report frequency decision tree depicted in Figure 4 depends mostly on the asset risk level.
Due to intensive data processing, reduced reporting can reduce annual monitoring costs significantly. The
frequency varies from ‘frequent’ (as soon as possible based on satellite specific return time) to annual.
Slope monitoring and its interpretation
SSIM 2021 191

Seasonally affected sites are considered and the report frequency increased to benefit from the information
during the shortened monitoring (and maintenance/inspection) window.
The following variables are used to determine the recommended report frequency:
• Whether there is a short monitoring season due to snow cover.
• The risk rating of the asset/s being monitored (1–5).
Figure 4 Report frequency
3.4 Orbit selection
SAR satellites travel in a near-polar orbit at an altitude ranging from 500–800 km above the Earth’s surface,
depending on the satellite platform (Ferretti et al. 2007). When satellites travel from north to south, it is
referred to as the descending orbit. On its return, when the satellite travels from south toward the north, it
is referred to as the ascending orbit (Figure 5).
InSAR monitoring guidelines: using simple to use decisiontrees – an owner's perspective
M Desjardins & PJH de Graaf
192 SSIM 2021
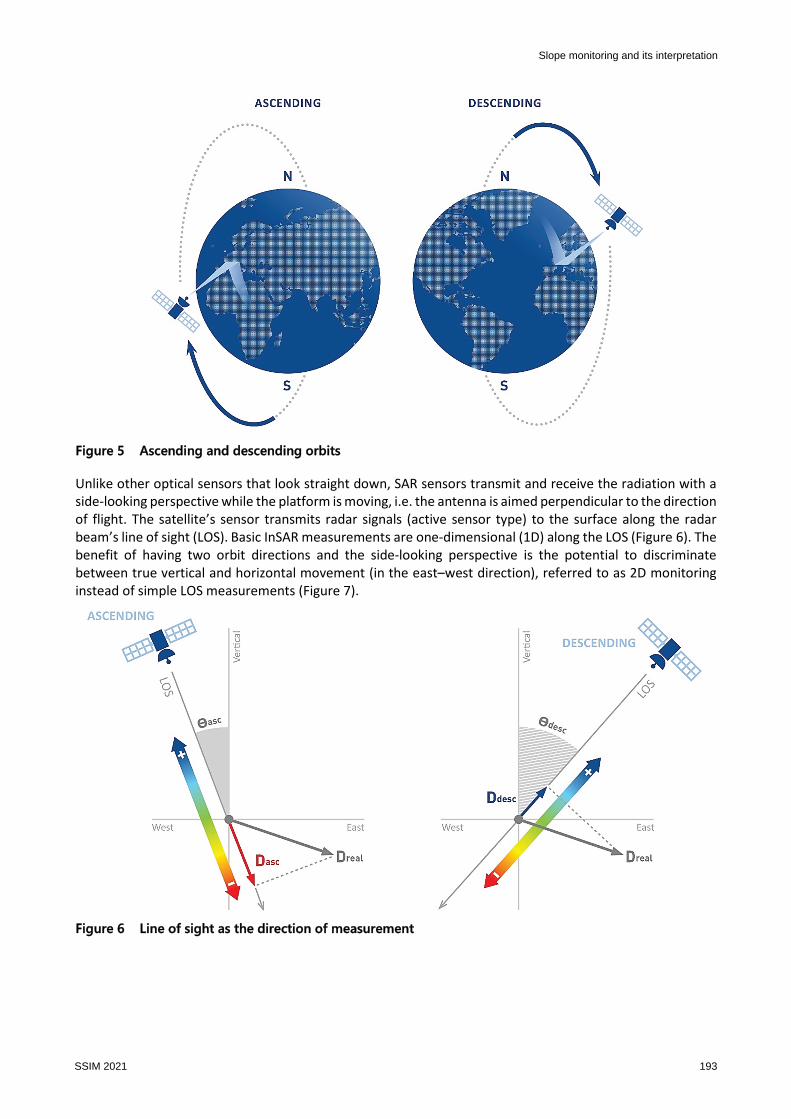
Figure 5 Ascending and descending orbits
Unlike other optical sensors that look straight down, SAR sensors transmit and receive the radiation with a
side-looking perspective while the platform is moving, i.e. the antenna is aimed perpendicular to the direction
of flight. The satellite’s sensor transmits radar signals (active sensor type) to the surface along the radar
beam’s line of sight (LOS). Basic InSAR measurements are one-dimensional (1D) along the LOS (Figure 6). The
benefit of having two orbit directions and the side-looking perspective is the potential to discriminate
between true vertical and horizontal movement (in the east–west direction), referred to as 2D monitoring
instead of simple LOS measurements (Figure 7).
Figure 6 Line of sight as the direction of measurement
Slope monitoring and its interpretation
SSIM 2021 193

Figure 7 Vertical and horizontal displacement vectors with two InSAR look directions (2D)
“Given that SAR satellites look at the ground at an angle, and considering the slope
geometry at a site, some areas may not be visible to the satellite’s LOS. In areas with strong
topography such as an open pit the use of a single orbit (ascending or descending) may
miss steep portions on one side of the pit or a tailings dam.” (Morgan et al. 2020)
Viewing the area from two orbits allows more information to be captured within the pit. Due to the
north–south travel path and the side-looking sensors, it is not possible to determine movement in the
north–south horizontal direction using the 2D approach as this direction corresponds to the approximate
direction the satellites are orbiting in (Morgan et al. 2019). In most cases, displacement contains both vertical
and horizontal motion components but if the critical slopes have north–south aspects, the horizontal
component limitation needs to be understood.
2D InSAR monitoring allows vector displacement information at an added cost due to doubling of the images
being acquired and extra processing requirement. This is more of an impact with commercial tasking (high
resolution) satellites than with Sentinel-1. The decision tree (Figure 8) developed to determine if 2D InSAR is
required or necessary considers the following:
• Overall slope angles of AOI (degrees).
• Expected horizontal versus vertical displacement (high/low).
In some cases where it is determined that high resolution is needed in 1D, it is possible to combine this with
standard resolution Sentinel-1 and is a way of obtaining a 2D product economically.
InSAR monitoring guidelines: using simple to use decisiontrees – an owner's perspective
M Desjardins & PJH de Graaf
194 SSIM 2021

Figure 8 Orbit selection
4 Case studies
To benchmark and test the decision trees, six operations with existing InSAR monitoring programs were used
to validate the outcomes. Figure 9 summarises the key inputs and outcomes of the InSAR decision tree
process for these operations. These operations included active and closed mines, ranging from sub-arctic
conditions with extensive snow coverage to semi-arid terrain and an extensive array of infrastructure and
modes of instability. Not surprisingly, the outcomes were generally in alignment with the current monitoring
activities, since each operation would have already had to match the monitoring resolution, reporting
frequency and orbit selection to the mode of instability and the business risk. This validated that there were
no outliers in the monitoring approach and provides assurance that there is consistency between the mines
and various business units.
An additional benefit in compiling these data and integrating the monitoring requirements from the separate
technical disciplines is that it makes the justification for mine-wide InSAR monitoring relatively easy. This is
especially important in breaking down the silos between technical disciplines, often with divergent reporting
frameworks and separate budgets.
Consolidating the procurement and administration of mine-wide InSAR services and reporting has several
business benefits. However, it is imperative that efficient mechanisms are in place to ensure that reports and
displacement alerts are communicated in a timely manner to the responsible individuals to appropriately
investigate, act, and effectively manage the geotechnical risk.
By evaluating the deformation monitoring requirements for the different geographical areas and assets
across the mine site in a systematic approach, this allows the primary monitoring requirements to be easily
identified.
Clearly, the monitoring requirements will be dictated by the combination of the most stringent deformation
conditions and the highest asset risk obligations. For example, if monitoring the open pit slopes is the highest
risk facility, and/or requires the highest frequency of data analysis and reporting, then it makes sense that this
will dictate the monitoring rigour for the mine site. While it is possible to analyse different areas to different
reporting frequencies, it doesn’t make much practical sense. Rather, the whole scene is analysed every cycle
but that area/facility specific deformation trigger action response plan criteria is applied to the outcomes. This
provides a consistent site-wide surface deformation output, at negligible additional cost.
Slope monitoring and its interpretation
SSIM 2021 195

Fig
ure
9
Case
his
tori
es
sum
mary
Min
e S
ite
Stru
ctu
re N
am
e /
De
scri
pti
on
Exp
ect
ed
Mo
vem
en
t A
rea
Ra
te o
f E
xpe
cte
d
Mo
vem
en
tR
isk
leve
lSl
op
e A
ngl
es
Cri
tica
l
Slo
pe
Asp
ect
s (N
S
vs E
W)
Sea
son
alit
y
(Sn
ow
Co
ver)
Exp
ect
ed
Late
ral
vs.
Ve
rtic
al
Mo
vem
en
t
Ve
geta
tio
n
of
AO
I
Ou
tpu
t
Re
solu
tio
n
Ou
tpu
t R
ep
ort
Fre
qu
en
cy
Ou
tpu
t
Orb
it
Sele
ctio
n
De
cisi
on
Tre
e v
s.
Act
ua
l Co
mp
ari
son
Co
mm
en
ts
Fin
e R
esi
du
e D
ep
osi
tM
ed
ium
Sca
le
(20
m²-
20
0m
²)
Slo
w
(<1
.6m
/ye
ar)
3
(Mo
de
rate
)
All
< 4
0⁰
Ove
rall
Slo
pe
An
gle
Bo
thY
es
Low
Ari
d/S
pa
rse
Hig
h
(3m
x 3
m)
Mo
nth
ly1
D
Op
en
Pit
(Flo
od
ing)
Me
diu
m S
cale
(20
m²-
20
0m
²)
Slo
w
(<1
.6m
/ye
ar)
2
(Min
or)
All
< 4
0⁰
Ove
rall
Slo
pe
An
gle
Bo
thY
es
Low
Ari
d/S
pa
rse
Hig
h
(3m
x 3
m)
Mo
nth
ly1
D
Co
ars
e P
K D
um
pM
ed
ium
Sca
le
(20
m²-
20
0m
²)
Slo
w
(<1
.6m
/ye
ar)
1
(In
sign
ific
an
t)
All
< 4
0⁰
Ove
rall
Slo
pe
An
gle
Bo
thY
es
Low
Ari
d/S
pa
rse
Hig
h
(3m
x 3
m)
Mo
nth
ly1
D
Op
en
Pit
(Flo
od
ing)
Larg
e S
cale
(>4
00
m²
are
a)
Mo
de
rate
to
Fa
st
(>1
.6m
/ye
ar)
4
(Hig
h)
Som
e C
riti
cal
Slo
pe
s >
40
⁰B
oth
No
Hig
hA
rid
/Sp
ars
eSt
an
da
rd
(5m
x 2
0m
)M
on
thly
2D
Co
ars
e R
esi
du
e D
ep
osi
tM
ed
ium
Sca
le
(20
m²-
20
0m
²)
Slo
w
(<1
.6m
/ye
ar)
2
(Min
or)
All
< 4
0⁰
Ove
rall
Slo
pe
An
gle
Bo
thN
oLo
wN
on
eH
igh
(3m
x 3
m)
Bi-
An
nu
al
1D
Fin
e R
esi
du
e D
ep
osi
tM
ed
ium
Sca
le
(20
m²-
20
0m
²)
Slo
w
(<1
.6m
/ye
ar)
3
(Mo
de
rate
)
All
< 4
0⁰
Ove
rall
Slo
pe
An
gle
Bo
thN
oLo
wN
on
eH
igh
(3m
x 3
m)
Mo
nth
ly1
D
Sto
rmw
ate
r M
an
age
me
nt
Da
ms
Me
diu
m S
cale
(20
m²-
20
0m
²)
Slo
w
(<1
.6m
/ye
ar)
2
(Min
or)
All
< 4
0⁰
Ove
rall
Slo
pe
An
gle
Bo
thN
oLo
wN
on
eH
igh
(3m
x 3
m)
Bi-
An
nu
al
1D
Op
en
Pit
Larg
e S
cale
(>4
00
m²
are
a)
Slo
w
(<1
.6m
/ye
ar)
3
(Mo
de
rate
)
All
< 4
0⁰
Ove
rall
Slo
pe
An
gle
Bo
thN
oH
igh
No
ne
Sta
nd
ard
(5m
x 2
0m
)M
on
thly
2D
Wa
ste
Du
mp
sM
ed
ium
Sca
le
(20
m²-
20
0m
²)
Slo
w
(<1
.6m
/ye
ar)
2
(Min
or)
All
< 4
0⁰
Ove
rall
Slo
pe
An
gle
Bo
thN
oLo
wN
on
eH
igh
(3m
x 3
m)
Bi-
An
nu
al
1D
Pla
nt/
In
fra
stru
ctu
reM
ed
ium
Sca
le
(20
m²-
20
0m
²)
Slo
w
(<1
.6m
/ye
ar)
2
(Min
or)
All
< 4
0⁰
Ove
rall
Slo
pe
An
gle
Bo
thN
oLo
wN
on
eH
igh
(3m
x 3
m)
Bi-
An
nu
al
1D
Fin
e R
esi
du
e D
ep
osi
tM
ed
ium
Sca
le
(20
m²-
20
0m
²)
Slo
w
(<1
.6m
/ye
ar)
2
(Min
or)
All
< 4
0⁰
Ove
rall
Slo
pe
An
gle
Bo
thN
oLo
wN
on
eH
igh
(3m
x 3
m)
Bi-
An
nu
al
1D
Op
en
Pit
Larg
e S
cale
(>4
00
m²
are
a)
Slo
w
(<1
.6m
/ye
ar)
3
(Mo
de
rate
)
All
< 4
0⁰
Ove
rall
Slo
pe
An
gle
Bo
thN
oH
igh
No
ne
Mo
nth
ly2
D
Wa
ste
Du
mp
sM
ed
ium
Sca
le
(20
m²-
20
0m
²)
Slo
w
(<1
.6m
/ye
ar)
2
(Min
or)
All
< 4
0⁰
Ove
rall
Slo
pe
An
gle
Bo
thN
oLo
wN
on
eH
igh
(3m
x 3
m)
Bi-
An
nu
al
1D
Sin
kho
le/C
avi
ty R
isk
Ma
na
gem
en
t
Me
diu
m S
cale
(20
m²-
20
0m
²)
Mo
de
rate
to
Fa
st
(>1
.6m
/ye
ar)
2
(Min
or)
All
< 4
0⁰
Ove
rall
Slo
pe
An
gle
N/A
No
Low
Ari
d/S
pa
rse
Hig
h
(3m
x 3
m)
Bi-
An
nu
al
1D
Fin
e R
esi
du
e D
ep
osi
tM
ed
ium
Sca
le
(20
m²-
20
0m
²)
Slo
w
(<1
.6m
/ye
ar)
2
(Min
or)
All
< 4
0⁰
Ove
rall
Slo
pe
An
gle
Bo
thN
oLo
wN
on
eH
igh
(3m
x 3
m)
Bi-
An
nu
al
1D
Op
en
Pit
Larg
e S
cale
(>4
00
m²
are
a)
Slo
w
(<1
.6m
/ye
ar)
3
(Mo
de
rate
)
All
< 4
0⁰
Ove
rall
Slo
pe
An
gle
Bo
thN
oH
igh
No
ne
Mo
nth
ly2
D
Wa
ste
Du
mp
sM
ed
ium
Sca
le
(20
m²-
20
0m
²)
Slo
w
(<1
.6m
/ye
ar)
2
(Min
or)
All
< 4
0⁰
Ove
rall
Slo
pe
An
gle
Bo
thN
oLo
wN
on
eH
igh
(3m
x 3
m)
Bi-
An
nu
al
1D
Sin
kho
le/C
avi
ty R
isk
Ma
na
gem
en
t
Me
diu
m S
cale
(20
m²-
20
0m
²)
Mo
de
rate
to
Fa
st
(>1
.6m
/ye
ar)
3
(Mo
de
rate
)
All
< 4
0⁰
Ove
rall
Slo
pe
An
gle
N/A
No
Low
Ari
d/S
pa
rse
Hig
h
(3m
x 3
m)
Mo
nth
ly1
D
Fin
e R
esi
du
e D
ep
osi
tM
ed
ium
Sca
le
(20
m²-
20
0m
²)
Slo
w
(<1
.6m
/ye
ar)
2
(Min
or)
All
< 4
0⁰
Ove
rall
Slo
pe
An
gle
Bo
thN
oLo
wN
on
eH
igh
(3m
x 3
m)
Bi-
An
nu
al
1D
De
cisi
on
Tre
e O
utp
uts
De
cisi
on
Tre
e I
np
uts
Min
e a
nd
Ass
et
Min
e F
(Act
ive
)
Min
e E
(Act
ive
)
Min
e D
(Act
ive
)
Min
e C
(Act
ive
)
Min
e B
(Clo
sed
)
Min
e A
(Clo
sed
)
Cu
rre
nt
InSA
R M
on
ito
rin
g
Cu
rre
nt
InSA
R p
rod
uct
is
sam
e a
s th
e d
eci
sio
n t
ree
ou
tpu
t
Exc
ep
tio
n is
re
solu
tio
n.
Cu
rre
nt
InSA
R p
rod
uct
is
sam
e a
s th
e d
eci
sio
n t
ree
ou
tpu
t
Cu
rre
nt
InSA
R p
rod
uct
is
sam
e a
s th
e d
eci
sio
n t
ree
ou
tpu
t
Exc
ep
tio
n is
qu
art
erl
y
rep
ort
s in
ste
ad
of
mo
nth
ly
Exc
ep
tio
n is
qu
art
erl
y
rep
ort
s in
ste
ad
of
mo
nth
ly
Tri
alin
g 1
D h
igh
-re
s
+ 1
D S
en
tin
el =
2D
Pu
rpo
se o
f m
on
ito
rin
g is
to m
on
ioto
r th
e p
it w
ith
2D
InSAR monitoring guidelines: using simple to use decisiontrees – an owner's perspective
M Desjardins & PJH de Graaf
196 SSIM 2021

5 Conclusion
The array of remote surface movement monitoring options can be overwhelming. The approach outlined in
this paper provides a simple and consistent methodology to review the need and objectives for monitoring
and presents three key outcomes:
Evaluate the suitability of InSAR methods to various surface monitoring mining scenarios, and
matching monitoring rigour with geotechnical risk.
Provides a process to facilitate alignment and ideally optimisation of monitoring objectives and
outcomes between separate technical disciplines (that collectively benefit from remote
monitoring).
Communicating these requirements to management to demonstrate an effective business case for
monitoring.
Furthermore, this approach is especially important to breaking down the intra-discipline silos, sometimes
with divergent management reporting frameworks with separate budgets.
Consolidated evaluation of the mine site-wide deformation monitoring requirements (for the different
assets) in a consistent approach facilitates quick identification of the primary monitoring requirements. These
will be defined by the combination of the most stringent deformation conditions and the highest asset risk
management obligations.
To date, relatively few case studies have been used to validate the decision tree approach presented, with
none having critical slope angles greater than 40°. As InSAR use expands within the company at various
operations with different physical characteristics, the decision trees will be tested. Further validation of the
proposed approach is needed and the decision trees will likely evolve and be improved over time based on
case study findings and changes to InSAR technology.
Acknowledgement and disclaimer
The contributions of colleagues and consultants in developing the InSAR guidelines are acknowledged.
Furthermore, permission from De Beers and Anglo American management to publish this work is also
gratefully acknowledged. Insightful comments by Paolo Farina are also gratefully acknowledged in
significantly improving the document.
All opinions and conclusions drawn in this paper are those of the authors alone and it should not be assumed
that any views expressed herein are also necessarily those of De Beers or Anglo American.
References
Ferretti, A, Monti-guarnieri, A, Prati, C & Rocca, F 2007, InSAR Principles: Guidelines for SAR Interferometry Processing and
Interpretation, ESA Publications, Auckland.
Morgan, JL, Colombo, D & Meloni, F 2019, ‘InSAR tools for risk assessment over mine assets’, in J Wesseloo (ed.), MGR
2019: Proceedings of the First International Conference on Mining Geomechanical Risk, Australian Centre for Geomechanics,
Perth, pp. 159–170, https://doi.org/10.36487/ACG_rep/1905_06_Morgan
Morgan, J, Boudreau, A, Verdugo, MA, Meloni, F & Colombo, D 2020, ‘New satellite sensors for monitoring mining areas: a look at
the future’, in PM Dight (ed.), Slope Stability 2020: Proceedings of the 2020 International Symposium on Slope Stability in
Open Pit Mining and Civil Engineering, Australian Centre for Geomechanics, Perth, pp. 1521–1530,
https://doi.org/10.36487/ACG_repo/2025_105
Norwegian Geotechnical Institute 2011, SafeLand Project Deliverable ID D4.4, viewed 6 June 2021,
https://www.ngi.no/eng/Projects/SafeLand
Sharon, R & Eberhardt, E 2020, Guidelines for Slope Performance Monitoring, CSIRO Publishing, Collingwood.
Slope monitoring and its interpretation
SSIM 2021 197

InSAR monitoring guidelines: using simple to use decisiontrees – an owner's perspective
M Desjardins & PJH de Graaf
198 SSIM 2021