input-output efficiency evaluation of financial block
TRANSCRIPT

Input-Output Efficiency Evaluation of Financial Block Chain Concept Stocks: Based on Dea-Bcc and Malmquist Index Model
Chengzi Zhu1, Ming Yang1*,Yihui Wang2 1School of Economics and Management, Northeast Agriculture University, Harbin, 150030, China 2 School of Resources and Environment, Northeast Agriculture University, Harbin, 150030, China
*corresponding author
Keywords: Blockchain, Listed companies, Financial, Dea - bcc, Dea and malmquist
Abstract: This paper selects relevant data of financial listed companies in blockchain concept stocks from 2016 to 2019, uses DEA-BCC model and Malmquist index model to construct static analysis and dynamic analysis. The static analysis shows that, on the whole, from 2016 to 2019, the overall inputting and output efficiency of listed companies performs well, with technical efficiency above 0.7 on average, pure technical efficiency above 0.79 on average, and scale efficiency above 0.89 on average. However, there is still a certain distance from DEA effectiveness. From the perspective of time change, the technical efficiency of the 15 listed companies showed a trend of fluctuation with time change, but the overall fluctuation was not obvious. The difference between the maximum and minimum value of technical efficiency of Rendong Holding, the listed company with the largest fluctuation, was 0.456, while the difference between the maximum and minimum value of ICBC with the least fluctuation was 0.009. Dynamic analysis shows that from 2016 to 2019, the average value of Malmquist index is 0.935, representing a decline in total factor production efficiency, mainly because the average value of technology progress index is less than 1. The development of blockchain technology is slow, and the average value of technical efficiency change index is 1.010, mainly because of the rise of pure technical efficiency. Therefore, financial enterprises should increase the research and development of blockchain technology, promote the progress of blockchain technology, make the perfect integration of blockchain technology and financial business, reasonably adjust the size of the company and related investment, so as to improve their input-output efficiency.
1. Introduction Blockchain technology is a distributed database that is recorded and maintained by multiple
parties. Its technical characteristics lay a fast and convenient foundation for transactions, and it has a broad market application prospect. At present, major governments and enterprises around the world are actively carrying out the research and development and application of blockchain technology. From the perspective of application fields, they mainly focus on computer and finance, among which finance is the most core and the most important application field of blockchain. From the perspective of the United States, as the gathering place of the blockchain industry, the investment scale in the blockchain industry accounts for 30% of the world's total. PayPal, an American company, plans to provide cryptocurrency based on the blockchain technology in early 2021. In the world, 80% of the central banks said they would set up their digital currency projects to promote the coordinated development of blockchain and finance, and 10% of them planned to issue them within three years. From the perspective of China, the Central Bank established a digital currency research project combining blockchain and finance as early as 2014, and is testing the digital RMB wallet, which is expected to be put into use during the 2022 Winter Olympic Games. In 2020, the single financing amount of China's blockchain industry will significantly increase, with more than 86% of companies' financing amount reaching more than 10 million yuan.
The combination of blockchain and finance can effectively reduce the cost of enterprises and improve the efficiency of enterprises. Moreover, due to its characteristics such as imtamperability, it
2021 5th International Conference on Economics, Management Engineering and Education Technology (ICEMEET 2021)
Copyright © (2021) Francis Academic Press, UK DOI: 10.25236/icemeet.2021.040162

can effectively reduce the procedures of account reconciliation. At the same time, blockchain technology can also help financial institutions to realize cross-border payment and other functions.
However, it is still worth discussing whether financial companies have really improved their efficiency after applying blockchain technology, what impact blockchain has had on financial companies, and how financial companies should improve their input-output efficiency. In view of the above problems, this article selects 15 listed financial companies in China's chain block stocks as a representative, because in 2020 the company annual report has not yet been published, so this article selects has released annual report 2016-2019 as the research time, the use of DEA BCC model and Malmquist index model for empirical research, in order to discuss the financial company listed in the practical use of chain blocks after efficiency, and puts forward related Suggestions.
2. Literature Review The combination of blockchain and finance has now become a hot research topic. Many scholars
have carried out research on the combination of blockchain and finance. Li Zhang et al believe that block chain technology plays a significant role in identifying customer credit status and establishing a sound financial credit system [1]. Michael Casey et al. believe that blockchain technology can be applied in the fields of user identification, network security, settlement and clearing, thus effectively reducing costs [2]. Yanchen et al. believe that blockchain technology has brought about the rise of decentralized financial services, making financial services more transparent and innovative [3]. Raphael Auer believes that the application of distributed ledger technology in the financial field can reduce the need for enterprises to collect, verify and deliver data, and discusses the conditions under which distributed ledger data may be used for financial supervision [4]. Scott B think “2.0” block chain technology has more obvious ideal and communitarianism have create large-scale team [5]. Ye Guo think the bank payment and settlement and other technologies such as can be thoroughly change block chain, chain block application also facilitated the formation of 'multiple centers' scenario, which will improve the efficiency of banking [6].
As for the input-output efficiency of listed companies, there are also many scholars who have carried out related researches. Gongmeng Chen et al. believed that the Chinese government should choose to continue to reduce its equity in listed companies and transfer the control to private companies, so as to improve the overall profitability and efficiency of the company [7]. Li Chang Hsu et al. measured the relative efficiency of semiconductor companies by combining data envelopment analysis (DEA) and improved grey correlation analysis (IgRA), and finally evaluated the operation of these companies by using multi-criteria decision making, entropy weight method and other methods [8]. Chen Lin et al. believe that the production efficiency of an enterprise is negatively correlated with the proportion of shares held by the state, while positively correlated with the proportion of shares held by public and employees [9]. Taking registered capital, asset value, number of employees and operating cost as input indexes and income and profit as output indexes, Xian Zheng et al analyzed the performance and efficiency of listed real estate companies [10] .Mohamed M.Mostafa used Production Frontier Analysis (PFA) to measure the relative market efficiency of 62 listed companies in Egypt. Moreover, Tobit regression was used to test the dependence of efficiency on the specific operating environment of these companies [11] .Xiaolong Xue et al. used MPI to measure the productivity change of China's construction industry from 1997 to 2003, and found that there were gaps in the development level of construction industry productivity in different regions of China. [12] Ai-Hua Wu et al. used the Malmquist index model to investigate the energy use efficiency of 30 provinces in China, and believed that the efficiency of the eastern region was higher than that of the central and western regions [13]. Ji Shengbao et al. used the DEA-Tobit model based on SORM-BCC and Malmquist to analyze the efficiency and influencing factors of 44 major listed food and beverage companies in China from 2002 to 2009 [14]. Peiwu Dong et al. collected the data of all aerospace enterprises listed in the A-share market and obtained the results through data envelopment analysis (DEA) and Malmquist productivity index (MPI). They believed that in terms of operational efficiency, private enterprises were more efficient than state-owned enterprises [15]. Xu Ye et al. combined the data
163

envelopment analysis method with Malmquist productivity index to make a dynamic evaluation on the resource allocation efficiency of China's high-tech industries from 2002 to 2007. The results show that the technical efficiency index and technological progress index are the main factors [16]. Fenghe et al. used data from 50 companies in the Chinese steel industry to assess their energy efficiency and productivity changes, and the results showed that productivity growth was mainly attributable to technological change and scale efficiency growth [17]. Yongtan et al. used three efficiency indexes and four risk indicators to evaluate the relationship between bank efficiency, risk and capital in the sample of Chinese commercial banks, and the results showed that there was a positive correlation between risk and efficiency in Chinese banks. [18]
3. Model Description and Data Selection 3.1 Dea - Bcc Model
Data Envelopnent Analysis (DEA) is an efficiency evaluation method established by Charenes and Cooper based on “multiple input and multiple output” [19]. The basic idea of DEA is that each evaluated unit or department is regarded as a DMU, which is a kind of agreement to some extent. All decision making units constitute an evaluation group, and each decision making unit under the same group of DMU has the same input and output indexes. In index and unit group, the group evaluation to determine, using mathematical programming model for integrated analysis of the input and output data, it is concluded that the comprehensive efficiency of each DMU quantitative index, on the basis of each DMU grading line, determine the effective DMU (i.e., the highest relative efficiency), and points out the reason and degree of other DMU is not effective, provides scientific management information for decision-making department. At the same time, DEA can also judge whether the input scale of each DMU is appropriate and provide the gap data between non-DEA effective DMU and DEA effective DMU, which can be used as the correct direction and degree of input scale adjustment of each non-effective DMU, as well as the appropriate adjustment range of expansion or reduction [20].
Traditional DEA models are divided into BCC model and CCR model. Since the CCR model requires that every DMU in the model has the limitation of constant scale [21], the improved DEA variable return to scale BBC model based on this model is often applied more widely. The model
assumes that the input vector of a DMU in a production activity is ( )1 2, , mX x x x= … , and the
output vector is ( )1 2, , TrY y y y= … . Now set n DMUj (1≤j≤n), the input and output vectors
corresponding to DMU are respectively 1 1 , 0( )j j mX x x x…•= > and 1 1( ), 0Tj j rjY y y y…•= >
( j=1,2,…,n). The BCC model for evaluation of the j0 DMU is:
01
01
1
min
, 1,2...,
, 1, 2...,s.t.
1
, ,
n
j ij i ij
n
j rj r rj
n
jj
j i r
x S x i m
x S y r t
S S
θ
θ−
=
+
=
=
− +
λ + = =
λ − = =
λ = λ ≥ 0
∑
∑
∑
(1)
Where θ is the effective value of DMU, jλ is the decision variable, iS −
and iS +
is the slack
variable of input and output respectively, 0ix and 0ry are the input value and output value corresponding to DMUJ0 respectively.
164

For θ , if 1θ = , and =0, =0i rS S− +
, then DMUj0 is DEA effective, the DMU is optimal in terms of input and output, and its production activities are both technically effective and scale effective. If
1θ = , but at least one of the input or output loose ground variables is greater than zero, then DMUJ0 is considered to be weak DEA effective, and DMUJ0 is not technically effective and scale effective at the same time. If θ ≤ 0 , then, and DMUj0 is DEA invalid, its production activities are neither technically effective nor scale effective.
3.2 Malmquist Index Model Malmquist index proposed based on DEA model uses distance function to calculate the
efficiency of input and output, which can better describe the dynamic change of the efficiency of decision making unit [22]. This model usually assumes that input elements remain unchanged. From the perspective of output maximization, distance functions in different periods are used to represent efficiency in different periods, and each decision unit is compared with the optimal front plane to
establish a dynamic model of productivity [23]. Let ( )t tx y, and 1 1( )t tx y+ +, represent the
input-output vectors of t period and t+1 period respectively. The change of input-output relationship
from ( )t tx y, to 1 1( )t tx y+ +, is the change of productivity. On the one hand, the change of
productivity is caused by the change of technical level, and on the other hand, it comes from the
change of technical efficiency. ( )t t tD x y, and 1 1 1( )t t tD x y+ + +, are distance functions.
( )t t tD x y, represents the technical efficiency level of the current period with the technology of the
period t (that is, the data of the period t is taken as the reference set); 1 1( )t t tD x y+ +, represents the
technical efficiency level of period t+1 with the technology of period t; 1( )t t tD x y+ , represents the
technical efficiency level of the period t+1 (that is, the data of the period t+1 is taken as the
reference set); 1 1 1( )t t tD x y+ + +, represents the technical efficiency level of the period t+1 with the
technology of the period t+1. The Malmquist indexes based on t and t +1 phase reference techniques are as follows:
1 11 1 ( , )( , , , ) (2)
( , )
t t tt t t t
t t t t
D x yM x y x yD x y
+ ++ + =
1 1 11 1
1 1
( , )( , , , ) (3)( , )
t t tt t t t
t t t t
D x yM x y x yD x y
+ + ++ +
+ +=
The geometric mean of these two indexes is defined as the Malmquist index [24] that measures efficiency changes in two adjacent periods, namely:
11 1 1 1 1 2
1 11
( , ) ( , )( , , , ) (4)( , ) ( , )
t t t t t tt t t t
t t t t t t t
D x y D x yM x y x yD x y D x y
+ + + + ++ +
+
= ×
If 1M > , it means that the total efficiency of DMUs from t period to t+1 period increases, and vice versa; If 1M = , then indicates that the total efficiency does not change with time. Malmquist index can be further decomposed into two parts, technical effciency change (Effch) and techchnical change (Techch). Equation (2) can be expressed as:
1 21 1 1 1 11 1
1 1 1 1 1
( , ) ( , ) ( , )( , , , ) (5)( , ) ( , ) ( , )
t t t t t t t t tt t t t
t t t t t t t t t
D x y D x y D x yM x y x y Effch TechchD x y D x y D x y
+ + + + ++ +
+ + + + +
= × × = ×
Where Effch represents the change of technical efficiency in the period from t to t+1, 1Effch > indicating that the technical efficiency of decision making units is closer to the forefront
of efficiency and the relative technical efficiency has been improved. This index mainly reflects the improvement and enhancement of the production and operation behaviors (such as the management level) of decision making units. Techch is the technological change index from t+1 period,
165

representing the movement of the production frontier in two periods, mainly reflecting the impact of technological progress on the change of input efficiency, 1Techch > indicating technological innovation.
3.3 Selection of Indicators Determining the input and output indicators of financial listed companies in blockchain concept
stocks requires certain rigor and data should be easy to obtain. Therefore, this paper refers to the listing annual reports of listed companies and previous studies of experts and scholars, and makes improvements on this basis. Specific indicators are as follows.
Table 1 Input-Output Index Indicators Specific indicators Unit Note Input indicators
Total assets Billion x1
Total operating costs Billion x2
Assets liability ratio % x3
Output indicators
ROE % y1
Total operating income Billion y2
Basic earnings per share Yuan y3
4. Empirical Analysis and Research 4.1 Static Study on the Input-Output Efficiency of Financial Listed Companies in Blockchain Concept Stocks 4.1.1 Analyze from the Overall Perspective
Table 2 Overall Average Efficiency of 15 Listed Companies from 2016 to 2019 Year Technical efficiency Pure technical efficiency Scale efficiency 2016 0.821 0.872 0.943 2017 0.730 0.801 0.914 2018 0.723 0.796 0.902 2019 0.758 0.846 0.897
The DEAP2.1 software was used to analyze the relevant data, and the DEA-BCC model with variable returns to scale was selected. (According to Table 1) Among the concept stocks, the overall input-output efficiency of financial listed companies is relatively good. From 2016 to 2019, the overall technical efficiency is above 0.72, the overall pure technical efficiency is above 0.79, and the overall scale efficiency is above 0.89. Listed companies, by definition, technical efficiency, pure technical efficiency and scale efficiency achieves one can think it reaches DEA effective, (according to table 3), 2016, industrial and commercial bank, only collum software, easy to see shares, flush the four companies achieve DEA efficient, 15 companies in 2017 to achieve the DEA valid state the number of companies for 8 years to 0201 the state of the DEA efficient company as Carla and fortune securities, accounted for 13.3%, 2019 DEA effective state of the company for the industrial and commercial bank and China's ping an, accounted for 13.3%. Companies with technical efficiency between 0.7 and 0.8 still account for the majority, which indicates that although financial listed companies perform well on the whole, there is still a certain distance between them and DEA effective state. Therefore, financial listed enterprises should reasonably adjust the related input, control the size of the enterprise, so as to improve the input-output efficiency of the enterprise.
Table 3 Specific Efficiency Of 15 Listed Companies in Different Years Firm Year Crste Vrste Scale Firm Year Crste Vrste Scale Jiangsu Bank 2016 0.793 0.811 0.978 PING AN
INSURANCE COMPANY OF CHINA
2016 0.955 0.956 0.999 2017 0.765 0.779 0.982 2017 0.985 0.986 1.000 2018 0.768 0.782 0.982 2018 0.555 0.638 0.871 2019 0.709 0.728 0.974 2019 1.000 1.000 1.000
ICBC 2016 1.000 1.000 1.000 Caitong Securities 2016 0.761 1.000 0.761 2017 0.988 0.989 0.999 2017 0.729 0.904 0.807
166

2018 0.991 0.991 1.000 2018 1.000 1.000 1.000 2019 1.000 1.000 1.000 2019 0.788 0.982 0.802
Guosheng Financial Holding
2016 0.460 0.488 0.942 Ping An Bank 2016 0.841 0.853 0.987 2017 0.446 0.459 0.970 2017 0.817 0.828 0.987 2018 0.265 0.387 0.683 2018 0.825 0.835 0.988 2019 0.313 0.338 0.926 2019 0.826 0.834 0.991
Cashway Fintech 2016 0.930 1.000 0.930 Lakala Payment 2016 0.802 0.810 0.991 2017 0.803 1.000 0.803 2017 0.862 0.868 0.993 2018 0.653 1.000 0.653 2018 1.000 1.000 1.000 2019 0.581 0.792 0.734 2019 0.800 1.000 0.800
Client Service International
2016 1.000 1.000 1.000 EAST MONEY INFORMATION
2016 0.569 0.598 0.952 2017 0.769 1.000 0.770 2017 0.491 0.534 0.919 2018 0.756 0.892 0.847 2018 0.600 0.685 0.876 2019 0.792 0.855 0.926 2019 0.727 0.899 0.809
Rendong Holdings
2016 0.981 0.981 0.999 Sinodata 2016 0.654 0.991 0.660 2017 0.525 0.561 0.936 2017 0.459 0.622 0.738 2018 0.554 0.567 0.978 2018 0.613 0.803 0.763 2019 0.712 0.728 0.977 2019 0.691 0.963 0.718
Easy Visible Supply Chain Management
2016 1.000 1.000 1.000 Hithink RoyalFlush Information Network
2016 1.000 1.000 1.000 2017 0.994 1.000 0.994 2017 0.833 0.978 0.852 2018 0.980 0.986 0.994 2018 0.903 1.000 0.903 2019 0.994 1.000 0.994 2019 0.936 0.977 0.957
First Capital Securities
2016 0.569 0.595 0.957 2017 0.489 0.506 0.966 2018 0.378 0.379 0.998 2019 0.502 0.592 0.847
4.1.2 Analysis from the Perspective of Time Change The technical efficiency of 15 listed companies fluctuates with time. Among them, Rendong
Holding has the most obvious efficiency fluctuation, with a difference of 0.456 between the maximum value and the minimum value; ICBC has the least obvious efficiency fluctuation, with a difference of 0.009 between the maximum value and the minimum value. The technical efficiency of most companies fluctuates in the shape of V. Industrial and Commercial Bank of China, Guosheng Financial Holding, Blum Software, Rendong Holding, Yisee, First Venture Capital, Ping An of China, Ping An Bank, Orient Fortune, Zhongke Jincai, and Flush, the efficiency value in 2019 is higher than the data in 2018, showing an upward trend. There were five companies with technical efficiency of 1 or equal in 2016, three in 2017, four in 2018, and four in 2019. Except for Guosheng Financial Holding, the technical efficiency of the other 14 financial listed companies maintained above 0.4 during the four years. The fluctuation of efficiency of 15 listed companies may be caused by the immature and stable development and application of blockchain technology, and the imperfect integration of financial listed companies with blockchain technology. Therefore, financial companies should reasonably adjust input factors to achieve the effective DEA state.
0.20.30.40.50.60.70.80.9
11.1
2016 2017 2018 2019
167

Fig.1 Changes in Technical Efficiency of Financial Listed Companies in Blockchain Concept Stocks
4.1.3 Analysis from the Perspective of Input-Output Redundancy After the overall analysis and time change analysis, this paper analyzes how to adjust the input
and output factors through the specific data of input-output redundancy, so as to make the company reach the effective DEA state. Due to the limited space, this article choi tong securities peace Banks, for example, the table 5 shows that choi tong securities should be adjusted roe, basic earnings per share, total assets, business spending, asset-liability ratio to implement DEA effective, return on net assets slack variable should be increased by 8.768%, basic earnings per share slack variable should increase 0.267 yuan, the total assets of radial variable should reduce 1.1703 billion yuan, radial variable operating expenditure should reduce 049 million yuan, radial variable asset-liability ratio should be reduced by 1.209%, so as to achieve the DEA valid state; For Ping An Bank, the relaxation variable of return on equity should be increased by 16.479%, the radial variable of total assets should be reduced by 655.5292 billion yuan, the radial variable of operating expenditure should be reduced by 16.924.9 billion yuan, the radial variable of asset-liability ratio should be reduced by 15.319%, and the relaxation variable should be reduced by 18.385%, so as to reach the effective DEA state.
Table 5 Input-Output Redundancy Data Table Firm Indicat
or S- S+ Goal
value Firm Indicat
or S- S+ Goal
value Jiangsu Bank
y1 0.000 13.682 26.332 PING AN INSURANCE COMPANY OF CHINA
y1 0.000 0.000 24.400 y2 0.000 0.000 449.700 y2 0.000 0.000 11690.00
0 y3 0.000 0.000 1.180 y3 0.000 0.000 8.410 x1 -5615.51
1 0.000 15034.489 x1 0.000 0.000 82230.00
0 x2 -79.678 0.000 213.322 x2 0.000 0.000 9838.000 x3 -25.396 -10.75
1 57.243 x3 0.000 0.000 89.630
ICBC y1 0.000 0.000 13.050 Caitong Securities
y1 0.000 8.768 18.048 y2 0.000 0.000 8552.00 y2 0.000 0.000 49.520 y3 0.000 0.000 0.860 y3 0.000 0.267 0.787 x1 0.000 0.000 301100.00
0 x1 -11.703 0.000 638.197
x2 0.000 0.000 4646.000 x2 -0.490 0.000 26.700 x3 0.000 0.000 91.060 x3 -1.209 0.000 65.941
Guosheng Financial Holding
y1 0.000 29.954 30.784 Ping An Bank y1 0.000 16.479 27.779 y2 0.000 0.000 16.700 y2 0.000 0.000 1380.000 y3 0.000 1.515 1.564 y3 0.000 0.000 1.540 x1 -223.259 -16.26
2 97.778 x1 -6555.29
2 0.000 32834.70
8 x2 -15.138 0.000 7.732 x2 -169.249 0.000 847.751 x3 -43.467 0.000 22.203 x3 -15.319 -18.38
5 58.346
Cashway Fintech
y1 0.000 9.983 10.083 Lakala Payment
y1 0.000 0.000 19.470 y2 0.000 0.000 10.160 y2 0.000 0.000 48.990 y3 0.000 0.360 0.460 y3 0.000 0.000 2.090 x1 -5.652 0.000 21.458 x1 0.000 0.000 111.900 x2 -2.327 0.000 8.833 x2 0.000 0.000 40.080 x3 -8.359 0.000 31.731 x3 0.000 0.000 55.150
Client Service International
y1 0.000 8.737 15.207 EAST MONEY INFORMATION
y1 0.000 14.240 23.730 y2 0.000 0.000 9.339 y2 0.000 0.000 42.320 y3 0.000 0.515 0.675 y3 0.000 0.772 1.049 x1 -2.147 0.000 12.693 x1 -62.643 0.000 555.657 x2 -1.261 0.000 7.455 x2 -2.410 0.000 21.380 x3 -7.027 -0.347 41.196 x3 -6.655 0.000 59.035
168
Rendong Holdings
y1 0.000 23.127 26.177 Sinodata y1 0.000 7.780 7.790 y2 0.000 0.000 18.310 y2 0.000 0.000 16.720 y3 0.000 1.217 1.267 y3 0.000 0.282 0.382 x1 -9.725 0.000 26.065 x1 -1.181 0.000 30.319 x2 -4.845 0.000 12.985 x2 -0.657 -1.825 15.039 x3 -19.391 -14.59
6 37.373 x3 -1.075 0.000 27.595
Easy Visible Supply Chain Management
y1 0.000 0.000 11.780 Hithink RoyalFlush Information Network
y1 0.000 9.223 34.153 y2 0.000 0.000 153.500 y2 0.000 0.000 17.420 y3 0.000 0.000 0.789 y3 0.000 0.017 1.687 x1 0.000 0.000 155.600 x1 -1.191 0.000 51.169 x2 0.000 0.000 143.400 x2 -0.198 0.000 8.519 x3 0.000 0.000 44.660 x3 -0.542 0.000 23.258
First Capital Securities
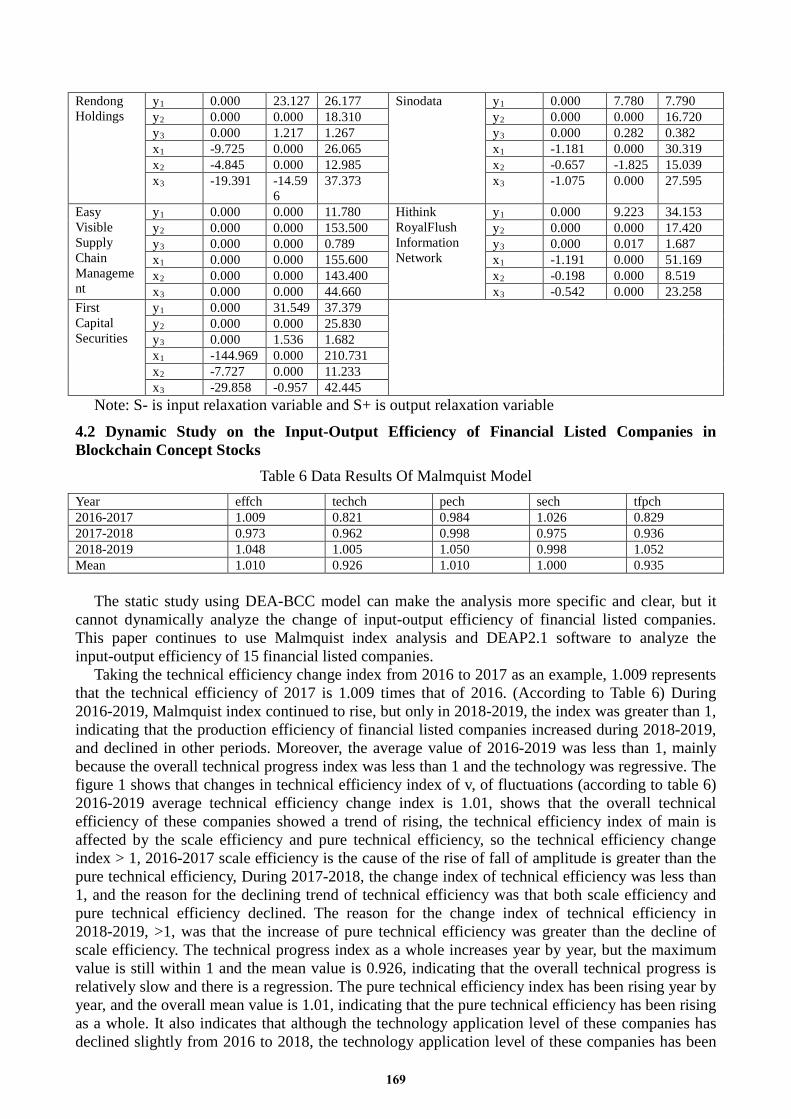
y1 0.000 31.549 37.379 y2 0.000 0.000 25.830 y3 0.000 1.536 1.682 x1 -144.969 0.000 210.731 x2 -7.727 0.000 11.233 x3 -29.858 -0.957 42.445
Note: S- is input relaxation variable and S+ is output relaxation variable
4.2 Dynamic Study on the Input-Output Efficiency of Financial Listed Companies in Blockchain Concept Stocks
Table 6 Data Results Of Malmquist Model Year effch techch pech sech tfpch 2016-2017 1.009 0.821 0.984 1.026 0.829 2017-2018 0.973 0.962 0.998 0.975 0.936 2018-2019 1.048 1.005 1.050 0.998 1.052 Mean 1.010 0.926 1.010 1.000 0.935
The static study using DEA-BCC model can make the analysis more specific and clear, but it
cannot dynamically analyze the change of input-output efficiency of financial listed companies. This paper continues to use Malmquist index analysis and DEAP2.1 software to analyze the input-output efficiency of 15 financial listed companies.
Taking the technical efficiency change index from 2016 to 2017 as an example, 1.009 represents that the technical efficiency of 2017 is 1.009 times that of 2016. (According to Table 6) During 2016-2019, Malmquist index continued to rise, but only in 2018-2019, the index was greater than 1, indicating that the production efficiency of financial listed companies increased during 2018-2019, and declined in other periods. Moreover, the average value of 2016-2019 was less than 1, mainly because the overall technical progress index was less than 1 and the technology was regressive. The figure 1 shows that changes in technical efficiency index of v, of fluctuations (according to table 6) 2016-2019 average technical efficiency change index is 1.01, shows that the overall technical efficiency of these companies showed a trend of rising, the technical efficiency index of main is affected by the scale efficiency and pure technical efficiency, so the technical efficiency change index > 1, 2016-2017 scale efficiency is the cause of the rise of fall of amplitude is greater than the pure technical efficiency, During 2017-2018, the change index of technical efficiency was less than 1, and the reason for the declining trend of technical efficiency was that both scale efficiency and pure technical efficiency declined. The reason for the change index of technical efficiency in 2018-2019, >1, was that the increase of pure technical efficiency was greater than the decline of scale efficiency. The technical progress index as a whole increases year by year, but the maximum value is still within 1 and the mean value is 0.926, indicating that the overall technical progress is relatively slow and there is a regression. The pure technical efficiency index has been rising year by year, and the overall mean value is 1.01, indicating that the pure technical efficiency has been rising as a whole. It also indicates that although the technology application level of these companies has declined slightly from 2016 to 2018, the technology application level of these companies has been
169

improving as a whole. As shown in Figure 1, the scale efficiency index fluctuates in a V-shape. 2016-2017 index is greater than 1, indicating an increase in scale efficiency; 2017-2019 index is less than 1, indicating a decline in scale efficiency. 2016-2019 overall scale efficiency index is 1, indicating no change in scale efficiency as a whole. The average technical efficiency change index >1 from 2016 to 2019 is mainly due to the improvement of pure technical efficiency.
Fig.2 Dynamic Analysis of Data Results Line Chart
5. Conclusions and Recommendations By studying the input-output efficiency of financial listed companies in blockchain concept
stocks from 2016 to 2019, this paper draws the following conclusions and suggestions:
5.1 Conclusion (1) The overall input-output efficiency performance of financial listed companies in blockchain
concept stocks is relatively excellent. The annual mean values of technical efficiency, pure technical efficiency and scale efficiency were all above 0.7, and the total mean values were 0.758, 0.846 and 0.897, respectively. And the technical efficiency presents V shape change.
(2) Few enterprises achieve effective efficiency, and all of them achieve effective efficiency in a certain year. This indicates that although the financial listed companies in the block chain concept stocks perform well in the overall input-output efficiency after applying the block chain technology, there is still a long way to go before reaching the effective DEA.
(3) The technical efficiency of the 15 listed companies fluctuated, and most of them showed V-shaped fluctuation. From 2016 to 2017, the technical efficiency of 15 listed companies showed a downward trend, while from 2017 to 2019, the technical efficiency of listed companies continued to rise.
(4) Based on the results of input-output redundancy analysis, the 15 listed companies can obtain the specific way to achieve DEA effectiveness by adjusting input and output.
(5) From 2016 to 2019, the average value of Malmquist index of financial listed companies in blockchain concept stocks was 0.935, and the overall total factor production efficiency declined, mainly because the average value of technical progress index was less than 1, and the technology went backwards. From 2016 to 2019, the change index of technical efficiency was >1, and the increase of technical efficiency was mainly due to the improvement of pure technical efficiency.
(6) The degree of progress of blockchain technology shows signs of slowing down, thus reducing the input-output efficiency of enterprises.
5.2 Suggestions (1) Continue to vigorously develop blockchain technology and improve the input-output
1.009
0.973
1.048
0.821
0.962
1.0050.984
0.998
1.051.026
0.9750.998
0.829
0.936
1.052
0.8
0.84
0.88
0.92
0.96
1
1.04
1.08
2016-2017 2017-2018 2018-2019
effch techch pech sech tfpch
170

efficiency of financial listed enterprises. According to the measurement results, the input-output efficiency of financial listed companies in blockchain concept stocks is relatively high. Therefore, relevant enterprises should continue to take blockchain as the key technology to improve the input-output efficiency and improve the overall input-output efficiency, in order to finally reach the effective state of DEA.
(2) Accelerate the research and development process of blockchain technology and improve the technical progress index of enterprises. By the empirical result shows that block appeared less chain technology progress and makes the input and output efficiency of the enterprises fell, so relevant enterprises should intensify their efforts to block chain technology research and development of crack core problems, to use block chain technology “and” distributed “and” smart contract books' features such as better services for the company, improve the company's core technical ability.
(3) Promote the combination of blockchain technology and the company's business to enhance the competitiveness of listed enterprises. Blockchain technology makes it difficult to tamper with relevant data and guarantees the security of data. Besides, features such as smart contracts can greatly reduce the operating costs of listed companies. Therefore, listed companies should promote the integration of technology and business, enhance the competitiveness of the company, so that the company can achieve the purpose of effective DEA.
6. Acknowledgment Humanities and Social Sciences Research Youth Fund Project of the China’s Ministry of
Education : Phase results of the integration research of block chain in targeted poverty alleviation (19YJC790169)
References [1] Zhang L, Xie Y, Zheng Y, et al. The challenges and countermeasures of blockchain in finance and economics[J]. Systems Research and Behavioral Science, 2020, 37(4): 691-698. [2] Casey M, Crane J, Gensler G, et al. The impact of blockchain technology on finance: A catalyst for change[J]. 2018. [3] Chen Y, Bellavitis C. Blockchain disruption and decentralized finance: The rise of decentralized business models[J]. Journal of Business Venturing Insights, 2020, 13: e00151. [4] Auer R. Embedded supervision: how to build regulation into blockchain finance[J]. 2019. [5] Scott B. How can cryptocurrency and blockchain technology play a role in building social and solidarity finance?[R]. UNRISD Working Paper, 2016. [6] Guo Y, Liang C. Blockchain application and outlook in the banking industry[J]. Financial Innovation, 2016, 2(1): 1-12. [7] Chen G, Firth M, Xin Y, et al. Control transfers, privatization, and corporate performance: Efficiency gains in China's listed companies[J]. Journal of Financial and Quantitative Analysis, 2008: 161-190. [8] Hsu L C. Using a decision-making process to evaluate efficiency and operating performance for listed semiconductor companies[J]. Technological and Economic Development of Economy, 2015, 21(2): 301-331. [9] Lin C, Ma Y, Su D. Corporate governance and firm efficiency: evidence from China's publicly listed firms[J]. Managerial and Decision Economics, 2009, 30(3): 193-209. [10] Zheng X, Chau K W, Hui E C M. Efficiency assessment of listed real estate companies: an empirical study of China[J]. International Journal of Strategic Property Management, 2011, 15(2): 91-104.
171

[11] Mostafa M M. Evaluating the competitive market efficiency of top listed companies in Egypt[J]. Journal of Economic Studies, 2007. [12] Xue X, Shen Q, Wang Y, et al. Measuring the productivity of the construction industry in China by using DEA-based Malmquist productivity indices[J]. Journal of Construction engineering and Management, 2008, 134(1): 64-71. [13] Wu A H, Cao Y Y, Liu B. Energy efficiency evaluation for regions in China: an application of DEA and Malmquist indices[J]. Energy efficiency, 2014, 7(3): 429-439. [14] Yanling, Ji Shengbao Xi. “Efficiency Evaluations and Influencing Factors of China Food & Beverage Listed Companies--DEA-Tobit model based on SORM-BCC & Malmquist.” Shanghai Journal of Economics 9 (2011). [15] Wu W, Yu B, Spender J C, et al. Operational efficiency across the Chinese aerospace industry: a DEA and Malmquist analysis[J]. Chinese Management Studies, 2015. [16] XU Y, ZHANG Q. An empirical study of resource allocation efficiency of China's Hi-Tech industry: based on DEA-Malmquist index approach[J]. Contemporary Finance & Economics, 2009, 12: 74-79. [17] He F, Zhang Q, Lei J, et al. Energy efficiency and productivity change of China’s iron and steel industry: Accounting for undesirable outputs[J]. Energy Policy, 2013, 54: 204-213. [18] Tan Y, Floros C. Risk, capital and efficiency in Chinese banking[J]. Journal of International Financial Markets, Institutions and Money, 2013, 26: 378-393. [19] Banker, R. D., Charnes, A., & Cooper, W. W. (1984). Some models for estimating technical and scale inefficiencies in data envelopment analysis. Management Science, 30,1078–1092. [20] Xing Huang, Huidong Jin, Hua Bai,Vulnerability assessment of China's coastal cities based on DEA cross-efficiency model,International Journal of Disaster Risk Reduction,Volume 36,2019,101091,ISSN 2212-4209. [21] Charnes, A., Cooper, W. W., & Rhodes, E. (1978). Measuring the efficiency of decision making units. European Journal of Operational Research, 2, 429–444. [22] TIMOTHY L D S, et al. An introduction to efficient and production analysis [M]. New York: Springer Science Business Media, 2005:85-132. [23] Mohsen A., Heine A.The Overall Malmquist Index: A New Approach for Measuring Productivity Changes Over Time [J]. Annals of Operations Research, 2015,226(1):1-27. [24] Thanassoulis E,Shiraz R.K.,Maniadakis N.A Cost Malmquist Productivity Ihadex Capturing Group Performance UJ.European Jourmal of Operational Research,2015,241(3):796-805
172