inorganic membranes for treatment of produced water kim_osu.pdf · treatment. 4 • ultrafiltration...
TRANSCRIPT
Inorganic Membranes for
Treatment of Produced Water
Seok-Jhin Kim School of Chemical Engineering,
Oklahoma State University, Stillwater, OK 74078, USA
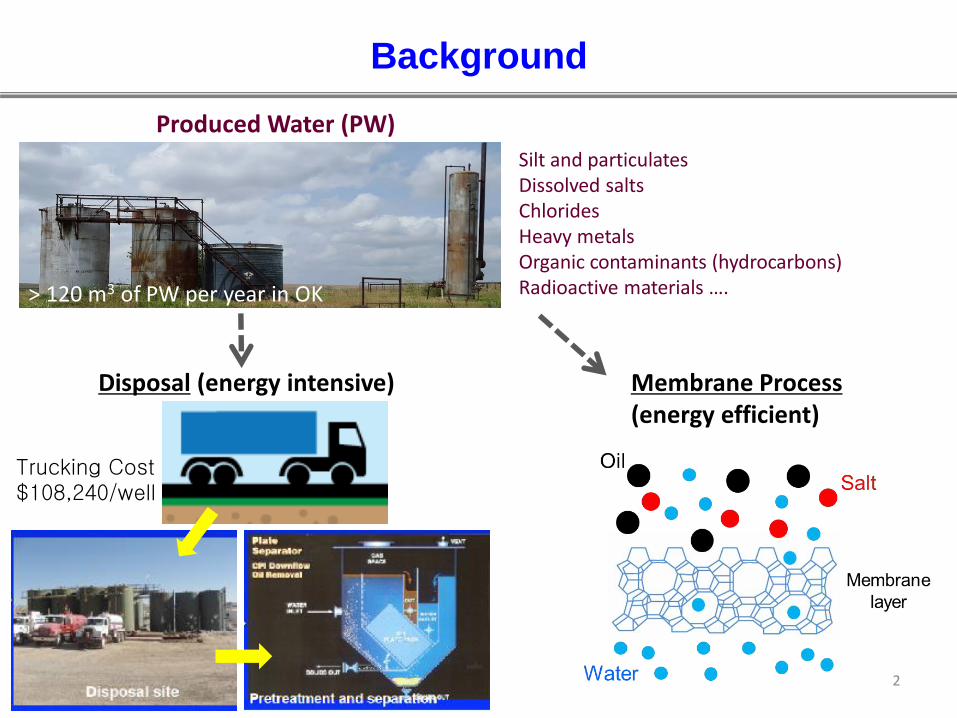
Produced Water (PW)
Silt and particulatesDissolved saltsChlorides Heavy metalsOrganic contaminants (hydrocarbons)Radioactive materials ….
Disposal (energy intensive) Membrane Process(energy efficient)
Background
> 120 m3 of PW per year in OK
Trucking Cost$108,240/well
2

- Including fresh water and disposal costs, the total average cost for water in completion can exceed $306,482 per well.
Background
Table. Example U.S. Water Cost Analysis.
4,626 active disposal wells in Oklahoma as of April 2017
Average water required per well 120,000 bbl (barrel)
Typical load recovery (30%) 36,000 bbl
Typical water truck holds 110 bbl/load
Each well requires 328 truck trips
Average trucking time 3 hours
Average cost of trucking $110/hours
Estimated trucking costs $108,240/well
Freshwater costs $90,000/well
Estimated disposal costs $108,242/well
Total cost per well $306,482/well
3

Background
- Disposal costs increase exponentially as the trucking distance from the well site to the disposal site increases.
-- Source: University of North Dakota’s Energy and Environmental Research Center
Table. Average Water Costs for Bakken Shale Stimulation Operations
Acquisition Costs (Cost, $/bbl)
Raw Water 0.25-1.75
Transportation 0.63-5.00
Disposal Costs (Cost, $/bbl)
Deep-Well injection 0.50-1.75
Transportation 0.63-9.00
Average Total Costs 2.00-16.80
- The advanced “onsite” water filtration system enables PW to be reused without delivering freshwater to the wellsite, and transporting PW off-site for treatment.
4
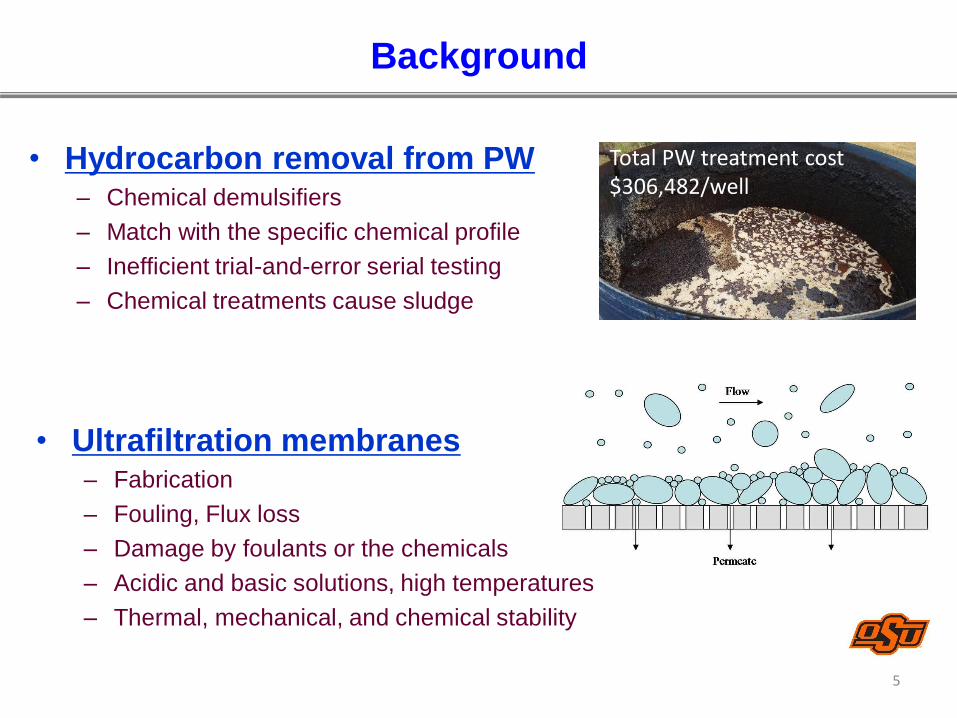
• Ultrafiltration membranes– Fabrication
– Fouling, Flux loss
– Damage by foulants or the chemicals
– Acidic and basic solutions, high temperatures
– Thermal, mechanical, and chemical stability
• Hydrocarbon removal from PW– Chemical demulsifiers
– Match with the specific chemical profile
– Inefficient trial-and-error serial testing
– Chemical treatments cause sludge
Background
Total PW treatment cost$306,482/well
5
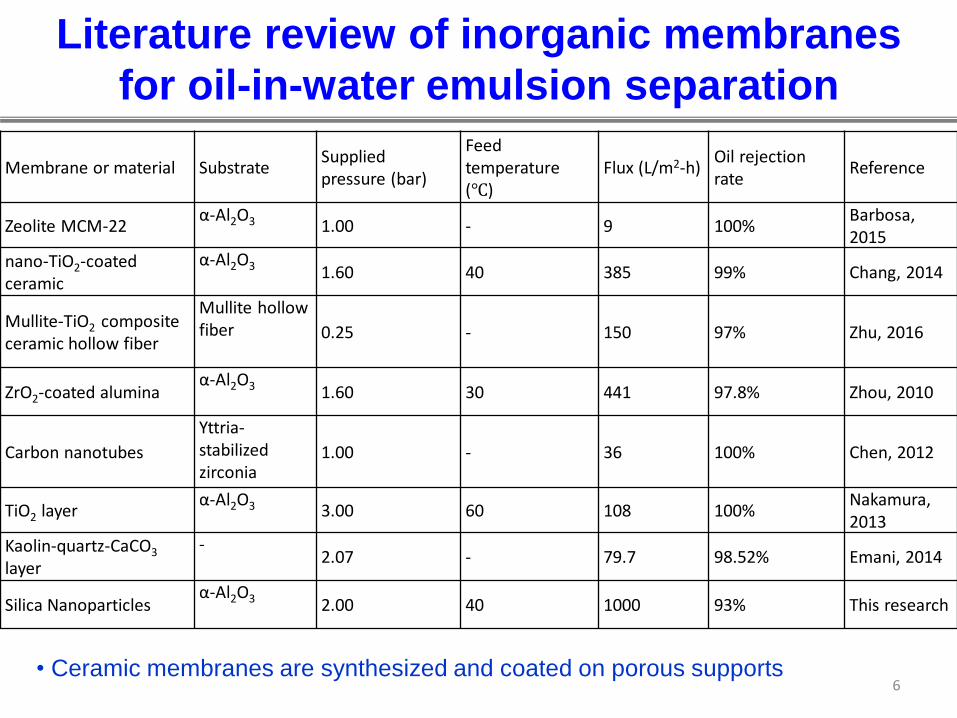
Literature review of inorganic membranes
for oil-in-water emulsion separation
6
Membrane or material SubstrateSupplied pressure (bar)
Feed temperature (℃)
Flux (L/m2-h)Oil rejection rate
Reference
Zeolite MCM-22α-Al2O3 1.00 - 9 100%
Barbosa,2015
nano-TiO2-coated ceramic
α-Al2O3 1.60 40 385 99% Chang, 2014
Mullite-TiO2 composite ceramic hollow fiber
Mullite hollow fiber 0.25 - 150 97% Zhu, 2016
ZrO2-coated aluminaα-Al2O3 1.60 30 441 97.8% Zhou, 2010
Carbon nanotubes
Yttria-stabilized zirconia
1.00 - 36 100% Chen, 2012
TiO2 layerα-Al2O3 3.00 60 108 100%
Nakamura, 2013
Kaolin-quartz-CaCO3
layer
-2.07 - 79.7 98.52% Emani, 2014
Silica Nanoparticlesα-Al2O3 2.00 40 1000 93% This research
• Ceramic membranes are synthesized and coated on porous supports
Silica nanoparticles
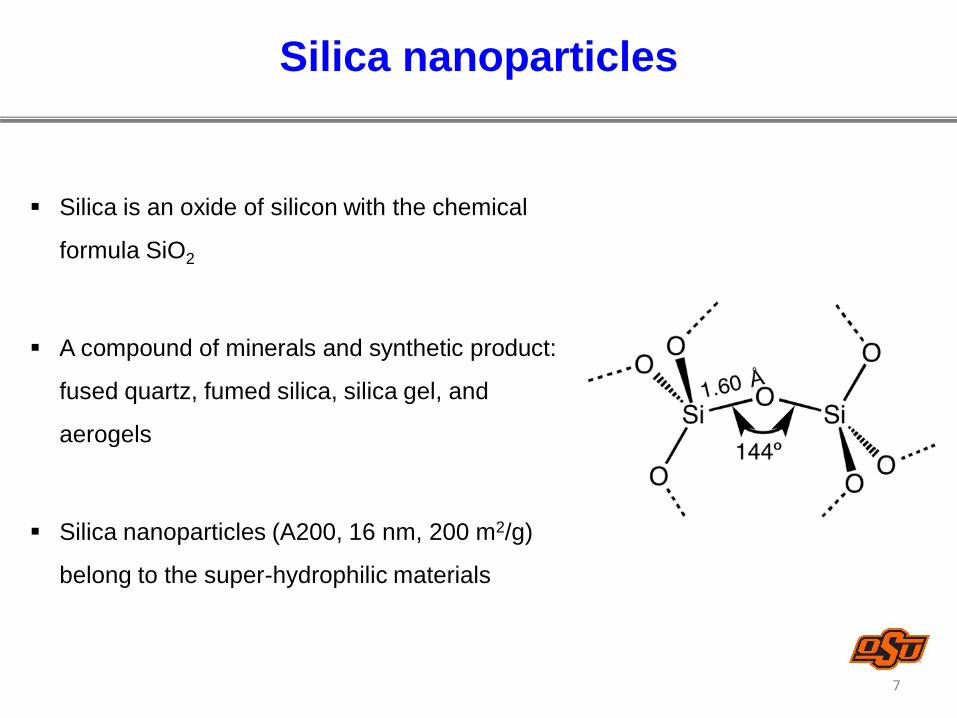
▪ Silica is an oxide of silicon with the chemical
formula SiO2
▪ A compound of minerals and synthetic product:
fused quartz, fumed silica, silica gel, and
aerogels
▪ Silica nanoparticles (A200, 16 nm, 200 m2/g)
belong to the super-hydrophilic materials
7
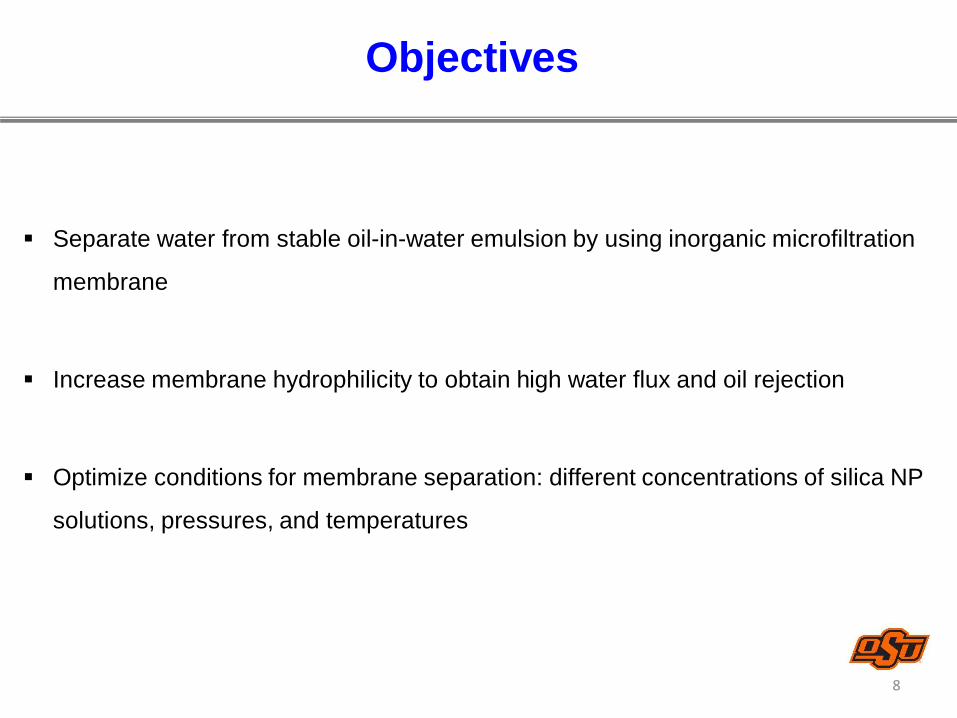
Objectives
▪ Separate water from stable oil-in-water emulsion by using inorganic microfiltration
membrane
▪ Increase membrane hydrophilicity to obtain high water flux and oil rejection
▪ Optimize conditions for membrane separation: different concentrations of silica NP
solutions, pressures, and temperatures
8
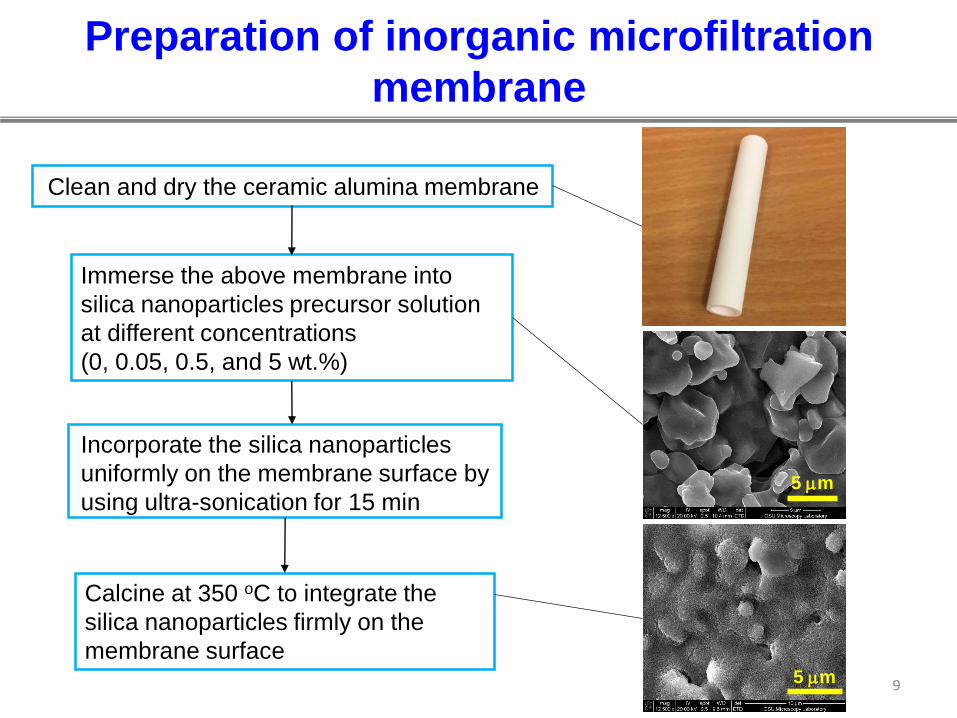
Preparation of inorganic microfiltration
membrane
Clean and dry the ceramic alumina membrane
Immerse the above membrane into
silica nanoparticles precursor solution
at different concentrations
(0, 0.05, 0.5, and 5 wt.%)
Incorporate the silica nanoparticles
uniformly on the membrane surface by
using ultra-sonication for 15 min
Calcine at 350 oC to integrate the
silica nanoparticles firmly on the
membrane surface
5 mm
5 mm 9
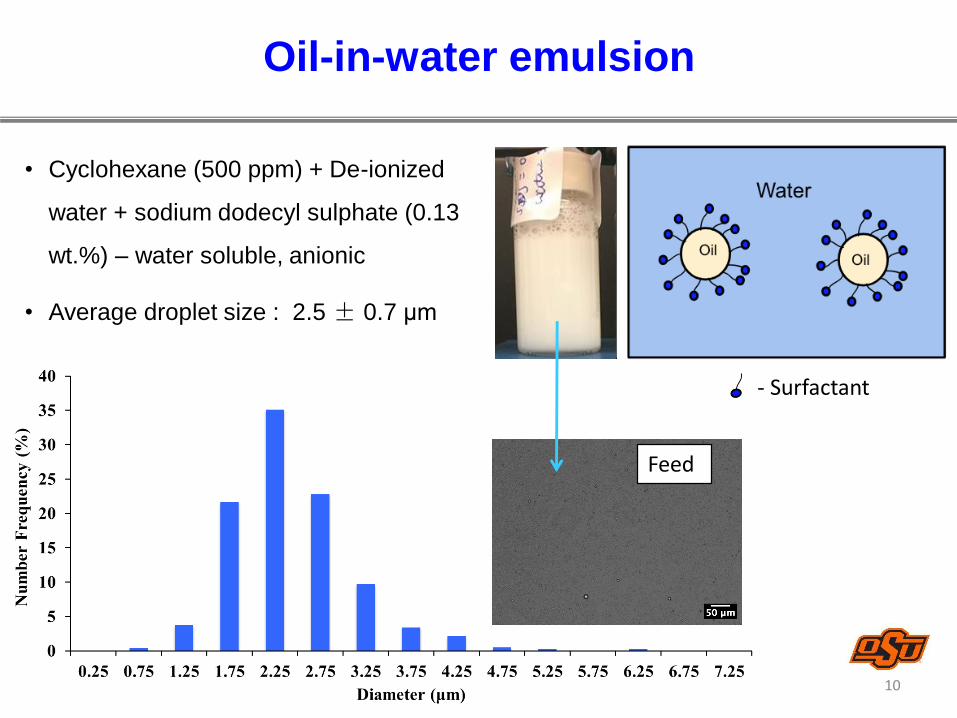
Oil-in-water emulsion
10
- Surfactant
• Cyclohexane (500 ppm) + De-ionized
water + sodium dodecyl sulphate (0.13
wt.%) – water soluble, anionic
• Average droplet size : 2.5 ± 0.7 μm
Feed
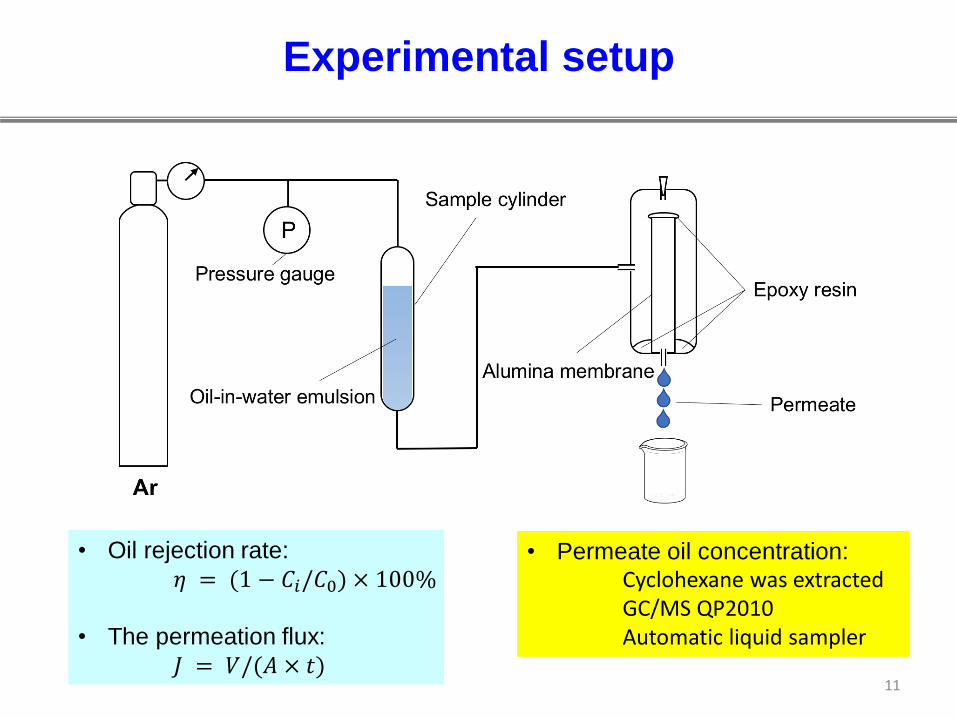
Experimental setup
11
• Oil rejection rate:
𝜂 = (1 − 𝐶𝑖/𝐶0) × 100%
• The permeation flux:
𝐽 = 𝑉/(𝐴 × 𝑡)
• Permeate oil concentration: Cyclohexane was extractedGC/MS QP2010Automatic liquid sampler
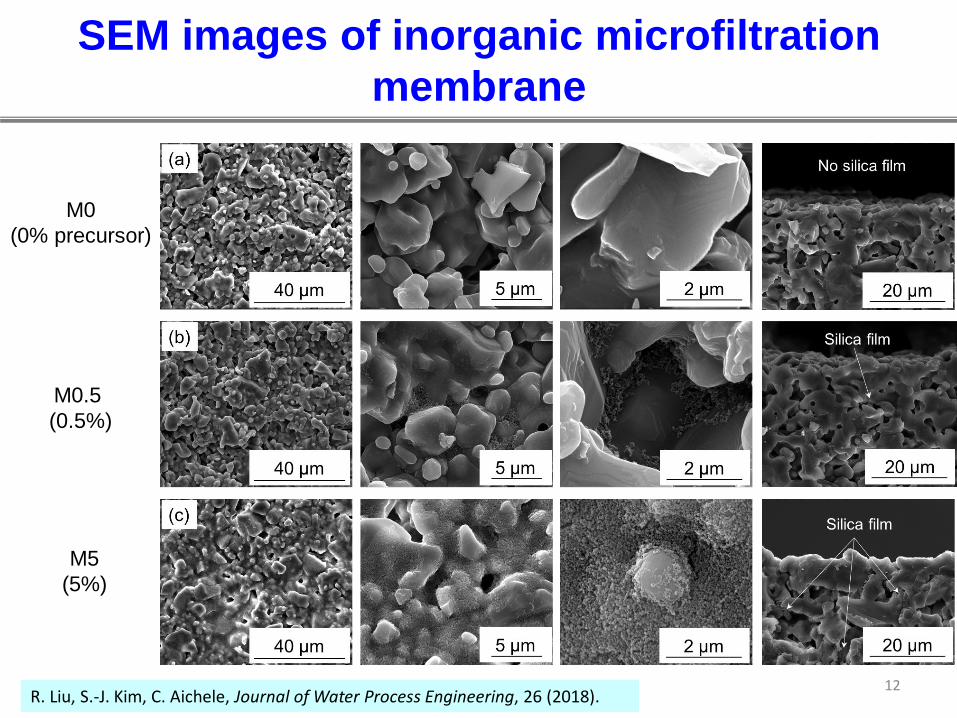
SEM images of inorganic microfiltration
membrane
12
M0
(0% precursor)
M0.5
(0.5%)
M5
(5%)
R. Liu, S.-J. Kim, C. Aichele, Journal of Water Process Engineering, 26 (2018).
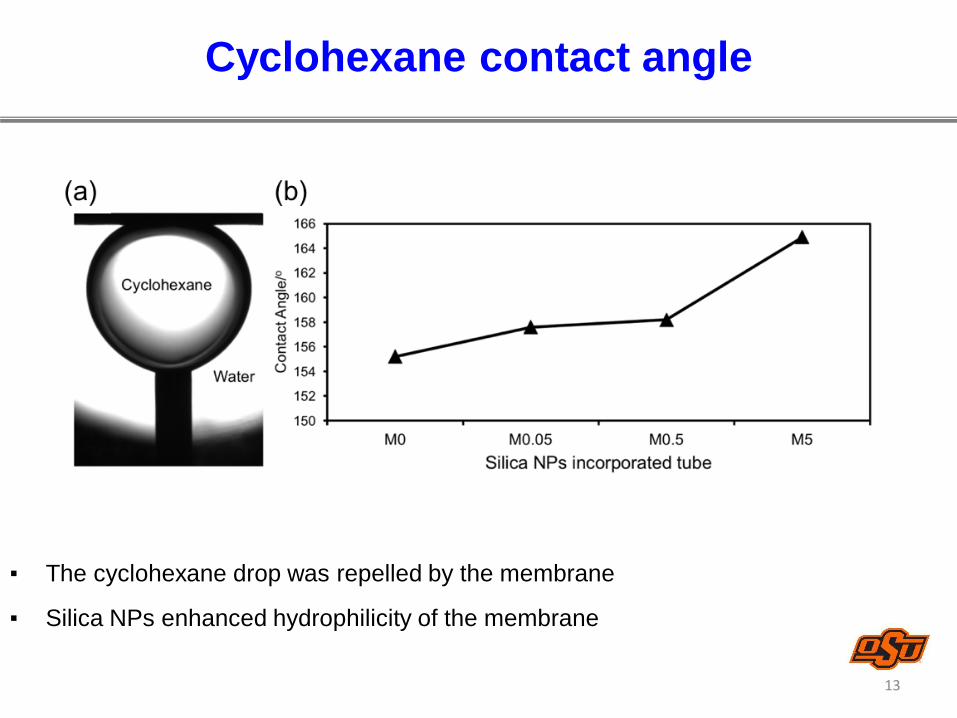
Cyclohexane contact angle
13
▪︎ The cyclohexane drop was repelled by the membrane
▪︎ Silica NPs enhanced hydrophilicity of the membrane
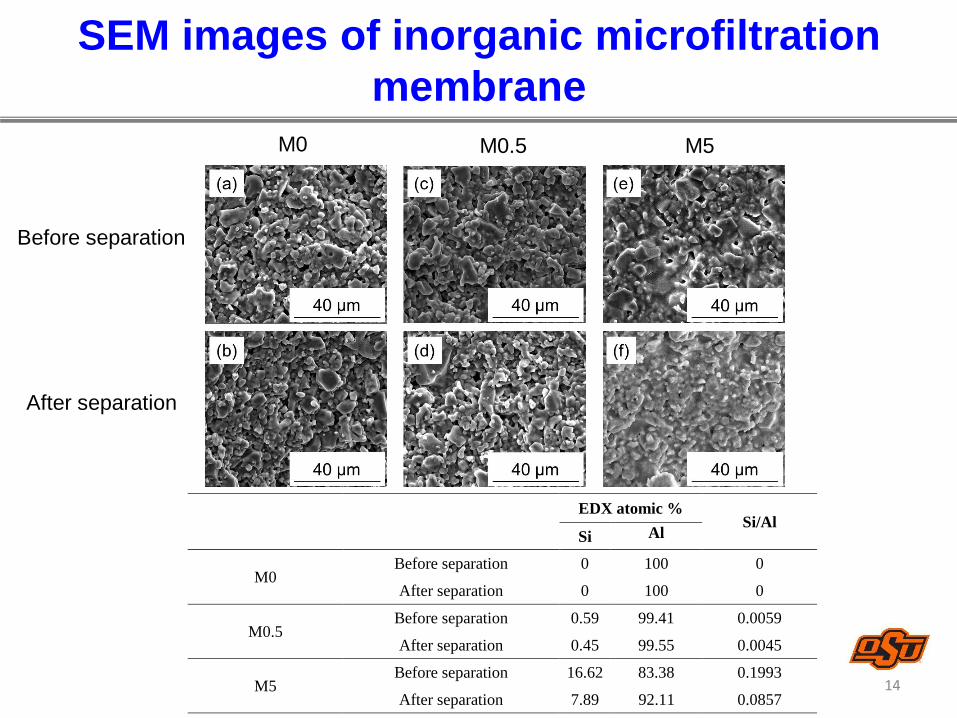
SEM images of inorganic microfiltration
membrane
14
EDX atomic %
Si/Al Si Al
M0 Before separation 0 100 0
After separation 0 100 0
M0.5 Before separation 0.59 99.41 0.0059
After separation 0.45 99.55 0.0045
M5 Before separation 16.62 83.38 0.1993
After separation 7.89 92.11 0.0857
M0 M0.5 M5
Before separation
After separation
Before and after separation with inorganic
microfiltration membrane
15
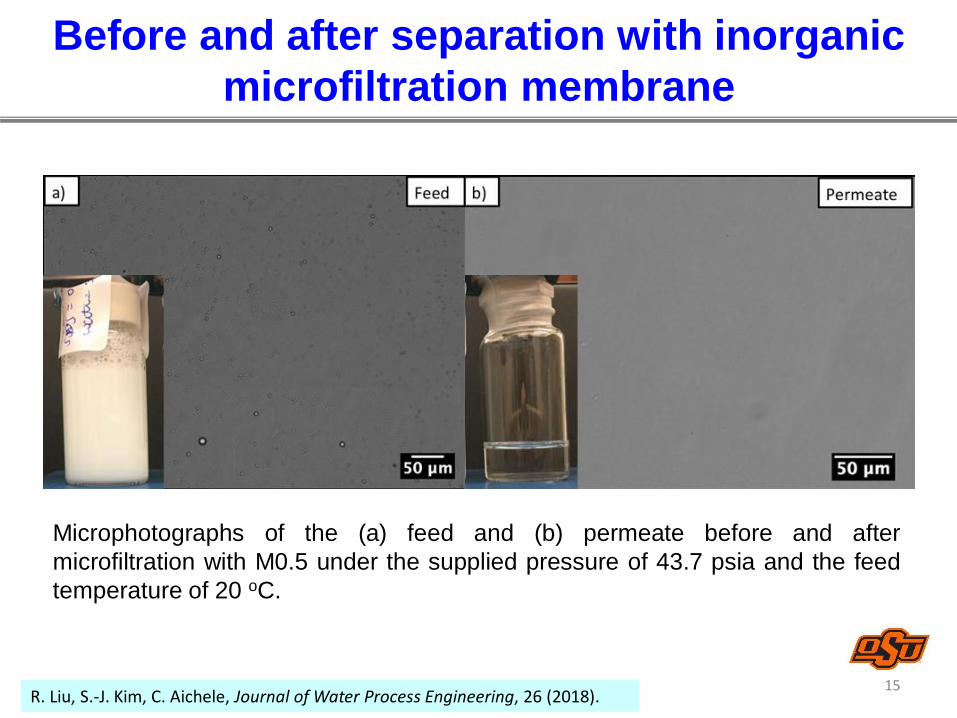
Microphotographs of the (a) feed and (b) permeate before and after
microfiltration with M0.5 under the supplied pressure of 43.7 psia and the feed
temperature of 20 oC.
R. Liu, S.-J. Kim, C. Aichele, Journal of Water Process Engineering, 26 (2018).
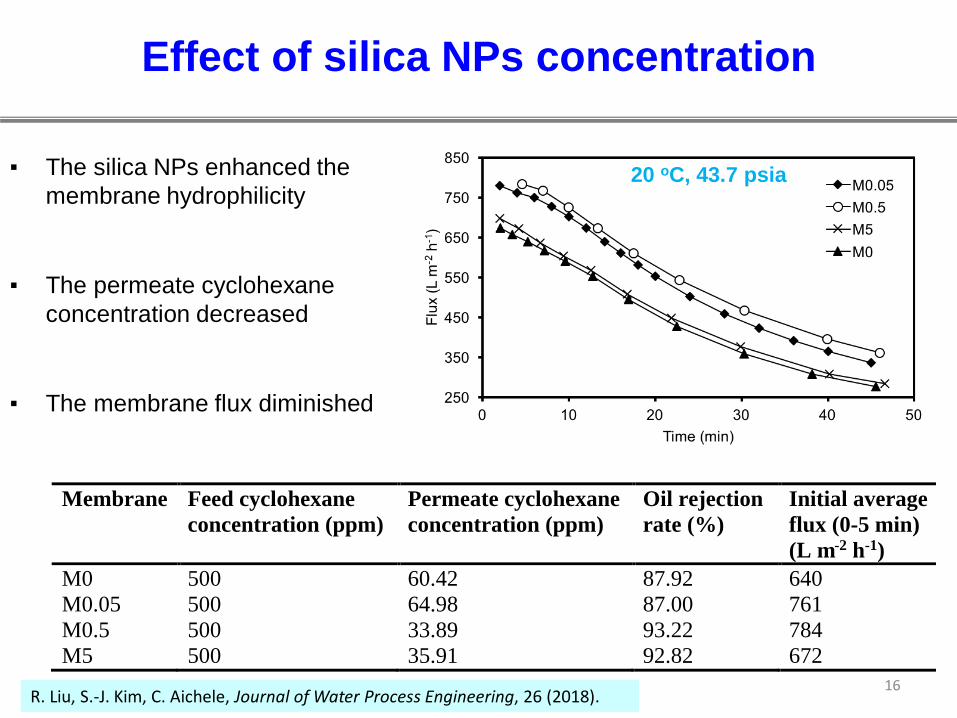
Effect of silica NPs concentration
16
▪︎ The silica NPs enhanced the
membrane hydrophilicity
▪︎ The permeate cyclohexane
concentration decreased
▪︎ The membrane flux diminished
20 oC, 43.7 psia
Membrane Feed cyclohexane
concentration (ppm)
Permeate cyclohexane
concentration (ppm)
Oil rejection
rate (%)
Initial average
flux (0-5 min)
(L m-2 h-1)
M0 500 60.42 87.92 640
M0.05 500 64.98 87.00 761
M0.5 500 33.89 93.22 784
M5 500 35.91 92.82 672
R. Liu, S.-J. Kim, C. Aichele, Journal of Water Process Engineering, 26 (2018).

Effect of feed pressure
17
▪︎ The water flux increased and
oil rejection decreased
▪︎ Higher flux worsen the fouling
problem
M0.5, 20 oC
Supplied
pressure
(psia)
Feed cyclohexane
concentration (ppm)
Permeate cyclohexane
concentration (ppm)
Oil rejection
rate (%)
Initial average
flux (0-5 min)
(L m-2 h-1)
29.2 500 2.04 99.59 596
43.7 500 33.89 93.22 784
58.2 500 42.91 91.82 1032
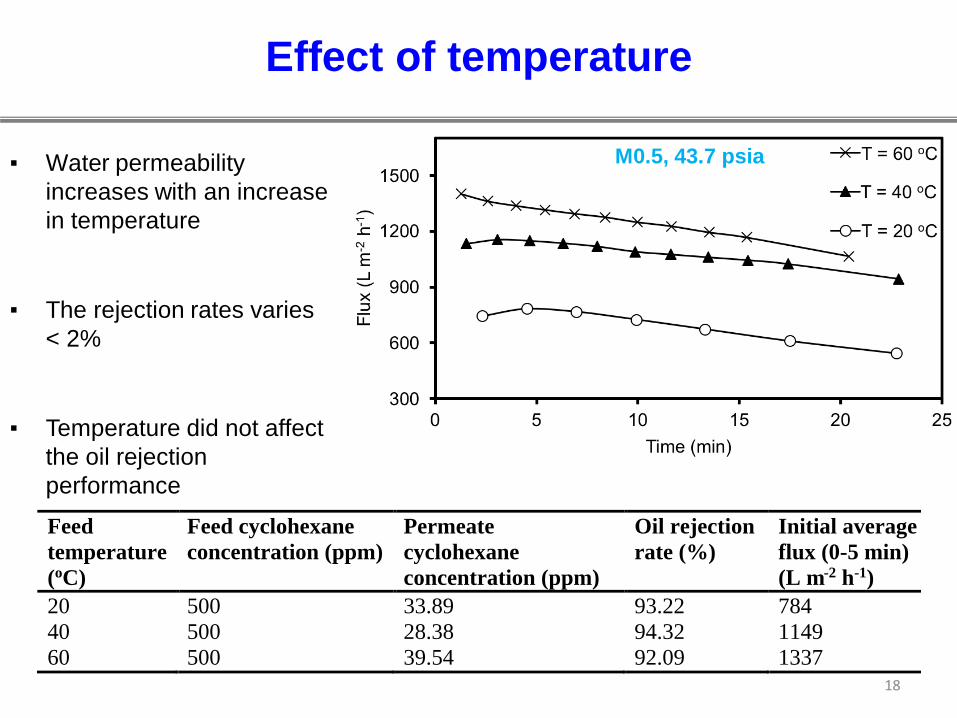
Effect of temperature
18
▪︎ Water permeability
increases with an increase
in temperature
▪︎ The rejection rates varies
< 2%
▪︎ Temperature did not affect
the oil rejection
performance
M0.5, 43.7 psia
Feed
temperature
(oC)
Feed cyclohexane
concentration (ppm)
Permeate
cyclohexane
concentration (ppm)
Oil rejection
rate (%)
Initial average
flux (0-5 min)
(L m-2 h-1)
20 500 33.89 93.22 784
40 500 28.38 94.32 1149
60 500 39.54 92.09 1337
19
Conclusions
▪ We demonstrated a novel method to incorporate hydrophilic silica NPs into an α-
alumina microfiltration tubular membrane for oil-in-water emulsion separation.
▪ The stable oil-in-water emulsion can be separated by using inorganic microfiltration
membrane.
▪ The high water flux and oil rejection rate (>1000 L m-2 h-1 and >94% at 40 oC) was
obtained by incorporating super-hydrophilic silica nanoparticles (0.5 wt.%)
Oil-water separation
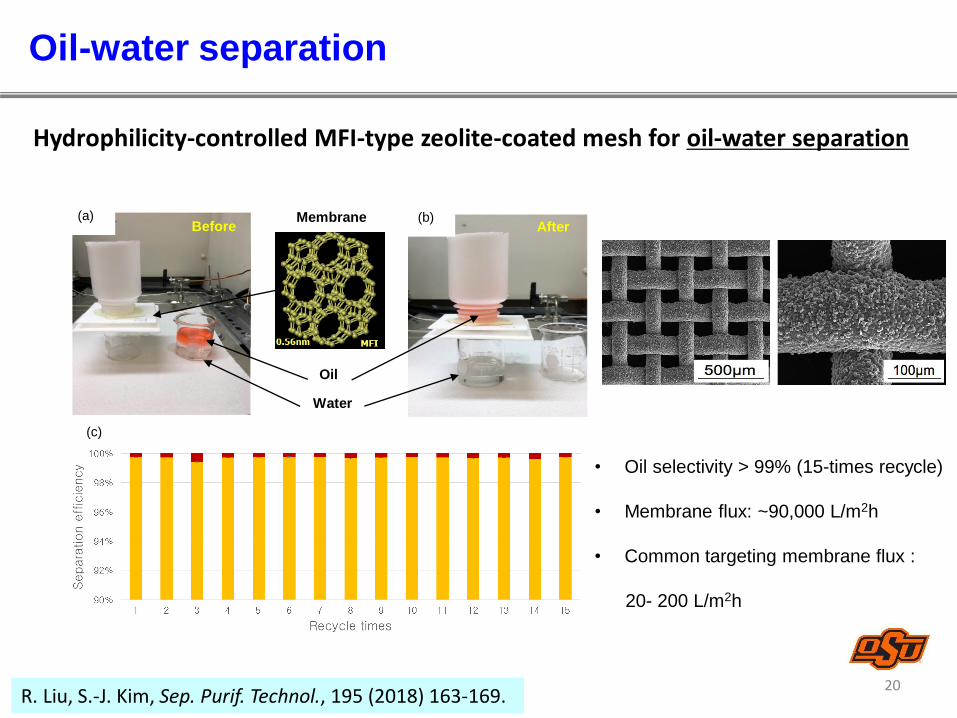
Hydrophilicity-controlled MFI-type zeolite-coated mesh for oil-water separation
• Oil selectivity > 99% (15-times recycle)
• Membrane flux: ~90,000 L/m2h
• Common targeting membrane flux :
20- 200 L/m2h
Oil
Water
Before AfterMembrane (b)(a)
(c)
R. Liu, S.-J. Kim, Sep. Purif. Technol., 195 (2018) 163-169.20
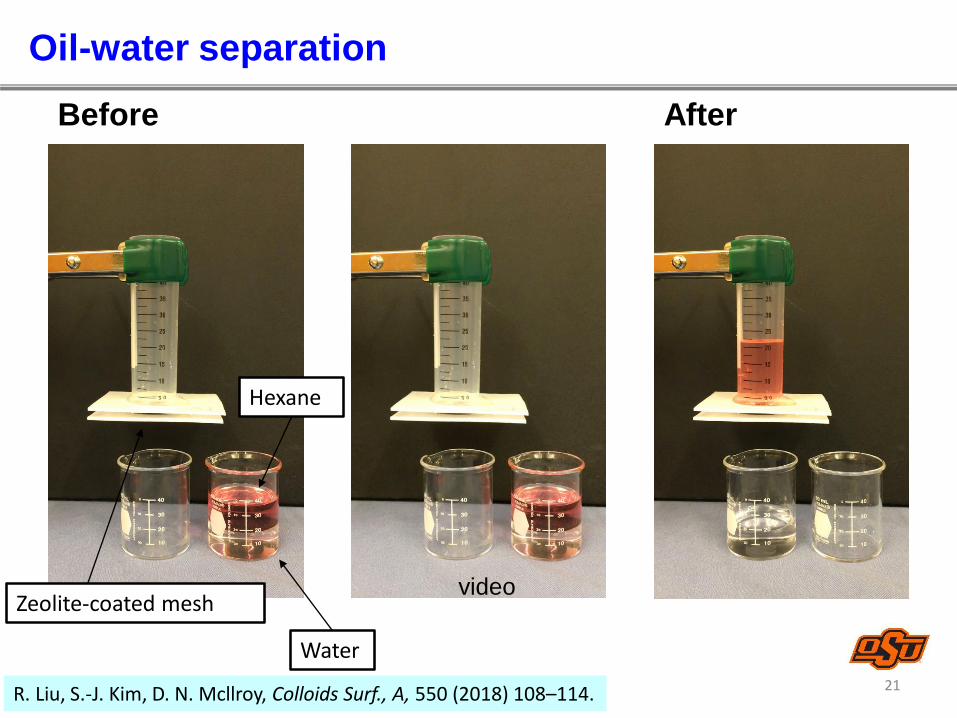
Before After
Hexane
Water
Zeolite-coated mesh
R. Liu, S.-J. Kim, D. N. Mcllroy, Colloids Surf., A, 550 (2018) 108–114.
video
Oil-water separation
21
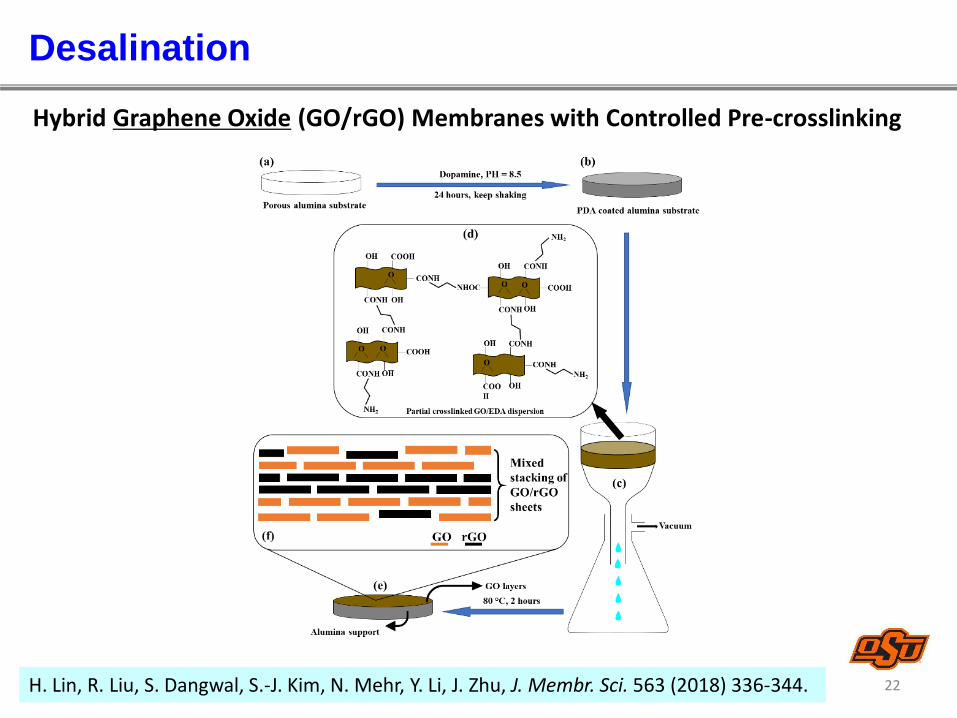
Hybrid Graphene Oxide (GO/rGO) Membranes with Controlled Pre-crosslinking
H. Lin, R. Liu, S. Dangwal, S.-J. Kim, N. Mehr, Y. Li, J. Zhu, J. Membr. Sci. 563 (2018) 336-344.
Desalination
22
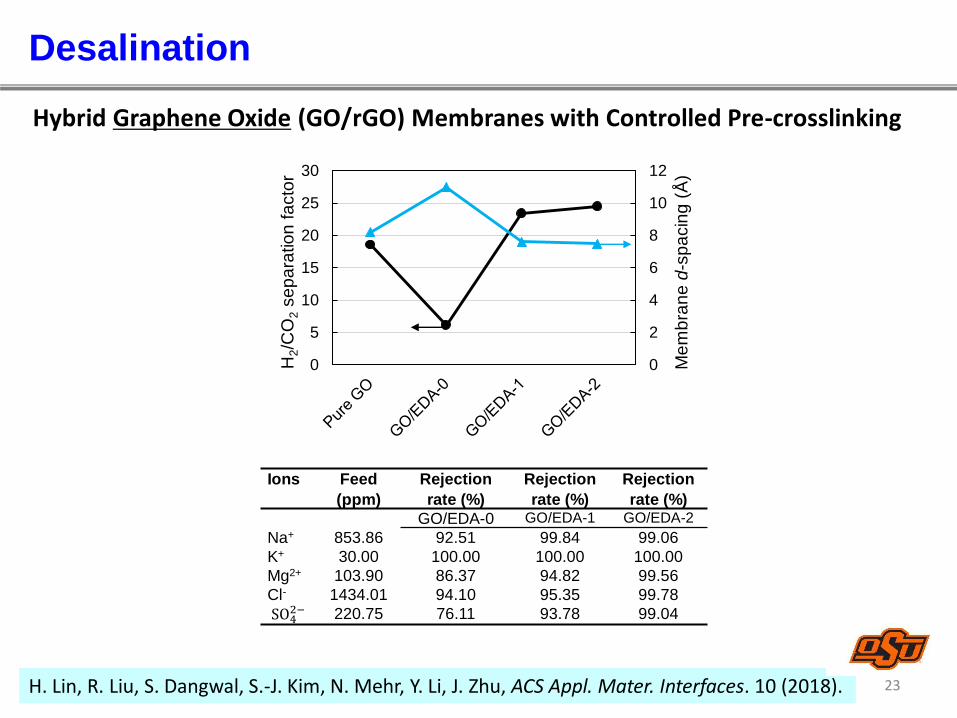
Ions Feed
(ppm)
Rejection
rate (%)
Rejection
rate (%)
Rejection
rate (%)
GO/EDA-0 GO/EDA-1 GO/EDA-2
Na+ 853.86 92.51 99.84 99.06
K+ 30.00 100.00 100.00 100.00
Mg2+ 103.90 86.37 94.82 99.56
Cl- 1434.01 94.10 95.35 99.78
SO42− 220.75 76.11 93.78 99.04
0
2
4
6
8
10
12
0
5
10
15
20
25
30
Me
mb
ran
e d
-sp
acin
g (
Å)
H2/C
O2
se
pa
ratio
n f
acto
r
H. Lin, R. Liu, S. Dangwal, S.-J. Kim, N. Mehr, Y. Li, J. Zhu, ACS Appl. Mater. Interfaces. 10 (2018).
Hybrid Graphene Oxide (GO/rGO) Membranes with Controlled Pre-crosslinking
Desalination
23
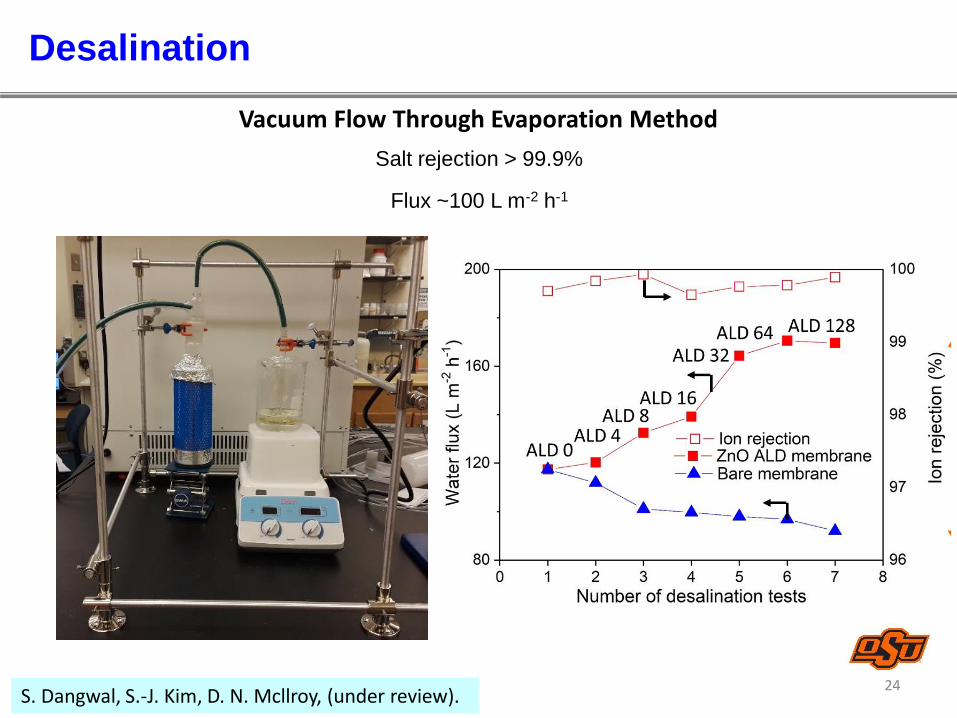
Salt rejection > 99.9%
Flux ~100 L m-2 h-1
S. Dangwal, S.-J. Kim, D. N. Mcllroy, (under review).
Vacuum Flow Through Evaporation Method
Desalination
24

Three-stage-system for PW treatment
Chemical precipitation
Sand filtration
Microfiltration (oil rejection) Desalination (salt rejection)
Flux ~1000 L m-2 h-1 Flux ~100 L m-2 h-1
Preliminary results
25
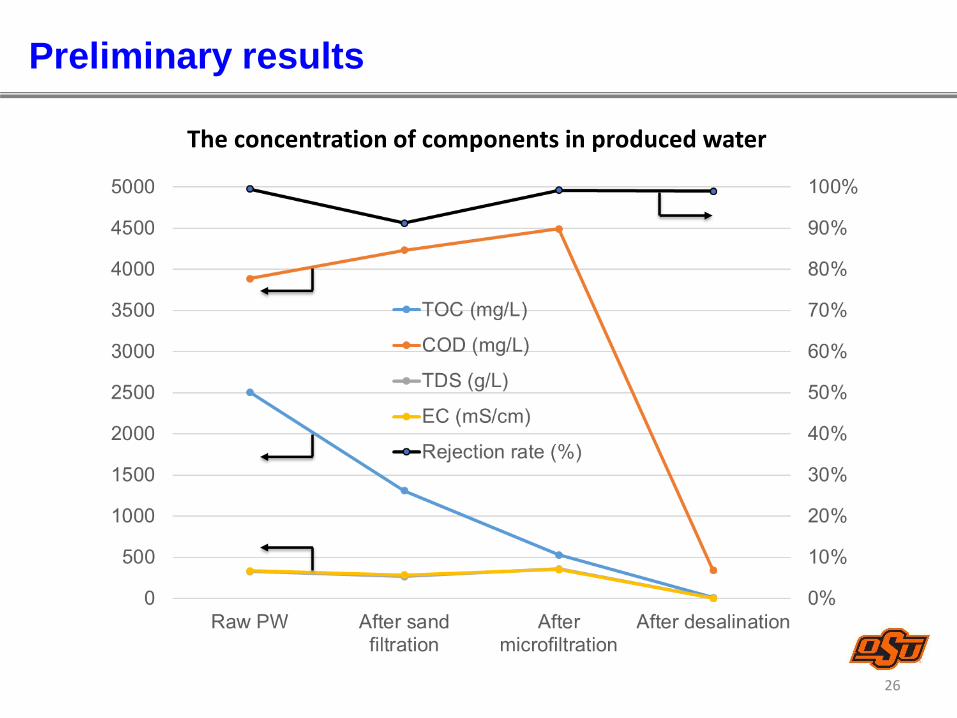
The concentration of components in produced water
Preliminary results
26
27
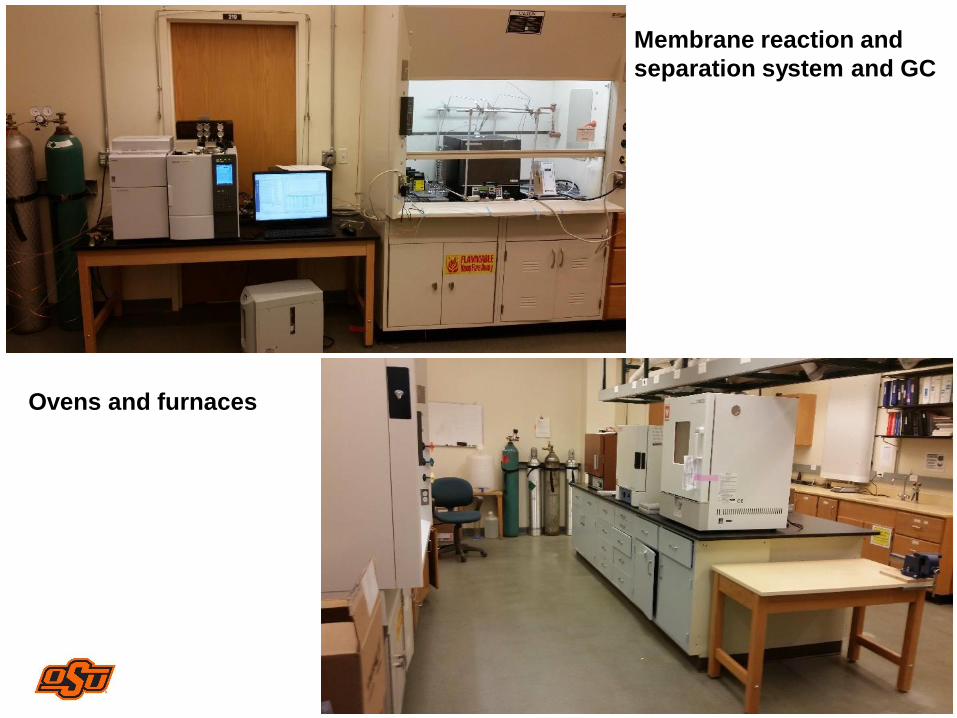
Membrane reaction and
separation system and GC
Ovens and furnaces

Membrane Cells
Disk-type cell
Tube-type cellDisk/Tubular membrane
28
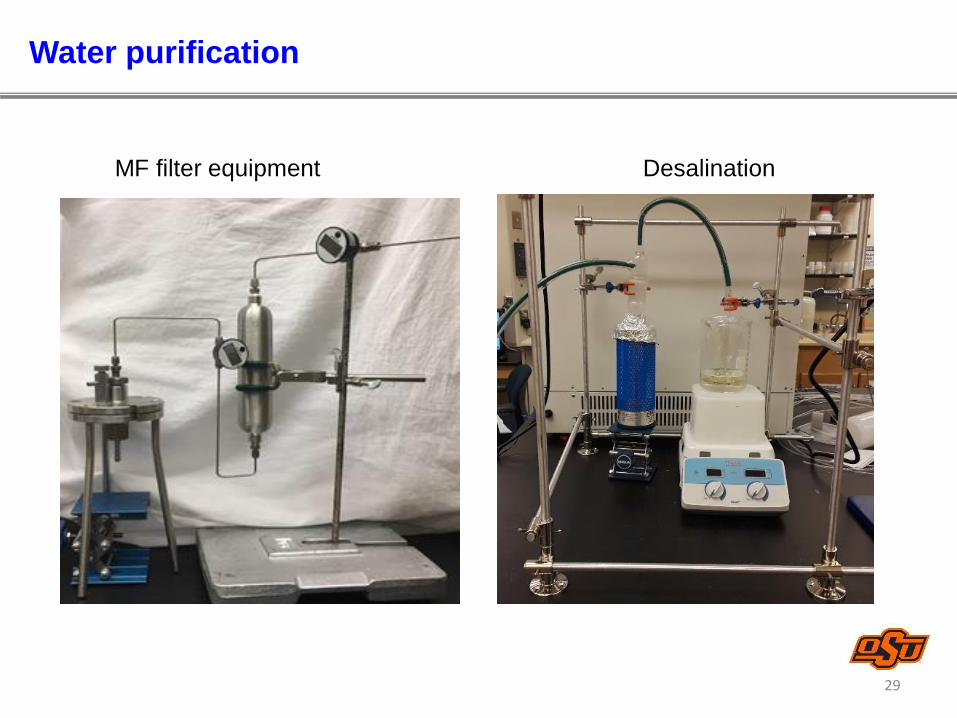
Water purification
Tube-type cellDisk/Tubular membraneMF filter equipment Desalination
29

Thank you!