ino: rantau dedap geothermal power project (phase 2) · ino: rantau dedap geothermal power project...
TRANSCRIPT

Draft Environmental and Social Impact Assessment Report (ESIA)
Project Number: 50330-001 February 2017
INO: Rantau Dedap Geothermal Power Project
(Phase 2)
Volume VII: Appendix 13 – Public Consultation (List)
Appendix 14 – Dispersion Modelling of Cooling Tower Plumes at Rantau Dedap
Geothermal Power Plant
Prepared by ESC for the Asian Development Bank The environmental and social impact assessment is a document of the project sponsor. The views expressed herein do not necessarily represent those of ADB’s Board of Directors, Management, or staff, and may be preliminary in nature. Your attention is directed to the “Terms of Use” section of this website. In preparing any country program or strategy, financing any project, or by making any designation of or reference to a particular territory or geographic area in this document, the Asian Development Bank does not intend to make any judgments as to the legal or other status of or any territory or area.


Dispersion Modelling of CoolingTower Plumes at Rantau DedapGeothermal Power Plant
Air Dispersion Modelling Report
Prepared for:Supreme Energy Rantau DedapMenara Sentraya 23rd Fl, Jl. Iskandarsyah No 1A, Jakarta 12160Telp. +6221 2788 2222. Faks. +6221 2788 2333
Agustus, 2016JKTD15040Rantau Dedap Geothermal Project

Air Dispersion Modelling Report Supreme Energy Rantau Dedap
2 AECOM
Quality information
Document name Ref Prepared for Prepared by Date
Air Dispersion Modeling Report JKTD15040 Supreme Energy Rantau Dedap
Muhamad Nizar 8/26/2016
Stage of Checking Position Name Signature Date
Review 1 Technical Director - Air Quality
Andrew Curtis 8/23/2016
Final Review Principal Engineer – Energy
Blair Murray (Project Manager)
9/02/2016
Revision history
Revision Revision date Details Name Position
00 08/26/2016 DRAFT issued for Client Review
Andrew Sembel Manager, Environment
01 09/02/2016 Revised for Client Comment
Andrew Sembel Manager, Environment
02 09/08/2016 Final Issue Andrew Sembel Manager, Environment
03 27/09/2016
Revised Final – New Accomodation Block Location
Andrew Sembel Manager, Environment
This document has been prepared by AECOM Limited for the sole use of our client (the “Client”) and in accordance with generally accepted consultancy principles, the budget for fees and the terms of reference agreed between AECOM Limited and the Client. Any information provided by third parties and referred to herein has not been checked or verified by AECOM Limited, unless otherwise expressly stated in the document. No third party may rely upon this document without the prior and express written agreement of AECOM Limited.

Table of Contents
1 Introduction ............................................................................................................................................ 5
1.1 Background ....................................................................................................................................... 5
1.2 Purpose of This Report ...................................................................................................................... 5
1.3 Project Scope .................................................................................................................................... 5
2 Project Outline ....................................................................................................................................... 7
3 Assessment Criteria ............................................................................................................................... 9
3.1 Emission Standards .......................................................................................................................... 9
3.2 Ambient Standards ............................................................................................................................ 9
4 Emission Inventory ................................................................................................................................11
5 Methodology .........................................................................................................................................13
5.1 Dispersion Model .............................................................................................................................13
5.2 Model Input Determination................................................................................................................14
5.2.1 Source Parameters ............................................................................................................14
5.2.2 Upset Conditions ................................................................................................................14
5.2.3 Building Downwash Investigation .......................................................................................14
5.2.4 Meteorological Conditions ..................................................................................................15
5.2.5 Modelling Domain and Representative Receptor Network ..................................................16
5.2.6 Sensitive Receptors ...........................................................................................................16
5.2.7 Topography........................................................................................................................16
5.2.8 Land Use ...........................................................................................................................17
6 Baseline Condition ................................................................................................................................20
7 Modelling Results..................................................................................................................................22
7.1 24-Hour Average Incremental Hydrogen Sulphide ............................................................................22
7.2 8-Hour Average Incremental Hydrogen Sulphide ..............................................................................23
8 Conclusion ............................................................................................................................................29
9 References ...........................................................................................................................................31

Air Dispersion Modelling Report Supreme Energy Rantau Dedap
2 AECOM
List of Tables
Table 4-1 Calculated H2S Emission Rate and Other Selected Parameters.....................................................11
Table 5-1 Summary of CALMET and CALPUFF Input Parameters ................................................................13
Table 5-2 Source Parameters for Individual Cells of Cooling Tower ...............................................................14
Table 5-3 Parameters for Buildings Investigated for Downwash Effect ...........................................................15
Table 6-1 Baseline 1-Hr Average H2S Concentrations ...................................................................................20
Table 7-1 Frequency Distribution of 24-hour Average H2S Concentrations at R54 .........................................22
Table 7-2 Maximum 8-Hr Average H2S Concentrations (µg/m3) at Representative Worker Receptors (Sorted
by The Highest) ............................................................................................................................................23
List of Figures
Figure 5-1 Wind Rose Based on Forecast Data from Lakes Environmental (Period of January 1, 2013 - 31
December 2015) ...........................................................................................................................................16
Figure 5-2 Topography Map of Study Area ....................................................................................................18
Figure 7-1 Predicted Incremental 24-hour Concentrations of H2S (µg/m3) overlaid on Forestry Map ..............24
Figure 7-2 Predicted Incremental 24-hour Concentrations of H2S (µg/m3) overlaid on Satellite Imagery ........25
Figure 7-3 Predicted Incremental 8-hour Concentrations of H2S (µg/m3) overlaid on Forestry Map ................26
Figure 7-4 Predicted Incremental 8-hour Concentrations of H2S (µg/m3) overlaid on Satellite Imagery..........27
Appendices
Appendix A Comparison between SERD Observation Meteorological Data and Calmet Simulation
Appendix B Calculation of H2S Emission from Cooling Tower
Appendix C Index of Sensitive Receptors
Appendix D SERD Well Field Assumptions
Appendix E Preliminary Power Plant Layouts
Appendix F Calpost List File

Supreme Energy Rantau Dedap Air Dispersion Modelling Report
AECOM 3
Limitations
AECOM Indonesia (hereafter referred to as AECOM) has prepared this report for the sole use of the client identified on the cover sheet. Neither AECOM nor
its parent corporation, or its affiliates, (a) makes any warranty, expressed or implied, with respect to the use of any information or methods disclosed in this
document or (b) assumes any liability with respect to the use of any information or methods disclosed in this document. Any recipient of this document, by
their acceptance or use of this document, releases AECOM, its parent corporation, and its and their affiliates from any liability for direct, indirect,
consequential or special loss or damage whether arising in contract, warranty, express or implied, tort or otherwise, and irrespective of fault, negligence and
strict liability.
Given the short timeframe of the study and the reliance on public data only, a comprehensive risk assessment and detailed forecasting could not be carried
out and the projections contained in this document are therefore only indicative.
AECOM undertakes no duty to, nor accepts any responsibility to, any other party who may rely upon such information unless otherwise agreed or consented
to by in writing (including, without limitation, in the form of a reliance letter) herein or in a separate document. Any party who is entitled to rely on this
document may do so only on the document in its entirety and not on any excerpt or summary. Entitlement to rely upon this document is conditional upon the
entitled party accepting full responsibility and not holding AECOM liable in any way for any impacts on the Report or the earnings from the Business arising
from changes in "external" factors such as changes in government policy, in the pricing of fuels, road pricing generally, alternate modes of transport or
construction of other means of transport, the behavior of competitors or changes in the owner's policy affecting the operation of the project.
AECOM devoted normal professional efforts compatible with the time and budget available in the review process. AECOM’s findings represent its reasonable
judgments within the time and budget context of its commission and utilizing the information available to it at the time.
This document may include “forward-looking statements”. These statements relate to AECOM’s expectations, beliefs, intentions or strategies regarding the
future. These statements may be identified by the use of words like “anticipate,” “believe,” “estimate,” “expect,” “intend,” “may”, “plan,” “project,” “will,”
“should,” “seek,” and similar expressions. The forward-looking statements reflect AECOM’s views and assumptions with respect to future events as of the
date of this report and are subject to future economic conditions, and other risks and uncertainties. Actual and future results and trends could differ materially
from those set forth in such statements due to various factors, including, without limitation, those discussed in this report. These factors are beyond AECOM’s
ability to control or predict.
COPYRIGHT
©This report is the copyright of AECOM. Any
unauthorised reproduction or usage by any person
other than the addressee is strictly prohibited.

Air Dispersion Modelling Report Supreme Energy Rantau Dedap
4 AECOM
INTRODUCTION
01

Supreme Energy Rantau Dedap Air Dispersion Modelling Report
AECOM 5
1 Introduction
1.1 Background
PT. Supreme Energy Rantau Dedap (SERD) is the operation company established by the Joint Venture of
Supreme Energy, Engie and Marubeni with the concession for Rantau Dedap awarded in early December
2010. SERD have got the price approval and assignment from the Indonesia Minister of Energy and Mineral
Resources through assignment letter No. 5834/26/MEM.L/2011 September 30, 2011, to develop the
geothermal field and power plant in Rantau Dedap. The Rantau Dedap geothermal prospect is located in the
Muara Enim, Lahat and Pagar Alam Regencies of South Sumatra, approximately 225 km from Palembang.
AECOM has been commissioned by SERD to prepare Air Dispersion Modelling (ADM) to demonstrate
compliance with applicable standards. This report therefore provides an assessment of the air quality impact
associated with the power plant operation.
The primary air emissions of concern with regards to odour nuisance and health effects from the power plant
will be the non-condensable gases (NCG). NCG are gases that are present with range of 0.09-1.6 wt% in the
geothermal fluid but are removed during the electricity generation process. The NCG consist predominantly of
carbon dioxide (approximately 97%), but also contains hydrogen sulphide (H2S). The NCG will be released
from vents located above the mechanical evaporative cooling towers.
1.2 Purpose of This Report
The purpose of this report is to conduct an ADM using air dispersion modelling to predict potential H2S
impacts at nearby sensitive receptors from emissions associated with the geothermal power plant operation.
This report has been undertaken in accordance with the British Columbia Air Quality Dispersion Modelling
guidance (BC Ministry of Environment, 2015).
1.3 Project ScopeThe ADM for the proposed SERD power plant was based on the air dispersion model Calpuff and assessed
the contribution to air quality impacts at nearby sensitive receptors from the power plant. In summary, the
report provides information on the following:
- A description of the proposed power plant development;
- Identification of relevant air quality criteria;
- Identifies nearby sensitive receivers which may be impacted by emissions from proposed development.
- A description of the modelling methodology including input parameters including meteorology, terrain and
air emissions.
- An assessesment the air quality impact of power plant operations against the relevant ambient air quality
criteria;
- A discussion of the potential impacts and recommendations.

Air Dispersion Modelling Report Supreme Energy Rantau Dedap
6 AECOM
PROJECT OUTLINE
02

Supreme Energy Rantau Dedap Air Dispersion Modelling Report
AECOM 7
2 Project Outline
The Rantau Dedap geothermal prospect is located in the Muara Enim, Lahat and Pagar Alam Regencies of
South Sumatra, approximately 225 km from Palembang. The contract area covers approximately 35,440 ha
(18.56 km x 19.63 km) and is situated at an elevation ranging from 1,000 to 2,600 metres (m) on the Bukit
Besar volcanic complex, in which the existence of the geothermal system is indicated by a wide distribution of
thermal manifestations, particularly on the flank of it.
SERD is currently undertaking exploratory drilling to investigate the geothermal resource and now intend to
undertake the development of the geothermal power project through to commercial operation of a geothermal
power plant comprising two units of approximately 46 MW each.
The power plant will use dual pressure condensing steam turbine technology. The steam turbine plant
includes 2 x 46 MWe (nominal-gross) condensing steam turbine generators, each with a dual steam inlet. The
geothermal fluid is first flashed and separated into high pressure steam and geothermal water components at
a specific pressure. The geothermal water is also flashed to produce an additional low pressure steam flow.
The separated steam flows are then admitted to steam turbine to drive electricity generators.
After passing through the turbines, the steam is condensed using direct-contact condensers. In direct-contact
condensers the cooling water from the cooling tower is sprayed directly into the condenser, mixing with and
condensing the incoming exhaust steam. The heated water from the condensers is then cooled in a cooling
tower.
Non-condensable gases, which occur naturally in the geothermal steam, are extracted from the steam side of
the condenser and piped to the cooling tower for discharge in the cooling tower plume. In direct-contact
condensers, a portion of the non-condensable gases is dissolved into the cooling water, while the remainder is
extracted and piped to the cooling tower.
The cooling towers for the plant will be induced mechanical-draft, counter flow types. Each cooling tower will
consist of five (5) fan cells arranged in a straight line. The dimension of each tower is 80 m long and 16 m
wide, with height of 15 m above base level.

Air Dispersion Modelling Report Supreme Energy Rantau Dedap
8 AECOM
ASSESSMENT CRITERIA
03

Supreme Energy Rantau Dedap Air Dispersion Modelling Report
AECOM 9
3 Assessment Criteria
Emission concentrations of the H2S from the power plant will be compared against the applicable emission
standard and for incremental concentrations of H2S in the ambient air predicted by Calpuff will added to the
baseline and compared with ambient air quality standards. These are criteria for assessment in this study.
They are intended to minimise the adverse effects of airborne pollutants on sensitive receivers.
3.1 Emission StandardsThe State Minister of Environment of the Republic of Indonesia has set Regulation No 21 of 2008 (MENLH,
2008) that stipulate emission standards for stationary sources in thermal power plants including geothermal
power plant. In this Regulation, the H2S emission standard was set to 35 mg/m3 at normal conditions
(temperature of 25°C and pressure of one atmosphere).
The IFC EHS Guideline for Geothermal Power Generation (IFC, 2007) which has been used, as a reference
for international guideline, did not establish an emission standard for H2S. This was because IFC did not
consider the H2S emission from a geothermal power plant is significant. However in the Guideline IFC
recommended that H2S emission “should not result in ambient concentrations above nationally established air
quality standards or, in their absence, internationally recognized guidelines”.
For this study, the H2S emission has been compared against the Indonesia Emission Standard as mentioned
above.
3.2 Ambient StandardsIn Indonesia, H2S concentration in the ambient air was regulated in the Minister of Environmental Decree No
50 of 1996 regarding Odor Standard (MENLH, 1996). Thus H2S was considered as an odor. The ambient
standard for this gas stipulated in this regulation is 0.02 ppm or equivalent to 28 µg/m3. The regulation did not
mention what the averaging period for the the standard should be. However, since it is for ambient standard, it
is believed it is for 24 hour average.
The ambient standard is applicable for residential and general areas only. For industrial areas, another
standard is applicable. In 2011, the Minister of Employment and Transmigration of The Republic of Indonesia
set forth Regulation Number PER.13/MEN/X/2011 regarding Threshold Values for Physical and Chemical
Factors in the Working Environment (MENAKERTRANS, 2011). In this regulation, the H2S threshold value is 1
ppm which is equivalent to 1,400 µg/m3. This value should be measured for eight hour averaging time which is
normal working duration for a worker.
As international standard for ambient H2S, WHO’s Air Quality Guidelines for Europe (WHO, 2000) was
referred to. Here WHO gave concentration of 150 µg/m3 in a 24 hours average time as guideline for ambient
H2S. Furthermore in order to avoid any substantial complaints on the possible generated odor among the
exposed population WHO adds a guideline value of 7 µg/m3 in 30 minute period of time.
However, as quoted in the Kawerau Geothermal power plant Air Discharge Assessment (Fisher &
Heydenrych, 2005), the guideline of 7 µg/m3 for one hour average is not appropriate for geothermal areas for
odor effect. In this report, Fisher & Heydenrych quoted several studies that all assumed 70 µg/m3 was more
appropriate guideline for geothermal power stations in regions affected by natural geothermal emissions.
Furthermore they explained for populations that have been adapted to the smell of hydrogen sulphide, 70
µg/m3 is unlikely to produce complaint. In contrary, for populations that do not experience high natural levels
of emissions, levels of above 7 µg/m3 are likely to be noticed.
The 70 µg/m3 for one hour average more or less will give the result of 28 µg/m
3 for 24 hour average.
Therefore it is equivalent to the Indonesia Odor Standard as explained above. For study in this report, the 28
µg/m3 for 24 hour average is used as assessment criteria for H2S ambient concentration.

Air Dispersion Modelling Report Supreme Energy Rantau Dedap
10 AECOM
EMISSION INVENTORY
04

Supreme Energy Rantau Dedap Air Dispersion Modelling Report
AECOM 11
4 Emission Inventory
SERD is proposing that its H2S emission to meet the emission quality standard from the Government of
Indonesia as discussed in Section 3.1. For the purpose of estimating the emission, it is assumed that a
steady-state condition. The H2S will be emitted together with other NCG from vents located above the
mechanical evaporative cooling towers.
The SERD geothermal power plant will have two identical units of cooling tower. Each unit will consist of 5
fans. For the purpose of the dispersion modelling with Calpuff, emission rates need to be calculated in units of
grams per second (g/s) at the point of emission. Based on the NCG content in the steam and H2S content in
the NCG supplied by SERD (Appendix D), the H2S emission was calculated 13.25 g/s. With this rate, the
emission concentration at normal condition was estimated 30 mg/m3, still well below the Indonesian Emission
Standard of 35 mg/m3.
For the purpose of modelling, high gas case is used for the calculation. In this case, NCG contents are 1.6%
in HP steam and 1.15% in LP steam. As for H2S concentration content is 5%for both steams. Detailed
calculations of H2S emission are provided in Appendix B. Summary of the calculated emission and other
selected parameters are presented in Table 4-1.
Table 4-1 Calculated H2S Emission Rate and Other Selected Parameters
Item Value Unit
NCG content in HP steam 1.6 % weight
NCG content in LP steam 1.15 % weight
H2S content in HP and LP
Steam5
% weight
Temperature of exit airflow 305.15 K
Pressure of exit airflow 0.8 bar
Specific volume of exit airflow 1.14 m3/kg
Mass flowrate of exit air 507.5 kg/s
Volume of exit airflow at
normal condition (25°C)449 m
3/s
H2S concentration at normal
condition30 mg/m
3
H2S mass flowrate 13.25 g/s
Note: All calculations represent one cooling tower cell (i.e. one fan)

Air Dispersion Modelling Report Supreme Energy Rantau Dedap
12 AECOM
METHODOLOGY
05

Supreme Energy Rantau Dedap Air Dispersion Modelling Report
AECOM 13
5 Methodology
5.1 Dispersion ModelThis assessment made use of CALMET meteorological processor and the CALPUFF dispersion model (BC
Ministry of Environment, 2015). A summary of the data and parameters used for both the meteorological and
air dispersion modelling is presented Table 5-1.
CALMET is a meteorological model that develops hourly wind and temperature fields on a three-dimensional
gridded modelling domain. Associated two-dimensional fields such as mixing height, surface characteristics
and dispersion properties are also included in the file produced by CALMET. CALMET produces a
meteorological file that is used within the CALPUFF model to predict the movement of air pollution.
CALPUFF is a non-steady state, three-dimensional Gaussian puff model developed for the US Environmental
Protection Agency (USEPA) for use in situations where basic Gaussian plume models are not effective. These
situations include areas where stagnation conditions occur, which are characterized by calm or very low wind
speeds with variable wind direction. The CALPUFF modelling system has the ability to model spatially varying
winds and turbulence fields that are important in complex terrain, long range transport and near calm
conditions. As such, CALPUFF was selected as the appropriate dispersion model for this assessment.
Table 5-1 Summary of CALMET and CALPUFF Input Parameters
Parameter Input
CALMET (v6.334)
Meteorological grid domain 12 km x 12 km
Meteorological grid resolution 500 m resolution (24 x 24 grid cells)
Reference grid coordinate of
southwest corner314.852 E, 9529.081 S (Zone: 48)
Cell face heights in vertical grid 0, 20, 40, 80, 160, 300, 600, 1000, 1500, 2200 and 3000 m
Simulation length 3 years (2013-2015)
Surface meteorological stations CALMET No-Obs Mode: CALMET used Numerical Weather
Prediction model outputs.
Upper air meteorological station No upper air stations. The 3-dimensional gridded prognostic data
were used as the initial guess wind-field for CALMET.
Terrain data Terrain elevations were extracted from the NASA ASTER dataset
(ASTER 30 metre, 1-arc sec). Elevations at power plant site were
modified using final elevations data.
Land use data Generic land use based on data from Indonesia Department of
Forestry.
CALPUFF (v6.42)
Modelling domain Computation grid: 12 km x 12 km
Modelling grid resolution for mapping
purpose
Grid resolution: 500 m
Number of discrete receptors A total of 89 discrete receptors were added surrounding the plant.
Dispersion algorithm Turbulence-based coefficients

Air Dispersion Modelling Report Supreme Energy Rantau Dedap
14 AECOM
Parameter Input
Hours modelled 26,280 hours
Meteorological modelling period 1 January 2013 – 31 December 2015
5.2 Model Input Determination
5.2.1 Source Parameters
For cooling towers, the individual cells were modelled as point sources, mimicking individual stack emission
points. The total emissions from the cooling tower cells were divided equally between each individual cell. The
stack parameters used for modeling inputs were based on the characteristics of the cooling tower fan, which is
assumed to behave like a “stack”.
The vertical velocity was determined by the fan rate (fan blows air at a certain flow rate). The exit diameter
was determined by the cross-sectional area of the cooling tower. The stack height would be the actual height
of the cooling tower. Summary of the source parameters for individual cells of SERD Cooling Tower is
provided in Table 5-2.
Table 5-2 Source Parameters for Individual Cells of Cooling Tower
Specification Unit Value
Stack height m 15
Stack outlet diameter m 10
Stack volumetric flowrate m3/s 580
Stack exit velocity m 7.4
Flue gas temperatureoC 32
Source: Supreme Energy Rantau Dedap, 2016
5.2.2 Upset Conditions
As stated in the Original ESIA, upset conditions at the SERD Geothermal Power Plant have not been
assessed separately as this operating scenario is considered to represent a lower quality impact than normal
operation.
5.2.3 Building Downwash Investigation
The term building downwash is defined as the effect caused by the aerodynamic turbulence induced by a
nearby building that may result in high ground-level concentrations in the vicinity of a stack (USEPA, 1992).
Thus, the possibility of downwash influences should be investigated.
The effect of building downwash on pollutant dispersion from cooling tower was incorporated in the dispersion
model using the PRIME building wake algorithm. Building Profile Input Program for PRIME (BPIPPRM) was
used to prepare downwash related input for the PRIME algorithm. BPIPPRM can determine whether a point
source is subjected to wake effects from a structure(s), and calculate building heights and projected building
widths for cases when the plume is affected by building wakes. Table 5-3 summarizes parameters for
buildings investigated for downwash effect based on power plant layout (Appendix E).

Supreme Energy Rantau Dedap Air Dispersion Modelling Report
AECOM 15
Table 5-3 Parameters for Buildings Investigated for Downwash Effect
Notation Cooling Towera
Turbine Hall
Building length (m) 80b
48b
Building width (m) 16b
37b
Building height above base elevation
(m)15 13
c
Building base elevation (m) 1960 1960c
Notes:
a. Parameters for cooling tower are for one of two identical tower units.b. Building length and width are calculated based on building corner coordinates input into the BPIPPRIME
model.c. The turbine building height is input into the model 2 m lower than its actual height considering that the
actual turbine building base elevation is 2 m lower than the cooling tower base elevation. Structuresmodelled at single elevation to avoid complex terrain model set up.
From the building investigations above, it can be concluded that all buildings are within stack influence areas
and they will induce building downwash. As the result, building downwash algorithm is included in Calpuff
input files for this study.
5.2.4 Meteorological Conditions
Meteorological conditions determine the direction of movement and dispersion of emissions carried by the
wind. Key meteorological parameters include air temperature, wind direction, wind speed, and mixing height.
Ideally, this data can be obtained from the nearest meteorological station of the study area. For modeling
purposes, the data that is needed is for each one hour interval within a period of three years for each of the
key parameters. In Indonesia, this kind of hourly data is not available in all existing meteorological stations.
In 2012 SERD installed a weather station at the project site warehouse. The station has made hourly
meteorological observation since February 2012 until now. Parameters observed are wind speed, wind
direction, temperature, relative humidity, barometric pressure, rainfall, and evaporation. The weather station is
located in 5 km distance from the planned power location. Further data evaluation from this station showed
that there is high percentage of missing hours. Therefore the weather station data cannot be used to be
accurate for the modelling purposes and data from a meteorological institute is to be obtained.
The forecast meteorological data was then obtained from Lakes Environmental. Lakes Environmental is a
company based in Ontario, Canada which provides meteorological modelling for dispersion modelling purpose
for any location in the world. For this purpose, Lakes Environmental utilizes WRF (Weather Research
Forecasting) model from NCAR (National Center for Atmospheric Research), which is a research and
development institute in field of atmosphere in the United States. For this study, meteorological data from
Lakes Environmental was obtained for period from January 1, 2013 to December 31, 2015 (three years) with
one hour data interval. These data sets were pre-processed with Calmet, the meteorological data pre-
processor for Calpuff.
Based on data from the Lakes Environmental, the wind directions at the project site are very scattered. This
shows that the wind in the area surrounding the project site is highly affected by terrain. West Southwest
direction only dominates with frequency of 13.5%. Yet, the frequency of the wind from the opposite direction is
less than 2% different i.e. 11.9%. Third dominant wind comes from the South Southeast with frequency of
11.5%. Number of calm winds is only 1.5%. The average wind speed is 1.68 m/s. The resultant wind rose is
presented in Figure 5-1.
A comparison of the CALMET processed meteorological data with climate data collected from the SERD
meteorological station is located in Appendix A.

Air Dispersion Modelling Report Supreme Energy Rantau Dedap
16 AECOM
Figure 5-1 Wind Rose Based on Forecast Data from Lakes Environmental (Period of January 1, 2013 -31 December 2015)
5.2.5 Modelling Domain and Representative Receptor Network
For this study, dispersion is modelled over 12 km x 12 km domain with the power plant cooling tower is in the
centre. This domain is considered to have covered all settlements closest to the study area.
For the purpose of input into Calpuff, receptor points are modelled in the form of representative receptor
networks. The distribution of concentrations will be calculated based on this receptor network. In this model,
the representative receptor is modelled as an arbitrary polar network with power plant cooling tower as its
centre point. In this network, the receptor points are placed at 500 m x 500 m grid. This will generate 576
representative receptor points.
5.2.6 Sensitive Receptors
The impact of air emissions on sensitive members of the population is of particular concern. Sensitive
receptors include areas such as residences, schools, mosques, churches, marketplaces, clinics, etc. They are
selected by identifying rooftops from Google Earth Satellite Imagery and field survey undertaken by SERD.
Using this approach, 81 sensitive receptors were selected. For assessing health impact of H2S to the workers,
eight random locations representing workers inside the plant were added to the sensitive receptors. A
complete list of sensitive receptors is provided in Appendix C.
5.2.7 Topography
Topography affects the distribution of pollutant concentrations at certain points. Therefore topographic data
needs to be entered into the Calpuff model. For this study topographical data were captured from ASTER
GDEM. For Indonesia, terrain data are available at approximately 30 m resolution (1-arc seconds).
However since the elevation of the power plant site will be changed because of cut and fills works, final
elevation of the site from the design data were incorporated into the Aster GDEM data. The combined data
were then processed with ArcGIS software to obtain new elevation data in XYZ. Topography map of the
modelling domain is provided as Figure 5-2.

Supreme Energy Rantau Dedap Air Dispersion Modelling Report
AECOM 17
The immediate elevations surrounding the power plant vary between 1,905 m to 1,965 m. In the wider context
of the study area, the elevations are lower to the north and higher to the south with the highest points at the
southwest area.
5.2.8 Land Use
The latest land use data for the modeling domain were taken from the Department of Forestry. In order to use
this data for the model, it was first converted into a generic xyz file. The procedure for creating this xyz file
available in the BC Air Quality Modeling Guideline is followed. For simplicity, the land use types from the
Indonesian Department of Forestry were changed into equivalent BC types. The result file was then
processed using CTGPROG which is the land use processor of Calpuff.
From the processed data, the land use within the modeling domain only consists of protected forest,
agriculture of coffee plantation and bush areas. The protected forest is classified as forest area by the
CTGPROG as for the coffee plantation is classified by agriculture area. The forest area dominates the
modelling domain with more than 50% of coverage. Bushes are spread from west to north as for agricultures
are scattered at northwest, northeast and east areas.

l
l
l
")")
")")
")")
")
")
")
!A
!A
!A
!A
!A
!AAQ7
AQ6
AQ5
AQ4
AQ3
AQ2
103°24'0"E
103°24'0"E
103°22'0"E
103°22'0"E4°1
2'0
"S
4°1
2'0
"S
4°1
4'0
"S
4°1
4'0
"S
Map Title
Regency
Province
Muara Enim, Lahat, and Pagar Alam City
South Sumatra
Scale Map Information
µ 0.25 0 0.25 0.5 0.75 10.125
Kilometers
Index Location
Legend
Provided by
Data Sources
1. Client Document2. Modeling results from Calpuff Software
3. Google Earth Imagery Services
Map Information
Datum
Projection
Zone
World Geodetic System 1984
Universal Transverse Mercator
48 South
Unit Meter
TOPOGRAPHY MAP
Administrative Details
Figure
5-2
PT AECOM Indonesia
1:25,000Scale on A3 Paper
Drawn
Checked
: RAP Date
: MN
: 27 Sept '16
Project ID : JKTD15040
105°0'0"E
105°0'0"E
100°0'0"E
100°0'0"E
95°0'0"E
95°0'0"E
5°0
'0"N
5°0
'0"N
0°0
'0"
0°0
'0"
5°0
'0"S
5°0
'0"S
!AAir QualitySampling Location
Receptor
l Coffee Farmer Hut
#* Household
ö Mosque
") Worker
Road and Wellpad
Regency Boundary
Elevation (m)
895 - 1,200
1,200 - 1,300
1,300 - 1,400
1,400 - 1,500
1,500 - 1,600
1,600 - 1,800
1,800 - 2,000
2,000 - 2,200
2,200 - 2,500
2,500 - 2,722
CLIENT
PT Supreme Energy Rantau DedapLAHAT REGENCY
PAGAR ALAM REGENCY
MUARA ENIM REGENCY
Supreme Energy Rantau Dedap Air Dispersion Modelling Report
AECOM 19
BASELINE CONDITION
06

Air Dispersion Modelling Report Supreme Energy Rantau Dedap
20 AECOM
6 Baseline Condition
Existing H2S concentrations (baseline) are vital to the assessment of the potential impact from the proposed
power plant. Baseline data are added to the predicted incremental concentrations to assess the cumulative
impacts likely from the site.
The baseline measurement was carried out on 21 – 22 July 2016. The measurement was carried out only for
one hour period at eight sampling points (AQ1 – AQ8). Results of the measurement are presented in Table
6-1.
Table 6-1 Baseline 1-Hr Average H2S Concentrations
Sampling Location
Concentration (µg/m
3)
Notes on Location
AQ1 < 2.24 Kampung Yayasan
AQ2 < 2.24 Between Wellpad X, L, M and N
AQ3 8.40 Area of Wellpad I
AQ4 7.00 Area of Wellpad C
AQ5 < 2.24 Area of Wellpad E
AQ6 < 2.24 A hut Belongs to Mr. Rawadi
AQ7 5.60 Area of Wellpad B
AQ8 < 2.24 Tunggul Bute Village
Note: 2.24 µg/m3 is limit of detection Source: Baseline study, SERD, 2016
AQ1, AQ6 and AQ8 are at residential areas and the others are at wellpad areas. It can be seen that H2S
concentrations were not detected at the residential areas. Higher H2S concentrations were detected at
wellpad areas with 8.4 µg/m3 as the highest at wellpad I. It can also be seen that the baseline one hour
average concentrations of H2S in the project area are still well below the one hour odor standard of 70 µg/m3.
With very low one-hour baseline H2S, the 24 hour baseline concentrations are believed to be negligible.
Therefore in this study baseline 24 hour concentrations are not added to the incremental concentrations
predicted by the Calpuff.

Supreme Energy Rantau Dedap Air Dispersion Modelling Report
AECOM 21
MODELLING RESULTS
07

Air Dispersion Modelling Report Supreme Energy Rantau Dedap
22 AECOM
7 Modelling Results
This section presents the dispersion modelling results for the proposed power plant based on expected
emission rates as described in Table 4-1 to assess the typical or expected emissions from the proposed
power plant. The model predicted concentrations are rounded to one significant value. As such,
concentrations of 28.0 to 28.4 µg/m3 would not exceed the standard 28 µg/m3 as those concentrations would
round to 28 µg/m3.
7.1 24-Hour Average Incremental Hydrogen Sulphide The 24-hour average predictions discussed in this section have been undertaken to assess the potential odor
nuisance effects, as opposed to the odor standard.
Figure 7-1 shows the predicted 24-hour average hydrogen sulphide concentration within 12km x 12km domain
for the expected total hydrogen sulphide emission rate of 133 g/s. Figure 7-2 shows the predicted
concentrations within smaller domain (3km x 3km). These figures were made based on spatial interpolation of
predicted concentrations at gridded receptors. The interpretation of these figures is as follows:
The red contour line corresponds to the guideline of 28 µg/m3 used to assess potential odour nuisance
impact, as discussed in Section 3.2. The 28 µg/m3 concentration contour remains to the east and south
of the plant.
The purple triangles show the locations of existing households based on satellite/field survey
identification.
The brown tree symbols represent coffee farmer huts at coffee plantation.
The black square symbols represent worker receptors inside the proposed power plant’s perimeter fence. The highest concentration contour (dark orange) shows the areas within which predicted incremental
concentrations exceed 400 µg/m3. The next two contours show the extent of the areas within which
predicted concentrations exceed 300 µg/m3 and 200 µg/m
3. Predicted incremental concentrations
exceeding 400 µg/m3 are confined within the power plant’s perimeter and will be considered in the OSHA
of the O&M plan.
The permanent accommodation facilities (sensitive receptor R90) are located more than 1.5 km to the
east of the power plant (emmissions source) and outside the 28 µg/m3
concentration contour. The
predicted maximum concentration at this location is 22 µg/m3.
Based on Calpuff calculations at discrete receptors (at this case the identified sensitive receptors), the
exceedance of the 24-hour incremental concentrations only occurs at one coffee farmer hut i.e. R54 located
approximately 1.5 km to the east of the power plant. The predicted maximum concentration at this receptor is
30 µg/m3. The maximum incremental concentrations predicted at the other sensitive receptors are in the range
5-28 µg/m3, or less than or equal to the odor standard.
However based on the spatial interpolation as can be seen from the Figure 7-1, the exceedance will also
occur at R55. This is note actually the case, as based on the Calpuff calculations for the specific receptors,
the maximum concentration at this receptor is 28 µg/m3 (see Appendix F for reference). The discrepancy may
be due to limitation in the spatial interpolation.
Table 7-1 shows frequency distribution of predicted 24-hour average hydrogen sulphide concentrations at R54
within three years period of modelling.
Table 7-1 Frequency Distribution of 24-hour Average H2S Concentrations at R54
Concentration Range* (µg/m
3)
Frequency (days)
Percentage
0-7 932 85.1% 8-14 119 10.9%
15-21 42 3.8% 22-28 1 0.1% >28 1 0.1%
* Concentrations are rounded to one significant value

Supreme Energy Rantau Dedap Air Dispersion Modelling Report
AECOM 23
The hydrogen sulphide emissions from the proposed power plant are predicted to cause the R54 to exceed
the 28 µg/m3 odour standard only one time in three years. The exceedance at R54 is only 0.1% of the time.
Most of the time (>85%) the H2S concentrations at this receptor is ranging from zero to seven µg/m3. Thus the
exceedance frequency can be considered insignificant.
In addition the predicted concentrations are well less than the WHO guideline of 150 µg/m3 and will not result
in any adverse health effects.
7.2 8-Hour Average Incremental Hydrogen Sulphide The 8-hour predictions discussed in this section have been undertaken to assess the potential health related
effects as opposed to the safety standard, in addition to the potential odour nuisance effects.
Figure 7-2 shows the predicted maximum 8-hour average hydrogen sulphide concentrations at eight
representative worker receptors resulting from emissions from the proposed power plant and will be
considered in the OSHA of the O&M plan.
Table 7-2 Maximum 8-Hr Average H2S Concentrations (µg/m3) at Representative Worker Receptors
(Sorted by The Highest)
Receptor Number
Location of Receptor Maximum
Concentration *
86 Near Turbine Hall 1,051
75 Site Access Road 1 696
88 Wellpad Pond Area 689
85 Site Access Road 2 589
87 Wellpad RD-E 536
83 Vent Station 498
84 Separator Station 462
56 Cleared Area (possible temporary
facilities area) 267
90 Accomodation Building 47
* Concentrations are rounded to one significant value
Figure 7-3 shows the predicted 8-hour average hydrogen sulphide concentration contributions for the
proposed power plant. There is no exceedance of the 8-hour incremental concentrations at representative
worker receptors. The highest predicted 8-hr concentration is at receptor number 86 with 1,051 µg/m3, or 75%
of the 1,400 µg/m3 threshold value in the working environment as stipulated in the Regulation of the Minister
of Employment and Transmigration Number PER.13/MEN/X/2011. This receptor is located less than 100
meter from the cooling tower. The incremental concentrations predicted at the other worker receptors are in
the range 47-696 µg/m3, or 3.5-50% of the threshold value.

ö
l
ll
#*#*#*#*#*#*#*#*#*#*#*#*#*#*#*#*#*#*#*#*#*#*#*#*#*#*#*#*#*#*#*#*#*#*#*#*#*#*#*#*#*
#*#*#*#*#* #* #*#* #*#*#*#*#*#*#*#*#*#*#*#*#*#*#*#*#*#*#*#*#*#*#*#*#*#*#*#*#*#*#*#*#*#*#*
#*#*#*#*#*#*#*#*#*#*#*#*#*#*#*#*#*#*#*#*#*#*#*#*#*#*#*#*#*#*#*#*#*#*#*#*#*#*
#*#*#*#*#*#*#*
#*#*#*#*
#*
#*#*#*#*#*#*#*#*#*#*
#*#*#*#*#*#*#*#*#*#*#*#*#*#*#*#*#*#*#*#*#*#*#*#*ö
#*#*#*#*#*#*#*#*#*#*#*#*#*#*#*#*#*#*#*#*#*#*#*#*#*#*#*#*#*#*#*#*#*#*#*#*#*#*#*#*#*#*#*#*#*
#*#*#*#*#*#*#*
")")")")")")
")
")
")
!A
!A
!A
!A
!A
!A
!A
!A
10
15
28
100
150
20
0
300
400
510
28
10
10
10
AQ8
AQ7
AQ6
AQ5
AQ4
AQ3
AQ2
AQ1
103°26'0"E
103°26'0"E
103°24'0"E
103°24'0"E
103°22'0"E
103°22'0"E
103°20'0"E
103°20'0"E4°1
0'0
"S
4°1
0'0
"S
4°1
2'0
"S
4°1
2'0
"S
4°1
4'0
"S
4°1
4'0
"S
Map Title
Regency
Province
Muara Enim, Lahat, and Pagar Alam City
South Sumatra
Scale Map Information
µ 0.5 0 0.5 1 1.5 20.25
Kilometers
Index Location
Legend
Provided by
Data Sources
1. Client Document2. Modeling results from Calpuff Software
3. Google Earth Imagery Services
Map Information
Datum
Projection
Zone
World Geodetic System 1984
Universal Transverse Mercator
48 South
Unit Meter
H2S 24 HOURS
INCREMENTAL CONCENTRATIONAdministrative Details
Figure
7-1
PT AECOM Indonesia
1:50,000Scale on A3 Paper
Drawn
Checked
: RAP Date
: MN
: 27 Sept '16
Project ID : JKTD15040
105°0'0"E
105°0'0"E
100°0'0"E
100°0'0"E
95°0'0"E
95°0'0"E
5°0
'0"N
5°0
'0"N
0°0
'0"
0°0
'0"
5°0
'0"S
5°0
'0"S
!AAir QualitySampling Location
Receptor
l Coffee Farmer Hut
#* Household
ö Mosque
") Worker
Road and Wellpad
Regency Boundary
Forestry Area
H2S Concentration (µg/m3)
10
15
28
100
150
200
300
400
510
CLIENT
PT Supreme Energy Rantau Dedap
LAHAT REGENCY
PAGAR ALAM REGENCY
MUARA ENIM REGENCY
Rantau Dedap
Tunggul Bute
SERDBasecamp
Notes: H2S Threshold (28 µg/m3)
Domain boundaryof forestry dataavailability

ö
l
ll
#*#*#*#*#*#*#*#*#*#*#*#*#*#*#*#*#*#*#*#*#*#*#*#*#*#*#*#*#*#*#*#*#*#*#*#*#*#*#*#*#*
#*#*#*#*#* #* #*#* #*#*#*#*#*#*#*#*#*#*#*#*#*#*#*#*#*#*#*#*#*#*#*#*#*#*#*#*#*#*#*#*#*#*#*
#*#*#*#*#*#*#*#*#*#*#*#*#*#*#*#*#*#*#*#*#*#*#*#*#*#*#*#*#*#*#*#*#*#*#*#*#*#*
#*#*#*#*#*#*#*
#*#*#*#*
#*
#*#*#*#*#*#*#*#*#*#*
#*#*#*#*#*#*#*#*#*#*#*#*#*#*#*#*#*#*#*#*#*#*#*#*ö
#*#*#*#*#*#*#*#*#*#*#*#*#*#*#*#*#*#*#*#*#*#*#*#*#*#*#*#*#*#*#*#*#*#*#*#*#*#*#*#*#*#*#*#*#*
#*#*#*#*#*#*#*
")")")")")")
")
")
")
!A
!A
!A
!A
!A
!A
!A
!A
10
15
28
100
150
20
0
300
400
510
28
10
10
10
AQ8
AQ7
AQ6
AQ5
AQ4
AQ3
AQ2
AQ1
103°26'0"E
103°26'0"E
103°24'0"E
103°24'0"E
103°22'0"E
103°22'0"E
103°20'0"E
103°20'0"E4°1
0'0
"S
4°1
0'0
"S
4°1
2'0
"S
4°1
2'0
"S
4°1
4'0
"S
4°1
4'0
"S
Map Title
Regency
Province
Muara Enim, Lahat, and Pagar Alam City
South Sumatra
Scale Map Information
µ 0.5 0 0.5 1 1.5 20.25
Kilometers
Index Location
Legend
Provided by
Data Sources
1. Client Document2. Modeling results from Calpuff Software
3. Google Earth Imagery Services (Basemap)
Map Information
Datum
Projection
Zone
World Geodetic System 1984
Universal Transverse Mercator
48 South
Unit Meter
H2S 24 HOURS
INCREMENTAL CONCENTRATIONAdministrative Details
Figure
7-2
PT AECOM Indonesia
1:50,000Scale on A3 Paper
Drawn
Checked
: RAP Date
: MN
: 27 Sept '16
Project ID : JKTD15040
105°0'0"E
105°0'0"E
100°0'0"E
100°0'0"E
95°0'0"E
95°0'0"E
5°0
'0"N
5°0
'0"N
0°0
'0"
0°0
'0"
5°0
'0"S
5°0
'0"S
!AAir QualitySampling Location
Receptor
l Coffee Farmer Hut
#* Household
ö Mosque
") Worker
Road and Wellpad
Regency Boundary
H2S Concentration (µg/m3)
10
15
28
100
150
200
300
400
510
CLIENT
PT Supreme Energy Rantau Dedap
LAHAT REGENCY
PAGAR ALAM REGENCY
MUARA ENIM REGENCY
Rantau Dedap
Tunggul Bute
SERDBasecamp
Notes: H2S Threshold (28 µg/m3)

l
l
")")
")
")
")")
")
")
")
!A
!A
!!
!!
!
!!
!!
!
AQ6
AQ5
100
50
200
400
60
0 80
0
1000
100
600
103°24'0"E
103°24'0"E
103°23'0"E
103°23'0"E4°1
2'0
"S
4°1
2'0
"S
4°1
3'0
"S
4°1
3'0
"S
Map Title
Regency
Province
Muara Enim, Lahat, and Pagar Alam City
South Sumatra
Scale Map Information
µ 0.1 0 0.1 0.2 0.3 0.40.05
Kilometers
Index Location
Legend
Provided by
Data Sources
1. Client Document2. Modeling results from Calpuff Software
3. Google Earth Imagery Services
Map Information
Datum
Projection
Zone
World Geodetic System 1984
Universal Transverse Mercator
48 South
Unit Meter
H2S 8 HOURS
INCREMENTAL CONCENTRATIONAdministrative Details
Figure
7-3
PT AECOM Indonesia
1:10,000Scale on A3 Paper
Drawn
Checked
: RAP Date
: MN
: 27 Sept '16
Project ID : JKTD15040
105°0'0"E
105°0'0"E
100°0'0"E
100°0'0"E
95°0'0"E
95°0'0"E
5°0
'0"N
5°0
'0"N
0°0
'0"
0°0
'0"
5°0
'0"S
5°0
'0"S
! Emission Sources
!AAir QualitySampling Location
Receptor
l Coffee Farmer Hut
") Worker
Road and SiteBoundary
Road and Wellpad
Cooling TowerBuilding
Turbine Hall
Forestry Area
H2S Concentration (µg/m3)
28
50
100
200
400
600
800
1000
CLIENT
PT Supreme Energy Rantau Dedap
R-54
R-55
R-85R-86
R-83
R-84
R-88R-87
R-75
R-56
R-90

l
l
")")
")
")
")")
")
")
")
!A
!A
!!
!!
!
!!
!!
!
AQ6
AQ5
100
50
200
400
60
0 80
0
1000
100
600
103°24'0"E
103°24'0"E
103°23'0"E
103°23'0"E4°1
2'0
"S
4°1
2'0
"S
4°1
3'0
"S
4°1
3'0
"S
Map Title
Regency
Province
Muara Enim, Lahat, and Pagar Alam City
South Sumatra
Scale Map Information
µ 0.1 0 0.1 0.2 0.3 0.40.05
Kilometers
Index Location
Legend
Provided by
Data Sources
1. Client Document2. Modeling results from Calpuff Software
3. Google Earth Imagery Services
Map Information
Datum
Projection
Zone
World Geodetic System 1984
Universal Transverse Mercator
48 South
Unit Meter
H2S 8 HOURS
INCREMENTAL CONCENTRATIONAdministrative Details
Figure
7-4
PT AECOM Indonesia
1:10,000Scale on A3 Paper
Drawn
Checked
: RAP Date
: MN
: 27 Sept '16
Project ID : JKTD15040
105°0'0"E
105°0'0"E
100°0'0"E
100°0'0"E
95°0'0"E
95°0'0"E
5°0
'0"N
5°0
'0"N
0°0
'0"
0°0
'0"
5°0
'0"S
5°0
'0"S
! Emission Sources
!AAir QualitySampling Location
Receptor
l Coffee Farmer Hut
") Worker
Road and SiteBoundary
Road and Wellpad
Cooling TowerBuilding
Turbine Hall
H2S Concentration (µg/m3)
28
50
100
200
400
600
800
1000
CLIENT
PT Supreme Energy Rantau Dedap
R-54
R-55
R-85R-86
R-83
R-84
R-88R-87
R-75
R-56
R-90

Air Dispersion Modelling Report Supreme Energy Rantau Dedap
28 AECOM
CONCLUSION
08

Supreme Energy Rantau Dedap Air Dispersion Modelling Report
AECOM 29
8 Conclusion
AECOM has been commissioned by SERD to prepare Air Dispersion Modelling (ADM) to demonstrate
compliance with applicable standards. This report is therefore to provide an assessment of the air quality
impact associated with the power plant operation.
The primary air emissions of concern with regards to odour nuisance and health effects from the power plant
will be the non-condensable gases (NCG). NCG are gases that are present with range of 0.09-1.6 wt% in the
geothermal fluid. The NCG consist predominantly of carbon dioxide (approximately 97%), but also contains
hydrogen sulphide (H2S). The NCG will be released from vents located above the mechanical evaporative
cooling towers.
Based on the NCG content in the steam and H2S content in the NCG provided by SERD, the H2S emission
was calculated 13.25 g/s. With this rate, the emission concentration at normal condition was estimated 30
mg/m3, still well below the Indonesian Emission Standard of 35 mg/m
3.
The ADM report for the proposed SERD geothermal power plant was based on the air dispersion model
Calpuff and assessed the contribution to air quality impacts at nearby sensitive receptors and representative
worker receptors from the power plant. The inputs to the model include source parameters, building
dimensions expected to cause downwash effect, meteorological data, topography and land use. For this
study, dispersion is modelled over 12 km x 12 km domain with the power plant cooling tower is in the centre.
Based on the Calpuff calculations, the Rantau Dedap geothermal power plant project substantially complies
with limits set by the following standards/regulations/guidelines:
- Power plant emissions as set by Republic of Indonesia Regulation No 21 of 2008 (MENLH, 2008)
- Ambient H2S concentrations, as set by Republic of Indonesia Regulation Minister of Environmental
Decree No 50 of 1996 regarding Odor Standard (MENLH, 1996)
- Ambient H2S concentrations recommended by IFC EHS Guideline for Geothermal Power Generation
(IFC, 2007)
- Ambient H2S Concentrations regarding the working environment, as set by The Republic of Indonesia
Minister of Employment and Transmigration Regulation Number PER.13/MEN/X/2011
(MENAKERTRANS, 2011)
- Ambient H2S concentrations regarding health, as recommended by World Health Organization’s Air Quality Guidelines for Europe (WHO, 2000)
Exceedance of the 24-hour incremental concentration limit (MENLH, 1996) occurs at only one identified
sensitive receptor (R54), a coffee farmer hut located approximately 1.5 km to the east of the power plant. The
predicted maximum concentration at this receptor is 30 µg/m3 which exceeds the Indonesia Odor Standard.
However the exceedance only occurs one time in three year period. This is unlikely to result in adverse
impacts on the receptors resulting in odour complaints.
There is no exceedance of the 8-hour incremental concentrations at representative worker receptors. The
highest predicted 8-hr concentration is 1,051 µg/m3
at receptor number 86 located less than 100 meter from
the cooling tower. This concentration is below the threshold value of 1,400 µg/m3
in the working environment
as stipulated in the Regulation of the Minister of Employment and Transmigration Number
PER.13/MEN/X/2011.

Air Dispersion Modelling Report Supreme Energy Rantau Dedap
30 AECOM
REFERENCES
09

Supreme Energy Rantau Dedap Air Dispersion Modelling Report
AECOM 31
9 References
BC Ministry of Environment. (2015, December). British Columbia Air Quality Dispersion Modelling Guideline.
Retrieved 2016, from www.bcairquality.ca/assessment/dispersion-modelling.html
Fisher, G. W., & Heydenrych, C. (2005). Assessment of Effects of the Air Discharges from the Proposed
Kawerau Geothermal Power Station. Auckland, New Zealand: Endpoint Consulting Partners.
IFC. (2007, April 30). Environmental Health and Saefty Guidelines for Geothermal Power Generation.
Retrieved August 2016, from International Finance Corporation:
http://www.ifc.org/wps/wcm/connect/329e1c80488557dabe1cfe6a6515bb18/Final%2B-
%2BGeothermal%2BPower%2BGeneration.pdf?MOD=AJPERES&id=1323161975166
MENAKERTRANS. (2011, October 28). Peraturan Menteri Tenaga Kerja dan Transmigrasi Republik
Indonesia Nomor PER.13/MEN/X/2011 Tentang Nilai Ambang Batas Faktor Fisika dan Faktor Kimia
di Tempat Kerja. Retrieved August 2016, from Direktorat Jenderal Peraturan Perundang-undangan
Kementerian Hukum dan Hak Asasi Manusia Republik Indonesia:
http://www.djpp.kemenkumham.go.id/arsip/bn/2011/bn684-2011.pdf
MENLH. (1996, November 25). Keputusan Menteri Negara Lingkungan Hidup Nomor 50 Tahun 1996 Tentang
Baku Tingkat Kebauan. Retrieved August 2016, from Kementerian Negara Lingkungan Hidup:
http://jdih.menlh.go.id/pdf/ind/IND-PUU-7-1996-Kepmen%2050-1996%20%20Kebauan.pdf
MENLH. (2008, December 1). Peraturan Menteri Negara Lingkungan Hidup Nomor 21 Tahun 2008 Tentang
Baku Mutu Sumber Tidak Bergerak Bagi Usaha dan/atau Kegiatan Pembangkit Tenaga Listrik
Termal. Retrieved August 2016, from Kementerian Negara Lingkungan Hidup:
http://jdih.menlh.go.id/pdf/ind/IND-PUU-7-2008-
Permen%20LH%20No.21%20th%202008%20Baku%20Emisi%20sumber%20tdk%20bergerak_Comb
ine.pdf
USEPA. (1992, October). Screening Procedures for Estimating the Air Quality Impact of Stationary Sources
Revised. Retrieved January 21, 2015, from United States Environmental Protection Agency:
http://www.epa.gov/scram001/guidance/guide/EPA-454R-92-019_OCR.pdf
WHO. (2000). Air Quality Guidelines for Europe. Retrieved August 2016, from World Health Organization
Regional Office for Europe: http://www.euro.who.int/__data/assets/pdf_file/0005/74732/E71922.pdf

Supreme Energy Rantau Dedap Air Dispersion Modelling Report
AECOM 31
APPENDIX A Comparison between SERD Observation
Meteorological Data and Calmet Simulation

Surface meteorological data were obtained from Meteorological Station installed by Supreme Energy Rantau
Dedap (SERD) since 2012 at the project location. Data obtained from this station is from 2012-2015. The
parameters obtained include temperature, humidity, wind speed, wind direction and rainfall. Data are available on
a hourly basis. However many hours have missing values.
Because of the limitation of the observation data, hourly forecast meteorological data were also obtained from
Lakes Environmental (hereinafter referred to as Lakes). Lakes is a company based in Ontario, Canada which
provides provides meteorological modelling for air dispersion modelling purpose for any location in the world.
Their data were results of running the next-generation Weather Research and Forecasting mesoscale model
(WRF).
The meteorological data from Lakes were obtained by request via their website. The request is completed with
information regarding domain to be modelled and modelling period. For this study, meteorological modelling was
requested for a domain size of 50 x 50 km (with project location in the middle), 12 km grid resolution, and for the
period of 2013 to 2015 with one hour data interval. The meteorological data from Lakes were generated in the
3D.DAT format outputs. For air dispersion modelling purpose, these outputs were further simulated with CALMET
for a finer grid resolution. CALMET is the meteorological pre-processor for the CALPUFF model. The results of
CALMET simulation were then compared to the observation data.
A further evaluation of the reasonableness of the CALMET meteorological output was conducted by comparing
the model predicted meteorological parameters with the observed measurements. Note that the extracted data
from the CALMET outputs are set up at the surface level, i.e., 10 m above the ground. Tabel 1 summarizes the
annual averaged results and the comparisons for wind direction, wind speed and temperature.
Table 1 Comparisons of CALMET Simulation vs. SERD Observation for Annual Average Wind Directions/Speeds and Temperature
Year
Observation Calmet Simulation Comparison
WD (degree)
WS (m/s)
T (oC)
WD (degree)
WS (m/s)
T (oC)
WD (%)
WS (%)
T (%)
2013 201 2.1 17.9 202.2 2.9 18.4 0.6% 38.1% 2.8%
2014 205 2.2 18.0 188.3 2.9 18.3 -8.1% 31.8% 1.7%
2015 197 2.4 18.5 172.6 3.3 18.4 -12.4% 37.5% -0.5%
Note: WD = Wind Direction; WS = Wind Speed; T = Temperature
As can be seen in Table 1, the predicted parameter values are very close to those of the observed especially for
wind direction and temperature. Only the predicted wind speeds are higher 32% to 38% than those of the
observed. However these can be still considered acceptable. It can be seen that the agreement between the
measurements and predictions are satisfactory.
Figure 1 and Figure 2 present the wind roses from SERD observation and Calmet simulation for three year period
respectively. Comparing with the observations, it is shown that the predicted wind rose is not close to the
observed. However, the Calmet simulation does a reasonable job in capturing the distribution of wind directions.
From the observation data, prevailing winds in the study area are primarily from the south southeast. The Calmet
simulation tends to under predict the frequency of winds from this direction and over predict the frequency of
winds from west southwest and east northeast.
The average wind speeds for the observed and predicted were about 2.4 m/s and 3.3 m/s, respectively.
Simulation-predicted wind speeds are slightly higher than the observed values.

Figure 1 Wind-Rose Depicting Wind Direction Distribution Based on Calmet SERD Observation
(Period of 2013-2015)
Figure 2 Wind-Rose Depicting Wind Direction Distribution Based on Calmet Simulation
(Period of 2013-2015)

Air Dispersion Modelling Report Supreme Energy Rantau Dedap
32 AECOM
APPENDIX B Calculation of H2S Emission from Cooling
Tower

1 of 2
The most important air quality impact associated with a geothermal power plant will be the release of non-
condensable gases (NCG) into the atmosphere. The NCG will be discharged from vents located above the
cooling tower fan units and be entrained within the cooling tower discharge, thereby aiding dispersion. The main
component of the discharged NCG will be carbon dioxide but hydrogen sulphide (H2S) and mercury will also be
present. The latter two components are those of concerns.
The H2S emissions from the Supreme Energy Rantau Dedap (SERD) geothermal power plant will originate from
the operations of two identical units of cooling tower. Characteristics of the cooling tower per unit at normal
operation are presented in Table 1.
Table 1 Characteristic of the Cooling Tower (per Unit)
Item Unit Design
Type COUNTERFLOW
Water flow t/hr 10,248
Hot water temperature (Tower inlet) oC 36
Cold water temperature (Tower outlet) oC 20
Cooling tower size
Length m 80
Width m 16
Height (working level and freeboard) m 15
Fan
Number of fans - 5
Fan diameter m 10
Exit temperature C 32
Exit pressure bar 0.8
Exit relative humidity % 100
Exit air mass flowrate per fan t/hr 1,827
Source: Supreme Energy Rantau Dedap, 2016
For this study, the H2S emission will be calculated based on the NCG content in the steam and H2S content in the
NCG. For the purpose of estimating the H2S emission, it will be assumed a steady-state condition will be reached.
Steps for the calculation of the cooling tower H2S emission are as follows:
1. Calculate mass flow rate of H2S emission per fan with equation:
EH = [(M1 * g1 * f1) + (M2 * g2 * f2)] / 5 Equation 1
Where:
EH = Mass flow rate of H2S emission per fan, g/s
M1 = Total mass flowrate of high pressure steam to turbine, g/s
M2 = Total mass flowrate of low pressure steam turbine, g/s
g1 = Mass fraction of NCG from the high pressure steam flow
g2 = Mass fraction of NCG from the low pressure steam flow
f1 = Mass fraction of H2S in the NCG from the high pressure steam flow
f2 = Mass fraction of H2S in the NCG from the low pressure steam flow
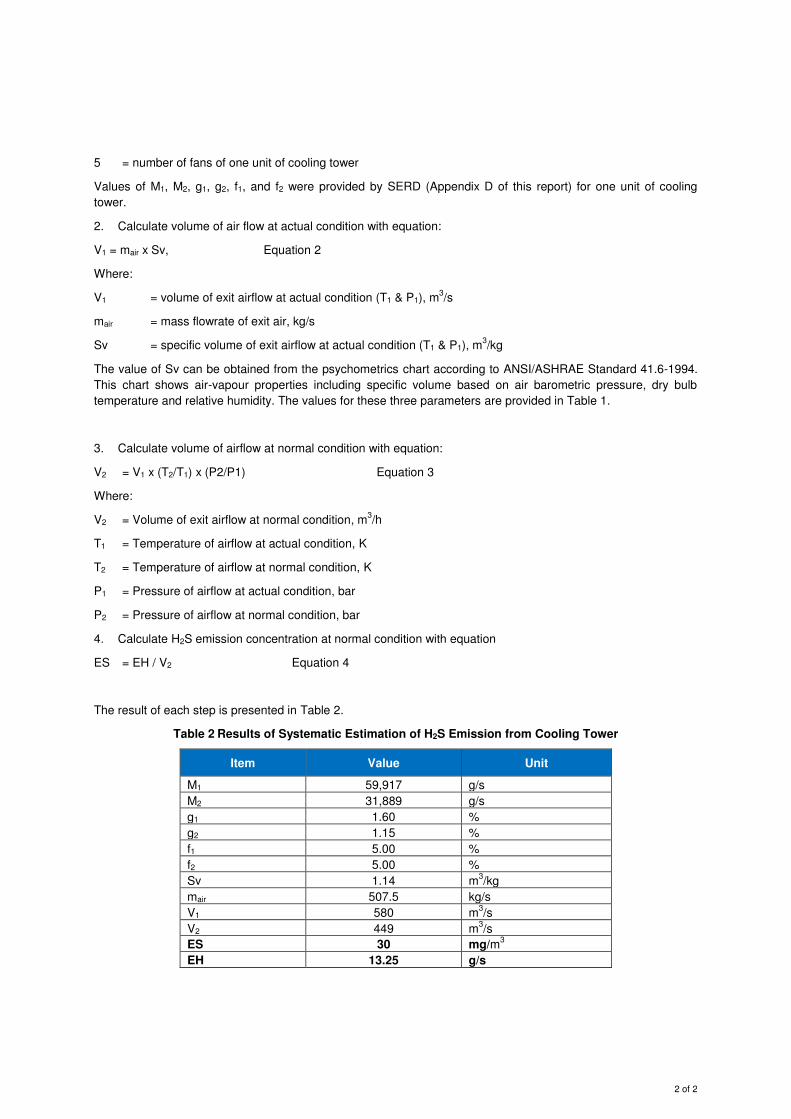
2 of 2
5 = number of fans of one unit of cooling tower
Values of M1, M2, g1, g2, f1, and f2 were provided by SERD (Appendix D of this report) for one unit of cooling
tower.
2. Calculate volume of air flow at actual condition with equation:
V1 = mair x Sv, Equation 2
Where:
V1 = volume of exit airflow at actual condition (T1 & P1), m3/s
mair = mass flowrate of exit air, kg/s
Sv = specific volume of exit airflow at actual condition (T1 & P1), m3/kg
The value of Sv can be obtained from the psychometrics chart according to ANSI/ASHRAE Standard 41.6-1994.
This chart shows air-vapour properties including specific volume based on air barometric pressure, dry bulb
temperature and relative humidity. The values for these three parameters are provided in Table 1.
3. Calculate volume of airflow at normal condition with equation:
V2 = V1 x (T2/T1) x (P2/P1) Equation 3
Where:
V2 = Volume of exit airflow at normal condition, m3/h
T1 = Temperature of airflow at actual condition, K
T2 = Temperature of airflow at normal condition, K
P1 = Pressure of airflow at actual condition, bar
P2 = Pressure of airflow at normal condition, bar
4. Calculate H2S emission concentration at normal condition with equation
ES = EH / V2 Equation 4
The result of each step is presented in Table 2.
Table 2 Results of Systematic Estimation of H2S Emission from Cooling Tower
Item Value Unit
M1 59,917 g/s
M2 31,889 g/s
g1 1.60 %
g2 1.15 %
f1 5.00 %
f2 5.00 %
Sv 1.14 m3/kg
mair 507.5 kg/s
V1 580 m3/s
V2 449 m3/s
ES 30 mg/m3
EH 13.25 g/s

Supreme Energy Rantau Dedap Air Dispersion Modelling Report
AECOM 33
APPENDIX C Index of Sensitive Receptors

Receptor ID Type of Receptor Easting (km) Northing (km) Elevation (m)
R‐1 Household 323.081 9540.194 1351
R‐2 Household 323.069 9540.189 1351
R‐3 Household 323.054 9540.186 1352
R‐4 Household 323.040 9540.185 1352
R‐5 Household 323.030 9540.179 1356
R‐6 Household 323.086 9540.176 1350
R‐7 Household 323.012 9540.172 1350
R‐8 Household 323.003 9540.171 1348
R‐9 Household 322.982 9540.169 1348
R‐10 Household 322.965 9540.162 1344
R‐11 Household 322.958 9540.162 1344
R‐12 Household 323.061 9540.157 1353
R‐13 Household 323.053 9540.157 1353
R‐14 Household 323.032 9540.155 1350
R‐15 Household 323.016 9540.146 1346
R‐16 Household 322.924 9540.145 1342
R‐17 Household 322.998 9540.144 1344
R‐18 Household 322.983 9540.143 1344
R‐19 Household 323.068 9540.137 1345
R‐20 Household 322.974 9540.136 1344
R‐21 Household 323.112 9540.134 1347
R‐22 Household 322.925 9540.133 1342
R‐23 Household 323.048 9540.131 1349
R‐24 Household 323.037 9540.131 1349
R‐25 Household 322.959 9540.130 1343
R‐26 Household 322.953 9540.127 1343
R‐27 Household 323.022 9540.124 1346
R‐28 Household 323.107 9540.123 1347
R‐29 Household 323.013 9540.122 1346
R‐30 Household 322.997 9540.115 1345
R‐31 Household 323.096 9540.112 1345
R‐32 Household 323.079 9540.109 1345
R‐33 Household 322.921 9540.109 1344
R‐34 Household 322.976 9540.105 1345
R‐35 Household 322.963 9540.103 1343
R‐36 Household 323.067 9540.102 1345
R‐37 Household 322.945 9540.101 1343
R‐38 Household 322.985 9540.087 1345
R‐39 Household 322.927 9540.086 1344
R‐40 Household 323.003 9540.085 1345

Receptor ID Type of Receptor Easting (km) Northing (km) Elevation (m)
R‐41 Household 322.972 9540.082 1347
R‐42 Household 323.045 9540.080 1345
R‐43 Household 322.911 9540.069 1348
R‐44 Household 322.958 9540.067 1347
R‐45 Household 322.931 9540.053 1348
R‐46 Household 318.413 9538.701 1240
R‐47 Household 318.388 9538.715 1240
R‐48 Household 318.357 9538.693 1243
R‐49 Household 318.377 9538.693 1243
R‐50 Household 318.398 9538.682 1240
R‐51 Household 315.891 9538.642 1247
R‐52 Household 315.869 9538.639 1249
R‐53 Household 315.897 9538.634 1247
R‐54 Coffee Farmer Hut 322.302 9535.285 1683
R‐55 Coffee Farmer Hut 322.302 9535.171 1692
R‐56 Worker 320.070 9535.108 1996
R‐57 Household 326.732 9535.088 1595
R‐58 Household 326.813 9535.084 1583
R‐59 Household 326.766 9535.078 1593
R‐60 Household 326.806 9535.074 1588
R‐61 Household 326.761 9535.061 1593
R‐62 Household 326.698 9535.060 1597
R‐63 Household 326.728 9535.048 1594
R‐64 Mosque 326.682 9535.042 1599
R‐65 Household 326.746 9535.040 1594
R‐66 Household 326.756 9535.039 1591
R‐67 Household 326.714 9535.025 1597
R‐68 Household 326.727 9535.019 1593
R‐69 Household 326.789 9535.012 1584
R‐70 Household 326.706 9535.009 1596
R‐71 Household 326.725 9535.003 1593
R‐72 Household 326.735 9534.996 1593
R‐73 Household 326.754 9534.994 1587
R‐74 Household 326.672 9534.985 1592
R‐75 Worker 320.506 9534.984 2000
R‐76 Household 326.693 9534.978 1594
R‐77 Household 326.704 9534.973 1594
R‐78 Household 326.715 9534.968 1594
R‐79 Household 326.725 9534.963 1589
R‐80 Household 326.735 9534.962 1589

Receptor ID Type of Receptor Easting (km) Northing (km) Elevation (m)
R‐81 Household 326.747 9534.942 1589
R‐82 Household 326.704 9534.911 1590
R‐83 Worker 320.371 9534.897 2008
R‐84 Worker 320.274 9534.866 2023
R‐85 Worker 321.182 9534.831 1929
R‐86 Worker 320.780 9534.804 1960
R‐87 Worker 320.368 9534.801 2012
R‐88 Worker 320.455 9534.797 2007
R‐89 Coffee Farmer Hut 324.967 9534.756 1687
R‐90 Worker 322.759 9535.518 1640

Air Dispersion Modelling Report Supreme Energy Rantau Dedap
34 AECOM
APPENDIX D SERD Well Field Assumptions


Supreme Energy Rantau Dedap Air Dispersion Modelling Report
AECOM 35
APPENDIX E Preliminary Power Plant Layouts


Supreme Energy Rantau Dedap Air Dispersion Modelling Report
AECOM 37
About AECOM
AECOM (NYSE: ACM) is built to deliver a better world. We design, build, finance and operate infrastructure assets for governments, businesses and organizations in more than 150 countries.
As a fully integrated firm, we connect knowledge and experience across our global network of experts to help clients solve their most complex challenges.
From high-performance buildings and infrastructure, to resilient communities and environments, to stable and secure nations, our work is transformative, differentiated and vital. A Fortune 500 firm, AECOM companies had revenue of approximately US$19 billion during the 12 months ended June 30, 2015.
See how we deliver what others can only imagine at aecom.com and @AECOM.
Contact
Andrew Sembel
Manager, Environment, Indonesia
T +62-21-7207574-ext-107
Novianto Hadisuwito
Associate, Environment, Indonesia
T +62-21-7207574-ext-148
aecom.com JKTD160XX – KA ANDAL PLTU Sulbagut – 1