innovative funding for sustainable aviation fuel … · the single largest opportunity to...
TRANSCRIPT

PREPARED BY ROCKY MOUNTAIN INSTITUTE-CARBON WAR ROOM AND SKYNRG
INNOVATIVE FUNDING FOR SUSTAINABLE AVIATION FUEL AT U.S. AIRPORTS EXPLORED AT SEATTLE-TACOMA INTERNATIONAL

RO
CKY MOUNTAIN
INSTIT UTE
WA R R O OM
CARBON
INNOVATIVE FUNDING OPTIONS FOR SUSTAINABLE AVIATION FUEL AT U.S. AIRPORTS 2
AUTHORS & ACKNOWLEDGMENTS
ACKNOWLEDGMENTS The authors thank the following individuals and organizations for offering their insights, perspectives, and support on this work. Stephanie Meyn, Seattle-Tacoma International Airport Borgan Anderson, The Port of Seattle Elizabeth Morrison, The Port of Seattle Isabel Safora, The Port of Seattle The Port of Seattle Eldred Foundation
AUTHORS Annie Benn, Charlotte Hardenbol (SkyNRG), Adam Klauber, Craig Schiller, Isaac Toussie, Misha Valk (SkyNRG), Jeff Waller Authors listed alphabetically. All authors are from Rocky Mountain Institute unless otherwise noted.
CONTACTS Adam Klauber, [email protected] Charlotte Hardenbol, [email protected]
SUGGESTED CITATION Klauber, Adam, Annie Benn, Charlotte Hardenbol, Craig Schiller, Isaac Toussie, Misha Valk, Jeff Waller. Innovative Funding for Sustainable Aviation Fuel at U.S. Airports: Explored at Seattle-Tacoma International. Rocky Mountain Institute, SkyNRG, July 2017. https://www.rmi.org/insights/reports/innovative-funding-sea-tac-2017/
ABOUT ROCKY MOUNTAIN INSTITUTE Rocky Mountain Institute (RMI)—an independent nonprofit founded in 1982—transforms global energy use to create a clean, prosperous, and secure low-carbon future. It engages businesses, communities, institutions, and entrepreneurs to accelerate the adoption of market-based solutions that cost-effectively shift from fossil fuels to efficiency and renewables. In 2014, Carbon War Room (CWR) merged with and now operates as part of RMI. RMI has offices in Basalt and Boulder, Colorado; New York City; Washington, D.C.; and Beijing.
ABOUT SKYNRG SkyNRG is the global market leader for sustainable aviation fuel (SAF), having supplied over 25 airlines worldwide. SkyNRG sources, blends, and distributes SAF, guarantees sustainability throughout the supply chain, and helps to co-fund the premium. At the same time, SkyNRG focuses on developing regional supply chains that offer a real sustainable and affordable alternative to fossil fuels. SkyNRG has its operations RSB certified and is structurally advised by an independent Sustainability Board in which the WWF International, Solidaridad, and the Energy Academy Europe hold a seat.

RO
CKY MOUNTAIN
INSTIT UTE
WA R R O OM
CARBON
INNOVATIVE FUNDING OPTIONS FOR SUSTAINABLE AVIATION FUEL AT U.S. AIRPORTS 3
EXECUTIVE SUMMARY Global aviation generates approximately 2 percent of global greenhouse gas emissions and is forecast to grow to 5 percent by 2050.1 While most industries have a range of cost-effective options available to reduce carbon emissions, aviation does not. For the foreseeable future, there is no alternative to liquid fuels for jet aircraft. The single largest opportunity to decarbonize air travel is to replace conventional, fossil-based jet fuel with sustainable aviation fuel (SAF). However, SAF commercialization has barely begun and the industry is grappling with a variety of economic and market challenges. High SAF prices are the chief reason for the slow uptake and the related absence of large-scale production capacity. Despite government incentives, the price premium for SAF is still significant. i Airlines operate on low profit margins; with fuel as the largest expense, there is limited ability to absorb these additional costs. The Port of Seattle (the Port), as the operator of Seattle-Tacoma International Airport (Sea-Tac), can leverage its unique position at the intersection of airlines, fuel suppliers, governments, and communities to support the scale-up of SAF. Airports can aggregate fuel demand across airlines and play an integral role in their regional economy. Bold leadership from airports will accelerate industry sustainability and SAF adoption. Catalyzing large-scale uptake of SAF can contribute to the Port’s Century Agenda Goals to reduce carbon emissions and will contribute to the development of clean energy jobs in the state of Washington. Blending SAF into the Sea-Tac jet fuel supply, at a 1 percent level, would reduce CO2 by approximately 23,300–31,000 metric tons annually on a life-cycle basis. Advancing SAF usage and creating a regional supply chain are ambitious goals requiring an innovative approach. To support the Port’s industry-leading goals, this project looks at a single critical element: funding mechanisms. The combined team of Carbon War Room and SkyNRG completed an assessment of potential mechanisms that could:
1. Secure SAF co-benefits by procuring the beneficial attributes of SAF beyond energy 2. Facilitate SAF infrastructure development
This report equips the Port’s leadership to act as one of the first airports in the world to advance climate solutions for aircraft via a reliable supply of low-carbon fuel for its passengers and airlines. We assessed and ranked 14 co-benefit funding mechanisms based on their revenue potential and feasibility (i.e., legal considerations, ease of implementation, airline factors, and other stakeholder impacts). The key findings of the study are:
1. While a U.S. airport cannot pay for aircraft fuel, it could pay directly for SAF co-benefits. Public dollars cannot cover a commodity used by a for-profit private firm. However, SAF produces direct air quality benefits, reduces greenhouse gas emissions, and supports regional economic development—all of which are valued by airports. These characteristics are referred to as SAF “co-benefits” for this report.
2. There are numerous viable funding mechanisms with significant revenue potential. Two of the four recommended mechanisms require FAA approval as they are currently not considered an acceptable use of airport revenue. The most promising mechanisms that can be implemented at Sea-Tac are:
i Currently, the price of SAF is approximately three times the price of conventional jet fuel.

RO
CKY MOUNTAIN
INSTIT UTE
WA R R O OM
CARBON
INNOVATIVE FUNDING OPTIONS FOR SUSTAINABLE AVIATION FUEL AT U.S. AIRPORTS 4
§ Corporate Support—corporations contribute to offset their flight emissions ($1 million to $2.5 million per year)
§ Port Taxing Authority—these funds support air quality benefits, similar to the Port’s Clean Truck Program (Funding amount is variable and dependent on Port Commission priorities)ii
§ Use of General Non-Aeronautical Revenue (requires FAA approval)—while there are several individual non-aeronautical fees and revenue sources that could be directed toward SAF co-benefits (such as parking or landside fees), offering non-source specific revenues only when the airport achieves a particular total revenue threshold could create a low-risk, non-targeted source for SAF co-benefit funds ($1.0 million to $4.0 million per year)
§ Airline Agreement (requires FAA approval)—implement a fund via the airline operating agreement that is not subject to revenue sharing, or create a new fee ($380,000 to $2.3 million per year)
3. Infrastructure investment could jump-start regional SAF production. The most promising approach to
support infrastructure is indirect via the procurement of SAF co-benefits. The certainty of a medium-to-long-term commitment made by the Port reduces investment risks for private sector funders. A longer-term contract from Sea-Tac to procure SAF co-benefits is favorable over one from airlines which are subject to greater market risks and exposure. Most other mechanisms identified for financing infrastructure projects are outside the Port’s legal scope. Focusing on funding SAF’s co-benefits is a better fit with the Port’s activities and mission.
INSIGHTS AND NEXT STEPS Developing an SAF supply chain in Washington is pioneering work. The Port has taken an important first step toward the deployment of SAF at Sea-Tac by identifying funding mechanisms for co-benefit procurement. Reducing the economic hurdle for SAF uptake is a key barrier to overcome. Therefore, the Port should continue to explore and develop the most viable co-benefit funding mechanisms. The assurance of funds for SAF uptake can also indirectly incentivize infrastructure investment, as a medium- to long-term commitment sends a demand signal to private sector investors. However, to fully enable regional SAF production, The Port must take additional steps. We recommend that the Port establishes a dedicated team to build the business case for a local supply chain as a critical next step. This likely involves identifying affordable and abundant feedstock sources, mapping production synergies, working with FAA and state authorities, and exploring partnership opportunities with other SAF demand centers. Creating an investable business case will require creative solutions and engagement with multiple stakeholders. The Port of Seattle is well positioned to facilitate this exercise given its active position at the intersection of airlines, fuel suppliers, governments, and the broader community. The Port can also facilitate regional SAF production through the active promotion of policy and regulatory support at the state and regional levels, and by advancing the airport leadership model with international and national policy makers.
ii For more information on the Port’s Clean Truck Program: http://www.portseattle.org/Environmental/Air/Seaport-Air-Quality/Pages/Clean-Trucks.aspx

RO
CKY MOUNTAIN
INSTIT UTE
WA R R O OM
CARBON
INNOVATIVE FUNDING OPTIONS FOR SUSTAINABLE AVIATION FUEL AT U.S. AIRPORTS 5
TABLE OF CONTENTS AUTHORS & ACKNOWLEDGMENTS .................................................................................................... 2EXECUTIVE SUMMARY ......................................................................................................................... 3
INSIGHTS AND NEXT STEPS ....................................................................................................................... 4INTRODUCTION ..................................................................................................................................... 6
THE OPPORTUNITY FOR SEA-TAC TO SUPPORT SAF .................................................................................. 8EXAMPLES OF EUROPEAN AIRPORT INVOLVEMENT IN SAF FUNDING .............................................................. 9
DEFINITIONS ......................................................................................................................................... 10PURCHASING SAF CO-BENEFITS ...................................................................................................... 12SAF CO-BENEFIT FUNDING MECHANISMS ...................................................................................... 13
LONG LIST OF FUNDING MECHANISMS ..................................................................................................... 13SELECTION CRITERIA ............................................................................................................................. 16LONG LIST EVALUATION ......................................................................................................................... 17SHORT LIST OF THE MOST FEASIBLE CO-BENEFIT FUNDING MECHANISMS FOR THE PORT OF SEATTLE ........... 18CO-BENEFIT FUNDING MECHANISM RECOMMENDATION ............................................................................ 20
SAF INFRASTRUCTURE FINANCE ..................................................................................................... 21LONG LIST OF SOURCES OF CAPITAL FOR SAF INFRASTRUCTURE ............................................................... 21
ON-AIRPORT SAF INFRASTRUCTURE FINANCE AT SEA-TAC ....................................................... 24PROJECT FINANCE ................................................................................................................................ 24FINANCE POLICY OPPORTUNITIES ........................................................................................................... 25
CONCLUSIONS AND NEXT STEPS ..................................................................................................... 26INSIGHTS AND NEXT STEPS ..................................................................................................................... 26
APPENDIX A .......................................................................................................................................... 27DETAILED SAF CO-BENEFIT FUNDING MECHANISM EVALUATION MATRIX .................................................... 27
APPENDIX B .......................................................................................................................................... 30CO-BENEFIT FUNDING MECHANISM REVENUE MAGNITUDE ESTIMATION ASSUMPTIONS AND CALCULATIONS ... 30
ENDNOTES ............................................................................................................................................ 34

RO
CKY MOUNTAIN
INSTIT UTE
WA R R O OM
CARBON
INNOVATIVE FUNDING OPTIONS FOR SUSTAINABLE AVIATION FUEL AT U.S. AIRPORTS 6
INTRODUCTION The commercial global aviation industry accounts for approximately 2 percent of global greenhouse gas emissions. In 2015, the industry produced 781 million metric tons (Mt) of CO2 with emissions growing by approximately 3 percent per year.2 Aviation’s share of total global emissions is forecast to grow to 5 percent by 2050. Demand for air transport is expected to increase by 4.3 percent, on average, each year for the next 20 years.3 To maintain its growth and simultaneously address environmental impacts, the aviation industry has committed to several carbon emission goals, including reducing net aviation emissions to 50 percent below 2005 levels by 2050 (see Figure 1). Figure 1 illustrates the options available to the industry to meet sustainability targets. While technological, operational, and economic measures will all play a role in reducing emissions, sustainable aviation fuel (SAF) is critical to the success of aviation in meeting stated environmental goals. Other industries have access to a range of existing cost-effective methods and products to reduce carbon emissions as well as numerous pathways for efficiency.4 Aviation is relatively efficient given the continual focus to improve aircraft performance and streamline operations to keep fuel consumption low. Unfortunately, due to the already achieved high efficiency of aviation, there are limited emission reduction options. Also, for the foreseeable future, there is no alternative to liquid fuels for aviation. The single largest opportunity to decarbonize the aviation industry is to replace conventional fossil-based jet fuel with SAF.
FIGURE 1. BREAKDOWN OF CO2 REDUCTION OPERATIONS FOR AVIATION THROUGH 20505 SAF is certified safe for use in commercial aircraft, without requiring any alterations to equipment or infrastructure, and can be produced sustainably without damaging ecosystems in a manner that benefits communities via low-carbon, sustainably grown feedstocks and sustainable production design. In the last five years, the sustainable aviation fuel industry has made rapid advancements on several fronts:

RO
CKY MOUNTAIN
INSTIT UTE
WA R R O OM
CARBON
INNOVATIVE FUNDING OPTIONS FOR SUSTAINABLE AVIATION FUEL AT U.S. AIRPORTS 7
§ Industry has commercialized SAF conversion technologies, and the first dedicated SAF refinery in the U.S. is now a reality.
§ U.S. and EU governments now offer policies to incentivize SAF use. § Producers have achieved downstream supply chain efficiency improvements. § Airlines, fuel producers, and other stakeholders seek a shift from isolated demonstration flights to
continuous daily operations. § ASTM has certified a total of five fuel production pathways to produce SAF for commercial aviation.
Nonetheless, the SAF industry has not grown at the rate targeted by the FAA and international aviation groups, and the penetration of SAF in the global jet fuel market is still essentially zero. Without scale and growing volume, the nascent industry grapples with a variety of economic and market challenges. The main reason for the low uptake and the related absence of large-scale production capacity is the price gap between SAF and conventional jet fuel. Fuel costs comprise over one-third of an average airline’s operating cost. Even with recent crude oil price declines in 2015, it remains a large percentage of a carrier’s expenditures. Given the competitive dynamic within the industry and pressure to compete on ticket pricing, fuel costs remain an important priority. The current price premium of SAF impacts airline profits if they choose to be an early adopter of the technology. Airlines are limited in their ability to purchase fuel at prices above the prevailing market price for fossil jet fuel. A carrier on the SAF vanguard will hurt its competitive position relative to other airlines that do not shoulder the same SAF cost burden on a specific city-pair route or airport location. While several airlines have made commitments to purchase SAF, the higher costs limit large-scale adoption. While the price premium of SAF remains an impediment, the cost of SAF has fallen significantly from its first introduction in 2008. Initially, SAF was 10 to 15 times more expensive than conventional jet fuel. However due to scaling growth, the development of dedicated production capacity, and increasingly efficient supply chains, that price difference has fallen dramatically to roughly three times the price of conventional fuel. The actual cost of SAF and its cost difference relative to fossil-based jet fuel differ significantly across regions, driven by feedstock price, conversion technology/capital investment for a production facility, the policy environment, supply chain logistics, and other factors.
FIGURE 2. SIMPLIFIED BREAKDOWN AND REDUCTION POTENTIAL OF SUSTAINABLE AVIATION FUEL PRICE

RO
CKY MOUNTAIN
INSTIT UTE
WA R R O OM
CARBON
INNOVATIVE FUNDING OPTIONS FOR SUSTAINABLE AVIATION FUEL AT U.S. AIRPORTS 8
The price premium of SAF is expected to continue to decrease, driven by scaling effects and increased conversion efficiencies, eventually nearing price parity with conventional jet fuel as illustrated in Figure 2. Increased demand will help drive lower-priced SAF supply as production increases in scale and favorable financing becomes available. Additionally, while there are several technologies for producing SAF that are currently certified for use in commercial aviation, many more technology pathways are in the certification pipeline. Upcoming new certified technologies will unlock lower value feedstocks, increase supply, and reduce production costs. THE OPPORTUNITY FOR SEA-TAC TO SUPPORT SAF The Port of Seattle (the Port), as the operator of Seattle-Tacoma International Airport (Sea-Tac), has a unique opportunity to leverage its position at the intersection of airlines, fuel suppliers, governments, and communities to support the scale-up of SAF. An airport can aggregate fuel demand across airlines and plays an integral role in its regional economy. Airports taking leadership roles to pioneer SAF adoption is a bold new paradigm in aviation sustainability that offers several advantages for the SAF industry over the conventional airline approach:
§ Equality—It avoids the competitive distortion resulting from one airline bearing more of the burden of purchasing the SAF. Also, fueling all airlines at the same blend ratio enables the participation of smaller airlines and business aviation operators without the resources to implement SAF offtake agreements.
§ Economies of scale—Aggregating demand across all airlines at the airport increases total volume while reducing transaction costs, logistical costs, complexity, and administrative burden. As SAF would be utilized in the existing infrastructure (tank farm, hydrant, fueling trucks, etc.) by all airlines, there are no additional capital investments for SAF introduction.
§ National/regional economic development—A proven and long-term airport demand center can encourage investment along the supply chain, including alternative fuel refinery capacity, and can stimulate increased downstream activity in the region. The Central Puget Sound area is already a key driver of economic activity and jobs and could extend its influence even further with this project.
Catalyzing large-scale uptake of SAF can contribute to the Port’s Century Agenda Goals to reduce carbon emissions and could also contribute to the development of clean energy jobs in the state of Washington. Blending SAF into 1 percent of all Sea-Tac jet fuel would result in approximately 23,300–31,000 metric tons of CO2 reduction each year on a life-cycle basis (see Table 1). This represents a substantial carbon reduction that is equal to or larger than other aircraft-related emission strategies that an airport could influence. Electrification of ground support equipment would generate 10,000 tonnes per year if implemented by all airlines. Reducing aircraft auxiliary power unit (APU) usage has been recognized as another opportunity for the Port, which includes providing pre-conditioned air at the gate (40,000 tonnes per year if implemented by all airlines).
TABLE 1. RANGE OF CO2 REDUCTION FROM AN AIRPORT-WIDE 1% BLEND OF SAF AT SEA-TAC 6, 7
Total jet fuel consumption
(gallons)
SAF volume for 1% airport-
wide blend (gallons)
Carbon coefficient
(pounds CO2/gallon)6, 7
Conventional fuel CO2
emissions (pounds CO2)
Conventional fuel CO2
emissions (MtCO2)
Minimum CO2
emissions reduction
(60% + 1%)
Maximum CO2
emissions reduction
(80% + 1%) EIA 21.10 84,400,000 38,283 23,353 31,009
ICAO 19.44 77,765,355 35,274 21,517 28,572
Notes:
1. Based on existing literature, 60–80% is the range of CO2 emission reduction, on a life-cycle basis, for SAF relative to conventional jet fuel.2. The additional 1 percent CO2 emission reduction is due to the reduced fuel consumption resulting from SAF having greater energy density than conventional jet fuel.
400,000,000 4,000,000

RO
CKY MOUNTAIN
INSTIT UTE
WA R R O OM
CARBON
INNOVATIVE FUNDING OPTIONS FOR SUSTAINABLE AVIATION FUEL AT U.S. AIRPORTS 9
Advancing SAF usage and creating a regional supply chain are ambitious goals that require an innovative approach. To support the Port’s industry-leading goals, this report looks at one specific element: funding mechanisms. The combined team of Carbon War Room and SkyNRG completed an assessment of potential mechanisms that could:
1. Help cover the cost of SAF co-benefits 2. Facilitate SAF infrastructure development
This report presents actions to equip the Port’s leadership as one of the first airports in the world to advance climate solutions for aircraft via a reliable supply of low-carbon fuel for its passengers and airlines. EXAMPLES OF EUROPEAN AIRPORT INVOLVEMENT IN SAF FUNDING Airports taking a leadership role to pioneer SAF adoption is a new development in aviation sustainability. Recently, several European airports have begun to actively support SAF uptake by identifying and leveraging funding mechanisms for SAF. The three different models that have been applied to aggregate funds in a European context include the following:
1. Corporate contribution: The Fly Green Fund is a Nordic initiative founded by SkyNRG, NISA, and Karlstad Airport in 2014. It is a fund that gives companies, organizations, and individuals the opportunity to decrease their environmental impact by flying on SAF. While 75 percent of the funds aggregated in the Fly Green Fund go into the procurement of SAF volume, the remaining 25 percent is invested in the development of SAF supply chains in the Nordic region. Swedavia, the largest Swedish airport operator, joined the Fly Green Fund as a launching customer, buying SAF for all staff flights. On an annual basis, Swedavia consumes approximately 150,000 U.S. gallons, resulting in a 1 million euro (10 million SEK) contribution per year over the course of three years. In 2016, Swedavia was the first company in the world to have its flights 100 percent powered by SAF.
2. Airport incentive: Norwegian airport operator Avinor has played a key role in a commercial offtake agreement by offering a unique airport incentive for all flights at Oslo Airport that are powered by SAF. Avinor has allocated up to 100 million NOK, approximately 10 million euros, over a 10-year period (2013–2022) for initiatives and projects that can contribute to the realization of Norwegian biofuel. In 2016, Avinor supported the supplying parties, AirBP and SkyNRG, in two ways; 1) Avinor allocated a fixed amount per year to cover additional logistics costs, and 2) Avinor contributed money to cover the SAF premium for each liquid ton of SAF blended into the Avinor airport fueling system.
3. Routine provision: Together with a yet-to-be-revealed central European airport, SkyNRG and Carbon War Room are currently advancing a program to integrate SAF into standard operations. The airport authority has aggregated funds to make a 1 percent SAF blend available to all aircrafts refueling at the airport for the first five years, at no additional cost to the airlines. A federal fund responsible for the development and supervision of civil aviation activities in the country will cover 80 percent of the costs to enable the routine provision of SAF. The airport authority will directly finance the remaining 20 percent.
Although these European models can serve as inspirational examples, U.S. regulatory constraints and restrictions specific to U.S. airports like Sea-Tac need to be assessed. The goal of this report is to explore options that meet the spirit of these European funding models, but are applicable to the U.S. airport context.

RO
CKY MOUNTAIN
INSTIT UTE
WA R R O OM
CARBON
INNOVATIVE FUNDING OPTIONS FOR SUSTAINABLE AVIATION FUEL AT U.S. AIRPORTS 10
DEFINITIONS
§ Sustainable aviation fuel (SAF) refers to jet fuel that is produced from renewable feedstocks instead of being refined from petroleum. There are a variety of possible feedstocks for SAF, including used cooking oil, tallow, energy crops, agricultural and forestry residues, and municipal solid waste. In this document, we define “neat” or “unblended” SAF as the product that comes directly from the SAF production facility. Neat SAF is not certified for use in commercial aircraft. Once the neat SAF is blended with conventional fuel (Jet-A), the resulting fuel is referred to as “blended fuel” or simply “SAF.” SAF is a “drop-in” fuel, which means that it has the same characteristics and meets the same specifications as regular jet fuel. Therefore, SAF can be used in existing engines, fuel systems, and infrastructure. The maximum blend percentage is prescribed by ASTM and results from a rigorous testing and certification process. In general, it ranges from 10 percent to 50 percent, depending on the production process. Once blended, the fuel is fully certified as jet fuel, has the same characteristics, and meets the same specifications.
§ SAF co-benefits are the positive externalities created by the production and consumption of SAF. Beyond the primary energy functions, SAF also produces direct air quality benefits, reduces greenhouse gas emissions, and benefits regional economic development—all of which are of value to airports. There may also be additional positive impacts that include reduced fuel price volatility and increased energy independence. These characteristics are designated as the “co-benefits” of SAF for this report. This can be thought of as an umbrella term for the numerous positive externalities associated with the production and consumption of SAF.
§ Airport revenue is considered all revenue that an airport receives from both aeronautical and non-
aeronautical revenue sources, as described in FAA Order 5190.6B, section 15.6. These revenues are subject to the revenue diversion rules described in section 15.13 of the Order. In the case of the Port of Seattle, all airport revenue (combined aeronautical and non-aeronautical) is subject to sharing with airlines (i.e., per the Port’s contracts with Signatory Airlines, all net revenue exceeding 125 percent of its annual debt service will be shared with airlines at a rate of 50 percent).
ú Aeronautical revenue is a subset of airport revenue. It is the revenue typically imposed on
airlines, and is associated with airline rents, usage fees, and charges. Airports, including Sea-Tac, create a contract with airlines wishing to use its facilities, typically known as a Use and Lease agreement. This contract frames the relationship between the airport and the airline. One of the most important elements of any Use and Lease Agreement is the definition of the compensation the airline pays to the airport for use and maintenance of its facilities, including:
• Terminal rents—Rents based on the amount of space an airline uses inside the terminal. • Landing fees—A per plane charge, usually based on the weight of the aircraft. • Other charges—Specific fees for extra airport services (e.g., use of a jet bridge).
An airline does not have to have a signed contract to use an airport. However, an airline with a contract, typically called a signatory airline, enjoys special benefits such as lower rates.
ú Non-aeronautical revenue is also a subset of airport revenue. It is the revenue associated with
parking fees, landside operation fees, real estate, advertising, car rentals, etc. These revenue streams have become a vital component of an airport’s total revenue. They tend to generate higher net profit margins than aeronautical revenues, providing diversification in an airport’s income portfolio while serving as an additional cushion during economic downturns.
§ Non-airport revenue is any revenue the Port receives or that a third party could generate that is not
associated with Sea-Tac’s direct finances. This includes the Port’s tax levy, non-airport property rent

RO
CKY MOUNTAIN
INSTIT UTE
WA R R O OM
CARBON
INNOVATIVE FUNDING OPTIONS FOR SUSTAINABLE AVIATION FUEL AT U.S. AIRPORTS 11
revenue, voluntary contributions from individuals or corporations, etc. This revenue is more flexible because it is not subject to FAA Order 5190.6B, but it is subject to state laws governing how Ports can spend revenue (e.g. Title 53 of the Revised Code of Washington).
ú Port revenue is a subset of non-airport revenue received by the Port from non-airport-related
sources such as tax levies, non-airport land leases, tenants, and operations.
ú Non-port revenue is also a subset of non-airport revenue that is generated by any public or private source that is not generated or controlled by the Port of Seattle.
RO
CKY MOUNTAIN
INSTIT UTE
WA R R O OM
CARBON
INNOVATIVE FUNDING OPTIONS FOR SUSTAINABLE AVIATION FUEL AT U.S. AIRPORTS 12
PURCHASING SAF CO-BENEFITS Airports cannot directly pay for aircraft fuel. Among other restrictions, public dollars cannot fund a commodity used by a for-profit private firm. However, airports can purchase services that support airport performance goals such as cleanliness (custodial contracts) or clean energy (renewable energy certificates). Sustainable aviation fuel provides the traditional energy qualities of fossil-based Jet-A as well as additional environmental benefits and desired services, or co-benefits. Besides offering lower life-cycle carbon emissions, SAF usage lowers direct emissions of air pollutants (such as sulfur and particulate matter) and supports regional economic development through locally sited supply-chain elements. Growing the SAF market could insulate airlines and, by extension, their stakeholders from the price volatility associated with conventional jet fuel. Fuel supply security can also benefit from increasing SAF consumption. An airport could theoretically purchase these co-benefits in the same way that vendors provide services without a transfer of physical ownership. For example, airports contract with carpet manufacturers that offer floor covering as a service and lighting corporations that offer lighting as a service, as well as receive renewable energy credits for green building certification. Co-benefits can function as a new service. Additionally, airports are already in the business of providing services that offer air quality benefits and cost savings to airlines in the form of pre-conditioned air at the gate, or infrastructure to plug in electric ground support equipment. Given the nascent stage of defining these benefits for each SAF product, it is too early to assign value to each of the types of co-benefits and fully examine a fuel program based on these values. For the current time, the willingness to pay a premium above fossil jet parity could equate with assumed co-benefits. This approach has been proposed to the FAA, which has expressed openness to the concept. As additional research is completed, co-benefits can be quantified and potentially monetized. The model of a central fund operated by a third party that purchases the SAF and tracks and quantifies the co-benefits for the fund contributors is feasible in the U.S. The specific legal structure of such a fund and the way in which a U.S. airport purchases SAF co-benefits must be made very clear and vetted through the appropriate state and federal departments. One significant benefit of a centralized fund operated by a third party is that its governance structure could allow for representatives to be elected or appointed to negotiate SAF fuel costs on behalf of the fund. This would provide assurance to airlines, corporations, and airports that the costs are as competitive as possible.

RO
CKY MOUNTAIN
INSTIT UTE
WA R R O OM
CARBON
INNOVATIVE FUNDING OPTIONS FOR SUSTAINABLE AVIATION FUEL AT U.S. AIRPORTS 13
SAF CO-BENEFIT FUNDING MECHANISMS This section assesses innovative funding mechanisms that an airport could consider utilizing to purchase SAF co-benefits. Through this action, the Port would help create stable demand for SAF, which is an ambitious goal and a powerful driver to establish a regional supply chain. To assess the best options for Sea-Tac, a long list covering a full range of potential mechanisms was scored on seven selection criteria (see Figure 3). The list includes 14 potential funding mechanisms divided into two categories: airport revenue and non-airport revenue. Airport revenue includes both aeronautical and non-aeronautical sources. This report distinguishes whether airport revenue is aeronautical or non-aeronautical because it is critical to the understanding of where and how airlines are monetarily affected. Non-airport revenue includes Port revenue (maritime or corporate, not associated with the airport) and non-Port revenue (e.g., from corporations or individual passengers). Using the selection criteria to analyze the mechanisms, the list was filtered down to a short list of the seven most viable funding mechanisms for the Port.
FIGURE 3. CRITERIA USED FOR SHORT-LISTING THE FUNDING MECHANISMS LONG LIST OF FUNDING MECHANISMS Not all the mechanisms described below are available to or feasible for the Port of Seattle; however, they reflect the full range of possibilities for any U.S. airport. AIRPORT REVENUES An airport could use its authority to impose new fees or use existing fees to cover the cost of SAF co-benefits. For each type of fee, the airport will need to determine whether it is most appropriate in the airport’s context to: a) divert existing fee revenue from its current use, b) increase an existing fee and use the new marginal revenue
RO
CKY MOUNTAIN
INSTIT UTE
WA R R O OM
CARBON
INNOVATIVE FUNDING OPTIONS FOR SUSTAINABLE AVIATION FUEL AT U.S. AIRPORTS 14
for SAF, or c) create a new fee where one is not currently in place. A key consideration in creating a new mechanism is whether it can be isolated from conditions such as revenue sharing in order to maximize revenue for SAF.
A. AERONAUTICAL REVENUES 1. Airline agreement: When negotiating airline agreements, new requirements for SAF co-benefit fees/funds
could be part of service contracts. This could potentially benefit airlines in helping them achieve their CORSIA (Carbon Offsetting and Reduction Scheme for International Aviation) targets with the International Civil Aviation Organization. While airline contracts are subject to FAA regulation, it may be possible to transmit funds directly to a third party, thereby exempting the funds from revenue-sharing requirements.
B. NON-AERONAUTICAL REVENUES
2. Retail vouchers: Retail and food vendors could sell coupons that cover mileage or pre-determined SAF volumes to passengers. The coupons could be redeemed for preferential pricing at concessionaires. A coupon system may also be combined with a voluntary passenger contribution as part of a comprehensive community engagement program. It may be possible to structure this program in such a fashion that airport revenues are not affected, for example by using a third-party operator, in which case revenue diversion rules might not apply.
3. Landside operation fees: The airport could create a specific fee for contracted vehicles entering the airport (e.g., buses, taxis, limousines, transportation network companies, etc.). This fee could be related to the environmental performance of the vehicle or transportation mode as part of an emissions reduction strategy.
4. User surcharge: The airport could create a charge to any number of potential customer groups including
passengers, concessions, and business aviation. One example of a plausible fee could be applied to energy use with user costs that relate to level of consumption. Stakeholder buy-in for such an approach is critical to its success. Another example is a parking fee, described below:
a. Parking fee: A new surcharge on targeted drivers (e.g., long-term business travelers) or a percentage increase in all parking could generate significant revenue for SAF. This could be linked to air quality goals by discounting the fee for EV drivers. Considerations of whether this option is viable at a specific airport should include revenue-sharing agreements and secondary effects of increased parking expense (e.g., mode-switching).
5. Mobile payment transactional efficiency: The use of mobile payment services for retail, dining, and other
concessions enables vendors to serve more customers, more quickly and efficiently, and to reduce attrition on queues. This has the potential to increase revenues directly for airport concessionaires and indirectly for the airport and airlines through revenue-sharing agreements.
6. Operational savings: Four variants of this mechanism relate to either capturing future operational savings or
using OpEx budgets funding to cover SAF. In the case of capturing savings, a tool such as a green revolving fund could be used to “bank” these savings and reapply them to the SAF co-benefits. The green revolving fund is not listed as a separate mechanism, but is rather a tool that can be used to convert savings from mechanisms such as the ones listed in this section into funds for the SAF co-benefits. The four variants include:
a. Energy Savings Performance Contracting (ESPC): A third-party energy services company, in conjunction with a third-party bank, can reduce energy, water, and waste consumption. Savings above contracted minimum can be directed to a green revolving fund.
b. Streamlined Performance Contracting: An alternative to an ESPC, the airport could elect to participate with an all-in-one provider and direct savings generated to SAF. Under this mechanism, the third-party provider takes on the internal coordination and effort of identifying potential operational cost-saving measures, pre-secures financing, and installs upgrades usually within three months of initial discussion (vs. the typical 18-month duration associated with ESPCs).

RO
CKY MOUNTAIN
INSTIT UTE
WA R R O OM
CARBON
INNOVATIVE FUNDING OPTIONS FOR SUSTAINABLE AVIATION FUEL AT U.S. AIRPORTS 15
c. Other Operational Savings: Additional pending operational savings initiatives could create savings that the airport would not otherwise capture (e.g., additional electrification of fleet, efficiencies in airport operations). Instead, the airport could dedicate proven savings to SAF. This measure could be a way to reach out across airport lines of business to identify cost-saving actions and capture those savings for SAF co-benefit coverage.
d. OpEx Budget: The Port could reserve unspent allocated operational expense budget to cover the SAF co-benefits on an episodic basis. The viability of this option would depend on the size of the OpEx budget at the airport, as well as decisions on a wide range of priorities.
7. Enhanced use lease: An airport could rent airport land (or roof surface area) to solar developers and receive
payments from the energy generation. The viability of this option depends on the availability of land or roof surface for this purpose, as well as the economics of energy pricing in the region. This option can alternatively be applied to non-airport property, in which case revenue diversion rules do not apply.
8. Aircraft fuel tax payments: If federal and state fuel taxes are currently being dedicated to non-airport
expenditures, these funds could be redirected to fund airport infrastructure. This funding could be used either to cover the cost of SAF co-benefits directly, or to make a capital investment that would generate operational savings that could then be leveraged (e.g., through a green revolving fund). This mechanism is viable only if it is possible to redirect these payments to the SAF program.
9. Toll road: Depending on the airport regulatory context, it could be possible to levy a toll on airport access
roads. This mechanism would have similar considerations and implementation to the “user surcharge” mechanism described above.
NON-AIRPORT REVENUES The mechanisms in this section cover how to leverage existing incentives external to the airport for improving air quality and reducing CO2 emissions. In some cases, the incentive can be applied directly to the SAF co-benefits. There are other examples of environmental funds available to airports, such as Voluntary Airport Low Emission (VALE) grants or Congestion Mitigation and Air Quality Improvement (CMAQ) funds, but these cannot be applied directly to the SAF co-benefits under current grant rules. Instead, those funds could be leveraged to generate operational cost savings, which can then be banked via a green revolving fund.
A. PORT REVENUE 1. Taxing authority: This option is available only to a small number of airports that have taxing authority, either
as part of a Port Authority with taxing authority, or through the municipal/regional government. This option may prove challenging from a stakeholder perspective without strong community buy-in.
B. NON-PORT REVENUE
2. Corporate support: A sponsorship model such as the Fly Green Fund (see section “Examples of European Airport Involvement in SAF Funding” above) could be established, enabling local firms to reduce their carbon footprint from business travel by flying on SAF.iii This mechanism has the additional benefit of engaging the local community and business partners in the project. Viability of the mechanism largely depends on the potential of corporate partners in the region.
3. Voluntary traveler contribution: Passengers may choose to buy SAF co-benefits (most likely to be CO2
reductions) proportional to the impact of their journey. This could be enabled by, for example, a modified version of the Good Traveler program—an offset program enabling flyers to voluntarily offset the carbon impact of their journey. The approach has the added benefit of direct engagement with passengers.
iii For more information on the Fly Green Fund: http://skynrg.com/nordic/fly-green-fund/

RO
CKY MOUNTAIN
INSTIT UTE
WA R R O OM
CARBON
INNOVATIVE FUNDING OPTIONS FOR SUSTAINABLE AVIATION FUEL AT U.S. AIRPORTS 16
4. Commodity impact factor (CIF): The American Carbon Registry (ACR) is developing CIF as an alternative to a carbon offset. When this is available, airport-purchased SAF could be financed in part through the sale of the carbon reduction. Based on recent discussion (September 2016), ACR is first piloting this concept for methane reduction and will implement aviation fuel at a later date (approximately Q4 2017).
5. Federal grants: As mentioned above, environmental funds available to airports such as VALE grants or
CMAQ funds cannot be applied directly to the SAF co-benefits under current grant rules; however, there are ongoing discussions with the FAA to allow VALE grants to be used for SAF. Alternatively, those funds could be leveraged to generate operational cost savings, which can then be banked via a green revolving fund as described above.
SELECTION CRITERIA All 14 mechanisms were evaluated for their feasibility for the Port using the seven selection criteria defined below.
§ Estimate of potential annual funding amount: The different funding options have different anticipated monetary yields. Details regarding the estimation of funding levels for the various mechanisms in the context of the Port are discussed in Appendix B.
§ Legal and regulatory considerations: Many options seem logical or reasonable, but may be incompatible with current local, state, or federal regulations. The legality must be considered.
§ Ease of implementation: An option may be feasible, but require a high level of effort to implement. All else equal, easier-to-implement measures will appear more attractive, but ease of implementation must be considered in the context of the level of potential funding and the other criteria. Factors affecting ease of implementation could include whether control of the mechanism is located internally or externally, staff availability, duration/timeline of the implementation process, and complexity to execute.
§ Airline coordination: As airlines are the key stakeholders in any fuel-related effort, airline interests and level of effort must be included in the analysis.
§ Neighboring communities: Like airlines, neighboring communities are a key stakeholder group that should be treated separately. Some funding mechanisms might have social and/or economic impacts on the community, or environmental co-benefits. These considerations should be included.
§ Other stakeholders: The interests of other relevant stakeholders (e.g., passengers, the public, landside stakeholders, government stakeholders, etc.) must be considered. This analysis includes the likely “winners” and “losers” of different approaches, if applicable, as well as the effort required to align stakeholder interests. Additionally, airports must address concerns of the public and any potential opposition to a specific funding mechanism.
§ Potential secondary effects: Secondary impacts of different funding mechanisms must be considered, and could include, for example, inadvertently reducing revenue in another area of the budget, or influencing behavior and buying choices at the airport.

RO
CKY MOUNTAIN
INSTIT UTE
WA R R O OM
CARBON
INNOVATIVE FUNDING OPTIONS FOR SUSTAINABLE AVIATION FUEL AT U.S. AIRPORTS 17
LONG LIST EVALUATION The results of the long list evaluation are summarized in Figure 4 below. See Appendix A for a detailed analysis.
FIGURE 4. SUMMARY OF CO-BENEFIT FUNDING MECHANISM LONG LIST EVALUATION

RO
CKY MOUNTAIN
INSTIT UTE
WA R R O OM
CARBON
INNOVATIVE FUNDING OPTIONS FOR SUSTAINABLE AVIATION FUEL AT U.S. AIRPORTS 18
FIGURE 4 CONTINUED SHORT LIST OF THE MOST FEASIBLE CO-BENEFIT FUNDING MECHANISMS FOR THE PORT OF SEATTLE Not all the mechanisms investigated are available to or feasible for the Port of Seattle. Given that the range of estimated revenue for the various co-benefit funding mechanisms spans from $1,250 to $22.5 million per year (see Appendix B for details on the estimation of funding amounts), it is likely that implementing a single mechanism will be insufficient to meet the needs of funding the co-benefits for an airport-wide 1 percent blend of SAF, estimated to cost approximately $6 million per year.iv Therefore, it is recommended that the Port consider implementing a portfolio of funding mechanisms that collectively provide the necessary funds. To provide the greatest risk-adjusted returns to expending effort in overcoming potential feasibility concerns, portfolio selection should prioritize mechanisms based on the following order (those listed first are highest priority):
1. High revenue, high overall feasibility 2. Low revenue, high overall feasibility 3. High revenue, low overall feasibility 4. Low revenue, low feasibility
iv 400 million gallons jet fuel consumed annually at Sea-Tac à 1% blend = 4 million gallons of SAF à $1.5/gallon premium in SAF price compared to jet fuel price à 4 million gallons * $1.5/gallon premium = $6 million total annual premium cost.
RO
CKY MOUNTAIN
INSTIT UTE
WA R R O OM
CARBON
INNOVATIVE FUNDING OPTIONS FOR SUSTAINABLE AVIATION FUEL AT U.S. AIRPORTS 19
The short list below represents the most feasible mechanisms that could be implemented at Sea-Tac based on the long list evaluation. AIRPORT REVENUES 1. Airline agreement (aeronautical):
§ Key Benefit: Airlines agree via a long-term contract to contribute directly to SAF funding and would receive direct co-benefits and clear greenhouse gas accounting for their shares.
§ Key Concern: Some airlines may want direct SAF contracts, while others would prefer a smaller, lower risk contribution. Balancing these interests will be challenging among all Signatory Airlines.
2. Retail vouchers (non-aeronautical): § Key Benefit: Motivates customers to receive monetary benefits by participating and avoids
solicitation. § Key Concern: Relies on complex concessionaire partnerships and could reduce overall revenue from
airport dining and retail sources (currently shared between the Port and airlines). 3. Landside operation fees (non-aeronautical):
§ Key Benefit: Could increase the environmental performance of landside operators and would likely be a large source of revenue.
§ Key Concern: The Port aims to create a level playing field among operators and their requirements, and operators already feel they are paying high fees and implementing environmental technologies and practices.
4. User surcharge (non-aeronautical):
§ Key Benefit: Could increase environmental performance of airport businesses and would likely be a large source of revenue.
§ Key Concern: Similar to other fees, businesses may feel singled out if there are additional fees associated with their operations at the airport.
The key concern for many of the non-aeronautical revenue mechanisms is that they single out specific users or revenue sources. One approach that could be explored to balance the fairness of using non-aeronautical revenue sources to pay for SAF co-benefits would be to allocate a fixed amount or percent of total non-aeronautical revenue above a certain revenue threshold. For example, rather than targeting a specific source such as landside operation fees, the allocation of SAF co-benefit funds would result in a slight reduction in overall revenue for the airport and revenue shared with airlines. This mechanism would be referred to as: 5. Use of General Non-Aeronautical Revenue:
§ Key Benefit: Does not target specific users, vendors, or funding sources at the airport, and relies only on the total non-aeronautical revenue received by the airport.
§ Key Concern: Requires airline and FAA approval, and could be reduced in years where general non-aeronautical revenue is not above the agreed-upon profit threshold.
NON-AIRPORT REVENUES 1. Taxing authority (Port):
§ Key Benefit: Compared to other taxpayer funded initiatives to improve air quality, this is a cost-effective way to achieve reductions.
§ Key Concern: This option may prove challenging from a political perspective without strong community buy-in.

RO
CKY MOUNTAIN
INSTIT UTE
WA R R O OM
CARBON
INNOVATIVE FUNDING OPTIONS FOR SUSTAINABLE AVIATION FUEL AT U.S. AIRPORTS 20
2. Corporate support (non-Port): § Key Benefit: This mechanism has the additional benefit of engaging the local community and
business partners in the project. § Key Concern: Viability of the mechanism largely depends on the potential of corporate partners in
the region. 3. Voluntary traveler contribution (non-Port):
§ Key Benefit: This mechanism engages the local community and creates a sense of regional pride and investment.
§ Key Concern: The anticipated funding from voluntary sources is expected to be small. CO-BENEFIT FUNDING MECHANISM RECOMMENDATION While all eight mechanisms identified in the short list were determined to have significant revenue potential and to be feasible for the Port to implement, it is recommended that the Port initially generate revenue from the following mechanisms, while expanding to the remaining short-listed mechanisms over time.
§ Corporate Support—$1 million to $2.5 million per year § Port Taxing Authority—$360,000 to $720,000 per year (Funding amount is variable and dependent on
Port Commission priorities) § Use of General Non-Aeronautical Revenue—$1.0 to $4.0 million per year § Airline Agreement—$380,000 to $2.3 million per year
With the exception of Corporate Support, all of these funding mechanisms require careful examination regarding state and federal regulations. In particular, both aeronautical and non-aeronautical revenue sources require FAA approval, and tax levy funds must be deemed eligible to pay for SAF co-benefits. Focusing efforts on these funding mechanisms will enable the Port to create a dedicated source of funds for the SAF co-benefits, while using a minimal number of mechanisms and expending the least amount of effort to establish them and overcome potential challenges.

RO
CKY MOUNTAIN
INSTIT UTE
WA R R O OM
CARBON
INNOVATIVE FUNDING OPTIONS FOR SUSTAINABLE AVIATION FUEL AT U.S. AIRPORTS 21
SAF INFRASTRUCTURE FINANCE This section describes various approaches an airport or private sector entity could take to participate in the financing of SAF infrastructure, which includes facilities to store, blend, or produce SAF. The Port of Seattle has limited legal authority to apply these mechanisms as a public sector entity, and therefore Port’s particular limitations are examined in section “On-Airport SAF Infrastructure Finance at Sea-Tac Airport” below. LONG LIST OF SOURCES OF CAPITAL FOR SAF INFRASTRUCTURE 1. Long-term contract with third-party producer: Guaranteeing offtake is the simplest method to support
regional SAF production without the associated complexity and risk involved with financing production infrastructure. While an airport cannot guarantee fuel offtake directly, depending on its legal structure, it could guarantee funds directed to a third-party contractor for co-benefits and indirectly provide the type of guarantee needed. A long-term agreement for a defined volume of fuel, at a specified price, provides demand assurance from a creditworthy counterparty. This arrangement could facilitate the SAF producer to confidently solicit external investor production financing. (See also non-capital contributions, below.) One option to consider for the party that could guarantee the offtake is a special purpose vehicle set up by the airline fuel consortium.
A long-term contract to procure SAF co-benefits from a supplier is identified as the most promising of all infrastructure financing actions for an airport. 2. Favorable leasing: An airport or city could lease non-airport property and build and own infrastructure on it,
provided it meets FAA requirements to benefit airport operations. 3. Public benefit fund: This revenue source is a common component of utility billing in most states in the U.S.
to cover the costs of energy efficiency and emissions reduction programs. Washington State is among the minority of states that do not have this fee. It may be possible to establish a new program for SAF production capacity to generate a credit for indirect elimination of fossil energy sources.
4. Federal bioenergy incentives: Incentives from federal agencies, including DOE, FAA, USDA, DoD, and
other involved parties, may be available to stimulate supply chains. The project developer would need to apply for these programs; however, cooperation and support from an airport can make applications more appealing (especially long-term offtake contracts; see above). Note that these programs include caps on the funding available, which should be taken into consideration when selecting appropriate programs. Examples of such programs include:
a. USDA Section 9003 program: This program provides loan guarantees for up to $250 million for the “development, construction, and retrofitting of new and emerging technologies for the development of Advanced Biofuels.”
b. USDA Section 9005 program: The Advanced Biofuel Payment Program “supports and ensures an expanding production of advanced biofuels by paying advanced biofuel producers for finished advanced biofuel products.”
c. USDA Section 9007 Rural Energy for America Program: “Provides guaranteed loan financing and grant funding to agricultural producers and rural small businesses for renewable energy systems or to make energy efficiency improvements.”
d. DOE Section 1703 Loan Program: Section 1703 supports “innovative clean energy technologies that are typically unable to obtain conventional private financing due to high technology risks.”
e. The FAA Office of Environment and Energy (AEE) has verbally confirmed it is open to exploring how existing grants could support biofuel infrastructure. Off-airport investments may be difficult given grant requirements; yet there may be innovative ways to address current restrictions.
f. Second Generation Biofuel Production Property Depreciation Allowance: An owner of a second-generation biofuel production plant may be eligible for a 50 percent special depreciation

RO
CKY MOUNTAIN
INSTIT UTE
WA R R O OM
CARBON
INNOVATIVE FUNDING OPTIONS FOR SUSTAINABLE AVIATION FUEL AT U.S. AIRPORTS 22
allowance to recover the cost of qualified property. To be eligible, the plant must function solely for second-generation biofuel production; be put into service by the current owner after December 20, 2006, and before January 1, 2017; and produce fuel that meets the U.S. Environmental Protection Agency fuel and fuel additive registration requirements. Note: this incentive expired December 31, 2016, and the renewal status is currently unknown (July 2017).
5. Pricing subsidies: These revenue streams help build the business case for a renewable fuel refining and/or
blending operation, and can help cover initial capital costs. They include: a. Renewable Identification Numbers (RINs): United States Renewable Fuel Standard (RFS)
program requires any party that refines or imports gasoline or diesel fuel to blend a minimum amount of renewable fuels into transportation fuel. The amount is EPA-specified and called the renewable volume obligation (RVO). Obligated parties comply by either blending enough renewable fuel to meet their annual RVO or purchasing RIN credits, which are generated when a producer makes a gallon of renewable fuel. Renewable fuel producers can either sell fuels with RINs attached to other obligated parties for a premium price or sell separated RINs to other obligated parties in need of credits to comply with their RVO.
b. California Low Carbon Fuel Standard (LCFS) Credit Market: The LCFS requires producers and refiners of petroleum-based transportation fuels to reduce the carbon intensity of their products sold in the California market, culminating in a 10 percent total reduction by 2020. Petroleum importers, refiners, and wholesalers can either develop their own low-carbon fuel products or buy LCFS credits from other companies that develop and sell low-carbon alternative fuels such as biofuels. It is theoretically possible for a Washington-based biorefinery to earn credits by selling a portion of its bio-based products, such as renewable diesel, in California, while simultaneously supplying SAF. Average credit prices have been trending upward over the last four years and at the current time are valued at about $90/mTCO2.
c. Biodiesel Mixture Excise Tax Credit: “A biodiesel blender that is registered with the IRS may be eligible for a tax incentive in the amount of $1.00 per gallon of pure biodiesel, agro-biodiesel, or renewable diesel blended with petroleum diesel to produce a mixture containing at least 0.1 percent diesel fuel. The incentive must first be taken as a credit against the blender’s fuel tax liability; any excess over this tax liability may be claimed as a direct IRS payment.” Note: this incentive expired December 31, 2016, and the renewal status is currently unknown (July 2017).
d. Second Generation Biofuel Producer Tax Credit: “A second generation biofuel producer that is registered with the Internal Revenue Service (IRS) may be eligible for a tax incentive in the amount of up to $1.01 per gallon of second generation biofuel that is: sold and used by the purchaser in the purchaser’s trade or business to produce a second generation biofuel mixture; sold and used by the purchaser as a fuel in a trade or business; sold at retail for use as a motor vehicle fuel; used by the producer in a trade or business to produce a second generation biofuel mixture; or used by the producer as a fuel in a trade or business.” Note: this incentive expired December 31, 2016, and the renewal status is currently unknown (July 2017).
6. Insuring technology risk: There is a growing area within the insurance industry focused on underwriting
and insuring risks associated with renewable energy production, including technology performance insurance for project debt financing and feedstock supply insurance. This can cover perils such as equipment performance and improper or inadequate maintenance. Technology insurance contributes to favorable project financing.
7. Economic development grants: Several broad federal programs might be appropriate, including the EB-5
Visa Program, which provides foreign investors the opportunity to gain permanent residency. 8. Tax-related incentives: The State of Washington could provide a tax incentive to the project investors.
Examples include exempting the facility owner from paying sales tax on the facility’s construction costs or exempting SAF from fuel taxes.
RO
CKY MOUNTAIN
INSTIT UTE
WA R R O OM
CARBON
INNOVATIVE FUNDING OPTIONS FOR SUSTAINABLE AVIATION FUEL AT U.S. AIRPORTS 23
9. Washington State Clean Energy Fund: Although the announced second round (most recently publicized) of state grants focuses on utility-based clean tech, a targeted request to include regional SAF infrastructure would support the same published economic development goals.
10. Non-capital contributions: Private funding requirements are reduced by an airport’s contribution to project
development and/or construction. Examples include leasing land below market rate and signing a long-term contract.
11. Impact investing: Mission-driven investors may find SAF project investment attractive. Examples of such
investors could include institutional investors, university endowments, and family offices. In the case of individual investors, a master limited partnership (MLP) could be established for a low-risk project such as a feedstock processing plant. MLPs are tax-advantaged vehicles to avoid enterprise-level associated tax obligations.
12. Local banks: Involving local banks as sources of finance yields attractive regional co-benefits, and an
airport could build on existing banking relationships in the region to finance the project. 13. Crowdfunding: Crowdfunding is an increasingly popular method of obtaining funding for projects. Blue
Marble Biomaterials recently launched a crowdfunding campaign, issuing equity under Regulation A+. In another example, Wunder Capital, an online fundraising and investment portal, raised $11.3 million from crowdfunding for commercial solar projects.8 The Port could encourage this type of investment by offering a match and engaging the local community. Conventional investors may view the crowdfunding platform unfavorably, and appropriateness varies according to risk profile.
14. Public-supported funding: An airport operator could provide credit or liquidity support to private investors,
and the infrastructure would then be financed by those private investors. An example of this could be the operator providing a loan guaranty, which would mitigate the risk of potential losses thus making the investment more attractive to potential investors. A variation on this option is a joint guarantee, in which the operator would provide a loan guaranty in cooperation with another guaranty-providing entity (e.g., an airline). This increases the creditworthiness and thus attractiveness of the guaranty. (Note: there are political feasibility challenges associated with a public entity’s securing the debt of a private entity, and this mechanism is not legal for the Port.)

RO
CKY MOUNTAIN
INSTIT UTE
WA R R O OM
CARBON
INNOVATIVE FUNDING OPTIONS FOR SUSTAINABLE AVIATION FUEL AT U.S. AIRPORTS 24
ON-AIRPORT SAF INFRASTRUCTURE FINANCE AT SEA-TAC The Port has several financial mechanisms it may employ to build a facility for SAF blending and storage for fuels consumed by the Port or its customers, but it does not have the authority to use these same funding sources for SAF production facilities, refineries, or other properties not directly owned by the Port. Port funding of SAF infrastructure would be based on the Port’s process for vetting project investments, and their funding would be subject to Port Commission review. Commission approval may result in reprioritization of other projects. The construction and funding of SAF infrastructure would likely need to be developed in collaboration with the Sea-Tac Fuel LLC (fuel consortium). The type of direct engagement the Port might have supporting supply chain infrastructure falls broadly into two categories:
1. Project finance, which includes direct financing (e.g., financing using taxes and bonds revenue) and direct ownership of the project.
2. Influencing favorable policy at the local, state, national, and international levels. The central focus of this section is on project finance. Policy actions are provided at the end of this section. PROJECT FINANCE 1. Bond issue: The Port could finance the construction of the infrastructure through a bond issue. Several
different bond repayment sources could be considered, including aeronautical revenue, non-aeronautical revenue, special revenues, or tax levy. These bonds include:
a. General Obligation Bonds—these are paid from the Port’s tax levy. b. Port Revenue Bonds—these are paid from the Port’s operating revenues. c. Special Facility Bonds—these require that the revenues paying back this debt be new to
the Port and not included in the Port’s existing revenues already pledged to its Revenue Bond investors. These bonds would be secured solely by the special revenues, so the revenues must be sufficient to provide adequate security for the bonds. If the special revenues are an addition to the fuel consortium lease, the bonds could be issued as additional Special Facility Fuel bonds.
2. Green bond: Designating the bond issue as a “green bond” may make the financial instrument more
attractive to certain types of investors. An authority would still issue debt, and repayment options are like more traditional bonds. Issuance must adhere to generally accepted green bond principles, such as those provided by the International Capital Market Association, and may attract a more diverse set of investors.v
3. Cash: Depending on the size of the project, the Port may use operating cash or tax levy cash to fund all or a
portion of the project costs.
4. Public Private Partnership (P3): P3 is an alternative project delivery approach that may be utilized in certain circumstances. There are many forms of P3 and the Port would want to assess the appropriate risk allocation among partners in order to determine the most appropriate approach.
5. Public-Public Partnership: The Port could potentially share funding with another public agency through an
interlocal agreement. This structure could include a private partner as well.
v For more information on the International Capital Market Association’s Green Bond Principles: http://www.icmagroup.org/Regulatory-Policy-and-Market-Practice/green-bonds/green-bond-principles/

RO
CKY MOUNTAIN
INSTIT UTE
WA R R O OM
CARBON
INNOVATIVE FUNDING OPTIONS FOR SUSTAINABLE AVIATION FUEL AT U.S. AIRPORTS 25
The use of Airport resources either in the form of cash or the payment of debt service, are subject to FAA regulations and potentially airline approval. The use of non-Airport resources, e.g. the tax levy may require the reprioritization of other projects and initiatives. FINANCE POLICY OPPORTUNITIES Government support for SAF is crucial. Fossil-based fuels benefit from over a century of technology innovations and many decades of public subsidies. To compete with conventional fuel, SAF currently requires price supports. Internationally, creating a price on carbon is a rational and logical place to start. The Port can play a meaningful role in each level of government; this section briefly presents various options. The International Civil Aviation Organization’s (ICAO) Carbon Offsetting and Reduction Scheme International Aviation (CORSIA) has the potential to make SAF consumption more economic for airlines. However, it will be less costly to reduce greenhouse gases via the purchase of out-of-sector carbon offsets, so airlines will be less likely to use SAF to meet their CORSIA obligations. There are opportunities for the Port to showcase leadership actions and demonstrate viable solutions to ICAO members at international meetings. Presenting innovative approaches to ICAO will foster interest and support on a global level. At the U.S. federal level, existing programs to support renewable fuels are essential. The Renewable Fuel Standard (RFS) and the price supports that go with a range of fuels collectively produce $1–2/gallon subsidies for SAF. RFS is a well-conceived program that paradoxically varies the magnitude of funding in relation to the price differential with crude products. Blending credits provide additional financial incentive to producers. USDA and DOE loan guarantees and funding for commercial production facilities can make the difference between a viable and a failed project. The maintenance and growth of these federal programs are critical for the development of SAF production facilities, and the Port should continue its support and advocacy role for these programs. The Port can assume a leadership role in working with the FAA to recognize the value of SAF, consistent with other airport spending, to reduce emissions. At the state level, Washington can create incentives for co-benefits in fuels. Oregon has new regulations regarding a low-carbon fuel standard (LCFS) that includes aviation, and California is in the process of modifying its own LCFS to include aircraft fuel on an opt-in basis (i.e. users of conventional jet fuel are not penalized, while users of SAF are incentivized). Adopting an LCFS in Washington or creating another carbon regulation approach that includes an opt-in option for domestic flights would be useful. Airlines have voiced a strong preference for the aviation industry to gain “opt-in” provisions and exemptions from mandated requirements within an LCFS. Opt-in participation generates financial incentives for voluntary SAF usage without additional regulatory burdens. The Port can influence state policy regarding carbon pricing and incentives. Washington State could create a Public Benefit Fund, described previously in this section, and the Port could play an influential role here as well. Locally siting facilities is a major hurdle given public concerns about new fuel production and the lack of recognition that liquid fuels can be produced sustainably. The Port can play a key role educating and engaging stakeholders to support SAF programs. Effective communication and response to community concerns will reduce developer challenges to retrofit or construct production facilities. The Port can also influence the local permitting process to ensure new infrastructure can be installed in the right locations.
RO
CKY MOUNTAIN
INSTIT UTE
WA R R O OM
CARBON
INNOVATIVE FUNDING OPTIONS FOR SUSTAINABLE AVIATION FUEL AT U.S. AIRPORTS 26
CONCLUSIONS AND NEXT STEPS The most viable role for the Port in developing the SAF market is to focus on funding SAF co-benefits. By sending a steady demand signal for SAF, the Port will incentivize producers to develop production capacity in the region. Although the Port cannot use funds to purchase fuel directly, it has historically been able to use funds to support clean air programs. The FAA has shown initial receptivity to the concept that payments for co-benefits may be eligible uses of revenue. The assessment of 14 co-benefit funding mechanisms showed that there is no silver bullet capable of fully covering the incremental cost. The estimated $6 million required to enable 1 percent SAF usage at Sea-Tac could be generated by a combination of the following mechanisms:
§ Corporate Support—corporations contribute to offset their flight emissions ($1 million to $2.5 million per year)
§ Port Taxing Authority—these funds support air quality benefits, similar to the Port’s Clean Truck Program ($360,000 to $720,000 per year)
§ Use of General Non-Aeronautical Revenue—while there are several individual non-aeronautical fees and revenue sources that could be directed toward SAF co-benefits (such as parking or landside fees), offering non-source specific revenues only when the airport achieves a particular total revenue threshold could create a low-risk, non-targeted source for SAF co-benefit funds ($1.0 to $4.0 million per year)
§ Airline Agreement—implement a fund via the airline operating agreement that is not subject to revenue sharing, or create a new fee ($380,000 to $1.5 million per year)
On the infrastructure side, the Port’s legal limitations prevent any significant role in developing production facilities. Therefore the Port’s efforts may be better targeted toward policy support and advocating for use of funding mechanisms toward SAF co-benefits. A longer-term fund commitment provides a form of assurance to investors. INSIGHTS AND NEXT STEPS The next step is a more rigorous assessment by Port staff of the feasibility to employ the mechanisms described in this report. The Port may be able to function in a unique capacity to facilitate SAF consumption with financing. By taking a leadership role, the Port may be able to ensure that all carriers have access to SAF. Creating a new and stable demand center would increase the viability of SAF for the aviation industry to develop a regional supply chain. Catalyzing SAF use yields a host of benefits for the Port, including reduced CO2 emissions and improved local air quality. Additionally, by addressing the incremental cost and playing a role in fund commitments, the airport indirectly incentivizes the development of infrastructure by providing long-term demand and de-risking the requisite investments. We suggest the following next steps to reach the goal of an in-state, small-scale SAF supply chain by 2020:
§ Engage Port staff in a more detailed assessment of funding mechanisms § Determine if/how the Port wants to engage at the State level § Determine if/how the Port wants to engage with the FAA on innovative SAF co-benefit funding
approaches § Formalize recognition for SAF co-benefits § Partner to develop and implement the selected co-benefit funding mechanisms and develop the
corresponding SAF volume projections § Leverage this market pull to create an in-state supply chain

RO
CKY MOUNTAIN
INSTIT UTE
WA R R O OM
CARBON
INNOVATIVE FUNDING OPTIONS FOR SUSTAINABLE AVIATION FUEL AT U.S. AIRPORTS 27
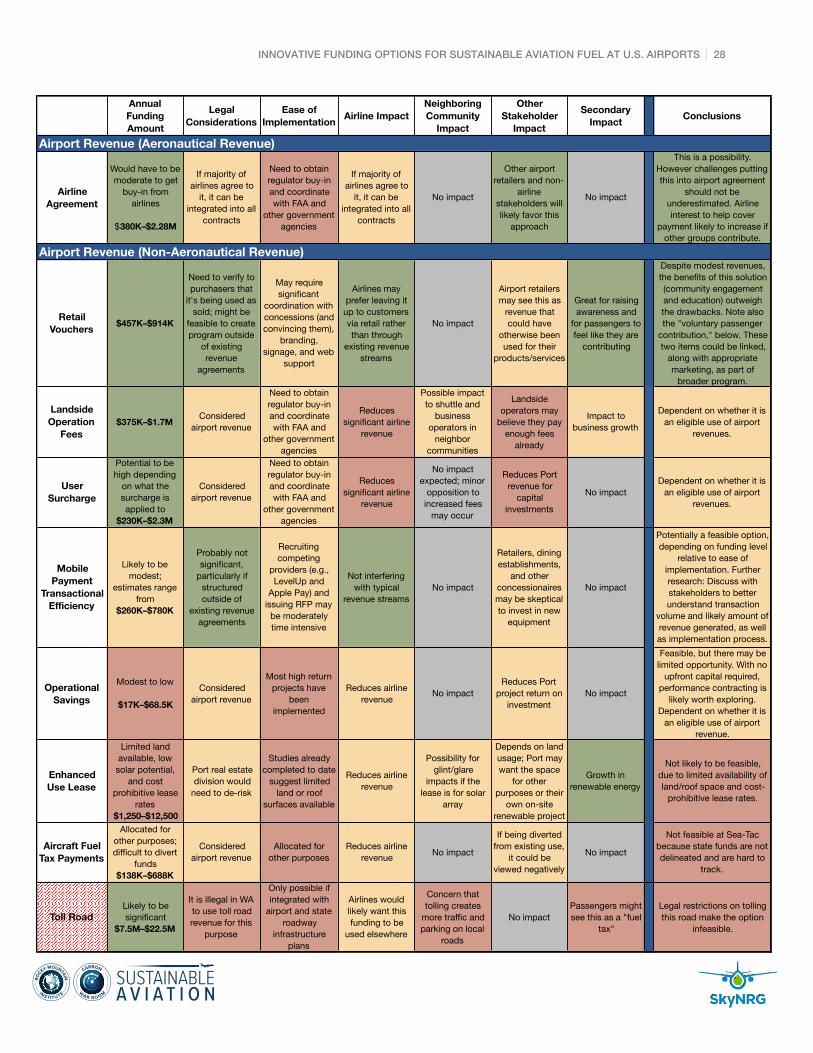
APPENDIX A DETAILED SAF CO-BENEFIT FUNDING MECHANISM EVALUATION MATRIX The matrix below shows the results of the detailed analysis of the long list of co-benefit funding mechanisms against the seven selection criteria. The following color-coding was used to assess the mechanisms:
§ Green—indicates high funding amount (greater than $500,000), minimal legal considerations, relative ease of implementation, and limited negative airline/community/stakeholder/secondary effects.
§ Yellow—indicates moderate funding amount (between $100,000 and $500,000), moderate legal considerations, moderate challenges to implementation, and moderate negative airline/community/stakeholder/secondary effects.
§ Red—indicates low funding amount (less than $100,000), significant legal considerations, significant challenges to implementation, and substantial negative airline/community/stakeholder/secondary effects.
§ Grey—indicates no negative airline/community/stakeholder/secondary effects.
RO
CKY MOUNTAIN
INSTIT UTE
WA R R O OM
CARBON
INNOVATIVE FUNDING OPTIONS FOR SUSTAINABLE AVIATION FUEL AT U.S. AIRPORTS 28
Annual Funding Amount
Legal Considerations
Ease of Implementation Airline Impact
Neighboring Community
Impact
Other Stakeholder
Impact
Secondary Impact Conclusions
Airline Agreement
Would have to be moderate to get
buy-in from airlines
$380K–$2.28M
If majority of airlines agree to
it, it can be integrated into all
contracts
Need to obtain regulator buy-in and coordinate with FAA and
other government agencies
If majority of airlines agree to
it, it can be integrated into all
contracts
No impact
Other airport retailers and non-
airline stakeholders will likely favor this
approach
No impact
This is a possibility. However challenges putting this into airport agreement
should not be underestimated. Airline interest to help cover
payment likely to increase if other groups contribute.
Retail Vouchers $457K–$914K
Need to verify to purchasers that
it's being used as sold; might be
feasible to create program outside
of existing revenue
agreements
May require significant
coordination with concessions (and convincing them),
branding, signage, and web
support
Airlines may prefer leaving it
up to customers via retail rather than through
existing revenue streams
No impact
Airport retailers may see this as
revenue that could have
otherwise been used for their
products/services
Great for raising awareness and
for passengers to feel like they are
contributing
Despite modest revenues, the benefits of this solution (community engagement and education) outweigh the drawbacks. Note also the "voluntary passenger
contribution," below. These two items could be linked,
along with appropriate marketing, as part of
broader program.
Landside Operation
Fees$375K–$1.7M Considered
airport revenue
Need to obtain regulator buy-in and coordinate with FAA and
other government agencies
Reduces significant airline
revenue
Possible impact to shuttle and
business operators in
neighbor communities
Landside operators may
believe they pay enough fees
already
Impact to business growth
Dependent on whether it is an eligible use of airport
revenues.
User Surcharge
Potential to be high depending
on what the surcharge is applied to
$230K–$2.3M
Considered airport revenue
Need to obtain regulator buy-in and coordinate with FAA and
other government agencies
Reduces significant airline
revenue
No impact expected; minor
opposition to increased fees
may occur
Reduces Port revenue for
capital investments
No impactDependent on whether it is
an eligible use of airport revenues.
Mobile Payment
Transactional Efficiency
Likely to be modest;
estimates range from
$260K–$780K
Probably not significant,
particularly if structured outside of
existing revenue agreements
Recruiting competing
providers (e.g., LevelUp and
Apple Pay) and issuing RFP may
be moderately time intensive
Not interfering with typical
revenue streamsNo impact
Retailers, dining establishments,
and other concessionaires may be skeptical to invest in new
equipment
No impact
Potentially a feasible option, depending on funding level
relative to ease of implementation. Further research: Discuss with stakeholders to better understand transaction
volume and likely amount of revenue generated, as well as implementation process.
Operational Savings
Modest to low
$17K–$68.5K
Considered airport revenue
Most high return projects have
been implemented
Reduces airline revenue No impact
Reduces Port project return on
investmentNo impact
Feasible, but there may be limited opportunity. With no
upfront capital required, performance contracting is
likely worth exploring. Dependent on whether it is
an eligible use of airport revenue.
Enhanced Use Lease
Limited land available, low
solar potential, and cost
prohibitive lease rates
$1,250–$12,500
Port real estate division would
need to de-risk
Studies already completed to date
suggest limited land or roof
surfaces available
Reduces airline revenue
Possibility for glint/glare
impacts if the lease is for solar
array
Depends on land usage; Port may want the space
for other purposes or their
own on-site renewable project
Growth in renewable energy
Not likely to be feasible, due to limited availability of land/roof space and cost-
prohibitive lease rates.
Aircraft Fuel Tax Payments
Allocated for other purposes; difficult to divert
funds$138K–$688K
Considered airport revenue
Allocated for other purposes
Reduces airline revenue No impact
If being diverted from existing use,
it could be viewed negatively
No impact
Not feasible at Sea-Tac because state funds are not delineated and are hard to
track.
Toll RoadLikely to be significant
$7.5M–$22.5M
It is illegal in WA to use toll road revenue for this
purpose
Only possible if integrated with
airport and state roadway
infrastructure plans
Airlines would likely want this funding to be
used elsewhere
Concern that tolling creates
more traffic and parking on local
roads
No impactPassengers might see this as a "fuel
tax"
Legal restrictions on tolling this road make the option
infeasible.
Airport Revenue (Aeronautical Revenue)
Airport Revenue (Non-Aeronautical Revenue)

RO
CKY MOUNTAIN
INSTIT UTE
WA R R O OM
CARBON
INNOVATIVE FUNDING OPTIONS FOR SUSTAINABLE AVIATION FUEL AT U.S. AIRPORTS 29
Annual funding Amount
Legal Considerations
Ease of Implementation Airline Impact
Neighboring Community
Impact
Other Stakeholder
Impact
Secondary Impact Conclusions
Port of Seattle Taxing
Authority
Could be moderate to significant
depending on Commission
priorities$360K–$720K
Need to examine state laws re: gift of public funds
Would require clear accounting and benefit value
Airlines less concerned with how tax dollars are used, more
with PFCs
King County communities may want other uses
of tax dollars
Taxpayer pushback; political will
No impact
Would require further discussion about level of
funding and further investigation of state law
precedents (i.e., could it be applied to air quality
improvements or other community benefits?).
Corporate Support
Depends on participants, but
could be substantial
$1M–$2.5M
SkyNRG and others have
considerable experience
setting this up
Requires effort to get participation from corporate
partners
As long as it's equitable among
all Sea-Tac Airlines
No impact No impactGood reputation for participating
corporations
This is a proven option that should be viable in the
Seattle region.
Voluntary Traveler
Contribution
Likely to be very modest, but
could become more significant
with time$230K–$690K
No major legal hurdles
Copy existing models
Appealing to airlines as it does
not impact traditional
revenue streams
No impact No impact
Great for raising awareness and
for passengers to feel like they are
contributing
See also Retail Vouchers, above. Funding amount could be modest initially, but might grow as more passengers participate.
Commodity Impact Factor
Probably modest
$73K–$131K
Easier if taken out of airport control
A precedent is helpful but with the CIF, carbon reduction from
biofuels becomes a direct
commodity and should be easier
to justify procurement
No impact No impact No impact No impact
Potentially viable revenue stream, pending timing.
Further research: Understand whether CIF for
jet fuel will be available within the necessary
timeline. May choose to recommend this option for
a future tranche of financing, even if it is not available in the near term.
Federal Grants
Grant funds likely to be substantial
$375K–$1.4M
FAA rules currently do not
allow VALE funds to be used for
SAF
Persuading FAA to make SAF an eligible project is
a challenge
No impact No impact No impact No impact
While there are ongoing discussions with the FAA to consider SAF as an eligible project for VALE grants, it is
a challenging effort. However, the funding
potential is high.
Non-Airport Revenue (Non-Port Revenue)
Non-Airport Revenue (Port Revenue)

RO
CKY MOUNTAIN
INSTIT UTE
WA R R O OM
CARBON
INNOVATIVE FUNDING OPTIONS FOR SUSTAINABLE AVIATION FUEL AT U.S. AIRPORTS 30
APPENDIX B CO-BENEFIT FUNDING MECHANISM REVENUE MAGNITUDE ESTIMATION ASSUMPTIONS AND CALCULATIONS Note: all funding amounts are estimated on an annual basis. AIRPORT REVENUE
A. AERONAUTICAL REVENUE 1. Airline agreement: $380,000–$2.28 million In 2015 landing fees totaled $76 million.9 A $500,000 increase in landing fee revenue constitutes a 0.65 percent increase. With the projected growth in landings at Sea-Tac, this increment may not even require increased rates; however, the marginal growth would need to be earmarked. There is significant flexibility in how this option could be designed to increase the revenue potential. While airline contracts are subject to FAA regulation, it may be possible to transmit funds through a third party, exempting the funds from revenue-sharing requirements. Additionally, funds are not exclusively limited to landing fees. Revenues from renegotiated airline agreement landing fees, while holding landings constant, are estimated as follows:
§ Low: 0.5% increase over $76 million = $380K § Base: 1.0% increase over $76 million = $760K § High: 3.0% increase over $76 million = $2.28M
B. NON-AERONAUTICAL REVENUE
2. Retail vouchers: $457,000–$914,000 In 2016 there were 45.7 million air passengers at Sea-Tac.10 It is assumed that this level of traffic will continue. Additionally, it is assumed that retail vouchers will have an exchange value of $1 per voucher, and that the program will be operated by a third party not affecting airport retailer revenue (exempting this option from airline revenue sharing). The level of uptake among passengers for a potential retail voucher program is estimated according to the following conservative scenarios:
§ Low: 1% uptake of 45.7M passengers at $1 per person = $457K § Base: 1.5% uptake of 45.7M passengers at $1 per person = $685.5K § High: 2% uptake of 45.7M passengers at $1 per person = $914K
3. Landside operation fees: $375,000–$1.7 million There are approximately 880,000 taxi trips and 750,000 transportation network company (TNC) (e.g., Uber, Lyft, etc.) rides per year at Sea-Tac.vi Total contracted ground transport is approximately 3.4 million trips. TNC services are currently charged $5 per trip by the Port, the cost of which is passed on to consumers, while taxis are charged $7 to $9 per trip.11 The TNC rates are based on a one-year pilot program started in April 2016. Relative to these existing charges, an additional $1 charge, earmarked for financing the co-benefits of SAF, seems minimal. The revenues from such a charge are estimated as follows:
§ Low: $1/ride charged just to TNC (750K rides) at 50% = $375K § Base: $1/ride charged to TNC and taxis (1.63M rides) at 50% = $815K § High: $1/ride charged to all contracted ground transport (3.4M rides) at 50% = $1.7M
vi An article in the Seattle Weekly states 571,000 taxi trips is 35% less than the total number in 2015 à suggests 880,000 taxi trips per year, historically. Article states taxis represent 26% of total ground transport à suggests 3.4 million trips for all ground transport. Article states TNC has 22% market share of ground transport à suggests 750,000 TNC rides per year. http://www.seattleweekly.com/news/uber-and-the-uncertain-future-of-taxis-at-the-airport/

RO
CKY MOUNTAIN
INSTIT UTE
WA R R O OM
CARBON
INNOVATIVE FUNDING OPTIONS FOR SUSTAINABLE AVIATION FUEL AT U.S. AIRPORTS 31
4. User surcharge: $230,000–$2.3 million Since this co-benefit funding mechanism has many potential ways of being applied, the possible range of revenues is large. Estimates are based on one surcharge option, in which all airport passengers are charged a nominal fee according to the following scenarios:
§ Low: $.01 surcharge on 46M passengers at 50% = $230K § Base: $.05 surcharge on 46M passengers at 50% = $1.15M § High: $.10 surcharge on 46M passengers at 50% = $2.3M
a. Parking fees: $160,000–$630,000 An example of an alternate option for a user surcharge is a parking fee. Parking revenues for the airport were $63 million in 2015.12 It is assumed that any marginal increase in retail revenues resulting from the use of mobile payment will be shared with airlines at a rate of 50 percent. It is assumed that parking revenues can be increased according to the following scenarios:
§ Low: 0.5% increase over $63M at 50% = $160K § Base: 1% increase over $63M at 50% = $315K § High: 2% increase over $63M at 50% = $630K
5. Mobile payment transactional efficiency: $260,000–$780,000 Experience among retail businesses has demonstrated that mobile payment use is on the rise, and that it has the ability to increase retail revenues due to reduced queues and less line attrition.13 According to the Port’s contracts with Signatory Airlines, all net revenue exceeding 125 percent of its annual debt service will be shared with airlines at a rate of 50 percent.14 It is assumed that any marginal increase in retail revenues resulting from the use of mobile payment will be shared with airlines at a rate of 50 percent. Dining and retail revenues for the airport were $52 million in 2015, and this is assumed to be representative of years going forward.15 The increase in retail revenues resulting from mobile pay are estimated according to the following scenarios:
§ Low: 1% increase of $52M at 50% = $260K § Base: 2% increase of $52M at 50% = $520K § High: 3% increase of $52M at 50% = $780K
6. Operational savings: $17,000–$68,500 While there are many variants to this mechanism, the funding estimation was based on the streamlined performance contracting option. Total aviation utility expenses were $13.7 million in 2016.16 It is assumed that any utility savings from this mechanism be fully diverted to fund the SAF co-benefits. The range of savings is estimated according to the following scenarios:
§ Low: 0.25% savings of $13.7 in utilities expense at 50% = $17K § Base: 0.50% savings of $13.7 in utilities expense at 50% = $34.3K § High: 1.00% savings of $13.7 in utilities expense at 50% = $68.5K
7. Enhanced use lease: $1,250–$12,500 Based on conversations with Josh Peterson, senior real estate manager with the Northwest Seaport Alliance and former seaport property manager with the Port of Seattle, general land rates in the port region are worth approximately $6,500/acre/month on the low end for bare lands with no improvements. Based on transactional data for solar leases, solar developers typically pay $500/acre/year.17 Solar potential in Seattle is also in the mid-to-low end.18 This leads to the conclusion that enhanced use leases for solar development are cost prohibitive in the Seattle region. However, other types of enhanced use leases besides solar could be viable. Additionally, if the Port were to identify unutilized land that was previously considered unviable for commercial development/leasing but could be used for solar farming, such land would carry a lower value that may be in the price range viable for solar leases. It is assumed that the amount of such land available at the Port varies according to the following scenarios:
§ Low: 5 acres at $500/acre/year at 50% = $1.25K § Base: 20 acres at $500/acre/year at 50% = $5K § High: 50 acres at $500/acre/year at 50% = $12.5K

RO
CKY MOUNTAIN
INSTIT UTE
WA R R O OM
CARBON
INNOVATIVE FUNDING OPTIONS FOR SUSTAINABLE AVIATION FUEL AT U.S. AIRPORTS 32
8. Aircraft fuel tax payments: $137,500–$687,500 RCW 82.42.030 authorizes the aircraft fuel tax and since 2005 has set the tax rate at 11 cents per gallon to be deposited into the aeronautics account.19 Over the 10 year period from 2005 to 2015, the tax generated on average $2.5 million per year, while revenues totaled $5.5 million in the 2011 to 2013 biennium.20 If the more recent data better represents current volumes, it is assumed that total annual aircraft fuel tax revenues equal $2.75 million. Since these funds are currently allocated to other projects, any new use of the revenues (e.g., to help finance the co-benefits of SAF) would require diversion from existing uses. We assume three potential scenarios with varying diversion rates as follows:
§ Low: 10% diversion of $2.75M at 50% = $137.5K § Base: 25% diversion of $2.75M at 50% = $343.8K § High: 50% diversion of $2.75M at 50%= $687.5K
9. Toll road: $7.5 million–$22.5 million This option is currently infeasible at the Port due to RCW Title 47, which restricts toll revenues to roadway improvements; however, a potential funding estimate is provided as if this were not the case. Approximately 40 percent of all Sea-Tac passengers arrive and depart by private vehicles on curbside drives, amounting to approximately 15 million personal vehicle trips and contributing to significant congestion. Revenues from this mechanism are estimated according to the following toll fee scenarios:
§ Low: $0.50 toll fee at 15M vehicles = $7.5M § Base: $1.00 toll fee at 15M vehicles = $15M § High: $1.50 toll fee at 15M vehicles = $22.5M
NON-AIRPORT REVENUE
A. PORT REVENUE 1. Port of Seattle taxing authority: $360,000–$720,000 The Port of Seattle’s 2017 tax levy is set at $72 million per year, while the maximum allowable levy is $98.7 million.21 There is significant flexibility in how the Port Commission can choose to allocate these tax revenues. While it is theoretically possible that the Commission might decide to allocate several million dollars of existing revenues towards an SAF co-benefit fund, in order to be conservative the following funding estimates assume that existing tax revenues are fully allocated and any amount available for an SAF fund could only be sourced from a tax increase. RCW Chapter 84.55 limits the annual growth of regular property taxes to the lesser of 1 percent or the inflation rate.22 Since inflation is above 1 percent currently, the levy cannot be increased beyond 1 percent.23 Provided any tax levy increase can be earmarked for the SAF co-benefits, estimates were made based on the following rate increase scenarios:
§ Low: 0.5% increase over $72 million = $360K § Base: 0.75% increase over $72 million = $540K § High: 1.0% increase over $72 million = $720K
B. NON-PORT REVENUE 2. Corporate support: $1 million–$2.5 million It is expected that the average corporate contribution will be $100K, with a range of $50K to $200K.24
§ Low: 10 corporate sponsors at $100K each = $1M § Base: 15 corporate sponsors at $100K each = $1.5M § High: 25 corporate sponsors at $100K each = $2.5M
3. Voluntary traveler contribution: $230,000–$690,000 Sea-Tac served 46 million passengers in 2016.25 The only existing voluntary traveler contribution program, The Good Traveler, currently charges $2 per certified carbon offset for 1,000 flying miles. To be conservative, it is assumed that volunteering passengers purchase a single offset for $1 each. Uptake among consumers for voluntary programs tends to be low; the level of involvement is estimated as follows:
§ Low: 0.25% uptake of 46M passengers at $1 each = $230K § Base: 0.50% uptake of 46M passengers at $1 each = $460K

RO
CKY MOUNTAIN
INSTIT UTE
WA R R O OM
CARBON
INNOVATIVE FUNDING OPTIONS FOR SUSTAINABLE AVIATION FUEL AT U.S. AIRPORTS 33
§ High: 0.75% uptake of 46M passengers at $1 each = $690K 4. Commodity impact factor: $73,000–$131,000 RMI-CWR and SkyNRG conducted work for a European airport, and estimated that 4,000 tons/year of SAF in a 1 percent blend would yield 14,600 tons of CO2 reduction. Since the European airport has less than half the annual passenger traffic as Sea-Tac, it is estimated that 8,000 tons/year of SAF would yield twice the CO2 reductions, or 29,200 tons. The price of carbon in existing voluntary carbon markets is used as a proxy for the price the Port could receive for carbon reductions, and revenues are estimated according to the following scenarios26:
§ Low: $2.50/ton for 29.2K tons of CO2 reduction = $73K § Base: $3.50/ton for 29.2K tons of CO2 reduction = $102K § High: $4.50/ton for 29.2K tons of CO2 reduction = $131K
5. Federal grants: $375,000–$1.375 million In 2016, the FAA awarded $31.1 million in VALE grants to eight airports.27 The average grant was $3.75 million, and the median grant was $3.35 million. Excluding outliers on the high and low end, the range of grants was $1.5 million to $5.7 million. Since grant applications can take two years to put together and there is no guarantee of being awarded, grant amounts are amortized over four years for each scenario.
§ Low: Low end of historical grants is $1.5M, over four years = $375K § Base: Approximate median historical grant is $3.5M, over four years = $875K § High: High end of historical grants is $5.5M, over four years = $1.375M
RO
CKY MOUNTAIN
INSTIT UTE
WA R R O OM
CARBON
INNOVATIVE FUNDING OPTIONS FOR SUSTAINABLE AVIATION FUEL AT U.S. AIRPORTS 34
ENDNOTES 1 “Facts & Figures,” Air Transport Action Group, http://www.atag.org/facts-and-figures.html 2 Ibid.3 Aviation Benefits Beyond Borders, Air Transport Action Group, July 2016. 4Lovins, Amory B., and Rocky Mountain Institute. Reinventing Fire: Bold Business Solutions for the New Energy Era. White River Junction, VT: Chelsea Green, 2013.5 Adapted from: The Aviation Sector’s Climate Action Framework, Air Transport Action Group, November 2015. 6 “Carbon Dioxide Emission Coefficients,” U.S. Energy Information Administration https://www.eia.gov/environment/emissions/co2_vol_mass.cfm 7 “ICAO Carbon Emissions Calculator Methodology, Version 7,” International Civil Aviation Organization, June 2014. http://www.icao.int/environmental-protection/CarbonOffset/Documents/Methodology%20ICAO%20Carbon%20Calculator_v7-2014.pdf 8 “2016 Year in Review,” Wunder Capital, http://assets.wundercapital.com/2016-year-in-review.pdf 9 “2017 Budget and Business Plan, Aviation,” Port of Seattle, https://www.portseattle.org/About/Financial-Info/Budget/Documents/2017/_09_sec_04_aviation.pdf, page IV-17. 10 “Airport Statistics,” Port of Seattle, https://www.portseattle.org/About/Publications/Statistics/Airport-Statistics/Pages/default.aspx 11 “Ride with Uber at Sea-Tac,” Uber, https://www.uber.com/airports/sea-tac/ and “A New Airport Contract Puts Taxi Drivers in a Tough Spot,” Sara Bernard, http://www.seattleweekly.com/news/a-new-airport-contract-puts-taxi-drivers-in-a-tough-spot/ and “App-based ride services may be able to pick up at Sea-Tac,” Evan Bush, http://www.seattletimes.com/seattle-news/app-based-ride-services-may-be-able-to-pick-up-at-sea-tac/ 12 “Comprehensive Annual Financial Report as of December 31, 2015 and 2014,” Port of Seattle, https://www.portseattle.org/About/Financial-Info/Documents/2015_cafr_final.pdf, page 65 13 “Starbucks wants your phone as much as it wants to sell you coffee,” John Kell, http://fortune.com/2015/07/24/starbucks-mobile-investments/ 14 “Signatory Lease and Operating Agreement 2013–2017,” Port of Seattle, http://aci-na.org/sites/default/files/sea-tac_airport_sloa_iii_2013_-_2017_-_execution_copy_-_9_10_13.pdf 15 “Comprehensive Annual Financial Report As of December 31, 2015 and 2014,” Port of Seattle, https://www.portseattle.org/About/Financial-Info/Documents/2015_cafr_final.pdf, page 65. 16 “2017 Budget and Business Plan, Aviation,” Port of Seattle, https://www.portseattle.org/About/Financial-Info/Budget/Documents/2017/_09_sec_04_aviation.pdf 17 “Pendleton airport leasing land for solar farm,” George Plaven, http://www.eastoregonian.com/eo/local-news/20141113/pendleton-airport-leasing-land-for-solar-farm 18 “Solar Energy Potential,” U.S. Department of Energy, https://energy.gov/maps/solar-energy-potential 19 “Washington Airport Investment Study,” Washington State Department of Transportation, https://www.wsdot.wa.gov/NR/rdonlyres/765B30A4-8E34-457A-986E-DDFC13DFBDAF/0/3FundingAirportInvestments.pdf, page 19. 20 “March 2015 Transportation Economic and Revenue Forecasts,” Washington State Office of Financial Management, http://www.ofm.wa.gov/budget/info/March15transposummary.pdf, page 34. 21 “Port of Seattle Tax Levy,” Port of Seattle, https://www.portseattle.org/About/Financial-Info/Pages/Tax_Levy.aspx 22 “2015 Budget and Business Plan, Levy,” Port of Seattle, https://www.portseattle.org/About/Financial-Info/Budget/Documents/2015/_14_2015_Levy.pdf 23 “12-month percentage change, Consumer Price Index,” Bureau of Labor Statistics, https://www.bls.gov/charts/consumer-price-index/consumer-price-index-by-category-line-chart.htm 24 Based on proprietary information. 25 “Airport Statistics,” Port of Seattle, https://www.portseattle.org/About/Publications/Statistics/Airport-Statistics/Pages/default.aspx 26 “Raising Ambition: State of the Voluntary Carbon Markets 2016,” Forest Trends,

RO
CKY MOUNTAIN
INSTIT UTE
WA R R O OM
CARBON
INNOVATIVE FUNDING OPTIONS FOR SUSTAINABLE AVIATION FUEL AT U.S. AIRPORTS 35
http://www.forest-trends.org/documents/files/doc_5242.pdf 27 “Press Release – FAA Awards $33.7 Million in Environmental Grants to Airports,” FAA, https://www.faa.gov/news/press_releases/news_story.cfm?newsId=21075

22830 Two Rivers Road
Basalt, CO 81621 USA
www.rmi.org
© July 2017 RMI. All rights reserved. Rocky Mountain Institute® and RMI® are registered trademarks.
Rapenburgerstraat 109
1011 VL Amsterdam, Netherlands
www.skynrg.com
22830 Two Rivers Road
Basalt, CO 81621 USA
www.rmi.org
© July 2017 RMI. All rights reserved. Rocky Mountain Institute® and RMI® are registered trademarks.
Rapenburgerstraat 109
1011 VL Amsterdam, Netherlands
www.skynrg.com