innovation responses to import competition …neudc2012/docs/paper_311.pdf · innovation responses...
TRANSCRIPT

Innovation Responses to Import Competition INCOMPLETE AND PRELIMINARY Leonardo Iacovone The World Bank Wolfgang Keller
Colorado Ferdinand Rauch
Oxford August 4, 2012 Abstract How does trade liberalization that raises a country's import competition affect the innovative activity of its firms? We exploit the strong growth of Chinese exports resulting from China's entry into the World Trade Organization in 2001 as a competitive shock to, specifically, Mexican manufacturing firms. Innovation is captured through information on the adoption of detailed firm level production techniques such as just in time inventory methods, quality control measures, and job rotation among the Mexican firms. Our results indicate that China's rise in global trade did not affect by much Mexico's rate of innovation, which contrasts with the substantial gains that others have found in the case of bilateral liberalizations. At the same time, there is a striking heterogeneity in the responses across firms for different productivities, with productive firms innovating more and less productive firms innovating less, which leads to positive selection in that initial differences in firm performance are sharpened by the advent of new competition. We discuss the implications of these findings for theories of trade and innovation.1
1 The authors thank Swati Dhingra, Amit Khandelwal, Mark Roberts, Andres Rodriguez-Clare, Jon Vogel, Stephen Yeaple, and participants at the LACEA September 2010 (San Jose) conference as well as participants at Columbia, Georgetown, Penn State, Princeton and NBER seminars for comments. The financial support of the World Bank's Research Support Budget is gratefully acknowledged.
1 Introduction
Trade liberalization in form of foreign market access improvements rarely encounters
domestic political opposition because it means higher exports and employment for
domestic firms. Economists have long supported the dismantling of trade barriers on
efficiency grounds, noting additional gains recently through the reallocation of firms'
market shares and increased incentives to innovate, among others (Pavcnik 2002,
Melitz 2003, Bernard et al. 2003, Aw, Roberts, and Winston 2007, Costantini and
Melitz 2008, Verhoogen 2008, Lileeva and Treer 2010, Bustos 2010). Given these
benefits from improved foreign market access, it is natural to ask how they compare
with the benefits from improving domestic access to foreign firms.
This paper addresses this question by examining innovation of Mexican firms in
response to increased competition from China between the years 1998 to 2004.
China's entry into world trade was the largest trade shock during the last 30 years.2
By becoming a member of the World Trade Organization (WTO) in 2001, China
gained new market access, and her already high rates of export growth accelerated.
Figure 1 shows the increasing presence of China on the world markets, with a
particular steep slope in the years after 1998. Mexico was among the countries most
strongly affected, because Mexico had substantial overlap with China in terms of
product range, and the location of Mexico next to the United States has made it
particularly vulnerable to competition from China. In comparison to its imports from
China, Mexico's exports to China over this period were trivial.
2 See Krugman (2008), Bloom, Draca, and Van Reenen, and Winters and Yusuf (2007).

Figure 1: Chinese exports over time
This setting yields an unparalleled opportunity to examine the innovative behavior of
firms under the threat of competition. Innovation has many dimensions, and relatively
little is known on which ones are most important. Some emphasize inventory
management while others the control of the production process, other observers see
workers as the crucial element while a fourth group focuses on computers and
equipment. This paper provides evidence on this and other specific forms of
innovation by Mexican firms as they faced new import competition from China. This
affords us a new look into the black box of firm-level innovation in response to
competitive shocks.3
3 The terms firm and plant are used interchangeably in this paper; the evidence below is on plants.

Our main findings are as follows. First, the aggregate level of innovation of Mexican
manufacturing firms did not change much with the new import competition from
China. In contrast, earlier studies have often found substantial overall effects
(Pavcnik 2002, Bloom, Draca, and Van Reenen 2009, Lileeva and Treer 2010). Our
second, and related finding is that the aggregate effect masks a striking
heterogeneous response across firms of different productivity. We find that relatively
productive firms innovate more in response to the China trade shock while less
productive firms innovate less. Import competition sharpens the difference between
strong and weak performing firms because it leads to innovation that amplifies the
initial difference. This is a positive dynamic selection finding.
Third, there is little evidence that the innovation strategies of Mexican firms can be
explained by market size reallocations. The sales growth of the firms that innovate
during the period of China's entry into the WTO is similar to the sales growth of firms
that do not innovate. While a market-size explanation of firm-level innovation is not
supported by our results, they are consistent with productive firms having relatively
more to gain from innovation than less productive firms, as, for example, in the model
of Aghion, Harris, Howitt, and Vickers (2001).4 We also find that a high degree of
intermediate good imports from Asia, foreign ownership, and a skilled labor force is
conducive to innovation in the face of import competition.
The gains from trade liberalization is a central question in international economics,
and this paper sheds new light on innovation gains in this context. It has long been
4 In Aghion, Harris, Howitt, and Vickers (2001), competition will provide greater incentives to innovate for high- compared to low-productivity firms because conditional on innovation, a high-productivity firm can win out against the foreign competitor in a limit pricing contest whereas the low-productivity firm cannot.

argued that trade liberalization can affect a country's rate of innovation, and analysis
of the detrimental impact of import substituting trade strategies adopted by many less
developed countries after World War II was early evidence of this (Krueger 1975,
Bhagwati 1978). Our work builds on and extends this research by emphasizing
heterogeneity as a determinant of firms' innovation choices (see surveys by Tybout
2003 and Redding 2010).
Our approach is distinct in two ways. First, we examine innovation in the sense of
particular organizational forms and production techniques. The specific way in which
a firm controls product quality, optimizes its inventory, and manages its operations
more generally explain much of the variation in economic performance across firms,
a finding emphasized in the business literature and more recently also by economists
(Womack, Jones, and Roos 1991 and Bloom and Van Reenen 2007, Syverson 2010,
respectively). In the context of trade liberalization, studies on the adoption of specific
firm techniques are extremely rare; an exception is Schmitz (2005) who presents a
case study on the abolition of restrictive work practices among North American iron
ore producers. Information on the introduction of computer systems needed for Just-
in-Time techniques is presented in Lileeva and Treer (2010), while Dhingra (2011)
employs direct evidence on production process innovations in analyzing trade-offs
faced by multi-product firms.
Comparatively little is known on how firms change their organizational structure and
their operations management in response to new sources of competition. The main
advantage of analyzing specific innovations is its potential for better understanding
the factors determining overall firm performance. When firm innovation is broken
down into its constituent parts, this will provide more information on which are the

truly crucial elements, and it also sheds new light on how individual choices fit
together to form the overall firm strategy. This information should prove valuable in
understanding the import and export behavior of _rms. In addition, particular
innovations may have quite different implications of trade liberalization on labor
markets and the economy as a whole. If innovation is mainly in form of improved
inventory management we would expect labor demand to become less skill biased
than if innovation is mostly in form of machinery replacing unskilled labor, for
example. In contrast, a focus on productivity changes does not give as much
information, also because the productivity changes that can be measured in practice
pick up changes in market power (Foster, Haltiwanger, and Syverson 2008), product
mix (Bernard, Redding, and Schott 2010, Mayer, Melitz, and Ottaviano 2010), and
factor market distortions (Hsieh and Klenow 2010) as well.
Second, we examine innovation responses to trade liberalization when the size of the
market is shrinking. There is a large literature on how an expanding market size
might increase innovation because innovation is complementary to the firm's decision
to export (Yeaple 2005, Verhoogen 2008, Costantini and Melitz 2008, Atkeson and
Burstein 2008, Lileeva and Treer 2010, and Bustos 2010)5, but this argument does
not apply in the case of new import competition because market size is generally
shrinking. Innovation in the face of new import competition must be driven by
something other than increases in firm scale, and in this respect our research relates
to research on the impact of changes in domestic competition and FDI entry (see
Holmes and Schmitz 2010 and Aghion, Blundell, Griffith, Howitt, and Prantl 2009,
respectively). Arguably, from a policy perspective the innovation response to 5 Similar market size effects are seen in the case of FDI; in particular, technology spending of firms that decide to supply Wal-Mart in Mexico (which increases the market size of the supplier) goes up relatively that of non-Wal-Mart suppliers (Iacovone, Javorcik, Keller, and Tybout 2010).

unilateral trade liberalization at home is just as important as the response to bi- or
multilateral liberalizations.
A recent contribution on the impact of import competition from China is Bloom, Draca,
and Van Reenen (2009).6 These authors emphasize that the contribution of trade in
generating wage inequality in rich countries is larger than generally presumed by
showing that this competition induced European firms to increase spending on
computers, which had a positive effect on the skill premium. Our work differs because
instead of technology investments we analyze specific organizational changes of the
firms, and moreover, in contrast to Bloom, Draca, and Van Reenen (2009) we find
strong heterogeneity in firms' innovation responses to competition, increasing for
some and decreasing for other firms.
The remainder of the paper is as follows. We start out by introducing the empirical
approach in section 2. The various forms of innovation analyzed in this paper are
introduced in section 3. This section also covers their basic features in our sample of
Mexican firms, which guides the empirical analysis. A description of our other data is
also in section 3. All empirical results are discussed in section 4, while section 5
provides some concluding discussion.
2 Estimating the relationship between innovation and
competition
6 Other research on the impact of China's recent entry into global trade includes Utar and Torres Ruiz (2010) and Iacovone, Rauch, and Winters (2010). The latter examine the impact of China's trade on the market shares of firms and products in Mexico, which is complementary to our emphasis on innovation. Utar and Torres Ruiz (2010) study productivity changes among Mexican export processing firms (maquiladoras) using familiar methods. Maquiladoras are also included in our sample below.

The empirical approach is this paper is straightforward. We relate firm-level
innovation to a variable that captures the change in import competition faced by
Mexican plants after China's entry into the World Trade Organization:
yi(j)t = β0 + β1 Δcompjt + γX + ui(j)t. (1)
Here, yi(j)t denotes a specific type of innovation of firm i, for example the adoption of
Just-in-Time (JIT). Firm i is observed in year t, and each firm belongs to a particular
six-digit industry j, the variable Δcompjt is the change in competition for industry j at
time t, the term X is a vector of other observable determinants of yi(j)t, and ui(j)t is an
error term. Our sample is a balanced panel of firms with two years of observations,
for 1998 and for 2004, which in equation (1) is estimated as a long-difference
regression. In the case of JIT as the dependent variable, for example, yi(j)t is equal to
one if the firm has introduced JIT between the years 2000 and 2004, and zero
otherwise.7 The goal is to consistently estimate β1 as the impact of competition
changes on innovation.
There are reasons to believe that β1 < 0; for example because increased competition
dissipates rents that are necessary to sustain innovation (Schumpeter), and there are
other reasons that would give β1 > 0; for example because increased competition
increases managerial effort (Schmidt 1997) or it may lower product line switching
7 We choose the years 2000 to 2004 because by the end of the year 1999 it had started to become clear that China would enter the WTO soon (official accession was in the year 2001).

costs (Holmes, Levine, and Schmitz 2008).8 At this point we are agnostic about the
sign of β1, the competition effect on innovation.
We will also generalize equation (1) by letting the impact of competition on innovation
depend on characteristics of the firm. Denoting a specific firm characteristic by qi(j)t,
the extended estimating equation becomes:
yi(j)t = β0 + β1 Δcompjt + β3 qi(j)t + β3(qi(j)t x Δcompjt) + γX + ui(j)t. (2)
Equation (2) includes the linear term in qi(j)t so that β3 captures only the differential
effect from changes in competition. The parameter β 3 is of key interest, because β3
not equal to 0 would indicate that the competition effect on innovation varies with the
firm characteristic. Several firm characteristics are prime candidates for qi(j)t. In line
with a large body of trade research emphasizing exogenous heterogeneity in
productivity, we will begin with the productivity of the firm in the year 1998, prior to
China's entry into the WTO.
Going beyond productivity, the analysis will be extended to other initial (year-1998)
determinants, such as the skill composition of the firm's labor force. Moreover, we will
also examine whether contemporaneous changes in firm characteristics between
1998 and 2004 are related to specific firm innovation between the years 1998 and
2004. On the one hand, it might be that the introduction of specific innovation and,
say, the training of the labor force are complementary activities. On the other, if both
activities eat up firm resources (and the firm is partially credit constrained), or
8 The theoretical literature of the impact of competition on innovation is covered in Bloom, Draca, and Van Reenen (2009) and Holmes and Schmitz (2010).

innovation and labor training are alternative ways of tackling new import competition,
the relationship between innovation and other contemporaneous firm changes may
be negative.
Consistent parameter estimation in (1) and (2) requires that a number of issues are
addressed. There is the possible endogeneity of the change-in-competition variable
Δcompjt as well as measurement error in our dependent variables, yi(j)t: Moreover,
several of our dependent variables, for example Just-in-Time (JIT), take on only the
value of zero and one. We will therefore estimate the equations not only with linear
probability models using least squares but also with probit models using maximum
likelihood. These issues will be discussed below.
The following section discusses the data sources and the definition of the innovation
variables.
3 Data
This paper employs data provided by Instituto Nacional de Estadística y Geografía
(INEGI), a Mexican statistical agency. We use surveys of manufacturing firms from
the years 2005 and 1999, which cover information for the years 2004 and 1998.
These surveys of the Encuesta Nacional de Empleo, Salarios, Tecnología y
Capacitación (ENESTyC), provide information on a large range of characteristics in
the area of technology, employment, and labor training salaries, in addition to basic
information on sales, investment, and age of the firm. The survey includes all
Mexican firms with more than 100 employees, and uses a sampling procedure that

ensures representativeness to include smaller firms. The data attaches a unique
identified to each firm that remains the same over time, which allows us to follow
firms over time.
In the section on firm organization, the ENESTyC questionnaires ask about the
existence (and in 2005 also the year of introduction) of a number of firm techniques.
These techniques define key elements of the operations management of the firm,
which is the business function responsible for planning, coordinating, and controlling
the resources needed to produce a firm's product (Reid and Sanders 2005). Most of
the specific techniques that we will study are part of operations management
concepts that became known in the 1980s and are sometimes collectively referred to
as lean manufacturing. These ideas originated mostly in Japan, specifically with the
car maker Toyota. They gained rapidly influence in business circles, and it is
reasonable to expect that these concepts were well-known in Mexican firms towards
the end of the 1990s.
While the concepts are related, each of them defines a particular aspect of the
techniques firms are employing. The following gives a list of techniques, followed by
a brief description of the key elements of each technique: (1) Total Quality
Management, (2) Statistical Quality Control, (3) Quality Control, (4) Just-in-Time
System, (5) Re-organization, (6) Job Rotation, (7) Worker Participation and (8)
Process Re-engineering.9
9 The following descriptions draw on a number of sources on operations management, mainly the INEGI manuals, but also in particular Reid and Sanders (2005).

(1) Total Quality Control: Total Quality Control, or Total Quality Management
(TQM), is an integrated effort designed to improve quality performance at
every level of the organization. TQM focuses on proactively identifying root
causes of reoccurring problems, correcting them at the source, where
customers ultimately determine what is important (customer-driven quality).
Key methods include continuous improvement, employee empowerment,
understanding quality control tools, and the formation of work groups acting as
problem-solving teams (so-called quality circles).
(2) Quality Control of Production: The question whether product quality is
meeting the pre-established standards. Quality Control uses a number of
statistical methods, in particular (i) Descriptive statistics, (ii) Statistical process
control, which is to determine whether a process is performing as expected,
and (iii) Acceptance sampling, where entire batches of products are accepted
or rejected by only inspecting a few items.
(3) Just-in-Time System: The goal is to get the right quantity of goods to the right
place exactly when they are needed. Key ideas are (i) to eliminate
unsynchronized production, unstreamlined layouts, and unnecessary material
handling (referred to as waste); (ii) to take a broad view of operations so that
the system, not individual tasks, are optimized; (iii) to make operations
simpler, with fewer steps (also less error prone); and (iv) to improve visibility
so that waste can be detected. Methods include so-called Kanbans and pull
production systems, quick setups and small lots, uniform plant loading, and
exible resources such as general-purpose equipment and multi-trained
workers.
(4) Re-Organization: The re-organization of the work facility in terms of
equipment, machinery, and installations. Re-organization can improve the

physical arrangement of resources within a facility. Standard forms of facility
layout are (i) process layouts, which groups similar resources together, and (ii)
product layouts, which is designed to produce a specific product efficiently. It
is central to have workstations in close physical proximity to reduce transport
and movement as well as streamline the ow of material. A key method is so-
called cellular manufacturing. Improved work facility layout also reduces the
probability of work risks, thereby reducing downtime.
(5) Job Rotation: Job rotation is a central part of the worker-related aspects of
modern operations management. It recognizes that in addition to the
advantages that labor specialization brings, it can also carry high costs in
terms of high absenteeism, high turnover rates, and high number of employee
grievances _led, at the same time when workers are dissatisfied because they
see little growth opportunity, control over work, room for initiative, and intrinsic
satisfaction in their work. Job rotation aims at changing that by shifting the
worker through several jobs to increase understanding of the total process,
together with the necessary skill training. This may also lead the worker to
make better decisions at their own departments and to increased
communication across various different departments of the firm.
(6) Statistical quality control: The questionnaires by INEGI specify that in this
question the surveyor asked for the installation of any system of quality
assurance, by which products are cross checked along certain check points
on the production chain if their quantity and quality matches predefined
standards.
(7) Worker participation: Surveyors were asked to determine if there was
regular communication with workers or if workers were directly involved in
decision making processes.
(8) Process re-engineering: This variable measures mayor changes to the
production change, that may involve new or improved equipment, or
streamlined production processes.
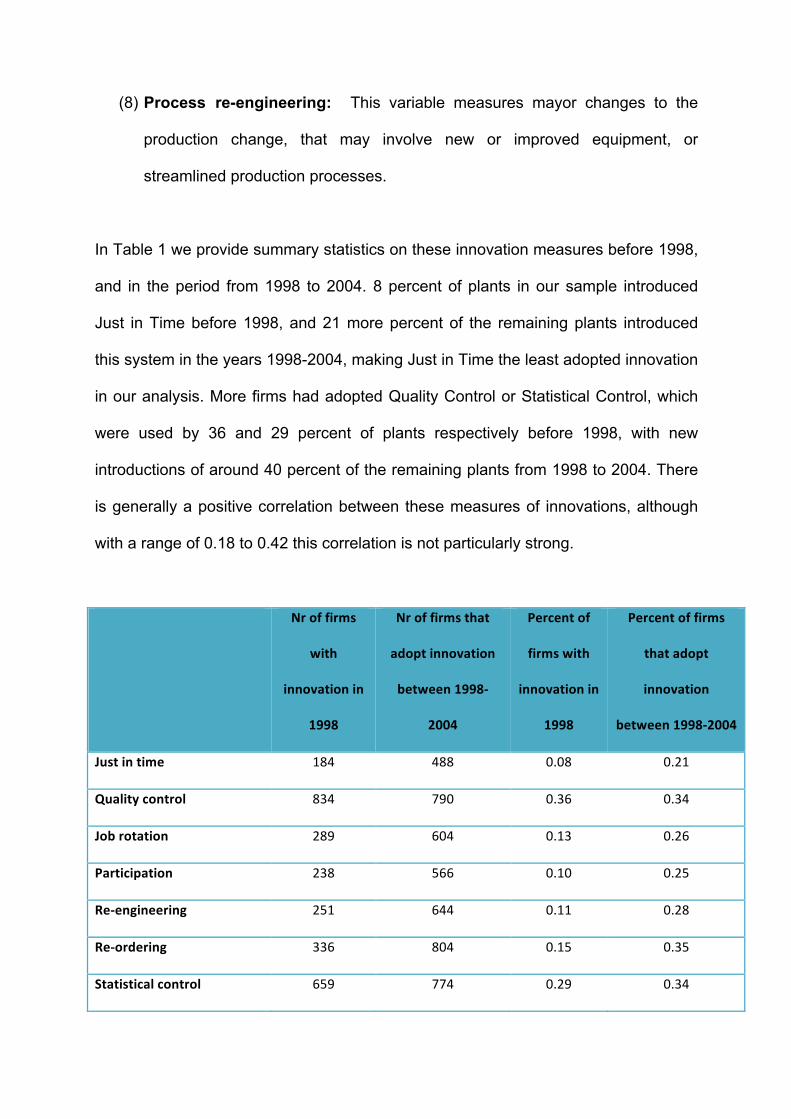
In Table 1 we provide summary statistics on these innovation measures before 1998,
and in the period from 1998 to 2004. 8 percent of plants in our sample introduced
Just in Time before 1998, and 21 more percent of the remaining plants introduced
this system in the years 1998-2004, making Just in Time the least adopted innovation
in our analysis. More firms had adopted Quality Control or Statistical Control, which
were used by 36 and 29 percent of plants respectively before 1998, with new
introductions of around 40 percent of the remaining plants from 1998 to 2004. There
is generally a positive correlation between these measures of innovations, although
with a range of 0.18 to 0.42 this correlation is not particularly strong.
Nr of firms
with
innovation in
1998
Nr of firms that
adopt innovation
between 1998‐
2004
Percent of
firms with
innovation in
1998
Percent of firms
that adopt
innovation
between 1998‐2004
Just in time 184 488 0.08 0.21
Quality control 834 790 0.36 0.34
Job rotation 289 604 0.13 0.26
Participation 238 566 0.10 0.25
Re‐engineering 251 644 0.11 0.28
Re‐ordering 336 804 0.15 0.35
Statistical control 659 774 0.29 0.34

Total quality control 447 875 0.19 0.38
Table 1: Innovation frequency in 1998 and innovation adoption from 1998 to 2004.
In addition to these variables, the ENESTyC surveys also include variables that are
relevant for innovation strategies of firms, in particular whether a firm exports, what
fraction of its sales it exports, whether a firm imports part of its materials and
intermediates, and if so from where, whether a firm is foreign owned, and at what
percentage; the skill composition of the firm's labor force, as well as the extent of
worker training that was performed. In addition, the surveys cover variables that
measure technology investment inputs, such as R&D expenditures and other
activities affecting the technological capabilities of the firm (such as technology
purchases, equipment purchases, and indicators of process and product innovation).
Our analysis will focus mainly on the adoption of specific firm techniques such as
Just-in-Time, for reasons laid out above.
Our measure of import competition is based on the actual market share gains of
Chinese exporters between the years 1998 and 2004.10 While we are interested in
the response of Mexican firms to Chinese competition, we recognize that Chinese
market share gains in Mexico are potentially endogenous to the performance of the
Mexican firms themselves. To address this issue, we employ information on Chinese
market share gains in the United States instead of Chinese gains in Mexico over this
period. By exploiting evidence on the competitive strength of China in a different,
10 We are in the process of adding policy measures--the change in tariffs—for a subset of industries as additional measures of changes in import competition.

much larger though closely related market, we are more plausibly examining an
exogenous shock to the Mexican manufacturing sector.
The import competition variable is the 1998-to-2004 change in the imports from
China in the United States, relative to all US imports, for narrowly defined industries.
We merge the survey information with the well known international trade data from
COMTRADE employing the concordance of Iacovone, Rauch, and Winters (2010).
This links the Mexican plant data at the six-digit level (CMAP 6) to the COMTRADE
trade data according to the Harmonized System (HS) classification.
The following section presents our empirical findings.
4 Empirical Results
We now turn to estimating the effect of competition from China on the innovative
behavior of Mexican plants. A simple estimation strategy is adopted in which
measures of innovation after China's entry into the WTO in 2001 are related to
competition from China and a number of control variables. We start with simple,
descriptive tables that convey the heterogeneous response of Mexican plants to
Chinese competition.
First we ask about characteristics of innovators. In Table 2 we restrict plants to those
that did not have a given innovation in the year 1998. We then decompose these
firms into those that have above or below median sales, and those that have above
or below median labor productivity, where we measure labor productivity as the share

of output to the number of all employees. We define both sales and productivity
relative to the four-digit industry to ensure that both the high- and the low-productivity
firm groups have firms from all industries.11
We compute the mean number of innovators for each of these four groups. Again
the table highlights that there was substantial innovation in the time period from 1998
to 2004 that we consider. The highest share of innovators is found for all innovations
for large and productive firms. It also seems that larger but less productive firms
seem to innovate more than productive small firms, possibly due to easier access to
funds.
Decomposition of firms by innovation and sales
mean number of firms that introduced innovation (number of these firms)
Sales low Sales high
Statistical control Lab prod low 0.461 (245) 0.468 (556)
Lab prod high 0.403 (556) 0.625 (283)
Quality control Lab prod low 0.556 (228) 0.51 (488)
Lab prod high 0.477 (488) 0.686 (261)
Total quality control Lab prod low 0.424 (271) 0.498 (637)
Lab prod high 0.386 (637) 0.642 (307)
Reordering Lab prod low 0.408 (292) 0.385 (672)
Lab prod high 0.365 (672) 0.554 (327)
Just in time Lab prod low 0.165 (309) 0.225 (730)
Lab prod high 0.178 (730) 0.413 (346)
11Lileeva and Trefler (2010) have recently adopted a similar approach.

Re‐engineering Lab prod low 0.282 (294) 0.329 (712)
Lab prod high 0.235 (712) 0.485 (330)
Job rotation Lab prod low 0.283 (300) 0.259 (688)
Lab prod high 0.263 (688) 0.479 (334)
Particip Lab prod low 0.259 (305) 0.247 (709)
Lab prod high 0.226 (709) 0.45 (338)
Table 2: In this table we consider firms that did not have the corresponding innovation in 1998. We
decompose these firms by above/below median sales and labor productivity, measured as output per
worker. For each of the four groups we display the mean number of firms that innovated in that
group, and the number of firms in that group in brackets.
In Table 3 we repeat the exercise, but replace the measure of labor productivity by
our measure of Chinese competition in the decomposition. This table demonstrates
the main findings of this paper. First, firms that face more competition from China
seem to innovate more, although this effect is not universal, and can be rather small.
Second, larger firms innovate more. This second effect is stronger and more robust
than the first. Plants that are both, large and that face a high degree of competition
from China innovate most. This finding holds for all innovations separately.
Decomposition of firms by innovation and sales
mean number of firms that introduced innovation (number of these firms)
Chinese
competition low
Chinese competition
high
Statistical control Sales low .432 (374) .409 (427)
Sales high .479 (427) .563 (412)
Quality control Sales low .521 (336) .492 (380)

Sales high .515 (380) .629 (369)
Total quality control Sales low .381 (417) .411 (491)
Sales high .523 (491) .566 (453)
Reordering Sales low .379 (440) .375 (524)
Sales high .437 (524) .444 (475)
Just in time Sales low .194 (483) .156 (556)
Sales high .259 (556) .312 (520)
Re‐engineering Sales low .259 (452) .239 (554)
Sales high .361 (554) .398 (488)
Job rotation Sales low .263 (451) .273 (537)
Sales high .307 (537) .356 (485)
Particip Sales low .240 (468) .231 (546)
Sales high .280 (546) .347 (501)
Table 3: In this table we consider firms that did not have the corresponding innovation in 1998. We
decompose these firms by above/below median sales and Chinese competition, measured as share
of Chinese in total imports. For each of the four groups we display the mean number of firms that
innovated in that group, and the number of firms in that group in brackets.
To determine statistical significance, we now turn to a regression analysis of these
findings. To keep the number of regressions manageable, we aggregate the eight
innovations into one innovation index, which is a count of innovations that a firm
introduced in the years 1998-2004. We exclude 67 firms that had all eight
innovations in 1998, and therefore cannot by construction contribute any meaningful
variation to the analysis. We use fixed effects to control for the initial number of
innovations that a firm has.
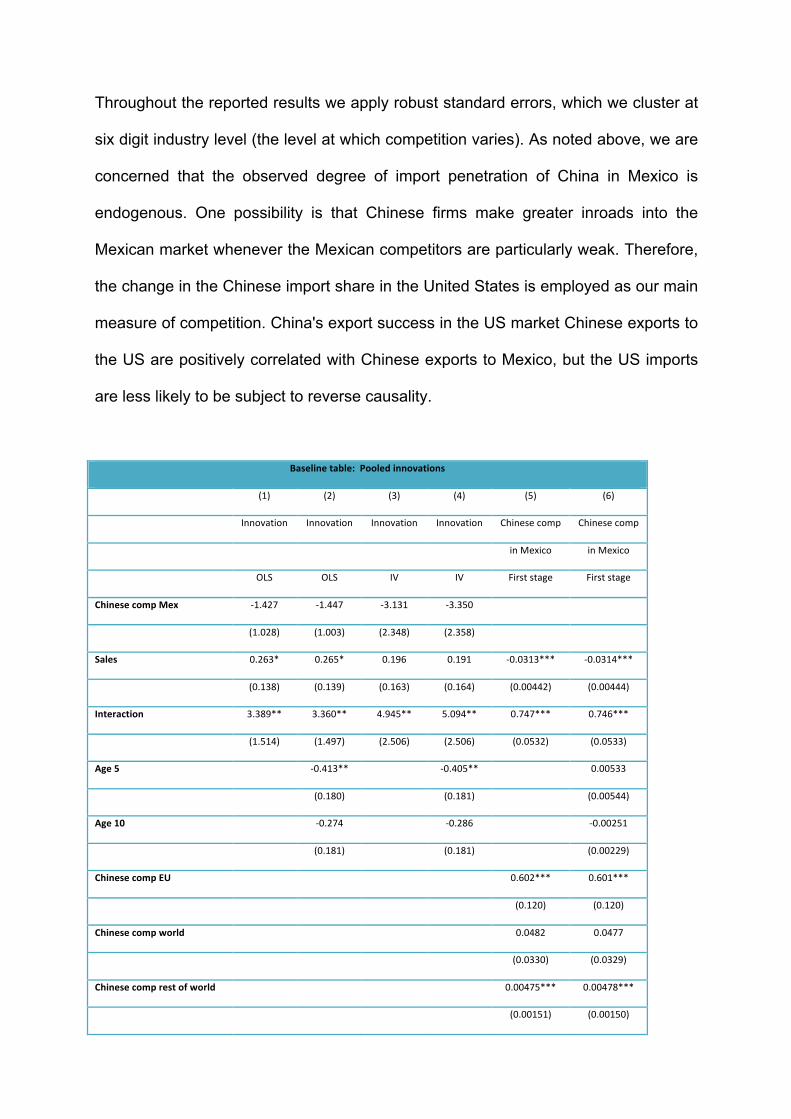
Throughout the reported results we apply robust standard errors, which we cluster at
six digit industry level (the level at which competition varies). As noted above, we are
concerned that the observed degree of import penetration of China in Mexico is
endogenous. One possibility is that Chinese firms make greater inroads into the
Mexican market whenever the Mexican competitors are particularly weak. Therefore,
the change in the Chinese import share in the United States is employed as our main
measure of competition. China's export success in the US market Chinese exports to
the US are positively correlated with Chinese exports to Mexico, but the US imports
are less likely to be subject to reverse causality.
Baseline table: Pooled innovations
(1) (2) (3) (4) (5) (6)
Innovation Innovation Innovation Innovation Chinese comp Chinese comp
in Mexico in Mexico
OLS OLS IV IV First stage First stage
Chinese comp Mex ‐1.427 ‐1.447 ‐3.131 ‐3.350
(1.028) (1.003) (2.348) (2.358)
Sales 0.263* 0.265* 0.196 0.191 ‐0.0313*** ‐0.0314***
(0.138) (0.139) (0.163) (0.164) (0.00442) (0.00444)
Interaction 3.389** 3.360** 4.945** 5.094** 0.747*** 0.746***
(1.514) (1.497) (2.506) (2.506) (0.0532) (0.0533)
Age 5 ‐0.413** ‐0.405** 0.00533
(0.180) (0.181) (0.00544)
Age 10 ‐0.274 ‐0.286 ‐0.00251
(0.181) (0.181) (0.00229)
Chinese comp EU 0.602*** 0.601***
(0.120) (0.120)
Chinese comp world 0.0482 0.0477
(0.0330) (0.0329)
Chinese comp rest of world 0.00475*** 0.00478***
(0.00151) (0.00150)

Observations 2080 2080 2080 2080 2080 2080
F statistic 119.09 112.2
Table 4: Pooled innovations. We use fixed effects for 2 digit industries, and cluster at the level of six
digit industries. The sales variable is a dummy variable that takes a value of one for above median
size.
Table 4 shows results for estimating equation 2 with the pooled innovation measure.
The competition variable is again an indicator to show above median change in the
import share from China in the United States between 1998 and 2004 (6-digit level).
Sales is an indicator for above median sales in the initial year, 1998. Again this
measure is computed within four digit industries. The other included variables are,
first, the geographical distance of the plant to the United States border which is a
determinant of the US orientation (especially the export-processing maquiladoras).
We also control for whether a plant is located in Mexico City or not, and a set of age
indicators (age greater than 10 years is the excluded category). We also include two-
digit industry fixed effects which capture broader industry trends. Estimation method
is OLS, with p-values based on robust and clustered (6-digit industry) standard errors
reported in parentheses.
Column (1) shows the results of estimating equation 2 in OLS. First, note that the
coefficient on initial sales positive, albeit not strongly significant. This gives some
weak evidence that strong past performance --which led to high productivity by
1998—may translate into higher rates of innovation.
There is, however, a key distinction between high and low productivity firms in terms
of their innovative response in the face of import competition. Innovation rates of low
productivity firms fall when they are hit by competition, whereas innovation rates of

high productivity firms do not. In fact, since the joint effect of the competition and
interaction variable in column (1) is positive, about 1.9, the typical firm with sales in
the year 1998 speeds up innovation whereas low productivity firms slow down
innovation activities. In column (2) we add the mentioned control variables, which do
not alter the effects much.
In columns (3) and (4) we repeat these estimation adopting an instrumental variables
approach. We instrument Chinese exports to Mexico by Chinese exports of that
same six digit product to the EU, to the world (excluding Mexico, the US and the EU),
and Chinese exports of that good to the world excluding Mexico and the US. We
take the view that Chinese export decisions concerning exports to the EU are taken
independently of behavior of Mexican plants, while reflecting production
developments in China. The results of these IV estimations are qualitatively and
quantitatively similar to the OLS results.
Columns (5) and (6) show the corresponding first stages. All coefficients show the
expected sign of a positive correlation between Chinese exports of products to the
EU or the rest of the world and Chinese exports of the same good to Mexico. The
first stage F-statistics are both over 100.
In Table 5 we add to the OLS estimation from Table 4 a second interaction term that
measures productivity of firms. We use the ratio of white to blue collar workers, and
create again a variable that indicates above median competition by that measure.
We again find that the larger and the more productive firms innovate more. The
competition variable itself, and its interactions with size and productivity are not
statistically significant. The triple interaction however is large in magnitude and

statistically significant in both specifications. This table demonstrates that within the
larger plants, the more productive ones are especially likely to respond to the
Chinese competition with innovation.
Multiple interactions (1) (2) Innovation Innovation Sales 0.277** 0.281** (0.139) (0.140) White over blue collar workers 0.393*** 0.376*** (0.140) (0.142) Chinese comp Mex ‐0.570 ‐0.574 (1.371) (1.355) Sales x comp 0.118 0.0510 (1.740) (1.730) Collar ratio x comp ‐1.147 ‐1.175 (1.755) (1.748) Collar ratio x sales x comp 4.863** 4.946** (2.357) (2.343) Age 5 ‐0.337* (0.181) Age 10 ‐0.199 (0.179) Observations 2143 2143
Table 5: Pooled innovations in OLS. We use fixed effects for 2 digit industries, and cluster at the level of six digit industries. The sales variable is a dummy variable that takes a value of one for above median size. The white over blue collar workers variable is a dummy variable that takes a value of one for above mean collar ratios.
We conduct a number of tests to see if the measure that just considers firms above
or below the mean is the appropriate one. In Table 6 we decompose the plants into
the bottom, medium and top third by size and generate dummy variables indicating
each of these categories. We then interact each of these with the Chinese
competition indicator. The table shows some robustness of the findings above. Both
in the linear effect, and in the interaction, the largest firms show the strongest
response to Chinese competition. Significance of the interaction term is lower than in
the previous estimation, but the mean effect for the large firms is stronger.

Three size terciles (1) Innovation Q1 ‐0.273* (0.144) Q2 Omitted Q3 0.471*** (0.155) Q1 x comp ‐1.244 (1.371) Q2 x comp ‐0.734 (1.106) Q3 x comp 2.416* (1.369) Age 5 ‐0.328* (0.181) Age 10 ‐0.281 (0.179) Observations 2143
Table 6: Pooled innovations. We use fixed effects for 2 digit industries, and cluster at the level of six digit industries. Q1 indicates the third of the smallest firms, Q2 the mid sized firms, and Q3 the largest firms.
Tables 7 and 8 (at the end of this document) exploit the same question by estimating
the same equation as in the baseline table in OLS and IV but with different size
cutoffs. These tables help us to find at which percentile the discontinuity of Mexican
firms rests. We find in both tables that the choice of cutoffs does not alter the
significance of the interaction term by much. We find strong and significant
interactions in both OLS and IV for the top 10, 15, 25, 33 or 50 percent of firms.
Coefficients seem to increase if we consider fewer firms for which we set the size
control to one, however we seem to lose some statistical power along the way.
We conclude that the finding that productive firms innovate more in response to the
China trade shock while less productive firms innovate less is solid, and seems to be
robust to a number of alternative specifications. It means that import competition
sharpens the difference between strong- and weak performing firms because it leads

to innovation that amplifies the initial difference. We emphasize that we find little
evidence that strong firms generally innovate more, but rather that import competition
triggers this response leading to positive dynamic selection.
Moreover, the response difference of strong versus weak performing firms can only
be explained in a framework that allows for a non-monotonic relationship between
innovation and competition. One possibility is the escape-competition effect modeled
by Aghion et al. (2001). In contrast, while a Schumpeterian argument may explain
why low productivity firms innovate less it is inconsistent with high productivity firms
innovating at the same time more. Alternatively, if increased competition increases
innovation by reducing agency problems, there must be another explanation for why
low productivity firms reduce innovation in the face of import competition from China.
5 Conclusion
The Schumpeterian hypothesis that monopolists have a greater incentive to innovate
than firms facing tough competition has been revisited by new theory and empirical
results finding that more competition may on balance actually increase the rate of
innovation. In our analysis of the impact of China's emergence as a force in
international trade, we find that the rate of innovation of Mexican plants seems on
average unaffected. This may be specific to the shock we are analyzing, which is
extraordinary in many respects. At the same time, there is strong evidence that firms
with higher labor productivity tend to innovate more than less productive firms in the
face of new competition.

For this investigation, we rely on data from surveys on Mexican plants, that allow us
to distinguish various specific measures of innovation, such as the introduction of
Just in Time management system, job rotation schemes, quality controls, continuous
controls and production re-organizations. We find for all these measures that more
productive plants are more likely to introduce them as a response to the unilateral
competition from China than less productive plants. This difference is strongest for
Just in Time. Import competition is thus a force that sharpens the difference between
strong-performing and weak-performing firms, a result that is in line with the more
qualitative body of research on countries' foreign trade strategies that has been
accumulated since World War II.
References Aghion, P., R. Blundell, R. Griffith, P. Howitt and S. Prantl (2009), ``The Effects of Entry on Incumbent Innovation and Productivity'', Review of Economics and Statistics, vol. 91, no. 1, pp. 20-32. Atkeson, Andrew and Ariel Burstein, ``Pricing to Market, Trade Costs, and International Relative Prices'', American Economic Review, December 2008 Aw, Bee Yan, Mark Roberts and Daniel Yi Xu, ``R\&D investments, exporting and the evolution of firm productivity'', American Economic Review: Papers \& Proceedings 2008, 98:2, 451--456 Bernard, Andrew, Jonathan Eaton, J. Bradford Jensen and Samuel S. Kortum, ``Plants and Productivity in International Trade'', American Economic Review, 93(4), 2003 Bhagwati, J. (1978), Anatomy and Consequences of Exchange Control Regimes}, Ballinger. Bloom, N., M. Draca and J. Van Reenen (2009), ``Trade Induced Technical Change: The Impact of Chinese Imports on Innovation Diffusion and Productivity'', mimeo, Stanford University. Bloom, N. and J. Van Reenen, ``Measuring and Explaining Management Practices Across Firms and Countries'', The Quarterly Journal of Economics 122: 1351-1408.

Bustos, Paula, Trade Liberalization, Exports and Technology Upgrading: Evidence on the Impact of MERCOSUR on Argentinean Firms, American Economic Review, 2010. Costantini, James A., and Marc J. Melitz, ``The Dynamics of Firm-Level Adjustment to Trade,'' in The Organization of Firms in a Global Economy, Elhanan Helpman, Dalia Marin, and Thierry Verdier, eds. (Cambridge, MA: Harvard University Press, 2008). De Loecker, J. (2007), ``Do exports generate higher productivity? Evidence from Slovenia'', Journal of International Economics, vol. 73, no. 1, pp. 69-98. Erdem E. and J. Tybout, (2003), ``Trade policy and industrial sector responses: using evolutionary models to interpret the evidence'', in Susan Collins and Dani Rodrik, eds., Brookings Trade Forum 2003, Washington, DC.: The Brookings Institution. Fernandes, A., ``Trade policy, trade volumes and plant-level productivity in Colombian manufacturing industries'', Journal of International Economics, Vol. 71. Fernandes, A. and C. Paunov, (2010), ``Does Trade Stiumlate Innovation? Evidence from Firm-Product Data'', OECD Development Centre Working Papers 286, OECD, Development Centre. Goldberg, P., A. Khandelwal, N. Pavcnik and P. Topolova (2009), ``Trade Liberalization and New Imported Inputs'', forthcoming, Quarterly Journal of Economics Iacovone, L., F. Rauch and L. Winters (2010), ``Trade as Engine of Creative Destruction'', mimeo, The World Bank. ``International Encyclopedia of Business & Management'', Routledge Publishing, New Fetter Lane, London, 1996 Javorcik, B., W. Keller, and J. Tybout (2008), ``Openness and Industrial Responses in a Wal-Mart World: A Case Study of Mexican Soaps, Detergents and Surfactant Producers'', World Economy, December 2008. Keller, W. and S. Yeaple, (2009), ``Multinational enterprises, international trade, and productivity growth: firm-level evidence from the United States'', The Review of Economics and Statistics, vol. 91, no. 4, pp. 821-831. Krueger, A. (1978), Liberalization Attempts and Consequences, NBER. Lileeva, A., and D. Trefler (2010), ``Improved Access To Foreign Markets Raises Plant-Level Productivity...For Some Plants'', Quarterly Journal of Economics, August 2010, 1051-1099. Melitz, M. (2003), ``The Impact of Trade on Intra-Industry Reallocations and Aggregate Industry Productivity'', Econometrica, Vol. 71, No. 6 (Nov., 2003), pp. 1695-1725.

Muendler, M. (2004), ``Trade, Technology, and Productivity: A Study of Brazilian Manufacturers, 1986-1998'' University of California at San Diego Economics Working Papers. Pavcnik, N. (2002), Trade Liberalization Exit, and Productivity Improvements: Evidence from Chilean Plants Review of Economic Studies. Redding, Stephen (2010), Schmitz, Topalova, P., and A. Khandewal (2010), ``Trade liberalization and Firm productivity: The Case of India'', forthcoming, Review of Economics and Statistics. Verhoogen, Eric, ``Trade, Quality Upgrading and Wage Inequality in the Mexican Manufacturing Sector,'' Quarterly Journal of Economics, 123 (2008), 489--530. Womack, J., D. Jones and D. Roos (1991), ``The machine that changed the world'', New York: Harper Collins. Yeaple, Stephen, A Simple Model of Firm Heterogeneity, International Trade, and Wages\textquotedblright , Journal of International Economics, 2005, 65(1): 1-20.

Different size cutoffs
(1) (2) (3) (4) (5) (6) (7) (8) (9) (10) (11) (12)
Innovation Innovation Innovation Innovation Innovation Innovation Innovation Innovation Innovation Innovation Innovation Innovation
Chinese competition ‐1.632 ‐1.497 ‐1.305 ‐1.132 ‐1.459 ‐1.253 ‐1.019 ‐0.832 ‐0.870 ‐0.704 ‐0.825 ‐0.678
(1.288) (1.247) (1.099) (1.070) (0.943) (0.919) (0.912) (0.893) (0.855) (0.835) (0.807) (0.787)
Sales 0.333** 0.323** 0.286** 0.281** 0.443*** 0.444*** 0.605*** 0.611*** 0.792*** 0.796*** 0.968*** 0.964***
(0.137) (0.136) (0.129) (0.128) (0.149) (0.147) (0.164) (0.164) (0.203) (0.199) (0.257) (0.251)
Interaction 3.027* 2.937* 3.355** 3.157** 4.533*** 4.179** 3.606* 3.260* 3.839* 3.467* 4.728** 4.350*
(1.709) (1.675) (1.626) (1.599) (1.713) (1.701) (1.836) (1.825) (2.077) (2.064) (2.270) (2.257)
age5 ‐0.380** ‐0.412** ‐0.406** ‐0.441** ‐0.427** ‐0.389**
(0.183) (0.183) (0.186) (0.186) (0.189) (0.186)
age10 ‐0.322* ‐0.318* ‐0.309* ‐0.321* ‐0.317* ‐0.306*
(0.185) (0.183) (0.182) (0.182) (0.185) (0.185)
Observations 2143 2143 2143 2143 2143 2143 2143 2143 2143 2143 2143 2143
Cutoff 0.66 0.66 0.5 0.5 0.33 0.33 0.25 0.25 0.15 0.15 0.1 0.1
Table 7: OLS, pooled innovations. We use fixed effects for 2 digit industries, and cluster at the level of six digit industries. The cutoff indicates the percentile of firms for which the sales dummy indicates a value of one.

Different size cutoffs
(1) (2) (3) (4) (5) (6) (7) (8) (9) (10) (11) (12)
Innovation Innovation Innovation Innovation Innovation Innovation Innovation Innovation Innovation Innovation Innovation Innovation
Chinese competition ‐4.151 ‐3.573 ‐3.375 ‐2.995 ‐2.953 ‐2.627 ‐2.713 ‐2.416 ‐2.153 ‐1.897 ‐2.470 ‐2.228
(3.312) (3.298) (2.349) (2.359) (1.965) (1.982) (1.854) (1.874) (1.661) (1.674) (1.559) (1.565)
Sales 0.231 0.239 0.204 0.209 0.390** 0.395** 0.551*** 0.560*** 0.707*** 0.713*** 0.805*** 0.800***
(0.194) (0.192) (0.158) (0.156) (0.167) (0.165) (0.179) (0.179) (0.217) (0.213) (0.256) (0.251)
Interaction 5.371 4.861 5.273** 4.884* 5.827** 5.371** 4.987** 4.552* 4.786** 4.346* 6.391** 5.940**
(3.349) (3.323) (2.514) (2.503) (2.264) (2.272) (2.328) (2.335) (2.412) (2.416) (2.500) (2.499)
age5 ‐0.369** ‐0.403** ‐0.395** ‐0.429** ‐0.420** ‐0.352*
(0.186) (0.185) (0.188) (0.189) (0.192) (0.185)
age10 ‐0.332* ‐0.328* ‐0.317* ‐0.331* ‐0.327* ‐0.327*
(0.184) (0.182) (0.181) (0.181) (0.183) (0.184)
Observations 2143 2143 2143 2143 2143 2143 2143 2143 2143 2143 2143 2143
Cutoff 0.66 0.66 0.5 0.5 0.33 0.33 0.25 0.25 0.15 0.15 0.1 0.1
Table 8: IV, pooled innovations. We use fixed effects for 2 digit industries, and cluster at the level of six digit industries. The cutoff indicates the percentile of firms for which the sales dummy indicates a value of one.