innovation, quality management and learning: a … · innovation, quality management and learning:...
TRANSCRIPT

Innovation, quality management and learning: a dynamic analysis
1
PAGE TITLE HERE
Innovation, quality management and learning: a dynamic analysis
Jane Bourke and Stephen Roper ERC Research Paper No.30 May 2015
Innovation, quality management and learning: a dynamic analysis
2
Innovation, quality management and learning: a dynamic analysis
Jane Bourke University College Cork
Stephen Roper
Warwick Business School [email protected]
This paper is published by the independent Enterprise Research Centre. The Enterprise Research Centre is a partnership between Warwick Business School, Aston Business School, Imperial College Business School, Strathclyde Business School, Birmingham Business School and De Montfort University. ERC is funded by the Economic and Social Research Council (ESRC); the Department for Business, Innovation & Skills (BIS); the Technology Strategy Board (TSB); and, through the British Bankers Association (BBA), by the Royal Bank of Scotland PLC; Bank of Scotland; HSBC Bank PLC; Barclays Bank PLC and Lloyds TSB Bank PLC. The support of the funders is acknowledged. The views expressed are those of the authors and do not necessarily represent the views of the funders.
Innovation, quality management and learning: a dynamic analysis
3
CONTENTS
ABSTRACT ...................................................................... 4
1. INTRODUCTION ........................................................... 5
2. CONCEPTS AND HYPOTHESES ................................ 7
2.1 Quality improvement.............................................. 7
2.2 Innovation and quality management ...................... 10
2.3 Hypotheses ........................................................ 12
3. DATA AND METHODS ............................................... 18
4. RESULTS ................................................................... 22
4.1 Dynamic analysis ................................................ 22
4.2 Complementarity and learning-by-using effects ...... 25
4.3 Robustness tests ................................................ 28
4.4 Discussion.......................................................... 29
5. CONCLUSION ............................................................ 31
REFERENCES ................................................................ 41
Innovation, quality management and learning: a dynamic analysis
4
ABSTRACT
Quality improvement and innovation are central strategies for firms in an
increasingly globalised marketplace. Implementing both quality
improvement and innovation, however, poses significant managerial,
organisational and technical challenges and may also involve significant
lags before benefits are realised. Here, using panel data on a large group
of Irish manufacturing firms and econometric analysis, we establish the
dynamic influence of firms’ adoption of quality improvement methods
(QIMs) on firms’ innovation performance. Our study highlights the short-
term disruptive and longer-term beneficial effects of QIM adoption on
innovation. The relationship between QIMs and innovation differs markedly
given the organic and/or mechanistic nature of individual QIMs. Quality
Certification (mechanistic) has a negative innovation effect; while QIMs with
an organic component (TQM and Quality Circles) create strong long-term
innovation benefits. In addition, we find evidence of complementarities and
learning-by-using effects from QIM adoption. Our results suggest that
maximising the returns to innovation and quality improvement requires
consideration of the organic and/or mechanistic nature of individual QIMs
and the timing and sequencing of their adoption.
Keywords: Innovation, Quality Improvement, TQM, ISO 9000 JEL Codes: O30, 032, L15 Acknowledgements Useful comments on an earlier draft were received from Will White, InnovateUK.
Innovation, quality management and learning: a dynamic analysis
5
1. INTRODUCTION
Innovation With increased market competition and globalisation, firms have
become more quality and innovation orientated. Quality improvement and
innovation have therefore become established strategies as firms seek to
create and defend their competitive position (Pekovic and Galia 2009).
Indeed, some authors have argued that quality improvement and
innovation are the central concepts of new forms of economic theory of the
firm and models of business behaviour (Anderson, Rungtusanatham, and
Schroeder 1994; Black and Porter 1996; Rungtusanatham et al. 1998), viz.
‘Quality is a vital component of the business strategy, and quality
improvement is a strategic variable employed in the highly competitive
international business world’ (Adam, Flores, and Macias 2001, p. 43). And,
on innovation Baumol (2002 p. ix) also comments: ‘firms cannot afford to
leave innovation to chance. Rather, managements are forced by market
pressures to support innovation activity systematically … The result is a
ferocious arms race among firms in the most rapidly evolving sectors of the
economy, with innovation as the prime weapon’.
The two functions – quality improvement and innovation – are clearly inter-
related although views contradict on whether the relationship between
innovation and quality improvement is complementary or opposing. Nowak
(1997), for example, envisages a complementary relationship, commenting
that: ‘quality and innovation processes are inter-linked and should not be
treated separately. Technical change not enhancing quality is illusive
because it does not contribute to a sustained and improved strategic
competitive advantage, nor does it increase the value creation potential of
available resources through quality creation’. Other writers have seen
quality improvement processes – which may involve mechanistic
routinisation and standardised business processes – as restricting creativity
and innovation (Kanter 1983; Glynn 1996; Prajogo and Sohal 2004);
Perdomo-Ortiz, Gonzalez-Benito, and Galende (2009). Where the
relationship between quality improvement methods (QIMs) and innovation
has been explored empirically relationships are generally positive Moura E

Innovation, quality management and learning: a dynamic analysis
6
Sá and Abrunhosa (2007); Abrunhosa and Moura E Sá (2008); Martínez-
Costa and Martínez-Lorente (2008); Santos-Vijande and Álvarez-González
(2007); Hung et al. (2011). Other studies, however, have found either
neutral or negative relationships between QIMs and innovation (Perdomo-
Ortiz et al., 2009a).
One other commonality between QIMs and innovation noted in the
literature is that both are often difficult to implement leading to significant
lags in the realisation of any related benefits. Pekovic and Galia (2009)
comment, for example, that ‘implementation of the ISO 9000 standard …
concerns the whole organisation and involves changes in the fundamental
behaviour and applied routine of employees’ (Pekovic and Galia 2009, p.
831). Likewise, innovation may result in short-term disruption before any
longer-term benefits are accrued by the firm (Roper, Du, and Love 2008).
Understanding the performance benefits of innovation and QIMs, and their
interactions, is therefore likely to require longitudinal data covering a period
of years in which causal mechanisms are clearly identifiable.
Here, using panel data on a large group of Irish manufacturing firms we
focus on the relationship between innovation and the prior adoption of
QIMs. Specifically we ask whether, and over what period, the adoption of
QIMs (ISO9000, TQM and Quality Circles) impacts on firms’ innovation
success. Most, if not all, of the prior studies of the relationship between
QIMs and innovation have been based on cross-sectional data making
causality difficult to identify, and providing little information on the nature of
the learning effects and lags involved in QIM adoption and its potential
benefits for innovation. Our study makes four main contributions. First, it
clearly highlights the temporal profile of the performance benefits of
individual QIMs, highlighting short-term disruption effects but longer-term
benefits. Second, we show how this disruption - benefit profile is influenced
by the organic and/or mechanistic components of each QIM. Third, it
highlights complementarities between the adoption of specific QIMs, and
fourth it suggests the role of learning-by-using effects in the shaping the
QIM– innovation relationship (Rosenberg 1982).

Innovation, quality management and learning: a dynamic analysis
7
The paper is organised as follows. In Section 2 we briefly review previous
perspectives on QIMs and innovation and identify four hypotheses related
to the potential impacts of prior QIM adoption on innovation. Section 3
describes the data used in our study. Our empirical analysis is based on a
panel dataset relating to Irish manufacturing firms which were surveyed at
regular intervals over the 1994-2008 period. Section 4 outlines the main
empirical results and Section 5 discusses the implications. Our results
suggest relatively long – and variable - time lags before the innovation
benefits of QIMs occur, contrasts in the innovation impacts of different
QIMs, and complementarities between some quality improvement
measures.
2. CONCEPTS AND HYPOTHESES
2.1 Quality improvement
With increased globalisation, market competition and developments in
technology, the characteristics of business have changed drastically
(Pekovic and Galia 2009). Many firms have responded to these changes by
incorporating quality-based strategies into their business models (Foley et
al. 1997). A commitment to quality can drive firms to make significant
improvements in profitability, productivity and competitiveness (Deming
1986; Morgan and Vorhies 2001).
In the management literature, it is widely recognised that quality is a
‘diffuse, multidimensional construct and little consensus exists regarding
how it can be measured or operationalised’ (Wieke cited in (Cameron and
Barnett 2000)). However, two distinct components of quality management
emerge. First, there is a mechanistic component to quality management
which emphasises stability, conformity and discipline, and comprises ‘hard’
processes such as work design and statistical process control. These
mechanistic components of QIMs relate to the control of processes and
products to comply with quality standards and satisfy manufacturing
specifications (López-Mielgo, Montes-Peón, and Vázquez-Ordás 2009).
Innovation, quality management and learning: a dynamic analysis
8
Second, there is an organic component to quality management which
stresses involvement, partnerships, and comparison with the market
leaders. These ‘soft’ aspects of quality management focus on leadership,
empowerment and training, and encourage employees to scan the
environment for new trends, approaches and technologies (Moura E Sá
and Abrunhosa 2007; McAdam 2000). These organic components of QIMs
promote the more human and developmental aspects of the quality system
allowing the firm to adapt to its changing environment and promoting
continuous improvement (López-Mielgo, Montes-Peón, and Vázquez-
Ordás 2009).
Three of the most widely recognised QIMs which span the range of organic
and mechanistic components of quality improvement are Total Quality
Management (TQM), Quality Certification (such as ISO9000) and Quality
Circles. TQM has been described as a management philosophy that fosters
an organisational culture committed to customer satisfaction through
continuous improvement (Kanji 2002). The TQM philosophy essentially
comprises three key elements: customer focus, people involvement and
continuous improvement (Moura E Sá and Abrunhosa 2007). These
elements combine organic and mechanistic components with implications
for a number of management practices such as leadership, training,
employee-management, information and analysis, supplier management,
process management, customer focus, and continuous improvement.
Although, there is no clear consensus as to the impact of TQM, many
scholars conclude that TQM positively affects business performance
(Sousa and Voss 2002; Kaynak 2003). Sadikogulu et al. 2010) in a
comprehensive review of the literature, report positive relationships
between TQM and business performance, including metrics such as market
and financial performance, employee performance and customer
satisfaction (see Table 1, p. 16).
Quality Certification initiatives - e.g. ISO 9000 - are more mechanistic in
nature than TQM, as certification requires detailed review and
documentation of a firm’s production processes, in accordance with the

Innovation, quality management and learning: a dynamic analysis
9
quality system requirements specified by ISO.1 The ISO 9000 standard is
based on eight principles that address the core values and concepts of
quality management: customer focus, leadership, involvement of people,
process approach, system approach to management, continual
improvement and factual approach to decision making (Kartha 2004). Many
of the principles of Quality Certification are similar to those of TQM. In
practice, however, the programme’s focus is on ensuring that organisations
create consistent, stable processes through process documentation and
adherence, which assures the delivery of quality products or services
(Pekovic and Galia 2009). The implementation of Quality Certification or
standards such as ISO 9000 is a top down change process, which
concerns the whole organisation and involves changes in the fundamental
behaviour and routines of employees. As with TQM, there is considerable
evidence that ISO certification can deliver advantages for the firm, such as
quality improvement (Douglas, Coleman, and Oddy 2003), sales growth
(Terlaak and King 2006), business performance (Terziovski, Power, and
Sohal 2003), financial performance (Corbett, Montes-Sancho, and Kirsch
2005), and firm productivity (Diaye, Greenan, and Pekovic 2009). However,
critics of ISO 9000 have claimed that implementation of ISO9000 is costly
and time-consuming, and is particularly difficult for small firms (Pekovic and
Galia 2009).
Without the mechanistic aspects of TQM or ISO9000, Quality Circles (QC)
represent a more organic QIM. Typically QCs are small groups of workers
who meet regularly on a voluntary basis to discuss problems (not
necessarily quality related) and determine possible solutions. Members of
Quality Circles are generally given training in quality control and evaluation
techniques (Trott 2008). QCs improve problem-solving capabilities through
employees’ participation and team work (Bodas Freitas 2008). Therefore,
QCs are organic in nature and enhance a participative culture. While there
is limited evidence of the influence of QCs on firm performance, there is
evidence that human resource management practices, such as QCs, which
1 ISO 9000 certification is undertaken by various certification bodies called
registrars such as government laboratories, private testing organisations, early adopters of ISO, industry trade groups and accounting firms.

Innovation, quality management and learning: a dynamic analysis
10
empower and involve employees positively, influence employee motivation
and behaviour with positive consequences for firm performance
(Subramony 2009).
2.2 Innovation and quality management
Innovation has been identified as a critical driver of business productivity
and economic growth (Schumpeter 1934; Romer 1990). Schumpeter
(1934) argued that innovation involves the transformation of knowledge into
new products, services or business processes. The relationship between
innovation output and innovation inputs has been explored extensively
(Crepon, Duguet, and Mairessec 1998; McCann and Simonen 2005; Griffith
et al. 2008.; Roper, Du, and Love 2008). Numerous scholars have
attempted to explain why some firms are more likely to innovate, with firm
characteristics, such as size, sector, ownership, and location being
identified as influential drivers of innovation output (Audretsch and Feldman
1996; Boschma 2005; Gordon and McCann 2005; Jordan and O'Leary
2008; McCann and Simonen 2005; Tether 1998; Romer 1990; Roper, Du,
and Love 2008). The importance of R&D to innovation activity within firms
has been established by many authors (Roper, Du, and Love 2008; Freel
2003). Firms engaging in R&D increase their existing stock of knowledge
resulting in commercial gains from the introduction of new products,
processes and/ or organisational innovations (Roper, Hewitt-Dundas, and
Love 2004). Likewise, managerial capabilities have been highlighted as an
important factor in firm level innovation. Successful innovation requires that
firms and managers provide clear and consistent signals to employees
about the goals and objectives of the firm (Barnes et al. 2006). There is
also considerable evidence of the importance of external sources to
innovation outputs (Mansury and Love 2008). These external sources of
knowledge may include linkages with customers, suppliers, competitors
and/or research institutes (Roper, Du, and Love 2008)
It has long been recognised that innovation in processes is necessary
when a company wants to increase productivity (Martínez-Costa and
Martínez-Lorente 2008), implying a potential link between innovation and

Innovation, quality management and learning: a dynamic analysis
11
quality management. However, it seems likely that the organic and
mechanistic components of quality improvement management may impact
differently on firms’ innovation activities. The organic component of QIM,
comprising elements such as customer focus, employee training, teamwork
and continuous improvement, seems likely to have a beneficial impact on
innovation performance. Knowing your customer’s needs and preferences
is an important element of a firm’s development of new products and
services (Martínez-Costa and Martínez-Lorente 2008). Customer focus
within an organisation encourages organisations to search consistently to
meet customer needs and expectations, although it has also been argued
that too close an alignment with customers’ preferences can, in fact, hinder
innovation (Martínez-Costa and Martínez-Lorente 2008). Similarly, the
continuous improvement aspect of QIMs should also be reflected in the
development of new products, services and processes. A commitment to
continuous improvement encourages change and creative thinking in how
work is organised and conducted (Prajogo and Sohal 2001). Zairi (1994)
also explains that quality management has ‘given organisations the
impetus and commitment required for establishing climates of never-ending
innovation or innovativeness’. These ‘softer’ aspects of quality
management are therefore likely to be beneficial for innovation.
The more mechanistic components of quality management may, however,
have a disruptive effect on the firm and its innovation activity. Many authors
have argued that quality management systems which focus on
conformance and error reduction can result in a rigidity that is not in line
with innovation strategies (Kanter 1983; Glynn 1996). Standardisation can
lead to lower flexibility and openness to change as a result of repeated
tasks and routinised problem-solving (Prajogo and Sohal 2004). For
instance, TQM in particular, emphasises the use of data for ‘management
by fact’ problem-solving. Glynn (1996) suggests that if workers are allowed
only to deal with routine operational problems, then it is unlikely that they
will come up with innovative solutions. In addition, it has been suggested
that the mechanistic component of quality management can trap
organisations in improvement or incremental innovations and lead them to

Innovation, quality management and learning: a dynamic analysis
12
be ‘narrow-minded’ – only seeing the world through current customer eyes.
Furthermore, TQM, in particular, focuses on cost efficiency which could
limit the capacity and opportunity for innovation, and could hinder creativity
due to the enforcement of standardisation or formalisation (Prajogo and
Sohal 2001).
In brief, the organic component of quality management, which stresses
involvement, partnerships, and comparison with the market leaders and so
encourages employees to scan the environment for new trends,
approaches and technologies (McAdam 2004), is likely to have a beneficial
impact on innovation. However, the new introduction of more mechanistic
QIMs which emphasise stability, conformity and discipline may actually
discourage creativity and innovation. Any such disruptive effect of quality
management is, however, likely to be short-term with the benefits of
adopting these practices accruing over time. Any disruption effect is likely
to decrease over time as firms improve the implementation of the new
quality measures, a learning-by-using effect.
2.3 Hypotheses
The majority of existing studies of the relationship between QIM and
innovation have considered the effects of TQM, reflecting a potential trade-
off between the positive effects of the organic component of TQM for
innovation and the potentially negative effects of the more mechanistic
components. Moura E Sá and Abrunhosa (2007), in an investigation of the
Portugese footwear industry, for example, report a positive relationship
between TQM and innovation, although the relationship proves relatively
weak. Martínez-Costa and Martínez-Lorente (2008), in a study of 451
Spanish companies, also report a significant and positive relationship
between TQM and product and process innovation, while Prajogo and
Hong (2008) find that TQM positively influences R&D in South Korean
firms.
Other studies have focussed on different dimensions of TQM and their
impact on innovation. Abrunhosa and Moura E Sá (2008), for example,

Innovation, quality management and learning: a dynamic analysis
13
report that communication, supportive people management practices and
teamwork positively impact on innovation performance, whereas autonomy
and consultation do not. Similarly, Prajogo and Sohal (2004), in an
examination of the impact of TQM on product innovation within Australian
firms, concluded that two elements of TQM - leadership and people
management - positively influenced innovation. In a further study, Hoang,
Igel, and Laosirihongthong (2006) find that TQM practices, in general,
positively influence firm-level innovation, and illustrate how three specific
dimensions of TQM, leadership and people management, process and
strategic management, and open organisation have a positive impact on
the innovation performance of firms in Vietnam. More recently, Hung et al.
(2011) examined the impact of TQM and organisational learning on
innovation performance in the high-tech industry in Taiwan. They report
that TQM has significant and positive effects on organisational learning,
and TQM and organisational learning both have significant and positive
effects on innovation performance.
There is therefore considerable evidence of a positive relationship between
TQM and innovation, suggesting that the more organic benefits of TQM
dominate any negative influence of TQMs more mechanistic components.
This positive evidence is not universal, however, with Perdomo-Ortiz,
González-Benito, and Galende (2009) finding that only the (organic) human
resource management element of TQM is linked positively to innovation in
their study of 105 Spanish industrial firms2. They conclude that TQM
contains a set of best practices related to human resource management
that promote better innovation performance. In a further study, Perdomo-
Ortiz, Gonzalez-Benito, and Galende (2009) examine the relationship
between TQM and innovation while considering business innovation
capacity (BIC) as both a moderating and mediating factor. They report
limited evidence of a moderating effect. However, they find a significant,
2 Perdomo-Ortiz, González-Benito, and Galende (2009) also considered five other
aspects of TQM finding no positive link to innovation (management support, information for quality, process management, product design, and relations with agents).

Innovation, quality management and learning: a dynamic analysis
14
negative interaction effect with respect to the (mechanistic) process
management dimension of TQM with different dimensions of BIC. This
suggests that the emphasis on the control and improvement of processes,
in parallel with management practices of innovation, such as project
planning, formulation and assessment, developing new knowledge and
skills and external cooperation, may have a negative effect on
technological innovation.
Less attention has been focussed on the relationship between other QIMs
and innovation. We are not aware of any quantitative studies which relate
Quality Circles to innovation, while only two studies appear to have
examined the links between Quality Certification, (ISO9000) and
innovation. Benner and Tushman (2002) find that the extent of process
management activities in a firm are associated with an increase in
exploitative innovations and exploitative innovation’s share of total
innovations in the paint and photography industry. Using two French
microeconomic surveys, Pekovic and Galia (2009) also find that ISO 9000
certification is significantly and positively linked to seven out of nine
innovation indicators3.
Although these empirical studies generally find a positive link between
QIMs and innovation, the use of cross-sectional data (and structural
equation models or correlation analysis) limits their ability to provide causal
insights4. In particular, it has been suggested that innovation cannot be
realised without first implementing quality practices. Perdomo-Ortiz,
3 Innovation measures used in these studies vary widely and include: business innovation
capability (Perdomo-Ortiz et al., 2006), adoption of innovations (Moura E Sá and Abrunhosa, 2007, Abrunhosa and Moura E Sá, 2008, Santos-Vijande and Álvarez-González, 2007), timing of adoption of innovations (Abrunhosa and Moura E Sá, 2008), novelty of innovations adopted (Santos-Vijande and Álvarez-González, 2007) product innovation (Prajogo and Sohal, 2004, Martínez-Costa and Martínez-Lorente, 2008, Hung et al., 2011), R&D (Prajogo and Hong, 2008), process innovation (Martínez-Costa and Martínez-Lorente, 2008, Hung et al., 2011), organisation innovation (Hung et al., 2011) and own assessment of innovation performance relative to main competitors (Perdomo-Ortiz et al., 2009). Pekovic and Galia (2009) use a total of nine indicators of innovation, including innovation projects and turnover due to new or improved products, new or improved processes for the firm and share of new or improved products to the market. 4 In fact, many of the studies reviewed highlight the static nature of their analysis as a
limitation, with calls for dynamic analysis of the quality-innovation relationship (Perdomo-Ortiz, González-Benito, and Galende 2006; Martínez-Costa and Martínez-Lorente 2008; Pekovic and Galia 2009).
Innovation, quality management and learning: a dynamic analysis
15
Gonzalez-Benito, and Galende (2009) state that ‘in general business
practice first incorporates the concept of quality management and then
gradually integrates innovation’. This argument draws on the resource-
based and dynamic capabilities (RDBC) theory of the firm, which suggests
that management priorities are path-dependent and that improving
innovation performance requires greater organisational complexity than
quality management (Perdomo-Ortiz, Gonzalez-Benito, and Galende
2009). The implications are that the payoffs from the implementation of any
QIM may only occur in the longer term, with the potential for short-term
disruption, and that lags may be evident in the impacts of QIM adoption on
innovation (Perdomo-Ortiz, Gonzalez-Benito, and Galende 2009; Prajogo
and Sohal 2003; Pekovic and Galia 2009). We therefore anticipate that the
adoption of a QIM by a firm may result in disruption to innovation in the
short-term but yield longer term benefits, i.e.
H1a: Adoption of QIMs will lead to a short term disruptive effect on
innovation performance.
H1b: Adoption of QIMs will lead to longer-term beneficial effects on
innovation performance.
While we might anticipate this temporal profile of benefits from each type of
QIM, variations may be evident between the more organic and more
mechanistic QIMs. For instance, some studies report that firms that
implement organic QIMs tend to be more innovative (Santos-Vijande and
Álvarez-González 2007; Moura E Sá and Abrunhosa 2007; Abrunhosa and
Moura E Sá 2008; Hoang, Igel, and Laosirihongthong 2006; Perdomo-
Ortiz, Gonzalez-Benito, and Galende 2009) as the organic elements of QIM
favour incremental innovations (Prajogo and Sohal 2004; Abrunhosa and
Moura E Sá 2008). On the other hand, there is evidence that the
mechanistic dimensions of QIMs may hinder innovation, in particular radical
innovation (Prajogo and Sohal 2004; Benner and Tushman 2002;
Perdomo-Ortiz, Gonzalez-Benito, and Galende 2009). This is not
particularly surprising as the rationality, efficiency and strict control of tasks
Innovation, quality management and learning: a dynamic analysis
16
required by mechanistic quality procedures inhibit creativity and
improvisation (López-Mielgo, Montes-Peón, and Vázquez-Ordás 2009).
This suggests that the potential disruption effects of introducing QIM will be
stronger for more mechanistic QIMs, such as Quality Certification.
Conversely, the organic nature of QCs would suggest a less severe
disruption effect with the benefits of adoption of QCs occurring sooner than
the more mechanistic QIMs. For TQM, which embodies both organic and
mechanistic components, it is likely that the beneficial effects owing to its
organic components may come into effect sooner and offset the short-term
disruptive effect caused by its more mechanistic components. As a result,
we expect TQM to have the largest long-term beneficial effect with respect
to innovation. We expect a lesser disruptive effect from QCs due to their
purely organic nature, whereas Quality Certification may involve significant
short-term disruption. In summary:
H2a: QIMs which are primarily organic will have weaker short-term
disruption effects than those which have stronger mechanistic components.
H2b: QIMs which combine mechanistic and organic components will have
the strongest long-term benefits for innovation.
Strategically, firms do not always adopt an individual QIM in isolation. Firms
may adopt QIMs sequentially or simultaneously. Indeed, a crucial element
in firms’ strategic decision-making is the identification and effective
harnessing of complementarities between different managerial activities,
optimising resource use (Milgrom and Roberts, 1990, 1995)5. In the
innovation literature, discussion of complementarities has often been
related to the benefits of experiential learning. Rosenberg (1972), for
example, describes how a firm increases itsstock of knowledge based on
5 In terms of human resource management (HRM), for example, Laursen and Foss
(2003) consider complementarity between different HRM practices in terms of their impact on innovation outputs (see also Michie and Sheehan, 2003), while in a more general context Lhuillery (2000) examines the impact of a range of organizational practices on the innovation capability of French companies (see also Labeaga and Martinez Ros (2003).

Innovation, quality management and learning: a dynamic analysis
17
its previous experience with technologies as ‘learning-by-using’. Previous
studies have also highlighted the benefit to firms of learning-by-using new
technology for subsequent adoption decision-making (Stoneman and Kwon
1994; Colombo and Mosconi 1995; McWilliams and Zilbermanfr 1996;
Stoneman and Toivanen 1997; Arvantis and Hollenstein 2001). In the same
way, the cumulative learning from earlier QIM adoption should ease the
disruptive effects of subsequent QIM adoption. Two effects are possible
here: complementarities in implementation where two QIMs are adopted
simultaneously and/or the more dynamic type of learning-by-using effect
envisaged by Rosenberg (1972) (see Figure 1). Hence:
H3a: Simultaneous QIM adoption generates positive complementarities
increasing the benefits for innovation.
H3b: Early adoption of one QIM will generate learning-by-using effects
increasing the innovation benefits of subsequent QIM adoption.
The scale of these complementary and learning-by-using effects may also
depend on the organic and/or mechanistic nature of each QIM. For
instance, we might anticipate the complementary benefits of QIM adoption
being strongest when the quality mechanisms have contrasting attributes,
e.g. QCs and Quality Certification, or vice-versa. Conversely, we might
anticipate that learning-by-using effects - which relate to the effectiveness
of adoption by firms - are likely to be strongest where QIMs share similar
characteristics, e.g. TQM and Quality Certification (Columbo and Musconi,
1995). This implies:
H4a: Positive complementarities will be strongest where the QIMs adopted
have contrasting mechanistic and organic components.
H4b: Learning by using effects will be strongest where the QIMs involved
have similar mechanistic or organic components
Innovation, quality management and learning: a dynamic analysis
18
3. DATA AND METHODS
Our empirical analysis is based on the Irish Innovation Panel (IIP) which
provides data on the innovation activity and QIM adoption of around 1300
manufacturing plants in Ireland and Northern Ireland over the period 1994
to 2008. More specifically, this element of the IIP comprises five surveys or
waves conducted using similar survey methodologies and common
questions. Each of the five surveys covers the innovation activities of plants
with 10 or more employees over a three-year reference period.6 The
resulting panel is highly unbalanced reflecting non-response in individual
surveys but also the opening and closure of plants over the period covered.
Plants’ innovation activity in the IIP is represented by the standard indicator
used in the European Community Innovation Survey: the proportion of
plants’ total sales (at the end of each three-year reference period) derived
from products newly introduced during the previous three years. This
variable has been widely used as an indicator of plants’ innovation output
(Laursen and Salter 2006; Roper, Du, and Love 2008; Love, Roper, and Du
2009), and reflects not only plants’ ability to introduce new products to the
market but also their short-term commercial success. Across those
elements of the IIP used in the current analysis, 17.4 per cent of plants’
sales were derived from newly introduced products (Table 1).
One rather unusual feature of the IIP is that alongside plants’ innovation
activity it also provides information on the use and timing of adoption of
QIMs.7 Data was collected on the three QIMs identified earlier: Quality
Circles, TQM and ISO 9000. Respondents were asked: ‘Please indicate if
you use any of the following production techniques. Also, please indicate
6 Individual survey response rates were: 1994-96, 32.9 per cent; 1997-99, 32.8 per
cent; 2000-02, 34.1 per cent; 2003-05, 28.7 per cent; 2006-08, 38.0 per cent (Roper et al. 1996; Roper and Hewitt-Dundas 1998; Roper and Anderson 2000; Hewitt-Dundas and Roper 2008). 7 While this data is helpful one important limitation of the IIP is also worth noting.
The structure of the survey questionnaire means that this use and adoption data is only collected for plants which reported undertaking some process innovation during the previous three years. Plants need not, however, have undertaken product innovation.

Innovation, quality management and learning: a dynamic analysis
19
the date when they were first introduced?’ In terms of the timing of
adoption, respondents were asked whether they had first introduced each
QIM in the three year period covered by the survey, the previous three
years, or prior to this. For each respondent this provides an indication of
whether they are using each QIM and an indication of the length of time in
which it has been in use in the plant. For example, around 53 per cent of
IIP respondents reported using ISO 9000 with 27 per cent adopting it in the
previous three years, 14.7 per cent adopting 3-6 years before the survey,
and 10 per cent earlier than that (Table 1). Quality Circles are implemented
in 12.4 per cent of plants with TQM implemented by just under a third of
firms.
The IIP also provides information on a number of other plant characteristics
which previous studies have linked to innovation outputs (Annex 1). For
example, plants’ in-house R&D activities are routinely linked to innovation
performance in econometric studies with suggestions that the innovation-
R&D relationship reflects both knowledge creation (Harris and Trainor
1995) and absorptive capacity effects (Griffith, Redding, and Van Reenan
2003). 54 per cent of plants were conducting in-house R&D at the time of
the IIP surveys (Table 1). Reflecting recent writing on open innovation
(Chesbrough 2007; Chesborough 2006) external innovation relationships
have also been shown to play an important role in shaping innovation
outputs (Oerlemans, Meeus, and Boekema 1998; Ritala et al. 2013),
complementing plants’ internal capabilities (He and Wong 2012; Cassiman
and Veugelers 2006; Arora and Gambardella 1990; Belderbos, Carree, and
Lokshin 2006; Cassiman and Veugelers 2006). Here, we include three
separate variables representing plants’ external innovation co-operation
with customers, suppliers and other organisations outside the supply chain.
Around 30.0 per cent of plants reported having innovation cooperation with
customers, while 32.7 per cent had backwards innovation cooperation with
suppliers (Table 1). Links outside the supply chain could be with a variety
of different types of organisation (e.g. universities, consultants) and here
we construct a count variable representing the number of types of partner

Innovation, quality management and learning: a dynamic analysis
20
with which a plant was cooperating. On average, plants were cooperating
with around 0.8 organisations outside the supply chain (Table 1).
We also include in the analysis a group of variables which give an
indication of the quality of firms’ in-house knowledge base – e.g. skills,
plant size, multi-nationality, plant vintage, and whether or not a plant is
exporting. Skill levels are reflected in the proportion of each plant’s
workforce which have a degree level qualification to reflect potential labour
quality impacts on innovation (Freel 2005; Leiponen 2005) or absorptive
capacity. Multi-nationality is included here to reflect the potential for intra-
firm knowledge transfer between national markets and plants, while plant
vintage is intended to reflect the potential for cumulative accumulation of
knowledge capital by older establishments (Klette and Johansen, 1998), or
plant life-cycle effects (Atkeson and Kehoe, 2005). Finally, studies of the
impact of publicly funded R&D have, since Griliches (1995), repeatedly
suggested that government support for R&D and innovation can have
positive effects on innovation activity both by boosting levels of investment
(Hewitt-Dundas and Roper 2009) and through its positive effect on
organisational capabilities (Buiseret, Cameron, and Georgiou 1995). Here,
we therefore include a dummy variable where plants received public
support for innovation.8
Our empirical approach focuses on the innovation or knowledge production
function which represents the process through which plants’ knowledge
capital is transformed into innovation outputs (Griliches 1995; Love and
Roper 2001; Laursen and Salter 2006). If Ii is an innovation output indicator
for plant i the innovation production function might be summarised in cross-
sectional terms as:
iiiiiiii CONTHSBSFSRDQIMI 6543210 (1)
8 Elsewhere we profile the range of public support initiatives for innovation in
Ireland and Northern Ireland over the period covered by the IIP (Meehan 2000; O'Malley, Roper, and Hewitt-Dundas 2008).
Innovation, quality management and learning: a dynamic analysis
21
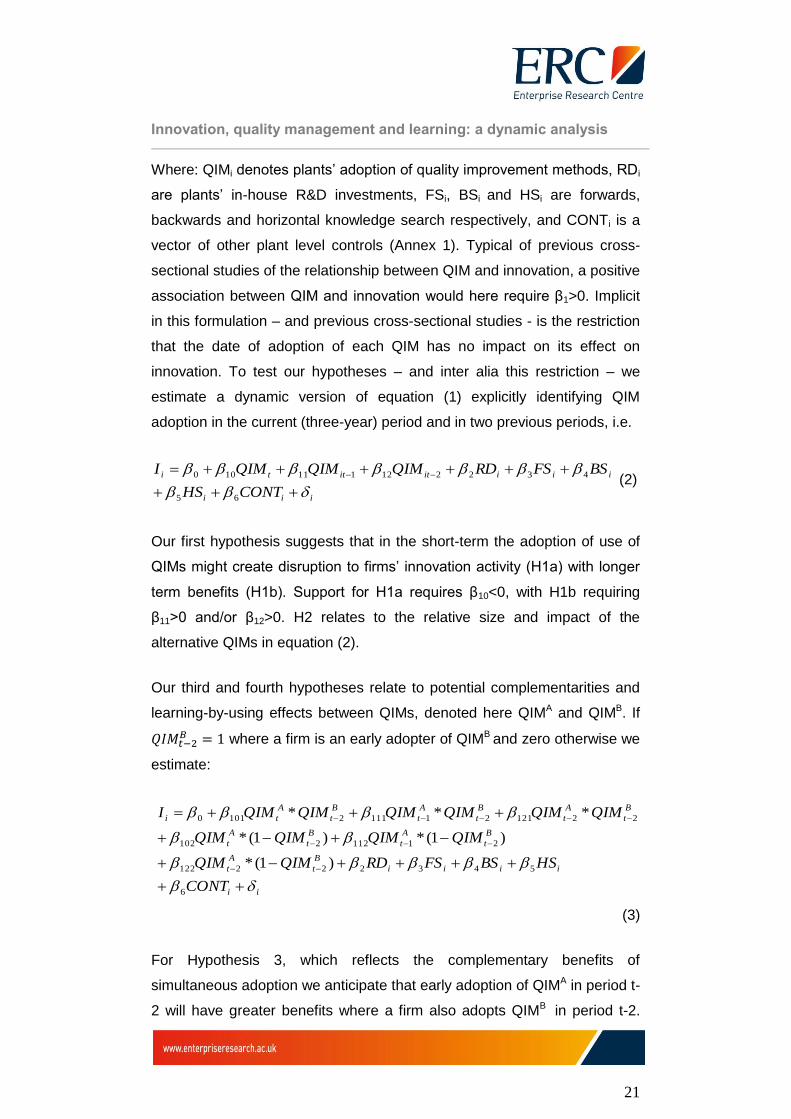
Where: QIMi denotes plants’ adoption of quality improvement methods, RDi
are plants’ in-house R&D investments, FSi, BSi and HSi are forwards,
backwards and horizontal knowledge search respectively, and CONTi is a
vector of other plant level controls (Annex 1). Typical of previous cross-
sectional studies of the relationship between QIM and innovation, a positive
association between QIM and innovation would here require β1>0. Implicit
in this formulation – and previous cross-sectional studies - is the restriction
that the date of adoption of each QIM has no impact on its effect on
innovation. To test our hypotheses – and inter alia this restriction – we
estimate a dynamic version of equation (1) explicitly identifying QIM
adoption in the current (three-year) period and in two previous periods, i.e.
iii
iiiititti
CONTHS
BSFSRDQIMQIMQIMI
65
432212111100 (2)
Our first hypothesis suggests that in the short-term the adoption of use of
QIMs might create disruption to firms’ innovation activity (H1a) with longer
term benefits (H1b). Support for H1a requires β10<0, with H1b requiring
β11>0 and/or β12>0. H2 relates to the relative size and impact of the
alternative QIMs in equation (2).
Our third and fourth hypotheses relate to potential complementarities and
learning-by-using effects between QIMs, denoted here QIMA and QIMB. If
𝑄𝐼𝑀𝑡−2𝐵 = 1 where a firm is an early adopter of QIMB and zero otherwise we
estimate:
ii
iiii
B
t
A
t
B
t
A
t
B
t
A
t
B
t
A
t
B
t
A
t
B
t
A
ti
CONT
HSBSFSRDQIMQIM
QIMQIMQIMQIM
QIMQIMQIMQIMQIMQIMI
6
543222122
211122102
221212111121010
)1(*
)1(*)1(*
***
(3)
For Hypothesis 3, which reflects the complementary benefits of
simultaneous adoption we anticipate that early adoption of QIMA in period t-
2 will have greater benefits where a firm also adopts QIMB in period t-2.

Innovation, quality management and learning: a dynamic analysis
22
Here, we test β121>β122. For Hypothesis 4 which reflects the potential
learning-by-using effects from early adoption of QIMB we test whether
β101>β102 and/or β111>β112.
Our choice of estimation method is dictated largely by the fact that we are
using plant-level data from a highly unbalanced panel and that our
dependent variables are percentages. We therefore make use of tobit
estimators, including in each model a set of sector controls at the 2- digit
level and a series of time dummies to pick up any secular differences
between the waves of the IIP. Observations are also weighted to provide
representative results and take account of the structured nature of the IIP
surveys.
4. RESULTS
4.1 Dynamic analysis
Replicating previous cross-sectional studies of the quality-innovation
relationship, we initially undertake a static analysis to determine whether
QIM use benefits firm innovation (Equation 1). As presented in Table 3,
TQM use positively impacts innovation performance, although neither
Quality Certification nor QC has a positive impact on innovation. In terms of
TQM our results reflect those of previous studies which have also reported
the benefits of implementing TQM for firm innovation (Moura E Sá and
Abrunhosa 2007; Martínez-Costa and Martínez-Lorente 2008; Abrunhosa
and Moura E Sá 2008; Prajogo and Sohal 2004; Hoang, Igel, and
Laosirihongthong 2006; Hung et al. 2011). Our static results contrast with
the limited number of previous studies that have reported that Quality
Certification positively influences innovation (Benner and Tushman 2002;
Pekovic and Galia 2009).
A limitation of this static approach to the quality-innovation relationship is
that the QIM coefficients capture the effects of both current and lagged
adoption. Our dynamic analysis (Eqn. 2) removes this implicit restriction
and allows us to test H1 which envisages a short term disruption (H1a) and
Innovation, quality management and learning: a dynamic analysis
23
a longer term beneficial effect (H2b) from QIM adoption on firm innovation.
Dynamic analysis of the impact of early (t-2), previous (t-1) and current QIM
adoption on innovation performance is presented in Table 4. In relation to
Quality Certification, we see significant disruption effects, and no evidence
of dynamic beneficial effects. These significant disruption effects may be
due to the formalised and mechanistic nature of Quality Certification. The
absence of a positive relationship between Quality Certification and firm
innovation in our dynamic analysis contrasts with results from previous
(static) studies (Benner and Tushman 2002; Pekovic and Galia 2009).
However, this finding is not altogether surprising as the implementation of
Quality Certification concerns the whole organisation and involves
considerable disruption to fundamental behaviour and routinised tasks
(Pekovic and Galia 2009).
In relation to QC, we find no significant disruption effect, but significant
longer-term beneficial effects. Early adoption of QC positively impacts on
innovation, although this relationship is not present for firms who adopted
QC in the current or previous time periods. QCs are primarily organic in
nature and therefore their implementation should not cause particular
disruption to the firm compared to the more mechanistic QIMs. Practices,
such as QCs, which empower and involve employees have been shown to
positively influence employee motivation and behaviour (Subramony 2009),
and therefore the lagged beneficial effect is as anticipated.
For TQM, there is no significant disruption effect, but positive and
significant beneficial effects. Firms that adopt TQM in the previous period
realise innovative returns in the current period, and early adopters of TQM
realise significantly larger returns (Table 4). The beneficial effects from
TQM adoption are not particularly surprising given the strong positive
relationship between TQM use and innovation reported in our static
analysis and previous (static) studies (Moura E Sá and Abrunhosa 2007;
Martínez-Costa and Martínez-Lorente 2008; Santos-Vijande and Álvarez-
González 2007; Prajogo and Sohal 2003; Hoang, Igel, and
Laosirihongthong 2006). Furthermore, the lack of an initial disruption effect

Innovation, quality management and learning: a dynamic analysis
24
may be due to the informal, participative or organic components of TQM.
For instance, previous studies have highlighted the returns to innovation
from softer TQM elements, such as resource management, leadership,
people management and open organisation (Perdomo-Ortiz, González-
Benito, and Galende 2009; Hoang, Igel, and Laosirihongthong 2006;
Prajogo and Sohal 2004). The advantageous temporal profile of TQM may
result from its multi-dimensionality nature. We hypothesised that QIM
adoption would influence firm innovation in terms of a short term disruptive
effect (H1a) and a longer term beneficial effect (H1b). We find support for
H1a as Quality Certification adoption has a significant short-term disruption
effect on firm innovation; and we find strong support for H1b with TQM and
QC adoption resulting in longer-term beneficial effects for firm innovation.
Next, we consider our results in the context of H2 which suggests that
QIMs which are primarily organic will have weaker short-term disruption
effects than those which have stronger mechanistic components (H2a)
while QIMs which comprise mechanistic and organic components will have
the strongest long-term benefits for innovation (H2b). Quality Certification,
which is primarily mechanistic, results in significant short-term disruption for
firms’ innovative performance, whereas QCs and TQM, QIMs comprising
full or partial organic components, impose none of these short-term
disruption effects on firm innovation. While there is no evidence of long-
term beneficial effects with Quality Certification, we do find long-term
beneficial effects for firm innovation in the case of QCs and TQM. In
addition, the beneficial effects from TQM adoption arise more quickly than
in the case of QCs, and the returns from TQM adoption are greater. Our
results therefore suggest that the organic or mechanistic components of
each QIM does impact the temporal profile of this disruptive –beneficial
relationship. We find strong support for H2a as the more organic QIMs,
QCs and TQM, have no short-term disruption effects on innovation in
contrast to the mechanistic Quality Certification. We also find considerable
support for H2b with TQM, comprising both organic and mechanistic
components, exhibiting the strongest long-term benefits for innovation.

Innovation, quality management and learning: a dynamic analysis
25
In line with previous studies, we find firm characteristics, such as R&D,
linkages with suppliers, firm vintage, eternally-owned firms and an
educated workforce, strongly impact on firm innovation (Roper, Hewitt-
Dundas, and Love 2004; Roper, Du, and Love 2008; Freel 2003). In
addition, we find that government support for innovation strongly and
significantly impacts on innovation performance (Love, Roper, and Bryson
2011).
4.2 Complementarity and learning-by-using effects
In our investigation of complementarities and learning by using effects, we
attempt to determine if simultaneous and sequential adoption of QIMs
benefit the firm (see Figure 1). We hypothesise that simultaneous QIM
adoption may generate positive complementarities increasing the benefits
to innovation (H3a), and that early adoption of one QIM will generate
learning-by-using effects increasing the innovation benefits of subsequent
QIM adoption (H3b).
Complementarities exist if the sum of the benefits of adopting QIMs
separately is less than the benefit of adopting them simultaneously.
Empirically, we are examining the influence of simultaneous early adoption
of two QIMs on innovative sales (see Table 5). For instance, in the first
model in Table 5 we examine if early Quality Certification adoption and
early QC adoption are complementarities for innovation. Specifically, we
include two variables, one which captures the firms that are early quality
certification and early QC adopters and another which captures those that
are early quality certification adopters but not early QC adopters. The
insignificant coefficients indicate that these two QIMs are not
complementarities. The next regression model examines if early quality
certification and early TQM adoption are complementarities, a pattern
followed in each of the subsequent models.
Our analysis reveals that TQM and Quality Certification are complementary
initiatives and the benefit of their simultaneous adoption is greater than if
adopted individually. We find that benefits of TQM adoption are conditional
Innovation, quality management and learning: a dynamic analysis
26
on the simultaneous adoption of Quality Certification, and vice versa. Of
particular interest is how simultaneous early adoption of Quality
Certification and TQM offsets the short-term disruptive effects of Quality
Certification. There is no evidence to suggest that Quality Circles and
Quality Certification create complementarities for firm innovation. An
interesting pattern emerges with respect to early QC and TQM adoption.
We see that early TQM and early QC adoption benefits innovation,
although early TQM adoption without early QC adoption also benefits
innovation. This suggests that the benefits of TQM are not conditional on
simultaneous adoption of QC. This is not particularly surprising given the
strong positive TQM-innovation relationship. Therefore, we find some
support for H3a that the simultaneous adoption of Quality Certification and
TQM generates positive complementarities enhancing the benefits to firm
innovation.
Next, we investigate whether early adoption of one QIM generates
learning-by-using effects increasing the innovation benefits of subsequent
QIM adoption. The motivation for investigating whether learning-by-using
effects impact on firm innovation is that early adoption of one QIM creates
the potential for learning and hence subsequent adoption and
implementation of an additional QIM is likely to be less onerous.
Empirically, we test for learning-by-using effects by including variables
which capture sequential adoption patterns. For instance, in the first model
in Table 5, we examine if early adoption of QC and subsequent quality
certification adoption, in both the current (Current QCert* early QC &
Current QCert*no early QC) and previous (Previous QCert*early QC &
Previous QCert*no early QC) time periods, influence innovative sales. In
the next model, we are examining if early TQM adoption and subsequent
quality certification adoption benefits innovation, a pattern followed in
subsequent models.
Interestingly, early adopters of QC and, to a lesser extent TQM, offset the
disruptive effects of Quality Certification. Therefore, early adoption of QC
generates learning-by-using effects for current Quality Certification

Innovation, quality management and learning: a dynamic analysis
27
adoption; the benefits (although still insignificant) of Quality Certification are
conditional on prior adoption of QC. In relation to QC, there were no
significant disruption effects for adopters of QC and so we see no
significant offset or learning-by-using effect from earlier adoption of other
QIMs. Neither does early adoption of another QIM augment the impact of
subsequent QC adoption. In relation to TQM, we find that early adopters of
QC enhance the longer-term benefits of subsequent TQM adoption. In
other words, the benefits of TQM to firm innovation are conditional on prior
adoption of QCs. These results are supportive of H3b, i.e. that early
adoption of one QIM will enhance the innovation benefits from subsequent
QIM adoption. In particular, we find considerable evidence of learning-by-
using from early adoption of QC; a reduction in the disruption element of
subsequent Quality Certification adoption and an enhancement of the
beneficial effect of subsequent TQM adoption.
Finally, we examine the scale of these complementary and learning-by-
using effects, hypothesising that positive complementarities will be
strongest where the QIMs adopted have contrasting mechanistic and
organic components (H4a) and suggesting that learning-by-using effects
will be strongest where the QIMs involved have similar mechanistic or
organic components (H4b). Our analysis reveals a complementary
relationship between the mechanistic Quality Certification and the organic-
mechanistic TQM for firm innovation. We find no evidence of a
complementary relationship between the mechanistic Quality Certification
and the organic QCs with respect to innovation performance. There is
some evidence of a complementary relationship between QCs and TQM,
although it is likely that early TQM adoption is driving that relationship.
Therefore, we find little support for H4a that complementarities are
strongest when QIMs comprise of contrasting mechanistic and organic
components. Our primary finding in relation to learning-by-using effects is
that early adoption of QCs generates learning-by-using effects for
subsequent Quality Certification and TQM adoption. Given the similar
organic components of QC and TQM and the contrasting organic and
mechanistic components of QC and Quality Certification respectively, we
Innovation, quality management and learning: a dynamic analysis
28
cannot report stronger learning-by-using effects where the QIMs adopted
have similar components (H4b).
4.3 Robustness tests
We conducted two robustness tests to evaluate our results with an
alternative measure of innovative output, and using an alternative
estimation approach allowing for the potential endogeneity of the
‘treatment’ represented by firms’ QIM adoption (Maddala 1983). First, in our
main analysis we use a dependent variable which reflects firms’ sales
derived from new products. This reflects an emphasis on more radical
innovation rather than either imitation or more incremental product change
(Schnaars 1994). To consider whether our results also hold for more
imitative strategies we repeated the analysis using an alternative and more
broadly defined dependent variable - innovative sales from new and
improved products. Results were broadly similar to those reported in
relation to our main dependent variable. In relation to the static analysis,
and reflecting the weak results of the static analysis in Table 3, none of the
QIMs have a significant effect on the broader measure of innovative sales.
Likewise, dynamic analysis with our alternative innovation output measure
generates results which are broadly similar to those reported earlier (Table
4). In relation to Quality Certification, the coefficient signs indicate the same
pattern of disruption and long term beneficial effects as for innovative sales
from new products but the short term disruption effect is not statistically
significant. For QC, we still see insignificant disruption effects but evidence
of longer term beneficial effects is insignificant. There is clear evidence of
long term beneficial effects from TQM adoption, although these are
generally weaker than for innovative sales. In summary, effects from QIM
adoption are stronger for innovative sales from new products than the
broader dependent variable which captures innovative sales from new and
improved products.
We also repeated the learning-by-using and complementarity analysis
using innovative sales from new and improved products as the dependent
variable. Results from this robustness test are broadly similar to those
Innovation, quality management and learning: a dynamic analysis
29
reported in relation to the narrower dependent variable of innovative sales
from new products (Table 5). The strong and significant complementary
benefit of early Quality Certification and early TQM is also evident in
relation to the broader dependent variables of innovative sales from new
and improved products. We find that the benefits of TQM to firm innovation
are conditional on prior adoption of QCs as previously reported for the
narrower definition of innovation. There is no evidence of a learning-by-
using effect from early QC adoption influencing the benefits to this broader
definition of innovation from subsequent Quality Certification adoption.
Although, in relation to this broader dependent variables we find the
benefits of TQM to firm innovation are also conditional on the prior adoption
of Quality Certification. The results from these robustness tests are
therefore similar to those reported for the narrower dependent variable of
innovative sales from new products.
In a second robustness test we sought to allow for the potential
endogeneity of the adoption of each of the QIMs, i.e. the possibility that the
determinants of adoption may also be the determinants of innovation
outcomes. We estimated two-stage models estimating first a model for the
probability of adoption and then including the implied Inverse Mills Ratio
(IMRs) in equations (1) to (3) (Heckman 1979). For both our main and
alternative dependent variables the IMRs proved insignificant with the
coefficients of interest also remaining unchanged in sign and significance.
4.4 Discussion
Previous cross-sectional studies have suggested a positive correlation
between QIMs and innovation, with a focus on the TQM-innovation
relationship (Moura E Sá and Abrunhosa (2007); Martínez-Costa and
Martínez-Lorente (2008); Prajogo and Hong (2008); Abrunhosa and Moura
E Sá (2008); Hoang, Igel, and Laosirihongthong (2006); Hung et al. (2011).
In cross-sectional terms our data also suggests a positive relationship
between TQM and innovation outputs although we find no relationship,
however, between either QC or Quality Certification and innovation
performance (Table 3). As our dynamic analysis suggests, however, these
Innovation, quality management and learning: a dynamic analysis
30
cross-sectional relationships hide some rather complex dynamic effects on
innovation, effects which differ markedly between QIMs (Table 4). In
particular, we find evidence that QIMs can cause short-term disruption to
firms’ innovation activity before the development of longer-term benefits.
These disruption effects are most significant for the more mechanistic
Quality Certification but weaker for the more organic QIM, Quality Circles.
TQM – which combines organic and mechanistic components has no
significant disruption effect (Table 4). Those QIMs with an organic
component - TQM and QC – which might encourage flexibility and creativity
also have the most significant long term benefits for innovation (Table 4).
Quality Certification has no significant longer-term effect on innovation.
Two implications follow from our dynamic analysis. First, our analysis
suggests the importance of the dynamic effects implicit in the adoption of
QIMs and the potential trade-off between short-term disruption and longer
term innovation benefits. Benefitting from the adoption of QIMs takes some
considerable time as firms revise and optimise organisational routines.
Second, the relationship between QIMs and innovation performance differs
markedly between those QIMs which have a strong organic component (i.e.
TQM, QCs) and more mechanistic initiatives such as Quality Certification:
mechanistic QIMs have negative innovation effects, while QIMs with an
organic element have strong long-term innovation benefits9.
These contrasts between the implications of alternative QIMs are also
reflected in our results on the benefits of combinations of QIMs. For
example, complementarities between QIMs adopted at the same time
prove strongest between Quality Certification and TQM which share some
mechanistic components. Conversely, and contrary to expectations, we find
no evidence of complementarities between contrasting QIMs such as QC
and Quality Certification. Quality Circles do, however, generate significant
learning-by-using effects, enhancing the innovation benefits of both Quality
Certification and TQM. The implication is that adoption of Quality Circles
9 This is not to say, of course, that implementing mechanistic QIMs such as Quality
Certification has no positive effects on wider business performance. Simply, that it has negative effects on innovation.
Innovation, quality management and learning: a dynamic analysis
31
may have a dual advantage for innovation: a direct longer-term benefit and
also an indirect longer-term benefit through its impact on enhancing the
effects of other QIMs.
5. CONCLUSION
Our paper makes several theoretical contributions to the quality and
innovation literature highlighting the temporal profile of the effects of
individual QIMs, short-term disruptive and longer-term beneficial effects, on
firm innovation performance. It also highlights the influence of the organic
and/or mechanistic components of each QIM on the extent of this disruptive
- beneficial temporal profile; and the role of complementarities and
learning-by-using effects in shaping the quality–innovation relationship
Our empirical analysis of the quality-innovation relationship reveals
complex dynamic effects not evident from previous cross-sectional studies.
Panel data allows us to establish the temporal profile of the –short-term
disruptive and longer-term beneficial - effects of QIMs on innovation
(H1a&b). In addition, the three quality improvement measures in our
dataset enabled us to examine the temporal profile of individual QIMs on
firm innovation. Our analysis reveals a more pronounced short-term
disruptive effect for mechanistic QIMs (e.g. Quality Certification), while the
longer-term beneficial effects are stronger for QIMs which combine both
organic and mechanistic components (e.g. TQM) (H2a&b). Interestingly,
organic QCs have no short-term disruptive effect on innovation, but do
have a longer term beneficial effect (albeit to a lesser extent than TQM) on
firm innovation. Therefore, mechanistic QIMs have negative innovation
effects, whereas the more organic QIMs have strong long-term benefits for
innovation. Our examination of the benefits of combinations of QIMs
supports our hypotheses that simultaneous and sequential QIM adoption
generates positive complementarities and learning-by-using effects
respectively enhancing innovation benefits (H3a&b). We expected
complementarities to exist between contrasting QIMs, such as QCs and
Quality Certification; but instead identified strong complementarities

Innovation, quality management and learning: a dynamic analysis
32
between Quality Certification and TQM. In addition, we also found the most
significant learning-by-using effects for subsequent TQM and Quality
Certification were generated from early adoption of QCs.
Two main managerial implications follow from our analysis. First, it is clear
that the adoption of QIMs has significant implications for firms’ innovation
outputs, albeit with some time lags as internal routines are optimised.
Quality improvement strategies and implementation plans need therefore to
consider their innovation implications and any consequent impact on firm
performance. Secondly, the synergies we identify between QIMs suggest
the value in strategies which maximise complementarities and gains from
learning-by-using. In particular, we find that the early adoption of Quality
Circles – a relatively straightforward and low cost QIM - significantly
enhances the value of TQM and Quality Certification where these are
adopted subsequently. It may be, for example, that the adoption of QCs is
stimulating an initial focus or interest in quality improvement in the firm
which is then formalised in the adoption of TQM or Quality Certification.
QC adoption may also be helping firms to overcome attitudinal barriers
related to change and the implementation of more formal quality
management systems. Our results, which highlight the dynamic nature of
the relationship between QIMs and innovation and between QIMs
themselves, also emphasise the limitations of analyses based on cross-
sectional data. In particular, cross-sectoral analyses inevitably see QIM
adoption – as a uniform treatment, obscuring any dynamic effects and/or
interactions between QIMs.
Our analysis suffers from three main limitations. First, our analysis focuses
on Irish manufacturing businesses only and may therefore be influenced by
specific national circumstances. The 1994-2008 period considered here,
however, was a period of rapidly changing institutions in Ireland as well as
marked changes in the nation’s economic fortunes - the Irish recovery of
the late 1990s, the 2000-02 high-tech crash, and a period of rapid
subsequent growth. Second, unlike some other – albeit static - studies we
are unable to identify separately those elements of each QIM linked to
Innovation, quality management and learning: a dynamic analysis
33
changes in human resource management, quality management etc. This
limits our ability to investigate the dynamic relationships between different
dimensions of quality management and innovation and between different
elements of QIMs. Both are areas in which future research would be
valuable. Finally, it is worth re-iterating that the focus of the current paper is
the QIM-innovation relationship. In future studies we propose to also
consider the QIM-productivity link.

Innovation, quality management and learning: a dynamic analysis
34
Table 1: Sample Descriptives
Variable Name & Description
Observations observations
Variable Mean
Variable Std. Dev. Innovative Sales from New Products (%)
1358 18.493 23.110
Innovative Sales from New and Imp. Products (%)
1356 31.827 30.971
Quality Certification (Q Cert) Use 1358 0.683 0.466
Quality Circles (QC)Use 1192 0.150 0.357
Total Quality Management (TQM) Use
1238 0.365 0.482
Current Q Cert Adoption 1358
0.356 0.479
Previous Q Cert Adoption
1358 0.197 0.197
Early Q Cert Adoption
1358 0.130 0.130
Current QC Adoption
1192
0.059 0.235
Previous QC Adoption
1192
0.039 0.039
Early QC Adoption
1192
0.052 0.222
Current TQM Adoption
1238
0.146 0.353
Previous TQM Adoption
1238
0.103 0.305
Early TQM Adoption
1238
0.116 0.320
In-plant R&D
1358 0.606 0.489
Linkages with Clients
1358 0.345 0.475
Linkages with Suppliers
1358 0.370 0.483
Horizontal Linkages
1358 0.965 1.496
Employment (Log)
1358 4.110 1.132
Firm Vintage
1358 28.261 28.196
Externally Owned
1358 0.304 0.460
Workforce with Degree (%)
1358 10.354 11.190
Government Support for Innovation
1358 0.323 0.468
Export Sales (%)
1358 26.964 34.665
Source: Irish Innovation Panel 1994-2008

Innovation, quality management and learning: a dynamic analysis
35
Ta
ble
2:
Co
rre
lati
on
Matr
ix
1
2
3
4
5
6
7
8
9
10
1
1
12
1
3
14
1
5
16
1
7
18
1
9
20
2
1
22
2
3
24
1
Sa
les f
rom
N
ew
Pro
du
cts
1
.00
2
Sa
les N
ew
&
Imp
rove
d
Pro
d.
0.7
6
1.0
0
3
Q C
ert
Use
0.0
4
0.0
8
1.0
0
4
QC
Use
0
.06
0.0
6
0.1
5
1.0
0
5
TQ
M U
se
0
.15
0.1
3
0.2
5
0.4
0
1.0
0
6
Curr
en
t Q
Ce
rt
Ad
op
tion
-0.0
4
0.0
1
0.5
2
0.1
5
0.2
0
1.0
0
7
Pre
vio
us Q
C
ert
Ad
op
tio
n
0.0
6
0.0
3
0.3
6
0.0
2
0.0
6
-0.3
3
1.0
0
8
Ea
rly Q
Cert
A
do
ption
0.0
5
0.0
6
0.2
9
-0.0
2
0.0
1
-0.2
7
-0.1
9
1.0
0
9
Curr
en
t Q
C
Ad
op
tion
0.0
4
0.0
2
0.1
5
0.5
9
0.2
7
0.2
5
-0.0
6
-0.0
5
1.0
0
10
P
revio
us Q
C
Ad
op
tion
-0.0
1
0.0
2
0.0
7
0.4
8
0.2
2
0.0
1
0.1
2
-0.0
5
-0.0
5
1.0
0
11
E
arl
y Q
C
Ad
op
tion
0.0
7
0.0
6
0.0
1
0.5
6
0.1
7
-0.0
4
0.0
0
0.0
7
-0.0
6
-0.0
5
1.0
0
12
C
urr
en
t T
QM
A
do
ption
0.0
4
0.0
3
0.2
0
0.2
7
0.5
4
0.4
0
-0.1
1
-0.1
3
0.4
5
0.0
2
-0.0
4
1.0
0
13
P
revio
us T
QM
A
do
ption
0.0
8
0.0
9
0.1
1
0.1
4
0.4
6
-0.0
3
0.2
1
-0.0
4
-0.0
4
0.3
2
0.0
0
-0.1
3
1.0
0
14
E
arl
y T
QM
A
do
ption
0.1
1
0.0
8
0.0
5
0.1
7
0.4
9
-0.1
1
0.0
2
0.2
0
-0.0
3
0.0
0
0.3
0
-0.1
3
-0.1
1
1.0
0
15
In-p
lan
t R
&D
0
.16
0.2
6
0.0
6
0.0
4
0.0
4
0.1
0
0.0
0
-0.0
4
0.0
1
0.0
4
0.0
3
0.0
0
0.0
5
0.0
1
1.0
0
16
L
inkag
es w
ith
C
lien
ts
0.1
5
0.2
0
0.1
1
0.1
1
0.1
3
0.1
1
0.0
4
-0.0
6
0.1
0
0.0
6
0.0
2
0.0
9
0.0
7
0.0
3
0.1
6
1.0
0
17
L
inkag
es w
ith
S
up
plie
rs
0.1
5
0.1
9
0.1
0
0.1
1
0.1
0
0.1
2
0.0
2
-0.0
4
0.1
1
0.0
3
0.0
3
0.0
8
0.0
4
0.0
2
0.1
3
0.6
4
1.0
0
18
H
ori
zo
nta
l L
inkag
es
0.1
3
0.1
9
0.1
8
0.1
4
0.1
9
0.1
8
0.0
5
-0.0
5
0.1
1
0.0
9
0.0
4
0.1
7
0.0
6
0.0
4
0.1
8
0.5
8
0.5
6
1.0
0
19
E
mp
loym
en
t (L
og
) 0
.13
0.1
5
0.3
1
0.1
8
0.2
7
0.2
3
0.1
2
-0.0
2
0.1
6
0.0
7
0.0
6
0.1
9
0.1
6
0.0
5
0.1
4
0.1
2
0.1
6
0.2
4
1.0
0
20
Fir
m V
inta
ge
-0.1
4
-0.0
8
0.0
4
-0.0
2
-0.0
4
0.1
4
-0.0
5
-0.0
9
0.0
2
-0.0
3
-0.0
3
0.0
5
-0.0
3
-0.0
8
-0.0
3
-0.0
2
0.0
1
0.0
9
0.1
0
1.0
0
21
E
xte
rna
lly
Ow
ne
d
0.1
1
0.0
9
0.2
5
0.0
9
0.2
1
0.1
8
0.1
0
-0.0
2
0.1
2
0.0
0
0.0
1
0.1
9
0.0
7
0.0
4
-0.0
6
0.0
4
0.1
0
0.1
0
0.4
3
0.0
5
1.0
0
22
W
ork
forc
e w
ith
D
eg
ree
(%
) 0
.12
0.1
3
0.0
8
0.0
5
0.1
2
0.0
9
-0.0
2
0.0
2
0.0
6
-0.0
2
0.0
3
0.1
0
0.0
6
0.0
2
0.0
8
0.1
5
0.1
2
0.1
8
0.1
1
-0.0
1
0.1
8
1.0
0
23
G
ove
rnm
en
t S
up
po
rt
0.1
3
0.2
0
0.0
8
0.0
6
0.0
6
0.0
9
-0.0
1
0.0
1
0.0
2
0.0
3
0.0
4
0.0
3
0.0
3
0.0
2
0.3
6
0.1
8
0.1
2
0.2
2
0.0
9
-0.0
1
-0.1
1
0.1
1
1.0
0
24
E
xp
ort
Sa
les
(%)
1.0
0

Innovation, quality management and learning: a dynamic analysis
36
Table 3: Static models: Tobit Models of Innovative Sales of New Products
Model 1 Model 2 Model 3
Q Cert Use -1.896
(-1.401)
QC Use
1.527
(-2.069)
TQM Use
4.601***
(-1.534)
In-plant R&D 5.194*** 6.559*** 5.829***
(-1.364) (-1.441) (-1.43)
Linkages with Clients 1.621 1.391 1.692
(-1.779) (-1.884) (-1.883)
Linkages with Suppliers 4.270** 4.036** 4.343**
(-1.709) (-1.784) (-1.800)
Horizontal Linkages 0.053 0.311 -0.201
(-0.538) (-0.567) (-0.563)
Employment (Log) -0.523 -0.445 -0.899
(-0.657) (-0.690) (-0.685)
Firm Vintage -0.091*** -0.100*** -0.092***
(-0.022) (-0.024) (-0.024)
Externally Owned 3.987** 3.725** 3.519**
(-1.679) (-1.784) (-1.787)
Workforce with Degree 0.045 0.128** 0.086
(-0.058) (-0.065) (-0.063)
Government Support 4.600*** 3.399** 3.919***
(-1.446) (-1.54) (-1.518)
Export Sales 0.028 0.014 0.019
(-0.023) (-0.025) (-0.024)
Constant 11.584*** 8.102** 9.402***
(-3.186) (-3.374) (-3.341)
N 1358 1232 1295
Chi-squared 160.286 165.573 160.887
Pseudo – R2 0.014 0.015 0.014 Notes: Standard errors in parentheses; ***p < 0.01, **p < 0.05, *p < 0.1. All the figures in the
table are marginal effects generated from Tobit models. All models include industry and wave dummies.

Innovation, quality management and learning: a dynamic analysis
37
Table 4: Dynamic models: Tobit Models of Innovative Sales of New Products
Notes: Standard errors in parentheses; ***p < 0.01, **p < 0.05, *p < 0.1. All the figures in the table are marginal effects generated from Tobit models. All models include industry and wave dummies.
Model 1 Model 2 Model 3
Current Q Cert Adoption -4.328***
(1.351) Previous Q Cert Adoption -0.643
(1.608) Early Q Cert Adoption 2.08
(1.814) Current QC Adoption
-0.075
(2.675)
Previous QC Adoption
-2.613
(3.197)
Early QC Adoption
5.427*
(2.868)
Current TQM Adoption
1.548
(1.798)
Previous TQM Adoption
3.806*
(2.096)
Early TQM Adoption
7.326***
(1.902)
In-plant R&D 5.238*** 6.165*** 5.616***
(1.157) (1.218) (1.212)
Linkages with Clients 2.021 2.166 2.338
(1.574) (1.663) (1.660)
Linkages with Suppliers 4.841*** 4.443*** 4.650***
(1.482) (1.542) (1.554)
Horizontal Linkages -0.137 0.045 -0.367
(0.490) (0.517) (0.515)
Employment (Log) 0.481 0.389 0.075
(0.557) (0.578) (0.580)
Firm Vintage -0.064*** -0.077*** -0.068***
(0.019) (0.020) (0.020)
Externally Owned 3.206** 2.414 2.257
(1.493) (1.575) (1.581)
Workforce with Degree 0.088** 0.161*** 0.139***
(0.044) (0.047) (0.046)
Government Support 5.014*** 3.739*** 4.089***
(1.302) (1.377) (1.363)
Export Sales 0.033* 0.024 0.029
(0.020) (0.021) (0.021)
Constant 4.471* 2.445 3.201
(2.558) (2.709) (2.697)
N 1715 1586 1648
Chi-squared 254.841 259.525 255.522
Pseudo – R2 0.017 0.018 0.017

Innovation, quality management and learning: a dynamic analysis
38
Ta
ble
5:
Co
mp
lem
en
tari
tie
s a
nd
Lea
rnin
g B
y U
sin
g E
ffe
cts
: T
ob
it M
od
els
of
Inn
ova
tive
Sa
les
fro
m N
ew
Pro
du
cts
Inn
ovation
Inn
ovation
Inn
ovation
Inn
ovation
Inn
ovation
Inn
ovation
S
ale
s
S
ale
s
S
ale
s
S
ale
s
S
ale
s
S
ale
s
Sim
ult
an
eo
us Q
IM A
do
pti
on
: C
om
ple
men
tari
tie
s
Earl
y Q
Cert
Ad
op
tio
n:
w
/wo
earl
yQ
C A
do
pti
on
E
arl
y Q
Cert
Ad
op
tio
n:
w
/wo
earl
y T
QM
Ad
op
tio
n
Earl
y Q
Cert
Ad
op
tio
n:
w
/wo
earl
y T
QM
Ad
op
tio
n
Earl
y Q
C A
do
pti
on
:
w/w
o e
arl
y T
QM
Ad
op
tio
n
Earl
y T
QM
Ad
op
tio
n:
w
/wo
earl
y Q
Cert
Ad
op
tio
n
Earl
y T
QM
Ad
op
tio
n:
w
/wo
earl
y Q
C A
do
pti
on
Earl
y Q
Cert
* 6.5
60
E
arl
y Q
Cert
* 11.7
0**
* E
arl
y Q
C*
7.2
76
E
arl
y Q
C*
8.0
01*
Earl
y T
QM
* 12.4
3**
* E
arl
y T
QM
* 9.2
97**
earl
y Q
C
(5.5
74
) earl
y T
QM
(3
.204
) earl
y Q
Cert
(5
.612
) earl
y T
QM
(4
.103
) earl
y Q
Cert
(3
.280
) earl
y Q
C
(4.1
81
)
Earl
y Q
Cert
* 1.1
48
E
arl
y Q
Cert
* -0
.322
E
arl
y Q
C*
4.0
05
E
arl
y Q
C*
2.4
54
E
arl
y T
QM
* 4.0
85
E
arl
y T
QM
* 7.5
13**
*
no e
arl
y Q
C
(2.0
90
) no e
arl
y T
QM
(2
.276
) no e
arl
y Q
Cert
(3
.584
) no e
arl
y T
QM
(4
.433
) no e
arl
y Q
Cert
(2
.512
) no e
arl
y Q
C
(2.4
58
)
Seq
ue
nti
al
QIM
Ad
op
tio
n:
Le
arn
ing
By U
sin
g E
ffe
cts
QC
ert
Ad
op
tio
n:
w
/wo
earl
y Q
C a
do
pti
on
Q
Cert
Ad
op
tio
n :
w
/wo
earl
y T
QM
ad
op
tio
n
QC
Ad
op
tio
n :
w
/wo
earl
y Q
Cert
ad
op
tio
n
QC
Ad
op
tio
n :
w
/wo
earl
y T
QM
ad
op
tio
n
TQ
M A
do
pti
on
:
w/w
o e
arl
y Q
Cert
ad
op
tio
n
TQ
M A
do
pti
on
:
w/w
o e
arl
y Q
C a
do
pti
on
Curr
en
t Q
Cert
*
6.2
45
C
urr
en
t Q
Cert
*
0.4
89
C
urr
en
t Q
C*
-8.0
82
C
urr
en
t Q
C*
-4.2
73
C
urr
en
t T
QM
* -1
1.1
4
Curr
en
t T
QM
* 4.8
42
earl
y Q
C
(6.0
19
) earl
y T
QM
(4
.252
) earl
y Q
Cert
(1
0.7
8)
earl
y T
QM
(1
1.1
7)
earl
y Q
Cert
(1
5.6
7)
earl
y Q
C
(11
.95
)
Curr
en
t Q
Cert
* -4
.017**
C
urr
en
t Q
Cert
*
-3.4
38**
C
urr
en
t Q
C*
1.0
55
C
urr
en
t Q
C*
1.3
44
C
urr
en
t T
QM
* 0.3
53
C
urr
en
t T
QM
* 1.2
16
no e
arl
y Q
C
(1.6
26
) no e
arl
y T
QM
(1
.587
) no e
arl
y Q
Cert
(3
.112
) no e
arl
y T
QM
(3
.106
) no e
arl
y Q
Cert
(2
.109
) no e
arl
y Q
C
(2.1
77
)
Pre
vio
us Q
Ce
rt*
-2.8
89
P
revio
us Q
Ce
rt *
5.0
23
P
revio
us Q
C*
-8.0
73
P
revio
us Q
C*
-3.2
78
P
revio
us T
QM
* -3
.886
P
revio
us T
QM
* 22.1
1**
earl
y Q
C
(7.9
85
) earl
y T
QM
(4
.510
) earl
y Q
Cert
(1
3.9
8)
earl
y T
QM
(1
1.3
5)
earl
y Q
Cert
(6
.981
) earl
y Q
C
(8.9
37
)
Pre
vio
us Q
Ce
rt*
0.1
42
P
revio
us Q
Ce
rt *
-0
.367
P
revio
us Q
C*
-3.4
32
P
revio
us Q
C*
-3.6
18
P
revio
us T
QM
* 4.2
88*
Pre
vio
us T
QM
* 2.7
55
no e
arl
y Q
C
(1.8
99
) no e
arl
y T
QM
(1
.887
) no e
arl
y Q
Cert
(3
.737
) no e
arl
y T
QM
(3
.792
) no e
arl
y Q
Cert
(2
.401
) no e
arl
y Q
C
(2.4
13
)
In-p
lan
t R
&D
5.3
43**
*
5.4
61**
*
6.5
44**
*
6.6
32**
*
5.8
96**
*
5.7
48**
*
(1
.362
)
(1.3
56
)
(1.4
40
)
(1.4
40
)
(1.4
28
)
(1.4
26
)
Clie
nts
Lin
kag
es
1.7
64
1.6
31
1.4
86
1.5
37
1.8
37
1.7
30
(1
.775
)
(1.7
71
)
(1.8
84
)
(1.8
82
)
(1.8
80
)
(1.8
77
)
Supplie
r Lin
kag
es
4.3
63**
4.3
04**
3.8
82**
4.0
06**
4.2
01**
4.2
67**
(1
.707
)
(1.6
98
)
(1.7
87
)
(1.7
82
)
(1.7
95
)
(1.7
94
)
Horz
. Lin
kag
es
-0.0
02
95
0.0
329
0.3
76
0.3
28
-0.0
69
6
-0
.075
9
(0
.538
)
(0.5
35
)
(0.5
67
)
(0.5
66
)
(0.5
63
)
(0.5
60
)
Em
plo
yment
(Log
) -0
.421
-0.4
25
-0.4
12
-0.4
39
-0.6
96
-0.8
72
(0
.657
)
(0.6
54
)
(0.6
90
)
(0.6
90
)
(0.6
88
)
(0.6
85
)
Firm
Vin
tag
e
-0.0
86
4**
*
-0.0
82
7**
*
-0.1
02**
*
-0.1
00**
*
-0.0
90
1**
*
-0.0
89
2**
*
(0
.021
8)
(0
.021
7)
(0
.023
6)
(0
.023
6)
(0
.023
7)
(0
.023
7)
Exte
rnally
Ow
ned
4.1
77**
4.0
55**
3.8
13**
3.7
45**
3.7
53**
3.8
68**
(1
.677
)
(1.6
77
)
(1.7
84
)
(1.7
81
)
(1.7
86
)
(1.7
82
)
Work
forc
e w
Deg
ree
0.0
371
0.0
358
0.1
22*
0.1
24*
0.0
760
0.0
934
(0
.058
4)
(0
.058
0)
(0
.064
6)
(0
.064
5)
(0
.062
5)
(0
.062
6)
Govt.
Sup
po
rt
4.5
88**
*
4.1
53**
*
3.3
24**
3.2
79**
3.6
54**
3.6
01**
(1
.447
)
(1.4
41
)
(1.5
38
)
(1.5
41
)
(1.5
17
)
(1.5
15
)
Export
Sale
s
0.0
265
0.0
271
0.0
136
0.0
107
0.0
205
0.0
201
(0
.023
2)
(0
.023
1)
(0
.024
8)
(0
.024
8)
(0
.024
1)
(0
.024
1)
Consta
nt
11.0
9**
*
10.9
6**
*
8.2
13**
8.2
14**
9.4
85**
*
9.5
66**
*
(3
.190
)
(3.1
74
)
(3.3
78
)
(3.3
70
)
(3.3
25
)
(3.3
31
)
Obse
rva
tio
ns
1,3
58
1,3
58
1,2
32
1,2
32
1,2
95
1,2
95
DV
Q
Ce
rt
Q
Ce
rt
Q
C
Q
C
T
QM
TQ
M
con
ditio
nal on
Q
C
T
QM
Q C
ert
TQ
M
Q
Ce
rt
Q
C
Com
ple
me
nta
rities
0.8
8
10.7
***
0.2
5
0.8
7
4.4
5**
0.1
4
LB
U P
revio
us
0.1
4
1.3
5
0.1
0
1.2
7
4.4
6**
LB
U C
urr
ent
2.8
9*
0.8
3
0.6
8
0.2
4
0.5
3
0.0
9
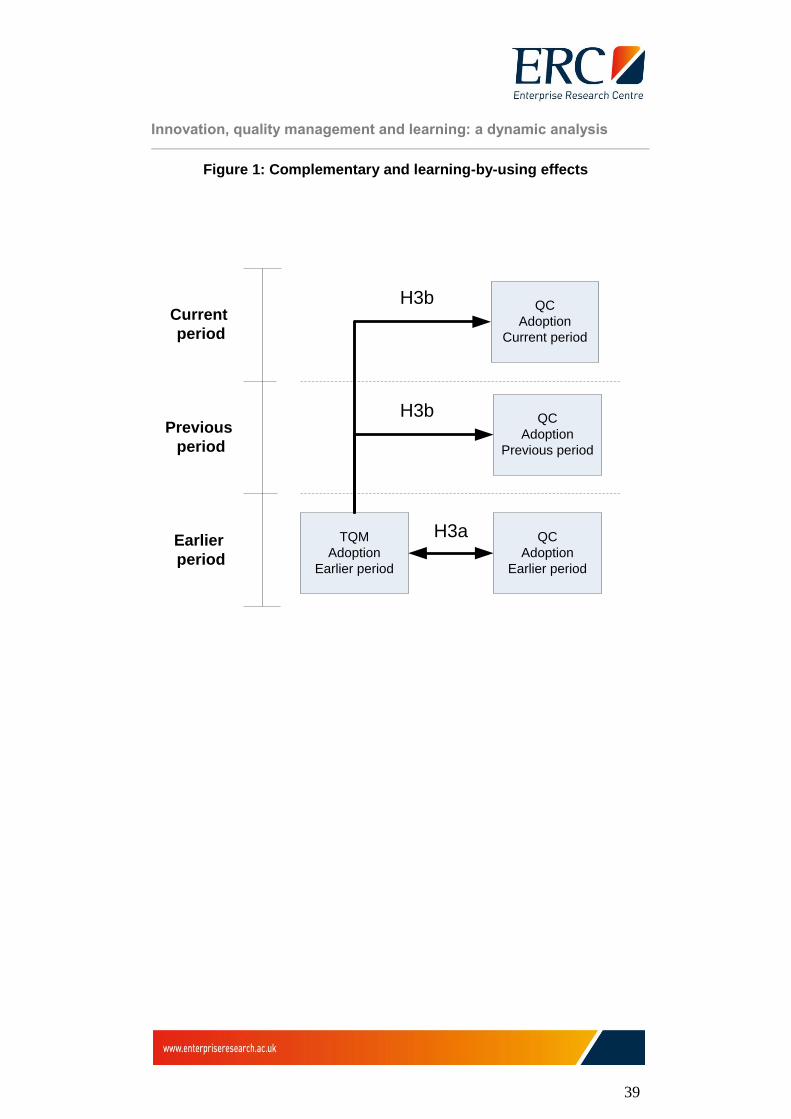
Innovation, quality management and learning: a dynamic analysis
39
Figure 1: Complementary and learning-by-using effects
TQM
Adoption
Earlier period
QC
Adoption
Earlier period
QC
Adoption
Previous period
QC
Adoption
Current period
Current
period
Previous
period
Earlier
period
H3b
H3b
H3a

Innovation, quality management and learning: a dynamic analysis
40
Annex 1: Variable Definitions
Innovation
Innovative sales (new) (% sales) An indicator representing the percentage of firms’ sales at the time of the survey accounted for by products which had been newly introduced over the previous three years.
QIM variables
Current user Static binary measure taking value 1 if the plant had implemented the QIM at the time of the survey and zero otherwise.
Current adopter Dynamic binary variable taking value 1 if the plant had first introduced the QIM in the previous three years and zero otherwise.
Early adopter
Dynamic binary variable taking value 1 if the plant had first introduced the QIM 4-6 years prior to the survey date and zero otherwise.
Previous adopter
Dynamic binary variable taking value 1 if the plant had introduced the QIM more than 6 years prior to the survey date and zero otherwise.
Firm Controls
In plant R&D A binary indictor taking value one if the plant has an in-house R&D capacity.
Clients Linkages A binary indicator taking value one if the plant is co-operating with customers as part of its innovation activity.
Supplier Linkages A binary indicator taking value one if the plant is co-operating with suppliers as part of its innovation activity.
Horiz. Linkages A count indicator of the breadth of plants’ other innovation partnering activity. Takes values 0 to 7 depending on how many different types of partner the plant is working with: consultant, competitor, joint venture, government laboratory, university, private laboratory, industry research centre.
Employment Employment at the time of the survey.
Firm vintage The time in years between the establishment date of the plant and the date of the survey.
Externally owned A binary indicator taking value 1 if the firm was externally-owned. For plants in Ireland this means owned outside the country. For plants in Northern Ireland this means plants owned outside the region.
Workforce with degree The percentage of the workforce with a degree or equivalent qualification.
Government support A binary indicator taking value one if the plant had received government support for product innovation over the previous three years.
Export sales A binary indicator taking value one if the plant was selling outside the UK and Ireland at the time of the survey and zero otherwise

Innovation, quality management and learning: a dynamic analysis
41
REFERENCES
Abrunhosa, A. and P. Moura E Sá. 2008. Are TQM principles supporting
innovation in the Portuguese footwear industry? Technovation 28(4):208-
221.
Adam, E.E.; B.E. Flores; and A. Macias. 2001. Quality improvement
practices and the effect on manufacturing firm performance: evidence from
Mexico and the USA. International Journal of Production Research
39(1):43-63.
Anderson, J.C.; M. Rungtusanatham; and R.G. Schroeder. 1994. A theory
of quality managment underlying the deming management method.
Academy of Management Review 19(3):472-509.
Arora, A. and A. Gambardella. 1990. Complementarity and external
linkages: the strategies of the large firms in biotechnology. Journal of
Industrial Economics 38, 361-379.
Audretsch, D.B. and M.P. Feldman. 1996. R&D Spillovers and the
Geography of Innovation and Production. The American Economic Review
86(3):630-640.
Barnes, J.W.; D.W.J. Jackson; M.D. Hutt; and A. Kumar. 2006. The role of
culture strength in shaping sales force outcomes Journal of Personal
Selling & Sales Management 26(3):255-270.
Baumol, W.J. 2002. The free market innovation machine. Princeton
Princeton University Press.
Belderbos, R.; M. Carree; and B. Lokshin. 2006. Complementarity in R&D
cooperation strategies. Review of Industrial Organization 28(4):401-426.
Benner, M. and M. Tushman. 2002. Process Management and
Technological Innovation: A Longitudinal Study of the Photography and
Paint Industries. Administrative Science Quarterly 47(4):676-706.
Innovation, quality management and learning: a dynamic analysis
42
Black, S.A. and L.J. Porter. 1996. Identification of the Critical Factors of
TQM*. Decision Sciences 27(1):1-21.
Bodas Freitas, I.M. 2008. Sources of differences in the pattern of adoption
of organizational and managerial innovations from early to late 1990s, in
the UK. Research Policy 37(1):131-148.
Boschma, R. 2005. Proximity and Innovation: A Critical Assessment.
Regional Studies 39, 61-74.
Buiseret, T.; H.M. Cameron; and L. Georgiou. 1995. What differences does
it make? Additionality in the public support of R&D in large firms.
International Journal Of Technology Management 10(4-6):587-600.
Cameron, K. and C. Barnett. 2000. Organizational quality as a cultural
variable. . In The Quality Movement &
Organization Theory, ed. R. Cole and W. Richard, 271–294. Beverly Hills,
CA: Sage Publications.
Cassiman, B. and R. Veugelers. 2006. In search of complementarity in
innovation strategy: Internal R&D and external knowledge acquisition.
Management Science 52(1):68-82.
Cassiman, B. and R. Veugelers. 2006. In Search of Complementarity in
Innovation Strategy:Cooperation in R&D Internal R&D and External
Technology Acquisition Management Science & Public Policy 52(1):68-82.
Chesborough, H.W. 2006. Open Innovation: a new paradign for
understanding industrial innovation. Oxford: Oxford University Press.
Chesbrough, H.W. 2007. Why companies should have open business
models. MIT Sloan Management Review 48(2):22-+.

Innovation, quality management and learning: a dynamic analysis
43
Colombo, M.G. and R. Mosconi. 1995. Complementarity and Cumulative
Learning Effects in the Early Diffusion of Multiple Technologies. The
Journal of Industrial Economics 43(1):13-48.
Corbett, C.J.; M.J. Montes-Sancho; and D.A. Kirsch. 2005. The financial
Impact of ISO 9000 Certification in the US: an empirical analysis. .
Management Science 51(7):1046–1059.
Crepon, B.; E. Duguet; and J. Mairessec. 1998. Research, Innovation And
Productivi[Ty: An Econometric Analysis At The Firm Level. Economics of
Innovation and New Technology 7(2):115-158.
Deming, W.E. 1986. Out of the Crisis. Cambridge: MIT Press.
Diaye, M.-A.; N. Greenan; and S. Pekovic. 2009. ISO 9000 Norm as a Club
Good: network effect evidence from French Employer Survey. mimeo.
Douglas, A.; S. Coleman; and R. Oddy. 2003. The case for ISO 9000. The
TQM Magazine 15(5):316-324.
Foley, K.; R. Barton; K. Busteed; J. Hulbert; and J. Sprouster. 1997.
Quality, Productivity and Competitiveness: The Role of Quality in
Australia’s Social and Economic Development. Sydney: Standards
Australia.
Freel, M.S. 2003. Sectoral Patterns of Small Firm Innovation: Networking
and Proximity. Research Policy 32, 751-770.
Freel, M.S. 2005. Patterns of Innovation and skills in small firms.
Technovation 25, 123-134.
Glynn, M.A. 1996. Innovative Genius: A Framework for Relating Individual
and Organizational Intelligences to Innovation. Academy of Management
Review 21(4):1081-1111.

Innovation, quality management and learning: a dynamic analysis
44
Gordon, N.R. and P. McCann. 2005. Innovation, agglomeration, and
regional development. Vol. 5, Issue 5, pp. 523-543, 2005. . Journal of
Economic Geography 5(5):523-543.
Griffith, R.; E. Huergo; J. Mairesse; and B. Peters. 2008. Innovation and
Productivity Across Four European Countries. Oxford Review of Economic
Policy 22, 483-498.
Griffith, R.; S. Redding; and J. Van Reenan. 2003. R&D and Absorptive
Capacity: Theory and Empirical Evidence. Scandinavian Journal of
Economics 105(1):99-118.
Griliches, Z. 1995. R&D and Productivity: Econometric Results and
Measurement Issues. Oxford: Blackwell.
Harris, R.I.D. and M. Trainor. 1995. Innovation and R&D in Northern Ireland
Manufacturing: A Schumpeterian Approach. Regional Studies 29, 593-604.
He, Z.L. and P.K. Wong. 2012. Reaching Out and Reaching Within: A
Study of the Relationship between Innovation Collaboration and Innovation
Performance. Industry and Innovation 19(7):539-561.
Heckman, J. 1979. Sample Selection Bias as a specification error.
Econometrica 47(1):153-161.
Hewitt-Dundas, N. and S. Roper. 2008. Ireland’s Innovation Performance:
1991-2005. Quarterly Economic Commentary, ESRI, Dublin.(Summer
2008):46-68
Hewitt-Dundas, N. and S. Roper. 2009. Output Additionality of Public
Support for Innovation: Evidence for Irish Manufacturing Plants. European
Planning Studies 18(1):107-122.
Hoang, D.T.; B. Igel; and T. Laosirihongthong. 2006. The impact of total
quality management on innovation. International Journal of Quality &
Reliability Management 23(9):1092-1117.

Innovation, quality management and learning: a dynamic analysis
45
Hung, R.Y.Y.; B.Y.-H. Lien; B. Yang; C.-M. Wu; and Y.-M. Kuo. 2011.
Impact of TQM and organizational learning on innovation performance in
the high-tech industry. International Business Review 20(2):213-225.
Jordan, D. and E. O'Leary. 2008. Is Irish Innovation Policy Working?
Evidence from Irish High-Technology Businesses. Journal of the Statistical
and Social Inquiry Society of Ireland XXXVII1-45.
Kanji, G.K. 2002. Measuring Business Excellence. Routeledge. London,
UK: Routledge.
Kanter, R.M. 1983. The Change Master: Innovation and Entrepreneuship in
the American Corporation. New York: Simon and Schuster.
Kartha, C.P. 2004. A comparison of ISO 9000:2000 quality systems
standards, QS 9000, ISO/TS 16949 and Baldridge criteria. TQM Magazine
16(5):331-340.
Kaynak, H. 2003. The relationship between total quality management
practices and their effects on firm performance. Journal of Operations
Management 21(4):405-435.
Laursen, K. and A. Salter. 2006. Open for Innovation: The role of openness
in explaining innovation performance among UK manufacturing firms.
Strategic Management Journal 27, 131-150.
Leiponen, A. 2005. Skills and innovation. International Journal of Industrial
Organization 23(5-6):303-323.
López-Mielgo, N.; J.M. Montes-Peón; and C.J. Vázquez-Ordás. 2009. Are
quality and innovation management conflicting activities? Technovation
29(8):537-545.
Love, J.H. and S. Roper. 2001. Networking and Innovation Success: A
Comparison of UK, German and Irish Companies. Research Policy 30,
643-661.

Innovation, quality management and learning: a dynamic analysis
46
Love, J.H.; S. Roper; and J.R. Bryson. 2011. Openness, knowledge,
innovation and growth in UK business services. Research Policy
40(10):1438-1452.
Love, J.H.; S. Roper; and J. Du. 2009. Innovation, Ownership and
Profitability. Internation Journal of Industrial Organization.
Maddala, G. 1983. Limited Dependent and Qualitative Variables in
Econometrics. New York: Cambridge University Press.
Mansury, M.A. and J.H. Love. 2008. Innovation, productivity and growth in
US business services: A firm-level analysis. Technovation 28(1–2):52-62.
Martínez-Costa, M. and A.R. Martínez-Lorente. 2008. Does quality
management foster or hinder innovation? An empirical study of Spanish
companies. Total Quality Management & Business Excellence 19(3):209-
221.
McAdam, R. 2000. Quality Models in an SME Context: a Critical
Perspective Using a Grounded Approach. International Journal of Quality &
Reliability Management 17, 305-323.
———. 2004. Knowledge creation and idea generation: a critical quality
perspective. Technovation 24(9):697-705.
McCann, P. and J. Simonen. 2005. Innovation, knowledge spillovers and
local labour markets. Papers in Regional Science 84(3):465-485.
Meehan, E. 2000. Britain's Irish Question: Britain's European Question?:
British-Irish relations in the context of the European Union and the Belfast
Agreement. Review of International Studies 26(1):83-97.
Morgan, N.A. and D.W. Vorhies. 2001. Product quality alignment and
business unit performance. Journal of Product Innovation Management
18(6):396-407.

Innovation, quality management and learning: a dynamic analysis
47
Moura E Sá, P. and A. Abrunhosa. 2007. The Role of TQM Practices in
Technological Innovation: The Portuguese Footwear Industry Case. Total
Quality Management & Business Excellence 18(1-2):57-66.
Nowak, A. 1997. Strategic relationship between quality management and
product innovation. The Mid-Atlantic Journal of Business 33(2):119-135.
O'Malley, E.; S. Roper; and N. Hewitt-Dundas. 2008. High growth and
innovation with low R&D: The case of Ireland. In Small Economy Innovation
System; Comparing Globalization, Change and Policy in Asia and Europe,
ed. C. Edquist and L. Hommen: Elgar.
Oerlemans, L.; M. Meeus; and F. Boekema. 1998. Do networks matter for
innovation? The usefulness of the economic network approach in analysing
innovation. Tijdschrift voor Economische en Sociale Gcografie 89, 298-309.
Pekovic, S. and F. Galia. 2009. From quality to innovation: Evidence from
two French Employer Surveys. Technovation 29(12):829-842.
Perdomo-Ortiz, J.; J. Gonzalez-Benito; and J. Galende. 2009. The
intervening effect of business innovation capability on the relationship
between Total Quality Management and technological innovation.
International Journal of Production Economics 47(18):5087-5107.
Perdomo-Ortiz, J.; J. González-Benito; and J. Galende. 2006. Total quality
management as a forerunner of business innovation capability.
Technovation 26(10):1170-1185.
———. 2009. An analysis of the relationship between total quality
management-based human resource management practices and
innovation. The International Journal of Human Resource Management
20(5):1191-1218.
Prajogo, D.I. and S.W. Hong. 2008. The effect of TQM on performance in
R&D environments: a perspective from South Korean firms Technovation
28(12):855-863.

Innovation, quality management and learning: a dynamic analysis
48
Prajogo, D.I. and A.S. Sohal. 2001. TQM and innovation: a literature review
and research framework. Technovation 21(9):539-558.
Prajogo, D.I. and A.S. Sohal. 2003. The relationship between TQM
practices, quality performance, and innovation performance. International
Journal of Quality & Reliability Management 20(8):901-918.
Prajogo, D.I. and A.S. Sohal. 2004. The multidimensionality of TQM
practices in determining quality and innovation performance—an empirical
examination. Technovation 24(6):443-453.
Ritala, P.; K. Henttonen; H. Salojarvi; L.M. Sainio; and S. Saarenketo.
2013. Gone fishing for knowledge? The effect of strategic orientations on
the scope of open knowledge search. Baltic Journal of Management
8(3):328-348.
Romer, P.M. 1990. Endogenous Technological Change. Journal of Political
Economy 98(5):S71-S102.
Roper, S. and J. Anderson. 2000. Innovation and E-Commerce - A Cross-
Border Comparison of Irish Manufacturing Plants. Belfast.
Roper, S.; B. Ashcroft; J.H. Love; S. Dunlop; H. Hofmann; and K. Vogler-
Ludwig. 1996. Product Innovation and Development in UK, German and
Irish Manufacturing: Queen's University of Belfast/University of
Strathclyde/ifo Institut.
Roper, S.; J. Du; and J.H. Love. 2008. Modelling the Innovation Value
Chain. Research Policy 37(6-7):961-977.
Roper, S.; J. Du; and J.H. Love. 2008. Modelling the innovation value chain
Research Policy 37, 961-977.
Roper, S. and N. Hewitt-Dundas. 1998. Innovation, Networks and the
Diffusion of Manufacturing Best Practice: A Comparison of Northern Ireland
and the Republic of Ireland. Belfast: NIERC.
Innovation, quality management and learning: a dynamic analysis
49
Roper, S.; N. Hewitt-Dundas; and J.H. Love. 2004. An Ex Ante Evaluation
Framework for the Regional Benefits of Publicly Supported R&D Projects.
Research Policy 33, 487-509.
Rosenberg, N. 1982. Inside the Black Box: Technology and Economics.
Cambridge: Cambridge University Press.
Rungtusanatham, M.; C. Forza; R. Filippini; and J.C. Anderson. 1998. A
replication study of a theory of quality management underlying the Deming
management method: insights from an Italian context. Journal of
Operations Management 17(1):77-95.
Sadikoglu, E. and C. Zehir. 2010. Investigating the effects of innovation and
employee performance on the relationship between total quality
management practices and firm performance: An empirical study of Turkish
firms. International Journal of Production Economics 127(1):13-26.
Santos-Vijande, M.L. and L.I. Álvarez-González. 2007. Innovativeness and
organizational innovation in total quality oriented firms: The moderating role
of market turbulence. Technovation 27(9):514-532.
Schnaars, S.P. 1994. Managing Imitation Strategies. New York: Free
Press.
Schumpeter, J. 1934. The Theory of Economic Development. Cambridge,
Mas: Harvard University Press.
Sousa, R. and C.A. Voss. 2002. Quality management re-visited: a reflective
review and agenda for future research. Journal of Operations Management
20(1):91-109.
Subramony, M. 2009. A meta‐analytic investigation of the relationship
between HRM bundles and firm performance. Human Resource
Management 48(5):745-768.
Innovation, quality management and learning: a dynamic analysis
50
Terlaak, A. and A. King. 2006. The effect of certification with ISO 9000
Quality Management Standard: a signalling approach. Journal of Economic
Behaviour and Organization 60(4):579-602.
Terziovski, M.; D. Power; and A. Sohal. 2003. 2003. The longitudinal
effects of the ISO 9000 certification process on business performance.
European Journal of Operational Research 146(3):580-595.
Tether, B.S. 1998. Small and large firms: sources of unequal innovations?
Research Policy 27, 725-745.
Trott, P. 2008. Innovation Management and New Product Development.
England: Pearson Eduction.
Zairi, M. 1994. Innovation or Innovativeness, results of a benchmarking
study. TQM Magazine 5(3):10-16.

Innovation, quality management and learning: a dynamic analysis
51
Centre Manager Enterprise Research Centre
Aston Business School Birmingham, B1 7ET
Centre Manager Enterprise Research Centre
Warwick Business School Coventry, CV4 7AL
The Enterprise Research Centre is an independent research centre funded by the Economic and Social Research Council (ESRC); the Department for Business,
Innovation & Skills (BIS); the Technology Strategy Board (TSB); and, through the British Bankers Association (BBA), by the Royal Bank of Scotland PLC; Bank of Scotland PLC;
HSBC Bank PLC; Barclays Bank PLC and Lloyds TSB Bank PLC.