innovation in monitoring: the u.s. geological survey ... to sonar, with hydro-acoustic devices (fig....
TRANSCRIPT

U.S. Department of the InteriorU.S. Geological Survey
Fact Sheet 2015–3061January 2016
Innovation in Monitoring: The U.S. Geological Survey Sacramento–San Joaquin River Delta, California, Flow-Station Network
ISSN 2327-6932 (online)http://dx.doi.org/10.3133/fs20153061
The U.S. Geological Survey (USGS) installed the first gage to measure the flow of water into California’s Sacramento–San Joaquin River Delta (figs. 1, 2) from the Sacramento River in the late 1800s. Today, a network of 35 hydro-acoustic meters measure flow throughout the delta. This region is a critical part of California’s freshwater supply and conveyance system. With the data provided by this flow-station network—sampled every 15 minutes and updated to the web every hour—state and federal water managers make daily decisions about how much freshwater can be pumped for human use, at which locations, and when. Fish and wildlife scientists, working with water managers, also use this information to protect fish species affected by pumping and loss of habitat. The data are also used to help determine the success or failure of efforts to restore ecosystem processes in what has been called the “most managed and highly altered” watershed in the country.
Understanding flow would be less challenging if managers and scientists were only trying to measure the outflow of the watershed’s myriad rivers and streams into San Francisco Bay and the ocean. However, the delta also receives a large amount of seawater that exchanges with the Pacific Ocean; peak tidal flows of 1.7 million cubic feet per second are exchanged into and out of the estuary by the tides through the Golden Gate. Twice every day, tides surge into the delta, causing reversed flows as far upstream as Freeport, less than 15 miles downstream from the city of Sacramento, before ebbing back to the ocean. It is a challenge to measure the amount of fresh water flowing through the delta’s labyrinth of channels because it is
Delta outflowDelta outflow
San JoaquinRiver/centraldelta exchanges
San JoaquinRiver/centraldelta exchanges
Old and MiddleRiver flowsOld and MiddleRiver flows
Yolo Bypass flowYolo Bypass flow
Sutter/Steamboatcorridor
Sutter/Steamboatcorridor
Deltatransferflow
Deltatransferflow
MokelumneRiver systemexchange
MokelumneRiver systemexchange
Export flowsExport flows
Franks Tract
Yolo
Byp
ass
Threemile Slough
Grant Line Canal
Sacr
amen
to De
ep W
ater S
hip
River
Mokelumne
Dry
Elk Slo
ugh
Stea
mboa
tSlo
ughSu
tter
Sloug
h
Creek
San
Old
Middle
River
River
Joaquin
River
Chan
nel
S acramento
Rive r
Cosumnes R
iver
State Water Projectpumping plant
Central Valley Projectpumping plant
SRVSRV
SJJSJJ
TSLTSL
GESGES
GSSGSS
DLCDLC
FPTFPT
SDCSDCSSSSSS
DSJDSJ
MDMMDMOBIOBI
OH4OH4
GLCGLC
ODMODM
SJGSJG
RYIRYI
HWBHWB
VCUVCU
TRNTRN
SUTSUT
SMRSMRNMRNMR
LPSLPS
MOKMOK
OSJOSJPRIPRI
HOLHOL
OROORO
SDISDI
MALMAL
LIBLIBDWSDWS
HLTHLT
FALFAL
Lodi
WalnutGrove
Rio Vista
Hood
Freeport
Stockton
Middle River
Tracy
Pittsburg
Antioch
EXPLANATION
DMCFlow station and identifierPumping plant
Station groups
Yolo Bypass
Base modified from U.S. Geological Survey and other Federal and State digital data, various scaleAlbers Equal Area ProjectionNorth American Datum of 1983
121˚30' 121˚15'
37˚45'
38˚
38˚15'
38˚30'
121˚45'
0 4 8 Miles
0 4 8 Kilometers
SanFrancisco
SacramentoRiver
SanJoaquin
River
SacramentoSacramento Sacramento-San Joaquin
Delta
San Francisco
Bay
sac14-0528_fig 01
Figure 1. The Sacramento–San Joaquin River Delta showing the location of U.S. Geological Survey-operated sites.
so strongly influenced by tides. Yet in the last few decades, the USGS Bay–Delta hydrodynamics team has measured delta flows successfully (fig. 3) by pioneering techniques for improved measurements of tidal currents and freshwater inflows (Simpson and Oltmann, 1993; Simpson and Bland, 2000; Simpson, 2002; Ruhl and Simpson, 2005; Dinehart and Burau, 2005a, 2005b) to reflect real-time conditions in the delta more accurately.
The modern-day flow station employs technology similar to sonar, with hydro-acoustic devices (fig. 4) and other monitoring tools that are attached to pilings on the edges of delta channels. Measurements from these stations are telemetered to computers through cell-phone modems, which upload the data to the Internet within minutes (Sauer and Turnipseed, 2010). Many stations include sensors for measurement of components
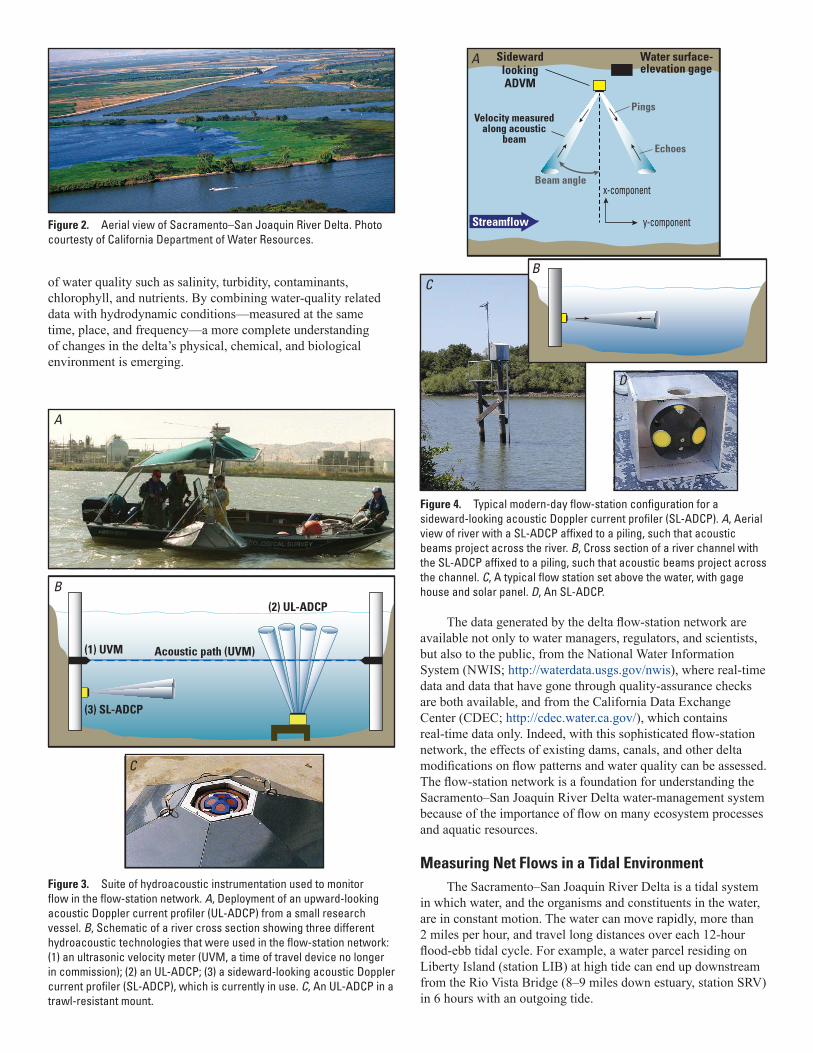
of water quality such as salinity, turbidity, contaminants, chlorophyll, and nutrients. By combining water-quality related data with hydrodynamic conditions—measured at the same time, place, and frequency—a more complete understanding of changes in the delta’s physical, chemical, and biological environment is emerging.
The data generated by the delta flow-station network are available not only to water managers, regulators, and scientists, but also to the public, from the National Water Information System (NWIS; http://waterdata.usgs.gov/nwis), where real-time data and data that have gone through quality-assurance checks are both available, and from the California Data Exchange Center (CDEC; http://cdec.water.ca.gov/), which contains real-time data only. Indeed, with this sophisticated flow-station network, the effects of existing dams, canals, and other delta modifications on flow patterns and water quality can be assessed. The flow-station network is a foundation for understanding the Sacramento–San Joaquin River Delta water-management system because of the importance of flow on many ecosystem processes and aquatic resources.
Measuring Net Flows in a Tidal Environment The Sacramento–San Joaquin River Delta is a tidal system
in which water, and the organisms and constituents in the water, are in constant motion. The water can move rapidly, more than 2 miles per hour, and travel long distances over each 12-hour flood-ebb tidal cycle. For example, a water parcel residing on Liberty Island (station LIB) at high tide can end up downstream from the Rio Vista Bridge (8–9 miles down estuary, station SRV) in 6 hours with an outgoing tide.
Figure 2. Aerial view of Sacramento–San Joaquin River Delta. Photo courtesty of California Department of Water Resources.
Figure 3. Suite of hydroacoustic instrumentation used to monitor flow in the flow-station network. A, Deployment of an upward-looking acoustic Doppler current profiler (UL-ADCP) from a small research vessel. B, Schematic of a river cross section showing three different hydroacoustic technologies that were used in the flow-station network: (1) an ultrasonic velocity meter (UVM, a time of travel device no longer in commission); (2) an UL-ADCP; (3) a sideward-looking acoustic Doppler current profiler (SL-ADCP), which is currently in use. C, An UL-ADCP in a trawl-resistant mount.
A
Acoustic path (UVM)
(2) UL-ADCP
(1) UVM
(3) SL-ADCP
B
UL-ADCP
C
Figure 4. Typical modern-day flow-station configuration for a sideward-looking acoustic Doppler current profiler (SL-ADCP). A, Aerial view of river with a SL-ADCP affixed to a piling, such that acoustic beams project across the river. B, Cross section of a river channel with the SL-ADCP affixed to a piling, such that acoustic beams project across the channel. C, A typical flow station set above the water, with gage house and solar panel. D, An SL-ADCP.
C
D
Water surface-elevation gage
SidewardlookingADVM
Streamflow y-component
x-componentBeam angle
Echoes
PingsVelocity measured
along acousticbeam
A
B

The density of flow stations in the network is necessitated, in part, by the dynamic nature of transport processes in the Sac-ramento–San Joaquin River Delta. Calculating net flows (fresh-water discharge) by using measured tidal flows is a classic signal (net flows) to noise (periodic tidal flows) problem. Because the net flows are small and tidal flows large, calculating the net flow places rigorous demands on the accuracy of tidal-flow estimates and every aspect of the data-collection process.
For example, at the San Joaquin River at Jersey Point station (SJJ), the daily peak tidal flows can be on the order of 150,000 cubic feet per second (cfs), whereas the net flows can be 2,000 cfs or less. Thus, estimates of net flows require that the tidal flow data be accurate to better than 1 percent, a challenging requirement. Even a small bias, on a percentage basis, in either the flood or ebb tidal discharge estimates can result in erroneous calculations of net flow, possibly in the wrong direction.
Network History The flow-station network developed over time to address
a series of specific questions. The first question, how much freshwater was flowing into the Sacramento–San Joaquin River Delta from the Sacramento River, was answered with the installation of the first hydro-acoustic meter at Freeport (Sta-tion FPT in fig. 1; see table 1 for NWIS station numbers) in 1978. A decade later, water managers and scientists wanted to quantify the influence of water-export facilities on the north-to-south movement of water from central to southern regions of the delta. In response, the USGS installed two more acoustic velocity meters at Old River (station OBI) by Bacon Island and at Middle River near Holt (HLT, 1987). In the early 1990s, the
USGS installed two stations in the Walnut Grove area, so water-project operators could find out how much water was flowing from the Sacramento River into the central delta through the Delta Cross Channel (DLC) and Georgiana Slough (GSS), the so-called delta transfer flow. Finally, a combination of four sta-tions in the south delta, just upstream of the export pumps, was installed to estimate delta export flows (stations Old River near Byron, OH4; Victoria Canal, VCU; Great Line Canal, GLC; and Delta Mendota Canal, ODM). As of November 2015, the USGS operated 35 stations throughout the Sacramento–San Joaquin River Delta.
Technological Advances Until the 1970s, getting just a snapshot of the net flows
required campaigns over 30-hour periods employing multiple boats, multiple current meters (Price AA1), and long tag lines stretched across wide channels. It was difficult to routinely collect a time series of the net flows, the type of data that managers now take for granted. Today, most of the flow stations employ sideward-looking acoustic Doppler current profilers (SL-ADCPs) attached to pilings or channel markers (fig. 4). Measurements of velocity, cross-sectional area, and stage are used to compute volumetric discharge (for example, cubic feet of water per second). In 2008, “robot boats,” unmanned vessels equipped with acoustic devices, were introduced. More recently, new systems have been set up that enable scientists to repair or reset stations remotely (fig. 5). Such improvements greatly reduce the costs of running the flow-station network.
Table 1. Delta flow-station network.
[Abbreviations: CDEC, California Data Exchange Center; NWIS, National Water Information System]
Name (CDEC abbreviation)NWISstation number
Name (CDEC abbreviation)NWISstation number
Sacramento River at Freeport CA (FPT) 11447650 San Joaquin River at Jersey Point (SJJ) 11337190Sutter Slough at Courtland CA (SUT) 11447830 False River near Oakley CA (FAL) 11313440Steamboat Slough near Walnut Grove CA (SSS) 11447850 Old River at Franks Tract near Terminous CA (OSJ) 11313452Miner Slough at Hwy 84 bridge CA (HWB) 11455165 San Joaquin River at Prisoners Point near Terminous CA (PRI) 11313460Sacramento River Deep Water Ship Channel near Rio Vista CA
(DWS)11455335 Middle River near Holt CA (HLT) 11312685
Cache Slough at south Liberty Island near Rio Vista CA (LIB) 11455315 Old River at Quimby Island near Bethel Island CA (ORQ) 11313434Sacramento R at Delta Cross Channel CA (SDC) 11447890 Holland Cut near Bethel Island CA (HOL) 11313431Delta Cross Channel near Walnut Grove CA (DLC) 11336600 Dutch Slough below Jersey Island Road at Jersey Island CA
(DSJ)11313433
Sacramento River below Georgiana Slough CA (GES) 11447905 Turner Cut near Holt CA (TRN) 11311300Georgiana Slough near Sacramento River CA (GSS) 11447903 Old River near Bacon Island CA (OBI) 11313405South Mokelumne River at New Hope bridge near Walnut
Grove CA (SMR)11336680 Middle River at Middle River CA (MDM) 11312676
North Mokelumne River near Walnut Grove CA (NMR) 11336685 San Joaquin River below Garwood bridge at Stockton CA (SJG) 11304810Mokelumne River at Andrus Island near Terminous CA (MOK) 11336930 Old River near Byron CA (OH4) 11313315Little Potato Slough at Terminous CA (LPS) 11336790 Victoria Canal near Byron CA (VCU) 11312672Cache Slough at Ryer Island CA (RYI) 11455350 Grant Line Canal near Tracy CA (GLC) 11313240Sacramento River at Rio Vista CA (SRV) 11455420 Old River at Delta Mendota Canal CA (ODM) 11312968Three Mile Slough near Rio Vista CA (TSL) 11337080 Sacramento River at Mallard Island CA (MAL) 11185185Sacramento River at Decker Island near Rio Vista CA (SDI) 11455478
1Use of trade names in this manuscript is for descriptive purposes only and does not constitute endorsement by the U.S. Geological Survey.
as OMR (Old and Middle River flow), represents the flow of water toward the export facilities from the north. The data from these stations currently are used to adjust water management to comply with a variety of court decisions and biological opinions under the Endangered Species Act. The OMR flow parameter used for regulatory purposes is a 14-day average of the measured (tidal) flows.
Sutter-Steamboat Corridor
Sutter and Steamboat Sloughs are important conveyance channels that carry half of the water that flows past the city of Sacramento at high water. Sutter Slough carries the bulk of the net flow; Steamboat Slough is more tidally dominated. The flows in both of these channels are strongly influenced by Sacramento River flows and Delta Cross Channel gate operations. Hydrodynamic data collected at Sutter (SUT) and Steamboat (SSS) Sloughs are also important for the study of salmon outmi-gration (Perry and others, 2013; Romine and others, 2013).
Yolo Bypass
The flows entering the Sacramento-San Joaquin Delta from the Yolo Bypass are computed by subtracting the flow in Miner Slough (HWB) from the flow in Cache Slough (RYI). This com-putation also defines the tidal and net exchanges into the Liberty Island/Cache Slough region, an area slated for large restoration efforts. Moreover, this region is one of the few places where delta smelt are found year round (Sommer and Mejia, 2013).
Mokelumne River System Exchange
Most of the Sacramento River water that is exported flows through the Mokelumne River system. When the Delta Cross Channel gates are open, this region is essentially riverine. Conversely, when the gates are closed, this system is primarily tidal. The data from the Mokelumne (MOK) and Little Potato Slough (LPS) stations also are relevant to salmon migration, because salmon outmigrants that take this route have lower sur-vival (Perry and others, 2013), and are critical for monitoring the system’s response to the proposed restoration of McCormack–Williamson Tract and Staten Island.
San Joaquin River/Central Delta Exchanges
Exchanges of water from the San Joaquin River into the central delta are important for understanding how salinity and turbidity (from suspended sediments and organic matter) change in the system. The four stations used to calculate this exchange are Turner Cut (TRN), Middle River north of Mildred Island (HLT), Old River north of Frank’s Tract near the confluence of the San Joaquin and Mokelumne Rivers (OSJ), and False River (FAL). These exchanges strongly influence the rate of entrain-ment of San Joaquin River salmon outmigrants into the central delta (Holbrook and others, 2008; Buchanan and others, 2013).
Export Flows
The volume of water entering the federal and state export facilities from the various “feeder” channels is calculated by using data from the following stations: Old River at Highway 4 (OH4), Victoria Canal (VCU), Grant Line Canal (GLC), and Delta Mendota Canal (ODM).
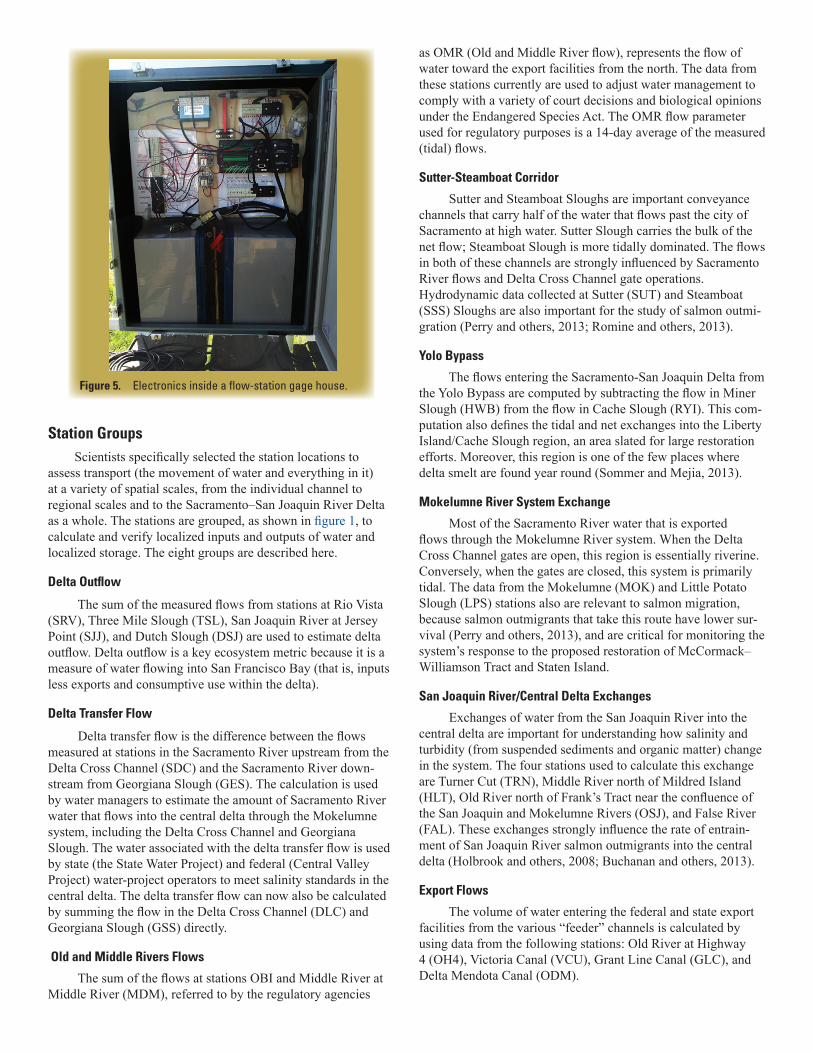
Figure 5. Electronics inside a flow-station gage house.
Station Groups Scientists specifically selected the station locations to
assess transport (the movement of water and everything in it) at a variety of spatial scales, from the individual channel to regional scales and to the Sacramento–San Joaquin River Delta as a whole. The stations are grouped, as shown in figure 1, to calculate and verify localized inputs and outputs of water and localized storage. The eight groups are described here.
Delta Outflow
The sum of the measured flows from stations at Rio Vista (SRV), Three Mile Slough (TSL), San Joaquin River at Jersey Point (SJJ), and Dutch Slough (DSJ) are used to estimate delta outflow. Delta outflow is a key ecosystem metric because it is a measure of water flowing into San Francisco Bay (that is, inputs less exports and consumptive use within the delta).
Delta Transfer Flow
Delta transfer flow is the difference between the flows measured at stations in the Sacramento River upstream from the Delta Cross Channel (SDC) and the Sacramento River down-stream from Georgiana Slough (GES). The calculation is used by water managers to estimate the amount of Sacramento River water that flows into the central delta through the Mokelumne system, including the Delta Cross Channel and Georgiana Slough. The water associated with the delta transfer flow is used by state (the State Water Project) and federal (Central Valley Project) water-project operators to meet salinity standards in the central delta. The delta transfer flow can now also be calculated by summing the flow in the Delta Cross Channel (DLC) and Georgiana Slough (GSS) directly.
Old and Middle Rivers Flows
The sum of the flows at stations OBI and Middle River at Middle River (MDM), referred to by the regulatory agencies

Uses of Network DataData from the network are used by scientists and by
managers of the area who make decisions and plans for the future. The data are also used for calibration and validation of numerical computer models that can estimate water levels, flow speeds and discharges, and even the spatial and temporal evolution of salinity in the delta and San Francisco Bay (Resource Management Associates, 2005; MacWilliams and others, 2008; DSM2 User Group Portal, 2014). Measurements from the network are required input for models of this type.
In addition, the flow-station data, and the USGS California Water Science Center hydrodynamics team, have played an important role in numerous interdisciplinary investigations of subjects such as sediment transport processes, the behavior of the low-salinity zone in the delta, and the outmigration of Chinook salmon and the upmigration of delta smelt. The flow-station network was the foundation for the process-based, large-scale, adaptive-management experiments undertaken by the CALFED Science Program, and in the future, it could support the projects envisioned by the Delta Stewardship Council (the Delta Plan) and the Bay Delta Conservation Plan (BDCP). This network can provide the base-line data to help document the effects of proposed changes in conveyance (for example, the tunnels proposed as part of the Bay Delta Conservation Plan) and of restoration efforts in the future, for which the data collected now document baseline (pre-project) conditions.
Uncertainty about New Facilities and Habitats
Decades of hydrodynamics monitoring, modeling, and special studies indicate that restoration or changes in water conveyance in one area can substantially affect basic hydro-dynamic processes and transport in others. Many changes are proposed for the Sacramento–San Joaquin River Delta to meet the State’s goals of “providing a more reliable water supply for California and protecting, restoring, and enhancing the delta ecosystem” (Delta Stewardship Council, 2013). Documenting how these changes affect flows in the delta is important. The proposed flooding of Sherman Island, for example, could affect hydrodynamics and transport processes, including salinity intru-sion, throughout the delta. Withdrawing water from the system into an isolated water-conveyance facility, such as the currently proposed twin tunnels, would also alter transport throughout the delta. If built, net flows throughout the north and western Sacramento–San Joaquin River Delta would be proportionately reduced by the amount withdrawn into the conveyance facility, increasing the influence of the tides throughout the delta. If the conveyance facility is built, the north-to-south draw of water across the delta that has existed for decades would likely be reduced as a result of compensatory reductions in pumping from the south delta, creating much longer average residence times. Longer residence times are associated with higher rates of algal growth, which could fuel eutrophication in some regions, including increased blooms of nuisance algae, such as Microcystis, which is toxic to humans and other organisms (Lehman and others, 2013). In the coming decades, the flow-station network can provide data that address uncertainty concerning the location of proposed water-conveyance facilities and that, after they are built, document the effects of these new
water-conveyance facilities, management actions, and habitat-restoration efforts.
Climate Change and Endangered Species
The comprehensive coverage of the flow network provides valuable data for developing responses to any new endangered species listings and ecosystem changes, as well as to flooding, droughts, and hydrodynamic changes due to earthquakes, storms, and sea-level rise.
Taking the Network to the Next Level
The dynamic nature of the delta system makes it very difficult to understand the transport and fate of constituents. Indeed, efforts are currently being made to add technology to existing flow stations that can measure and report in real time a broad suite of physical, optical, particle, and water-quality parameters. This multi-analytical approach allows for better integration of information across disciplines and for more powerful diagnostic tools. It allows scientists and water managers to continuously characterize parameters related to nutrient uptake, phytoplankton community structure, and zoo-plankton and fish-foraging efficiency at the same time as more common water-quality information (for example, dissolved oxygen, nutrients, and pH) in the context of the existing flow and turbidity monitoring network. When further coordinated with monitoring of biological organisms, such as fish, birds, and invasive species, these simultaneous data sets can also help scientists gain a better understanding of the influences of flows on the extent of estuarine and riparian habitats and on the distribution of species in the Sacramento–San Joaquin River Delta.
AcknowledgementsThe flow-station network would not have been possible
were it not for the generous support, throughout the years, of a variety of agencies and individuals. Jerry Johns, during his tenure with the State Water Resources Control Board, provided the initial funding for the installation of the acoustic velocity meter (AVM) at Freeport and funded the installation and initial operation of ultrasonic velocity meters (UVMs) at Old and Middle Rivers. Randy Brown, with the California Department of Water Resources (DWR), and Ken Lentz, with the U.S. Bureau of Reclamation (USBR), provided much of the sup-port for the development of acoustic technologies to measure tidal flows in the delta and supported the operation of the flow network. The Interagency Ecological Program (IEP) continues to support the flow-station network substantially, and we thank Ted Sommer, Karen Gehrts, and others for their ongoing sup-port. The conveyance branch at the California Department of Water Resources (DWR) funded the installation, operation, and maintenance of 16 sites in the north and central delta for a period of 5 years under the auspices of the Franks Tract Project until bond funds were cut as a result of the State’s fiscal crisis. The USBR, through Erwin Van Nieuwenhuyse and others, took over support of these stations. Finally, support from the city of Stockton, Sacramento County and the Contra Costa Water District (CCWD) over the years is gratefully acknowledged.

References Cited
Buchanan , R.A., Skalski, J. R., Brandes, P. L., and Fuller, A., 2013, Route use and survival of juvenile Chinook salmon through the San Joaquin River Delta: North American Journal of Fisheries Manage-ment, v. 33, no. 1, p. 216–229, http://dx.doi.org/10.1080/02755947.2012.728178.
Dinehart, R.L., and Burau, J.R., 2005a, Repeated surveys by acous-tic Doppler current profiler for flow and sediment dynamics in a tidal river: Journal of Hydrology, v. 314, p. 1–21, http://dx.doi.org/ 10.1016/j.jhydrol.2005.03.019.
Dinehart, R.L., and Burau, J.R., 2005b, Averaged indicators of second-ary flow in repeated acoustic Doppler current profiler crossing of bends: Water Resources Research, v. 41, p.1–21, W09405, http://dx.doi.org/10.1029/2005WR004050.
Delta Stewardship Council, 2013, The Delta Plan: Ensuring a reliable water supply for California, a healthy Delta ecosystem, and a place of enduring value, http://deltacouncil.ca.gov/delta-plan-0.
DSM2 (Delta Simulation Model – 2, developed by DWR) User Group Portal, 2014; https://dsm2ug.water.ca.gov/library/-/document_library/view/163187.
Holbrook, C.M., Perry, R.W., and Adams, N.S., 2009, Distribution and joint fish-tag survival of juvenile Chinook salmon migrating through the Sacramento-San Joaquin River Delta, California, 2008: U.S. Geological Survey Open-File Report 2009–1204, 30 p., http://pubs.er.usgs.gov/publication/ofr20091204.
Lehman, P.W., Marr, K., Boyer, G. L., and Acuna, S.J., 2013, Long-term trends and causal factors associated with Microcystis abun-dance and toxicity in San Francisco Estuary and implications for climate change impacts: Hydrobiologia, v. 718, p. 141–158, http://dx.doi.org/10.1007/s10750-013-1612-8.
MacWilliams, M.L., Salcedo, F.G., and Gross, E.S., 2008, POD 3-D Particle Tracking Model Study, San Francisco Bay-Delta UnTRIM Model Calibration Report, prepared for the California Department of Water Resources, Sacramento, California, 334 p., http://www.water.ca.gov/iep/docs/pod/UnTRIM_Calibration_Report.pdf.
Perry, R.W., Brandes, P.L., Burau, J.R., Klimley, A.P., MacFarlane, B., Michel, C., and Skalski, J.R., 2013, Sensitivity of survival to migration routes used by juvenile Chinook salmon to negotiate the Sacramento–San Joaquin River Delta: Environmental Biology of Fishes, v. 96, p. 381–392.
Resouces Management Associates (RMA), 2005, Flooded islands pre-feasibility study, RMA delta model calibration: prepared for the California Department of Water Resources, Sacramento, Calif., for submittal to the California Bay-Delta Authority, 158 p., http://baydeltaoffice.water.ca.gov/ndelta/summaryreport/documents/FloodedIslandsRMADeltaModelCalibrationReport.pdf .
Romine, J.G., Perry, R.W., Brewer, S.J., Adams, N.S., Liedtke, T.L., Blake, A. R., and Burau., J.R., 2013, The regional salmon outmi-gration study—survival and migration routing of juvenile Chinook salmon in the Sacramento-San Joaquin River Delta during the winter of 2008–09: U.S. Geological Survey Open-File Report 2013–1142, 36 p., http://pubs.er.usgs.gov/publication/ofr20131142.
Ruhl, C.A., and Simpson, M.R., 2005, Computation of discharge using the index-velocity method in tidally affected areas: U.S. Geological Survey Scientific Investigations Report 2005–5004, 31 p., http://pubs.water.usgs.gov/sir20055004.
Sauer, V.B., and Turnipseed, D.P., 2010, Stage measurement at gaging stations: U.S. Geological Survey Techniques and Methods book 3, chap. A7, 45 p., at http://pubs.usgs.gov/tm/tm3-a7/.
Simpson, M.R., and Oltmann, R.N., 1993, Discharge-measurement system using an acoustic doppler current profiler with applications to large rivers and estuaries: U.S. Geological Survey Water-Supply Paper 2395, 32 p., http://pubs.er.usgs.gov/publication/wsp2395.
Simpson, M.R., and Bland, R., 2000, Methods for accurate estimation of net discharge in a tidal channel: Institute of Electrical and Elec-tronics Engineers Journal of Oceanic Engineering, Special Issue on Current Measurement Technology, v. 25, no. 4, p. 437–445, http://dx.doi.org/10.1109/48.895351.
Simpson, M.R., 2002, Discharge measurements using a broad-band acoustic doppler current profiler: U.S. Geological Survey Open-File Report 2001–1, 4 p., http://pubs.er.usgs.gov/publication/ofr011.
Sommer, T., and Mejia, F., 2013, A place to call home: a synthesis of delta smelt habitat in the upper San Francisco estuary: San Francisco Estuary and Watershed Science, v. 11, no. 2, 25 p., https://escholar-ship.org/uc/item/32c8t244.
Additional Information and Contacts
USGS California Water Science Center6000 J Street, Placer Hall
Sacramento, California 95819-6129http://ca.water.usgs.gov/topic.html?topic=HST
USGS Data Repository
(National Water Information System, NWIS)
http://waterdata.usgs.gov/ca/nwis/
California Data Exchange Center (CDEC)
Delta flow stations
http://www.cdec.water.ca.gov/
Jon Burau, [email protected]
Cathy Ruhl, [email protected]
Paul Work, [email protected]