innovating in cyber security...cyber intelligence threat actor profiling for enhanced security...
TRANSCRIPT

Innovating in Cyber SecurityShared research 2019

Preface
Shared Research Program Cybersecurity - introduction
Physiological measures to optimize performance of security analysts
How Google’s PageRank inspired us to improve collaboration in fraud detection
Quantifying Cybersecurity risks
Advanced Security Architecture - Don’t trust. Verify!
How Biology can help us to protect against cybercriminals: self-healing security
Improving the security assurance of third-party relations
Detecting Lateral Movement with Anomaly-Based Clustering
Contents348
13202837
4551
2 | Innovating in Cyber Security – Shared research 2019

Innovating in Cyber Security – Shared research 2019 | 3
This is the second edition of the magazine produced by the Dutch Cyber Security Shared Research
Program (SRP), a collaboration involving TNO, ING, ABN AMRO, Rabobank, Volksbank and Achmea
and which is financially supported by the Dutch government. This magazine serves two purposes;
• to share our experience that cooperation in a Shared Research Program adds value for every
participant;
• to share some of the results that have been achieved in this Program in the previous two years.
We hope these experiences and results again will offer you some fresh perspectives on cyber security
innovation, which we believe is essential to maintain a robust and safe society.
The projects and the results highlighted in the magazine prove the added value of cooperation, which
is the basis for this Program and is a common theme that returns in the articles in the magazine. As in
the first edition, throughout the magazine, security leaders from each of the partners involved in this
SRP share their views on cooperation within the Program, and on the resultant benefits.
In 2019, the SRP celebrates its five year anniversary. We will continue the cooperation in the coming
years and foster new partnerships.
We trust that the experiences and results presented in this magazine will benefit individual organisations
and trigger them to explore new ways of defending against cyber-attacks, resulting in a safer Dutch
society as a whole.
Enjoy reading the magazine!
Olaf Streutker (ABN AMRO)
Tom Huitema (Achmea)
Ruud Zwan (ING)
Henny van der Pavert (Rabobank)
Mark Buningh (TNO)
Reinder Wolthuis (TNO)
Rob van Os (Volksbank)
Preface

4 | Innovating in Cyber Security – Shared research 2019
The overall umbrella of the articles in this
magazine is the Shared Research Program (SRP)
Cyber Security. The partners in the SRP cooperate
to improve cyber security by means of innovation
in various technologies and processes. The overall
goal is to improve the prevention and detection of
cyber-attacks (and the subsequent recovery) by
developing a range of innovative technologies and
methods. This development work will draw on the
participants’ expertise in the areas of security
technologies and methodologies, data analytics,
incident and crisis management, and behavioural
sciences. The SRP partners benefit by applying
newly developed methodologies and tools that
instantaneously improve their ability to control
cyber security threats. But they also can use the
built-up knowledge and results of proof-of-con-
cepts to make well-informed decisions on
investments and future security strategy.
ABN AMRO, ING, Rabobank and TNO started the
SRP in 2014, so 2019 marks the five-year anni-
versary of this successful cooperation. During
these five years, we were joined by Achmea and
Volksbank, making the current number of
partners six. We are still open for new partners,
including partners from other (non-financial)
sectors, that want to cooperate in cyber security
innovation.
The foundation of the cooperation model lies in
three aspects:
• Shared workload – while the program’s project
teams are primarily made up of TNO staff, these
are complemented with staff members from
each of the participating partners; they actually
participate in and contribute to the projects,
2019 marks the five-year anniversary of successful cooperation in the Shared Research Pro-gram Cyber Security.
Shared Research Program Cyber security - introductionAuthor: Reinder Wolthuis (TNO)

Innovating in Cyber Security – Shared research 2019 | 5
making each project team a valuable combinati-
on of research oriented staff and staff that has a
more practical (operational) perspective. An
interesting effect also is that staff of participa-
ting financial institutions has a chance to meet
in a completely different context, and we have
seen some fruitful follow-up activities outside
the SRP of these meetings.
• Shared data – the participating partners provide
anonymized, real-life data to evaluate innova-
tive security methods, thereby enhancing the
evaluation results and increase the value of
the project output.
• Shared funding – the costs of the SRP are
shared between partners, with contributions of
each individual partner, on top of the in-kind
contributions. The Dutch government also
provides funding.
The SRP aims to conduct ‘applied research’
(see Figure 1). This means that the SRP’s research
activities use scientific knowledge as input, and
deliver knowledge that is ready for product &
service development. In a selection of projects,
the research activities involved are more oriented
towards long-term goals.
The current Roadmap is depicted in Figure 2.
Figure 1: SRP in the wider context of cyber security research
Dutch CyberSecurity assessment
Vendors
Products
& services
Product & service
development
Knowledge
application
Knowledge
development
NowAvailability < 1 year 1-3 years > 3 years
SRPContractresearch
Scientificresearch
Dutch Cyber security research agenda
The SRP team of Volksbank, that joined ithe program
in 2018.

6 | Innovating in Cyber Security – Shared research 2019
We have organized the SRP in four lines of
research:
• Monitoring & Response – the aim is to improve
the monitoring of (and response to) cyber
security incidents, through innovation in
monitoring and response technologies and
processes.
• Controlled Resilience – the aim is to improve
organizations’ cyber resilience, through
innovation in resilience technologies and
processes. Cyber resilience is defined as an
organization’s ability to cope with cyber-attacks
on its infrastructure or electronic services.
• Cyber Intelligence – the aim is to share threat
intelligence more effectively, and to use it for the
early detection and prevention of cyber-attacks.
• Human Factors in cyber security – The aim is to
empower the human element in cyber security.
The human factor includes offenders, victims of
cybercriminals (e.g., banking employees and
customers) and actors that play a role
in tackling cybercrime (e.g., SOC analysts,
software developers).
Results achieved in the SRP Cyber Security are often made public, so the Dutch society can enhance its Cyber Resilience posture.
This last research line was newly introduced in
2018, replacing the research line ‘secure trans-
actions’; this was because of changing (shared)
research interests and priorities.
Where the beginning of the SRP focussed
primarily on producing results, we soon reached a
phase in which the first results became available.
Results were both short term (that were applied
directly by the SRP partners) and long term (which
provided input for strategic decisions). For each
result we select appropriate follow-up in either
publication, applying it in the operational
environment of the partners, commercial exploi-
tation or other. We make results public where
possible, so also society can benefit from these
results and enhance its cyber resilience posture;
one clear example being the magazine that now
is in front of you. But we also have presented at
conferences, produced white papers and we
cooperate with Enisa to publish the CTI capability
framework that was developed in the program.
Another example is the spin-off company from
TNO (Sightlabs) that also has taken over some of
the tooling that was developed in the program; so
the professional support on and further develop-
ment of this tooling, which is used in security
operations by some of the partners, is guaranteed.
Lines of research 2017 2018 2019
Monitoring &Response
Controlled resilience
Detection of targeted attacks 3 Email Ninja
CRIMSON 2Collaborative Monitoring and Detectionusing secure MPC (CRIMSON)
Cyber intelligence
Threat actor profiling forenhanced security operations
Human Factors inCyber security
Secure transactions III Cyber security end-user behaviour
Securityperception
Securetransactions 2.0Datalake security
Solidification CTI framework
Predictive analysis of attacks
Threat landscapingmethodology
Use of monitoring information to quantify risks
Correlates of missed cyber securityincidents in human operators
Self healingsecurity
Security governance of suppliers Sec. governance of suppliers validation
Advanced security architectures Advanced securityarchitectures 2
Figure 2: Current Roadmap of the Shared Research Program Cybersecurity

Innovating in Cyber Security – Shared research 2019 | 7
“ Our society becomes more and more digital and cyber security has become an essential element of our everyday life. At the same time, technology is changing extremely fast and innovations enter the market every day. Information security teams can only keep up with that rate of change and discover how to protect these new technologies against a very volatile threat landscape, when they adopt a learning culture and exploring attitude. The SRP allows CISO’s and researchers to explore the near future by applying many difference scientific domains. This is essential as to be a successful CISO in these times, one has to be a ‘CISO Universalis’.”
Martijn DekkerCISO ABN AMRO

8 | Innovating in Cyber Security – Shared research 2019
Skin conductance and pupil size have the poten-tial to provide continuous information about the mental state of analysts without disrupting him or her from work.
While security monitoring and incident response
operations are increasingly automated, it is not
likely that human analysts will ever fully disappear
from Security Operations Centers (SOCs), fraud
management teams or similar environments. The
automation of relatively straightforward (standar-
dized) work will, however, gravitate analysts’
duties towards the more sophisticated fraud
schemes and cyber-attacks. Since this might
increase the demand on such things as expertise,
focus, creativity and resilience to stress, it is
interesting to consider the mental state of fraud
and security analysts. At what times and under
what circumstances are they stressed or overloa-
ded, when can they focus themselves best? The
SRP program investigated the potential of
physiological measurement to acquire such
insights.
To gain knowledge about the mental state of fraud
and security analysts, they might be questioned
about their experienced stress, mental effort and
focus after finishing work. This approach, howe-
ver, is known to introduce so called “recall biases”.
Questioning analysts while performing their work
(typically about how they feel at that particular
moment), reduces such biases but disrupts the
work flow and puts extra load on the analyst.
Thus, this project explored the extent to which
physiological signals such as skin conductance
and pupil size can aid in monitoring the analysts’
mental state.
From theory…Skin conductance reflects the electric conductivity
of the skin which is affected by activity of the swe-
at glands. Both skin conductance and pupil size
are innervated by the sympathetic nervous system
that is active when the body prepares for action
(“fight or flight”) relative to the parasympathetic
(“rest and digest”) nervous system. Skin conduc-
tance and pupil size have indeed been found to
reliably associate with mental arousal, e.g.
resulting from increased task difficulty or mental
effort, social stress or even tasting a disliked drink.
This indicates that physiological signals are not
very specific and require context information to
be interpreted. Compared to questioning,
however, these physiological measures have the
advantage that they can potentially provide
continuous information about the analyst’s
mental state without disrupting him or her from
the task and without possible biases.
While as mentioned above, relations between
mental state and physiological signals have been
repeatedly demonstrated, such reliable demon-
strations mainly stem from laboratory experi-
ments. In such experiments an effort is made to
induce certain mental states artificially. Factors
that affect physiological signals apart from mental
state, such as body movements and light intensi-
ty, are strictly controlled. In this project we
explored whether skin conductance and pupil size
as recorded in a real cyber security working
environment could provide meaningful informati-
on about the analysts’ mental state.
…to experiment….The project experimented with physiological
measurement techniques in ABN AMRO’s fraud
monitoring center, where around 20 specialists
respond to fraud alerts on a 24*7 basis. The setup
resembles that of a Security Operations Center
Physiological measures to optimize performance of security analystsAnne-Marie Brouwer (TNO), Richard Kerkdijk (TNO), Ron Luttik (ABN AMRO), Wieke Oldenhof (TNO)

Innovating in Cyber Security – Shared research 2019 | 9

10 | Innovating in Cyber Security – Shared research 2019
(SOC), albeit that the fraud team not only handles
on-screen alerts but also engages with victims of
fraud that report (potential) incidents via phone.
While ABN AMRO standardized the general
process of handling fraud cases, the work of its
fraud analysts is typically not prescribed in
detailed playbooks or scripts. Rather, much of the
actual fraud handling relies on the creativity and
analytic skills of analysts on the floor. This
characteristic made the environment particularly
interesting for mental state measurements.
Eleven fraud analysts were recorded during the
experiment, ten of which completed the planned
four hours of physiological monitoring. The
experiment focused on the effect of multi- versus
single tasking. For two hours, each analyst worked
only on dealing with alerts from the on-screen
queue (single tasking), while in the other slot of
two hours this was combined with other tasks
such as answering phone calls (multi-tasking).
Analysts were outfitted with a new type of
wearable skin conductance sensor (EdaMove4),
and an eye tracker (Tobii TX300) was located
underneath one of their monitors. The eye tracker
recorded pupil size as well as eye movements.
In addition to the technical measurements,
analysts were questioned about their experience,
both through an elaborate questionnaire after
recordings had ended and through a pop-up
screen that appeared every 10 minutes. The
analysts were asked to quickly respond to the
pop-up screen and the response time to the
pop-up was registered as well.
…to tangible results!Despite the uncontrolled, real life setting, the
quality of the recorded data was satisfactory and
the recordings did not noticeably impede the
analysists’ work. We did not find differences
between multi-tasking and single-tasking for any
of the measures, except that reported mental
effort was somewhat higher for multi-tasking than
single tasking. However, when the data was
examined from the preferred type of working of
the individual analyst, a consistent pattern
emerged. Four analysts preferred multi-tasking,
four preferred single tasking and two had no
preference. Reported focus tended to be highest
during the preferred type of working, be it single
or multi-tasking. Reported stress and mental effort
were relatively high for multi-tasking compared to
single tasking for analysts who disliked multi-tas-
king. Consistent with this, these analysts showed
a relatively high pupil size and skin conductance
during multi-tasking. Analysts who dislike, and as
evidenced by our results, become relatively
stressed by multi-tasking, responded relatively
quickly to the pop-up. This suggests that mul-
ti-tasking is stressful to them because of their
effort to quickly pick up each sub-task rather than
prioritize.
Perspective and future workThe consistent patterns observed in the experi-
ments reveal that physiology can indeed provide
insight into the mental state of fraud and security
analysts. Here we note that the results obtained in
ABN AMRO’s fraud monitoring facility should be
equally applicable in similar working environ-
ments such as a SOC. Collecting physiological
data in such 24*7 operations centers may be
valuable because analysts themselves might not
always be aware that they are experiencing stress
or concentration relapse (or simply be reluctant to
express this). Physiological signals might prompt
an operations manager to inquire about the
well-being of specific team members and for
instance make adjustments in the duty roster to
avoid overload and errors in the appraisal of fraud
and security alerts.
To further substantiate the project’s findings, it
would be useful to extend the experiment to
other (but similar) operations facilities and record
more cyber security operators or analysts over a
longer period of time. It would also be interesting
to include some alternate physiological characte-
ristics in the measurement scheme (e.g. body
movement and posture which can be measured
through pressure sensors embedded in office
chairs) and to establish a more explicit link
between the measurements, the specific tasks
that an analyst was conducting and the extent to
which these tasks were in fact performed
appropriately.
The results obtained in ABN AMRO’s fraud monitoring facility should be equally appli-cable in similar working environments such as a SOC.

Innovating in Cyber Security – Shared research 2019 | 11
BibliographyBrouwer, A.-M., Hogervorst, M. A., Oudejans, B.,
Ries, A. J. and Touryan, J. (2017). EEG and Eye
Tracking Signatures of Target Encoding during
Structured Visual Search. Frontiers in Human
Neuroscience 11:264.
Brouwer, A.-M., Zander, T. O., van Erp, J. B. F.,
Korteling, J. E. and Bronkhorst, A. W. (2015). Using
neurophysiological signals that reflect cognitive or
affective state: six recommendations to avoid
common pitfalls. Frontiers in Neuroscience 9:136.
Dawson, M.E., Schell, A.M., Filion, D.L. (2007). The
electrodermal system. In: Cacioppo, J.T., Tassinary,
L.G., Berntson, G.G. (eds.) Handbook of Psychop-
hysiology. Cambridge University Press, Cambridge
Hogervorst, M. A., Brouwer, A.-M., & van Erp, J.B.F.
(2014). Combining and comparing EEG, peripheral
physiology and eye-related measures for the
assessment of mental workload. Frontiers in
Neuroscience 8:322.
Kapoor, A., & Picard, R. W. (2005). Multimodal
affect recognition in learning environments. In
Proceedings of the 13th annual acm international
conference on multimedia.
Moskowitz, D.S., Young, S.N. (2006). Ecological
momentary assessment: what it is and why it is a
method of the future in clinical psychopharmaco-
logy. J. Psychiatry Neurosci. 31(1), 13–20
Vanhala, T., Surakka, V., Anttonen, J. (2008).
Measuring bodily responses to virtual faces with a
pressure sensitive chair. ACM International
Conference Proceeding Series, 358: 555-558
NordiCHI 2008: Building Bridges - 5th Nordic
Conference on Human-Computer Interaction.
Widmann, A., Schröger, E., Wetzel, N. (2018).
Emotion lies in the eye of the listener: Emotional
arousal to novel sounds is reflected in the
sympathetic contribution to the pupil dilation
response and the P3. Biological Psychology, 133,
10-17
12 | Innovating in Cyber Security – Shared research 2019
“ With the banking sector moving into the digital era rapidly, customer needs are more and more innovatively addressed via multi- channel offerings. Put together with the open banking regulations, this puts a challenge on the cyber security organisations within the financial industry.
Banking is all about trust, so we continuously need to invest in our defence structure. Besides the technologic developments, this means also developing our human firewall. Because it is crucial to combine both in preventing data breaches. I strongly support the SRP initiative were the banks join forces to tackle the challenges put upon us.”
Mimoent HaddoutiGlobal Head First Line Risk & Security Rabobank

Innovating in Cyber Security – Shared research 2019 | 13
IntroductionCyber security, anti-fraud and other anti-crime
activities highly benefit from collaboration
between involved parties like financial instituti-
ons, governments and law enforcement agencies.
Public and private sectors are stimulated by
regulators to perform joint activities and share
data, e.g. threat intelligence, as there is a common
goal to combat this type of crime. Relevant data
to share includes lists of known criminals,
confirmed money mules and known malicious IP
addresses. Sharing operational data on customers,
transactions and events between different
The risks of sharing data for companiesas well as public services are loss of trust in services, integrity, financi-al losses, societal damage, and damaged reputation.
organizations would be advantageous as well,
but this has always been strictly restricted due to
competition and privacy regulations, especially if
it concerns personal data of customers and
employees. The risks of sharing data for compa-
nies as well as public services are loss of trust
in services, integrity, financial losses, societal
damage, and damaged reputation.
The financial sector is continuously fighting the
misuse of the financial infrastructure for criminal
activities like fraud and money laundering.
Financial crime detection is a typical example of a
How Google’s PageRank inspired us to improve collab-oration in fraud detection.1
Collaborative fraud detection using secure multiparty computation
Alex Sangers (TNO), Mark Wiggerman (ABN AMRO), Daniël Worm (TNO)
1 This article is partly based on the more detailed scientific paper [2].
14 | Innovating in Cyber Security – Shared research 2019
Financial institu-tions do not need the data itself but only the result of the analytics performed on that data.
setting where multiple parties share a common
interest, but confidentiality and privacy regulati-
ons prevent collaboration [1]. In a payment
transaction a financial institution typically only
knows details if it was involved in the payment.
Financial institutions could be much more
effective at combatting financial crime if they
would be able to access results from analytics
based on each other’s data, as well as data from
other related organizations. However, since such
data is often too sensitive to share, there is no
straightforward way of accomplishing this.
A possible solution would be to have a single
trusted third party that all financial parties are
willing to confide their financial secrets to.
However, it may be difficult or impossible to find
such a party. In addition, it may be very expensi-
ve. An important observation is that financial
institutions do not need the data itself but only
the result of the analytics performed on that data.
Therefore we developed an alternative solution,
without needing a trusted third party, but still
achieving the same security goals. The crypto-
graphic technology that overcomes the described
dilemma is Secure Multi-Party Computation
(MPC).
Secure Multi-Party Computation (MPC)MPC protocols are cryptographic techniques
that allow multiple parties to collaboratively
evaluate a function on private input data in
such a way that only the output of the
function is revealed, i.e. private input remains
private. MPC could be explained as the
implementation of a trusted third party that
collects all relevant input data, evaluates the
desired function and only reveals its output.
Already in the 1980s it was shown that any
computable function can be evaluated
securely, i.e. in an MPC fashion. However,
early MPC protocols came at a cost as they
introduced significant computation and/or
communication overhead, deeming this
protocols impractical in many situations.
Over the years progress has been made
and research interests have shifted towards
practical applicability making MPC ready for
deployment.
PageRank for fraud detectionIn the SRP, we selected a use case in the
area of fraud detection in order to evaluate the
possible application of an MPC approach. We
focused on financial transaction networks. In
mathematical terms a network is called a graph.
A financial transaction consists of a source bank
account, a destination bank account, an amount
and a timestamp. A set of transactions can be
modelled as a graph where nodes (circles)
represent bank accounts and links (arrows)
represent the transactions between accounts.
It was shown that graph-based features can be
used to reduce the false-positives of existing
fraud detection techniques [3]. One of these
graph-based features is PageRank, originally deve-
loped by Google to rank websites in their search
engine results. PageRank estimates the popularity
of a website, by considering how central a website
is in the graph of all websites: the more central,
the higher the PageRank value. PageRank can also
be computed for transaction networks: For every
account number (node) in the network (graph)
one can calculate a value which is the PageRank
of that account number. Although it is no silver
bullet, it has been shown that transactions to
accounts with high PageRank are less likely to
receive fraudulent transactions. Because of this
property, we have chosen to develop an MPC
solution for PageRank.
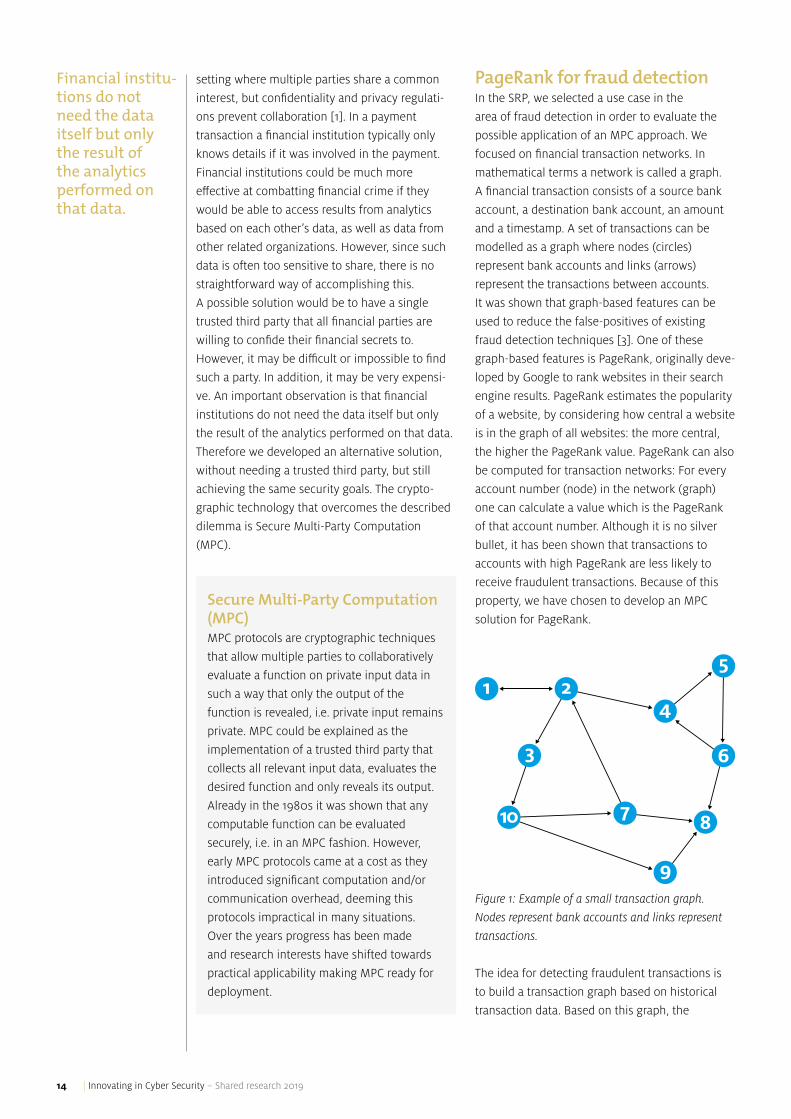
Figure 1: Example of a small transaction graph.
Nodes represent bank accounts and links represent
transactions.
The idea for detecting fraudulent transactions is
to build a transaction graph based on historical
transaction data. Based on this graph, the
25
4
6
87
9
10
3
1

Innovating in Cyber Security – Shared research 2019 | 15
The idea for detecting fraudulent transactions is to build a trans-action graph based on historical trans-action data.
PageRank value for each bank account is compu-
ted. As soon as a new transaction request comes
in, this transaction request has to be assessed
within milliseconds on whether it is fraudulent.
This assessment can be based on various existing
detectors, for example using geolocation.
The graph-based features such as PageRank
from the historical transaction graph can be used
to improve this assessment. If the transaction
request is assessed to be (likely) fraudulent, it can
be declined or delayed for further investigation.
PageRank computation Inspired by the original idea of Google, the
PageRank model for transactions can be seen as
money following transactions with some probabi-
lity p, and jumping randomly to any bank account
with probability 1-p. Each time the money ends up
in a dead-end bank account, it will randomly jump
to any bank account. If the money follows this
behaviour infinitely long, then the PageRank value
of the bank accounts is the proportion of time
spent by the money in the bank accounts. The
lower the PageRank value of a bank account, the
more likely that such a bank account is fraudulent
if it receives large sums of money.
PageRank Mathematically, the PageRank is the stationary
distribution of a Markov chain. An efficient
algorithm to compute the PageRank is given
by the power method. The PageRank value of
node j at the kth iteration of the power method is
denoted as xkj and the power method is given
by the following iterative scheme.
where p is a fixed probability, n the total
number of nodes, ci the outdegree (number
of outgoing links) of node i, and S(j) is the set
of nodes linking to j. This formula is linear
and consists mostly of additions, which is a
nice property for some MPC solutions. Under
mild conditions, it can be shown that the
power method has a convergence rate of p.
For p=0.85 the power method converges
within 50 till 100 iterations independent of
the graph size.
Cooperation is required to analyse the combined transaction graphThe PageRank algorithm can be deployed at each
individual financial institution to detect fraudulent
transactions. However, each financial institution
oversees only a part of the global transaction
graph. To be precise, a bank only sees the
transactions if the source and/or destination bank
account is managed by that bank. Figure 2 shows
an example of how the transaction graph consists
of parts that are visible to each financial instituti-
on. The transaction graph can be constructed by
combining the transaction data that is available to
each individual financial institution.
24
7
9
10
3
1
25
4
6
87
9
10
3
1
Figure 3: The part of the transaction graph that is
visible to the blue financial institution.
Figure 2: Small example of how three subgraphs
(indicated by three colors) can be coupled to the
combined transaction graph.
16 | Innovating in Cyber Security – Shared research 2019
During the project we have shown that the
PageRank values more accurately represent the
true PageRank values (of the whole financial
transaction network) if financial institutions would
collaboratively compute the PageRank values
compared to them doing this separately. This
effect is even stronger for financial institutions
with a relative small number of bank accounts.
Furthermore, the PageRank values of bank
accounts with many interbank transactions are
significantly more accurate if the PageRank is
computed collaboratively.
However, the transaction data is sensitive data
and cannot be shared between financial instituti-
ons for this purpose. Given Figure 3, assume that
the blue bank wants to compute the PageRank
values of its nodes. In order to compute the
PageRank values of the blue nodes, the blue bank
requires information of the nodes that have a link
directed to the blue nodes. For example, node 7
We designed a secure PageRank solution that is able to collabo-ratively compute PageRank of coupled trans-action graphs without leaking information about individual transactions.
contributes to the PageRank of node 2, so the
blue party should know the number of outgoing
links of node 7 and the intermediate PageRank
value of node 7. However, these values are known
by the yellow bank but it is a secret to the blue
bank. Additionally, the intermediate PageRank
values also leak information about transactions.
We designed a secure PageRank solution that is
able to collaboratively compute PageRank of
coupled transaction graphs without leaking
information about individual transactions.
Secure PageRank algorithmDeveloping an MPC solution for PageRank is
non-trivial for several reasons. MPC may introduce
a significant overhead. Furthermore, most
cryptographic protocols work over finite groups3,
rings or fields and not over real numbers. These
challenges can be tackled by developing a specific
and efficient MPC protocol. We developed an MPC
protocol using additive homomorphic encryption.
3 Groups, rings and fields are mathematical objects often used in cryptography.
In depth: the secure PageRank solutionSome encryption schemes have the property that computations can be performed with ciphertexts.
Such schemes can form important building blocks for MPC solutions. This property is called fully
homomorphic encryption (HE) if both additions and multiplications can be performed with cipher-
texts. However, fully HE performs poorly in practical applications as a general solution. Additively
HE is much faster but only allows for additions in the encrypted domain. Additively HE has the
following properties:
• Two ciphertexts can be multiplied, with the same result as if adding the decrypted ciphertexts;
• A ciphertext can be exponentiated with a known/plaintext integer, with same result as if multi-
plying the decrypted ciphertext with the known integer.
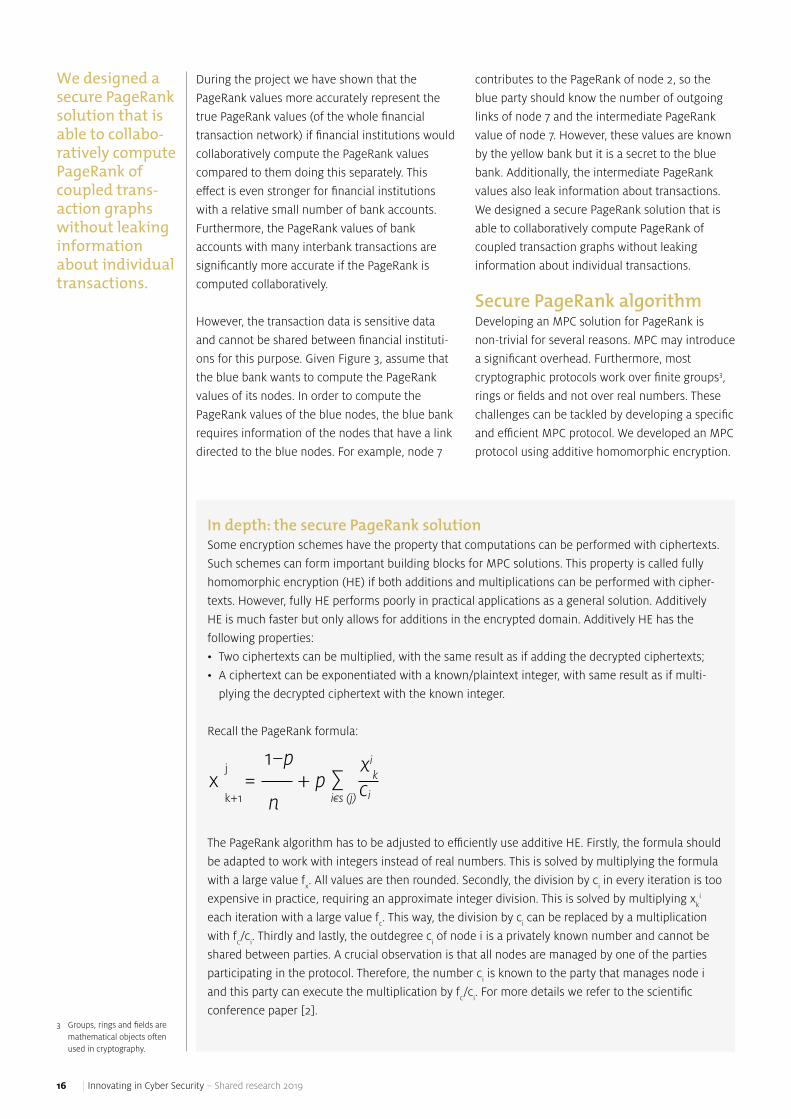
Recall the PageRank formula:
The PageRank algorithm has to be adjusted to efficiently use additive HE. Firstly, the formula should
be adapted to work with integers instead of real numbers. This is solved by multiplying the formula
with a large value fx. All values are then rounded. Secondly, the division by c
i in every iteration is too
expensive in practice, requiring an approximate integer division. This is solved by multiplying xki
each iteration with a large value fc. This way, the division by c
i can be replaced by a multiplication
with fc/c
i. Thirdly and lastly, the outdegree c
i of node i is a privately known number and cannot be
shared between parties. A crucial observation is that all nodes are managed by one of the parties
participating in the protocol. Therefore, the number ci is known to the party that manages node i
and this party can execute the multiplication by fc/c
i. For more details we refer to the scientific
conference paper [2].

Innovating in Cyber Security – Shared research 2019 | 17
The application of the MPC solution is not limitedto fraud detec-tion but can e.g. also be applied in Security moni-toring & detecti-on.
Our developed solution achieves computational
security in the semi-honest model, i.e. under the
assumption that all parties follow the prescribed
protocol no party will be able to learn any more
information other than the output of the algo-
rithm and any information that follows from
that. In our setting, each party will learn the
final PageRank values of its own nodes (bank
accounts). The solution is implemented using the
Paillier Homomorphic Encryption library in Python
[4]. The key generation involves a public key, and
a partial private key for each party. The private
keys ensure that ciphertexts can only be decryp-
ted collaboratively. Generating the keys is a
onetime effort and is implemented using a trusted
third party. Currently, a distributed key generation
algorithm is in development in the Shared
Research Program, removing the need for a
trusted third party all-together. The number of
communication rounds, excluding the key
generation, equals the number of PageRank
iterations plus 1.
ResultsFor practical application, it is important to
show the accuracy and scalability of the secure
PageRank algorithm. The results are based on
sampled, anonymized transaction data. Bank
accounts, amounts and times are hashed or
randomized but in such a way that bank accounts
can be coupled in different transactions. Four
different datasets are sampled from the transacti-
on data with 100, 1.000, 10.000 and 100.000
bank accounts and the transactions between
themselves. The sampled transaction data is
divided among three artificial parties, each of
whom only see a transaction if the source and/or
destination bank account is managed by that
artificial party.
Firstly, the accuracy of the secure PageRank
algorithm is measured by comparing the results
to the outcome of normal PageRank. A maximum
relative error below 0.05 is acceptable. As can be
seen in Figure 4, the effect of rounding errors in
the secure PageRank algorithm is small. Secondly,
the computation time increases linearly with the
number of nodes in the transaction graph, as
shown in Figure 5. This is consistent with the
theoretical scalability.
Figure 4: The maximum relative error for increasing
sample size of the transaction graph.
Figure 5: The computation time for increasing
sample size of the transaction graph.
The secure PageRank algorithm is also highly
parallellizable (for each party). Extrapolation of
these results indicate that, for a secure 3-party
PageRank computation with 30 million nodes and
average outdegree of 80, the current Python
implementation would require less than 11 days to
compute the PageRank values. When implemen-
ted in C++, this can be further improved to within
1 day.
ConclusionFinancial institutions can highly benefit from
collaborative fraud detection. Relevant data
exchange, however, is limited due to privacy
and legal restrictions. Collaborating organizations
actually do not need the data itself, only the
result of the analysis, the computation. Some
techniques such as PageRank detect fraudulent
transactions using historical transaction data in
order to find anomalous patterns that deviate
0 5k 10k 15k 20k 25k 30k 35k
0
1000
2000
3000
4000
Number of nodes for each party
Com
puta
tion
tim
e (s
econ
ds)
0 5k 10k 15k 20k 25k 30k 35k
0.0052
0.0054
0.0056
0.0058
0.006
0.0062
Number of nodes for each party
Max
imum
rel
ativ
e er
ror

18 | Innovating in Cyber Security – Shared research 2019
from normal transaction patterns. Individually,
financial institutions only see a part of the global
transactions and would benefit from a more
complete view on all the transactions. In the
Shared Research Program a secure PageRank
algorithm has been developed to compute the
PageRank of the combined transaction graph of
collaborating financial institutions, without
sharing any data on transactions. Each financial
institute learns the PageRank values of its own
bank accounts using a collaborative decryption
scheme. The algorithm has been implemented
in Python and experiments show that securely
analyzing features of a large-scale network that
is distributed over multiple parties is feasible.
The application of the MPC solution is not limited
to fraud detection. Current research focuses on
generalizing and extending the solution for secure
collaborative money laundering detection. And on
how to enable secure following of cash flows and
propagate risk metrics across transaction net-
works. The possibilities with MPC are countless.
Think of opportunities such as securely sharing
Indicators of Compromise between organizations
or collaboratively detecting botnets. Do you have
a suggestion on a possible MPC application? We
are always interested in exploring new ideas!
Bibliography[1] Poortwachter bank ziet veel, maar mag weinig
– Financieel Dagblad 27 november 2018
[2] Sangers, A., Heesch, M. van, Attema, T.,
Veugen, T., Worm D., Wiggerman M., Veldsink
J., Bloemen O.: Secure multiparty PageRank
algorithm for collaborative fraud detection. In:
Financial Cryptography and Data Security,
February 2019. See https://fc19.ifca.ai/
preproceedings/61-preproceedings.pdf
[3] Molloy, I., Chari, S., Finkler, U., Wiggerman, M.,
Jonker, C., Habeck, T., Park, Y., Jordens, F., van
Schaik, R.: Graph analytics for real-time
scoring of cross-channel transactional fraud.
In: Financial Cryptography and Data Security,
February 2016.
[4] A Python 3 library for Partially Homomorphic
Encryption using the Paillier crypto system,
https://python-paillier.readthedocs.io/en/deve-
lop/ - 2 June 2016.
Each financial institute learns the PageRank values of its own bank accounts using a collabo-rative decryption scheme.

Innovating in Cyber Security – Shared research 2019 | 19
“ Everyone has a plan until they get punched in the mouth (Mike Tyson). This is true for both life and for cybersecurity. We need to be better prepared for the unexpected. Not only on paper by writing procedures, policies and cool reports. But by doing, exercising, researching, discussing & sharing experiences with our sparring partners. The Shared Research Program gives us exactly that opportunity. To get in the ring and start researching & learning, together with creative and talented people from other companies & sectors. I am convinced that we all benefit from this coope-rative approach. Expect to get hit. Enjoy it. And improve.”Leon KersCISO Volksbank

20 | Innovating in Cyber Security – Shared research 2019
For financial service providers (but also for
companies in many other sectors), it is important
to understand their risks. Many business decisions
are based on estimations of risk and in the
financial sector, risk management is one of the
key processes in the day-to-day business. Until
recently this risk management was mainly focused
on financial risks. But currently, financial services
rely heavily on electronic channels and complex
IT infrastructures, which introduces the risk on
cyber-attacks. These attacks might lead to
considerable impact on reputation, loss of
confidential information or loss of money.
This triggered the need for more attention for
(cyber) security risk management, a process that
is now implemented at all financial providers.
Traditionally, security risk management is a
qualitative process based on expert opinion
and information at hand; periodically a group of
experts gathers, reviews whether the existing risks
are still applicable, verifies whether existing risks
have correct risk levels, and whether new risks
should be added to the list. This usually results in
a rather good insight in risks, although not very
timely (depending on the periodicity of the
meetings), usually formulated qualitatively (e.g. in
terms of low, medium, high), depending heavily
on expertise of staff that is present during the risk
assessment sessions and without a traceable
reasoning process. Also, current cyber security
risk management approaches usually have an
‘asset based’ approach, meaning that the risks
are established for an asset, such as a process,
Quantifying Cyber security RisksReinder Wolthuis (TNO), Frank Phillipson (TNO), Peter Rochat (Volksbank), Bert van Ingen (Rabobank), Sander Zeijlemaker (ING), Daniël Gorter (Achmea)
In the financial sector, risk management is one of thekey processes in the day-to-day business.

Innovating in Cyber Security – Shared research 2019 | 21
a server or a website. As a result, risks cannot be
sufficiently related to impact on business proces-
ses. These characteristics of cyber security risk
management hinder the effective use of cyber
security risks in decision making processes.
In the Shared Research Program (SRP) Cyber
Security we have developed a quantitative and
actual risk assessment methodology, that uses
available actual information to quantify risks. The
methodology focusses on potential cyber-attacks
and their resulting business impact. This leads to
a near real-time traceable quantitative risk
process, because available information is proces-
sed and the risks are automatically updated. The
methodology was evaluated against some real-life
use cases and in the risk departments of banks. In
this article we share these experiences.
Risk assessmentRisk is a metric to estimate the impact of a threat
and the likelihood that a threat really leads to this
impact. Risk can in its most simple form be
expressed as the product of two parameters:
• The likelihood that a threat materializes;
• The impact of a threat when it materializes.
Risk = Likelihood (threat) * Impact (threat)
An example of a threat is a Distributed Denial
of Service (DDoS) attack. During a DDoS
attack, many computers are used to send
large amounts of Internet traffic to one
specific target website, with the aim to
disturb the accessibility of the website or to
even bring it down completely. The potential
impact would be that the website owner
cannot deliver its services any more through
the website and suffers reputational damage
and/or financial loss. The likelihood that the
threat actually occurs depends on many
things, such as the attractiveness of the
organization for attackers, the means that an
attacker has to generate such an attack, the
potential gain that an attacker can make (e.g.
by extortion) and the measures that the
organization under attack has implemented
to mitigate DDoS attacks.
Risk QuantificationRisks can be expressed in qualitative values or
quantitative values. Qualitative risk assessments
usually define risks in scales that are expressed in
discrete levels such as Low, Medium, High or 1
to 5. Each level in such a scale needs to have a
definition that suits the context of the risk
assessment, to be able to qualify a risk. This is
done both for the impact and for the likelihood of
the risk and combined this leads to the actual risk
level.
The results of qualitative risk assessments provide
a good insight in risks, but there are some
drawbacks:
• They depend heavily on the definition of the
discrete levels and to really understand risk
levels, this definition should also be provided;
• There usually is little distinctive power; i.e. on a
scale of ‘low, medium, high’, most risks will
score ‘medium’, which is not a good base to
decide which risks need to be mitigated.
Quantitative risks do not have these disadvanta-
ges; they do not need definition tables and usually
have more distinctive power because of the
theoretically endless number of values it can
have.
Estimations for the impact of cyber-attacks (e.g.
“how much financial loss is caused by a DDOS
attack”) can be expected to be more-or-less time
invariant, provided the IT infrastructure and the
various business processes remain the same.
However, some impact aspects could very well
change over time (such as reputation loss or
fines). Usually the impact is quantified by making
it financial taking into account costs for response
& repair, costs of loss of production time, costs of
repairing reputational damage, costs of injuries,
cost of fines etcetera.
The likelihood of a risk is usually quantified with
support of model-based approaches such as
Fault/Event Tree Analysis, Attack Graphs/Trees,
(Monte Carlo) simulation, Markov Models or Baye-
sian (Belief) Networks. These models are used to
derive the likelihood of a threat, given valid data.
Where data is not available, eliciting expert
opinion methods can be used. Most methods help
to reason in cases of uncertainty and interdepen-
dencies (correlated events), which are both hard
to perform by humans.
Risk is a metric to estimate the impact of a threatand the likeli-hood that a threat really leads to thisimpact.

22 | Innovating in Cyber Security – Shared research 2019
Next to these model-based approaches, current
developments in AI, such as Deep Learning, also
offer possibilities in threat identification and risk
quantification. Here, data is analyzed and models
are trained to recognize anomalies in static and
dynamic situations. However, here the explainabi-
lity or traceability lacks.
Building a usable quantified Risk Assessment methodologyThe methodology that we have developed is
based on the following design parameters and
design decisions.
1. We have chosen to develop a methodology
that quantifies the likelihood part of a risk.
The likelihood part is usually not time-invariant,
it could change fast and frequent and we expect
that we can use available information to track
this change in an automated way;
2. We have chosen to take a threat based
approach (contrary to e.g. an asset based
approach). This means that we build the model
based on a threat that could lead to a certain
(defined) business impact (e.g. DDoS attack,
identity theft);
3. We have chosen to take a model based ap-
proach. We model the processes, infrastructure,
the attacker and other assets that are related to
the threat. We also include the mitigating
measures in the model, that will influence the
likelihood of the threat actually leading to
business impact;
4. We have chosen for a model that is able to
structurally capture and record expert opinion
in a transparent way. In this way, we can always
trace back why the model was built in a certain
way and revise the model when changes
(internally or externally) occur.
Based on the points above, we have decided to
use a Bayesian Belief Network (BBN), which
enables reasoning with uncertainty. It translates
uncertainties in threats, effectiveness and
availability of protective measures into probability
that a certain target is affected.
The developed methodology uses a model and threat based approach and quantifies the likelihood part of risk.
Bayesian Belief NetworksA Bayesian Belief Network (BBN) is a
probabilistic graphical model that represents
a set of random variables and their conditio-
nal dependencies. In the context of the risk
methodology, for example, the random
variables of interest will be: threats, measu-
res, impact, etc. One of the advantages of a
Bayesian network is that these relations do
not have to be deterministic. The uncertainty
in different threats and in the effect of
measures can be modelled. The sensitivity of
critical decisions can be evaluated and
different scenarios can be analyzed.
In a BBN several types of nodes can be distinguis-
hed (see Figure 1). Each node may have multiple
states.
• Input (or: Root): nodes with only outgoing
arrows. An input node needs as input a
definition of states it can be in and the probabi-
lity of occurrence of each of these states. An
input node can be fed by an automated or a
manual stream of information that influences
its state and by that, through the Intermediate
nodes it is connected, influencing the state of
Result nodes;
• Intermediate: nodes that are located on the
inside of the network and that have one or
more incoming arrows from ‘parent’ nodes and
one or more outgoing arrows to other Interme-
diate nodes or to End nodes; These nodes need
as input a definition of states it can be in and
the probability that it will be in each of the
states, given the state of the parents, in the
form of a probability table.
• Result: nodes with only incoming arrows, which
represent the final result. These nodes need as
input a definition of states it can be in and the
probability that it will be in each of the states,
given the state of the parents.
The way that information or incoming arrows
influences the states of a node needs to be
defined in the probability tables. Elicitation of the
probability tables can be done by using evidence
or expert opinion, who has to quantify its belief.
A method for this can be found in [Cooke] and
[Wisse].

Innovating in Cyber Security – Shared research 2019 | 23
Figure 1: Types of nodes in a Bayesian Belief
Network.
The Quantified Risk MethodologyBelow the methodology for Quantified Risk
management is described, inspired by the
‘Business continuity response-recovery chain’ in
[Phillipson] and the threat and model based
approach of [Phillipson2]. In each step, we apply
the methodology on a threat example, in this case
a DDoS attack (as was done in the Proof of
Concept).
Step 1. Identify the threat and the business
impact to be modelled
In this step, the threat needs to be described as
detailed as possible. Also the business impact
needs to be defined: what does it encompass
(regulatory fines, service disruption, etc.) and
which levels can be distinguished (business
impact still is defined as qualitative discrete
levels).
The example is built around a DDoS threat. There
are many types of DDoS threats (network level,
application level, flooding etc.). We have narrowed
the example down to a ‘Network level DDoS
attack’. Please note that we need to build a model
for each type of DDoS attack that is applicable in
this context. In this case, the business impact is
on consumer bank transfers (retail banking) and
we have defined three levels of business impact:
• No impact – non-measurable impact;
• Medior impact – 50-100K euro costs, disruption
1-4 hours, medium reputation damage;
• Major impact – over 100K euro costs, disruption
> 4 hours, major reputation damage.
The foundation of the methodo-logy is a Bayesian Belief Network (BBN), which translatesuncertainties in threats, effec-tiveness andavailability of protective measures into probability that a certain target is affected.
Step 2. Identify the business processes and
assets that are involved in the attack.
In this step, all the business processes that will be
impacted by the defined threat need to be listed,
including the major assets. We need to go into a
certain detail, but not too much detail, because
then the model will become too complex.
In the example of a ‘Network level DDoS attack’
we have identified the following business
processes and assets: Payment service, SEPA
transaction service, Other necessary services
(needed for the payment process to function),
Operating system, Application, Network.
Step3. Identify the mitigating security measu-
res that are in place
In this step, all security measures that are in place
that can reduce the probability that the threat
leads to impact need to be listed. Also here, it is
necessary to go into a certain level of detail, but
not too much detail.
In the example of a ‘Network level DDoS attack’,
some examples of potential mitigating measures
are: Mitigating business measures, Incident
response (on three levels), Testing and training (of
incident response teams and processes), External
DDoS mitigation (by an external service provider),
Attack traceback (the ability to gather information
on the source of attack etc.) and Forensics and
prosecution. For the full set, see the model in the
picture of the model (Figure 2).
Step 4. Identify the actor, its motivation and
the means that are available
In this step, the threat actor is defined in a BBN
node. It can also be useful to define the actor
motivation, the means that an actor has available
to launch the attack and the country of origin of
the actor.
In the example of a ‘Network level DDoS attack’
we have identified the following nodes:
• Actor (script kiddy, activist, state sponsored
and criminal);
• Actor motivation (extortion, competitor,
environmental and/or reputational, thrill seeker,
national conflict);
• Country of origin of the actor/attacker (EU,
Eastern Europe, Middle East, USA, other);
• Available botnet capacity (the DDoS capacity
through botnets available for the actor).
Root/input Intermediate Result

24 | Innovating in Cyber Security – Shared research 2019
Experts and information are neededto define the dependencies between threats andmitigating measures.
Step 5. Build the model in a BBN
In this step, the nodes are modelled in the BBN,
and their interrelationships are determined (by
means of connecting arrows).
Step 6. Define the probability tables with
relevant experts
In this step, the probability tables are defined.
To do this, experts and information are needed
to define the dependencies between threats and
mitigating measures. Also experts and informati-
on are needed to understand the actors and their
motivation. It is crucial, for traceability, to record
the motivation for the values in the decision table.
This can be done in a ‘decision table document’.
In the example of a ‘Network level DDoS attack’
we have made a decision table for the node
‘DDoS duration’ (see Table 1, that shows part of a
decision table), with incoming nodes ‘available
botnet capacity’ and ‘actor’:
The motivation for this table is that the probability
that a long during attack occurs will increase with
increasing botnet capacity and with increasing
experience of the actor. We define a probability of
0% that there will be a duration of more than 4
hours (H4_PLUS) if the botnet capacity is low.
We now have established the following model of a
‘Network level DDoS attack’ (see Figure 2)
Actor Script kiddy Activist State sponsored
Available bot- net capacity Hi Av Lo None Hi Av Lo None Hi Av Lo None
H4_plus 0 0 0 0 0 0 0 0 0,3 0,2 0 0
H4 0,3 0,2 0,1 0 0,3 0,2 0,1 0 0,3 0,2 0,2 0
H1 0,7 0,8 0,9 1 0,7 0,8 0,9 1 0,4 0,6 0,8 1
Table 1 – Partial decision table for the node DDoS duration in the model for network level DDoS attack
Figure 2: Model of a Network level DDoS attack.
AVAILABLE 86%UNAVAILABLE14%
SEPA TRANSACTION AVAILABILITY
AVAILABLE 93%UNAVAILABLE 7%
OS
AVAILABLE 86%UNAVAILABLE14%
NETWORK
AVAILABLE 100%UNAVAILABLE 0%
APPLICATION
Gbps50 3%Gbps10 9%Gbps5 13%Gbps1 59%Gbps0 16%
UDP FLOODING DDOS SIZE
SCRIPTKIDDY 53%ACTIVIST 12%STATESPONSORED 5%CRIMINAL 9%TERRORIST 5%NONE 16%
ACTORUNHAPPY_CLIENTS 20%EXTORTION 11%BAD_ESG_NEWS 16%ANTICOMPETITIVE 1%NATIONAL_CONFLICT 5%THRILL_SEEKERS 42%TERRORISTIC 5%
ACTOR MOTIVATION
HIGH 25%AVERAGE34%LOW 25%NONE 16%
AVAILABLE BOTNET CAPACITY
HIGH 1%MEDIUM14%LOW 70%NONE 16%
RESULTING UDP FLOODING DDOSTHREAT
AVAILABLE 84%PARTLY_UNAVAILABLE13%MAJOR_UNAVAILABLE 2%
PAYMENT SERVICE AVAILABILITY
AVAILABLE 99%UNAVAILABLE 1%
OTHER NECESSARY SERVICE AVAILABILITY
Network level DDoS attack -impacting consumer bank transfers
EFFECTIVE 70%INEFFECTIVE30%
OVERPROVISIONING
EFFECTIVE 83%INEFFECTIVE17%
INCIDENT RESPONSE LEVEL 1
EFFECTIVE 37%INEFFECTIVE63%
FORENSICS AND PROSECUTION
EFFECTIVE 70%INEFFECTIVE30%
TESTING AND TRAININGEFFECTIVE 50%INEFFECTIVE50%
INTERNAL FILTERING
EFFECTIVE 50%INEFFECTIVE50%
INTERNAL DDOS MITIGATION
EFFECTIVE 95%INEFFECTIVE 5%
EXTERNAL DETECTION & DDOSMITIGATION SERVICE
NO_IMPACT 85%MEDIOR_IMPACT11%MAJOR_IMPACT 4%
BUSINESS IMPACT
EFFECTIVE 85%INEFFECTIVE15%
INTERNAL_INCIDENTDETECTION
EFFECTIVE 70%INEFFECTIVE30%
ATTACK TRACEBACK
EFFECTIVE 80%INEFFECTIVE20%
NETWORK ROBUSTNESS
EFFECTIVE 90%INEFFECTIVE10%
EXTERNAL FILTERING
VULNERABLE 20%NOT_VULNERABLE80%
PLATFORM VULNERABILITY
EFFECTIVE 80%INEFFECTIVE20%
MITIGATING_BUSINESS MEASURES
EFFECTIVE 82%INEFFECTIVE18%
PREVENTIVEFILTERING
EFFECTIVE 76%INEFFECTIVE24%
INCIDENT RESPONSE LEVEL 2
EFFECTIVE 77%INEFFECTIVE23%
INCIDENT RESPONSE LEVEL 3
THREAT ANALYSIS
ORIGINAL THREAT
RESULTING THREAT/ THREAT INSIDE
DAMAGE
CLIENT IMPACT
HIGH 12%AVERAGE14%LOW 74%
UPD FLOODING DDOS COMPLEXITY
H4_PLUS 2%H4 19%H1 79%
UPD FLOODING DDOS DURATION
EU 50%EASTERNEUROPE12%MIDDLEEAST 14%USA 15%OTHER 9%
COUNTRY OF ORIGIN ATTACKER

Innovating in Cyber Security – Shared research 2019 | 25
Step 7. Establish the information that is
available to feed into the model
In this step we assess what information can be
used to feed into the input nodes (the green
nodes in Figure 2) and that will influence the
probability table of the input node. This informati-
on can be acquired internally (e.g. output from
technical systems such as log files or service level
reports from suppliers) or externally (cyber threat
intelligence sources, reports from national certs,
etc.). A translation table needs to be defined, that
translates the value of the information sources
into probability percentages of the input node.
The higher the refreshment rate of the informati-
on, the more actual the probability table of the
input parameter.
If no (structural) information sources can be found,
the probability for an input node needs to be
determined by experts in which case it is impor-
tant to record the considerations of the experts.
Step 8. Develop automated scripts to feed the
information in the model
Manually updating the information in the model
can be tedious, in particular when it contains a lot
of input nodes and/or many information sources.
To increase the usability of the model, automated
scripts can be developed that overtake this task.
Step 9. Put it into operation
After the model is finalized, the information
sources and translation tables are established
and optional automation has been implemented
and tested, the model can actually be used. It is
recommended to, e.g., perform a yearly verificati-
on step on the probability tables with experts.
The output of the model can be used in the Risk
Management process. But the model can also be
used for many different analysis purposes e.g.:
• Scenario analysis: a particular situation is
simulated by determining a set of multiple
input variables and propagation. What answer
does that give in the outcome variable(s)?
• Sensitivity analysis: what effect does varying
one input variable have on the outcome
variable(s)? E.g. what if the effectiveness of
our external mitigation provider decreases?
• Root cause analysis (in case that an attack
actually occurred): what has caused the
observed state of the outcome or intermediate
variable(s)?
The model can also be used for analysis purpo-ses, such as root cause analysis and sensitivity analysis.
Lessons learned and outlookWe have gained many useful insights in building
the methodology and conducting a Proof of
Concept with it:
• Although it takes considerable effort to imple-
ment a model for one threat, the effort seems
to be well spent because it provides useful new
insights. The model and decision tables will
most probably not change heavily over time, so
the result of the effort can be used for a longer
period. Also, this method ensures that expert
opinion is structurally recorded and traceable,
making it less depending on (presence of)
specific experts;
• The actuality of the output of the model
(probability of impact when a threat materiali-
zes) depends heavily on the actuality of
information sources. But even if the information
does not change frequently and the model
therefore remains relatively static, the model is
useful because of the quantified risk level and
the knowledge that is recorded in the model;
• Different appearances of one threat-group (e.g.
DDoS attack) should be modelled separately.
This seems tedious, but for one group of
threats, a large part of the model will be the
same for all appearances (only some nodes
will be specific for an appearance) and many
information sources and decision tables can
also be re-used;
• One of the challenges was to collect relevant
information sources, that are also available
when needed. This will remain to be a difficult
task, because the information needs to be
collected from different parts of the organizati-
on and, probably, also externally;
• Also challenging is the translation from
information to probability. We have experienced
that it helps to define translation tables in terms
of maturity levels (is it a one-off, it is done more
frequently, is it described, is it structurally done
according to the description). But also presence
of certain information elements can be used for
translation tables (e.g. if we have only 7 of maxi-
mum 10 information elements present, we
assume effectiveness to be 70%). This needs to
be considered from case to case and put into
context.
All in all, the method can be well used in practice,
both in actual risk management but also for
different analysis purposes and we think the effort
that is needed to build the models is worth it. As a

26 | Innovating in Cyber Security – Shared research 2019
next and final step we plan to enhance the
methodology and its guidance and automated
tooling. so it will become usable for employees
in risk management processes.
Our methodology provides traceable, modelled
risk estimations based on the current insights. Yet
in practice there is an ongoing dynamic dialogue
between attacker and defender where both are
struggling for the weakest link. The attacker is
focused on its exploitation and the defender on
avoiding that. This means that both attacker and
defender are observing each other and over time
they improve their way of attacking or defending
based on their observations. This dynamic
complex behavior caused by attacker – defender
interactions and response of the (resilient)
organization [Zeijlemaker], [Zeijlemaker2]
will cause the input parameters to increase or
decrease over a longer time period. Therefore
there is at least a need to do regular risk
estimations.
More informationMore information and a more detailed description
of the model can be found in the white paper
‘Quantifying risks’ will be published on the SRP
cyber security webpage: https://www.tno.nl/
srpcybersecurity
Bibliography[Cooke]
R. M. Cooke, Experts in Uncertainty: Opinion and
Subjective Probability in Science, New York, USA:
Oxford University Press, 1991.
[Wisse]
B. W. Wisse, N. P. Elst van, A. I. Barros and S. P.
Gosliga van, “Relieving the elicitation burden of
Bayesian Belief Networks,” in BMA, 2008.
[Phillipson]
F. Phillipson, E. Matthijssen and T. Attema,
“Bayesian belief networks in business continuity,”
Journal of Business Continuity & Emergency
Planning , vol. 8, no. 1, 2014.
There is dynamic complex behavi-or caused by attacker – defen-der interactions which causes the input parame-ters to change over time.
[Phillipson2]
F. Phillipson, I. C. L. Bastings, and N. Vink,
“Modelling the effects of a CBRN defence system
using a Bayesian Belief Model.”, 9th Symposium
on CBRNE Threats, Helsinki, Finland, 2015.
[Zeijlemaker]
Zeijlemaker S, 2016. Exploring the dynamic
complexity of the cyber-security economic
equilibrium, PhD colloquium of the 34th
International Conference of the System Dynamics
Society, Delft, Netherlands, July 17–July 21
[Zeijlemaker2]
S. Zeijlemaker, 2017, Exploring the dynamic
complexity of the cyber-security: does a
deeper understanding support financial policy
evaluation?, PhD Research Proposal, March 2017,
Radboud University

Innovating in Cyber Security – Shared research 2019 | 27
“ Security is a strategy enabler for our digital transformation. The Shared Research Program fits perfectly in our ambition to be customer relevant and trend setting, were we collaborate to make Information Technology safer through innovation in cyber security technologies and processes. We’re extremely enthusiastic about the research work on “Quantifying Cyber Risk”. This research project aims to de-velop and evaluate a methodology to quantify cyber risks based on actual (available) and dynamic data like security monitoring infor-mation. Risk quantification and modeling is part of our insurance DNA and very relevant for not only (internal) security and risk manage ment organizations, but also further development of cyber related insurance pro-positions.”Willem van der ValkGISO Achmea

28 | Innovating in Cyber Security – Shared research 2019
Breaking the cycleCyber security threats targeting the financial
industry continuously evolve into new forms of
attacks. As a consequence, security measures that
defend systems and services against these attacks
are also evolving over time. This evolutionary
process is driven by constant innovation in the
areas of cyber-crime prevention, detection and
response. However, this continuing cycle of attack
and defend requires a great deal of human effort
and time. Can we break out of this cycle? Can we
think of and design new security concepts for the
future? Are the new concepts good enough to
protect us for a few years’ worth of iterations of
attacks?
In the SRP, security consultants, engineers and
architects have worked together to design a
security architecture in which new innovative
security concepts are proposed that can be used
Advanced Security Architec-tures - Don’t trust. Verify!Hiddo Hut (TNO), Wouter Langenkamp (TNO), Martine Kea (ABN AMRO), René Sibbel (ABN AMRO)
to escape from the ongoing arms race: the
Advanced Security Architecture (ASA).
Based on our analysis of published banking cyber
heists like Carbanak1, Barclays2 and the Bangladesh3
Robbery we extrapolated some of the problems
that allowed these heists to be successful:
1. Eggshell. Current architectures are frequently
based on the Eggshell model, where the
internal network is protected from the outside
world by shielding it using a security perimeter.
The problem is that, once inside, an attacker
has the ability to move through the system.
As the threat landscape has evolved, a strong
perimeter defence on its own is no longer good
enough.
2. Vulnerabilities. Attackers make use of (combi-
nations of) vulnerabilities that are present in
computing environments such as servers,
workstations, mobile devices, networks and
1 https://media.kasperskycon-tenthub.com/wp-content/uploads/si-tes/43/2018/03/08064518/Carbanak_APT_eng.pdf
2 https://www.dailymail.co.uk/news/article-2612285/Acid-House-King-handcuffed-Jonathan-Ross-jailed-sophisti-cated-cyber-bank-heist-skim-med-1-25-million-accounts.html
3 https://en.wikipedia.org/wiki/Bangladesh_Bank_robbery
Can we think of and design new security concepts for the future?

Innovating in Cyber Security – Shared research 2019 | 29
services while at the same time also exploiting
weaknesses in people, processes and organiza-
tions. Vulnerabilities will always be present,
even more so due to the ever-growing IT
landscape. We need to find a better way to
handle these weak spots without being overly
dependent on vendor patches.
3. Trust. Today’s successful companies have
morphed into complex environments with
lots of employees, customers, suppliers and
partners that continuously demand new forms
of access to data and functionality using an
ever-expanding array of devices and networks
to do so. There is too much trust in these
environments and not enough proof that
systems are secure.
4. Static. Security architectures and the security
measures therein consist of many statically
defined elements that make it hard to keep up
with the increasingly dynamic environment. The
classification of cyber security risks into actiona-
ble and quantifiable responsibilities for people,
systems, networks and services requires a lot of
human interaction and decision-making from
higher up the chain of command.
Note that the identified problems are of a generic
nature, i.e. they are not specific for the financial
industry and could be applicable to many
organizations.
A changing paradigmThe goal of ASA is to propose a redesign of
security architectures to change and improve the
way in which security attacks can be mitigated.
The context we have chosen is (a) a generic
‘greenfield’4 situation and (b) a time-frame of
about 5-10 years ahead. Both aspects allow us to
look beyond today’s solutions and limitations in
order to truly think of something new that has not
been done before. In that time span, commercial
products should be available on the market to
implement (parts of) the architecture. As a
consequence, this means that the developed
concepts do not form a complete and all-encom-
passing security architecture that spans an entire
organization. In fact, some of today’s current
security measures work quite well and should,
in our opinion, not be discarded.
All of our ideas are centered around a changing
paradigm of “Don’t trust. Verify!”. The underlying
assumption is that with today’s evolving security
attacks, infrastructure and functionality can no
longer be trusted up front. Before being allowed
to be used for sensitive workloads like financial
applications, we want a higher degree of assuran-
ce; we want infrastructure, functionality and users
to be verified explicitly and continuously. We
thereby assume that the hardware and software
stack of computing cannot be trusted. We assume
that the network cannot be trusted. We assume
that applications and services cannot be trusted.
In other words, every part of the architecture may
have vulnerabilities that can potentially be
exploited at some point in time.
We have to come up with a recipe that can deal
with this brave new world. Not by preventing
cyber security incidents from happening – we
have already lost that game – but rather by
creating an architecture in which those events can
only create small, localized problems. We have to
be able to contain attacks in order to prevent
escalation and diminish the overall impact. We
need a solution that does not care if something,
somewhere turns ‘red’. We want to be able to
shrug it off and say: “It’s just a flesh wound”.
Proposed conceptsHereafter follows a summarized overview of a
selection of concepts that we propose to be
integrated within the newly designed security
architecture. The premise of every concept is
given, followed by a brief technical overview and
an explanation of how these will contribute to the
overall architectural design.
Security ZonesSecurity zones is a concept which aims to define
clear boundaries and interfaces between different
(sets of) functionalities, thereby allowing these
functionalities to be compartmentalized.
Security zones are a way of reducing the attack surface and preventing the escalation of attacks.
4 ‘Greenfield’ means no legacy and not taking into account existing IT infrastructure.


32 | Innovating in Cyber Security – Shared research 2019
Compartmentalization is the act of splitting an
architecture in more manageable sections of
functionality. Amongst other benefits, this enables
the containment of malicious activities, rapid
(re)deployment, reusability, better version control
and an immutable infrastructure. These compart-
ments – denoted security zones in ASA – are
strictly isolated by default unless explicitly
instructed otherwise. Security zones can be
designed to be immutable, meaning the zones
themselves are never reconfigured but completely
replaced with a new version of the security zone.
Security zones may also be used to contain or
mitigate malicious threats by both reducing the
attack surface (as only specific parts of an
architecture will be exposed to an attacker at a
given time) and containing malicious activities
within a zone (as an attacker will have only limited
possibilities for moving laterally). As part of the
concept, each security zone is bundled with its
own set of security requirements, which have to
be met in order to interact with it. The responsibi-
lities to maintain these requirements and enforce
them in practice should be clearly appointed to a
responsible entity. Security Zones is a novel
concept that builds upon and combines aspects of
existing techniques (e.g. compartmentalization [1],
segmentation, microservices [2, 3] and networked
risk management [4]).
Security zones are a way of reducing the attack
surface and preventing the escalation of attacks in
an eggshell type of environment. While security
incidents may still take place, this ensures that
their impact will be minimized.
On-Demand ConnectivityOn-Demand Connectivity is a network mechanism
in which authorized connections between two
entities must be provisioned in order for them to
be able to communicate.
17 This capability encompasses activities such as acquisition, maintenance and release management for software solutions and other technical infrastructure employed in the organization’s CTI practice.
Figure 1: Security zones
Figure 2: On-Demand Connectivity
Tran
smis
sion
Transmission
Data
Zones
UI
Function Function Function
UI UI UI UIEnforcement
Enforcement Enforcement
Business logic Business logic
Enforcement
Enforcement
Enforcement
Enforcement
Enforcement
Function discovery
Security parameters
Secure connection establishment
Function request establishment
Terminate connection
Security parameters
Terminate connection
Zone ZoneConnect service
On-demandconnect request
Functionalrequest
On-demand connectivity makes connecti-ons explicit and insightful, both reducing the amount of unwanted connections as well as making it easier to monitor them.

Innovating in Cyber Security – Shared research 2019 | 33
Figure 3: A hardware-based security mechanism to determine trustworthiness
Source: https://software.intel.com/en-us/articles/intel-trusted-execution-technology-intel-txt-enabling-guide
This idea aims to ensure that there are only
connections made between functions in the
network that are actually necessary for business
applications. The consequence is one of Zero-
Trust: without provisioning, there is no per default
communication possible. To make sure that
keep-alive messages do not keep connections
alive indefinitely and create a form of network
legacy, we also propose a ‘garbage collector’
mechanism that automatically tears down connec-
tions. On-Demand Connectivity is an existing
concept [5] for which we developed a novel
implementation to validate the idea and research
and demonstrate its functionality.
This concept addresses the eggshell problem by
adding a Zero-Trust type of network to a strong
perimeter defence. On-demand connectivity
makes connections explicit and insightful, both
reducing the amount of unwanted connections
as well as making it easier to monitor them.
This drastically reduces the impact of a security
breach, as it will be far more difficult for an
attacker to laterally move throughout the system.
Full-Stack IntegrityFull-Stack Integrity is a hardware-based security
mechanism to cryptographically validate the
integrity and authenticity of a software stack
from the low-level firmware up to and including
application-level functionality.
In its most common form, a general computing
platform consists of a hardware layer, an opera-
ting system layer and an application layer. The
security of upper layers build on top of the ones
below. All of these layers are however sensitive to
security issues: when one of the lower layers is
insecure, all layers above are affected. We propose
a hardware-based Security Trust Anchor that is
completely out of reach from the Operating
System and the applications. Next we propose a
remote attestation mechanism using a security
trust anchor over critical components in the stack
(e.g. BIOS (Basic Input/Output System), bootloa-
der, kernel, base operating system image,
hypervisor and application). This enables a remote
system (challenger) to asynchronously measure
the current status of integrity and authenticity
of the platform of another system to determine
the level of trust. Next we propose using such a
mechanism to migrate sensitive applications and
services away from an untrusted cluster to a
trusted cluster within the scope of a single
cloud-provider if the integrity of a cluster cannot
be guaranteed anymore. Finally we propose using
such a mechanism to migrate sensitive applications
and services between different cloud-providers
in the case of a large-scale emergency. Our
Full-Stack Integrity concept is based on existing
ideas [6] but with additional requirements (e.g.
open firmware for higher assurance and indepen-
dent security evaluation) and additional security
mechanisms (e.g. migration of functionality).
This concept addresses the vulnerability problem
and makes an organization less dependent on
vendor patches because it focusses on trying to
detect unauthorized changes. It also addresses
the eggshell problem by reducing the opportuni-
Virtualization management canidentify and report platforms thatdemonstrate integrity via Intel TXT Blue =
sensitive VMYelow =Generic VM
Securitymanagement
Virtualizationmanagement
Trusted systems
Intel® TXT Trusted pools use model
Untrusted systems
Policy:Sensitive VMrequirestrusted host
VM3
VM1 VM2
1
Security management software allowsidentification of sensitive workloads2
Security management software canread platforms trust status fromvirtualization management software
3
Security management software allowslinkage of platform capability toworkload classification via policy
4
Security management software policycan control VMs based on platformtrust to better protect data
5
Prove your trust-level by producing a valid chain of attestations.

34 | Innovating in Cyber Security – Shared research 2019
ties as well as impact of a piece of malware and
adds a strong integrity and authenticity detection
mechanism to the mix.
Risk-Adaptive Decision MakingRisk-adaptive decision making is a concept in
which decisions are made based on a trade-off
between current risks, acceptable risks and the
need for the requested action. By making these
actions explicit and measurable, such a system
can be used to support or even automate parts
of decision making.
Figure 4: Risk-Adaptive action evaluation
The idea originates from risk-adaptive access
control (RAdAC) [7], which is a method of
providing access according to a risk trade-off.
In contrast to only making an access decision,
risk-adaptive decision making strives to more
universally apply such risk trade-offs in the
architecture. The use of risk-engines to support
decision making is not a new concept and is
already being used to reduce manual efforts,
improve accuracy and enable automation.
However, many of today’s systems only apply to
a narrowly defined problem and are designed
according to a predefined set of rules. We aim to
more universally apply the concept of risk-adapti-
vity throughout the infrastructure, where it can
more generally help decide whether or not an
action should be allowed. Both of these concepts
require a system in which requirements, measu-
res, demands and decisions are made more
explicit. In order for a system to reason about
such features independently, we will need to
come up with a system language to describe
them. The transparency and explicitness of
requirements and decisions provide a unique
platform for monitoring and detection as well as
user behavior analysis. The goal is to move from
statically defined rules and environments to a
more dynamic system that can adapt to a
changing environment.
This concept makes a security architecture more
dynamic instead of static. It also addresses the
trust problem by creating a more transparent
decision making process that is not as dependent
on human interaction.
ResultsThe results of ASA cover a wide range of proposed
solutions of which a selection is presented in this
article. Our approach has been to analyze three
financial cyber-heists, extrapolate the problems
underneath the attacks that allowed them to do
what they did and find ways to mitigate these
problems.
For the concept of ‘On-Demand Connectivity’,
we implemented a working proof-of-concept.
It is built on existing open-source technology and
aims to present a Zero-Trust perspective of the
network to any infected device, software, service
or a malicious user. For this concept, we envision
a future where every connection over the network
between two components has to be authorized
explicitly, in order to limit lateral movement and
improve monitoring and detection capabilities.
Future workAs a next step, we would like to study the
technical feasibility of (a subset of) the other
proposed components by building more proof-of-
concepts. Additionally, we would like to replay the
cyber-heists and their malware in a controlled
environment in which (a subset of) our concepts
are deployed, to see how they deal with these
kinds of attacks. Last but not least, we would like
to consult vendors to disseminate our results and
to verify whether any of our proposed concepts
are included in future roadmaps.
Object
Permit actionR
A > R
C?
Identify
LocationRole
Behaviouralaspects
Age
Distributionrate
Contentdescription
Action
The goal is to move from statically defined rules and environments to a more dynamic system that can adapt to a changing environment.
Innovating in Cyber Security – Shared research 2019 | 35
Bibliography[1] Robert Watson, Steven J. Murdoch and others
(March 2013). “Towards a Theory of Applicati-
on Compartmentalisation”5. University of
Cambridge, SRI International and Google UK
Ltd.
[2] Nathaniel Schutta ( January 19, 2018). “Should
that be a Microservice? Keep These Six Factors
in Mind”6. Pivotal.
[3] Andy Wu (2017). “Taking the Cloud-Native
Approach with Microservices”7. Magenic.
[4] Joosten, H., & Smulders, A. (2014). “Networked
Risk Management : How to successfully
manage risks in hyperconnected value
networks”8. TNO.
[5] Armon Dadgar. “The What, Why, and How of
Zero Trust Networking”9. HashiCorp.
[6] Philip Tricca (2018). “TPM 2.0 Software Stack:
Usability, Privacy and Security”10. Intel.
[7] MCGRAW, R. (2009). “Risk-adaptable access
control (radac)”. In: Privilege (Access) Manage-
ment Workshop. NIST–National Institute of
Standards and Technology–Information
Technology Laboratory.
5 See https://khilangudka.github.io/pubs/2013spw-com-partmentalisation.pdf
6 See https://content.pivotal.io/blog/should-that-be-a-micro-service-keep-these-six-fac-tors-in-mind
7 See https://cloud.google.com/files/Cloud-native-ap-proach-with-microservices.pdf
8 See http://publications.tno.nl/publication/34612233/jfvm8m/joosten-2014-networ-ked.pdf
9 See https://www.hashicorp.com/resources/how-ze-ro-trust-networking
10 See https://www.platformsecuritysummit.com/2018/speaker/tricca/

36 | Innovating in Cyber Security – Shared research 2019
“ Security measures should at least keep pace with ever evolving cybercrime threats. Traditional rule-based detection is no longer sufficient. Effective detection of threats calls for smart anomaly based detection. The Shared Research Program increasingly not only researches this topic but also deve-lops implementation ready smart capabilities in the area of f.i. Phishing, prioritizing SIEM alerts, DNS Ninja. Participation in these projects makes us learn and gets us inspired and able to improve our capabilities by creating advanced models for early detecti-on.”
Beate ZwijnenbergCISO ING
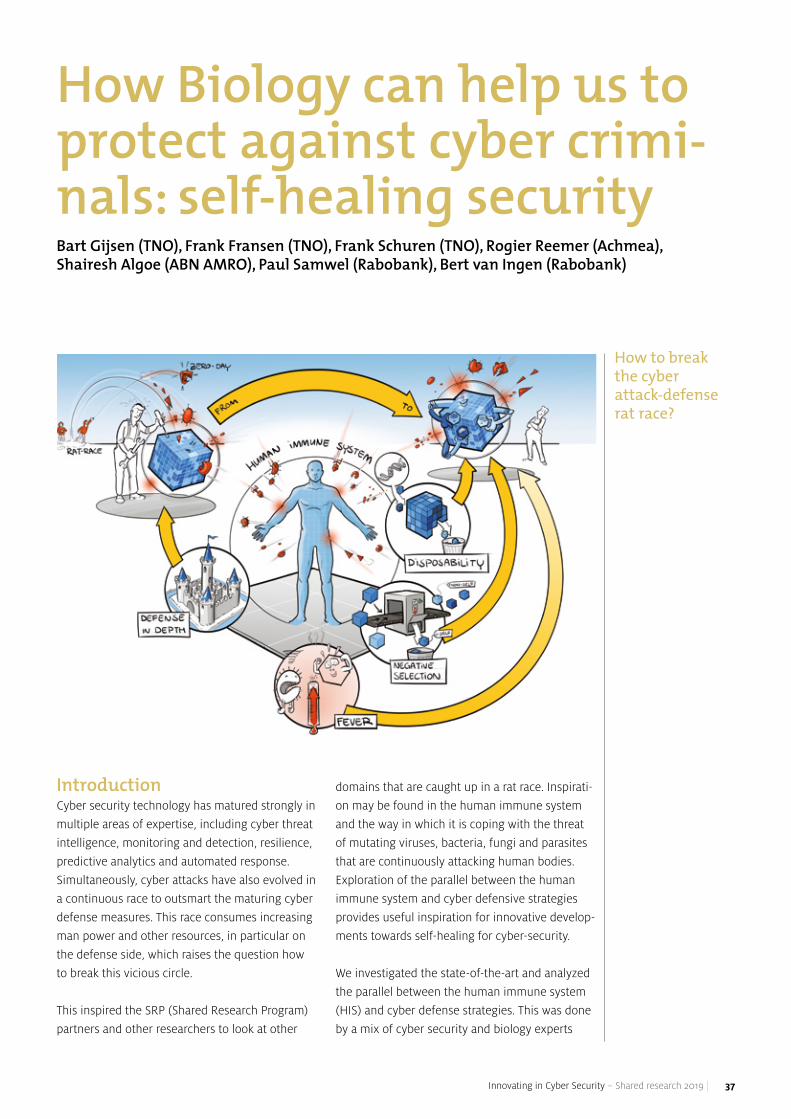
Innovating in Cyber Security – Shared research 2019 | 37
IntroductionCyber security technology has matured strongly in
multiple areas of expertise, including cyber threat
intelligence, monitoring and detection, resilience,
predictive analytics and automated response.
Simultaneously, cyber attacks have also evolved in
a continuous race to outsmart the maturing cyber
defense measures. This race consumes increasing
man power and other resources, in particular on
the defense side, which raises the question how
to break this vicious circle.
This inspired the SRP (Shared Research Program)
partners and other researchers to look at other
domains that are caught up in a rat race. Inspirati-
on may be found in the human immune system
and the way in which it is coping with the threat
of mutating viruses, bacteria, fungi and parasites
that are continuously attacking human bodies.
Exploration of the parallel between the human
immune system and cyber defensive strategies
provides useful inspiration for innovative develop-
ments towards self-healing for cyber-security.
We investigated the state-of-the-art and analyzed
the parallel between the human immune system
(HIS) and cyber defense strategies. This was done
by a mix of cyber security and biology experts
How Biology can help us to protect against cyber crimi-nals: self-healing security Bart Gijsen (TNO), Frank Fransen (TNO), Frank Schuren (TNO), Rogier Reemer (Achmea), Shairesh Algoe (ABN AMRO), Paul Samwel (Rabobank), Bert van Ingen (Rabobank)
How to break the cyber attack-defense rat race?

38 | Innovating in Cyber Security – Shared research 2019
from the SRP partners. Also, external speakers
from Delft University of Technology and VU
Amsterdam were invited to present their research
on distributed artificial immune systems and on
self-healing software. This article presents the
insights gained in the analysis on Self-Healing for
Cyber Security (SH4CS).
Evolution of self-healing The term ‘self-healing’ was first coined by IBM in
2001 and more elaborately defined in their article
titled “The dawning of the autonomic computing
era” [1]. According to the authors autonomic
computing comprised eight characteristics:
self-awareness, -configuring, -optimization,
-healing, -protection, context-awareness,
openness and anticipatory. In their definition
self-healing systems should be able to recover
from a failed component without any apparent
application disruption, with the objective to keep
enterprise applications available at all times.
While this definition of self-healing is focused on
availability, self-protection is focused on authori-
zed access to computing environments, or cyber
systems. In this article we refer to SH4CS as the
broader definition of self-* (in which the asterix
depicts any term that is used in this context, such
as self-healing, self-configuring etc.) characteris-
tics that are applied to autonomously secure cyber
systems (i.e. not requiring any human interaction
or modification).
Part of the vision of autonomic computing is a
high-level concept for engineering self-* systems
[2], which has remained a consensus technique
for automated monitoring & control until today.
This self-* engineering technique is a specialized
MIMO (multiple input, multiple output) clo-
sed-loop control system and referred to as
MAPE-K: Monitor, Analyze, Plan and Execute,
using Knowledge. In Figure 1 the MAPE-K control
loop concept is illustrated.
Autonomic computing and MAPE-K (alike)
concepts inspired the field of self-adaptive
(software) systems (SAS). In 2013 over a hundred
papers about self-protecting software systems
(more commonly referred to as SAS) where
included in a survey [3]. The categorization of
these papers in this survey resulted in a taxonomy
that distinguishes between:
a) why SAS is applied (e.g. to adapt to changes in
context or available resources),
b) which software or IT layer it is applied to (e.g.
application, operating system, (virtual)
resource or communication layer),
c) when it is applied (proactive or reactive),
d) what it modifies (e.g. parameters, code,
alternate service) and
e) how it makes its adaption decisions (e.g.
system internal / external, centralized /
decentralized, rule- / goal- / utility-based).
Knowledge
Is monitored
Is monitored Manages
InteractsUses
User/engineer
Specifiesprotectionobjectives
Protecting susbsystem (meta-level)
Protected susbsystem (base-level) Domain
Analysis
Monitoring Execution
Planning
Sensor Effector
Figure 1: A MAPE-K engineered self-protected subsystem; source: [3]
Self-healing security research seems more promising than its limited prac-tical application suggests.

Innovating in Cyber Security – Shared research 2019 | 39
Until recently the least explored part in SAS has
been the decision making process; i.e. the steps
of analysis and planning in the MAPE-K loop.
For the SAS decision making part techniques are
emerging in the field of Cyber Reasoning Systems
(CRS) [4]. CRS are expert systems aimed to
automatically detect exploitable bugs, generate
verifiable exploits and patch software. In recent
years this field has started to make progress,
amongst others boosted by DARPA’s Cyber Grand
Challenge in 2016, in which seven high-perfor-
mance autonomous computer systems competed
to patch and hack software in tens of battle rounds.
Nevertheless, CRS research is still in its infancy.
Parallel between HIS and AISAt the beginning of the self-healing evolution
IBM deliberately chose a term with a biological
connotation, hinting at the parallel with the
autonomic nervous system [2]. In our SH4CS
analysis we also found that bio-inspired security
provides a fresh viewpoint. In particular, the
parallel between the human immune system
(HIS) and artificial immune systems (AIS, a term
that emerged in the mid 80’s). Artificial immune
systems are adaptive cyber (security) systems,
inspired by human innate and adaptive immune
functions and principles, that protect against
vulnerabilities and facilitate recovery from their
exploitation.
In the next section we attempt to describe the
parallel between the HIS and the AIS as far as
possible. We do so by proving a mapping between
elements and characteristics of the HIS and AIS
and to identify commonalities. While doing so it is
also clear that there are differences between the
HIS and AIS.
Mapping and commonalitiesFor the mapping between the HIS and the AIS we
start by identifying the ‘to be protected system’.
The HIS can be regarded1 to protect the human
body that it is part of, which is a confined system.
The equivalent of a human body in AIS seems to
be less clear. In the early days of the information
era a stand-alone ‘computer system’ or ‘informati-
on system’ was a clear candidate as the system to
be protected. However, nowadays IT systems and
applications have become intertwined and shared,
within organizations and even between organiza-
tions via the internet. In [5] this current state is
referred to as cyber infrastructures that have “no
sense of self-awareness”. In this blurry context we
chose the following (ambiguously defined)
to-be-protected-system for the AIS: all IT systems
and applications used by, and under the responsi-
bility of, a single organizational unit that governs
the cyber security policy (i.e. there are no
competing AIS’s that may enforce conflicting
security actions).
The ‘objective’ of the HIS could simply be referred
to as the survival of a human’s body. The most
commonly referenced AIS objective is the
information security triad: CIA (Confidentiality,
Integrity and Availability). Note that the CIA triad
is applicable to information, communication and
data security. Regarding the security of the
underlaying network and IT systems the confiden-
tiality objective can be interpreted as controlled
system access (related to identification, authenti-
cation and authorization).
Figure 2: 12 jobs of the human immune system [6]
Bio-inspired security provides a fresh view-point, but there are also differen-ces between the HIS and AIS.
Communication
Kill enemies
Standby mode
Fight worms
Cause inflammation
Activate other cells
Produce antibodies
Kill infected cells
Strategic decisions
Remember enemies
Mark/disable enemies I
Mark/disable enemies II
1 Note that there can be different viewpoints to this when looking at diversity of the HIS between individuals, which protects a population instead of individual bodies. Likewise, when considering the long-term evolution of the HIS this evolution has protected the entire human race. In this paper the focus is on the human body as the system protected by the HIS.

40 | Innovating in Cyber Security – Shared research 2019
The ‘defensive measures’ that can be applied by
the HIS to combat invaders in the human body
are presented in Figure 2. This set of 12 jobs is the
result of decades of HIS research that are further
illustrated in the animated movie [6]. In the much
younger research field of cyber security the list of
defensive measures is less clearly defined and
subject to change. High-level cyber defense
measures include: hygiene (software scanning
and network filtering rules, up-to-date patches,
etc.), reducing the attack surface (hardening),
cyber monitoring and intelligence (user behavior
analytics, anomaly detection, threat intelligence,
etc.), deception techniques (e.g. honey pots) and
techniques to throttle exploitation. In the SH4CS
analysis much of the discussions were focused on
identifying commonalities and gaps between
defensive measures of the HIS and AIS. Some of
the identified (partial) commonalities are
included in Table 1 (this is a non-exhaustive
comparison of defensive measures, more can be
found in [5] and [7]).
When looking at the attack side of the rat race
we can distinguish several types of attackers.
The HIS has four types of non-self attackers:
bacteria, viruses, fungi and parasites. Besides
these non-self attackers there are diseases that
are typically not regarded as HIS attackers, such
as cancer and anti-immune diseases. In the
parallel with AIS, Intel’s threat actor library [8]
distinguishes twenty-one types of cyber attackers.
Examples are: thief, civil / radical activist, compe-
titor and sensationalist. This includes inside-attac-
kers (self), such as a disgruntled employee or an
internal spy, as well as outside attackers (non-
self).
The high-level ‘objective of the attackers‘ is
self-preservation. In more detail the cyber threat
actor library [8] distinguishes the objective of an
attacker in the intended outcome (theft, business
or technical advantage, damage and/or embar-
rassment) and the intended action (copy/take,
destroy/damage, deny access or multiple of
these). For HIS attackers the ‘intended outcome’
is more or less the growth of their population. The
‘actions’ they take to achieve that are feeding and
reproducing. While doing so they cause collateral
HIS defensive measure AIS defensive measure
Macrophages (Greek for big-eaters) are white blood cells that provide generic defense by (not very selectively) cleaning up damaged cells and ingesting non-self pathogens. They can also initiate specific defensive measures by the adaptive immune system.
We did not identify automated cyber defense measures that are as generally applicable as the role that macrophages play in the HIS. Their function is common to that of an array of cyber defensive measures including intrusion, anomaly and malware detection and antivirus, comple-mented with human analyst intelligence.
Natural killer cells that selectively kill infected cells that are (a) not revealing “self” markers or (b) are revealing “danger” signals.
In theory, remote attestation can be used in IT systems (e.g. via mobile agents) that inquire running software code to identify themselves using Trusted Platform Module (TPM)2 hashes (and kill them, if not responding or not valid). However, this is not common practice yet.
Memory B cells enable fast immune response in case of re-infection. In combination with vaccina-tion, memory B cells can be made an infection preventive measure.
Antivirus scanners use virus signature dictionaries that have a common function as memory B cells, where distribution of dictionaries by antivirus vendors is similar to vaccination.
Inflammation is a response to an infection that eliminates the cause of cell injury, clears out damaged cells and initiates repair.
We did not identify a clear AIS commonality for inflammation.
2 Trusted Platform Module is an ISO standard that specifies cryptographic verification of the integrity of a HW/SW stack.
In the much younger research field of cyber security the list of defensive measures is less clearly defined.
Table 1: Comparison of several defensive measures.

Innovating in Cyber Security – Shared research 2019 | 41
damage to the bodies they feed from and
over time these invaders mutate and build up
resistance.
Regarding ‘attacking phases’ a number of stages
can be distinguished3: preparation / infection /
spreading / exploitation. Where these phases fit
well for the cyber kill chain (AIS), some imaginati-
on is required to fit in the HIS attacker stages.
Except for evolution of bacteria (that can become
resistant) and virus mutations there is not an
explicit preparation phase. Also, there is no
explicit exploitation phase for HIS attackers,
since self-preservation by growing in population
(i.e. the spreading phase) is their intended
outcome.
DifferencesWhile this parallel inspires and brings forth
suggestions to improve and extend current cyber
defense techniques, we also observe differences.
These differences may illustrate more fundamen-
tal aspects that we need to change in our current
way of designing and securing information
systems. For that purpose we highlight three of
the most fundamental differences.
A fundamental aspect of the HIS is the fact that
large numbers of more or less identical human
cells collaborate in performing body functions.
As such, individual cells are disposable and are
continuously regenerated. This feature is not
common in IT environments: applications can
typically not be killed at will and randomly
deleting data files may lead to unrecoverable
information. Nevertheless, some concepts such
as virtualized, micro services and serverless
architectures and CI/CD (Continuous Integration
and Continuous Delivery) techniques are enabling
IT infrastructures to become more disposable and
regenerative.
Secondly, the HIS is decentralized and choreo-
graphic by nature with multiple, redundant
biological systems that provide overlapping
protective functions (for which the interactions
between them still remain a mystery). In contrast
to this, cyber security architectures and SOC’s
tend to be centrally orchestrated. Moreover,
most current cyber security solutions are informa-
tion systems that provide an overview to humans
to assist them in their cyber decision making.
While human brain capacity applied to centralized
data sets might currently be unmatched for
interpreting complex cyber situations and acting
upon it, advances in distributed computation may
relieve the human effort. During the SH4CS
analysis an AIS prototype was presented that
implements negative selection-based anomaly
detection4 in large IT infrastructures using
adaptive, choreographic deployment of distribu-
ted, mobile agents.
Related to the above another distinction between
HIS and AIS is that the HIS is adaptive by nature,
while AIS are planned, developed and managed
[5]. The latter is a consequence of the common
approach to build cyber security technology using
the same IT building blocks that are used to build
the systems that they are supposed to protect.
Note, that for business IT systems it is essential
that one can plan, develop and manage specific
functionality for supporting business processes.
This approach is also useful for implementing
cyber monitoring & control technology. However,
emerging agile and dev(sec)ops approaches are
inherently needed to provide adaptivity of current
cyber technology in order to enable adequate
response to unprecedented attacks.
Lessons learnedIn our SH4SC analysis we experienced that
discussing bio-inspired security in a mixed group
of cyber security and biology experts provides a
fresh viewpoint. In particular, from discussion of
the parallel between the human immune system
(HIS) and artificial immune systems (AIS) we
learned the following lessons:
a) Centralized orchestration of security monito-
ring, prevention and resilience is dominating
nowadays cyber security measures, while the
HIS is organized as a decentralized choreo-
graphic protection system. Both approaches
have their pro’s and con’s. While centralization
provides administrators and security officers
overview and control, it also provides attac-
kers a source of intelligence and a target to
collect privileges. It seems to make sense to
complement current centralized cyber
defenses with decentralized monitoring and
control that is also capable of adapting itself
autonomously within certain cyber security
objectives and policies. Introducing self-adap-
tiveness in IT architectures is a challenging
task, where research in the field of cyber
reasoning systems seems to be promising.
3 The exact kill chain phases evolve over time since attackers are increasingly using pre-packaged attack tools.
4 The HIS-inspired negative selection process can be applied to generate new traffic patterns for filtering yet-unknown ‘non-self’ traffic, which patterns are not triggered by ‘self’-traffic.
It makes sense to complement current centralized cyber defenses with decentralized, self-adaptive security measures.

42 | Innovating in Cyber Security – Shared research 2019
b) “Self-awareness” and the ability to distinguish
between “self and non-self”5 entities and
activities are important features in HIS
protection strategies. These properties were
also pointed out as key elements of autonomic
computing [1] and required to develop
self-healing and cyber reasoning systems.
Although attempts are being made to develop
machine processable protocols for distinguis-
hing self and non-self IT services, software
components and hardware elements, their
limited adoption is still hindering further deve-
lopment of AIS.
c) The HIS is an example of a multi-layered
protection system, similar to defense in depth
in AIS. The skin can be regarded as an outer
layer protection and the macrophages of the
innate immune system as a second layer, that
protect against a wide range (non-specific) of
attackers, by isolating and destroying the
invaders. While doing so the macrophages
produce alarm signals that, once many of
them are being produced, trigger the adaptive
immune system to provide specific counter
measures (i.e. the HIS contains a decentrali-
zed, continuous scale risk indicating mecha-
nism). The adaptive immune system can be
regarded the third layer of defense that can
mobilize counter measures from its memory
of previous attacks or it can produce specific
killer cells and anti-bodies.
d) Interesting is how the HIS uses the negative
selection process3 for producing killer cells
and anti-bodies against invaders that the body
has never been exposed to before. Some AIS
research has explored if and how negative
selection (amongst others) can be used to
protect against zero-day exploits. This research
seems more promising than its limited current
practice suggests.
e) Protective HIS strategies (presented in for
example [5], [6]) are exploiting the principle
of disposability. This makes HIS inspired
strategies applicable to stateless parts of
cyber infrastructures and less applicable for
protecting data integrity or confidentiality. In
particular, it makes sense to focus on micro
service- and virtualized architectures and CI/
CD (Continuous Integration and Continuous
Delivery) techniques that enable IT infrastruc-
tures to become more disposable and
regenerative. A continuously regenerating
infrastructure can be an additional defensive
measure to limit the maintainable duration of
attacker footholds that remain undetected.
End of the cyber attack-defense rat race?The research question that initiated this self-hea-
ling for cyber-security exploration was focused on
ways to break the vicious circle of cyber-attack
and defense. So, does self-healing break this rat
race?
The answer is not a clear yes or no. Yes, self-
healing does hold the promise to change the rat
race. In particular, it may alter the ‘rats’ in the rat
race, which are currently human cyber security
experts that can be assisted to a higher degree
by automated, self-adaptive systems. As such,
self-healing can significantly reduce the required
cyber security effort. No, in the sense that the rat
race can be expected to remain to exist once
self-healing becomes applied more widely. After
all, the HIS and its attackers are also involved in
an evolutionary loop of genetic adaptation, virus
mutation, bacteria resistance, etc. Moreover, an
individual’s HIS might also suffer from an auto-
immune disease (such as HIV). As such the HIS
evolution is a “survival of the fittest” rat race in
itself, where the HIS still needs occasional
assistance from medical professionals. Never-
theless, we conclude that further research into
self-healing for cyber security provides novel
approaches to becoming “the cyber fittest”.
5 The ability to distinguish “self and non-self” need not be an either / or assessment (i.e. risk or no risk), but rather a gradual scale that can cope with some room for acceptable risk.
Self-healing security provides novel approaches to becoming “the cyber fit-test”.

Innovating in Cyber Security – Shared research 2019 | 43
Bibliography[1] The Dawning of the Autonomic Computing
Era, IBM Systems Journal, 2003.
[2] The vision of autonomic computing, Computer
Journal, Vol. 36, January 2003.
[3] A Systematic Survey of Self-Protecting
Software Systems, ACM Transactions, 2013.
[4] Survey of Automated Vulnerability Detection
and Exploit Generation Techniques in Cyber
Reasoning Systems, arXiv.org, August 2018.
[5] A Taxonomy of Bio-Inspired Cyber Security
Approaches: Existing Techniques and Future
Directions, Arabian Journal for Science and
Engineering, February 2018.
[6] https://www.youtube.com/watch?v=zQGO-
cOUBi6s
[7] Basis immunologie, Workshop IT Security &
Immunologie, Achmea, December 2017
(internal document, available for SRP part-
ners)
[8] Threat Actor Library, Intel IT threat assessment
group, 2007

44 | Innovating in Cyber Security – Shared research 2019
“ Cybersecurity is increasingly dependent on addressing vulnerabilities across chains and organizations. Cooperative research in this area is challenging but also necessary to facilitate and nurture novel approaches. For the past five years TNO and its partners have co-developed and piloted new approaches in security monitoring and response as well fraud and money laundering detection within the shared research program cybersecurity. TNO as an organization has a long term commitment to foster cybersecurity innovation and especially focuses on developing and prototyping innovations in a demanding collaborative setting. We look forward to continue this successful shared research program with our partners.”
Berry VetjensDirector Market of Unit ICT TNO

Innovating in Cyber Security – Shared research 2019 | 45
Security in a dynamic worldSecurity is and always has been a core business
for financial institutions. The very nature of
financial institutions, working with monetary
assets, makes them susceptible to criminal
activity. Safeguarding these assets requires
continuous, ever ongoing, efforts. This is
especially true with the present-day world’s
digital transformation and overall pervasiveness
of ICT; users expect new functionalities, constant
availability of trusted information and connectivi-
ty from a wide range of personal devices. Keeping
up with the functional demands without jeopardi-
zing security is paramount for financial instituti-
ons.
In practice, much of the hardware, software and
services (hereafter simply denoted as ‘products’)
used to provide these functionalities are supplied
by a wide range of external parties from all over
the world. This not only creates a functional
dependency on these parties, but also drastically
influences the way security requirements need to
be managed. Depending on the product, security
measures may have to be taken by either the
external party, the financial institution itself,
or both. The attention for security starts at the
selection of a vendor and continues into the
day-to-day operations.
Improving the security assurance of third-party relationsWouter Langenkamp (TNO), Bob Bekker (ING), Brenda van het Hul (ABN AMRO)
The attention for security starts at the selection of a vendor and continues into the day-to-day operations.

46 | Innovating in Cyber Security – Shared research 2019
Gaining appropriate security assuranceThere are several ways in which the use of
products supplied by third-parties could affect
security in an organization. Most significantly, (1)
the product may contain security flaws, making it,
and the infrastructure it is placed in, vulnerable to
malicious activity, or (2) the vendor that provides
the product may itself not be trustworthy, either
due to some degree of incompetence or even
malicious intent. Luckily, in practice, it seems that
many of the vendors are well-capable of taking
appropriate security measures, nor is there reason
to question their intent. However, it is important
to make contractual agreements to formally
capture the requirements, roles and responsibili-
ties. Security clauses have become common
practice; while a standard clause may suffice in
some cases, it is oftentimes necessary to tailor
these to the specific product and vendor. The
requirements may be susceptible to changes over
time and thereby require periodic reconsideration.
Especially for products used in critical business
processes, it is crucial to determine when to take
action, as well as to routinely verify whether the
contractual agreements are still being met.
Given sufficient time and resources, most financial
organizations are well-capable of determining the
impact of a to-be-acquired product and the
corresponding actions that should be taken. In
practice, however, such investigative activities are
labor-intensive, whereas available resources are
scarce. This makes it unfeasible to do extensive
research for every single product that is being
acquired and every vendor that is being contrac-
ted, thereby also laying restrictions on the actions
that can be taken. Therefore, it is important to
tailor the use of assurance instruments and the
degree of assurance and control to the ‘criticality’
of the product and the associated vendor
(typically, more demands and tighter control for
higher criticality). Achieving assurance is always a
trade-off; how much resources should be spent to
achieve what degree of assurance?
Making the trade-off insightfulThere should be an efficient, systematic way to
rate the criticality and use this to decide upon
security requirements and the appropriate
security assurance instruments. The aim is to
make this trade-off between invested resources
and degree of assurance insightful, as well as to
help determine how critical a product is for the
organization and the degree of assurance that
should therefore be obtained.
We developed a methodology to obtain a quick
but useful indication of the product criticality as
well as the degree of assurance that is or should
be in place. This indication will be used to help
prioritize what products or vendors require further
attention and on which aspects specifically. The
methodology is implemented in an interactive
tool, in which the user is required to answer a set
of questions relating to the product, vendor and
the assurance measures that are already in place.
The challenge is to find an implementation that is
insightful yet keeps the effort required by
organizations to a bare minimum. The methodo-
logy will be tested and refined based on a set of
representative use-cases within the financial
institutions involved in the SRP.
In contrast to most projects in the SRP, which
focus on problems in the near future, this is a
challenge that currently exists, and can be
addressed today. This also means that the
outcome of this research can be verified and,
ideally, be implemented in an operational
setting when finalized.
Foundation of the methodologyThere are many works available that target
third-party security management. A wide variety
of information is available; industry standards,
Achieving assu-rance is always a trade-off; how much resources should be spent to achieve what degree of assu-rance?
Productcharacteristics
Suppliercharacteristics
Degree ofassurance
(Continously update)
Needs
Outcome
(Select & execute)
Productcriticality
rating
Securityassurance
instruments(e.g. auditing,certification)
Figure 1: Product criticality rating, formed by the
product characteristics, supplier characteristics and
the degree of assurance.

Innovating in Cyber Security – Shared research 2019 | 47
guidelines, best practices and even tooling that
deals with the subject. Most of the literature we
analyzed, deals with topics from the perspective
of doing things more accurately and thoroughly.
In contrast, our aim has been to do things smarter
and more efficient. The literature served as a great
starting point for the structure to adopt in the
tooling and as a way of coming up with the right
questions to ask.
Among others, we adopted the third-party
security management model as presented by
Nokia (depicted in Figure 2) during the ‘Third
Party & Supply Chain Cyber Security Summit’
conference (Frankfurt, 2018). This model does a
good job at capturing the different phases of a
third-party relationship. For our methodology,
it served as an overview of the different phases in
which security governance and assurance
instruments can be used.
Although there is a variety of tools that deal with
third-party security management, we have yet to
find one that solves the problem that is addressed
in this research. Relevant survey tools exist even
specific to the topic of vendor management (e.g.
Google Vendor Security Assessment Questionnai-
res )1, but none seem to provide the desired
capabilities (e.g. aggregation of results, dashboard
overview, etc.) that fill the need of this project,
which will be further outlined hereafter.
Designing a practical toolThe first version of the tool is implemented in an
Excel workbook. The workbook consists of a
dashboard overview (Figure 3) as well as sheets
with multiple-choice questions to be answered
by the user. The questions are divided into three
sections: product characteristics, vendor characte-
ristics and degree of assurance. The list of
questions is provided in Figure 4. It is important
to note that the questions and their answers are
deemed specific to the financial institutions and
that these will likely need to be different for other
industries. The product and vendor characteristics
sections can be seen as a bare-minimum risk
assessment, where a higher outcome increases
the overall product criticality estimate. The degree
of assurance section consists of a set of questions
to determine the assurance measures that are
already in place, which may thereby compensate
for the former two sections. In other words;
scoring positively on the degree of assurance
lowers the overall criticality score. This works
intuitively, as the product criticality score is used
to determine whether or not action should be
taken; when a higher degree of assurance is
already achieved, there is a lesser need for
further action.
The Excel prototype served as a convenient tool to
validate the set of questions and scoring mecha-
nism used to determine a product criticality score.
The challenge is to find an imple-mentation that is insightful yet keeps the effort required by organizations to a bare mini-mum.
Figure 2: Third-party security management model adapted from the model presented by Nokia during the
Third Party & Supply Chain Cyber Security Summit (Frankfurt, 2018).
Supplier qualificationand selection
RFI check
Low risk
Medium risk
High risk
Information securityrisk assessment (RAT)
1. Contractual requirements
Baseline requirements(NSR 6.0)
Optional advancedrequirements
2. Security assessment
3. Awareness delivery
Secure information sharingpractices
4. Critical informationplatform
Security relationship
Secure Nokia assets
Change risk management
5. Risk monitoring
Negotiation & contractcreation
Ramp up operationswith a supplier
Ongoingoperations
Controlledphase-outProcess key
Supplier lifecycle processRisk based controlsSecurity activities
1 https://github.com/google/vsaq

48 | Innovating in Cyber Security – Shared research 2019
Both the list of questions and the scoring mecha-
nism were improved over several iterations and
were tested using a set of representative use-ca-
ses. The validation showed that it was possible to
quickly obtain a useful indication of the product
criticality. The use-cases that were examined first
were that of actual products used in operation.
These scored low in overall criticality, which is in
line with expectations, as they and their vendor
are either trusted or appropriate assurance
measures have already been taken. To validate
the tool for more extreme scenarios that were
not present among the real-life cases, it was also
tested using mock data that was considered
representative for other more critical products
and less-reputable companies. While official
validation is yet to be done, the outcomes proved
intuitive and the tool satisfyingly captured the
extremes, thereby showing potential for actual
implementation. The next step to more accurately
determine the usefulness and applicability of the
methodology is to conduct a systematic and more
widespread evaluation, preferably carried out by
actual end-users during operation.
The validation showed that it was possible to quickly obtain a useful indication of the product criticality.
Figure 3: Dashboard overview of the Excel tooldegree of assurance.

Innovating in Cyber Security – Shared research 2019 | 49
The second stage of this research, which is
currently ongoing, focuses on a new, improved
version of the tooling. The Excel tool, although
useful, is rather inflexible and the use of a
dedicated workbook for every product makes it
difficult to analyze and compare results on a larger
scale. The new version is designed as a dedicated
web-based environment and is largely built from
scratch. This new environment makes it more
accessible for users while also greatly facilitating
the addition of features and changing of existing
functionality. Most importantly, this approach
enables a dynamic, centralized environment that
collects results in a single database, thereby
providing a solid basis for creating aggregated
views or summaries of the data.
Among the added functionalities are a dashboard
overview with aggregated information, dynamic
questions, form validation, a management
summary and settings to control both the content
and the framework (part of the functionalities are
depicted in Figure 5). These functionalities are
there to create an intuitive design, the prevention
of errors and more valuable insights with less user
efforts. The settings are there such that the tool
can easily be tuned towards specific needs and to
adapt to changing insights. The modular design of
the framework itself makes it easy to add or
change functionalities over time.
This approach enables a dyna-mic, centralized environment that collects results in a single database, thereby provi-ding a solid basis for creating aggregated views or sum-maries of the data.
Figure 4: Question list to assess the product criticality rating for financial institutions; product characteristics,
vendor characteristics and degree of assurance
A. Product characteristics
A1. What is the nature of the product
or service that is acquired
(hereafter simply denoted as
‘product’)?
A2. Are the contractual conditions set
by the own party or established
by the supplier?
A3. What is the nature of the business
process in which the product is
employed?
A5. To what extend will the continuity
of the business process rely on
the product?
A6. What best describes the data that
will be processed by the product?
B. Vendor characteristics
B1. Will the supplier gain autono-
mous access to internal infra-
structure?
B2. Will the supplier get autonomous
access to the data (as described
in A6)?
B3. Are there reasons to question the
supplier’s competence or intent?
C. Degree of assurance
C1. Are there relevant certificates or
TPAs in place?
C2. Do the available certificates or
TPAs cover all security require-
ments?
C3. Are there arrangements in place
to address requirements not
covered by certificate or TPA?
C4. What best describes the score
and trend of the third-party
security rating?
C5. Have any material deficiencies
been observed in the past
12 months? (e.g. audit, report,
dialogue)

50 | Innovating in Cyber Security – Shared research 2019
Conclusions and future workThird-party management is a challenging task
due to the widespread dependencies and highly
dynamic environment. Gaining insight in the
degree of assurance to help determine whether or
not further measures should be taken is a difficult
and time-consuming process. To deal with the
limited time and resources that are available,
it is important to base assurance requirements
and the amount of control on the criticality of a
product and its vendor in relation to the business
processes. The assurance measures and the
importance to the business should thereby always
be balanced. We designed a methodology to make
this trade-off insightful and implemented this in
a practical tool.
The final stage of this work will deal with end-user
validation. This will be the final proof of the tool’s
operational usefulness as well as a possibility to
further refine its functionality. When finalized,
the tool may serve as a guideline for operational
management in day-to-day use.
Gaining insight in the degree of assurance in relation to product and vendor criticality is a problem that transcends the financial do-main.
Figure 5: Overview of web-tool design. From left to right, top to bottom; dashboard overview, dynamic
questions, form validation, aggregation of assessments
Gaining insight in the degree of assurance in
relation to product and vendor criticality is a
problem that transcends the financial domain.
The general structure and method described in
this article are applicable to any organization
that deals with third-party management and may
therefore be useful for a broader public. Future
work may be done in order to gain insight in the
potential differences that exist and assess what is
required in order to bridge the gap.

Innovating in Cyber Security – Shared research 2019 | 51
IntroductionCyber attacks are getting more and more advan-
ced and targeted. The traditional eggshell model
of a hardened perimeter and a more or less open
internal network is no longer sufficient (ClearSky
2018). In this research, we assume that a security
breach already took place, and we investigated
how it can be detected using internal network
traffic (Beukema 2017). In fact, we focus on
finding anomalies (i.e. deviations from normal
behavior) in internal network communication
patterns which may be an indication of lateral
movement in the Cyber attack kill chain (Cutler
2010). To this end, the generic Anomaly-Based
Clustering (ABC) toolkit has been developed.
It has the following key features:
• Applicable to data commonly available in IT
environments (e.g. internal DNS, internal
Netflow, file access logs). In fact, we use
available data sources to model internal
enterprise networks; we specifically focus on
which end points (hosts) communicate with
each other, and how much. The data does not
need to be labeled with cyber attacks.
• Automatic clustering of hosts in the network
with similar communication patterns.
• Statistical modeling of normal communication
behavior between clusters.
Detecting Lateral Movement with Anomaly- Based Clustering Alex Sangers (TNO), Erik Meeuwissen (TNO), Kadir Kalayci (Achmea)
We focus on finding anoma-lies (i.e. deviati-ons from normal behavior) in internal network communication patterns which may be an indication of lateral move-ment in the cyber attack kill chain.

52 | Innovating in Cyber Security – Shared research 2019
• Detecting when individual end points start to
deviate from the baseline of normal behavior.
Typically, such deviations may indicate network
misconfigurations as well as lateral movement
as part of a Cyber attack.
• Internal network visualization and anomaly
visualization to support SOC analysts and threat
hunters.
The ABC toolkit supports anomaly detection and
threat hunting [SQRRL 2018]. For example, by
starting from a specific hypothesis of how a
successful Cyber attack on an organization could
take place, it can be used to search for such an
attack. Thus, it can be considered as an extra line
of defense to complement real-time detection
based on signatures or blacklists.
The remainder of this paper is organized as
follows. First, we describe the rationale behind
Anomaly Based Clustering. Then, we describe the
process steps supported by the ABC toolkit. Next,
we describe the experimental validation with a
real-life dataset consisting of file access logs.
Finally, we end with conclusions.
Rationale behind clustering of hostsOne of the research challenges for anomaly
detection in internal network communications
traffic is to create a useful model of normal
behaviour. As individual hosts typically behave
relatively unpredictable, the ABC toolkit models
groups of hosts (i.e. clusters) with similar commu-
nication behavior. This helps to reduce false
positives caused by irregular behaviour of
individual hosts. Moreover, it improves scalability
such that large networks can be modelled (e.g.
more than 100.000 end points).
Process steps supported by the ABC toolkitWhen using the ABC toolkit, a threat hunting
hypothesis must be developed. To effectively use
the ABC toolkit, the hypothesis should consist of
attack steps such as lateral movement or internal
data exfiltration. The threat hunting scenario
might also depend on the availability of data
sources on the internal network. The attack
(steps) should hypothetically impact available
data. The ABC toolkit approach consists of the
following six phases:
1 Data selection. Define a threat hunting scenario and find data
where deviating communication patterns between
source and destination addresses might indicate
an attack. The data should consist of information
on what systems communicating with what
systems with what volume. Some examples of
suitable data sources for threat hunting scenarios:
a. Based on Netflow data, e.g. port 1433 for
detection of anomalous connections to SQL
servers.
b. Based on file access data: detection of anoma-
lous file path attempts.
c. Based on DNS data: detection of anomalous
A-queries of hosts to the DNS resolver
2 Data parsing. Filter, clean and process the input data to a format
that can be interpreted by the subsequent
modules of the ABC toolkit. Examples of filtering
are IP addresses that are expected to behave
anomalously by nature, and data that is irrelevant
for the threat hunting scenario.
3 Clustering and network visualization.
The selected clustering technique is called
Louvain clustering [Blondel 2008]. Louvain
clustering is a community detection algorithm
that groups hosts that are strongly interconnected
between themselves in a cluster, and less strongly
connected to other clusters. The clustering is
automatically determined based on the communi-
cation patterns in the historical (network) data.
4 Clustering and cluster modelling.
The Louvain clustering ensures that hosts within a
cluster are strongly interconnected. Traffic within a
cluster is assumed to be normal. Traffic between
clusters is considered to be interesting to monitor.
Each cluster has so-called inter-cluster communi-
cation models that captures the normal traffic
between that cluster and other clusters. The
inter-cluster communication models are statistical
models of communication between clusters based
on training data.
As individual hosts typically behave relatively unpredictable, the ABC toolkit models groups of hosts (i.e. clusters) with similar commu-nication behavi-or.

Innovating in Cyber Security – Shared research 2019 | 53
5 Anomaly detection. Compare the inter-cluster communication models
with new (test) data to find deviating communica-
tion patterns between hosts in different clusters.
A sudden increase of inter-cluster communication
might indicate a host is deviating from its normal
behaviour. The ABC toolkit detects three types of
anomalies:
a. A host with a statistically significant increased
amount of traffic to hosts in another cluster.
b. A host that communicates to hosts in another
cluster, although no communication between
the corresponding two clusters existed in the
inter-cluster communication models.
c. A host communicates to hosts that were not
present in the inter-cluster communication
models at all.
The output of this module is a prioritized list of
(anomalous) hosts.
6 Anomaly inspection. Zoom into the behaviour of individual anomalous
hosts. Both the inter-cluster communication
model of the host and the communication during
testing are visualized and can be compared. In
addition to the visualization, a text file providing
the corresponding data rows has been generated
to support actionable follow-up.
The process steps are visualized in Figure 1.
Experimental validation for the use case file ac cess logsTo apply the ABC toolkit to several use cases,
it is important to understand the modelling and
detection approach to determine what use case
to develop. The use case should consist a threat
hunting scenario including the available data
source with (internal) source and destination
addresses.
File access data consists of data on at what time
what user was trying to access which file location.
It is also includes whether the user was reading,
writing or executing the file and whether this was
a successful attempt or not. We executed an
experiment with real-life file access data to
identify hosts that had anomalous file access
attempts.
1 Data selection. We used file access data with user ID as source
address and file path as destination address. The
threat hunting hypothesis is that an adversary is
already inside and scanning for commercially or
privacy sensitive data that is stored on one or
more file servers. Deviations in file access data
indicate that a user is attempting to access file
paths more often than usual or attempting to
access other file paths than usual. This behaviour
might be caused by a fraudulent employee or an
adversary that is gathering data.
File access data consists of information on whether the user was reading, writing or execu-ting the file and whether this was a successful attempt or not.
Non-anomalous training data
Non-anomalous training data
Potentially anomalous test data
Inter-cluster com-municationmodels
Anomaly list
Visualization• PDF• Interactive
Generic data format
1 Data selection
Internal NetFlow
Internal DNS logs
File access logs
…
2 Data parsing
5 Anomaly detection
3 Clustering & Network
visualization
6 Anomaly inspection
4 Clustering & Cluster
modelling • Data describes internal network patterns of hosts • Deviating patterns may indicate attack
• Towards generic input • Remove corrupt lines• Filtering
• Assess cluster stability• Identify disturbing host behaviour
• Model the normal internal network patterns of clustered hosts
• Compare test data to the models • Anomaly list with three anomalous pattern types
• Why is a host identified as anomalous • Context of a host
• PDF visualization• Host inspection information
Figure 1: The process steps of the ABC tooling.

54 | Innovating in Cyber Security – Shared research 2019
2 Data parsing. The data was filtered on some anomalous systems
that are anomalous due to their functionality, and
corrupt data rows were removed. Additionally, the
data was formatted to the generic format. The
training data is based on file access data of the
first half of a working day (12 hours) and the test
data is based on the second half of that working
day (12 hours).
3 Clustering and network visualization.
The community detection of the file access
training data is shown in Figure 3. Each node in
the graph represents a user or file path and each
colour represents a community. Note that many
separate small communities exist, meaning that
many users only accessed limited number of file
paths and that many file paths were accessed by
only a limited number of users. In the middle of
the graph a larger number of nodes are connec-
ted. There exist a small number of communities
within this middle part. This indicates that there
are users and file paths connecting all together,
but some parts are more connected than others.
In Figure 3, we recognize some similar patterns
but there are some differences on first sight.
Firstly, more nodes are present, indicating more
users and/or file paths present in the second data
set. Secondly, the middle part that is connected
has more nodes but similar number of clusters
that are identified.
For the sake of experimentation the clusters were
deemed to be sufficiently similar based on visual
inspection of these figures.
4 Clustering and cluster modelling.
The first half of the working day, shown in Figure
3, was used as training data to develop a baseline.
The baseline consists of inter-cluster communica-
tion models that provide a statistical analysis on
the communication of hosts between clusters.
5 Anomaly detection. The inter-cluster communication models as
developed in the previous step were compared to
the test data as visualized in Figure 1. The result is
a list of anomalous user IDs. The most anomalous
host was assigned to cluster 683 and has a
significantly increased number of file path visits,
attempts to access file path that were not visited
by its cluster during the training period and it also
visits file paths that were not seen in the training
period yet.
6 Anomaly inspection. Zooming into the behaviour of the anomalous
host shows what communication was anomalous.
The anomalous host was assigned to cluster 683
and that cluster has had some communication to
cluster 44 during the training period (Figure 4).
During the testing period, the anomalous host in
cluster 683 started visiting significantly more file
paths belonging to cluster 44, started accessing
file paths in cluster 700, which did not occur in
training period, and started visiting new file paths
that were not even present in training data,
represented by cluster 701. This is shown in
Figure 5.
Many users only accessed a limited number of file paths and many file paths were accessed by only a limited number of users.
Figure 3: Cluster visualization of file access data of
the second half of a working day.
Figure 2: Cluster visualization of file access data of
the first half of a working day.
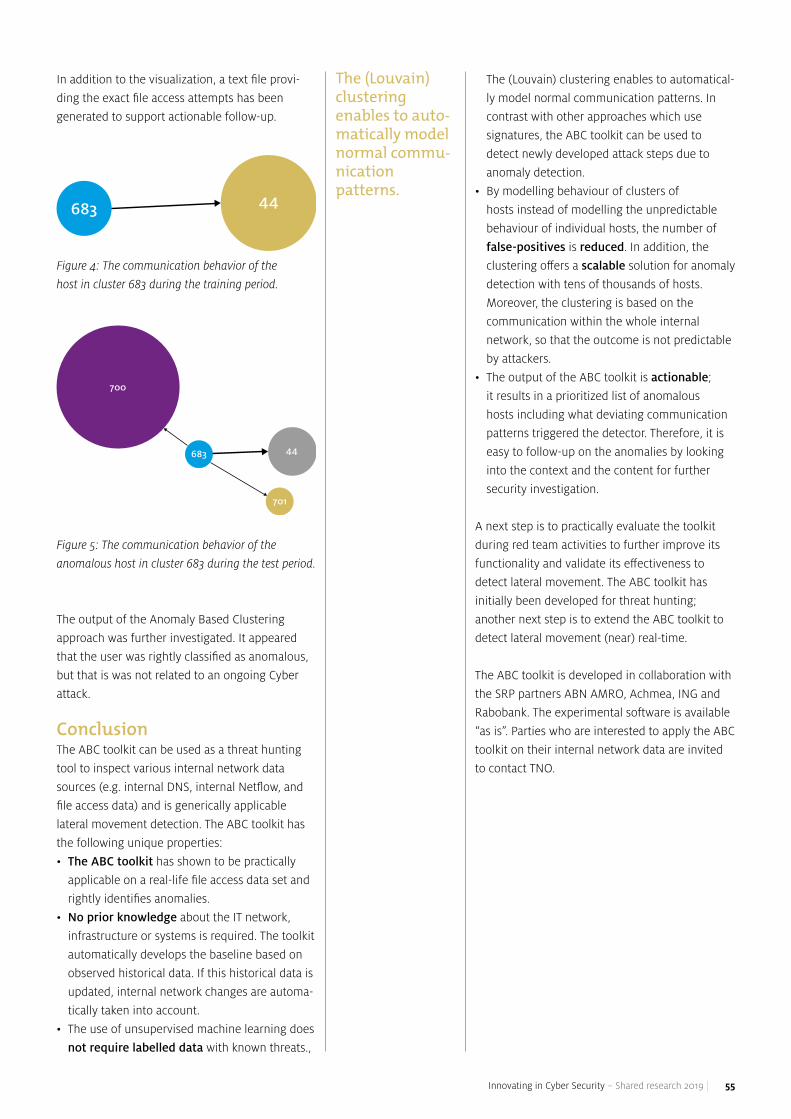
Innovating in Cyber Security – Shared research 2019 | 55
In addition to the visualization, a text file provi-
ding the exact file access attempts has been
generated to support actionable follow-up.
Figure 4: The communication behavior of the
host in cluster 683 during the training period.
Figure 5: The communication behavior of the
anomalous host in cluster 683 during the test period.
The output of the Anomaly Based Clustering
approach was further investigated. It appeared
that the user was rightly classified as anomalous,
but that is was not related to an ongoing Cyber
attack.
ConclusionThe ABC toolkit can be used as a threat hunting
tool to inspect various internal network data
sources (e.g. internal DNS, internal Netflow, and
file access data) and is generically applicable
lateral movement detection. The ABC toolkit has
the following unique properties:
• The ABC toolkit has shown to be practically
applicable on a real-life file access data set and
rightly identifies anomalies.
• No prior knowledge about the IT network,
infrastructure or systems is required. The toolkit
automatically develops the baseline based on
observed historical data. If this historical data is
updated, internal network changes are automa-
tically taken into account.
• The use of unsupervised machine learning does
not require labelled data with known threats.,
The (Louvain) clustering enables to automatical-
ly model normal communication patterns. In
contrast with other approaches which use
signatures, the ABC toolkit can be used to
detect newly developed attack steps due to
anomaly detection.
• By modelling behaviour of clusters of
hosts instead of modelling the unpredictable
behaviour of individual hosts, the number of
false-positives is reduced. In addition, the
clustering offers a scalable solution for anomaly
detection with tens of thousands of hosts.
Moreover, the clustering is based on the
communication within the whole internal
network, so that the outcome is not predictable
by attackers.
• The output of the ABC toolkit is actionable;
it results in a prioritized list of anomalous
hosts including what deviating communication
patterns triggered the detector. Therefore, it is
easy to follow-up on the anomalies by looking
into the context and the content for further
security investigation.
A next step is to practically evaluate the toolkit
during red team activities to further improve its
functionality and validate its effectiveness to
detect lateral movement. The ABC toolkit has
initially been developed for threat hunting;
another next step is to extend the ABC toolkit to
detect lateral movement (near) real-time.
The ABC toolkit is developed in collaboration with
the SRP partners ABN AMRO, Achmea, ING and
Rabobank. The experimental software is available
“as is”. Parties who are interested to apply the ABC
toolkit on their internal network data are invited
to contact TNO.
The (Louvain) clustering enables to auto-matically model normal commu-nication patterns.
683 44
683 44
701
700

56 | Innovating in Cyber Security – Shared research 2019
Bibliography[Beukema 2017] Beukema, W.J.B., Attema, T.,
Schotanus, H.A. 2017. “Internal network monitor-.”
Proceedings of the 3rd International Conference
on Information Systems Security and Privacy.
SciTePress. 694-703.
[Blondel 2008] Blondel, V.D., Guillaume, J.,
Lambiotte, R., Lefebvre, E. 2008. “Fast unfolding
of communities in large networks.” Journal of
Statistical Mechanics.
[ClearSky 2018] ClearSky. 2018. Cyber Intelligence
Report 2017. Technical Report, ClearSkye Cyber
Security Ltd.
[Cutler 2010] Cutler, T. 2010. Anatomy of an
advanced persistent threat. Accessed May 2019.
http://terrycutler.com/news/securityweek%20
-%20anatomy-advanced-persistent-threat.pdf.
[SQRRL 2018] SQRRL. 2018. “A Framework for
Cyber threat hunting.”
Next step is to practically evaluate the toolkit during red team activi-ties to further improve its functionality.

Innovating in Cyber Security – Shared research 2019 | 57

58 | Innovating in Cyber Security – Shared research 2019
Colophon
© 2019 Participants in the Shared Research Program Cyber Security
EditorsReinder Wolthuis and Richard Kerkdijk
Contributing expertsABN AMRO: Brenda van het Hul, Christiaan de Groot, Ilona Scheerder,
Jenny Gershkovich, Luc Verholt, Maarten Zwaan, Mark Kazemier,
Mark Wiggerman, Martine Kea, Michael van den Berg, Olaf Streutker,
René Sibbel, Ron Luttik, Sander Oerlemans, Shairesh Algoe, Steven Raspe,
Ton Poppe
Achmea: Daniël Gorter, Fleur Bello, Kadir Kalayci, Marco Simmers,
Mike Couwenbergh, Rob Faber, Robert Smit, Rogier Reemer,
Tom Huitema
ING: Bob Bekker, Florian Schneider, Isik Yavuz, Leonie Schouwenaar,
Mirna Bognar, Oscar Bloemen, Pieter Siedsma, Rene Scholte,
Rianne Lieuwens, Ruud Zwan, Sander van de Kolk, Sander Zeijlemaker
Rabobank: Arnold Schekkerman, Bert van Ingen, Eric Kaasenbrood,
Gauke Witteveen, Hein Laan, Henny van de Pavert, Jan Veldsink,
Kees Hoogewoning, Leonie Schouwenaar, Marco van der Kraan,
Paul Samwel, Walter Leemhuis
TNO: Alex Sangers, Anne-Marie Brouwer, Bart Gijsen, Daniël Worm,
Erik Meeuwissen, Frank Fransen, Frank Phillipson, Frank Schuren,
Gabriele Spini, Harm Schotanus, Hidde-Jan Jongsma, Hiddo Hut,
Jeffrey Panneman, Maran van Heesch, Marie Beth van Egmond,
Mark Buningh, Peter Langenkamp, Pieter Venemans, Piotr Zuraniewski,
Reinder Wolthuis, Richard Kerkdijk, Robert Seepers, Thijs Veugen,
Thomas Attema, Wieke Oldenhof, Wouter Langenkamp
Volksbank: Paul Gloudemans, Peter Rochat, Peter Wijkmans, Rob van Os,
Ron Werther, Sijmen Veenstra
Illustrations: jamvisualthinking.com
Design: PI&Q grafisch ontwerp
Print: Zalsman BV
CopyrightAll rights reserved. No part of this document may be reproduced and/or
published in any form by print, photoprint, microfilm, website or any
other means without previous written permission.

Innovating in Cyber SecurityShared research 2019