initiation: underrated geothermal powerhouse 1...
TRANSCRIPT
See important disclosures, including any required research certifications, beginning on page 36
■ Investment case We initiate coverage on Energy Development Corp (EDC) with a Buy (1) rating. Year to date, the shares have fallen by 6%, and we see the current share price weakness as a good buying opportunity – we forecast EDC to post EPS growth of 11-19% YoY for 2015-16, driven primarily by 194MW of new capacity added over the past year.
World leader in geothermal energy and diversified renewable energy (RE) player. Often seemingly overlooked by investors, EDC is the world’s largest integrated geothermal firm and is among the few with end-to-end expertise in geothermal energy. This allows it to lead exploration domestically and overseas. In October 2015, it will conduct its first major drilling overseas, in Chile. Aside from geothermal power, EDC has diversified into hydro, solar and wind power over the past 7 years. These ventures have added 233MW in
capacity, bringing EDC’s portfolio to 1,402MW. From around 3% for 2014, we expect these businesses to account for 14% of net profit in 2016E. Stronger after recent issues. EDC’s operations and earnings have fully recovered from past setbacks, in our view, adding 194MW over the past year. These developments were reflected in EDC’s 40% YoY net profit growth, and the stock’s 54% gain in 2014, and should continue to boost net profit until end-2016E. Moving forward, EDC has identified 7 new domestic projects with indicative capacity of 188MW. ■ Catalysts The share price has recovered from its YTD low of PHP7.22 on 8 July 2015. We identify these positive catalysts, which should continue to support its rebound over the next 12 months: 1) removal of transmission-line constraints at Burgos Wind, 2) construction of Bacman 3, and 3) good results from its Chile drilling. ■ Valuation We initiate with an SOTP-based 12-month TP of PHP9.24, implying upside potential of 20%, in addition to a 2016E dividend yield of 2.9%. The stock is trading currently at respective 2015-16E PERs of 14.2x and 12.0x, which are below the regional averages of 16.0x and 12.7x,
respectively (Bloomberg consensus and Daiwa forecasts). ■ Risks The main downside risks to our call would be operational risks due to natural disasters and steam field/power plant issues.
Utilities / PhilippinesEDC PM
24 July 2015
Energy Development
Initiation: underrated geothermal powerhouse
• Has added 194MW over the past year, which should boost EPS growth in 2015E (+11% YoY) and 2016E (+19% YoY)
• End-to-end technical expertise in geothermal power serves as a platform for exploration and expansion
• Recent share-price pullback presents a buying opportunity; coverage initiated with a Buy (1) rating and TP of PHP9.24
Source: FactSet, Daiwa forecasts
Utilities / Philippines
Energy DevelopmentEDC PM
Target (PHP): 9.24Upside: 20.0%24 Jul price (PHP): 7.70
Buy (initiation)
OutperformHoldUnderperformSell
1
2
3
4
5
95
105
115
125
135
6.0
6.8
7.5
8.3
9.0
Jul-14 Oct-14 Jan-15 Apr-15 Jul-15
Share price performance
Energy Dev (LHS)Relative to PCOMP Index (RHS)
(PHP) (%)
12-month range 6.14-8.96Market cap (USDbn) 3.183m avg daily turnover (USDm) 3.32Shares outstanding (m) 18,750Major shareholder Lopez Group (50.6%)
Financial summary (PHP)Year to 31 Dec 15E 16E 17ERevenue (m) 34,118 37,273 39,211Operating profit (m) 16,305 17,917 18,572Net profit (m) 10,160 12,066 12,921Core EPS (fully-diluted) 0.542 0.644 0.689EPS change (%) 10.6 18.8 7.1Daiwa vs Cons. EPS (%) (4.1) (1.1) (3.8)PER (x) 14.2 12.0 11.2Dividend yield (%) 2.6 2.9 3.5DPS 0.200 0.224 0.266PBR (x) 3.0 2.6 2.2EV/EBITDA (x) 9.5 8.7 8.2ROE (%) 22.4 23.0 21.4
Bianca Solema(63) 2 737 [email protected]
How do we justify our view?How do we justify our view?
Utilities / Philippines EDC PM
24 July 2015
- 2 -
Investment thesis ........................................................................................................................... 6
Underrated geothermal powerhouse .......................................................................................... 6
Key catalysts ................................................................................................................................. 7
A world leader in geothermal energy ............................................................................................. 8
Largest integrated geothermal company .................................................................................... 8
Coming out stronger from recent trials ...................................................................................... 9
Evolving into a diversified pure-play RE company ...................................................................... 11
Diversified into hydro, solar and wind power generation ......................................................... 11
Mid- and long-term growth opportunities in sight ...................................................................... 14
Maximising domestic resources ................................................................................................ 14
Leading overseas exploration .................................................................................................... 15
Predictable cash flow with upside from new projects .................................................................. 17
Long-term contracts provide stable and predictable cash flow ................................................ 17
New initiatives to deliver growth ............................................................................................... 18
Valuation: undemanding with attractive prospects .................................................................... 20
TP of PHP9.24 offers upside potential of 20% ......................................................................... 20
Cheap among its peers .............................................................................................................. 22
Sensitivity analysis .................................................................................................................... 24
Key risks ........................................................................................................................................ 25
Appendix I: company profile ......................................................................................................... 27
Appendix II: geothermal energy .................................................................................................. 29
Appendix III: Philippine power industry ..................................................................................... 30
Support for RE sector in the Philippines .................................................................................. 30
Power-supply demand scenario ................................................................................................. 31
Contents

Utilities / Philippines EDC PM
24 July 2015
- 3 -
Growth outlook EDC: recurring net profit after preferred dividends (PHPm)
In 2014, EDC posted record-high recurring net profit (after preferred dividends) of PHP9.19bn, up a robust 40% YoY, mainly on the back of the partial return-to-service of Bacman and commercial operations of the Nasulo plant. For 2015E and 2016E, we still expect the company to post double-digit profit growth, albeit at a lower rate than in 2014. We forecast 11% YoY growth for 2015 to PHP10.16bn still driven by Nasulo and the partial operations of Bacman. By 2016, a full contribution from Burgos Wind and Bacman, together with the return-to-service of one unit of Tongonan plant, should lift EDC’s earnings to PHP12.07bn, up 19% YoY.
Source: EDC, Daiwa forecasts
Valuation EDC: 12-month forward PER bands
Separately valuing each RE technology using the DCF method, we arrive at our SOTP-based 12-month target price of PHP9.24. This is computed using a WACC of 8.26% and terminal growth of 3%, and implies upside potential of 20%, in addition to a dividend yield of 2.9% in 2016E. EDC is trading currently at a PER discount to its regional peers in the power generation sector. Based on its closing price of PHP7.70/sh on 24 July 2015, the stock was trading at a 2015E PER of 14.2x and 12.0x for 2016E, which are well below the regional averages, as forecast by the Bloomberg consensus, of 16.0x and 12.7x, respectively.
Source: Daiwa, Bloomberg, EDC
Earnings revisions EDC: Bloomberg consensus 2015 adjusted EPS forecasts
The Bloomberg consensus lowered its adjusted 2015 EPS forecast from a high of 0.68 in February to PHP0.57 in June, which we attribute to the factoring in of continued transmission line constraints for Burgos Wind, lower rates from the repricing of the contracts of a subsidiary, as well as the repairs to one unit at the Tongonan plant. Our core EPS forecast of PHP0.54 for 2015 is slightly lower than that of the consensus, but still implies YoY growth of 11%. Following the consensus downgrades, EDC’s share price has fallen by 6% YTD. Given our EPS growth forecast of 19% YoY for 2016, we believe the current share-price weakness instead presents a buying opportunity.
Source: Bloomberg
How do we justify our view?
Growth outlook
Valuation
Earnings revisions
8,514
6,558
9,190 10,160
12,066 12,921
14,019
2012 2013 2014 2015E 2016E 2017E 2018E
-23%+92% +40% +11% +19% +7% +9%
0
2
4
6
8
10
12
14
16
Dec-08 Dec-09 Dec-10 Dec-11 Dec-12 Dec-13 Dec-14
(PHP/sh)
4.9x
9.8x
14.7x
19.6x
24.5x
-
2.00
4.00
6.00
8.00
10.00
0.50
0.55
0.60
0.65
0.70
Jun-14 Sep-14 Dec-14 Mar-15 Jun-15
(PHP/sh)(PHP/sh)
2015 EPS (LHS) Price (RHS)
Buy (initiation)
OutperformHoldUnderperformSell
1
2
3
4
5

Utilities / Philippines EDC PM
24 July 2015
- 4 -
Key assumptions
Profit and loss (PHPm)
Cash flow (PHPm)
Source: FactSet, Daiwa forecasts
Year to 31 Dec 2010 2011 2012 2013 2014 2015E 2016E 2017EInflation (YoY%) 3.80 4.70 3.10 2.90 4.20 3.60 3.10 3.50
Consolidated volume sales incl. ancillary services (GWh)
7,548.6 7,072.0 7,518.0 6,781.0 7,832.4 8,363.3 8,677.8 8,795.0
Ave price of geothermal energy sales (PHP/kWh)
3.18 3.37 3.59 3.70 3.91 3.91 4.07 4.23
Year to 31 Dec 2010 2011 2012 2013 2014 2015E 2016E 2017ESale of electricity 22,944 24,540 28,369 25,656 30,867 34,118 37,273 39,211Sale of steam 1,209 0 0 0 0 0 0 0Other Revenue 749 0 0 0 0 0 0 0Total Revenue 24,902 24,540 28,369 25,656 30,867 34,118 37,273 39,211Other income 0 0 0 0 0 0 0 0COGS (10,474) (7,382) (6,629) (6,234) (7,650) (7,904) (8,504) (8,930)SG&A (4,529) (4,398) (4,319) (3,964) (5,329) (4,795) (5,200) (5,454)Other op.expenses (3,445) (3,442) (3,579) (3,569) (4,079) (5,114) (5,654) (6,255)Operating profit 6,454 9,318 13,841 11,889 13,809 16,305 17,917 18,572Net-interest inc./(exp.) (3,361) (3,716) (3,339) (3,090) (3,569) (4,540) (4,178) (3,865)Assoc/forex/extraord./others 4,601 (402) 411 (859) 317 0 0 0Pre-tax profit 7,694 5,199 10,913 7,940 10,556 11,765 13,738 14,707Tax (777) 115 (775) (486) (1,223) (1,246) (1,260) (1,343)Min. int./pref. div./others (287) (871) (1,624) (896) (144) (359) (412) (444)Net profit (reported) 4,108 (167) 8,995 4,732 11,674 10,160 12,066 12,921Net profit (adjusted) 6,630 4,443 8,514 6,558 9,190 10,160 12,066 12,921EPS (reported)(PHP) 0.219 (0.009) 0.480 0.252 0.623 0.542 0.644 0.689EPS (adjusted)(PHP) 0.354 0.237 0.454 0.350 0.490 0.542 0.644 0.689EPS (adjusted fully-diluted)(PHP) 0.354 0.237 0.454 0.350 0.490 0.542 0.644 0.689DPS (PHP) 0.120 0.160 0.140 0.160 0.200 0.200 0.224 0.266EBIT 6,454 9,318 13,841 11,889 13,809 16,305 17,917 18,572EBITDA 9,899 12,760 17,420 15,458 17,888 21,419 23,570 24,827
Year to 31 Dec 2010 2011 2012 2013 2014 2015E 2016E 2017EProfit before tax 7,694 5,199 10,913 7,940 10,556 11,765 13,738 14,707Depreciation and amortisation 3,445 3,442 3,579 3,569 4,079 5,114 5,654 6,255Tax paid (200) (444) (563) (695) (637) (1,230) (1,260) (1,343)Change in working capital 694 1,580 494 (466) (1,985) 3,102 (361) (54)Other operational CF items 2,907 4,134 2,303 4,088 4,075 4,543 4,186 3,870Cash flow from operations 14,540 13,911 16,726 14,437 16,089 23,295 21,957 23,434Capex (5,948) (9,418) (7,180) (11,718) (18,617) (16,330) (16,388) (12,846)Net (acquisitions)/disposals (1,280) 5 (162) (102) (450) 0 0 0Other investing CF items (552) (1,488) (1,172) 1,019 (1,585) 0 0 0Cash flow from investing (7,779) (10,901) (8,515) (10,801) (20,652) (16,330) (16,388) (12,846)Change in debt (6,011) 10,329 (1,353) 7,908 10,624 5,643 (4,199) (1,993)Net share issues/(repurchases) 0 0 0 0 0 0 0 0Dividends paid (2,496) (3,341) (4,495) (3,959) (4,416) (3,758) (4,215) (4,999)Other financing CF items (3,285) 441 676 495 242 8 63 15Cash flow from financing (11,792) 7,429 (5,172) 4,445 6,451 1,894 (8,352) (6,977)Forex effect/others (32) 25 (4) 19 0 0 0 0Change in cash (5,031) 10,439 3,039 8,081 1,888 8,858 (2,783) 3,612Free cash flow 3,345 5,112 8,680 3,193 (4,563) 6,188 4,698 9,737
Financial summary

Utilities / Philippines EDC PM
24 July 2015
- 5 -
Balance sheet (PHPm)
Key ratios (%)
Source: FactSet, Daiwa forecasts
Company profile
Energy Development Corp (EDC) is a pure-play power generation company in the Philippines with capacity of 1,402MW. It is the largest integrated geothermal company in the world, but it also has ventures in hydro, wind and solar energy.
As at 31 Dec 2010 2011 2012 2013 2014 2015E 2016E 2017ECash & short-term investment 6,865 13,167 11,552 16,385 14,534 18,844 11,820 11,552Inventory 2,577 3,356 3,339 3,094 2,902 3,212 3,631 3,814Accounts receivable 4,602 3,411 4,116 3,611 6,888 6,956 7,532 7,901Other current assets 734 742 693 1,250 743 743 743 743Total current assets 14,779 20,676 19,700 24,340 25,067 29,755 23,725 24,010Fixed assets 57,850 58,764 62,284 68,621 85,875 97,205 108,054 114,760Goodwill & intangibles 4,543 4,705 4,818 4,400 4,543 4,428 4,314 4,200Other non-current assets 4,132 5,917 7,553 7,645 9,015 8,999 8,999 8,999Total assets 81,304 90,063 94,355 105,006 124,499 140,388 145,094 151,970Short-term debt 1,702 2,250 2,394 1,872 10,500 10,497 7,331 7,462Accounts payable 5,123 6,992 7,716 6,982 7,639 11,123 11,764 12,268Other current liabilities 661 79 140 54 112 112 112 112Total current liabilities 7,487 9,320 10,250 8,908 18,251 21,731 19,207 19,841Long-term debt 39,679 49,240 46,656 56,677 58,963 64,609 63,576 61,452Other non-current liabilities 1,899 2,516 2,741 3,176 3,666 3,666 3,666 3,666Total liabilities 49,065 61,076 59,647 68,761 80,879 90,006 86,448 84,959Share capital 25,110 25,111 25,122 25,127 25,130 25,130 25,130 25,130Reserves/R.E./others 5,560 1,659 7,516 9,112 17,000 23,410 31,269 39,198Shareholders' equity 30,670 26,770 32,638 34,238 42,130 48,540 56,399 64,328Minority interests 1,569 2,218 2,070 2,007 1,490 1,842 2,247 2,683Total equity & liabilities 81,304 90,063 94,355 105,006 124,499 140,388 145,094 151,970EV 180,460 184,915 183,943 188,546 200,794 202,478 205,708 204,419Net debt/(cash) 34,515 38,322 37,497 42,164 54,928 56,261 59,086 57,361BVPS (PHP) 1.636 1.428 1.741 1.826 2.247 2.589 3.008 3.431
Year to 31 Dec 2010 2011 2012 2013 2014 2015E 2016E 2017ESales (YoY) 12.8 (1.5) 15.6 (9.6) 20.3 10.5 9.2 5.2EBITDA (YoY) (0.6) 28.9 36.5 (11.3) 15.7 19.7 10.0 5.3Operating profit (YoY) (26.2) 44.4 48.5 (14.1) 16.1 18.1 9.9 3.7Net profit (YoY) (10.1) (33.0) 91.6 (23.0) 40.1 10.6 18.8 7.1Core EPS (fully-diluted) (YoY) (10.1) (33.0) 91.6 (23.0) 40.1 10.6 18.8 7.1Gross-profit margin 57.9 69.9 76.6 75.7 75.2 76.8 77.2 77.2EBITDA margin 39.8 52.0 61.4 60.3 58.0 62.8 63.2 63.3Operating-profit margin 25.9 38.0 48.8 46.3 44.7 47.8 48.1 47.4Net profit margin 26.6 18.1 30.0 25.6 29.8 29.8 32.4 33.0ROAE 22.3 15.5 28.7 19.6 24.1 22.4 23.0 21.4ROAA 8.3 6.1 11.1 7.5 8.1 7.9 8.7 9.0ROCE 22.4 15.5 28.8 19.7 24.1 22.5 23.0 21.4ROIC 8.5 5.6 10.1 7.2 8.6 8.3 9.3 9.6Net debt to equity 109.3 134.5 108.4 117.3 127.1 112.7 101.6 86.4Effective tax rate 10.1 (2.2) 7.1 6.1 11.6 10.6 9.2 9.1Accounts receivable (days) 73.9 59.6 48.4 55.0 62.1 74.0 70.9 71.8Current ratio (x) 2.0 2.2 1.9 2.7 1.4 1.4 1.2 1.2Net interest cover (x) 1.7 2.3 3.7 3.5 3.7 3.6 4.2 4.8Net dividend payout 41.4 50.0 30.3 50.3 40.2 40.0 40.0 40.0Free cash flow yield 2.3 3.5 6.0 2.2 n.a. 4.3 3.3 6.7
Financial summary continued …

Utilities / Philippines EDC PM
24 July 2015
- 6 -
Investment thesis
Underrated geothermal powerhouse
We initiate coverage of EDC with a Buy (1) rating and 12-month target price of PHP9.24, implying 20% upside potential. Moreover, the stock is trading currently at undemanding PER valuations of 14.2x for 2015E and 12.0x for 2016E, lower than the regional power generation sector averages of 16.0x and 12.7x, respectively, per the Bloomberg-consensus forecasts. EDC: SOTP valuation Equity
value EDC's stake
Attributable value
Value per share
(PHPm) (PHPm) (PHP/sh)Geothermal* 136,941 100% 136,941 7.30 Burgos Wind 23,003 100% 23,003 1.23 Burgos Solar 839 100% 839 0.04 FG Hydro 20,755 60% 12,453 0.66 Total 9.24
Outstanding common shares (m) 18,750
Source: Daiwa
Note: *Includes parent and others
We believe EDC’s market-leader position and technological expertise are underrated. It is the largest geothermal company in the world and one of only five companies that have full vertically integrated geothermal operations. Its expertise spans the entire geothermal value chain from exploration to power plant operations. It currently has over 1,169MW of installed geothermal capacity. EDC is also evolving into a diversified pure-play RE company. In addition to a 60% stake in FG Hydro, it recently completed the 150-MW Burgos Wind farm in November 2014 and the 4.1-MW Burgos Solar project in February 2015. Altogether, EDC’s attributable capacity is now 1,402MW, which accounts for 8% of the country’s total installed capacity as of end-2014. Good buying opportunity With EDC’s recovery from past setbacks reflected in its robust financial performance in 2014, the stock was one of the best-performing among the PSEi constituents in 2014, outperforming the market by more than 31pp. Year-to-date, however, the stock is down 6% and is lagging the market by 11.4pp.
EDC: share-price performance
Source: Bloomberg
We believe the current share-price weakness instead presents a good buying opportunity. Fundamentals remain intact with a healthy project pipeline of 7 identified domestic projects, equivalent to a total of 188MW, for the medium term and ongoing exploration overseas (Chile and Peru) for long-term earnings growth.
Double-digit growth as new projects begin to contribute In addition, we look for EDC’s core net profit to increase by 11% YoY for 2015E to PHP10.16bn, driven by fresh contributions from the 140-MW Bacman power plants which were brought back into service in 3Q14-1Q15 and the new 40-MW Nasulo plant. By 2016E, a full contribution from the 150-MW Burgos wind farm should boost our earnings forecast up by 19% YoY to PHP12.07bn. EDC: recurring net income after preferred dividends (PHPm)
Source: EDC, Daiwa forecasts
Technical backbone a unique platform for growth, in our view The company’s end-to-end expertise in geothermal energy which covers exploration up to power plant operations, allows it to lead greenfield exploration projects and maximise resources in existing concession areas. Aside from domestic undertakings, EDC is now
-
1,000
2,000
3,000
4,000
5,000
6,000
7,000
8,000
9,000
0
2
4
6
8
10
Dec-08 Dec-09 Dec-10 Dec-11 Dec-12 Dec-13 Dec-14
(PH
P/sh
)
EDC PM Equity PCOMP Index
8,514
6,558
9,190 10,160
12,066 12,921
14,019
2012 2013 2014 2015E 2016E 2017E 2018E
-23%+92% +40% +11% +19% +7% +9%
Utilities / Philippines EDC PM
24 July 2015
- 7 -
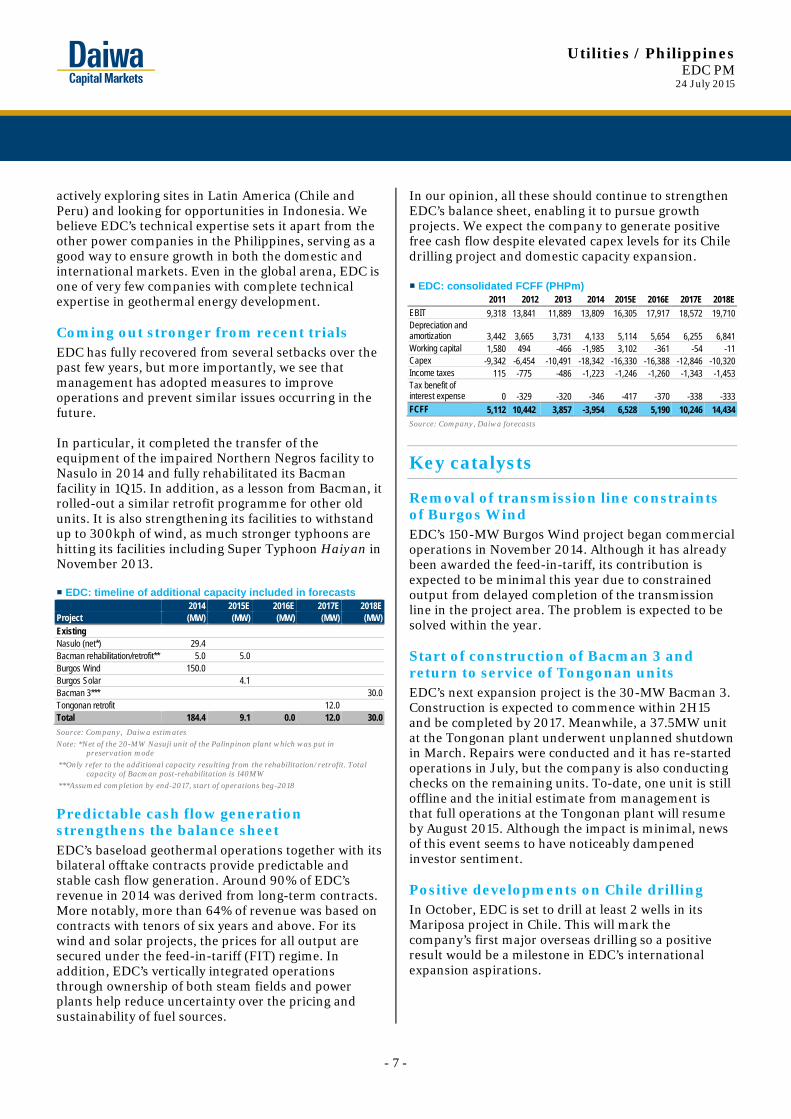
actively exploring sites in Latin America (Chile and Peru) and looking for opportunities in Indonesia. We believe EDC’s technical expertise sets it apart from the other power companies in the Philippines, serving as a good way to ensure growth in both the domestic and international markets. Even in the global arena, EDC is one of very few companies with complete technical expertise in geothermal energy development. Coming out stronger from recent trials EDC has fully recovered from several setbacks over the past few years, but more importantly, we see that management has adopted measures to improve operations and prevent similar issues occurring in the future. In particular, it completed the transfer of the equipment of the impaired Northern Negros facility to Nasulo in 2014 and fully rehabilitated its Bacman facility in 1Q15. In addition, as a lesson from Bacman, it rolled-out a similar retrofit programme for other old units. It is also strengthening its facilities to withstand up to 300kph of wind, as much stronger typhoons are hitting its facilities including Super Typhoon Haiyan in November 2013. EDC: timeline of additional capacity included in forecasts 2014 2015E 2016E 2017E 2018EProject (MW) (MW) (MW) (MW) (MW)Existing Nasulo (net*) 29.4 Bacman rehabilitation/retrofit** 5.0 5.0 Burgos Wind 150.0 Burgos Solar 4.1 Bacman 3*** 30.0Tongonan retrofit 12.0Total 184.4 9.1 0.0 12.0 30.0
Source: Company, Daiwa estimates
Note: *Net of the 20-MW Nasuji unit of the Palinpinon plant which was put in preservation mode
**Only refer to the additional capacity resulting from the rehabilitation/retrofit. Total capacity of Bacman post-rehabilitation is 140MW
***Assumed completion by end-2017, start of operations beg-2018
Predictable cash flow generation strengthens the balance sheet EDC’s baseload geothermal operations together with its bilateral offtake contracts provide predictable and stable cash flow generation. Around 90% of EDC’s revenue in 2014 was derived from long-term contracts. More notably, more than 64% of revenue was based on contracts with tenors of six years and above. For its wind and solar projects, the prices for all output are secured under the feed-in-tariff (FIT) regime. In addition, EDC’s vertically integrated operations through ownership of both steam fields and power plants help reduce uncertainty over the pricing and sustainability of fuel sources.
In our opinion, all these should continue to strengthen EDC’s balance sheet, enabling it to pursue growth projects. We expect the company to generate positive free cash flow despite elevated capex levels for its Chile drilling project and domestic capacity expansion. EDC: consolidated FCFF (PHPm) 2011 2012 2013 2014 2015E 2016E 2017E 2018EEBIT 9,318 13,841 11,889 13,809 16,305 17,917 18,572 19,710Depreciation and amortization 3,442 3,665 3,731 4,133 5,114 5,654 6,255 6,841Working capital 1,580 494 -466 -1,985 3,102 -361 -54 -11Capex -9,342 -6,454 -10,491 -18,342 -16,330 -16,388 -12,846 -10,320Income taxes 115 -775 -486 -1,223 -1,246 -1,260 -1,343 -1,453Tax benefit of interest expense 0 -329 -320 -346 -417 -370 -338 -333FCFF 5,112 10,442 3,857 -3,954 6,528 5,190 10,246 14,434
Source: Company, Daiwa forecasts
Key catalysts
Removal of transmission line constraints of Burgos Wind EDC’s 150-MW Burgos Wind project began commercial operations in November 2014. Although it has already been awarded the feed-in-tariff, its contribution is expected to be minimal this year due to constrained output from delayed completion of the transmission line in the project area. The problem is expected to be solved within the year. Start of construction of Bacman 3 and return to service of Tongonan units EDC’s next expansion project is the 30-MW Bacman 3. Construction is expected to commence within 2H15 and be completed by 2017. Meanwhile, a 37.5MW unit at the Tongonan plant underwent unplanned shutdown in March. Repairs were conducted and it has re-started operations in July, but the company is also conducting checks on the remaining units. To-date, one unit is still offline and the initial estimate from management is that full operations at the Tongonan plant will resume by August 2015. Although the impact is minimal, news of this event seems to have noticeably dampened investor sentiment. Positive developments on Chile drilling In October, EDC is set to drill at least 2 wells in its Mariposa project in Chile. This will mark the company’s first major overseas drilling so a positive result would be a milestone in EDC’s international expansion aspirations.

Utilities / Philippines EDC PM
24 July 2015
- 8 -
A world leader in geothermal energy
Often overlooked is EDC’s top market position and technical expertise. It is the world’s largest vertically integrated geothermal company and is among a very few with expertise spanning the entire geothermal value chain.
Largest integrated geothermal company
EDC is the largest integrated geothermal company in the world with total installed capacity of 1,169MW, which accounts for 9.1% of the world’s total of 12.8GW. All of its operating geothermal facilities are located in the Philippines, but the company is now actively exploring sites in Latin America and looking for opportunities in Indonesia and Africa. EDC has 12 operating geothermal power plants in 5 concession areas across the Philippines.
EDC: geothermal facilities Plant Capacity (MW) Manufacturer Location RegionBacman I 120.0 Toshiba/ Alstom Bicol LuzonBacman II 20.0 Mitsubishi Bicol LuzonTongonan 112.5 Mitsubishi Leyte VisayasPalinpinon I 112.5 Fuji Southern Negros VisayasPalinpinon II 60.0 Fuji Southern Negros VisayasUpper Mahiao 125.0 GE/ Ormat/ Kato Leyte VisayasMalitbog 232.5 Fuji Leyte VisayasMahanagdong 180.0 Toshiba Leyte VisayasOptimization 50.9 Various Leyte VisayasNasulo 49.4 Fuji Southern Negros VisayasMindanao I 52.0 Mitsubishi Mt. Apo MindanaoMindanao II 54.0 Mitsubishi Mt. Apo MindanaoTotal 1,168.8
Source: EDC
Note: *Excludes the 20MW Nasuji power plant placed on preservation
Geothermal energy companies Company
Country
Steam capacity (MW)
Plant Capacity (MW)
EDC Philippines 1,169 1,169Comision Federal de Electricidad Mexico 958 958Enel Green Power Italy 915 915Chevron USA 1,329 887*Ormat Israel 689 749Calpine USA 725** 725**Mighty River Power New Zealand 385 385Terra Gen USA 337 338Contact Energy New Zealand 335 335Orkuveita Reykjavikur Iceland 333 333CalEnergy Generation USA 329 329Star Energy Ltd Indonesia 227 227Northern California Power Agency USA 220 220
Source: Bertani, Rugero (Geothermal Power Generation in the World 2005-2010 Update Report), EDC, **Calpine
Note: *Not included is the 442MW operated by the Indonesian government
One of very few with technological expertise covering the entire geothermal value chain We believe that one of the most underrated strengths of EDC is its technological expertise in the geothermal field. The company’s expertise covers the entire geothermal value chain from exploration to power plant operations. There are at most 4 other companies in the world (Ormat, Chevron, Enel and Calpine) that have a similar technological background. This technological expertise serves as EDC’s platform for growth, as it is equipped to lead greenfield exploration projects both domestically and abroad. Vertically integrated operations allow operational efficiency and stability EDC successfully won the bidding for all remaining unowned power plants associated with its steam fields during the privatization of government-owned power assets. These were the Palinpinon-Tongonan facility in 2009 and the Bacman plant in 2010. Its high level of vertical integration allows it to control and more effectively run existing geothermal operations. Control over both steam field and power plant operations is valuable for geothermal operations because unlike power plants using conventional
Geothermal energy value chain and players
R&D Exploration Drilling Confirmation Engineering Construction O&M EDC (PH), Ormat (US), Chevron (US), Enel (IT), Calpine (US)
PT pertamina (ID), Reykjavik Energy (IS) Boart Longyear (US), Halliburton (US) Sumitomo (JP), Shaw Group (US)
Gov't/Univ Labs (All) Iceland Drilling Co (IS), GeothermEx (US), Baker Drilling (US), Parker Drilling (US), ThermaSource (US)
Siemens (DE), Enex (IS) Mannvit (IS), Power Eng
(US) MHI (JP), GE (US), Fuji (JP),
UTC Source: New Energy Finance, 2008
Note: DE = Denmark, ID = Indonesia, IS = Iceland, IT = Italy, JP = Japan, PH = Philippines, US = United States

Utilities / Philippines EDC PM
24 July 2015
- 9 -
sources of fuel (like coal, diesel, and gas), a geothermal power plant is dependent on a specific on site steam field for fuel. In addition, continuous maintenance of steam fields is necessary to ensure sustainability of steam production. Having control over the entire value chain allows EDC to make all-inclusive investment decisions, unlike in the case of the Tiwi-Makban geothermal facility wherein steam production, and consequently electricity generation, has been declining because Chevron, the steam field operator, has not conducted new well drillings. Aboitiz Power Corp (AP PM, not rated) owns the associated power plants.
Coming out stronger from recent trials
EDC has fully recovered from its misfortunes in past years, particularly from the impairment of its Northern Negros facility, repeated delays in the rehabilitation of the Bacman plant, and natural calamities. More importantly, beyond just recovering, we note that management has applied solutions and adopted learnings from these events to enhance operations and strengthen its facilities. What went before? Northern Negros impairment. In 2011, EDC recognised the full impairment of its Northern Negros Geothermal plant (NNGP) amounting to PHP8.74bn. NNGP was commissioned in 2007 with installed capacity of 49.4MW, but only generated 15MW over the 2007 to June 2008 period, due to low discharge from the steam field. Bacman rehab’s repeated delays. EDC begun rehabilitation of the Bacman geothermal power plant after it acquired the plants from the government in September 2010. Repairs were completed in December 2011, but units 1 and 2 experienced problems with the generator-rotor during reliability runs. The units were again repaired, but upon re-commissioning, issues once again surfaced in February 2013 for unit 2 and in September 2013 for unit 1. Because of this, management decided to implement a more permanent solution by fully replacing the units’ steam paths (turbine, rotors and diaphragms). Simultaneously, an interim fix through the repair of the units was applied while the company waited for the new parts. EDC completed its permanent fix for Bacman in February 2015.
Hit by the world’s strongest typhoon. In November 2013, Central Philippines was hit by Super Typhoon Haiyan. It was the strongest storm on record to make landfall with sustained winds of 230kph and a peak of 315kph. Directly hit and damaged by the Super Typhoon were EDC’s Leyte-based plants, which consist of over 700MW and accounted for about 54% of the company’s revenue at the time. The initial estimate to restore operations was almost 11 months, but EDC was able to completely bring capacity back to pre-Haiyan levels after 123 days (by 11 March 2014). EDC: cooling tower damaged by Typhoon Haiyan
Source: EDC presentation materials
Recently, much stronger typhoons have passed through EDC’s facilities. After Haiyan, 3 more strong typhoons in 2014 affected EDC’s operations, namely, typhoon Glenda in July, which affected operations in Bacman and typhoons Ruby and Seniang in December, which affected its Leyte facilities. EDC’s responses and actions Transferred NNGP equipment to Nasulo. The 49.4-MW Nasulo geothermal plant started commercial operations in July 2014. This was part of EDC’s Northern Negros to Nasulo (N2N) project which involved the transfer of equipment from its 49.4MW NNGP to Nasulo. The transfer also resulted in a PHP1.8bn net impairment recovery in 2014. However, the adjacent 20-MW Nasuji unit (part of Palinpinon facility) was put in preservation mode to accommodate the steam requirements of Nasulo. With full-year operations, we expect revenue and EBITDA from Nasulo (net of the Nasuji shutdown) to reach PHP874m and PHP586m, respectively, for 2015.

Utilities / Philippines EDC PM
24 July 2015
- 10 -
EDC: N2N transfer programme
Source: Google Maps
Retrofitting old plants. When Bacman’s old turbine and generator were replaced with the latest designs (“retrofit”), EDC was able to realise efficiency gains and life extension of the facility. Following this retrofit, Bacman’s electricity production has increased by 10%, while its steam consumption has declined by 9.75%. Even with just partial completion in 2014, Bacman already returned to black last year with a net profit contribution of PHP271m from a loss of PHP1.19bn in 2013. The permanent fix or retrofit of all 3 units at Bacman was completed in February 2015 and Bacman’s rated capacity was upgraded to 140MW from 130MW.
With its return-to-service, upgraded capacity and more efficient steam consumption, we expect Bacman’s revenue to reach PHP4.24bn in 2015 and PHP5.25bn in 2016. In terms of EBITDA, we forecast PHP2.33bn and PHP2.89bn contributions for 2015 and 2016, respectively.
EDC: replacement turbines for Bacman unit 1
Source: Daiwa
Similar to the permanent fix at Bacman, EDC is now rolling-out retrofit programmes for some of its old units. First on the list are the 3 units at the 112.5MW Tongonan power plant. The equipment was already ordered in January 2015 and target completion is between 3Q16 and 1Q17. This should add about 12MW to Tongonan. “Typhoon-proofing” facilities. Since 2006, the company has been reinforcing critical geohazard-prone areas within its concession areas. By end-2014, EDC had completed the necessary geohazard mitigating measures in 150 areas it has identified. More recently, however, much stronger typhoons are hitting the Philippines which pose a greater threat to EDC’s facilities. From its experience with Super Typhoon Haiyan, most of the damage was to the cooling towers at the power plants. As such, the company is implementing a solution which replaces the cooling towers with a new design that can withstand up to 300kph winds. Based on the Philippines wind zones, priority 1 are the Bacman and Leyte cooling towers, followed by the Palinpinon and Mindanao cooling towers. The designs were completed by SPX Marley, the manufacturer of 68% of EDC’s cooling towers, in 2014 and are due to be installed starting July 2015. In addition, EDC remodelled its control rooms into “bunker type” rooms which are solid, waterproof, concrete structures in order to protect all critical electronic instruments and control systems.

Utilities / Philippines EDC PM
24 July 2015
- 11 -
Evolving into a diversified pure-play RE company
We forecast EDC’s projects in hydro, wind and solar power to contribute 14% of consolidated earnings by 2016.
Diversified into hydro, solar and wind power generation
Total attributable capacity of 1,402MW EDC is evolving into a pure-play RE company. Although geothermal remains its biggest asset and core competency, the company has diversified into the hydro, solar and wind power businesses over the past 7 years (it moved into hydro power in 2008, and wind and solar businesses since 2014.) Combined, these add 233MW and bring EDC’s portfolio to 1,402MW, equivalent to 8% of the total installed capacity of the country as of end-2014. EDC: other RE projects Type Plant Capacity
(MW)
Stake Attributable capacity
(MW)
Manufacturer Location Region
Wind Burgos 150.0 100% 150.0 Vestas Ilocos LuzonSolar Burgos 4.1 100% 4.1 Juwi Ilocos LuzonHydro Pantabangan
(FG Hydro) 120.0 60% 72.0 Adritz Nueva
EcijaLuzon
Hydro Masiway (FG Hydro)
12.0 60% 7.2 Toshiba Nueva Ecija
Luzon
Total 286.1 233.3
Source: EDC
Non-geothermal RE projects expected to contribute 14% of total profit by 2016 We expect the contribution of EDC’s 3 other RE projects – FG Hydro, Burgos Wind and Burgos Solar – to increase from around 3% of earnings in 2014 to 14% (or PHP1.68bn) in 2016 with the full contribution of Burgos Wind. Although all 3 projects are already operational this year, we expect a minimal contribution from Burgos Wind due to the delay in completion of transmission line facilities. Nevertheless, we expect the combined contribution from the 3 projects to amount
to PHP795m in 2015, which is equivalent to 8% of EDC’s consolidated net profit. EDC: breakdown of earnings
Source: EDC, Daiwa forecasts
Note: *Includes parent and others
FG Hydro: seasonal earnings kicker EDC’s acquisition of a 60% stake in FG Hydro, the owner and operator of the 132-MW Pantabangan-Masiway hydroelectric power plants, in 2008, marked its diversification into other RE technologies. The acquisition cost was USD105m. In 2014, FG Hydro added PHP399m or 4% of EDC’s total profit. However, its performance has varied over the past 4 years, as its power generation has been greatly affected by weather patterns, such as El Niño. In addition, about half of FG Hydro’s sales are tied to the spot market. FG Hydro’s highest contribution to EDC of PHP1.69bn was recorded in 2012 driven by high generation with the dams’ high water levels and elevated spot market prices. Nevertheless, we expect a baseline contribution from FG Hydro of between PHP528m and PHP607m this year and next.
4,443
8,514
6,558
9,190 10,160
12,066 12,921
14,019
(2,000)
0
2,000
4,000
6,000
8,000
10,000
12,000
14,000
16,000
2011 2012 2013 2014 2015E 2016E 2017E 2018E
Geothermal* Burgos wind Burgos solar FG Hydro (at 60%) Total

Utilities / Philippines EDC PM
24 July 2015
- 12 -
FG Hydro: 130-MW Pantabangan power plant FG Hydro: 12.5-MW Masiway power plant
Source: EDC company brochure Source: EDC company brochure
FG Hydro: operating and financial highlights 2012 2013 2014 2015E 2016E 2017E 2018ETotal Revenue (PHPm) 4,753 2,501 1,624 2,186 2,254 2,333 2,414 EBITDA (PHPm) 4,246 2,067 1,127 1,683 1,690 1,749 1,811 Net Income (PHPm) 3,404 1,467 540 880 1,011 1,090 1,172 Gross rated capacity (MW) 132.0 132.0 132.0 132.0 132.0 132.0 132.0 Total volume (GWh) 932 453 425 474 474 474 474 Price (PHP/kWh) 5.10 5.52 3.82 4.61 4.75 4.92 5.09 Capacity factor (%) 39.0% 28.0% 21.0% 25.0% 25.0% 25.0% 25.0%Source: EDC, Daiwa
Burgos Wind: the largest wind project in Southeast Asia Following the finalisation of the FIT rules in 2013, EDC fast-tracked the development of its 150-MW Burgos Wind located in Ilocos Norte, one of the northernmost provinces in the Philippines. The project was initially planned with only 87-MW and a cost of USD300m, but EDC decided to upsize this to 150-MW with a total cost of USD450m. The Burgos Wind project was formally started in March 2013 with the signing of the supply deal with Denmark’s Vestas, the world’s largest wind turbine manufacturer. It was completed in November 2014 and became the first wind project under the new FIT regime of the government. With FIT, Burgos Wind’s power generation will be sold at a fixed rate of PHP8.53/kWh (with annual inflation and forex
adjustments). The Burgos Wind project also holds the title of the largest wind power project in Southeast Asia. FIT was awarded to the project in April 2015, with the retroactive effect beginning 11 November 2014. However, its power generation is still curtailed due to delays in the completion of a transmission facility in the Ilocos region. The target set by the grid operator is August, but management guides for end-of-year completion to give room for further delays. In line with management’s guidance, Burgos Wind, despite its output curtailment, is expected to add around PHP2.0bn in revenue. This is equivalent to an annual capacity factor of 17.8%, lower than the expected normal average of 25%. We estimate the project will contribute minimally to net profit this year

Utilities / Philippines EDC PM
24 July 2015
- 13 -
at PHP245m. Full contribution of the project should be seen in 2016, when we forecast revenue and net profit of PHP2.95bn and PHP1.04bn, respectively. Burgos Wind
Source: Manila Bulletin
Burgos Wind: operating and financial highlights 2014 2015E 2016E 2017E 2018ETotal Revenue (PHPm) 188 1,995 2,951 3,054 3,161EBITDA (PHPm) 151 1,596 2,361 2,443 2,529Net Income (PHPm) -81 245 1,037 1,165 1,302 Gross rated capacity (MW) 150.0 150.0 150.0 150.0 150.0Total volume (GWh) 49 234 329 329 329Price (PHP/kWh) 3.86 8.53 8.98 9.30 9.62Capacity factor (%) 4.0% 17.8% 25.0% 25.0% 25.0%
Source: Company, Daiwa
Burgos Solar: small but gives experience Burgos Solar is EDC’s 4.1-MW solar project located within the Burgos Wind concession area. The project started commercial operations on 2 March 2015 and cost PHP410m, which was fully funded by equity. Although relatively small, this marks EDC’s first foray into solar power. It should provide EDC with the necessary experience to guide it in future solar energy projects. FIT of PHP9.68/kWh was awarded to the project in March 2015. It is also directly connected to a local electricity cooperative in Ilocos so it is not affected by the transmission line constraint. We look for the project to add revenue of PHP39m and PHP55m, as well as net profit of PHP22m and PHP33m in 2015 and 2016, respectively.
Burgos Solar
Source: EDC presentation materials
Burgos Solar: operating and financial highlights 2015E 2016E 2017E 2018E
Total Revenue (PHPm) 39 55 57 59EBITDA (PHPm) 37 52 54 56Net Income (PHPm) 22 33 35 38 Gross rated capacity (MW) 4.1 4.1 4.1 4.1Total volume (GWh) 4 5 5 5Price (PHP/kWh) 9.68 10.19 10.55 10.92Capacity factor (%) 11.3% 15.0% 15.0% 15.0%
Source: Company, Daiwa

Utilities / Philippines EDC PM
24 July 2015
- 14 -
Mid- and long-term growth opportunities in sight
Domestic projects, albeit small in size, should provide growth over the mid-term. Latin America projects have big potential over the long term.
Maximising domestic resources
EDC has a robust pipeline of projects in the Philippines which are in varying stages of development. These are a mix of greenfield, expansion and upgrade projects. In 2014 and 1H2015, a total of 194MW was added through Burgos Wind, Burgos Solar, Nasulo and the Bacman retrofit. In addition to this, 7 projects with combined indicative capacity of 188MW are in varying stages of development. These should provide growth over the medium term. Frontier areas across the country are also continuously being explored by EDC. Maximising current geothermal service areas The company’s priority is to develop resources within operating geothermal concessions (Leyte, Southern Negros, Bacon-Manito, Mt. Apo, and including Northern Negros). This strategy should prove to be more cost efficient because of existing civil works and shared facilities in these areas. Currently, EDC has 6 new sites within existing concessions and 1 retrofit in its pipeline. Bacman 3 is the most advanced among the 6 new projects in the pipeline. It will be located within the existing Bacman concession area and resources of 30MW have been confirmed. Notice to proceed is targeted to be issued within the year, and the plant is expected to commence commercial operations by 2017.
EDC: Bacman expansion projects
Source: EDC presentation materials
With the success of the Bacman retrofit (replacement of turbine and generator with latest models), EDC is replicating this programme to its other old units. First on the list are the three units of the 112.5-MW Tongonan power plant. The equipment was already ordered in January 2015 and target completion of the three units is between 3Q16 to 1Q17. There is also ongoing discussion about the possible retrofit of the 192.5-MW Palinpinon plant, but no clear details are available as of the moment. We estimate incremental EBITDA from the Tongonan retrofit of PHP114m in 2017 and PHP302m in 2018, while Bacman 3 is expected to contribute PHP662m beginning 2018. Exploring new frontiers In addition to EDC’s project pipeline, the company is exploring frontier sites across the country. Aside from current operating areas, it holds 5 geothermal service contracts, 9 wind energy service contracts, and 3 solar energy service contracts.

E
Sour
Le
EDdevovetheconparrespotyeadricou1,8 LaPe
SimPaactmoThcouonshocou16,
EDC: domestic
rce: Company, Daiw
eading o
DC’s strong tevelopment alerseas. Curree Philippinesncrete develorticularly in source explortential contrars or more, iver. Currentuntries show
800MW.
atin Amerieru
milar to the Pcific Ring of tive regions iost active geo
here are no opuntries yet, bly 14 private ow huge geotuntries, with,000MW for
projects and fr
wa
overseas
echnical expellows it to leaently, all of Es. In recent yopments by ELatin Americration in Chi
ribution will lthese could b
t estimates ow total capaci
ica: closin
Philippines, LFire and is a
in the world.othermal playperating geotbut active exp
companies pthermal ener
h estimates for 50 years and
rontier areas
s explor
ertise in geotad exploratio
EDC’s assets years, howeveEDC on its veca. It is in thile and Peru. likely be accrbe EDC’s lonn 4 advance ity ranging fr
ng in on Ch
Latin Americalso one of th Today, EDC
ayers in Chilethermal planploration is oparticipatingrgy potentialor Chile in thd for Peru at
ration
thermal on projects are located ier, we have sentures abroe early stageAlthough an
retive only inng-term growsites in the 2
rom 760-
hile and
ca belongs tohe geologicallC is one of thee and Peru. nts in the 2 ongoing, withg. Earlier studl in the 2
he order of t 3,000MW.
- 15 -
n seen oad, es of ny n 5 wth 2
o the ly e
h dies
Dirgeoand201AussevewithCorstakproj
Initresorepinst EDComp(EntryAlterraHot REDC ATotal
Sourc
Note:(fromprojec
ectly and throthermal cond 2 in Chile) a13, EDC acqustralian geotheral concessih global renerp (Alterra) inke in Alterra’
ojects in the 2
tial studies oources of betresents a 65-talled geothe
DC: Latin Amerpany y into Latin Americaa Power Corp ock Ltd Applied/Bid sites
ce: Company
* Peru: Achumani am Alterra JVA); Chile
ct from Alterra JVA)
U
rough joint vcessions in thand 19 applic
uired in phashermal firm,ions in Chile ewable energn 2013 where’s subsidiarie2 countries.
n 4 of EDC’stween 760MW-154% increaermal capacit
rica sites
) Peru 1 2 0 3
and Quello Apacheta : Laguna del Maule
)
Utilities /
ventures, EDCthe 2 countriecations. Betw
ses the subsid, Hot Rock Lt
e and Peru. Itgy player Altere EDC acquies holding th
s sites show tW and 1,800ase from EDCty.
Granted sites*
Chile 2 0 0 2
a (from HRL acquisitand Pellado (both co
PhilippinEDC P
24 July 2
C now holds es (3 in Peru
ween 2012 andiaries of td, which helt also partnererra Power ired a 70% he latter’s
total probabl0MW which C’s current
Applica
Peru834
15
tion) and Pinchollo Lomprise the Maripos
nes PM 2015
5 u nd
ld red
le
ations
Chile0044
Libre sa

Utilities / Philippines EDC PM
24 July 2015
- 16 -
EDC: resource potential of select Chile and Peru projects
Prospects Temp
(deg Celsius)Resource
probability Area (sqm) MWe
Achumani project 250-320 P90 7 70 (Peru) P50 26 260
P10 70 700 Quello Apacheta project 220-240 P90 6 55
(Peru) P50 17 168 P10 49 487
Tutapaca project 220-290 P90 0 0 (Peru) P50 27 270
[Under EDC application] P10 40 400 Mariposa project* 250-290 P90 10 105
(Chile) P50 15 155 P10 21 210
Source: Company
Note: *EDC has a 70% stake in the JV with Alterra Power Corp
Significant progress is being made in the Mariposa project in Chile wherein EDC has a 70% interest through its JV with Alterra. The project is estimated to have geothermal resources of 105-210MW, with the mean resource probability (at P50) showing capacity of 155MW. Drilling for the top holes of 3 wells and installation of the water line have been completed in preparation for the first major drilling in October 2015, which will also mark EDC’s first major well drilling overseas. EDC has budgeted for USD58m between 2014 and 2016 for the drilling campaign. EDC: Mariposa project in Chile
Source: EDC presentation materials
Indonesia: long-standing prospects Even prior to its Latin America entry, EDC had already set its sights on Indonesia for overseas expansion. Indonesia also belongs to the Pacific Ring of Fire and actually has the world’s biggest geothermal potential of around 28-29GW. Despite this, Indonesia is only the third-largest producer of geothermal power, next to the US and the Philippines, with installed capacity of 1,340MW.
EDC has established an office in Indonesia and has applied for preliminary survey rights covering pre-identified areas. Although it has yet to acquire or win any concessions in Indonesia, a positive development came when the Indonesia Ministry of Energy and Mineral Resources assigned the geothermal introduction survey of the GrahoNyabu region in Sumatra to EDC in 2013. EDC has already completed the survey activities in GrahoNyabu in Sumatra and submitted the results to the Indonesia Ministry of Energy and Mineral Resources. The same information will be used as the basis for the upcoming tender of the GrahoNyabu concession. In addition, EDC said it is currently in partnership discussions with a geothermal concession holder for a JV in one of their sites in Indonesia which has an estimated capacity of 220MW and development cost of USD1bn.

Utilities / Philippines EDC PM
24 July 2015
- 17 -
Predictable cash flow with upside from new projects
Robust and predictable cash flow generation, provided by baseload geothermal operations and offtake contracts, strengthens EDC’s balance sheet which should support growth.
Long-term contracts provide stable and predictable cash flow
90% of capacity contracted Around 90% of EDC’s revenue in 2014 was derived from long-term contracts. More notably, 64%+ of revenue was based on contracts with tenors of 6 years and above. Coming from legacy contracts when EDC was still a government-owned entity, the biggest single customer of EDC remains the government’s National Power Corp (NPC). However, from almost 100%, EDC has managed to expand its revenue base such that only 43% of revenue is now tied to NPC through power purchase agreements expiring in 2022/24. EDC: term structure of contracts
Source: EDC
Prefers stability over short-term gains The company made a big decision last year when it renegotiated its contracts for its subsidiary, Green Core Geothermal Inc (GCGI), the owner and operator of the Palinpinon and Tongonan geothermal plants, to reduce its base price by around PHP0.40/kWh beginning 2015. The move was driven by low pricing by the competition, particularly from newly built coal plants which are taking advantage of the current low coal prices. In return, it saw requests for additional capacity and extensions of the life of some of the existing contracts up to 2025, 2030 and even 2040. In the short run, the lowered rates will cost EDC around PHP911m. However, the move is testament to the company’s preference towards a more secure and stable cash flow over the long run. FIT scheme also provides stable revenue
EDC’s existing wind and solar projects also enjoy relatively stable revenue through the government’s FIT regime. Under the FIT scheme, EDC’s Burgos Wind and Burgos Solar have secured fixed base prices of PHP8.53/kWh and PHP9.68/kWh for all power generated up to 20 years. Control over steam fields reduces uncertainty EDC’s vertically integrated operations through its ownership of both steam fields and power plants reduce uncertainty over the long-term operations of the geothermal facility. As such, investment decisions on maintenance of the steam fields are easier and issues on pricing of steam can be avoided. Solid balance sheet to finance growth All of the above factors should contribute to stable and predictable cash flow generation for EDC. As a result, its balance sheet should continue to strengthen, allowing it to pursue growth projects. Due to the risks and costs associated with geothermal energy exploration, particularly in early-stage exploration and drillings, initial investments are often funded by the investor’s balance sheet. At end-1Q15, EDC’s cash balance stood at PHP23.98bn, while its current ratio and net debt-to-equity ratio were 1.60x and 1.22x, respectively.
Last year, we estimate the company’s FCF on a consolidated basis was a negative PHP3.95bn due largely to its capital expenditure for the USD450m Burgos Wind project. Moving forward, we expect the company to be able to generate positive FCF despite still-elevated capex levels for its Chile drilling project
Consolidate revenues (2014): PHP30,867m
SP OT 1-2 YR S 3-5 YR S >6 YR SWESM 10% - - - N GC P - 2% - - D U - 17% 7% 20%T R A N SC O - - - 1%N P C - - - 43%
TranscoPHP188m
0.6%
NPCPHP13,437m
43.5%
DUPHP13,417m
43.5%
NGCPPHP720m
2.3%
WESMPHP3,105m
10.1%

Utilities / Philippines EDC PM
24 July 2015
- 18 -
and domestic capacity expansion. For 2015E and 2016E, we forecast FCF (on a consolidated basis) of PHP6.53bn for 2015E and PHP5.19bn for 2016E. Aside from maintenance capex and ongoing domestic exploration costs, we have taken into account the USD58m or around PHP2.59bn budget between 2014 and 2016 for drilling at the Mariposa drilling facility, and around a PHP4.7bn cost for Bacman 3 between 2015 and 2017.
EDC: consolidated FCFF (PHPm) 2012 2013 2014 2015E 2016E 2017E 2018E
EBIT 13,841 11,889 13,809 16,305 17,917 18,572 19,710Depreciation and amortization 3,665 3,731 4,133 5,114 5,654 6,255 6,841Working capital 494 -466 -1,985 3,102 -361 -54 -11Capex -6,454 -10,491 -18,342 -16,330 -16,388 -12,846 -10,320Income taxes -775 -486 -1,223 -1,246 -1,260 -1,343 -1,453Tax benefit of interest expense -329 -320 -346 -417 -370 -338 -333FCFF 10,442 3,857 -3,954 6,528 5,190 10,246 14,434
Source: Company, Daiwa forecasts
New initiatives to deliver growth
Complementing the stable cash flow generation are EDC’s growth initiatives, which should provide the boost to profits. Recently completed projects between 2014 and 1Q15 are the return-to-service of Bacman, Nasulo, Burgos wind, and Burgos Solar, while upcoming projects are the 30-MW Bacman 3, Tongonan retrofit, as well as Mariposa drilling in Chile. EDC: timeline of additional capacity included in forecasts 2014 2015 2016 2017 2018Project (in MW) (in MW) (in MW) (in MW) (in MW)Existing Nasulo (net*) 29.4 Bacman rehabilitation/retrofit** 5.0 5.0 Burgos Wind 150.0 Burgos Solar 4.1 Bacman 3*** 30.0Tongonan retrofit 12.0Total 184.4 9.1 0.0 12.0 30.0
Source: Daiwa
Note: *Net of the 20-MW Nasuji unit of the Palinpinon plant which was put in preservation mode
**Only refers to the additional capacity resulting from the rehabilitation/retrofit. Total capacity of Bacman post-rehabilitation is 140MW
***Assumed completion by end-2017, start of operations beg-2018
Full-year impact of Bacman, Nasulo and Burgos in 2015 and 2016 In 2014, EDC posted record-high recurring net profit (after preferred dividends) of PHP9.19bn. Core net profit grew robustly, up 40% YoY, mainly on the back of the partial return-to-service of Bacman and commencement of commercial operations at the Nasulo plant.
EDC: consolidated revenue historical and forecast (PHPm)
Source: EDC, Daiwa forecasts
EDC: recurring net profit historical and forecast (PHPm)
Source: Company, Daiwa forecasts
For 2015 and 2016, we still expect the company to post double-digit EPS growth, albeit at a lower rate than 2014’s. We forecast an 11% YoY increase in core net profit for 2015 to PHP10.16bn still driven by fresh contributions from Bacman and Nasulo. Although Burgos Wind has been operational since November 2014, we expect it to contribute minimally in 2015 due to transmission line constraints, which are scheduled to be fixed by end of year. By 2016, full contribution of both Burgos Wind and Bacman, together with the return-to-service of a 37.5-MW unit of Tongonan plant, should lift EDC’s earnings to PHP12.07bn, up 19% YoY, on our forecasts. Long-term growth hinges on the success of exploration, new projects EDC’s pipeline of projects, particularly the expansion of its operating concession areas and increased capacity from its retrofit programme, should be the main source of earnings growth for the company over the medium term. We have factored in its 30-MW Bacman 3 expansion project, as well as the retrofit of the 112.5-MW Tongonan plant, which are expected to both be completed in 2017. With the incremental contribution from these projects, we forecast EDC’s recurring net profit to increase by 7% YoY to
28,369 25,656
30,867 34,118
37,273 39,211
42,064
2012 2013 2014 2015E 2016E 2017E 2018E
-20%+26%
+20%
+11%
+9% +5% +7%
8,514
6,558
9,190 10,160
12,066 12,921
14,019
2012 2013 2014 2015E 2016E 2017E 2018E
-23%+92% +40% +11% +19% +7% +9%

Utilities / Philippines EDC PM
24 July 2015
- 19 -
PHP12.92bn for 2017 and by 9% YoY to PHP14.02bn for 2018. Although admittedly small-sized, these domestic projects should provide decent growth for EDC while its bigger overseas projects are under development. Beyond Bacman 3, we have not yet factored in any contribution from either domestic or overseas projects.

Utilities / Philippines EDC PM
24 July 2015
- 20 -
Valuation: undemanding with attractive prospects
Despite EDC’s top market position and technical expertise, predictable cash flows, and growth prospects, its current share price offers hefty upside potential and undemanding valuations.
TP of PHP9.24 offers upside potential of 20%
We initiate coverage on EDC with a Buy (1) rating. Separately valuing each RE technology using the DCF method, we arrive at a SOTP-based target price of PHP9.24. Our target price suggests 20% upside potential, while the stock is trading currently at PERs of 14.2x for 2015E and 12.0x for 2016E. Geothermal remains as the core asset, but other projects add value Based on our estimates, EDC’s geothermal business has an equity value of PHP136.94bn or PHP7.30/sh, equivalent to around 79% of our target price. Our valuation for the geothermal business is composed of the 12 operating geothermal facilities, future projects (30-MW Bacman 3 and retrofit of Tongonan plants), as well as initial capex for Mariposa drilling. SOTP valuation Equity
value EDC's stake
Attributable value
Value per share
(PHPm) (PHPm) (PHP/sh)Geothermal* 136,941 100% 136,941 7.30 Burgos Wind 23,003 100% 23,003 1.23 Burgos Solar 839 100% 839 0.04 FG Hydro 20,755 60% 12,453 0.66 Total 9.24
Outstanding common shares (m) 18,750
Source: Daiwa
Note: *Includes parent and others
Although we believe geothermal will remain EDC’s core asset and biggest value driver, its diversification into other RE technologies (hydro, solar and wind) has slowly increased in contribution. Combined, its other RE assets now account for 21% of the company’s total equity value and add PHP1.94/sh to our target price. The newly-operational Burgos Wind has the biggest share with PHP1.23/sh contribution, followed by EDC’s 60% stake in FG Hydro with PHP0.66/sh. The 4-MW Burgos Solar, albeit small, adds positively to value by PHP0.04/sh. Steady dividends EDC’s dividend policy is to pay at least 30% of the previous year’s recurring net profit. The dividend payout has ranged from 30-50% since 2008. In 2014, EDC paid PHP0.20/sh in cash dividends (PHP0.10/sh regular and PHP0.10/sh special cash dividends) or a total of PHP3.75bn, which was equivalent to 50% of 2013’s recurring net income. However, we expect the payout for 2014’s profit to be lower at 40%, given that its board just maintained the PHP0.10/sh cash dividend in its latest dividend declaration in 9 March 2015. We expect the company to declare a similar fixed amount of PHP0.10/sh as special cash dividends in September or October this year, bringing the total cash dividends for the year to PHP0.20/sh. Moving forward, we opt to maintain the 40% dividend payout. We forecast dividend yields for 2015E and 2016E of 2.6% and 2.9%, respectively. EDC: dividend payments and payout ratio
Source: Company, Daiwa forecasts
Note: Payout ratio is based on recurring net profit. For presentation purposes, both DPS and the payout ratio are adjusted based on the reckoning year of the recurring net income.
0.14 0.16
0.20 0.20 0.22 0.27 0.29
0.31
50%30%
50%40% 40% 40% 40% 40%
2011 2012 2013 2014 2015E 2016E 2017E 2018E
Common cash dividends (PHP/sh) Dividend payout

Utilities / Philippines EDC PM
24 July 2015
- 21 -
EDC geothermal (includes parent and others): DCF valuation Burgos Wind: DCF valuation
(in PHPm) 2015E 2016E 2017E 2018E2019E -
2024EEBIT 14,234 15,065 15,577 16,566 101,481Depreciation and amortization 3,868 4,402 5,003 5,590 43,811Working capital 3,852 -200 -20 24 -8Capital expenditures -16,000 -16,063 -12,520 -9,995 -63,520Income taxes -1,034 -1,148 -1,222 -1,323 -8,486Tax benefit of interest expense -380 -355 -324 -322 -1,595Free Cash Flow to Firm 4,540 1,702 6,493 10,540 71,682Terminal value 126,142 PV of discounted FCFF 63,471PV of terminal value 120,875Enterprise value 184,346 Less: Debt -58,490Add: Cash 11,085Equity value 136,941
(in PHPm) 2015E 2016E 2017E 2018E2019E -
2024EEBIT 787 1,552 1,634 1,720 12,076Depreciation and amortization 809 809 809 809 4,854Working capital -484 -152 -16 -17 -100Capital expenditures 0 0 0 0 -809Income taxes 0 0 0 0 -613Tax benefit of interest expense 0 0 0 0 -81Free Cash Flow to Firm 1,112 2,209 2,427 2,512 2,600Terminal value 35,112 PV of discounted FCFF 16,315PV of terminal value 16,204Enterprise value 32,519 Less: Debt -11,615Add: Cash 2,099Equity value 23,003
Source: Daiwa estimates and forecasts Source: Daiwa estimates and forecasts
Burgos Solar: DCF valuation FG Hydro: DCF valuation
(in PHPm) 2015E 2016E 2017E 2018E2019E -
2024EEBIT 22 31 33 35 250Depreciation and amortization 15 21 21 21 125Working capital -6 -3 0 0 -2Capital expenditures -5 0 0 0 -21Income taxes 0 0 0 0 -11Tax benefit of interest expense 0 0 0 0 0Free Cash Flow to Firm 26 50 54 56 340Terminal value 725 PV of discounted FCFF 363PV of terminal value 335Enterprise value 698 Less: Debt 0Add: Cash 141Equity value 839
(in PHPm) 2015E 2016E 2017E 2018E2019E -
2024EEBIT 1,262 1,269 1,328 1,389 9,594Depreciation and amortization 422 422 422 422 2,529Working capital -259 -7 -18 -18 -107Capital expenditures -325 -325 -325 -325 -2,048Income taxes -211 -112 -121 -130 -972Tax benefit of interest expense -37 -16 -13 -11 -22Free Cash Flow to Firm 850 1,230 1,272 1,326 8,973Terminal value 27,573 PV of discounted FCFF 9,471PV of terminal value 12,701Enterprise value 22,172 Less: Debt -2,901Add: Cash 1,483Equity value 20,755
Source: Daiwa estimates and forecasts Source: Daiwa estimates and forecasts
DCF parameters We have discounted the 10-year free cash flow to the firm (FCFF) of each of EDC’s 4 segments – geothermal (including parent and others), hydro, solar and wind – using a WACC of 8.26% and a terminal growth rate of 2.5%. We have computed a cost of common equity of 10.13%, after-tax cost of debt of 4.73%, and used the dividend rate of 8.0% for its cost of preferred equity.
EDC: DCF parameters WACC 8.26%Cost of common equity 10.13%Risk free rate 4.50%Beta 0.94 Market risk premium 6.00%Cost of preferred equity 8.00%Cost of debt (after-tax) 4.73%Corporate tax rate 10%Capital structure: Common Equity 65.39%Preferred Equity 0.04%Debt 34.57%
Source: Daiwa

Utilities / Philippines EDC PM
24 July 2015
- 22 -
Cheap among its peers
EDC is trading currently at a PER discount to its regional peers in the power generation sector. Based on its closing price of PHP7.70 on 24 July 2015, the stock is trading at PERs of 14.2x for 2015E and 12.0x for 2016E, which are well-below the regional averages for power generators of 16.0x and 12.7x, respectively. Similarly, in terms of EV/EBITDA multiple, the stock’s current trading multiples of 9.5x for 2015E and 8.7x for 2016 are lower than the regional peer averages of 11.0x and 9.5x, respectively, based on the Bloomberg-consensus and Daiwa forecasts. Compared with other renewable energy companies in the Asia region, EDC is also trading below their PER averages of 17.4x and 14.0x for 2015E and 2016E, as well as the EV/EBITDA multiple averages of 15.8x and 14.5x, respectively, based on the Bloomberg consensus and Daiwa forecasts. We believe this discount imposed on EDC is unwarranted because:
(1) It has now fully recovered from its issues with NNGP, Bacman and natural calamities.
Further, it has implemented long-term solutions to enhance operations and strengthen facilities.
(2) It has a competitive advantage through its technical expertise in the geothermal field against other power generation companies. It has good prospects for international expansion, particularly in Latin America.
At our target price of PHP9.24, the stock would trade at PERs of 17.1x for 2015E and 14.4x for 2016E. These are slightly higher than the regional averages for the power generators, but we believe this slight premium is justifiable given EDC’s quality RE portfolio and growth potential. Compared with the regional averages for RE developers, our target PERs are in line. Meanwhile, our target EV/EBITDA estimates are 10.7x and 9.9x, respectively, which are below the regional averages for both power generators and RE developers.
EDC: 12-month forward PER bands EDC: 12-month forward EV/EBITDA bands
Source: Daiwa, Bloomberg, Company
Note: Based on recurring EPS
Source: Daiwa, Bloomberg, Company
0
2
4
6
8
10
12
14
16
Dec-08 Dec-09 Dec-10 Dec-11 Dec-12 Dec-13 Dec-14
(PHP/sh)
4.9x
9.8x
14.7x
19.6x
24.5x
0
2
4
6
8
10
12
14
Dec-08 Dec-09 Dec-10 Dec-11 Dec-12 Dec-13 Dec-14
(PHP/sh)
6.2x
7.7x
9.2x
10.7x
12.3x

Utilities / Philippines EDC PM
24 July 2015
- 23 -
Power generators: regional peer comparison Company Ticker & Market PER PER PBV PBV EV/EBITDA EV/EBITDA Div Yld Div Yld ROE ROE ROA ROA
Exchange Cap 2015E 2016E 2015E 2016E 2015E 2016E 2015E 2016E 2015E 2016E 2015E 2016E(PHPm) (x) (x) (x) (x) (x) (x) (%) (%) (%) (%) (%) (%)
Aboitiz Power Corp AP PM 331,137 18.20 16.62 3.32 3.08 12.94 11.47 3.48 3.66 18.53 18.72 8.60 8.16Beijing Jingneng Clean Ene-H 579 HK 110,117 7.34 6.41 1.05 0.92 8.65 7.69 3.11 3.52 14.43 15.26 3.93 4.05China Datang Corp Renewabl-H 1798 HK 46,547 19.41 13.03 0.66 0.64 9.55 8.46 0.69 1.03 3.28 4.63 0.52 0.81China Longyuan Power Group-H 916 HK 428,878 15.87 13.64 1.63 1.48 9.54 8.51 1.18 1.46 10.40 10.97 3.24 3.39China Yangtze Power Co Ltd-A 600900 CH 1,781,007 20.07 19.61 2.61 2.42 13.69 13.23 2.62 2.65 11.99 11.51 8.59 8.55Electricity Generating PCL EGCO TB 105,083 10.71 9.70 1.04 0.98 22.98 18.91 4.08 4.21 10.01 10.59 4.38 4.64Energy Development Corp* EDC PM 144,375 13.63 11.83 2.91 2.49 9.84 9.02 2.56 2.95 23.04 22.60 9.60 10.14First Gen Corp FGEN PM 99,944 13.64 10.53 1.54 1.34 6.25 5.50 1.67 1.83 10.83 12.27 5.27 5.91Glow Energy PCL GLOW TB 163,171 14.01 13.95 2.49 2.46 9.51 9.63 4.32 5.01 18.88 17.49 7.48 7.95Huaneng Renewables Corp-H 958 HK 186,187 14.67 11.66 1.43 1.29 8.97 7.33 1.26 1.65 10.16 11.62 2.17 2.37Jaiprakash Power Ventures LT JPVL IN 14,007 35.64 n.a. 0.33 0.31 10.44 8.38 n.a. n.a. 0.13 1.63 0.24 1.75Manila Electric Co MER PM 332,269 18.10 19.21 4.00 3.86 9.09 9.77 4.37 4.30 22.82 20.66 6.74 6.09NHPC Ltd NHPC IN 150,463 9.73 9.23 0.71 0.67 7.49 7.21 3.29 3.36 7.48 7.75 4.19 3.95Reliance Power Ltd RPWR IN 89,224 12.70 9.62 0.61 0.57 14.78 8.56 n.a. 0.29 4.91 6.29 1.91 2.32Average 15.98 12.70 1.74 1.61 10.98 9.55 2.72 2.76 11.92 12.28 4.78 5.00
Daiwa estimates Energy Development Co 22.41 23.00 7.67 8.45
At current price 14.21 11.97 2.97 2.56 9.40 8.66 2.6* 2.91* n.a. n.a. n.a. n.a.At target price 17.05 14.36 3.57 3.07 10.74 9.88 2.16* 2.43* n.a. n.a. n.a. n.a.
Source: Bloomberg (as of 24 July 2015), Daiwa forecasts (EDC)
Note: *Dividend yield estimates for EDC are based on actual/estimated dividend per share for the year to conform to Bloomberg estimates.
Renewable energy developers: regional peer comparison Company Ticker & Market PER PER PBV PBV EV/EBITDA EV/EBITDA Div Yld Div Yld ROE ROE ROA ROA
Exchange Cap 2015E 2016E 2015E 2016E 2015E 2016E 2015E 2016E 2015E 2016E 2015E 2016E(PHPm) (x) (x) (x) (x) (x) (x) (%) (%) (%) (%) (%) (%)
Central Hydropower JSC CHP VN 5,105 7.15 7.59 1.48 1.36 6.14 6.48 6.69 6.69 21.80 18.70 9.80 9.30China Datang Corp Renewabl-H 1798 HK 46,547 19.41 13.03 0.66 0.64 9.55 8.46 0.69 1.03 3.28 4.63 0.52 0.81China Longyuan Power Group-H 916 HK 428,878 15.87 13.64 1.63 1.48 9.54 8.51 1.18 1.46 10.40 10.97 3.24 3.39China Yangtze Power Co Ltd-A 600900 CH 1,781,007 20.07 19.61 2.61 2.42 13.69 13.23 2.62 2.65 11.99 11.51 8.59 8.55CK Power PCL CKP TB 25,768 37.75 35.26 0.98 0.91 14.45 13.89 0.93 1.01 4.34 2.67 0.91 0.86Energy Development Corp* EDC PM 144,375 13.63 11.83 2.91 2.49 9.84 9.02 2.56 2.95 23.04 22.60 9.60 10.14Greenko Group PLC GKO LN 7,597 8.93 6.50 0.54 0.46 6.03 4.29 n.a. n.a. 7.20 14.60 n.a. n.a.Huaneng Renewables Corp-H 958 HK 186,187 14.67 11.66 1.43 1.29 8.97 7.33 1.26 1.65 10.16 11.62 2.17 2.37Hunan Development Group Co-A 000722 CH 61,734 41.72 35.24 3.17 2.88 29.73 24.16 n.a. n.a. 7.90 9.50 n.a. n.a.Jaiprakash Power Ventures LT JPVL IN 14,007 35.64 n.a. 0.33 0.31 10.44 8.38 n.a. n.a. 0.13 1.63 0.24 1.75Mytrah Energy LTd MYT LN 8,759 20.28 10.05 n.a. n.a. 7.66 5.72 n.a. 0.68 15.90 22.80 n.a. n.a.NHPC Ltd NHPC IN 150,463 9.73 9.23 0.71 0.67 7.49 7.21 3.29 3.36 7.48 7.75 4.19 3.95Sichuan Chuantou Energy Co-A 600674 CH 403,230 10.39 10.43 2.93 2.43 95.25 89.53 1.48 1.56 24.55 20.64 18.29 16.20Southern Hydropower JSC SHP VN 3,538 7.22 6.07 1.26 1.17 5.69 n.a. 4.42 n.a. 17.85 19.00 7.10 n.a.SPCG PCL SPCG TB 29,895 9.77 8.65 2.89 2.36 9.25 8.45 3.98 4.60 32.83 28.63 9.62 9.86Thai Solar Energy PCL TSE TB 15,272 23.04 17.67 3.07 2.80 24.63 14.92 1.63 1.86 13.83 16.52 7.54 9.96Vallibel Power Erathna PLC VPEL SL 2,388 7.64 9.04 n.a. n.a. 6.46 6.91 10.64 10.64 42.80 33.30 n.a. n.a.Vinh Son -Song Hinh Hydrpo VSH VN 5,937 11.01 12.02 0.92 0.86 9.08 9.42 3.62 3.62 8.54 7.50 6.27 n.a.Average 17.44 13.97 1.72 1.53 15.77 14.46 3.21 3.12 14.67 14.70 6.29 6.43
Daiwa estimates Energy Development Co 22.41 23.00 7.67 8.45
At current price 14.21 11.97 2.97 2.56 9.40 8.66 2.6* 2.91* n.a. n.a. n.a. n.a.At target price 17.05 14.36 3.57 3.07 10.74 9.88 2.16* 2.43* n.a. n.a. n.a. n.a.
Source: Bloomberg (as of 24 July 2015), Daiwa forecasts (EDC)
Note: *Dividend yield estimates for EDC are based on actual/estimated dividend per share for the year to conform to Bloomberg estimates.

Utilities / Philippines EDC PM
24 July 2015
- 24 -
Sensitivity analysis
Our sensitivity analysis on key DCF inputs (risk-free rate, terminal growth, beta, and market risk premium) show that our target price for EDC is most sensitive to changes in the risk-free rate as it affects both cost of equity and cost of debt. A 50bps decrease in our base assumptions of a 4.50% risk-free rate and 5.25% cost of debt (gross) would raise our target price to PHP10.45. Meanwhile, an equivalent 50bps reduction would bring our target price down to PHP8.22. Nevertheless, the stock is still currently trading at a discount against this low case scenario. EDC: sensitivity analysis -50bps* -25bps* Base +25bps* +50bps*Risk-free rate** (base=4.50%) 10.45 9.82 9.24 8.71 8.22 Terminal growth (base=2.50%) 8.59 8.9 9.24 9.61 10.02Market risk premium (base=6.00%) 9.98 9.6 9.24 8.9 8.57 -.10* -.05* Base +.05* +.10*Beta* (base=0.94) 10.2 9.7 9.24 8.81 8.4Source: Daiwa
Note: *For beta, increments are 5bps.
**Changes in risk-free rate are also reflected as addition (reduction) to gross cost of debt base of 5.25%.
Concerns might be raised about a possible rerating of utility stocks, including EDC, once the US Fed hikes its policy rate. However, the results of our correlation and regression analysis between EDC’s share price and the USGG10YR Index (US Generic Gov’t 10Yr) yield show an insignificant relationship with a correlation of -0.4949 and adjusted R2 of 0.2447. Although still considerably low, EDC’s share price shows a higher correlation of -0.7387 and adjusted R2 of 0.5455 against the PDSS10YR Index (Philippine Dealing and Exchange PDST-R2 Fixing 10 Yr) yield. EDC: correlation/regression analysis against bond yields Correlation of share price/bond yield EDC vs USGG10YR Index -0.4949EDC vs PDSS10YR Index -0.7387USGG10YR Index vs PDSS10YR Index 0.6915Regression: adjusted R² EDC vs USGG10YR Index 0.2447EDC vs PDSS10YR Index 0.5455USGG10YR Index vs PDSS10YR Index 0.4780
Source: Daiwa estimates
Note: Data from 14 March 2007 up to 24 July 2015
EDC: share price vs US and PH 10-yr Treasury bond yields
Source: Bloomberg, Daiwa
Note: Values in RHS are in reverse order.
0
2
4
6
8
10
120
2
4
6
8
10
Dec-06 Dec-07 Dec-08 Dec-09 Dec-10 Dec-11 Dec-12 Dec-13 Dec-14
Yield (%)PHP/sh
LHS: EDC PM Equity RHS: USGG10YR IndexRHS: PDSS10YR Index

Utilities / Philippines EDC PM
24 July 2015
- 25 -
Key risks
Operating risks, such as natural disasters, and steam field and plant/equipment issues, resulting in business interruptions would be the main risks to our earnings forecasts. Steam field and plant/equipment issues Geothermal plants are highly dependent on a specific steam resource, so any issue with a steam field would instantly affect the operations of the power plant, and we see this as the main risk to our earnings forecasts. A case in point is the NNGP facility wherein the company recognised impairment losses of PHP8.74bn because of the less-than-ideal geological attributes of the steam field. Another operational risk for EDC is any mechanical issues with its power plants. A prolonged shutdown of a power plant could result in lost sales for merchant plants and trading losses for plants under bilateral contracts. If a plant exceeds the allowable downtime in a given bilateral contract, EDC would be required to purchase replacement power, typically from the spot market, and trading losses could arise if the purchase price were higher than the contracted price. For geothermal plants, there is also an opportunity loss on the margins over steam. The company mitigates the risk by drilling new wells in order to sustain the steam resource and continuous maintenance of facilities. For EDC’s 2015 budget, maintenance capex accounts for 55% or PHP8.8bn of its PHP16bn budget. The retrofit programme for its old geothermal plants should also improve the reliability, efficiency and life of the power plants. Natural disasters EDC’s facilities are constantly at risk from natural disasters, and we would see any occurrence as a secondary risk to our forecasts. Its geothermal facilities are located in the mountains and volcanic regions which exposes it to natural forces especially typhoons, landslides, and earthquakes. Its Burgos Wind farm (as well as Burgos Solar), being in a strong wind area, is also susceptible to typhoons. Between 2006 and 2013,
its facilities were hit by 24 typhoons, including Super Typhoon Haiyan in late 2013. For FG Hydro, the biggest natural threat is a dry spell or El Niño which causes the water level in its dam to go down and restricts power generation. The company tries to mitigate these risks through reinforcing identified geo-hazard-prone areas, replacing cooling towers with a new design that can withstand up to 300kph winds, and building bunker-type control rooms. Change in regulatory regime Through the Electric Power Industry Reform Act (EPIRA) of 2001, the power generation sector was privatised and became unregulated. In addition, renewable energy players have been given various fiscal incentives under the Renewable Energy (RE) Law of 2008. In theory, amendments to these laws, whether favourable or unfavourable against EDC, could be passed in Congress. In reality, however, it takes a very long time before Congress can pass any amendment or a new law. Meanwhile, under the RE Law and its implementing rules, a registered RE company enjoys a lower income tax rate of 10% from 30%. However, there is a provision for a possible pass-on of savings in the form of lower power rates under such mechanism as may be determined by the Department of Energy in coordination with the RE developers. So far, the DOE has not raised the issue of implementing any pass-on savings mechanism. Exploration of new resource The biggest risks for a geothermal project are in the pre-development stages (pre-survey, exploration and test drilling) with project risk above 90%. EDC, as a vertically integrated geothermal company, continuously engages in these pre-development activities in order to find growth opportunities. In terms of cost profile, however, less than 25% of the total cost is associated with these pre-development activities with the first 2 stages (pre-survey and exploration) making up less than 5% of the total.

Utilities / Philippines EDC PM
24 July 2015
- 26 -
Geothermal project cost and risk profile
Source: World Bank (Geothermal Handbook: Planning and Financing Power Generation, 2012)

Utilities / Philippines EDC PM
24 July 2015
- 27 -
Appendix I: company profile Over 1,400MW of pure RE capacity EDC is a pure-play RE company with assets in geothermal, hydro, wind and solar and total attributable capacity of 1,402MW. This accounted for 8% of the Philippines’ total installed capacity as of March end-2014. Geothermal energy is EDC’s core business. It has a total of 12 operating plants in 4 service concession areas which have a combined capacity of 1,169MW or 83% of EDC’s capacity. Combined, geothermal is also the biggest contributor to both revenue and recurring net income at 84% and 85% of the consolidated totals as of end-1Q15. EDC: capacity breakdown per RE technology
Source: Company
EDC: revenue breakdown per RE technology in 1Q15
Source: Company
EDC began its ventures into other RE technologies in 2008 when it acquired a 60% stake in FG Hydro, the owner and operator of the 132-MW Pantabangan-Masiway hydroelectric power plant. More recently, it completed the wind-solar complex comprising the 150-MW Burgos Wind farm last November 2014 and the 4.1-MW Burgos Solar last February 2015. Pioneered geothermal energy in the Philippines EDC, formerly known as PNOC-Energy Development Corp, was created in 1976 as the Philippine Government’s vehicle in accelerating indigenous energy resources, particularly geothermal energy. In July 1977, the country’s first commercial geothermal power plant, a 3-MW unit in Palinpinon, began operations.
Until 2005, EDC’s focus was only with the exploration of geothermal resources and operations of steam fields. Beginning in 2006, however, it began to own and acquire the associated power generation facilities of its steam fields. The Unified Leyte and Mindanao geothermal complexes were handed over to EDC upon expiration of its build-operate-transfer contracts, while Bacman and Palinipinon-Tongonan were acquired by the company in the bidding conducted by the government between 2009 and 2010. EDC: geothermal facilities and commissioning year
Plant Installed
capacity (MW)Original year
commissioned Year power plant
was owned by EDCBac-Man I – unit 1 60 1993 2010Bac-Man I – unit 2 60 1993 2010Bacman II – Cawayan 20 1994 2010Palinpinon I 112.5 1983 2009Palinpinon II 60 1994/1995 2009Tongonan I 112.5 1983 2009Unified Leyte 588.4 1996/1997 2006/2007Mindanao I 52 1996 2009Mindanao II 54 1999 2009Nasulo 49.4 2014 2014Source: Company, DOE
Ownership history As mentioned, EDC began as a government-owned and controlled corporation in 1976. The divestment by the government began when it listed on the Philippine Stock Exchange in December 2006 via an initial public offering. Almost a year after listing, the government sold all its remaining shares to the Lopez Group ultimately through First Gen Corp (FGEN PM). Today, FGEN has a 50.18% economic and a 50.59% voting interest in EDC. Other major institutional investors such as the International Finance Corp (IFC) and GIC of Singapore hold 1.69% and 4.99% economic stakes, respectively. The remaining 43.14% stake is owned by the public.
Geothermal1,169
83.4%
Hydro79MW 5.6%
Wind150MW 10.7%
Solar4MW 0.3%
GeothermalPHP7.2bn
84.7%
HydroPHP1,044m
12.3%
WindPHP253m
3.0%
SolarPHP1m
0.0%
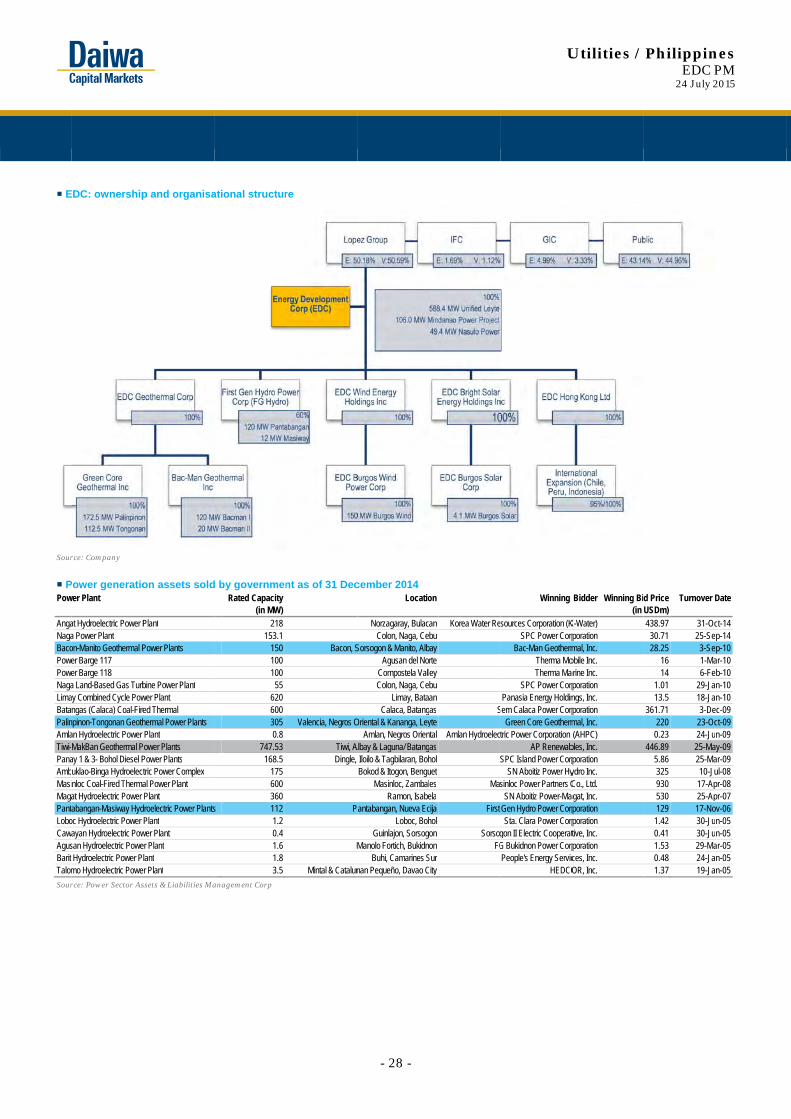
E
Sour
PPow AngaNagaBacoPowePoweNagaLimaBataPalinAmlaTiwi-PanaAmbMasiMagaPantLoboCawaAgusBarit Talom
Sour
EDC: ownership
rce: Company
Power generatiower Plant
at Hydroelectric Power Pa Power Plant on-Manito Geothermal Per Barge 117 er Barge 118 a Land-Based Gas Turbay Combined Cycle Powngas (Calaca) Coal-Fire
npinon-Tongonan Geothan Hydroelectric Power MakBan Geothermal Pay 1 & 3- Bohol Diesel Puklao-Binga Hydroelectnloc Coal-Fired Thermaat Hydroelectric Power abangan-Masiway Hyd
oc Hydroelectric Power ayan Hydroelectric Powsan Hydroelectric PoweHydroelectric Power P
mo Hydroelectric Powe
rce: Power Sector As
p and organisa
on assets sold
Plant
Power Plants
bine Power Plant wer Plant ed Thermal hermal Power Plants Plant
Power Plants Power Plants tric Power Complex al Power Plant Plant
droelectric Power PlantsPlant
wer Plant er Plant lant
er Plant
ssets & Liabilities Ma
ational structur
d by governmenRated Capacity
(in MW) 218
153.1 150 100 100
55 620 600 305 0.8
747.53 168.5
175 600 360
s 112 1.2 0.4 1.6 1.8 3.5
anagement Corp
re
nt as of 31 Dec
Bacon, S
Valencia, Negros O
Tiwi, ADingle,
Pa
M
Mintal & Catalun
- 28 -
cember 2014 Locatio
Norzagaray, BulacColon, Naga, Ce
Sorsogon & Manito, AlbAgusan del No
Compostela VallColon, Naga, Ce
Limay, BataCalaca, Batang
Oriental & Kananga, LeyAmlan, Negros Orien
Albay & Laguna/ BatangIloilo & Tagbilaran, BohBokod & Itogon, Bengu
Masinloc, ZambalRamon, Isabe
Pantabangan, Nueva EcLoboc, Boh
Guinlajon, SorsogManolo Fortich, Bukidn
Buhi, Camarines Snan Pequeño, Davao C
on
an Korea Water Rebu
bayrteeybuanas Sytental Amlan Hydroelecasholuetes Maselacija First holon Sorsogon FG
SurCity
U
Winning
sources Corporation (KSPC Power Corp
Bac-Man GeothermTherma MoTherma Ma
SPC Power CorpPanasia Energy Holdin
Sem Calaca Power CorpGreen Core Geotherm
tric Power Corporation AP Renewab
SPC Island Power CorpSN Aboitiz Power Hy
sinloc Power Partners CSN Aboitiz Power-Mag
Gen Hydro Power CorpSta. Clara Power Corp
gon II Electric CooperatG Bukidnon Power CorpPeople's Energy Servic
HEDCO
Utilities /
Bidder Winning Bi (in
K-Water) rporation mal, Inc. obile Inc. arine Inc. rporation ngs, Inc. rporation mal, Inc. (AHPC)
bles, Inc. rporation ydro Inc. Co., Ltd.
agat, Inc. rporation rporation tive, Inc. rporation ces, Inc. OR, Inc.
PhilippinEDC P
24 July 2
d Price Turnover DUSDm)438.97 31-Oc
30.71 25-Se28.25 3-Se
16 1-Ma14 6-Fe
1.01 29-Ja13.5 18-Ja
361.71 3-De220 23-Oc0.23 24-Ju
446.89 25-Ma5.86 25-Ma325 10-Ju930 17-Ap530 25-Ap129 17-No1.42 30-Ju0.41 30-Ju1.53 29-Ma0.48 24-Ja1.37 19-Ja
nes PM 2015
Date
ct-14ep-14ep-10ar-10eb-10an-10an-10ec-09ct-09n-09
ay-09ar-09ul-08pr-08pr-07ov-06n-05n-05
ar-05an-05an-05
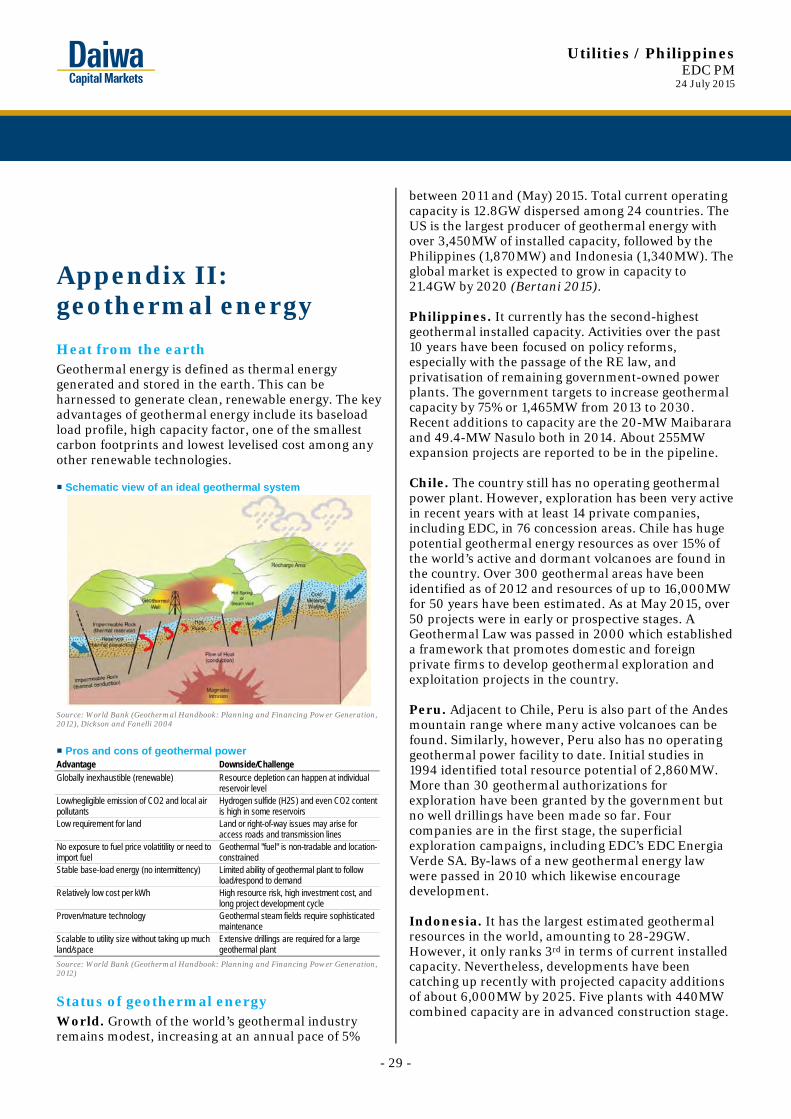
Utilities / Philippines EDC PM
24 July 2015
- 29 -
Appendix II: geothermal energy Heat from the earth Geothermal energy is defined as thermal energy generated and stored in the earth. This can be harnessed to generate clean, renewable energy. The key advantages of geothermal energy include its baseload load profile, high capacity factor, one of the smallest carbon footprints and lowest levelised cost among any other renewable technologies. Schematic view of an ideal geothermal system
Source: World Bank (Geothermal Handbook: Planning and Financing Power Generation, 2012), Dickson and Fanelli 2004
Pros and cons of geothermal power Advantage Downside/Challenge Globally inexhaustible (renewable) Resource depletion can happen at individual
reservoir level Low/negligible emission of CO2 and local air pollutants
Hydrogen sulfide (H2S) and even CO2 content is high in some reservoirs
Low requirement for land Land or right-of-way issues may arise for access roads and transmission lines
No exposure to fuel price volatitility or need to import fuel
Geothermal "fuel" is non-tradable and location-constrained
Stable base-load energy (no intermittency) Limited ability of geothermal plant to follow load/respond to demand
Relatively low cost per kWh High resource risk, high investment cost, and long project development cycle
Proven/mature technology Geothermal steam fields require sophisticated maintenance
Scalable to utility size without taking up much land/space
Extensive drillings are required for a large geothermal plant
Source: World Bank (Geothermal Handbook: Planning and Financing Power Generation, 2012)
Status of geothermal energy World. Growth of the world’s geothermal industry remains modest, increasing at an annual pace of 5%
between 2011 and (May) 2015. Total current operating capacity is 12.8GW dispersed among 24 countries. The US is the largest producer of geothermal energy with over 3,450MW of installed capacity, followed by the Philippines (1,870MW) and Indonesia (1,340MW). The global market is expected to grow in capacity to 21.4GW by 2020 (Bertani 2015). Philippines. It currently has the second-highest geothermal installed capacity. Activities over the past 10 years have been focused on policy reforms, especially with the passage of the RE law, and privatisation of remaining government-owned power plants. The government targets to increase geothermal capacity by 75% or 1,465MW from 2013 to 2030. Recent additions to capacity are the 20-MW Maibarara and 49.4-MW Nasulo both in 2014. About 255MW expansion projects are reported to be in the pipeline. Chile. The country still has no operating geothermal power plant. However, exploration has been very active in recent years with at least 14 private companies, including EDC, in 76 concession areas. Chile has huge potential geothermal energy resources as over 15% of the world’s active and dormant volcanoes are found in the country. Over 300 geothermal areas have been identified as of 2012 and resources of up to 16,000MW for 50 years have been estimated. As at May 2015, over 50 projects were in early or prospective stages. A Geothermal Law was passed in 2000 which established a framework that promotes domestic and foreign private firms to develop geothermal exploration and exploitation projects in the country. Peru. Adjacent to Chile, Peru is also part of the Andes mountain range where many active volcanoes can be found. Similarly, however, Peru also has no operating geothermal power facility to date. Initial studies in 1994 identified total resource potential of 2,860MW. More than 30 geothermal authorizations for exploration have been granted by the government but no well drillings have been made so far. Four companies are in the first stage, the superficial exploration campaigns, including EDC’s EDC Energia Verde SA. By-laws of a new geothermal energy law were passed in 2010 which likewise encourage development. Indonesia. It has the largest estimated geothermal resources in the world, amounting to 28-29GW. However, it only ranks 3rd in terms of current installed capacity. Nevertheless, developments have been catching up recently with projected capacity additions of about 6,000MW by 2025. Five plants with 440MW combined capacity are in advanced construction stage.

Utilities / Philippines EDC PM
24 July 2015
- 30 -
Appendix III: Philippine power industry
Support for RE sector in the Philippines
Renewable energy (RE) accounted for 26% of the Philippine’s electricity generation in 2014. Hydro is the biggest source of RE energy, immediately followed by geothermal. Other forms of RE such as wind, solar, and biomass are slowly being developed in recent years. Total installed RE capacity increased by 33% from 4,449MW in 2001 to 5,898MW in 2014. This growth was driven by favourable changes in legislation with the implementation of the Electricity Power Industry Reform Act (EPIRA) of 2001 which included the privatisation of the power generation sector and development of a competitive electricity market. Philippines: power generation by source (2014)
Source: Department of Energy
Philippines: installed generating capacity (2014)
Source: Department of Energy
Industry reform provides incentives for RE development Another key agenda of the energy industry reform in the Philippines was to push for the development of RE projects. The RE Law was passed in 2008 which set forth several fiscal and non-fiscal incentives for RE developers. Among others, registered RE developers would enjoy an income tax holiday of 7 years and reduced corporate income tax rate of 10% versus 30% for ordinary corporations. Incentives to RE developers under the RE Act of 2008
Income tax holiday of seven years Reduced corporate tax rate of 10% (from 30%) Duty-free importation of renewable energy machinery, equipment and materials within the first 10 years 10-year exemption from tariff duties Net operating loss carry-over for the next seven years following the loss Accelerated depreciation 0% value-added tax rate Cash incentive for missionary electrification (outside the three main grids and wehere connection to existing network is not feasible) Special realty tax Tax exemption on carbon credits Tax credit on domestic capital equipment Net-metering for RE to allow consumers generating their own power to sell back to the grid
Source: Chapter VII of the Philippine’s RE Act of 2008
Feed-in-tariffs: opportunity and risk In addition to the incentives mentioned above, the RE Act also directed the creation of a FIT scheme which would provide a guaranteed price for run-of-river hydro, wind, solar, biomass and ocean (deferred) power projects. Awarding of FIT is subject to installation targets per technology.
Hydro11.8%
Geothermal13.3%
Other renewables
0.5%
Coal42.8%
Oil-based7.4%
Natural Gas24.2%
Total power generated (2014): 77,261 GWh
Hydro19.7%
Geothermal10.7%
Other renewables
2.4%Coal
31.8%
Oil-based19.4%
Natural Gas15.9%
Total installed capacity(2014): 17,944 MW

Utilities / Philippines EDC PM
24 July 2015
- 31 -
Philippines: feed-in-tariff (FIT) system Salient features of the FIT system Coverage Wind, solar, ocean, run-of-river hydroelectric, biomass Priority connection, purchase and transmission Duration of FITs
20 years for first round of FIT. After first generation of FITs, the Energy Regulatory Commission (ERC) will determine the duration of the succeeding FITs. Minimum provided by RE Law is 12 years.
Approval of FIT rates
Approval will come from the ERC, based on the recommendation of the National Renewable Energy Board (NREB). Recommendation of NREB is based on a first-to-build basis
FIT adjustments
Adjusted by ERC annually to allow pass-through of local inflation and foreign exchange variations
Degression Subject to degression rate based on NREB's recommendation in order to encourage early investments
Approved FIT for first tranche Tariff (PHP/kWh) Installation targets (MW)Run-of-river Hydro:
5.9 250
Wind: 8.53 200Solar: 9.68 50Biomass: 6.63 250Ocean: Decision deferred Decision deferred
Source: National Transmission Corp, O’Melveny & Myers LLP (The Philippine Renewable Energy Framework, 2010)
In 2013, the final FIT rules for the first tranche were released. However, RE players voiced concerns over the rules, particularly the “first-to-finish” rule which means the project must first be commercially operational before being endorsed for FIT. The developer must take on the risk of not getting the tariff if the project does not make it to the installation target. Despite delays to the final rules governing the FIT scheme, as well as initial apprehension by investors from the “first-to-finish” qualification for projects, we would note that development of RE projects had been catching up the past two years. The 200MW allocation for wind was already fully taken-up by EDC’s 150-MW Burgos Wind and two other smaller projects. In fact, other wind projects that are already operational/under construction are still in the waitlist for their FIT award. For solar, the installation target was already increased from 50 to 500MW, while discussions are ongoing for wind.
Projects under the FIT system as of 30 April 2015
Source: Department of Energy
Note: *The 54-MW San Lorenzo Wind project's eligibility to the FIT system shall be subject to the issuance of ERC of the FIT for amended installation target since the initial 200-MW installation target for wind was already met.
Power-supply demand scenario
The months of March and April 2015 were dubbed a critical period in terms of power supply in the Philippines due to the maintenance shutdown of the Malampaya natural gas facility coupled with higher demand during the summer months. However, the Luzon grid, where more than 70% of power demand originates, has been spared from the earlier-forecasted power shortages. The Visayas grid was also mostly spared except for a few days of thin reserves and some hours of shortage due to the forced shutdown of a major coal plant at the end of May 2015. On the other hand, the Mindanao grid has long been suffering sporadic power shortages because of essentially zero reserves and its dependence on the 982-MW Agus-Pulangi hydro power plant. Moving forward, estimates based on data from the Department of Energy and various power generation companies, show that the Luzon and Visayas grids need to get the 585MW committed capacities by 2016 in order to satisfy the projected peak demand of 11,311MW. The Mindanao grid is already short in supply as of 2013 and 2014 (projected). Committed capacities for the Mindanao grid of 343MW in 2015 should be sufficient to satisfy projected peak demand of 1,435MW. In fact, there could be an oversupply once all the committed capacities (343MW in 2015 to 935MW in 2020) come on line.
304
109
403
242 410
48
707
351422
75
Wind* Solar Run-of-river hydro Biomass
Ongoing with Certificate of Commerciality Commercial operations (w/ approved FIT)

Utilities / Philippines EDC PM
24 July 2015
- 32 -
Luzon-Visayas supply-demand forecast 2013-2020 (in MW)
Source: EDC, First Gen’s internal estimates based on actual data submitted to Department of Energy (DOE), DOE’s list of existing power plants 2013, Daiwa
Mindanao supply-demand forecast 2013-2020 (in MW)
Source: EDC, First Gen’s internal estimates based on actual data submitted to Department of Energy (DOE), DOE’s list of existing power plants 2013
Electricity demand drivers We have established a high correlation between economic activity and electricity demand, with an electricity demand to real GDP elasticity of 0.97x. As such, growth in the Philippines economy should continue to drive electricity demand. The Philippines registered real GDP growth of 6.1% YoY for 2014, still the fastest growing economy in Southeast Asia and the second-fastest in Asia (after China). And the outlook for the country’s economic development remains positive, as evidenced by the Philippines’s credit rating upgrade from Moody’s1 to Baa2 (with stable outlook) on 11 December 2014, from Baa3 (with positive outlook).
1 This report uses credit ratings assigned by Moody’s, which is not registered with Japan’s Financial Services Agency pursuant to Article 66, Paragraph 27 of the Financial Instruments and Exchange Act. Investors should read the related attachment for information on ratings assigned by unregistered rating agencies.
Philippines: real GDP growth vs. that for ASEAN (%)
Source: ASEAN.org
We identify three key trends in the Philippine economy which should directly drive electricity demand: Population and demographic sweet spot. Over the past 34 years, the population of the Philippines has seen a CAGR of 2.2% and now stands at around 100m Filipinos. This number is projected to reach 157m by 2050, according to a UN study in 2012. More importantly, the study showed that the Philippines is, and will continue to be, in a demographic sweet spot with a young working-age population. The population median age is estimated to be 23.4 years in 2015 and 31.5 years in 2050, according to the UN study.
The Philippines: historical and forecast population
Source: “World Population Prospects: The 2012 Revision, Volume II: Demographic Profiles,” United Nations Department of Economic and Social Affairs/Population Division
Rising private consumption. Much of the GDP growth enjoyed in recent years was driven by household consumption, which made up 65% of GDP growth from 2010-14. Aside from a growing population and workforce, robust private consumption is driven by higher personal income due to remittances from overseas foreign workers and better-paying jobs from the business process outsourcing sector.
0
4,000
8,000
12,000
16,000
20,000
2013 -actual
2014 2015 2016 2017 2018 2019 2020
Req'd additional capacityCommitted capacityExisting capacityPeak demandPeak demand + Req' reserve margin
0
1,000
2,000
3,000
2013 -actual
2014 2015 2016 2017 2018 2019 2020
Req'd additional capacityCommitted capacityExisting capacityPeak demandPeak demand + Req' reserve margin
(2)(1)
0123456789
10
Brun
eiD
arus
sala
m
Cam
bodi
a
Indo
nesi
a
Lao
PDR
Mal
aysi
a
Mya
nmar
Philip
pine
s
Sing
apor
e
Thai
land
Viet
Nam
2011 2012 2013
19 36 62 78 86 93 102 110 128
157 180 188
18 1719 21 21 22 23 25
2732
3742
1950 1970 1990 2000 2005 2010 2015E 2020E 2030E 2050E 2075E 2100E
Total population ('000s) Median age (years)
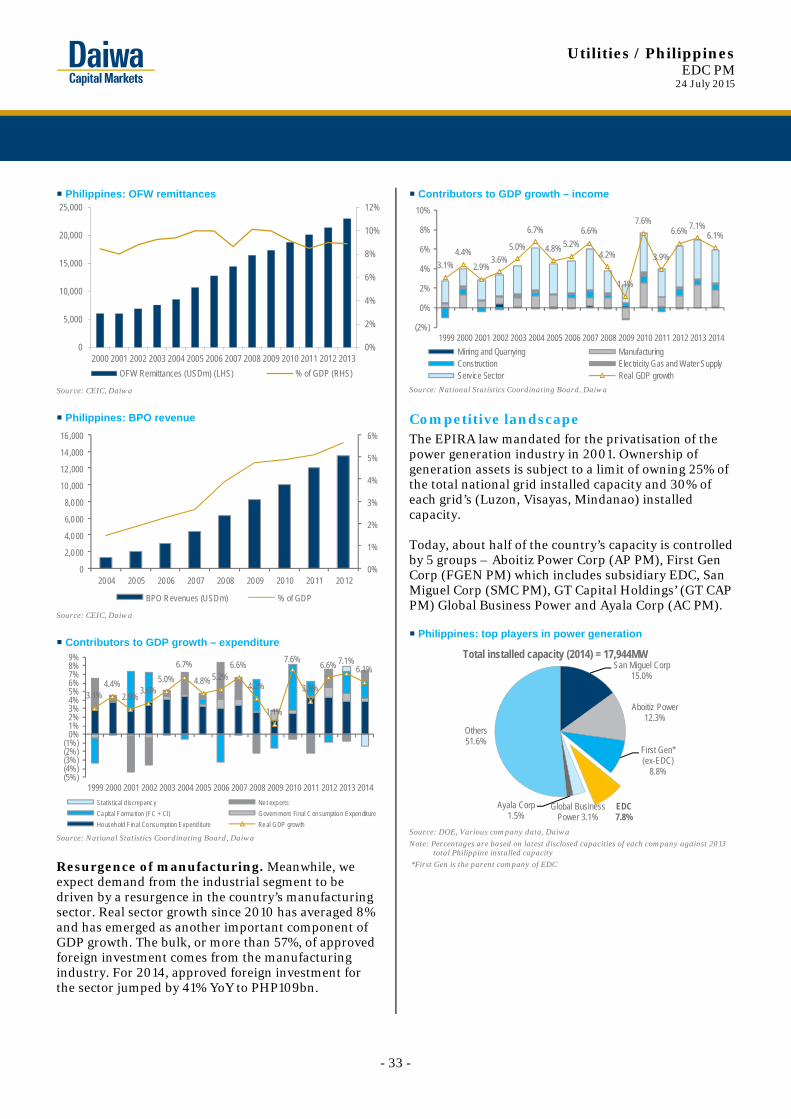
Utilities / Philippines EDC PM
24 July 2015
- 33 -
Philippines: OFW remittances
Source: CEIC, Daiwa
Philippines: BPO revenue
Source: CEIC, Daiwa Contributors to GDP growth – expenditure
Source: National Statistics Coordinating Board, Daiwa
Resurgence of manufacturing. Meanwhile, we expect demand from the industrial segment to be driven by a resurgence in the country’s manufacturing sector. Real sector growth since 2010 has averaged 8% and has emerged as another important component of GDP growth. The bulk, or more than 57%, of approved foreign investment comes from the manufacturing industry. For 2014, approved foreign investment for the sector jumped by 41% YoY to PHP109bn.
Contributors to GDP growth – income
Source: National Statistics Coordinating Board, Daiwa
Competitive landscape The EPIRA law mandated for the privatisation of the power generation industry in 2001. Ownership of generation assets is subject to a limit of owning 25% of the total national grid installed capacity and 30% of each grid’s (Luzon, Visayas, Mindanao) installed capacity. Today, about half of the country’s capacity is controlled by 5 groups – Aboitiz Power Corp (AP PM), First Gen Corp (FGEN PM) which includes subsidiary EDC, San Miguel Corp (SMC PM), GT Capital Holdings’ (GT CAP PM) Global Business Power and Ayala Corp (AC PM). Philippines: top players in power generation
Source: DOE, Various company data, Daiwa
Note: Percentages are based on latest disclosed capacities of each company against 2013 total Philippine installed capacity
*First Gen is the parent company of EDC
0%
2%
4%
6%
8%
10%
12%
0
5,000
10,000
15,000
20,000
25,000
2000 2001 2002 2003 2004 2005 2006 2007 2008 2009 2010 2011 2012 2013
OFW Remittances (USDm) (LHS) % of GDP (RHS)
0%
1%
2%
3%
4%
5%
6%
0
2,000
4,000
6,000
8,000
10,000
12,000
14,000
16,000
2004 2005 2006 2007 2008 2009 2010 2011 2012
BPO Revenues (USDm) % of GDP
3.1%4.4%
2.9%3.6%
5.0%
6.7%
4.8% 5.2%6.6%
4.2%
1.1%
7.6%
3.9%
6.6% 7.1%6.1%
(5%)(4%)(3%)(2%)(1%)
0%1%2%3%4%5%6%7%8%9%
1999 2000 2001 2002 2003 2004 2005 2006 2007 2008 2009 2010 2011 2012 2013 2014
Statistical d iscrep anc y Ne t exp orts
Ca pital Forma tion (FC + CI) Govern ment Final C on sumptio n Expen diture
Ho useh old Fin al Co nsu mption Exp end iture Re al GDP grow th
3.1%
4.4%
2.9%3.6%
5.0%
6.7%
4.8% 5.2%
6.6%
4.2%
1.1%
7.6%
3.9%
6.6% 7.1%6.1%
(2%)
0%
2%
4%
6%
8%
10%
1999 2000 2001 2002 2003 2004 2005 2006 2007 2008 2009 2010 2011 2012 2013 2014
Mining and Quarrying ManufacturingConstruction Electricity Gas and Water SupplyService Sector Real GDP growth
San Miguel Corp15.0%
Aboitiz Power12.3%
First Gen*(ex-EDC)
8.8%
EDC7.8%
Global Business Power 3.1%
Ayala Corp1.5%
Others51.6%
Total installed capacity (2014) = 17,944MW

Utilities / Philippines EDC PM
24 July 2015
- 34 -
Daiwa’s Asia Pacific Research Directory
HONG KONG
Takashi FUJIKURA (852) 2848 4051 [email protected] Regional Research Head
Kosuke MIZUNO (852) 2848 4949 / (852) 2773 8273
Regional Research Co-head
John HETHERINGTON (852) 2773 8787 [email protected] Regional Deputy Head of Asia Pacific Research
Rohan DALZIELL (852) 2848 4938 [email protected] Regional Head of Product Management
Kevin LAI (852) 2848 4926 [email protected] Chief Economist for Asia ex-Japan; Macro Economics (Regional)
Christie CHIEN (852) 2848 4482 [email protected] Macro Economics (Regional); Banking; Insurance (Taiwan)
Junjie TANG (852) 2773 8736 [email protected] Macro Economics (China)
Jonas KAN (852) 2848 4439 [email protected] Head of Hong Kong and China Property
Cynthia CHAN (852) 2773 8243 [email protected]
Property (China)
Leon QI (852) 2532 4381 [email protected] Banking (Hong Kong/China); Broker (China); Insurance (China)
Anson CHAN (852) 2532 4350 [email protected] Consumer (Hong Kong/China)
Jamie SOO (852) 2773 8529 [email protected] Gaming and Leisure (Hong Kong/China)
Dennis IP (852) 2848 4068 [email protected] Power; Utilities; Renewables and Environment (Hong Kong/China)
John CHOI (852) 2773 8730 [email protected]
Head of Hong Kong and China Internet; Regional Head of Small/Mid Cap
Becky HAN (852) 2848 4464 [email protected] Small/Mid Cap (Regional)
Kelvin LAU (852) 2848 4467 [email protected] Head of Transportation (Hong Kong/China); Transportation (Regional)
Brian LAM (852) 2532 4341 [email protected] Transportation – Aviation (Hong Kong/China); Railway; Construction and Engineering (China)
Jibo MA (852) 2848 4489 [email protected] Head of Custom Products Group
Thomas HO (852) 2773 8716 [email protected] Custom Products Group
PHILIPPINES
Bianca SOLEMA (63) 2 737 3023 [email protected] Utilities and Energy
SOUTH KOREA
Sung Yop CHUNG (82) 2 787 9157 [email protected] Pan-Asia Co-head/Regional Head of Automobiles and Components; Automobiles; Shipbuilding; Steel
Mike OH (82) 2 787 9179 [email protected] Banking; Capital Goods (Construction and Machinery)
Iris PARK (82) 2 787 9165 [email protected] Consumer/Retail
Jun Yong BANG (82) 2 787 9168 [email protected] Oil; Chemicals; Tyres
Thomas Y KWON (82) 2 787 9181 [email protected] Pan-Asia Head of Internet & Telecommunications; Software – Internet/On-line Game
SK KIM (82) 2 787 9173 [email protected] IT/Electronics(Korea) – Semiconductor/Display and Tech Hardware
TAIWAN
Rick HSU (886) 2 8758 6261 [email protected] Head of Regional Technology; Head of Taiwan Research; Semiconductor/IC Design (Regional)
Steven TSENG (886) 2 8758 6252 [email protected] IT/Technology Hardware (PC Hardware)
Christine WANG (886) 2 8758 6249 [email protected] IT/Technology Hardware (Automation); Pharmaceuticals and Healthcare; Consumer
Kylie HUANG (886) 2 8758 6248 [email protected] IT/Technology Hardware (Handsets and Components)
Helen CHIEN (886) 2 8758 6254 [email protected] Small/Mid Cap
INDIA
Punit SRIVASTAVA (91) 22 6622 1013 [email protected] Head of India Research; Strategy; Banking/Finance
Saurabh MEHTA (91) 22 6622 1009 [email protected] Capital Goods; Utilities
SINGAPORE
Ramakrishna MARUVADA (65) 6499 6543 [email protected] Head of Singapore Research; Telecommunications (China/ASEAN/India)
Royston TAN (65) 6321 3086 [email protected] Oil and Gas; Capital Goods
David LUM (65) 6329 2102 [email protected] Property and REITs
Shane GOH (65) 64996546 [email protected] Small/Mid Cap (Singapore)
Jame OSMAN (65) 6321 3092 [email protected] Telecommunications (ASEAN/India); Pharmaceuticals and Healthcare; Consumer (Singapore)
Utilities / Philippines EDC PM
24 July 2015
- 35 -
Daiwa’s Offices
Office / Branch / Affiliate Address Tel Fax
DAIWA SECURITIES GROUP INC
HEAD OFFICE Gran Tokyo North Tower, 1-9-1, Marunouchi, Chiyoda-ku, Tokyo, 100-6753 (81) 3 5555 3111 (81) 3 5555 0661
Daiwa Securities Trust Company One Evertrust Plaza, Jersey City, NJ 07302, U.S.A. (1) 201 333 7300 (1) 201 333 7726
Daiwa Securities Trust and Banking (Europe) PLC (Head Office) 5 King William Street, London EC4N 7JB, United Kingdom (44) 207 320 8000 (44) 207 410 0129
Daiwa Europe Trustees (Ireland) Ltd Level 3, Block 5, Harcourt Centre, Harcourt Road, Dublin 2, Ireland (353) 1 603 9900 (353) 1 478 3469
Daiwa Capital Markets America Inc. New York Head Office Financial Square, 32 Old Slip, New York, NY10005, U.S.A. (1) 212 612 7000 (1) 212 612 7100
Daiwa Capital Markets America Inc. San Francisco Branch 555 California Street, Suite 3360, San Francisco, CA 94104, U.S.A. (1) 415 955 8100 (1) 415 956 1935
Daiwa Capital Markets Europe Limited, London Head Office 5 King William Street, London EC4N 7AX, United Kingdom (44) 20 7597 8000 (44) 20 7597 8600
Daiwa Capital Markets Europe Limited, Frankfurt Branch Neue Mainzer Str. 1, 60311 Frankfurt/Main, Germany (49) 69 717 080 (49) 69 723 340
Daiwa Capital Markets Europe Limited, Paris Representative Office 17, rue de Surène 75008 Paris, France (33) 1 56 262 200 (33) 1 47 550 808
Daiwa Capital Markets Europe Limited, Geneva Branch 50 rue du Rhône, P.O.Box 3198, 1211 Geneva 3, Switzerland (41) 22 818 7400 (41) 22 818 7441
Daiwa Capital Markets Europe Limited, Moscow Representative Office
Midland Plaza 7th Floor, 10 Arbat Street, Moscow 119002, Russian Federation
(7) 495 641 3416 (7) 495 775 6238
Daiwa Capital Markets Europe Limited, Bahrain Branch 7th Floor, The Tower, Bahrain Commercial Complex, P.O. Box 30069, Manama, Bahrain
(973) 17 534 452 (973) 17 535 113
Daiwa Capital Markets Hong Kong Limited Level 28, One Pacific Place, 88 Queensway, Hong Kong (852) 2525 0121 (852) 2845 1621
Daiwa Capital Markets Singapore Limited 6 Shenton Way #26-08, OUE Downtown 2, Singapore 068809, Republic of Singapore
(65) 6220 3666 (65) 6223 6198
Daiwa Capital Markets Australia Limited Level 34, Rialto North Tower, 525 Collins Street, Melbourne, Victoria 3000, Australia
(61) 3 9916 1300 (61) 3 9916 1330
DBP-Daiwa Capital Markets Philippines, Inc 18th Floor, Citibank Tower, 8741 Paseo de Roxas, Salcedo Village, Makati City, Republic of the Philippines
(632) 813 7344 (632) 848 0105
Daiwa-Cathay Capital Markets Co Ltd 14/F, 200, Keelung Road, Sec 1, Taipei, Taiwan, R.O.C. (886) 2 2723 9698 (886) 2 2345 3638
Daiwa Securities Capital Markets Korea Co., Ltd. 20 Fl.& 21Fl. One IFC, 10 Gukjegeumyung-Ro, Yeongdeungpo-gu, Seoul, Korea
(82) 2 787 9100 (82) 2 787 9191
Daiwa Securities Co. Ltd., Beijing Representative Office Room 301/302,Kerry Center,1 Guanghua Road,Chaoyang District, Beijing 100020, People’s Republic of China
(86) 10 6500 6688 (86) 10 6500 3594
Daiwa (Shanghai) Corporate Strategic Advisory Co. Ltd. 44/F, Hang Seng Bank Tower, 1000 Lujiazui Ring Road, Pudong, Shanghai China 200120 , People’s Republic of China
(86) 21 3858 2000 (86) 21 3858 2111
Daiwa Securities Co. Ltd., Bangkok Representative Office 18th Floor, M Thai Tower, All Seasons Place, 87 Wireless Road, Lumpini, Pathumwan, Bangkok 10330, Thailand
(66) 2 252 5650 (66) 2 252 5665
Daiwa Capital Markets India Private Ltd 10th Floor, 3 North Avenue, Maker Maxity, Bandra Kurla Complex, Bandra East, Mumbai – 400051, India
(91) 22 6622 1000 (91) 22 6622 1019
Daiwa Securities Co. Ltd., Hanoi Representative Office Suite 405, Pacific Palace Building, 83B, Ly Thuong Kiet Street, Hoan Kiem Dist. Hanoi, Vietnam
(84) 4 3946 0460 (84) 4 3946 0461
DAIWA INSTITUTE OF RESEARCH LTD
HEAD OFFICE 15-6, Fuyuki, Koto-ku, Tokyo, 135-8460, Japan (81) 3 5620 5100 (81) 3 5620 5603
MARUNOUCHI OFFICE Gran Tokyo North Tower, 1-9-1, Marunouchi, Chiyoda-ku, Tokyo, 100-6756 (81) 3 5555 7011 (81) 3 5202 2021
New York Research Center 11th Floor, Financial Square, 32 Old Slip, NY, NY 10005-3504, U.S.A. (1) 212 612 6100 (1) 212 612 8417
London Research Centre 3/F, 5 King William Street, London, EC4N 7AX, United Kingdom (44) 207 597 8000 (44) 207 597 8550

Utilities / Philippines EDC PM
24 July 2015
- 36 -
Disclaimer
This publication is produced by Daiwa Securities Group Inc. and/or its non-U.S. affiliates, and distributed by Daiwa Securities Group Inc. and/or its non-U.S. affiliates, except to the extent expressly provided herein. This publication and the contents hereof are intended for information purposes only, and may be subject to change without further notice. Any use, disclosure, distribution, dissemination, copying, printing or reliance on this publication for any other purpose without our prior consent or approval is strictly prohibited. Neither Daiwa Securities Group Inc. nor any of its respective parent, holding, subsidiaries or affiliates, nor any of its respective directors, officers, servants and employees, represent nor warrant the accuracy or completeness of the information contained herein or as to the existence of other facts which might be significant, and will not accept any responsibility or liability whatsoever for any use of or reliance upon this publication or any of the contents hereof. Neither this publication, nor any content hereof, constitute, or are to be construed as, an offer or solicitation of an offer to buy or sell any of the securities or investments mentioned herein in any country or jurisdiction nor, unless expressly provided, any recommendation or investment opinion or advice. Any view, recommendation, opinion or advice expressed in this publication may not necessarily reflect those of Daiwa Securities Group Inc., and/or its affiliates nor any of its respective directors, officers, servants and employees except where the publication states otherwise. This research report is not to be relied upon by any person in making any investment decision or otherwise advising with respect to, or dealing in, the securities mentioned, as it does not take into account the specific investment objectives, financial situation and particular needs of any person. Daiwa Securities Group Inc., its subsidiaries or affiliates, or its or their respective directors, officers and employees from time to time have trades as principals, or have positions in, or have other interests in the securities of the company under research including derivatives in respect of such securities or may have also performed investment banking and other services for the issuer of such securities. The following are additional disclosures. Japan Daiwa Securities Co. Ltd. and Daiwa Securities Group Inc. Daiwa Securities Co. Ltd. is a subsidiary of Daiwa Securities Group Inc. Investment Banking Relationship
Within the preceding 12 months, The subsidiaries and/or affiliates of Daiwa Securities Group Inc. * has lead-managed public offerings and/or secondary offerings (excluding straight bonds) of the securities of the following companies: Modern Land (China) Co. Ltd (1107 HK); econtext Asia Ltd (1390 HK); Neo Solar Power Corp (3576 TT); Accordia Golf Trust (AGT SP); Hua Hong Semiconductor Ltd (1347 HK); GF Securities Co Ltd (1776 HK).
*Subsidiaries of Daiwa Securities Group Inc. for the purposes of this section shall mean any one or more of: Daiwa Capital Markets Hong Kong Limited (大和資本市場香港有限公司), Daiwa Capital Markets Singapore Limited, Daiwa Capital Markets Australia Limited, Daiwa Capital Markets India Private Limited, Daiwa-Cathay Capital Markets Co., Ltd., Daiwa Securities Capital Markets Korea Co., Ltd. Hong Kong This research is distributed in Hong Kong by Daiwa Capital Markets Hong Kong Limited (大和資本市場香港有限公司) (“DHK”) which is regulated by the Hong Kong Securities and Futures Commission. Recipients of this research in Hong Kong may contact DHK in respect of any matter arising from or in connection with this research. Ownership of Securities For “Ownership of Securities” information, please visit BlueMatrix disclosure Link at https://daiwa3.bluematrix.com/sellside/Disclosures.action. Investment Banking Relationship For “Investment Banking Relationship”, please visit BlueMatrix disclosure Link at https://daiwa3.bluematrix.com/sellside/Disclosures.action. Relevant Relationship (DHK) DHK may from time to time have an individual employed by or associated with it serves as an officer of any of the companies under its research coverage. DHK market making DHK may from time to time make a market in securities covered by this research.
Singapore This research is distributed in Singapore by Daiwa Capital Markets Singapore Limited and it may only be distributed in Singapore to accredited investors, expert investors and institutional investors as defined in the Financial Advisers Regulations and the Securities and Futures Act (Chapter 289), as amended from time to time. By virtue of distribution to these category of investors, Daiwa Capital Markets Singapore Limited and its representatives are not required to comply with Section 36 of the Financial Advisers Act (Chapter 110) (Section 36 relates to disclosure of Daiwa Capital Markets Singapore Limited’s interest and/or its representative’s interest in securities). Recipients of this research in Singapore may contact Daiwa Capital Markets Singapore Limited in respect of any matter arising from or in connection with the research. Australia This research is distributed in Australia by Daiwa Capital Markets Stockbroking Limited and it may only be distributed in Australia to wholesale investors within the meaning of the Corporations Act. Recipients of this research in Australia may contact Daiwa Capital Markets Stockbroking Limited in respect of any matter arising from or in connection with the research. Ownership of Securities For “Ownership of Securities” information, please visit BlueMatrix disclosure Link at https://daiwa3.bluematrix.com/sellside/Disclosures.action. India This research is distributed by Daiwa Capital Markets India Private Limited (DAIWA) which is an intermediary registered with Securities & Exchange Board of India. This report is not to be considered as an offer or solicitation for any dealings in securities. While the information in this report has been compiled by DAIWA in good faith from sources believed to be reliable, no representation or warranty, express of implied, is made or given as to its accuracy, completeness or correctness. DAIWA its officers, employees, representatives and agents accept no liability whatsoever for any loss or damage whether direct, indirect, consequential or otherwise howsoever arising (whether in negligence or otherwise) out of or in connection with or from any use of or reliance on the contents of and/or omissions from this document. Consequently DAIWA expressly disclaims any and all liability for, or based on or relating to any such information contained in or errors in or omissions in this report. Accordingly, you are recommended to seek your own legal, tax or other advice and should rely solely on your own judgment, review and analysis, in evaluating the information in this document. The data contained in this document is subject to change without any prior notice DAIWA reserves its right to modify this report as maybe required from time to time. DAIWA is committed to providing independent recommendations to its Clients and would be happy to provide any information in response to any query from its Clients. This report is strictly confidential and is being furnished to you solely for your information. The information contained in this document should not be reproduced (in whole or in part) or redistributed in any form to any other person. We and our group companies, affiliates, officers, directors and employees may from time to time, have long or short positions, in and buy sell the securities thereof, of company(ies) mentioned herein or be engaged in any other transactions involving such securities and earn brokerage or other compensation or act as advisor or have the potential conflict of interest with respect to any recommendation and related information or opinion. DAIWA prohibits its analyst and their family members from maintaining a financial interest in the securities or derivatives of any companies that the analyst cover. This report is not intended or directed for distribution to, or use by any person, citizen or entity which is resident or located in any state or country or jurisdiction where such publication, distribution or use would be contrary to any statutory legislation, or regulation which would require DAIWA and its affiliates/ group companies to any registration or licensing requirements. The views expressed in the report accurately reflect the analyst’s personal views about the securities and issuers that are subject of the Report, and that no part of the analyst’s compensation was, is or will be directly or indirectly, related to the recommendations or views expressed in the Report. This report does not recommend to US recipients the use of Daiwa Capital Markets India Private Limited or any of its non – US affiliates to effect trades in any securities and is not supplied with any understanding that US recipients will direct commission business to Daiwa Capital Markets India Private Limited. Taiwan This research is distributed in Taiwan by Daiwa-Cathay Capital Markets Co., Ltd and it may only be distributed in Taiwan to institutional investors or specific investors who have signed recommendation contracts with Daiwa-Cathay Capital Markets Co., Ltd in accordance with the Operational Regulations Governing Securities Firms Recommending Trades in Securities to Customers. Recipients of this research in Taiwan may contact Daiwa-Cathay Capital Markets Co., Ltd in respect of any matter arising from or in connection with the research. Philippines This research is distributed in the Philippines by DBP-Daiwa Capital Markets Philippines, Inc. which is regulated by the Philippines Securities and Exchange Commission and the Philippines Stock Exchange, Inc. Recipients of this research in the Philippines may contact DBP-Daiwa Capital Markets Philippines, Inc. in respect of any matter arising from or in connection with the research. DBP-Daiwa Capital Markets Philippines, Inc. recommends that investors independently assess, with a professional advisor, the specific financial risks as well as the legal, regulatory, tax, accounting, and other consequences of a proposed transaction. DBP-Daiwa Capital Markets Philippines, Inc. may have positions or may be materially interested in the securities in any of the markets mentioned in the publication or may have performed other services for the issuers of such securities. For relevant securities and trading rules please visit SEC and PSE Link at http://www.sec.gov.ph/irr/AmendedIRRfinalversion.pdf and http://www.pse.com.ph/ respectively. Thailand
This research is distributed to only institutional investors in Thailand primarily by Thanachart Securities Public Company Limited (“TNS”).
This report is prepared by analysts who are employed by Daiwa Securities Group Inc. and/or its non-U.S. affiliates. While the information is from sources believed to be reliable, neither the information nor the forecasts shall be taken as a representation or warranty for which Thanachart Securities Public Company Limited, Daiwa Securities Group Inc. nor any of their respective parent, holding, subsidiaries or affiliates, nor any of their respective directors, officers, servants and employees incur any responsibility. This report is provided to you for informational purposes only and it is not, and is not to be construed as, an offer or an invitation to make an offer to sell or buy any securities. Neither Thanachart Securities Public Company Limited, Daiwa Securities Group Inc. nor any of their respective parent, holding, subsidiaries or affiliates, nor any of their respective directors, officers, servants and employees accept any liability whatsoever for any

Utilities / Philippines EDC PM
24 July 2015
- 37 -
direct or consequential loss arising from any use of this research or its contents.
The information and opinions contained herein have been compiled or arrived at from sources believed reliable. However, Thanachart Securities Public Company Limited, Daiwa Securities Group Inc. nor any of their respective parent, holding, subsidiaries or affiliates, nor any of their respective directors, officers, servants and employees make no representation or warranty, express or implied, as to their accuracy or completeness. Expressions of opinion herein are subject to change without notice. The use of any information, forecasts and opinions contained in this report shall be at the sole discretion and risk of the user.
Daiwa Securities Group Inc. and/or its non-U.S. affiliates perform and seek to perform business with companies covered in this research. Thanachart Securities Public Company Limited, Daiwa Securities Group Inc., their respective parent, holding, subsidiaries or affiliates, their respective directors, officers, servants and employees may have positions and financial interest in securities mentioned in this research. Thanachart Securities Public Company Limited, Daiwa Securities Group Inc., their respective parent, holding, subsidiaries or affiliates may from time to time perform investment banking or other services for, or solicit investment banking or other business from, any entity mentioned in this research. Therefore, investors should be aware of conflict of interest that may affect the objectivity of this research. United Kingdom This research report is produced by Daiwa Capital Markets Europe Limited and/or its affiliates and is distributed in the European Union, Iceland, Liechtenstein, Norway and Switzerland. Daiwa Capital Markets Europe Limited is authorised and regulated by The Financial Conduct Authority (“FCA”) and is a member of the London Stock Exchange, Eurex and NYSE Liffe. Daiwa Capital Markets Europe Limited and/or its affiliates may, from time to time, to the extent permitted by law, participate or invest in other financing transactions with the issuers of the securities referred to herein (the “Securities”), perform services for or solicit business from such issuers, and/or have a position or effect transactions in the Securities or options thereof and/or may have acted as an underwriter during the past twelve months for the issuer of such securities. In addition, employees of Daiwa Capital Markets Europe Limited and/or its affiliates may have positions and effect transactions in such securities or options and may serve as Directors of such issuers. Daiwa Capital Markets Europe Limited may, to the extent permitted by applicable UK law and other applicable law or regulation, effect transactions in the Securities before this material is published to recipients. This publication is intended for investors who are not Retail Clients in the United Kingdom within the meaning of the Rules of the FCA and should not therefore be distributed to such Retail Clients in the United Kingdom. Should you enter into investment business with Daiwa Capital Markets Europe’s affiliates outside the United Kingdom, we are obliged to advise that the protection afforded by the United Kingdom regulatory system may not apply; in particular, the benefits of the Financial Services Compensation Scheme may not be available. Daiwa Capital Markets Europe Limited has in place organisational arrangements for the prevention and avoidance of conflicts of interest. Our conflict management policy is available at http://www.uk.daiwacm.com/about-us/corporate-governance-regulatory . Regulatory disclosures of investment banking relationships are available at https://daiwa3.bluematrix.com/sellside/Disclosures.action. Germany This document is distributed in Germany by Daiwa Capital Markets Europe Limited, Niederlassung Frankfurt which is regulated by BaFin (Bundesanstalt fuer Finanzdienstleistungsaufsicht) for the conduct of business in Germany. Bahrain
This research material is distributed by Daiwa Capital Markets Europe Limited, Bahrain Branch, regulated by The Central Bank of Bahrain and holds Investment Business Firm – Category 2 license and having its official place of business at the Bahrain World Trade Centre, South Tower, 7th floor, P.O. Box 30069, Manama, Kingdom of Bahrain. Tel No. +973 17534452 Fax No. +973 535113
This material is provided as a reference for making investment decisions and is not intended to be a solicitation for investment. Investment decisions should be made at your own discretion and risk. Accordingly, no representation or warranty, express or implied, is made as to and no reliance should be placed on the fairness, accuracy, completeness or correctness of the information and opinions contained in this document, Content herein is based on information available at the time the research material was prepared and may be amended or otherwise changed in the future without notice. All information is intended for the private use of the person to whom it is provided without any liability whatsoever on the part of Daiwa Capital Markets Europe Limited, Bahrain Branch, any associated company or the employees thereof. If you are in doubt about the suitability of the product or the research material itself, please consult your own financial adviser. Daiwa Capital Markets Europe Limited, Bahrain Branch retains all rights related to the content of this material, which may not be redistributed or otherwise transmitted without prior consent. United States This report is distributed in the U.S. by Daiwa Capital Markets America Inc. (DCMA). It may not be accurate or complete and should not be relied upon as such. It reflects the preparer’s views at the time of its preparation, but may not reflect events occurring after its preparation; nor does it reflect DCMA’s views at any time. Neither DCMA nor the preparer has any obligation to update this report or to continue to prepare research on this subject. This report is not an offer to sell or the solicitation of any offer to buy securities. Unless this report says otherwise, any recommendation it makes is risky and appropriate only for sophisticated speculative investors able to incur significant losses. Readers should consult their financial advisors to determine whether any such recommendation is consistent with their own investment objectives, financial situation and needs. This report does not recommend to U.S. recipients the use of any of DCMA’s non-U.S. affiliates to effect trades in any security and is not supplied with any understanding that U.S. recipients of this report will direct commission business to such non-U.S. entities. Unless applicable law permits otherwise, non-U.S. customers wishing to effect a transaction in any securities referenced in this material should contact a Daiwa entity in their local jurisdiction. Most countries throughout the world have their own laws regulating the types of securities and other investment products which may be offered to their residents, as well as a process for doing so. As a result, the securities discussed in this report may not be eligible for sales in some jurisdictions. Customers wishing to obtain further information about this report should contact DCMA: Daiwa Capital Markets America Inc., Financial Square, 32 Old Slip, New York, New York 10005 (telephone 212-612-7000). Ownership of Securities For “Ownership of Securities” information please visit BlueMatrix disclosure Link at https://daiwa3.bluematrix.com/sellside/Disclosures.action. Investment Banking Relationships For “Investment Banking Relationships” please visit BlueMatrix disclosure link at https://daiwa3.bluematrix.com/sellside/Disclosures.action. DCMA Market Making For “DCMA Market Making” please visit BlueMatrix disclosure link at https://daiwa3.bluematrix.com/sellside/Disclosures.action. Research Analyst Conflicts For updates on “Research Analyst Conflicts” please visit BlueMatrix disclosure link at https://daiwa3.bluematrix.com/sellside/Disclosures.action. The principal research analysts who prepared this report have no financial interest in securities of the issuers covered in the report, are not (nor are any members of their household) an officer, director or advisory board member of the issuer(s) covered in the report, and are not aware of any material relevant conflict of interest involving the analyst or DCMA, and did not receive any compensation from the issuer during the past 12 months except as noted: no exceptions. Research Analyst Certification For updates on “Research Analyst Certification” and “Rating System” please visit BlueMatrix disclosure link at https://daiwa3.bluematrix.com/sellside/Disclosures.action. The views about any and all of the subject securities and issuers expressed in this Research Report accurately reflect the personal views of the research analyst(s) primarily responsible for this report (or the views of the firm producing the report if no individual analysts[s] is named on the report); and no part of the compensation of such analyst(s) (or no part of the compensation of the firm if no individual analyst[s)] is named on the report) was, is, or will be directly or indirectly related to the specific recommendations or views contained in this Research Report.
The following explains the rating system in the report as compared to relevant local indices, unless otherwise stated, based on the beliefs of the author of the report.
"1": the security could outperform the local index by more than 15% over the next 12 months. "2": the security is expected to outperform the local index by 5-15% over the next 12 months. "3": the security is expected to perform within 5% of the local index (better or worse) over the next 12 months. "4": the security is expected to underperform the local index by 5-15% over the next 12 months. "5": the security could underperform the local index by more than 15% over the next 12 months. Disclosure of investment ratings
Rating Percentage of total
Buy* 60.4% Hold** 26.0% Sell*** 13.6%
Source: Daiwa
Notes: data is for single-branded Daiwa research in Asia (ex Japan) and correct as of 30 June 2015. * comprised of Daiwa’s Buy and Outperform ratings.

Utilities / Philippines EDC PM
24 July 2015
- 38 -
** comprised of Daiwa’s Hold ratings. *** comprised of Daiwa’s Underperform and Sell ratings. Explanatory Document of Unregistered Credit Ratings (Moody’s Investors Service, Inc.) In order to ensure the fairness and transparency in the markets, Credit Rating Agencies became subject to the Credit Rating Agencies’ registration system based on the Financial Instruments and Exchange Act. In accordance with this Act, in soliciting customers, Financial Instruments Business Operators, etc. shall not use the credit ratings provided by unregistered Credit Rating Agencies without informing customers of the fact that those Credit Rating Agencies are not registered, and shall also inform customers of the significance and limitations of credit ratings, etc. The Significance of Registration Registered Credit Rating Agencies are subject to the following regulations: 1) Duty of good faith. 2) Establishment of control systems (fairness of the rating process, and prevention of conflict of interest, etc.). 3) Prohibition of the ratings in cases where Credit Rating Agencies have a close relationship with the issuers of the financial instruments to be rated, etc. 4) Duty to disclose information (preparation and publication of rating policies, etc. and public disclosure of explanatory documents). In addition to the above, Registered Credit Rating Agencies are subject to the supervision of the Financial Services Agency (“FSA”), and as such may be ordered to produce reports, be subject to on-site inspection, and be ordered to improve business operations, whereas unregistered Credit Rating Agencies are free from such regulations and supervision. The Name of the Credit Rating Agency Group, etc The name of the Credit Rating Agency group: Moody’s Investors Service, Inc. ("MIS") The name and registration number of the Registered Credit Rating Agency in the group: Moody’s Japan K.K. (FSA commissioner (Rating) No.2) How to acquire information related to an outline of the rating policies and methods adopted by the person who determines Credit Ratings The information is posted under “Unregistered Rating explanation” in the section on “The use of Ratings of Unregistered Agencies” on the website of Moody’s Japan K.K. (The website can be viewed after clicking on “Credit Rating Business” on the Japanese version of Moody’s website (http://www.moodys.co.jp) Assumptions, Significance and Limitations of Credit Ratings Credit ratings are Moody’s Investors Service, Inc.’s ("MIS") current opinions of the relative future credit risk of entities, credit commitments, or debt or debt-like securities. MIS defines credit risk as the risk that an entity may not meet its contractual, financial obligations as they come due and any estimated financial loss in the event of default. Credit ratings do not address any other risk, including but not limited to: liquidity risk, market value risk, or price volatility. Credit ratings do not constitute investment or financial advice, and credit ratings are not recommendations to purchase, sell, or hold particular securities. No warranty, express or implied, as to the accuracy, timeliness, completeness, merchantability or fitness for any particular purpose of any such rating or other opinion or information is given or made by MIS in any form or manner whatsoever. Based on the information received from issuers or from public sources, the credit risks of the issuers or obligations are assessed. MIS adopts all necessary measures so that the information it uses in assigning a credit rating is of sufficient quality and from sources MIS considers to be reliable. However, MIS is not an auditor and cannot in every instance independently verify or validate information received in the rating process. Additional information may be available upon request. Japan - additional notification items pursuant to Article 37 of the Financial Instruments and Exchange Law (This Notification is only applicable where report is distributed by Daiwa Securities Co. Ltd.) If you decide to enter into a business arrangement with us based on the information described in materials presented along with this document, we ask you to pay close attention to the following items. • In addition to the purchase price of a financial instrument, we will collect a trading commission* for each transaction as agreed beforehand with you. Since commissions may be included in
the purchase price or may not be charged for certain transactions, we recommend that you confirm the commission for each transaction. • In some cases, we may also charge a maximum of ¥ 2 million (including tax) per year as a standing proxy fee for our deposit of your securities, if you are a non-resident of Japan. • For derivative and margin transactions etc., we may require collateral or margin requirements in accordance with an agreement made beforehand with you. Ordinarily in such cases, the
amount of the transaction will be in excess of the required collateral or margin requirements. • There is a risk that you will incur losses on your transactions due to changes in the market price of financial instruments based on fluctuations in interest rates, exchange rates, stock prices,
real estate prices, commodity prices, and others. In addition, depending on the content of the transaction, the loss could exceed the amount of the collateral or margin requirements. • There may be a difference between bid price etc. and ask price etc. of OTC derivatives handled by us. • Before engaging in any trading, please thoroughly confirm accounting and tax treatments regarding your trading in financial instruments with such experts as certified public accountants.
*The amount of the trading commission cannot be stated here in advance because it will be determined between our company and you based on current market conditions and the content of each transaction etc.
When making an actual transaction, please be sure to carefully read the materials presented to you prior to the execution of agreement, and to take responsibility for your own decisions regarding the signing of the agreement with us. Corporate Name: Daiwa Securities Co. Ltd. Financial instruments firm: chief of Kanto Local Finance Bureau (Kin-sho) No.108 Memberships: Japan Securities Dealers Association, The Financial Futures Association of Japan Japan Securities Investment Advisers Association Type II Financial Instruments Firms Association