initiating coverage - india...
TRANSCRIPT

Sector: Oil & Gas Sector view: Neutral
Sensex: 21,143
52 Week h/l (Rs): 69.5 / 26.5
Market cap (Rscr) : 7,308
6m Avg vol (‘000Nos): 911
Bloomberg code: MRPL IB
BSE code: 500109
NSE code: MRPL
FV (Rs): 10
Price as on December 30, 2013
Company rating grid
Low High
1 2 3 4 5
Earnings Growth
Cash Flow
B/S Strength
Valuation appeal
Risk
Share price trend
40
60
80
100
120
Dec‐12 Apr‐13 Aug‐13 Dec‐13
MRPL Sensex
Share holding pattern
0%
20%
40%
60%
80%
100%
Dec‐12 Mar‐13 Jun‐13 Sep‐13
Promoter Institutions Others
Rating: BUY Target (9‐12 months): Rs51.0
CMP: Rs41.8
Upside: 22.1%
Company ReportDecember 31, 2013
Research Analyst:
Prayesh Jain [email protected]
Initiating Coverage
MRPL
Complexity gains
Mangalore Refinery and Petrochemicals Ltd (MRPL), a 71% subsidiary of ONGC, is all set to complete its long drawn US$2.4bn capacity expansion program at its refinery. Post completion the refinery 1) will have a nameplate capacity of 15 million tons per annum (mtpa) as compared to 12mtpa earlier, 2) the nelson complexity index of the refinery will increase from 6 to 9, 3) jump in distillate yield of the refinery, 4) will have capability to produce value added products from the heavier ends. These will translate into a GRM improvement of US$3‐4/bbl over a period of two years. While the outlook for GRMs at the global level is muted, MRPL will post a relatively better growth in earnings on the back of higher margins from expanded capacities. At FY15E EV/EBIDTA of 4.4x, the stock is attractively valued when compared with regional peers. We initiate coverage with a BUY rating and a 9‐month price target of Rs51. MRPL GRMs set to rise.... With the commencement of operations at the secondary processing units, the complexity of MRPL's refinery will increase from 6 to 9. This will enable to improve the crude diet of the refinery whereby it will process higher amounts of sour and heavier crude oil varieties which are cheaper when compared with the sweet and lighter varieties. Additionally, the refinery will produce higher quantities of light products which command better spreads. Commencement of single point mooring will lead to freight cost reduction. Cumulatively, these will add US$3‐4/bbl to GRMs over the next couple of years. Furthermore, these projects enjoy tax benefits which will flow down to the bottomline. ... in a weak global environment Global slowdown has impacted demand for petroleum products leading to weak product spreads. Demand recovery is expected to be slow and gradual. On the other hand, net refining capacity additions (gross additions – closures) are expected to keep pace with demand growth in the next couple of years. This, we believe, will keep GRMs at current levels for most part of CY14.
Financial summary Y/e 31 Mar (Rs m) FY13 FY14E FY15E FY16E
Revenues 657,170 737,693 816,120 845,072
yoy growth (%) 22.2 12.3 10.6 3.5
Operating profit 3,211 17,502 28,789 33,075
OPM (%) 0.5 2.4 3.5 3.9
Reported PAT (8,014) 4,683 13,080 16,330
yoy growth (%) ‐ ‐ 179.3 24.8
EPS (Rs) (4.6) 2.7 7.5 9.3
P/E (x) ‐ 15.6 5.6 4.5
Price/Book (x) 1.1 1.1 0.9 0.8
EV/EBITDA (x) 39.6 8.2 4.4 3.3
Debt/Equity (x) 1.1 1.1 0.8 0.6
RoE (%) (11.7) 7.1 18.0 19.1
RoCE (%) (1.4) 6.8 14.0 16.5 Source: Company, India Infoline Research
MRPL
2
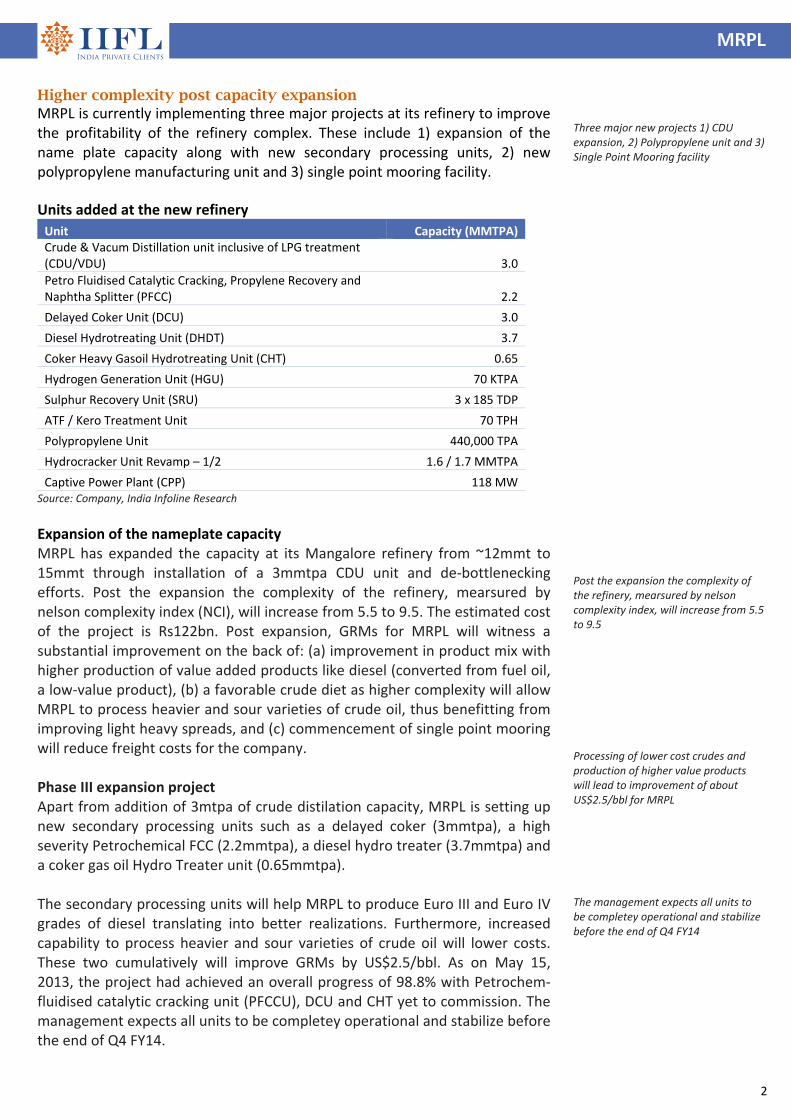
Higher complexity post capacity expansion MRPL is currently implementing three major projects at its refinery to improve the profitability of the refinery complex. These include 1) expansion of the name plate capacity along with new secondary processing units, 2) new polypropylene manufacturing unit and 3) single point mooring facility. Units added at the new refinery
Unit Capacity (MMTPA) Crude & Vacum Distillation unit inclusive of LPG treatment (CDU/VDU) 3.0
Petro Fluidised Catalytic Cracking, Propylene Recovery and Naphtha Splitter (PFCC) 2.2
Delayed Coker Unit (DCU) 3.0
Diesel Hydrotreating Unit (DHDT) 3.7
Coker Heavy Gasoil Hydrotreating Unit (CHT) 0.65
Hydrogen Generation Unit (HGU) 70 KTPA
Sulphur Recovery Unit (SRU) 3 x 185 TDP
ATF / Kero Treatment Unit 70 TPH
Polypropylene Unit 440,000 TPA
Hydrocracker Unit Revamp – 1/2 1.6 / 1.7 MMTPA
Captive Power Plant (CPP) 118 MW Source: Company, India Infoline Research
Expansion of the nameplate capacity MRPL has expanded the capacity at its Mangalore refinery from ~12mmt to 15mmt through installation of a 3mmtpa CDU unit and de‐bottlenecking efforts. Post the expansion the complexity of the refinery, mearsured by nelson complexity index (NCI), will increase from 5.5 to 9.5. The estimated cost of the project is Rs122bn. Post expansion, GRMs for MRPL will witness a substantial improvement on the back of: (a) improvement in product mix with higher production of value added products like diesel (converted from fuel oil, a low‐value product), (b) a favorable crude diet as higher complexity will allow MRPL to process heavier and sour varieties of crude oil, thus benefitting from improving light heavy spreads, and (c) commencement of single point mooring will reduce freight costs for the company. Phase III expansion project Apart from addition of 3mtpa of crude distilation capacity, MRPL is setting up new secondary processing units such as a delayed coker (3mmtpa), a high severity Petrochemical FCC (2.2mmtpa), a diesel hydro treater (3.7mmtpa) and a coker gas oil Hydro Treater unit (0.65mmtpa). The secondary processing units will help MRPL to produce Euro III and Euro IV grades of diesel translating into better realizations. Furthermore, increased capability to process heavier and sour varieties of crude oil will lower costs. These two cumulatively will improve GRMs by US$2.5/bbl. As on May 15, 2013, the project had achieved an overall progress of 98.8% with Petrochem‐fluidised catalytic cracking unit (PFCCU), DCU and CHT yet to commission. The management expects all units to be completey operational and stabilize before the end of Q4 FY14.
Three major new projects 1) CDU expansion, 2) Polypropylene unit and 3) Single Point Mooring facility Post the expansion the complexity of the refinery, mearsured by nelson complexity index, will increase from 5.5 to 9.5 Processing of lower cost crudes and production of higher value products will lead to improvement of about US$2.5/bbl for MRPL The management expects all units to be completey operational and stabilize before the end of Q4 FY14
MRPL
3
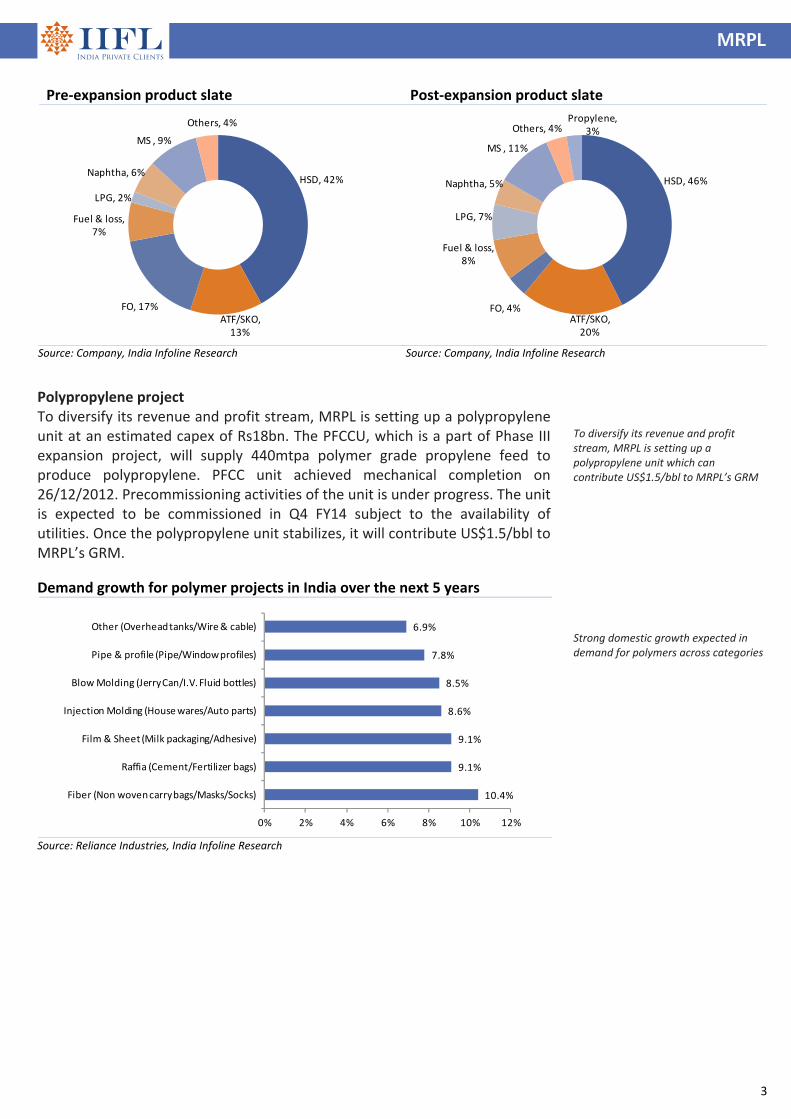
Polypropylene project To diversify its revenue and profit stream, MRPL is setting up a polypropylene unit at an estimated capex of Rs18bn. The PFCCU, which is a part of Phase III expansion project, will supply 440mtpa polymer grade propylene feed to produce polypropylene. PFCC unit achieved mechanical completion on 26/12/2012. Precommissioning activities of the unit is under progress. The unit is expected to be commissioned in Q4 FY14 subject to the availability of utilities. Once the polypropylene unit stabilizes, it will contribute US$1.5/bbl to MRPL’s GRM. Demand growth for polymer projects in India over the next 5 years
10.4%
9.1%
9.1%
8.6%
8.5%
7.8%
6.9%
0% 2% 4% 6% 8% 10% 12%
Fiber (Non woven carry bags/Masks/Socks)
Raffia (Cement/Fertilizer bags)
Film & Sheet (Milk packaging/Adhesive)
Injection Molding (House wares/Auto parts)
Blow Molding (Jerry Can/I.V. Fluid bottles)
Pipe & profile (Pipe/Window profiles)
Other (Overhead tanks/Wire & cable)
Source: Reliance Industries, India Infoline Research
To diversify its revenue and profit stream, MRPL is setting up a polypropylene unit which can contribute US$1.5/bbl to MRPL’s GRM Strong domestic growth expected in demand for polymers across categories
Pre‐expansion product slate Post‐expansion product slate
HSD, 42%
ATF/SKO, 13%
FO, 17%
Fuel & loss, 7%
LPG, 2%
Naphtha, 6%
MS , 9%
Others, 4%
HSD, 46%
ATF/SKO, 20%
FO, 4%
Fuel & loss, 8%
LPG, 7%
Naphtha, 5%
MS , 11%
Others, 4%Propylene,
3%
Source: Company, India Infoline Research Source: Company, India Infoline Research

MRPL
4
Single Point Mooring (SPM) project MRPL has set up a Single Point Mooring (SPM) project along with coastal booster pumping station within the port limits at a location of 16kms inside the sea having draft availability of 30 meters for handling Very Large Crude Carrier (VLCC) at an estimated cost of Rs10.4bn. On commencement, SPM will add US$0.5/bbl to MRPL’s GRM. SPM facility will have following advantages: Use of VLCC will reduce the average freight cost of crude Flexibility to receive opportunity crudes from West African and Latin
American countries. De‐congestion of existing jetties at New Mangalore Port Trust (NMPT) will
result in handling more petroleum products. Crude will be pumped to the Indian Strategic Petroleum Reserve Limited
underground cavern for storage of Crude oil at Mangalore and Padur.
Resolution of Iran issue to help increase GRMs and reduce interest costs MRPL, the largest Indian importer of crude oil from Iran, is all set to gain on two counts from the nuclear deal signed last month 1) GRMs will rise owing to better availability of cheaper crude and 2) lower interest costs as the risk premium reduces.
1) Improvement in GRMs: Owing to the sanctions on Iran, MRPL had to cut down import of cheaper crude from Iran and purchase more expensive crudes from the global market. The nuclear deal now paves way for higher purchase of Iran’s heaviest crude which costs about US$5‐6/bbl cheaper than other varieties. While the new units, which start operations from January, will gain substantially from this, existing units should be able to report better margins as well.
Discount of Soroosh and Nowrooz crude oil varieties compared to Iran Heavy
0
1
2
3
4
5
6
7
8
Jan‐13
Feb‐13
Mar‐13
Apr‐13
May‐13
Jun‐13
Jul‐13
Aug‐13
Sep‐13
Oct‐13
Nov‐13
Dec‐13
Source: National Iranian Oil Company, India Infoline Research
2) Cut in interest costs: Relaxation in sanction benefits MRPL as the process to make payments to Iran smoothens. It should also benefit from better credit period, thereby easing pressure on its working capital cycle and possibly some reduction in interest expenses. MRPL has seen its debt rise sharply after March. It had debt of Rs106bn (debt‐equity ratio at 1.7) at the end of Q2 FY14, compared to total loans of Rs70bn at the end of FY13. Additionally, reduction in country risk premium will also help reduce interest costs.
SPM will add US$0.5/bbl to MRPL’s GRM Relaxed sanctions paves way for import of cheaper varieties of crude oil which were earlier restricted adding to GRMs Possible reduction in working capital and reduction in country risk premium can reduce interest expense for MRPL
MRPL
5
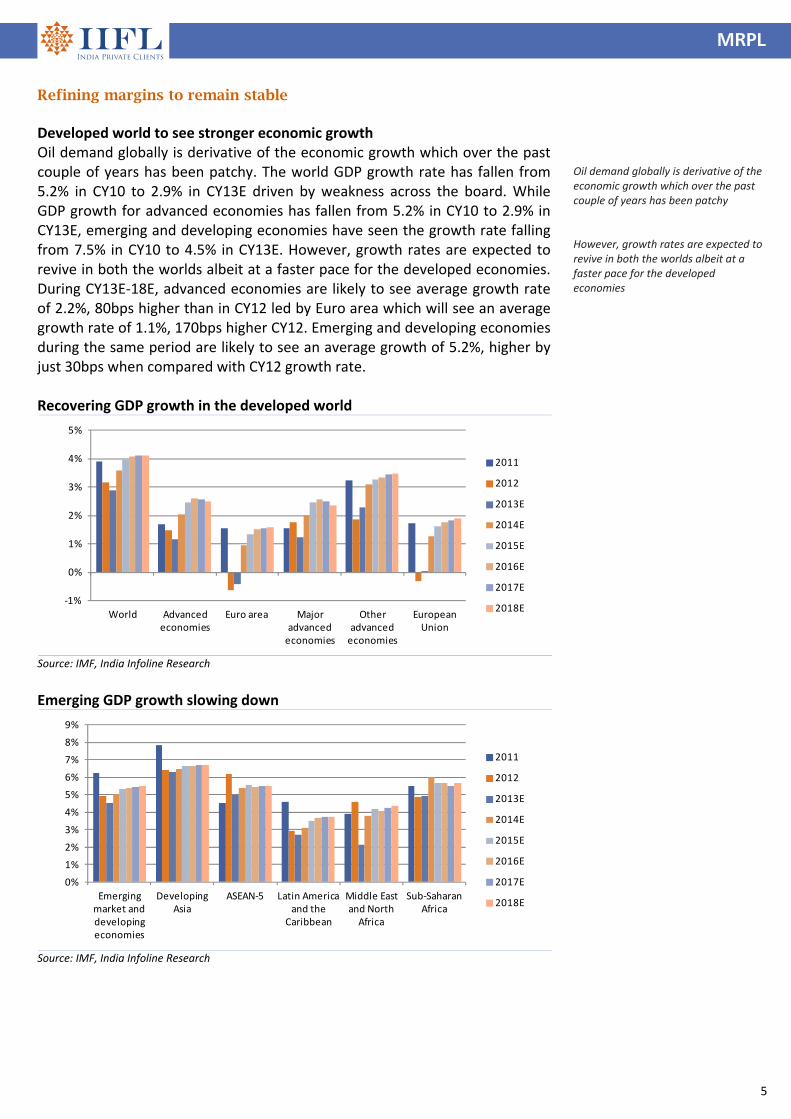
Refining margins to remain stable Developed world to see stronger economic growth Oil demand globally is derivative of the economic growth which over the past couple of years has been patchy. The world GDP growth rate has fallen from 5.2% in CY10 to 2.9% in CY13E driven by weakness across the board. While GDP growth for advanced economies has fallen from 5.2% in CY10 to 2.9% in CY13E, emerging and developing economies have seen the growth rate falling from 7.5% in CY10 to 4.5% in CY13E. However, growth rates are expected to revive in both the worlds albeit at a faster pace for the developed economies. During CY13E‐18E, advanced economies are likely to see average growth rate of 2.2%, 80bps higher than in CY12 led by Euro area which will see an average growth rate of 1.1%, 170bps higher CY12. Emerging and developing economies during the same period are likely to see an average growth of 5.2%, higher by just 30bps when compared with CY12 growth rate.
Recovering GDP growth in the developed world
‐1%
0%
1%
2%
3%
4%
5%
World Advanced economies
Euro area Major advanced economies
Other advanced economies
European Union
2011
2012
2013E
2014E
2015E
2016E
2017E
2018E
Source: IMF, India Infoline Research
Emerging GDP growth slowing down
0%
1%
2%
3%
4%
5%
6%
7%
8%
9%
Emerging market and developing economies
Developing Asia
ASEAN‐5 Latin America and the
Caribbean
Middle East and North Africa
Sub‐Saharan Africa
2011
2012
2013E
2014E
2015E
2016E
2017E
2018E
Source: IMF, India Infoline Research
Oil demand globally is derivative of the economic growth which over the past couple of years has been patchy
However, growth rates are expected to revive in both the worlds albeit at a faster pace for the developed economies
MRPL
6
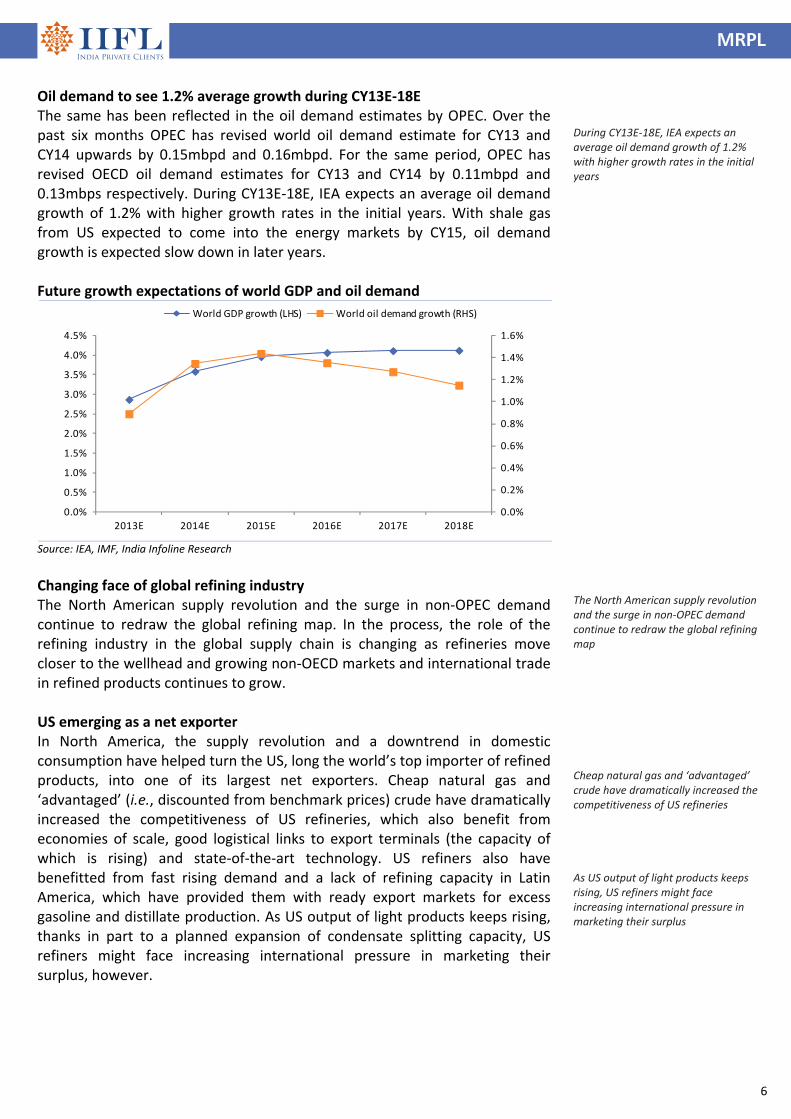
Oil demand to see 1.2% average growth during CY13E‐18E The same has been reflected in the oil demand estimates by OPEC. Over the past six months OPEC has revised world oil demand estimate for CY13 and CY14 upwards by 0.15mbpd and 0.16mbpd. For the same period, OPEC has revised OECD oil demand estimates for CY13 and CY14 by 0.11mbpd and 0.13mbps respectively. During CY13E‐18E, IEA expects an average oil demand growth of 1.2% with higher growth rates in the initial years. With shale gas from US expected to come into the energy markets by CY15, oil demand growth is expected slow down in later years.
Future growth expectations of world GDP and oil demand
0.0%
0.2%
0.4%
0.6%
0.8%
1.0%
1.2%
1.4%
1.6%
0.0%
0.5%
1.0%
1.5%
2.0%
2.5%
3.0%
3.5%
4.0%
4.5%
2013E 2014E 2015E 2016E 2017E 2018E
World GDP growth (LHS) World oil demand growth (RHS)
Source: IEA, IMF, India Infoline Research
Changing face of global refining industry The North American supply revolution and the surge in non‐OPEC demand continue to redraw the global refining map. In the process, the role of the refining industry in the global supply chain is changing as refineries move closer to the wellhead and growing non‐OECD markets and international trade in refined products continues to grow. US emerging as a net exporter In North America, the supply revolution and a downtrend in domestic consumption have helped turn the US, long the world’s top importer of refined products, into one of its largest net exporters. Cheap natural gas and ‘advantaged’ (i.e., discounted from benchmark prices) crude have dramatically increased the competitiveness of US refineries, which also benefit from economies of scale, good logistical links to export terminals (the capacity of which is rising) and state‐of‐the‐art technology. US refiners also have benefitted from fast rising demand and a lack of refining capacity in Latin America, which have provided them with ready export markets for excess gasoline and distillate production. As US output of light products keeps rising, thanks in part to a planned expansion of condensate splitting capacity, US refiners might face increasing international pressure in marketing their surplus, however.
During CY13E‐18E, IEA expects an average oil demand growth of 1.2% with higher growth rates in the initial years
The North American supply revolution and the surge in non‐OPEC demand continue to redraw the global refining map Cheap natural gas and ‘advantaged’ crude have dramatically increased the competitiveness of US refineries As US output of light products keeps rising, US refiners might face increasing international pressure in marketing their surplus
MRPL
7
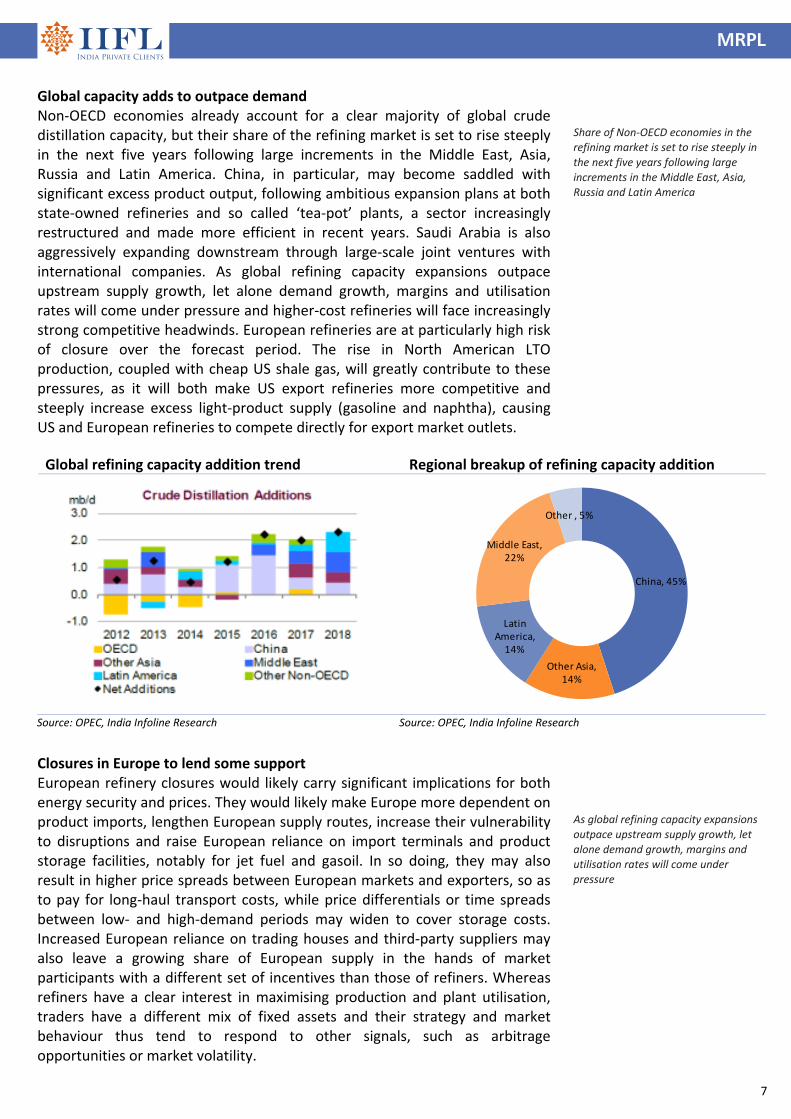
Global capacity adds to outpace demand Non‐OECD economies already account for a clear majority of global crude distillation capacity, but their share of the refining market is set to rise steeply in the next five years following large increments in the Middle East, Asia, Russia and Latin America. China, in particular, may become saddled with significant excess product output, following ambitious expansion plans at both state‐owned refineries and so called ‘tea‐pot’ plants, a sector increasingly restructured and made more efficient in recent years. Saudi Arabia is also aggressively expanding downstream through large‐scale joint ventures with international companies. As global refining capacity expansions outpace upstream supply growth, let alone demand growth, margins and utilisation rates will come under pressure and higher‐cost refineries will face increasingly strong competitive headwinds. European refineries are at particularly high risk of closure over the forecast period. The rise in North American LTO production, coupled with cheap US shale gas, will greatly contribute to these pressures, as it will both make US export refineries more competitive and steeply increase excess light‐product supply (gasoline and naphtha), causing US and European refineries to compete directly for export market outlets.
Closures in Europe to lend some support European refinery closures would likely carry significant implications for both energy security and prices. They would likely make Europe more dependent on product imports, lengthen European supply routes, increase their vulnerability to disruptions and raise European reliance on import terminals and product storage facilities, notably for jet fuel and gasoil. In so doing, they may also result in higher price spreads between European markets and exporters, so as to pay for long‐haul transport costs, while price differentials or time spreads between low‐ and high‐demand periods may widen to cover storage costs. Increased European reliance on trading houses and third‐party suppliers may also leave a growing share of European supply in the hands of market participants with a different set of incentives than those of refiners. Whereas refiners have a clear interest in maximising production and plant utilisation, traders have a different mix of fixed assets and their strategy and market behaviour thus tend to respond to other signals, such as arbitrage opportunities or market volatility.
Share of Non‐OECD economies in the refining market is set to rise steeply in
the next five years following large
increments in the Middle East, Asia, Russia and Latin America
As global refining capacity expansions
outpace upstream supply growth, let
alone demand growth, margins and utilisation rates will come under
pressure
Global refining capacity addition trend Regional breakup of refining capacity addition
China, 45%
Other Asia, 14%
Latin America, 14%
Middle East, 22%
Other , 5%
Source: OPEC, India Infoline Research Source: OPEC, India Infoline Research

MRPL
8
US Gasoline demand to weaken Based on trends in US during the last 40 years, the average miles driven declines significantly as driver’s age increases. Vehicle miles travelled falls by 45% from peak driving years (age 35 to 54) to retirement age (over age 65). Based on projections of population growth and demographic trends from the U.S. Census Bureau, an estimated 38% of the U.S. driving population will be past its peak driving period by 2020. This age group (55 and older) will represent the largest segment of the drivers. This would translate into a fall in gasoline demand. This trend will get additional thrust if US drivers accept natural gas as a preferred fuel over gasoline.
Heavy‐light spreads to reduce Increasing light heavy spreads have been one of the key drivers for strong GRMs for complex refiners in the past. This is expected to remain muted if OPEC resorts to restriction on its production as first to go under the axe are generally the less remunerative heavy and sour blocks. Furthermore, complexity with global refiners has been on a rise. This will lead to higher demand for heavier oil leading to narrower gap and reduction in benefits for complex refiners.
Heavy‐light spread is expected to remain muted if OPEC resorts to restriction on its production as first to go under the axe are generally the less remunerative heavy and sour blocks
Average miles travelled as per age groups in US Trend in population growth across age groups in US
‐
2,000
4,000
6,000
8,000
10,000
12,000
14,000
16,000
16 to 19 20 to 34 35 to 54 55 to 64 65+
miles
travelled
Age Group
0
10
20
30
40
50
60
70
80
90
16 to 19 20 to 34 35 to 54 55 to 64 65+
CY10 CY15 CY20
Age Group
mn drivers
Source: Bloomberg, India Infoline Research Source: Bloomberg, India Infoline Research

MRPL
9
Financial analysis Sensitivity to GRMs Earnings of MRPL are highly sensitive to movement in GRMs. For FY14, the sensitivity is exceedingly high as the effect of new capacities will start flowing in from end of Q4 FY14. A US$1/bbl from our assumption of US$4.75/bbl (US$4/bbl in H1 FY14) could result in losses for FY14. From FY15, with full benefits of new complex capacity the earnings riskiness will reduce. For FY15 and FY16, we have assumed GRMs of US$6.75/bbl and US$7/bbl respectively.
Sensitivity to exchange rate With prices of both raw material and end products dollar linked, changes in exchange rate have a major bearing on the earnings. With US tapering its bond buying program, possibilities of rupee depreciation are significantly high. However, if the twin deficits of India continue to reduce and inflation starts heading downwards, fall in rupee would be cushioned. We have assumed rupee to be flat at Rs61/US$ for FY14, FY15E and FY16E. For a Re1/US$ depreciation in the INR, MRPL’s EPS increases by 3‐4% during FY14E‐16E.
A US$1/bbl from our assumption of US$4.75/bbl (US$4/bbl in H1 FY14) could result in losses for FY14
For a Re1/US$ depreciation in the INR, MRPL’s EPS increases by 3‐4% during FY14E‐16E
EPS sensitivity to GRMs in FY14E EPS sensitivity to GRMs in FY15E
(3.0)
(2.0)
(1.0)
‐
1.0
2.0
3.0
4.0
5.0
3.0 3.5 4.0 4.8 5.0 5.5
US$/bbl
Rs
‐
2.0
4.0
6.0
8.0
10.0
12.0
5.0 5.5 6.0 6.8 7.0 7.5
US$/bbl
Rs
Source: Company, India Infoline Research Source: Company, India Infoline Research
EPS sensitivity to exchange rate in FY14E EPS sensitivity to exchange rate in FY15E
‐
0.5
1.0
1.5
2.0
2.5
3.0
3.5
58 59 60 61 62 63 64 65
Rs/US$
Rs
6.0
6.5
7.0
7.5
8.0
8.5
58 59 60 61 62 63 64 65
Rs/US$
Rs
Source: Company, India Infoline Research Source: Company, India Infoline Research

MRPL
10
Return ratios to improve Given the loss reported in FY13, return ratios were in the negative zone. However, we expect modest recovery in FY14 and further strengthen in FY15 and FY16. Strong cash‐flows in FY15 will enable the company to retire a substantial portion of its debt leading to jump in RoCE. RoE will remain flattish in FY16 given the negative impact of lower financial leverage. Trend in RoE and RoCE
(20)
(10)
0
10
20
30
40
50
FY08 FY09 FY10 FY11 FY12 FY13 FY14E FY15E FY16E
RoE (%) RoCE (%)
%
Source: Company, India Infoline Research
Free cash flow positive from in FY15 Given the benefits of incremental GRMs from the three new projects, we expect MRPL to report positive free cash flows for FY15E and FY16E. The company will report positive free cash flow in FY15 after four consecutive years of negative free cash flows. While there are capital expenditure plans, nothing has been finalized so far. Trend in cash flow
(60,000)
(50,000)
(40,000)
(30,000)
(20,000)
(10,000)
‐
10,000
20,000
30,000
FY12 FY13 FY14E FY15E FY16E
Operating cashflow Capital expenditure Free cash flow
Rsmn
Source: Company, India Infoline Research
We expect modest recovery in return ratios in FY14 and estimate stronger growth in FY15 and FY16
Given the benefits of incremental GRMs from the three new projects, we expect MRPL to report positive free cash flows for FY15E and FY16E

MRPL
11
Attractive valuations at FY15E EV/EBIDTA of 4.4x Given the strong recovery in earnings in FY15E and sustained strength in FY16E along with improving return ratios, increasing cash flows, strengthening balance sheet, we believe MRPL is attractively valued at 4.4x EV/EBIDTA based on FY15E estimates. As compared to global and regional peers, which are trading in the range of 5.1x‐9x, valuations look even more compelling. We initiate coverage with a BUY rating with a price target of Rs51, based on FY15E EV/EBIDTA of 5x. 1‐year forward EV/EBIDTA Bands
0
50,000
100,000
150,000
200,000
250,000
300,000
Mar‐06 Mar‐07 Mar‐08 Mar‐09 Mar‐10 Mar‐11 Mar‐12 Mar‐13
EV 3x 4x 5x 6x 7x 8x
Rs mn
Source: Company, India Infoline Research
Risks Steep fall in GRMs
Delay in stabilization of expanded capacities
Further slowdown in domestic demand

MRPL
12
Company background MRPL, a subsidiary of ONGC is a state of art grass‐root refinery located in north of Mangalore city, in Dakshin Kannada region. The refinery has got a versatile design with high flexibility to process crudes of various API and with high degree of automation. MRPL has a design capacity to process 15mtpa and has 2 Hydrocrackers producing premium diesel. It also has 2 CCRs producing unleaded petrol of high octane. Before acquisition by ONGC in March 2003, MRPL was a joint venture oil refinery promoted by Hindustan Petroleum Corporation Limited (HPCL), a public sector company and IRIL & Associates (AV Birla Group). MRPL was set up in 1988 with the initial processing capacity of 3.0mtpa that was later expanded to the present capacity of 15mtpa. The refinery was conceived to maximize middle distillates, with capability to process light to heavy and sour to sweet crudes with 24 to 46 API gravity. On 28th March 2003, ONGC acquired the total shareholding of A.V. Birla Group and further infused equity capital of Rs6bn thus making MRPL a majority held subsidiary of ONGC. The lenders also agreed to the debt restructuring package proposed by ONGC, which included, inter alia, conversion up to Rs3.6bn of their loans into equity. Subsequently, ONGC acquired equity allotted to the lenders pursuant to DRP raising ONGC's holding in MRPL to 71.62%. Physical infrastructure at MRPL refinery Crude and Vacuum Distillation Units The Atmospheric, Vacuum Distillation Units and Naphtha Splitter Unit designed by Engineers India Ltd., are heat integrated, using Pinch Technology to achieve high‐energy efficiency, thereby reducing Fuel Oil consumption and in turn reducing air emissions. Hydrocracker Units The Hydrocracker Units produce high quality Sulphur free Diesel and ATF. The Plant is designed for 100% conversion of low value Vacuum Gas Oils to lighter, low Sulphur valuable products. Soaker Visbreakers (Technology Shell/ABB Lummus, Holland) Shell Soaker Visbreaker technology under the Licence of ABB Lummus, Holland, has been adopted to upgrade heavy vacuum residue to Gas, Naphtha and Gas Oil. This is the first Unit in India to have Vacuum Flash column producing Vacuum Gas Oil that is used for supplementing the feed stock to Hydrocracker Unit and extracting maximum value from short residue. Platforming Units (technology UOP , USA) The Continuous Catalytic Regeneration Platforming Unit (CCR), a State‐of‐the‐Art Unit, produces Lead free, high Octane Motor Spirit (Petrol). Hydrogen produced as a by‐product is used in the Hydrocracker Unit. The other by‐product is LPG.
MRPL
13
Merox (technology UOP , USA) LPG Merox Unit reduces the Sulphur content in LPG. The kerosene Merox Unit converts mercaptans to disulphide. Hydrogen (Technology KTI , Holland) The Hydrogen Plant designed by KTI, Holland, produces Hydrogen by Steam Reforming of Naphtha. Hydrogen purity of 99.9% is achieved through the UOP Pressure Swing Adsorption (PSA) Unit. Bitumen (Technology M/s Porner, Austria) This Unit employs the highly efficient Biturox process given by Porner, Austria to produce various grades of asphalt. Captive Power Plant Captive Power Plant of 118.5 MW capacity for Phase I and II. Phase 1 – 45 MW Phase 2 ‐ 73.5 MW Other support facilities: Oil Jetty to receive Crude Oil and dispatch Petroleum products by ocean
tankers.
Raw Water line, 43 kms long from river Netravathi.
Well equipped laboratory
Blast proof centralized Control Room
DCS based Control Room for all Process Units and offsites.
75 Storage Tanks including 4 Horton Spheres.

14
MRPL
Financials Income statement Y/e 31 Mar (Rs m) FY13 FY14E FY15E FY16E
Revenue 657,170 737,693 816,120 845,072
Operating profit 3,211 17,502 28,789 33,075
Depreciation (6,044) (8,676) (8,879) (9,081)
Interest expense (3,286) (3,321) (2,743) (2,313)
Other income 906 1,000 1,000 1,000
Profit before tax (5,213) 6,504 18,166 22,681
Taxes (2,801) (1,821) (5,087) (6,351)
Net profit (8,014) 4,683 13,080 16,330
Balance sheet Y/e 31 Mar (Rs m) FY13 FY14E FY15E FY16E
Equity capital 17,527 17,527 17,527 17,527
Reserves 47,150 49,797 60,840 75,133
Net worth 64,677 67,323 78,367 92,660
Debt 69,798 73,798 63,798 53,798
Def tax liab (net) 7,343 7,343 7,343 7,343
Total liabilities 141,818 148,465 149,508 153,802
Fixed assets 133,351 154,878 150,999 146,917
Investments 150 150 150 150
Net working capital (7,741) (10,439) (11,549) (11,959)
Inventories 67,153 75,381 83,395 86,353
Sundry debtors 39,727 44,595 49,336 51,086
Other current assets 10,573 11,065 12,242 12,676
Sundry creditors (109,608) (123,038) (136,118) (140,947)
Other curr liabilities (15,586) (18,442) (20,403) (21,127)
Cash 16,059 3,876 9,908 18,693
Total assets 141,818 148,465 149,508 153,802
Cash flow statement Y/e 31 Mar (Rs m) FY13 FY14E FY15E FY16E
Profit before tax (5,213) 6,504 18,166 22,681
Depreciation 6,044 8,676 8,879 9,081
Tax paid (2,801) (1,821) (5,087) (6,351)
Working capital ∆ 7,842 2,698 1,110 410
Operating cashflow 5,872 16,058 23,069 25,821
Capital expenditure (27,905) (30,203) (5,000) (5,000)
Free cash flow (22,033) (14,146) 18,069 20,821
Equity raised 399 0 ‐ ‐
Investments 273 ‐ ‐ ‐
Debt financing/ disposal
11,921 4,000 (10,000) (10,000)
Dividends paid ‐ (2,037) (2,037) (2,037)
Other items 2,812 ‐ ‐ ‐
Net ∆ in cash (6,628) (12,182) 6,032 8,785
Key ratios Y/e 31 Mar FY13 FY14E FY15E FY16E
Growth matrix (%)
Revenue growth 22.2 12.3 10.6 3.5
Op profit growth (80.1) 445.1 64.5 14.9
EBIT growth ‐ ‐ 112.8 19.5
Net profit growth ‐ ‐ 179.3 24.8
Profitability ratios (%)
OPM 0.5 2.4 3.5 3.9
EBIT margin (0.3) 1.3 2.6 3.0
Net profit margin (1.2) 0.6 1.6 1.9
RoCE (1.4) 6.8 14.0 16.5
RoNW (11.7) 7.1 18.0 19.1
RoA (3.0) 1.7 4.4 5.3
Per share ratios
EPS (4.6) 2.7 7.5 9.3
Dividend per share 0.0 1.0 1.0 1.0
Cash EPS (1.1) 7.6 12.5 14.5
Book value per share 36.9 38.4 44.7 52.9
Valuation ratios (x)
P/E ‐ 15.6 5.6 4.5
P/CEPS ‐ 5.5 3.3 2.9
P/BV 1.1 1.1 0.9 0.8
EV/EBIDTA 39.6 8.2 4.4 3.3
Payout (%)
Dividend payout 0.0 43.5 15.6 12.5
Tax payout (53.7) 28.0 28.0 28.0
Liquidity ratios
Debtor days 22 22 22 22
Inventory days 37 37 37 37
Creditor days 61 61 61 61
Leverage ratios
Interest coverage (0.6) 3.0 7.6 10.8
Net debt / equity 0.8 1.0 0.7 0.4
Net debt / op. profit 16.7 4.0 1.9 1.1
Du‐Pont Analysis Y/e 31 Mar (Rs m) FY13 FY14E FY15E FY16E
Tax burden (x) 1.54 0.72 0.72 0.72
Interest burden (x) 2.70 0.66 0.87 0.91
EBIT margin (x) 0.00 0.01 0.03 0.03
Asset turnover (x) 2.48 2.65 2.74 2.72
Financial leverage (x) 3.86 4.22 4.09 3.64
RoE (%) (11.7) 7.1 18.0 19.1

Recommendation parameters for fundamental reports:
Buy – Absolute return of over +10%
Market Performer – Absolute return between ‐10% to +10%
Sell – Absolute return below ‐10%
Published in 2013. © India Infoline Ltd 2013 This report is for the personal information of the authorised recipient and is not for public distribution and should not be reproduced or redistributed without prior permission. The information provided in the document is from publicly available data and other sources, which we believe, are reliable. Efforts are made to try and ensure accuracy of data however, India Infoline and/or any of its affiliates and/or employees shall not be liable for loss or damage that may arise from use of this document. India Infoline and/or any of its affiliates and/or employees may or may not hold positions in any of the securities mentioned in the document. The report also includes analysis and views expressed by our research team. The report is purely for information purposes and does not construe to be investment recommendation/advice or an offer or solicitation of an offer to buy/sell any securities. The opinions expressed are our current opinions as of the date appearing in the material and may be subject to change from time to time without notice. Investors should not solely rely on the information contained in this document and must make investment decisions based on their own investment objectives, risk profile and financial position. The recipients of this material should take their own professional advice before acting on this information. India Infoline and/or its affiliate companies may deal in the securities mentioned herein as a broker or for any other transaction as a Market Maker, Investment Advisor, etc. to the issuer company or its connected persons. This report is published by IIFL ‘India Private Clients’ research desk. IIFL has other business units with independent research teams separated by 'Chinese walls' catering to different sets of customers having varying objectives, risk profiles, investment horizon, etc and therefore, may at times have, different and contrary views on stocks, sectors and markets. This report is not directed or intended for distribution to, or use by, any person or entity who is a citizen or resident of or located in any locality, state, country or other jurisdiction, where such distribution, publication, availability or use would be contrary to local law, regulation or which would subject IIFL and affiliates to any registration or licensing requirement within such jurisdiction. The securities described herein may or may not be eligible for sale in all jurisdictions or to certain category of investors. Persons in whose possession this document may come are required to inform themselves of and to observe such restriction. IIFL, IIFL Centre, Kamala City, Senapati Bapat Marg, Lower Parel (W), Mumbai 400 013. For Research related queries, write to: Amar Ambani, Head of Research at [email protected] or [email protected] For Sales and Account related information, write to customer care: [email protected] or call on 91‐22 4007 1000