initiating coverage idea cellular ltd. -...
TRANSCRIPT
Idea Cellular Ltd. Telecom
INITIATING COVERAGE
BUY
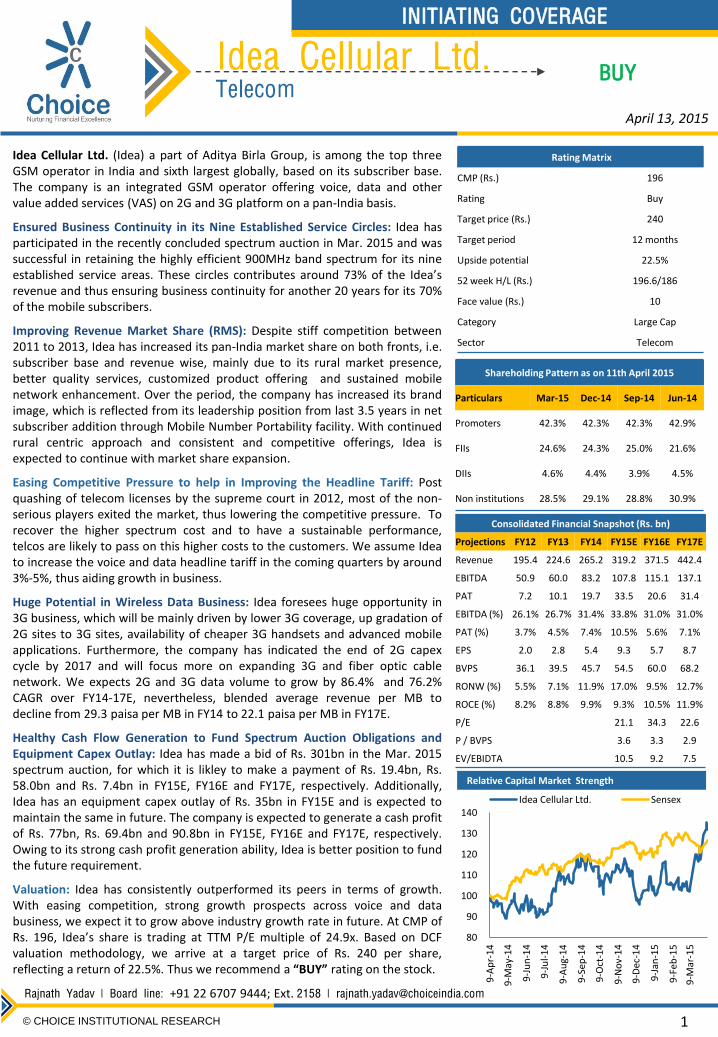
Relative Capital Market Strength
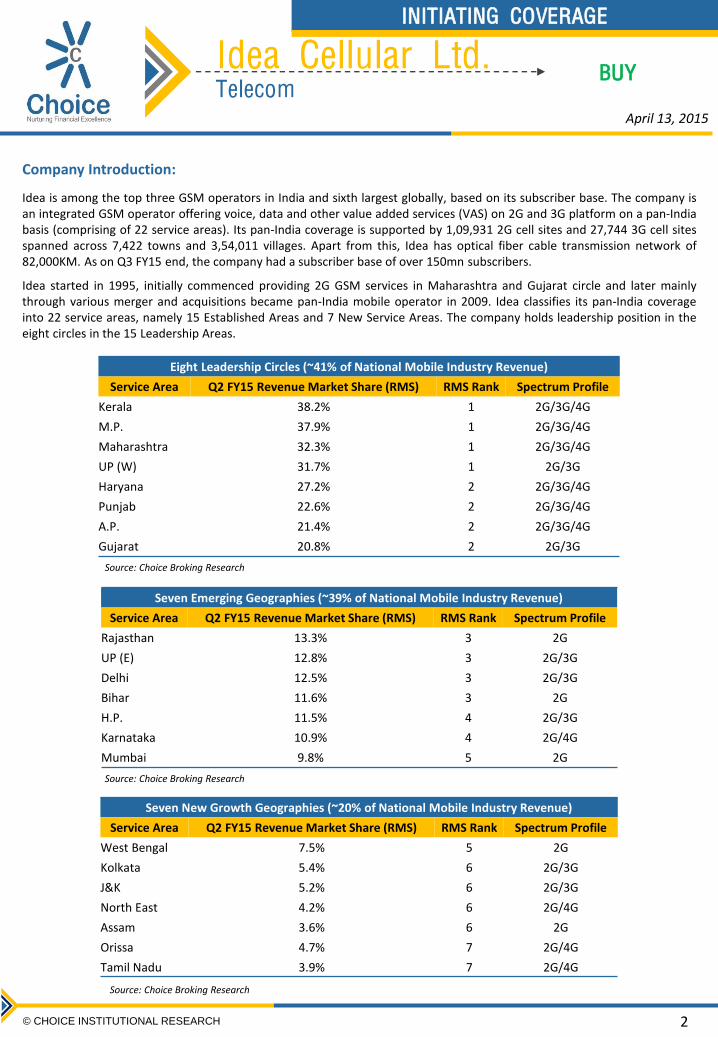
Idea Cellular Ltd. (Idea) a part of Aditya Birla Group, is among the top three GSM operator in India and sixth largest globally, based on its subscriber base. The company is an integrated GSM operator offering voice, data and other value added services (VAS) on 2G and 3G platform on a pan-India basis.
Ensured Business Continuity in its Nine Established Service Circles: Idea has participated in the recently concluded spectrum auction in Mar. 2015 and was successful in retaining the highly efficient 900MHz band spectrum for its nine established service areas. These circles contributes around 73% of the Idea’s revenue and thus ensuring business continuity for another 20 years for its 70% of the mobile subscribers.
Improving Revenue Market Share (RMS): Despite stiff competition between 2011 to 2013, Idea has increased its pan-India market share on both fronts, i.e. subscriber base and revenue wise, mainly due to its rural market presence, better quality services, customized product offering and sustained mobile network enhancement. Over the period, the company has increased its brand image, which is reflected from its leadership position from last 3.5 years in net subscriber addition through Mobile Number Portability facility. With continued rural centric approach and consistent and competitive offerings, Idea is expected to continue with market share expansion.
Easing Competitive Pressure to help in Improving the Headline Tariff: Post quashing of telecom licenses by the supreme court in 2012, most of the non-serious players exited the market, thus lowering the competitive pressure. To recover the higher spectrum cost and to have a sustainable performance, telcos are likely to pass on this higher costs to the customers. We assume Idea to increase the voice and data headline tariff in the coming quarters by around 3%-5%, thus aiding growth in business.
Huge Potential in Wireless Data Business: Idea foresees huge opportunity in 3G business, which will be mainly driven by lower 3G coverage, up gradation of 2G sites to 3G sites, availability of cheaper 3G handsets and advanced mobile applications. Furthermore, the company has indicated the end of 2G capex cycle by 2017 and will focus more on expanding 3G and fiber optic cable network. We expects 2G and 3G data volume to grow by 86.4% and 76.2% CAGR over FY14-17E, nevertheless, blended average revenue per MB to decline from 29.3 paisa per MB in FY14 to 22.1 paisa per MB in FY17E.
Healthy Cash Flow Generation to Fund Spectrum Auction Obligations and Equipment Capex Outlay: Idea has made a bid of Rs. 301bn in the Mar. 2015 spectrum auction, for which it is likley to make a payment of Rs. 19.4bn, Rs. 58.0bn and Rs. 7.4bn in FY15E, FY16E and FY17E, respectively. Additionally, Idea has an equipment capex outlay of Rs. 35bn in FY15E and is expected to maintain the same in future. The company is expected to generate a cash profit of Rs. 77bn, Rs. 69.4bn and 90.8bn in FY15E, FY16E and FY17E, respectively. Owing to its strong cash profit generation ability, Idea is better position to fund the future requirement.
Valuation: Idea has consistently outperformed its peers in terms of growth. With easing competition, strong growth prospects across voice and data business, we expect it to grow above industry growth rate in future. At CMP of Rs. 196, Idea’s share is trading at TTM P/E multiple of 24.9x. Based on DCF valuation methodology, we arrive at a target price of Rs. 240 per share, reflecting a return of 22.5%. Thus we recommend a “BUY” rating on the stock.
Rajnath Yadav | Board line: +91 22 6707 9444; Ext. 2158 | [email protected]
1 © CHOICE INSTITUTIONAL RESEARCH
April 13, 2015
Rating Matrix
CMP (Rs.) 196
Rating Buy
Target price (Rs.) 240
Target period 12 months
Upside potential 22.5%
52 week H/L (Rs.) 196.6/186
Face value (Rs.) 10
Category Large Cap
Sector Telecom
80
90
100
110
120
130
140
9-A
pr-
14
9-M
ay-1
4
9-J
un
-14
9-J
ul-
14
9-A
ug-
14
9-S
ep-1
4
9-O
ct-1
4
9-N
ov-
14
9-D
ec-1
4
9-J
an-1
5
9-F
eb-1
5
9-M
ar-1
5
Idea Cellular Ltd. Sensex
Shareholding Pattern as on 11th April 2015
Particulars Mar-15 Dec-14 Sep-14 Jun-14
Promoters 42.3% 42.3% 42.3% 42.9%
FIIs 24.6% 24.3% 25.0% 21.6%
DIIs 4.6% 4.4% 3.9% 4.5%
Non institutions 28.5% 29.1% 28.8% 30.9%
Consolidated Financial Snapshot (Rs. bn)
Projections FY12 FY13 FY14 FY15E FY16E FY17E
Revenue 195.4 224.6 265.2 319.2 371.5 442.4
EBITDA 50.9 60.0 83.2 107.8 115.1 137.1
PAT 7.2 10.1 19.7 33.5 20.6 31.4
EBITDA (%) 26.1% 26.7% 31.4% 33.8% 31.0% 31.0%
PAT (%) 3.7% 4.5% 7.4% 10.5% 5.6% 7.1%
EPS 2.0 2.8 5.4 9.3 5.7 8.7
BVPS 36.1 39.5 45.7 54.5 60.0 68.2
RONW (%) 5.5% 7.1% 11.9% 17.0% 9.5% 12.7%
ROCE (%) 8.2% 8.8% 9.9% 9.3% 10.5% 11.9%
P/E 21.1 34.3 22.6
P / BVPS 3.6 3.3 2.9
EV/EBIDTA 10.5 9.2 7.5
Idea Cellular Ltd. Telecom
INITIATING COVERAGE
BUY
2 © CHOICE INSTITUTIONAL RESEARCH
Company Introduction:
Idea is among the top three GSM operators in India and sixth largest globally, based on its subscriber base. The company is an integrated GSM operator offering voice, data and other value added services (VAS) on 2G and 3G platform on a pan-India basis (comprising of 22 service areas). Its pan-India coverage is supported by 1,09,931 2G cell sites and 27,744 3G cell sites spanned across 7,422 towns and 3,54,011 villages. Apart from this, Idea has optical fiber cable transmission network of 82,000KM. As on Q3 FY15 end, the company had a subscriber base of over 150mn subscribers.
Idea started in 1995, initially commenced providing 2G GSM services in Maharashtra and Gujarat circle and later mainly through various merger and acquisitions became pan-India mobile operator in 2009. Idea classifies its pan-India coverage into 22 service areas, namely 15 Established Areas and 7 New Service Areas. The company holds leadership position in the eight circles in the 15 Leadership Areas.
Eight Leadership Circles (~41% of National Mobile Industry Revenue)
Service Area Q2 FY15 Revenue Market Share (RMS) RMS Rank Spectrum Profile
Kerala 38.2% 1 2G/3G/4G
M.P. 37.9% 1 2G/3G/4G
Maharashtra 32.3% 1 2G/3G/4G
UP (W) 31.7% 1 2G/3G
Haryana 27.2% 2 2G/3G/4G
Punjab 22.6% 2 2G/3G/4G
A.P. 21.4% 2 2G/3G/4G
Gujarat 20.8% 2 2G/3G
Seven Emerging Geographies (~39% of National Mobile Industry Revenue)
Service Area Q2 FY15 Revenue Market Share (RMS) RMS Rank Spectrum Profile
Rajasthan 13.3% 3 2G
UP (E) 12.8% 3 2G/3G
Delhi 12.5% 3 2G/3G
Bihar 11.6% 3 2G
H.P. 11.5% 4 2G/3G
Karnataka 10.9% 4 2G/4G
Mumbai 9.8% 5 2G
Seven New Growth Geographies (~20% of National Mobile Industry Revenue)
Service Area Q2 FY15 Revenue Market Share (RMS) RMS Rank Spectrum Profile
West Bengal 7.5% 5 2G
Kolkata 5.4% 6 2G/3G
J&K 5.2% 6 2G/3G
North East 4.2% 6 2G/4G
Assam 3.6% 6 2G
Orissa 4.7% 7 2G/4G
Tamil Nadu 3.9% 7 2G/4G
Source: Choice Broking Research
April 13, 2015
Source: Choice Broking Research
Source: Choice Broking Research
Idea Cellular Ltd. Telecom
INITIATING COVERAGE
BUY
3 © CHOICE INSTITUTIONAL RESEARCH
Company Introduction (Contd…)
In 2010, the company participated in 3G spectrum auction and won bids for 11 circles covering 73% the company’s total revenue and 49% of the national mobile industry revenue. In next year Idea launched 3G services in 10 circles. Through various inter-circle roaming arrangements with other mobile operators, Idea provides 3G services in another 10 circles.
Idea also participated in Feb. 2014 spectrum auction and bagged 3G license for Delhi circle, taking total 3G coverage to 12 circles. Additionally, in the same auction, Idea won 4G licenses for eight circles covering 58% of its revenue and 39% of national mobile industry revenue.
Again in Mar. 2015, the company was successful in retaining the efficient 900MHz spectrum for the nine circles and also acquired 3G spectrum for Kolkata and 4G spectrums for Odisha and Tamil Nadu, taking the total 3G coverage to 13 circles covering 80 % of its revenue and 4G coverage to 10 circles covering 61% of its revenue.
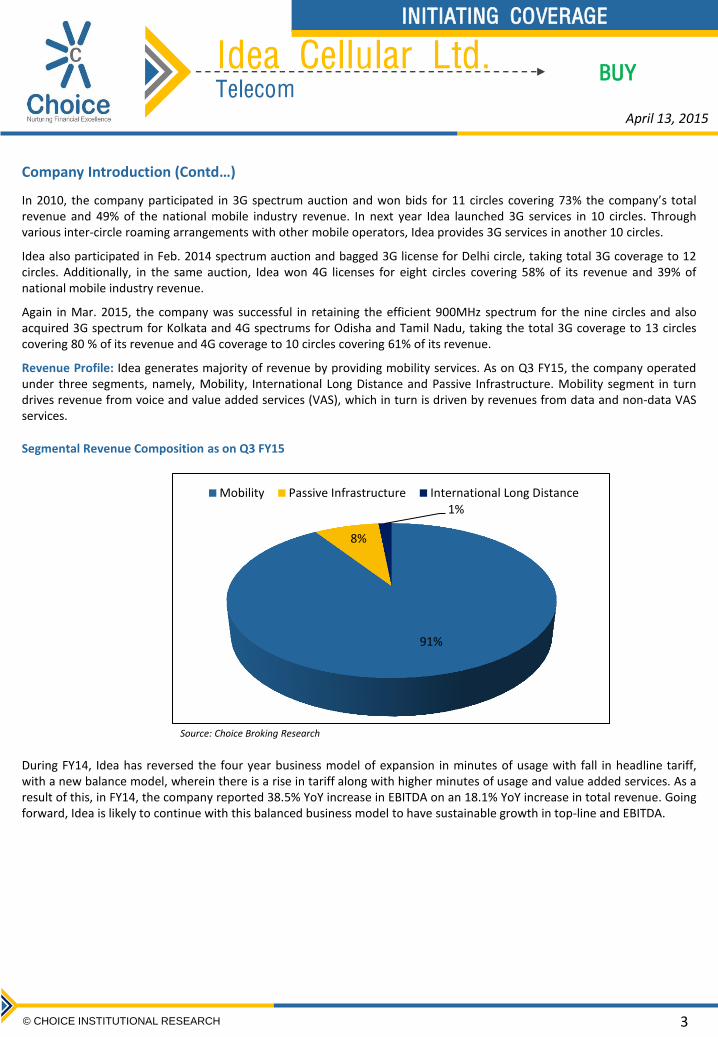
Revenue Profile: Idea generates majority of revenue by providing mobility services. As on Q3 FY15, the company operated under three segments, namely, Mobility, International Long Distance and Passive Infrastructure. Mobility segment in turn drives revenue from voice and value added services (VAS), which in turn is driven by revenues from data and non-data VAS services.
Segmental Revenue Composition as on Q3 FY15
91%
8%
1%
Mobility Passive Infrastructure International Long Distance
During FY14, Idea has reversed the four year business model of expansion in minutes of usage with fall in headline tariff, with a new balance model, wherein there is a rise in tariff along with higher minutes of usage and value added services. As a result of this, in FY14, the company reported 38.5% YoY increase in EBITDA on an 18.1% YoY increase in total revenue. Going forward, Idea is likely to continue with this balanced business model to have sustainable growth in top-line and EBITDA.
Source: Choice Broking Research
April 13, 2015
Idea Cellular Ltd. Telecom
INITIATING COVERAGE
BUY
4 © CHOICE INSTITUTIONAL RESEARCH
Company Introduction (Contd…)
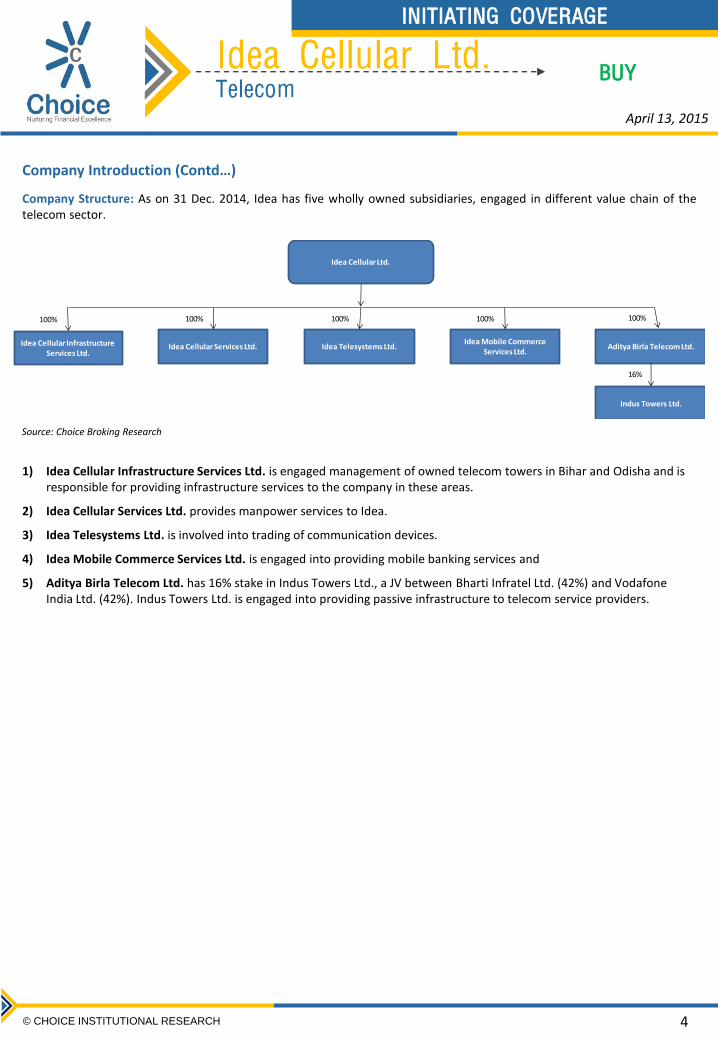
Company Structure: As on 31 Dec. 2014, Idea has five wholly owned subsidiaries, engaged in different value chain of the telecom sector.
Idea Cellular Ltd.
Idea Cellular Infrastructure Services Ltd.
Idea Cellular Services Ltd. Idea Telesystems Ltd.Idea Mobile Commerce
Services Ltd.Aditya Birla Telecom Ltd.
100% 100% 100% 100% 100%
Indus Towers Ltd.
16%
1) Idea Cellular Infrastructure Services Ltd. is engaged management of owned telecom towers in Bihar and Odisha and is responsible for providing infrastructure services to the company in these areas.
2) Idea Cellular Services Ltd. provides manpower services to Idea.
3) Idea Telesystems Ltd. is involved into trading of communication devices.
4) Idea Mobile Commerce Services Ltd. is engaged into providing mobile banking services and
5) Aditya Birla Telecom Ltd. has 16% stake in Indus Towers Ltd., a JV between Bharti Infratel Ltd. (42%) and Vodafone India Ltd. (42%). Indus Towers Ltd. is engaged into providing passive infrastructure to telecom service providers.
Source: Choice Broking Research
April 13, 2015
Idea Cellular Ltd. Telecom
INITIATING COVERAGE
BUY
5 © CHOICE INSTITUTIONAL RESEARCH
Telecom Sector Overview
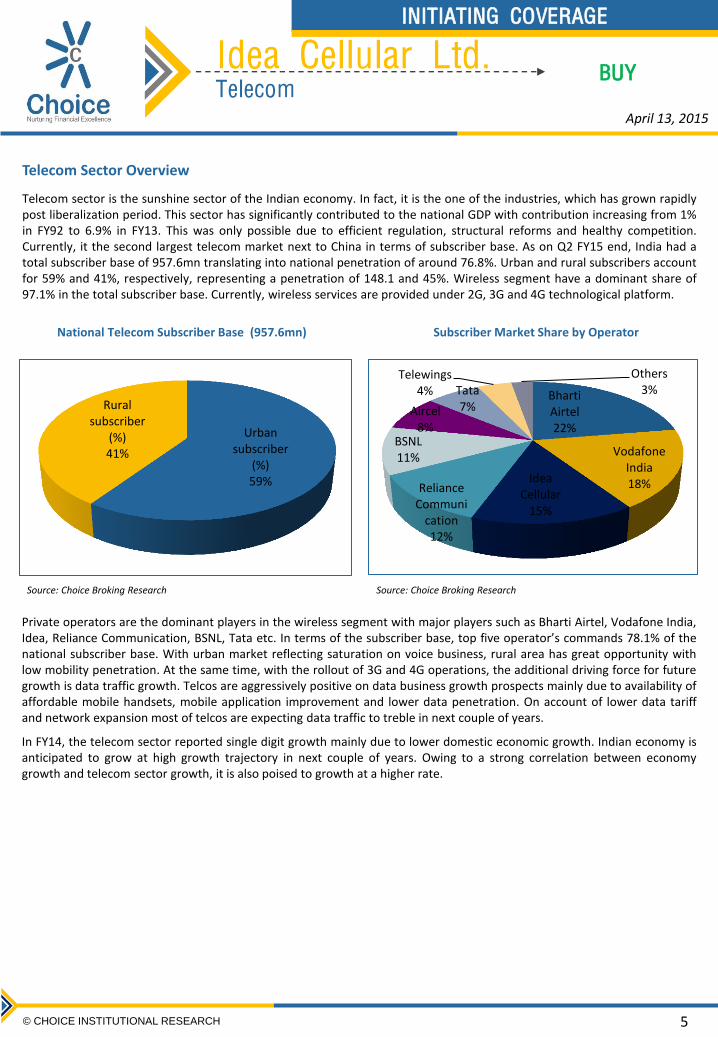
Telecom sector is the sunshine sector of the Indian economy. In fact, it is the one of the industries, which has grown rapidly post liberalization period. This sector has significantly contributed to the national GDP with contribution increasing from 1% in FY92 to 6.9% in FY13. This was only possible due to efficient regulation, structural reforms and healthy competition. Currently, it the second largest telecom market next to China in terms of subscriber base. As on Q2 FY15 end, India had a total subscriber base of 957.6mn translating into national penetration of around 76.8%. Urban and rural subscribers account for 59% and 41%, respectively, representing a penetration of 148.1 and 45%. Wireless segment have a dominant share of 97.1% in the total subscriber base. Currently, wireless services are provided under 2G, 3G and 4G technological platform.
Source: Choice Broking Research
National Telecom Subscriber Base (957.6mn) Subscriber Market Share by Operator
Urban subscriber
(%) 59%
Rural subscriber
(%) 41%
Bharti Airtel 22%
Vodafone India 18% Idea
Cellular 15%
Reliance Communi
cation 12%
BSNL 11%
Aircel 8%
Tata 7%
Telewings 4%
Others 3%
Source: Choice Broking Research
Private operators are the dominant players in the wireless segment with major players such as Bharti Airtel, Vodafone India, Idea, Reliance Communication, BSNL, Tata etc. In terms of the subscriber base, top five operator’s commands 78.1% of the national subscriber base. With urban market reflecting saturation on voice business, rural area has great opportunity with low mobility penetration. At the same time, with the rollout of 3G and 4G operations, the additional driving force for future growth is data traffic growth. Telcos are aggressively positive on data business growth prospects mainly due to availability of affordable mobile handsets, mobile application improvement and lower data penetration. On account of lower data tariff and network expansion most of telcos are expecting data traffic to treble in next couple of years.
In FY14, the telecom sector reported single digit growth mainly due to lower domestic economic growth. Indian economy is anticipated to grow at high growth trajectory in next couple of years. Owing to a strong correlation between economy growth and telecom sector growth, it is also poised to growth at a higher rate.
April 13, 2015
Idea Cellular Ltd. Telecom
INITIATING COVERAGE
BUY
6 © CHOICE INSTITUTIONAL RESEARCH
Telecom Sector Overview (Contd…)
Various Government Initiatives that will be Responsible for Future Growth:
Spectrum Trading: The government is likely to come up with spectrum trading norms in coming quarters. Under this policy, an operator can buy or sell its spectrum to other operator. This facility is likely to be available for all band of liberalized spectrum.
The government may also consider spectrum leasing, where an inefficient operator can lease the spectrum in lieu of charge. Under this facility it will be a win-win situation for both the parties as one will get the spectrum for use and other will get the charge as rent.
Pan-India Implementation of Mobile Number Portability (MNP): From 3rd May 2015, mobile user can retain their mobile number if they relocated from one telecom circle to another, irrespective of the operator. This will be beneficial for the customers.
Policy on Consolidation: The government is likely to come up a policy which will expedite the consolidation process in the telecom sector. The government may frame an easy exit policy, by which the company can close the business without losing the value on assets.
April 13, 2015
Idea Cellular Ltd. Telecom
INITIATING COVERAGE
BUY
7 © CHOICE INSTITUTIONAL RESEARCH
Investment Rationale:
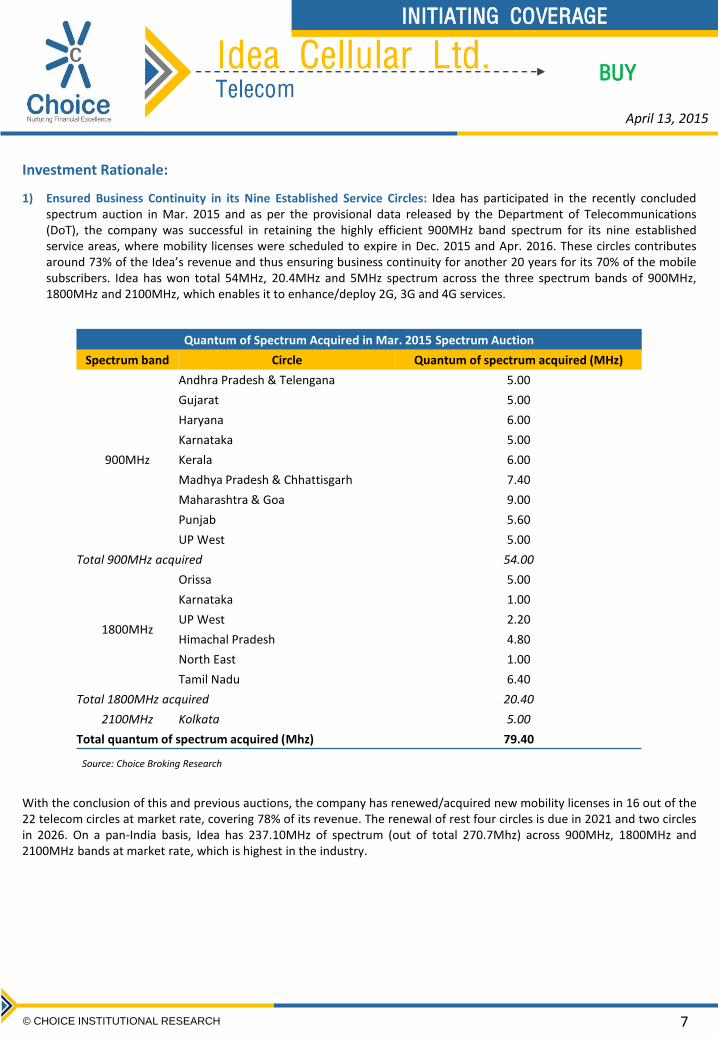
1) Ensured Business Continuity in its Nine Established Service Circles: Idea has participated in the recently concluded spectrum auction in Mar. 2015 and as per the provisional data released by the Department of Telecommunications (DoT), the company was successful in retaining the highly efficient 900MHz band spectrum for its nine established service areas, where mobility licenses were scheduled to expire in Dec. 2015 and Apr. 2016. These circles contributes around 73% of the Idea’s revenue and thus ensuring business continuity for another 20 years for its 70% of the mobile subscribers. Idea has won total 54MHz, 20.4MHz and 5MHz spectrum across the three spectrum bands of 900MHz, 1800MHz and 2100MHz, which enables it to enhance/deploy 2G, 3G and 4G services.
Quantum of Spectrum Acquired in Mar. 2015 Spectrum Auction
Spectrum band Circle Quantum of spectrum acquired (MHz)
900MHz
Andhra Pradesh & Telengana 5.00
Gujarat 5.00
Haryana 6.00
Karnataka 5.00
Kerala 6.00
Madhya Pradesh & Chhattisgarh 7.40
Maharashtra & Goa 9.00
Punjab 5.60
UP West 5.00
Total 900MHz acquired 54.00
1800MHz
Orissa 5.00
Karnataka 1.00
UP West 2.20
Himachal Pradesh 4.80
North East 1.00
Tamil Nadu 6.40
Total 1800MHz acquired 20.40
2100MHz Kolkata 5.00
Total quantum of spectrum acquired (Mhz) 79.40
Source: Choice Broking Research
With the conclusion of this and previous auctions, the company has renewed/acquired new mobility licenses in 16 out of the 22 telecom circles at market rate, covering 78% of its revenue. The renewal of rest four circles is due in 2021 and two circles in 2026. On a pan-India basis, Idea has 237.10MHz of spectrum (out of total 270.7Mhz) across 900MHz, 1800MHz and 2100MHz bands at market rate, which is highest in the industry.
April 13, 2015
Idea Cellular Ltd. Telecom
INITIATING COVERAGE
BUY
8 © CHOICE INSTITUTIONAL RESEARCH
Investment Rationale (Contd…)
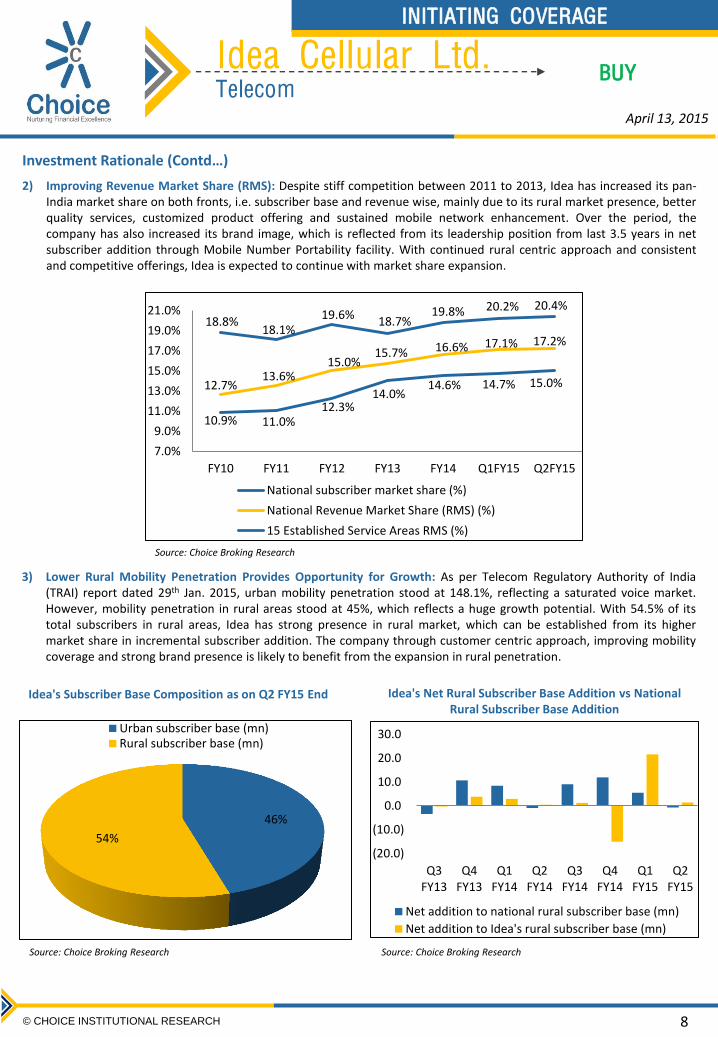
2) Improving Revenue Market Share (RMS): Despite stiff competition between 2011 to 2013, Idea has increased its pan-India market share on both fronts, i.e. subscriber base and revenue wise, mainly due to its rural market presence, better quality services, customized product offering and sustained mobile network enhancement. Over the period, the company has also increased its brand image, which is reflected from its leadership position from last 3.5 years in net subscriber addition through Mobile Number Portability facility. With continued rural centric approach and consistent and competitive offerings, Idea is expected to continue with market share expansion.
10.9% 11.0% 12.3%
14.0% 14.6% 14.7% 15.0% 12.7%
13.6% 15.0%
15.7% 16.6% 17.1% 17.2%
18.8% 18.1%
19.6% 18.7%
19.8% 20.2% 20.4%
7.0%
9.0%
11.0%
13.0%
15.0%
17.0%
19.0%
21.0%
FY10 FY11 FY12 FY13 FY14 Q1FY15 Q2FY15
National subscriber market share (%)
National Revenue Market Share (RMS) (%)
15 Established Service Areas RMS (%)
3) Lower Rural Mobility Penetration Provides Opportunity for Growth: As per Telecom Regulatory Authority of India (TRAI) report dated 29th Jan. 2015, urban mobility penetration stood at 148.1%, reflecting a saturated voice market. However, mobility penetration in rural areas stood at 45%, which reflects a huge growth potential. With 54.5% of its total subscribers in rural areas, Idea has strong presence in rural market, which can be established from its higher market share in incremental subscriber addition. The company through customer centric approach, improving mobility coverage and strong brand presence is likely to benefit from the expansion in rural penetration.
Source: Choice Broking Research
46%
54%
Urban subscriber base (mn)Rural subscriber base (mn)
(20.0)
(10.0)
0.0
10.0
20.0
30.0
Q3FY13
Q4FY13
Q1FY14
Q2FY14
Q3FY14
Q4FY14
Q1FY15
Q2FY15
Net addition to national rural subscriber base (mn)
Net addition to Idea's rural subscriber base (mn)
Source: Choice Broking Research Source: Choice Broking Research
Idea's Subscriber Base Composition as on Q2 FY15 End Idea's Net Rural Subscriber Base Addition vs National Rural Subscriber Base Addition
April 13, 2015
Idea Cellular Ltd. Telecom
INITIATING COVERAGE
BUY
9 © CHOICE INSTITUTIONAL RESEARCH
Investment Rationale (Contd…)
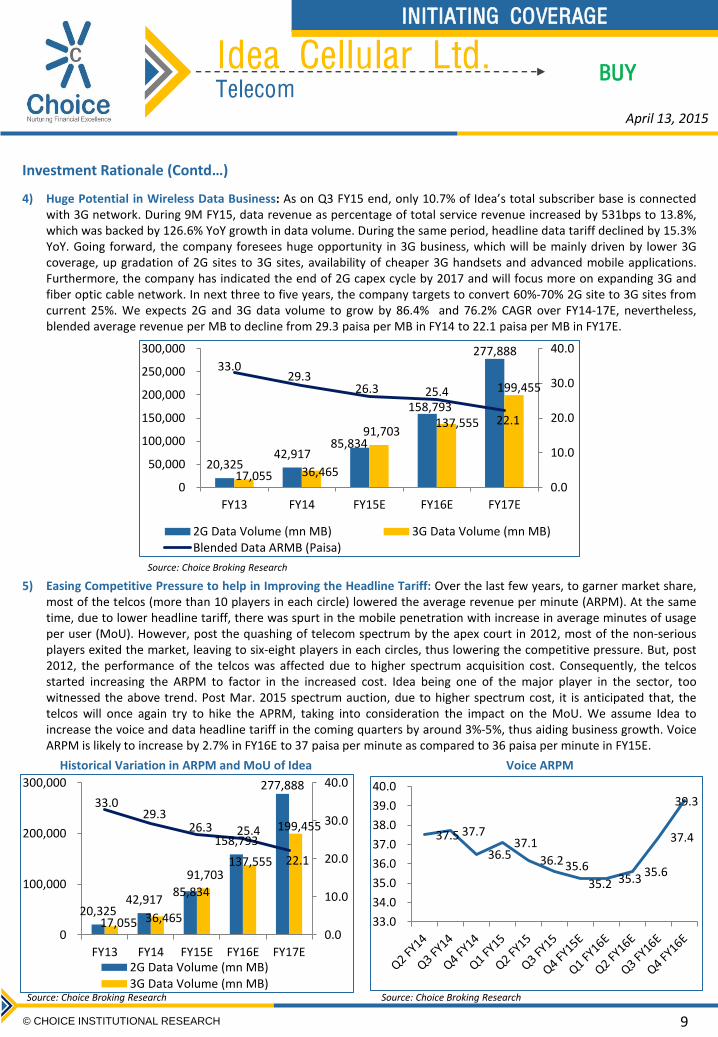
4) Huge Potential in Wireless Data Business: As on Q3 FY15 end, only 10.7% of Idea’s total subscriber base is connected with 3G network. During 9M FY15, data revenue as percentage of total service revenue increased by 531bps to 13.8%, which was backed by 126.6% YoY growth in data volume. During the same period, headline data tariff declined by 15.3% YoY. Going forward, the company foresees huge opportunity in 3G business, which will be mainly driven by lower 3G coverage, up gradation of 2G sites to 3G sites, availability of cheaper 3G handsets and advanced mobile applications. Furthermore, the company has indicated the end of 2G capex cycle by 2017 and will focus more on expanding 3G and fiber optic cable network. In next three to five years, the company targets to convert 60%-70% 2G site to 3G sites from current 25%. We expects 2G and 3G data volume to grow by 86.4% and 76.2% CAGR over FY14-17E, nevertheless, blended average revenue per MB to decline from 29.3 paisa per MB in FY14 to 22.1 paisa per MB in FY17E.
Source: Choice Broking Research
20,325 42,917
85,834
158,793
277,888
17,055 36,465
91,703 137,555
199,455
33.0 29.3
26.3 25.4
22.1
0.0
10.0
20.0
30.0
40.0
0
50,000
100,000
150,000
200,000
250,000
300,000
FY13 FY14 FY15E FY16E FY17E
2G Data Volume (mn MB) 3G Data Volume (mn MB)Blended Data ARMB (Paisa)
5) Easing Competitive Pressure to help in Improving the Headline Tariff: Over the last few years, to garner market share, most of the telcos (more than 10 players in each circle) lowered the average revenue per minute (ARPM). At the same time, due to lower headline tariff, there was spurt in the mobile penetration with increase in average minutes of usage per user (MoU). However, post the quashing of telecom spectrum by the apex court in 2012, most of the non-serious players exited the market, leaving to six-eight players in each circles, thus lowering the competitive pressure. But, post 2012, the performance of the telcos was affected due to higher spectrum acquisition cost. Consequently, the telcos started increasing the ARPM to factor in the increased cost. Idea being one of the major player in the sector, too witnessed the above trend. Post Mar. 2015 spectrum auction, due to higher spectrum cost, it is anticipated that, the telcos will once again try to hike the APRM, taking into consideration the impact on the MoU. We assume Idea to increase the voice and data headline tariff in the coming quarters by around 3%-5%, thus aiding business growth. Voice ARPM is likely to increase by 2.7% in FY16E to 37 paisa per minute as compared to 36 paisa per minute in FY15E.
April 13, 2015
20,325 42,917
85,834
158,793
277,888
17,055 36,465
91,703 137,555
199,455
33.0 29.3
26.3 25.4
22.1
0.0
10.0
20.0
30.0
40.0
0
100,000
200,000
300,000
FY13 FY14 FY15E FY16E FY17E2G Data Volume (mn MB)3G Data Volume (mn MB)
37.5 37.7
36.5 37.1
36.2 35.6
35.2 35.3 35.6
37.4
39.3
33.0
34.0
35.0
36.0
37.0
38.0
39.0
40.0
Historical Variation in ARPM and MoU of Idea Voice ARPM
Source: Choice Broking Research Source: Choice Broking Research
Idea Cellular Ltd. Telecom
INITIATING COVERAGE
BUY
10 © CHOICE INSTITUTIONAL RESEARCH
Investment Rationale (Contd…)
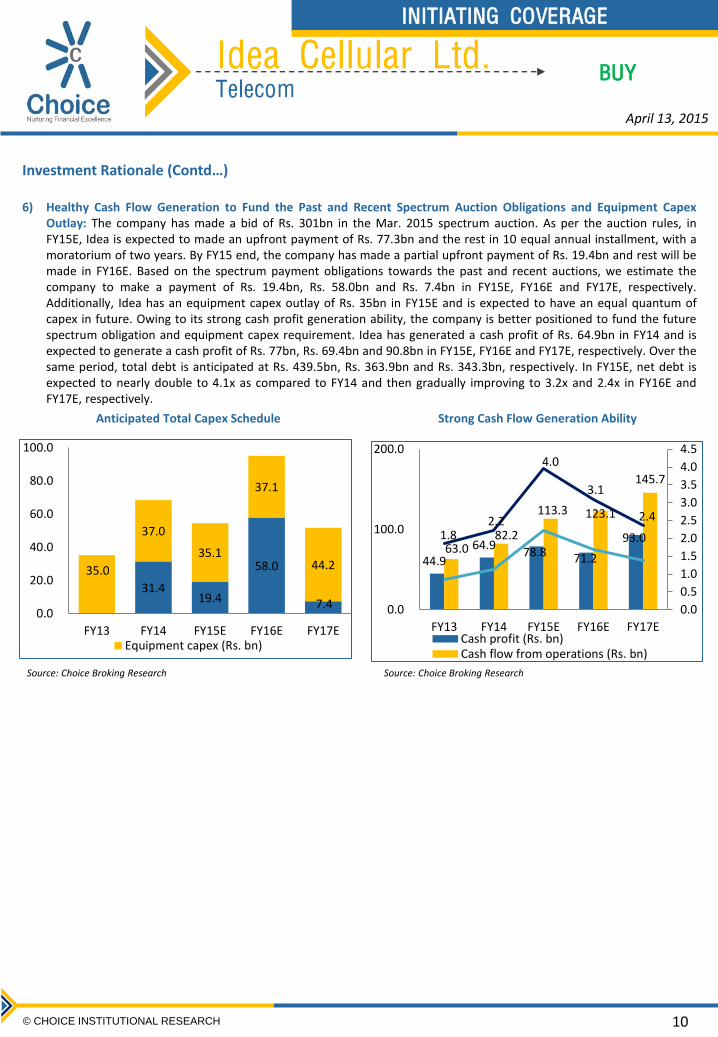
6) Healthy Cash Flow Generation to Fund the Past and Recent Spectrum Auction Obligations and Equipment Capex Outlay: The company has made a bid of Rs. 301bn in the Mar. 2015 spectrum auction. As per the auction rules, in FY15E, Idea is expected to made an upfront payment of Rs. 77.3bn and the rest in 10 equal annual installment, with a moratorium of two years. By FY15 end, the company has made a partial upfront payment of Rs. 19.4bn and rest will be made in FY16E. Based on the spectrum payment obligations towards the past and recent auctions, we estimate the company to make a payment of Rs. 19.4bn, Rs. 58.0bn and Rs. 7.4bn in FY15E, FY16E and FY17E, respectively. Additionally, Idea has an equipment capex outlay of Rs. 35bn in FY15E and is expected to have an equal quantum of capex in future. Owing to its strong cash profit generation ability, the company is better positioned to fund the future spectrum obligation and equipment capex requirement. Idea has generated a cash profit of Rs. 64.9bn in FY14 and is expected to generate a cash profit of Rs. 77bn, Rs. 69.4bn and 90.8bn in FY15E, FY16E and FY17E, respectively. Over the same period, total debt is anticipated at Rs. 439.5bn, Rs. 363.9bn and Rs. 343.3bn, respectively. In FY15E, net debt is expected to nearly double to 4.1x as compared to FY14 and then gradually improving to 3.2x and 2.4x in FY16E and FY17E, respectively.
Anticipated Total Capex Schedule Strong Cash Flow Generation Ability
31.4 19.4
58.0
7.4
35.0
37.0
35.1
37.1
44.2
0.0
20.0
40.0
60.0
80.0
100.0
FY13 FY14 FY15E FY16E FY17EEquipment capex (Rs. bn)
44.9 64.9
78.8 71.2
93.0 63.0
82.2
113.3 123.1
145.7
1.8 2.2
4.0
3.1
2.4
0.0
0.5
1.0
1.5
2.0
2.5
3.0
3.5
4.0
4.5
0.0
100.0
200.0
FY13 FY14 FY15E FY16E FY17ECash profit (Rs. bn)Cash flow from operations (Rs. bn)
Source: Choice Broking Research Source: Choice Broking Research
April 13, 2015
Idea Cellular Ltd. Telecom
INITIATING COVERAGE
BUY
11 © CHOICE INSTITUTIONAL RESEARCH
Quarterly and Financial Performance:
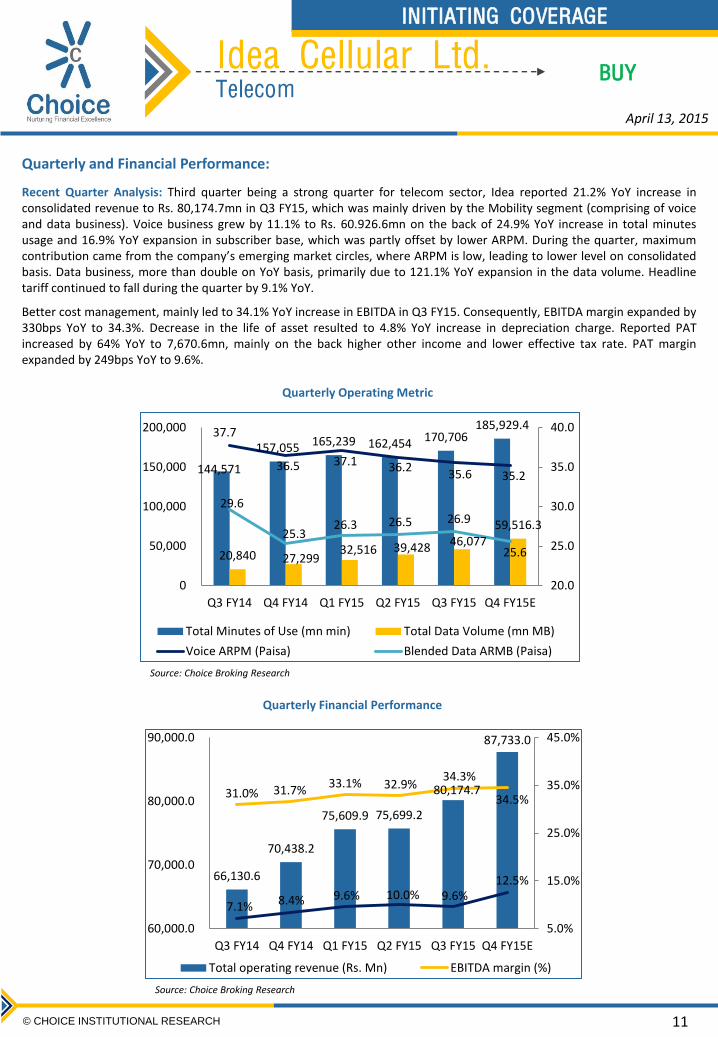
Recent Quarter Analysis: Third quarter being a strong quarter for telecom sector, Idea reported 21.2% YoY increase in consolidated revenue to Rs. 80,174.7mn in Q3 FY15, which was mainly driven by the Mobility segment (comprising of voice and data business). Voice business grew by 11.1% to Rs. 60.926.6mn on the back of 24.9% YoY increase in total minutes usage and 16.9% YoY expansion in subscriber base, which was partly offset by lower ARPM. During the quarter, maximum contribution came from the company’s emerging market circles, where ARPM is low, leading to lower level on consolidated basis. Data business, more than double on YoY basis, primarily due to 121.1% YoY expansion in the data volume. Headline tariff continued to fall during the quarter by 9.1% YoY.
Better cost management, mainly led to 34.1% YoY increase in EBITDA in Q3 FY15. Consequently, EBITDA margin expanded by 330bps YoY to 34.3%. Decrease in the life of asset resulted to 4.8% YoY increase in depreciation charge. Reported PAT increased by 64% YoY to 7,670.6mn, mainly on the back higher other income and lower effective tax rate. PAT margin expanded by 249bps YoY to 9.6%.
Quarterly Financial Performance
Quarterly Operating Metric
144,571
157,055 165,239 162,454 170,706 185,929.4
20,840 27,299 32,516 39,428 46,077
59,516.3
37.7
36.5 37.1 36.2 35.6 35.2
29.6
25.3 26.3 26.5 26.9
25.6
20.0
25.0
30.0
35.0
40.0
0
50,000
100,000
150,000
200,000
Q3 FY14 Q4 FY14 Q1 FY15 Q2 FY15 Q3 FY15 Q4 FY15E
Total Minutes of Use (mn min) Total Data Volume (mn MB)
Voice ARPM (Paisa) Blended Data ARMB (Paisa)
66,130.6
70,438.2
75,609.9 75,699.2
80,174.7
87,733.0
31.0% 31.7% 33.1% 32.9%
34.3%
34.5%
7.1% 8.4% 9.6% 10.0% 9.6% 12.5%
5.0%
15.0%
25.0%
35.0%
45.0%
60,000.0
70,000.0
80,000.0
90,000.0
Q3 FY14 Q4 FY14 Q1 FY15 Q2 FY15 Q3 FY15 Q4 FY15E
Total operating revenue (Rs. Mn) EBITDA margin (%)
Source: Choice Broking Research
Source: Choice Broking Research
April 13, 2015
Idea Cellular Ltd. Telecom
INITIATING COVERAGE
BUY
12 © CHOICE INSTITUTIONAL RESEARCH
Quarterly and Financial Performance (Contd…)
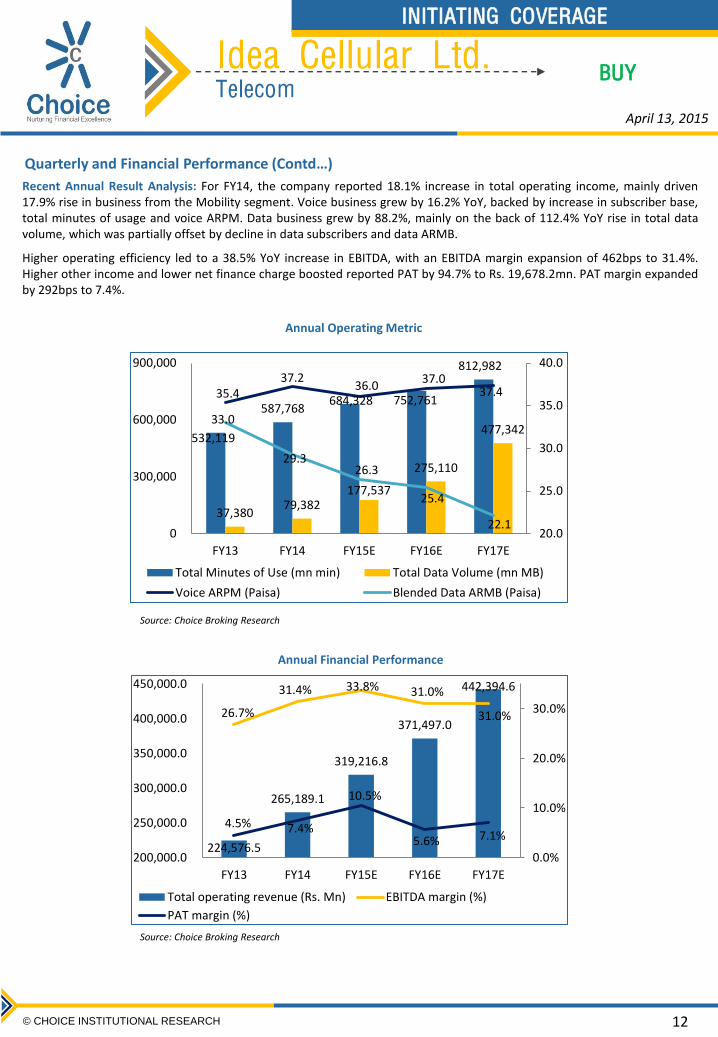
Recent Annual Result Analysis: For FY14, the company reported 18.1% increase in total operating income, mainly driven 17.9% rise in business from the Mobility segment. Voice business grew by 16.2% YoY, backed by increase in subscriber base, total minutes of usage and voice ARPM. Data business grew by 88.2%, mainly on the back of 112.4% YoY rise in total data volume, which was partially offset by decline in data subscribers and data ARMB.
Higher operating efficiency led to a 38.5% YoY increase in EBITDA, with an EBITDA margin expansion of 462bps to 31.4%. Higher other income and lower net finance charge boosted reported PAT by 94.7% to Rs. 19,678.2mn. PAT margin expanded by 292bps to 7.4%.
Annual Operating Metric
Annual Financial Performance
532,119
587,768 684,328 752,761
812,982
37,380 79,382
177,537
275,110
477,342
35.4 37.2
36.0 37.0
37.4
33.0
29.3 26.3
25.4
22.1 20.0
25.0
30.0
35.0
40.0
0
300,000
600,000
900,000
FY13 FY14 FY15E FY16E FY17E
Total Minutes of Use (mn min) Total Data Volume (mn MB)
Voice ARPM (Paisa) Blended Data ARMB (Paisa)
224,576.5
265,189.1
319,216.8
371,497.0
442,394.6
26.7%
31.4% 33.8% 31.0%
31.0%
4.5% 7.4%
10.5%
5.6% 7.1%
0.0%
10.0%
20.0%
30.0%
200,000.0
250,000.0
300,000.0
350,000.0
400,000.0
450,000.0
FY13 FY14 FY15E FY16E FY17E
Total operating revenue (Rs. Mn) EBITDA margin (%)
PAT margin (%)
Source: Choice Broking Research
Source: Choice Broking Research
April 13, 2015
Idea Cellular Ltd. Telecom
INITIATING COVERAGE
BUY
13 © CHOICE INSTITUTIONAL RESEARCH
Quarterly and Financial Performance (Contd…)
Expectations for Q4 FY15E, FY15E and FY16E and FY17E: For Q4 FY15, Idea is expected to report a 24.6% YoY growth in top-line to Rs. 87.733mn, primarily due to 24.9% YoY increase in revenue from the Mobility segment. Voice business is likely to grow by 13.9% YoY, mainly backed by 18.4% YoY increase in total minutes of usage and 14.4% YoY increase in subscriber base, which is expected to be partially offset by 3.4% YoY decline in voice ARPM. Data business is likely to more than double mostly on the back of 118% YoY increase in total data volume. Data ARMB to continue its downward trend by posting a 10% YoY decline.
Total operating expenditure to increase by 19.3% YoY leading to 35.8% YoY rise in EBITDA. EBITDA margin to expand by 286bps to 34.5%. Reported PAT to increase by 86.6% YoY to Rs. 11,006.2mn with PAT margin of 12.5% representing an expansion of 417bps YoY.
As a result, for FY15E, the company is likely to report 70.3% YoY rise in PAT to Rs. 33,517.6mn on total operating revenue of Rs. 3,19,216.8bn, which represents a growth of 20.4% YoY. EBITDA margin and PAT margin is expected to be at 33.8% and 10.5%, respectively, with expansion of 240bps and 308bps YoY.
With expansion in subscriber base coupled with increase in MoU & data volume and headline tariff, Idea is anticipated to report a top-line growth of 16.4% and 19.1% YoY to Rs. 3,71,497mn and Rs. 4,42,394.6mn in FY16E and FY17E, respectively. However, due to higher operating cost, EBITDA is expected to growth by 6.8% to Rs. 1,15,109.9mn in FY16E. A EBITDA growth of 19.1% is expected in FY17E. Reported PAT to increase by 5.6% and 7.1% YoY in FY16E and FY17E, respectively.
Risk and Concerns:
Lower Economic Growth to Pose Risk for the Sector: Telecom sector growth is strongly correlated with the growth in the economy. Higher economic growth is expected to increase the purchasing power, which in turn will be beneficial for the telecom sector. Thus lower than expected economic growth will be negative for the whole sector. Idea will also affected due to relatively higher concentration towards the rural areas.
Intense Competition from Existing/New Operators: The sector is sensitive to tariff war and has bitter experience in the past. Pricing pressure from existing/new operators in the current environment of higher regulatory cost will be negative for the sector. A tariff hike of 3%-5% in voice and data pricing is factored in the financial forecasting and valuation. Due to intense competition, if the company is not able to pass on the cost to the customers, it will affect the financial performance of the company.
Lower than Expected Mobile Internet Adoption: Whole sector is betting on the data business growth and Idea being a major player in the sector is bullish, mainly due to availability of affordable smartphones, low coverage and improved mobile application. For financial forecasting, we have factored a data volume growth of 123.6% in FY15E and 55% in FY16E. Lower than expected mobile data growth will be negative for the company.
Unfavorable Court Ruling Related to One Time Spectrum Charge: Idea has filed a petition before the Bombay High Court for the penalty of Rs. 21,135mn imposed by the Department of Telecommunications for holding excess spectrum. Currently the case is pending for final hearing and any unfavorable ruling by the court will be negative for the company. The potential impact is likely to be Rs. 5.8 per share.
Extended Loss by New Circles: In 2010, the company has launched services in new areas which are currently loss making. The strong performance in the established areas is compensating the loss in new circles. The inability of company to turnaround the performance in new circles will affect the profitability.
April 13, 2015
Idea Cellular Ltd. Telecom
INITIATING COVERAGE
BUY
14 © CHOICE INSTITUTIONAL RESEARCH
Peer Group Valuation
Peer Group Comparison
Companies CMP (Rs.)
MCAP (Rs.mn)
Stock Return (%) LTM Revenue (Rs. mn)
LTM EBIDTA
Margin (%)
LTM PAT Margin (%) 1M 3M 6M 12M
Idea Cellular Ltd. 196 708,083 25.9% 27.3% 17.2% 28.7% 301,922.0 33.0% 9.4% Bharti Airtel Ltd. 411 1,644,331 18.4% 14.1% 0.6% 27.1% 912,432.0 33.4% 5.4% Reliance Communications Ltd.
72 172,726 0.8% -17.8% -39.5% -53.0% 211,110.0 32.2% 3.0%
Peer Group Comparison
Companies EPS (Rs.) BVPS (Rs.)
DPS (Rs.)
Debt Equity Ratio
RoE (%) RoCE (%)
P / E (x)
P / B (x)
EV / EBITDA (x)
Idea Cellular Ltd. 7.9 61.9 0.4 0.7 12.7% 11.9% 24.9 3.2 8.2 Bharti Airtel Ltd. 12.2 153.9 1.8 1.1 7.9% 22.8% 33.6 2.7 7.5 Reliance Communications Ltd.
2.7 159.0 0.0 0.8 1.7% -1.2% 26.9 0.5 6.9
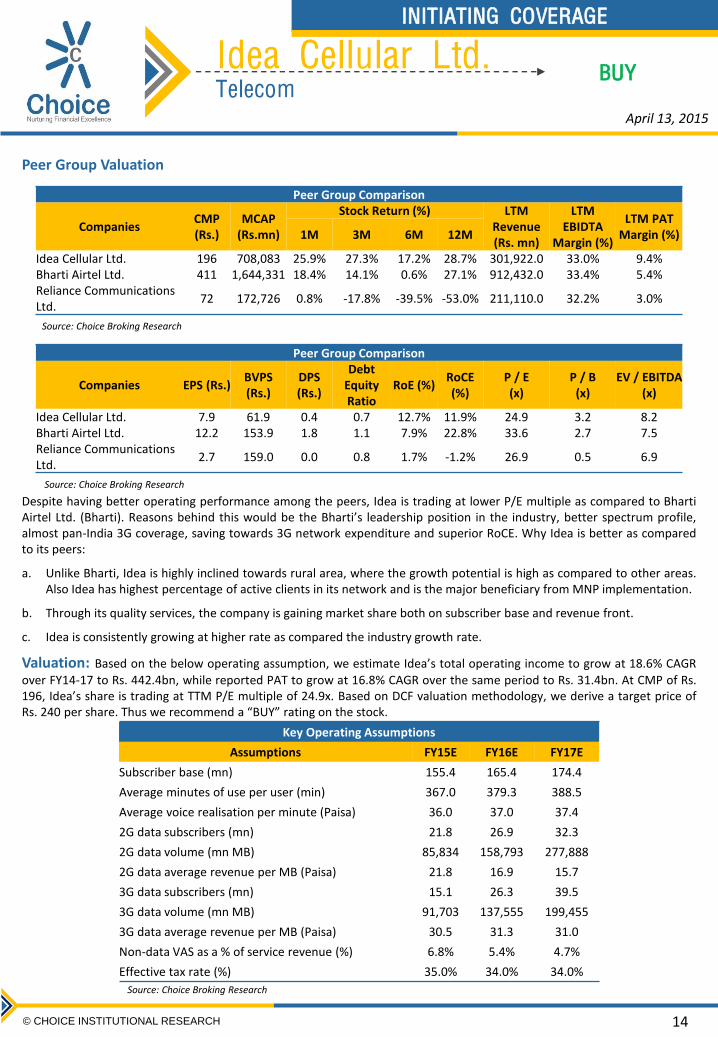
Despite having better operating performance among the peers, Idea is trading at lower P/E multiple as compared to Bharti Airtel Ltd. (Bharti). Reasons behind this would be the Bharti’s leadership position in the industry, better spectrum profile, almost pan-India 3G coverage, saving towards 3G network expenditure and superior RoCE. Why Idea is better as compared to its peers:
a. Unlike Bharti, Idea is highly inclined towards rural area, where the growth potential is high as compared to other areas. Also Idea has highest percentage of active clients in its network and is the major beneficiary from MNP implementation.
b. Through its quality services, the company is gaining market share both on subscriber base and revenue front.
c. Idea is consistently growing at higher rate as compared the industry growth rate.
Valuation: Based on the below operating assumption, we estimate Idea’s total operating income to grow at 18.6% CAGR
over FY14-17 to Rs. 442.4bn, while reported PAT to grow at 16.8% CAGR over the same period to Rs. 31.4bn. At CMP of Rs. 196, Idea’s share is trading at TTM P/E multiple of 24.9x. Based on DCF valuation methodology, we derive a target price of Rs. 240 per share. Thus we recommend a “BUY” rating on the stock.
Source: Choice Broking Research
Source: Choice Broking Research
April 13, 2015
Key Operating Assumptions
Assumptions FY15E FY16E FY17E
Subscriber base (mn) 155.4 165.4 174.4
Average minutes of use per user (min) 367.0 379.3 388.5
Average voice realisation per minute (Paisa) 36.0 37.0 37.4
2G data subscribers (mn) 21.8 26.9 32.3
2G data volume (mn MB) 85,834 158,793 277,888
2G data average revenue per MB (Paisa) 21.8 16.9 15.7
3G data subscribers (mn) 15.1 26.3 39.5
3G data volume (mn MB) 91,703 137,555 199,455
3G data average revenue per MB (Paisa) 30.5 31.3 31.0
Non-data VAS as a % of service revenue (%) 6.8% 5.4% 4.7%
Effective tax rate (%) 35.0% 34.0% 34.0%
Source: Choice Broking Research
Idea Cellular Ltd. Telecom
INITIATING COVERAGE
BUY
15 © CHOICE INSTITUTIONAL RESEARCH
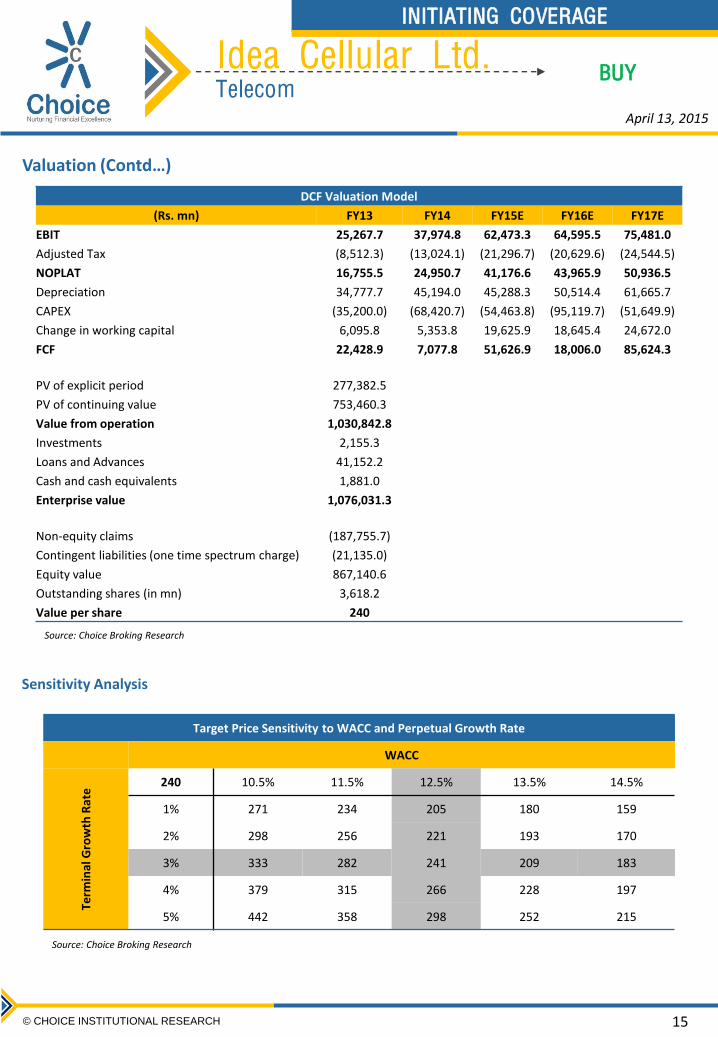
Valuation (Contd…)
DCF Valuation Model
(Rs. mn) FY13 FY14 FY15E FY16E FY17E
EBIT 25,267.7 37,974.8 62,473.3 64,595.5 75,481.0
Adjusted Tax (8,512.3) (13,024.1) (21,296.7) (20,629.6) (24,544.5)
NOPLAT 16,755.5 24,950.7 41,176.6 43,965.9 50,936.5
Depreciation 34,777.7 45,194.0 45,288.3 50,514.4 61,665.7
CAPEX (35,200.0) (68,420.7) (54,463.8) (95,119.7) (51,649.9)
Change in working capital 6,095.8 5,353.8 19,625.9 18,645.4 24,672.0
FCF 22,428.9 7,077.8 51,626.9 18,006.0 85,624.3
PV of explicit period 277,382.5
PV of continuing value 753,460.3
Value from operation 1,030,842.8
Investments 2,155.3
Loans and Advances 41,152.2
Cash and cash equivalents 1,881.0
Enterprise value 1,076,031.3
Non-equity claims (187,755.7)
Contingent liabilities (one time spectrum charge) (21,135.0)
Equity value 867,140.6
Outstanding shares (in mn) 3,618.2
Value per share 240
Source: Choice Broking Research
Sensitivity Analysis
Target Price Sensitivity to WACC and Perpetual Growth Rate
WACC
Term
inal
Gro
wth
Rat
e 240 10.5% 11.5% 12.5% 13.5% 14.5%
1% 271 234 205 180 159
2% 298 256 221 193 170
3% 333 282 241 209 183
4% 379 315 266 228 197
5% 442 358 298 252 215
Source: Choice Broking Research
April 13, 2015
Idea Cellular Ltd. Telecom
INITIATING COVERAGE
BUY
16 © CHOICE INSTITUTIONAL RESEARCH
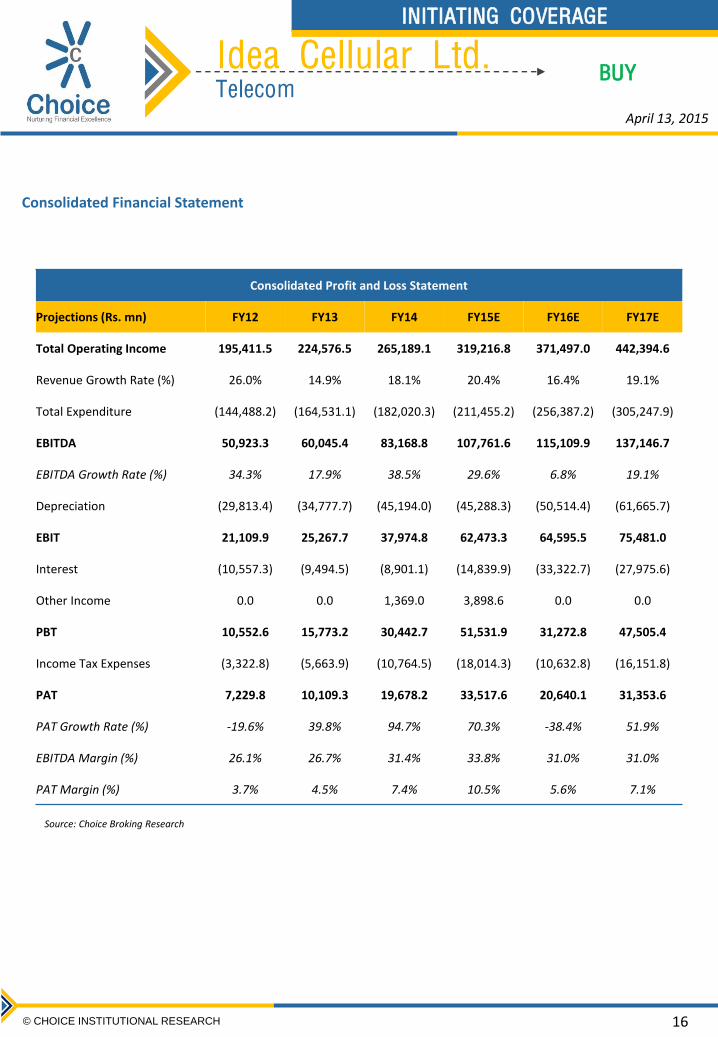
Consolidated Financial Statement
Consolidated Profit and Loss Statement
Projections (Rs. mn) FY12 FY13 FY14 FY15E FY16E FY17E
Total Operating Income 195,411.5 224,576.5 265,189.1 319,216.8 371,497.0 442,394.6
Revenue Growth Rate (%) 26.0% 14.9% 18.1% 20.4% 16.4% 19.1%
Total Expenditure (144,488.2) (164,531.1) (182,020.3) (211,455.2) (256,387.2) (305,247.9)
EBITDA 50,923.3 60,045.4 83,168.8 107,761.6 115,109.9 137,146.7
EBITDA Growth Rate (%) 34.3% 17.9% 38.5% 29.6% 6.8% 19.1%
Depreciation (29,813.4) (34,777.7) (45,194.0) (45,288.3) (50,514.4) (61,665.7)
EBIT 21,109.9 25,267.7 37,974.8 62,473.3 64,595.5 75,481.0
Interest (10,557.3) (9,494.5) (8,901.1) (14,839.9) (33,322.7) (27,975.6)
Other Income 0.0 0.0 1,369.0 3,898.6 0.0 0.0
PBT 10,552.6 15,773.2 30,442.7 51,531.9 31,272.8 47,505.4
Income Tax Expenses (3,322.8) (5,663.9) (10,764.5) (18,014.3) (10,632.8) (16,151.8)
PAT 7,229.8 10,109.3 19,678.2 33,517.6 20,640.1 31,353.6
PAT Growth Rate (%) -19.6% 39.8% 94.7% 70.3% -38.4% 51.9%
EBITDA Margin (%) 26.1% 26.7% 31.4% 33.8% 31.0% 31.0%
PAT Margin (%) 3.7% 4.5% 7.4% 10.5% 5.6% 7.1%
April 13, 2015
Source: Choice Broking Research
Idea Cellular Ltd. Telecom
INITIATING COVERAGE
BUY
17 © CHOICE INSTITUTIONAL RESEARCH
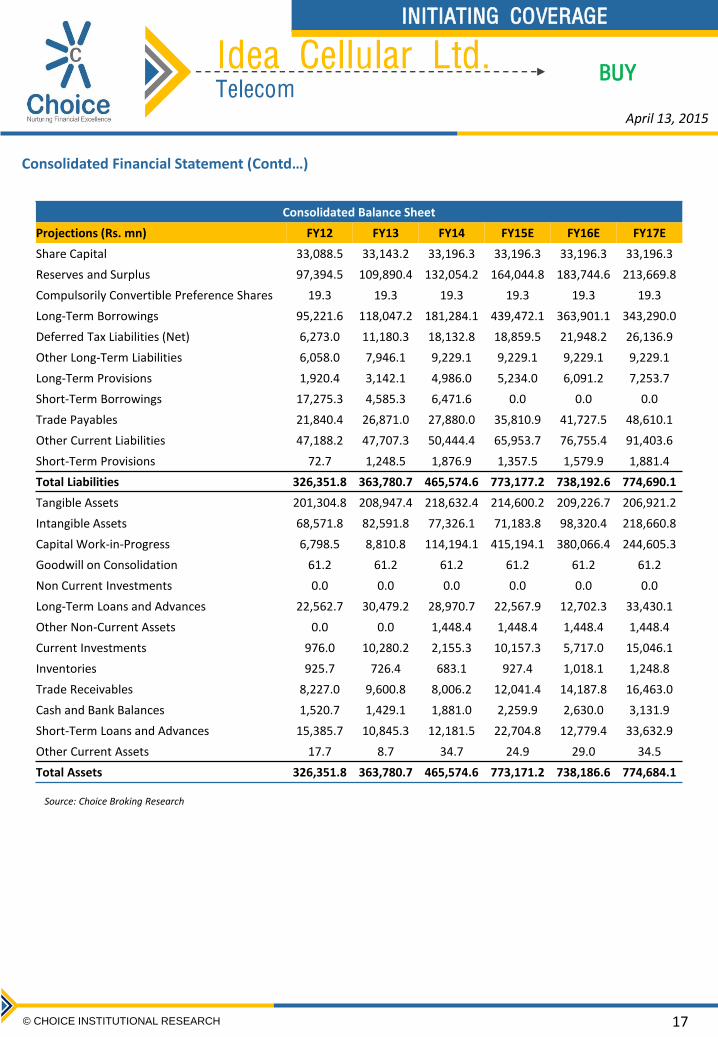
Consolidated Financial Statement (Contd…)
Consolidated Balance Sheet
Projections (Rs. mn) FY12 FY13 FY14 FY15E FY16E FY17E
Share Capital 33,088.5 33,143.2 33,196.3 33,196.3 33,196.3 33,196.3
Reserves and Surplus 97,394.5 109,890.4 132,054.2 164,044.8 183,744.6 213,669.8
Compulsorily Convertible Preference Shares 19.3 19.3 19.3 19.3 19.3 19.3
Long-Term Borrowings 95,221.6 118,047.2 181,284.1 439,472.1 363,901.1 343,290.0
Deferred Tax Liabilities (Net) 6,273.0 11,180.3 18,132.8 18,859.5 21,948.2 26,136.9
Other Long-Term Liabilities 6,058.0 7,946.1 9,229.1 9,229.1 9,229.1 9,229.1
Long-Term Provisions 1,920.4 3,142.1 4,986.0 5,234.0 6,091.2 7,253.7
Short-Term Borrowings 17,275.3 4,585.3 6,471.6 0.0 0.0 0.0
Trade Payables 21,840.4 26,871.0 27,880.0 35,810.9 41,727.5 48,610.1
Other Current Liabilities 47,188.2 47,707.3 50,444.4 65,953.7 76,755.4 91,403.6
Short-Term Provisions 72.7 1,248.5 1,876.9 1,357.5 1,579.9 1,881.4
Total Liabilities 326,351.8 363,780.7 465,574.6 773,177.2 738,192.6 774,690.1
Tangible Assets 201,304.8 208,947.4 218,632.4 214,600.2 209,226.7 206,921.2
Intangible Assets 68,571.8 82,591.8 77,326.1 71,183.8 98,320.4 218,660.8
Capital Work-in-Progress 6,798.5 8,810.8 114,194.1 415,194.1 380,066.4 244,605.3
Goodwill on Consolidation 61.2 61.2 61.2 61.2 61.2 61.2
Non Current Investments 0.0 0.0 0.0 0.0 0.0 0.0
Long-Term Loans and Advances 22,562.7 30,479.2 28,970.7 22,567.9 12,702.3 33,430.1
Other Non-Current Assets 0.0 0.0 1,448.4 1,448.4 1,448.4 1,448.4
Current Investments 976.0 10,280.2 2,155.3 10,157.3 5,717.0 15,046.1
Inventories 925.7 726.4 683.1 927.4 1,018.1 1,248.8
Trade Receivables 8,227.0 9,600.8 8,006.2 12,041.4 14,187.8 16,463.0
Cash and Bank Balances 1,520.7 1,429.1 1,881.0 2,259.9 2,630.0 3,131.9
Short-Term Loans and Advances 15,385.7 10,845.3 12,181.5 22,704.8 12,779.4 33,632.9
Other Current Assets 17.7 8.7 34.7 24.9 29.0 34.5
Total Assets 326,351.8 363,780.7 465,574.6 773,171.2 738,186.6 774,684.1
Source: Choice Broking Research
April 13, 2015
Idea Cellular Ltd. Telecom
INITIATING COVERAGE
BUY
18 © CHOICE INSTITUTIONAL RESEARCH
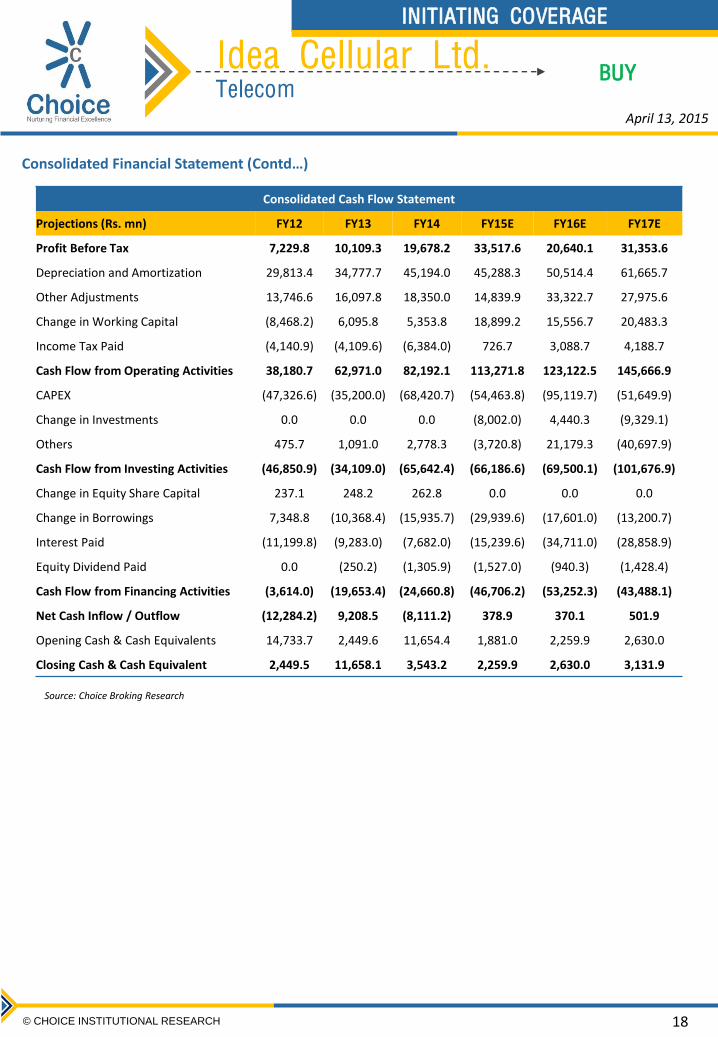
Consolidated Cash Flow Statement
Projections (Rs. mn) FY12 FY13 FY14 FY15E FY16E FY17E
Profit Before Tax 7,229.8 10,109.3 19,678.2 33,517.6 20,640.1 31,353.6
Depreciation and Amortization 29,813.4 34,777.7 45,194.0 45,288.3 50,514.4 61,665.7
Other Adjustments 13,746.6 16,097.8 18,350.0 14,839.9 33,322.7 27,975.6
Change in Working Capital (8,468.2) 6,095.8 5,353.8 18,899.2 15,556.7 20,483.3
Income Tax Paid (4,140.9) (4,109.6) (6,384.0) 726.7 3,088.7 4,188.7
Cash Flow from Operating Activities 38,180.7 62,971.0 82,192.1 113,271.8 123,122.5 145,666.9
CAPEX (47,326.6) (35,200.0) (68,420.7) (54,463.8) (95,119.7) (51,649.9)
Change in Investments 0.0 0.0 0.0 (8,002.0) 4,440.3 (9,329.1)
Others 475.7 1,091.0 2,778.3 (3,720.8) 21,179.3 (40,697.9)
Cash Flow from Investing Activities (46,850.9) (34,109.0) (65,642.4) (66,186.6) (69,500.1) (101,676.9)
Change in Equity Share Capital 237.1 248.2 262.8 0.0 0.0 0.0
Change in Borrowings 7,348.8 (10,368.4) (15,935.7) (29,939.6) (17,601.0) (13,200.7)
Interest Paid (11,199.8) (9,283.0) (7,682.0) (15,239.6) (34,711.0) (28,858.9)
Equity Dividend Paid 0.0 (250.2) (1,305.9) (1,527.0) (940.3) (1,428.4)
Cash Flow from Financing Activities (3,614.0) (19,653.4) (24,660.8) (46,706.2) (53,252.3) (43,488.1)
Net Cash Inflow / Outflow (12,284.2) 9,208.5 (8,111.2) 378.9 370.1 501.9
Opening Cash & Cash Equivalents 14,733.7 2,449.6 11,654.4 1,881.0 2,259.9 2,630.0
Closing Cash & Cash Equivalent 2,449.5 11,658.1 3,543.2 2,259.9 2,630.0 3,131.9
Consolidated Financial Statement (Contd…)
Source: Choice Broking Research
April 13, 2015
Idea Cellular Ltd. Telecom
INITIATING COVERAGE
BUY
19 © CHOICE INSTITUTIONAL RESEARCH
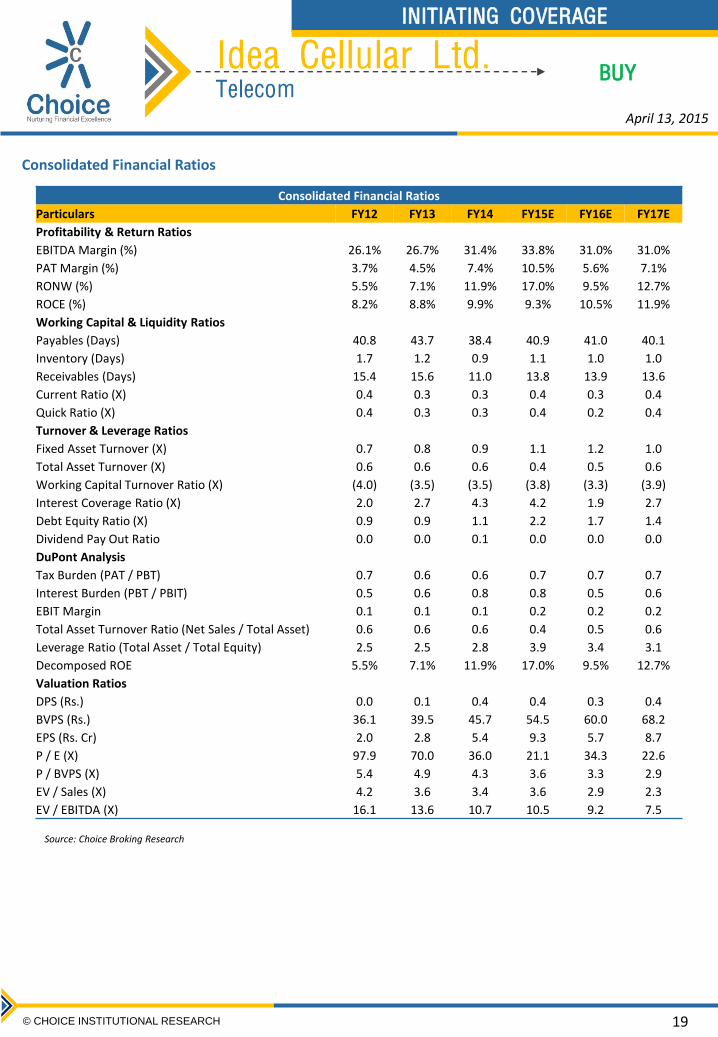
Consolidated Financial Ratios
Consolidated Financial Ratios
Particulars FY12 FY13 FY14 FY15E FY16E FY17E
Profitability & Return Ratios
EBITDA Margin (%) 26.1% 26.7% 31.4% 33.8% 31.0% 31.0%
PAT Margin (%) 3.7% 4.5% 7.4% 10.5% 5.6% 7.1%
RONW (%) 5.5% 7.1% 11.9% 17.0% 9.5% 12.7%
ROCE (%) 8.2% 8.8% 9.9% 9.3% 10.5% 11.9%
Working Capital & Liquidity Ratios
Payables (Days) 40.8 43.7 38.4 40.9 41.0 40.1
Inventory (Days) 1.7 1.2 0.9 1.1 1.0 1.0
Receivables (Days) 15.4 15.6 11.0 13.8 13.9 13.6
Current Ratio (X) 0.4 0.3 0.3 0.4 0.3 0.4
Quick Ratio (X) 0.4 0.3 0.3 0.4 0.2 0.4
Turnover & Leverage Ratios
Fixed Asset Turnover (X) 0.7 0.8 0.9 1.1 1.2 1.0
Total Asset Turnover (X) 0.6 0.6 0.6 0.4 0.5 0.6
Working Capital Turnover Ratio (X) (4.0) (3.5) (3.5) (3.8) (3.3) (3.9)
Interest Coverage Ratio (X) 2.0 2.7 4.3 4.2 1.9 2.7
Debt Equity Ratio (X) 0.9 0.9 1.1 2.2 1.7 1.4
Dividend Pay Out Ratio 0.0 0.0 0.1 0.0 0.0 0.0
DuPont Analysis
Tax Burden (PAT / PBT) 0.7 0.6 0.6 0.7 0.7 0.7
Interest Burden (PBT / PBIT) 0.5 0.6 0.8 0.8 0.5 0.6
EBIT Margin 0.1 0.1 0.1 0.2 0.2 0.2
Total Asset Turnover Ratio (Net Sales / Total Asset) 0.6 0.6 0.6 0.4 0.5 0.6
Leverage Ratio (Total Asset / Total Equity) 2.5 2.5 2.8 3.9 3.4 3.1
Decomposed ROE 5.5% 7.1% 11.9% 17.0% 9.5% 12.7%
Valuation Ratios
DPS (Rs.) 0.0 0.1 0.4 0.4 0.3 0.4
BVPS (Rs.) 36.1 39.5 45.7 54.5 60.0 68.2
EPS (Rs. Cr) 2.0 2.8 5.4 9.3 5.7 8.7
P / E (X) 97.9 70.0 36.0 21.1 34.3 22.6
P / BVPS (X) 5.4 4.9 4.3 3.6 3.3 2.9
EV / Sales (X) 4.2 3.6 3.4 3.6 2.9 2.3
EV / EBITDA (X) 16.1 13.6 10.7 10.5 9.2 7.5
Source: Choice Broking Research
April 13, 2015
es
20 © CHOICE INSTITUTIONAL RESEARCH
INITIATING COVERAGE
Disclaimer
This is solely for information of clients of Choice Broking and does not construe to be an investment advice. It is also not intended as an offer or solicitation for the purchase and sale of any financial instruments. Any action taken by you on the basis of the information contained herein is your responsibility alone and Choice Broking its subsidiaries or its employees or associates will not be liable in any manner for the consequences of such action taken by you. We have exercised due diligence in checking the correctness and authenticity of the information contained in this recommendation, but Choice Broking or any of its subsidiaries or associates or employees shall not be in any way responsible for any loss or damage that may arise to any person from any inadvertent error in the information contained in this recommendation or any action taken on basis of this information. This report is based on the fundamental analysis with a view to forecast future price. The Research analysts for this report certifies that all of the views expressed in this report accurately reflect his or her personal views about the subject company or companies and its or their securities, and no part of his or her compensation was, is or will be, directly or indirectly related to specific recommendations or views expressed in this report. Choice Broking has based this document on information obtained from sources it believes to be reliable but which it has not independently verified; Choice Broking makes no guarantee, representation or warranty and accepts no responsibility or liability as to its accuracy or completeness. The opinions contained within the report are based upon publicly available information at the time of publication and are subject to change without notice. The information and any disclosures provided herein are in summary form and have been prepared for informational purposes. The recommendations and suggested price levels are intended purely for stock market investment purposes. The recommendations are valid for the day of the report and will remain valid till the target period. The information and any disclosures provided herein may be considered confidential. Any use, distribution, modification, copying, forwarding or disclosure by any person is strictly prohibited. The information and any disclosures provided herein do not constitute a solicitation or offer to purchase or sell any security or other financial product or instrument. The current performance may be unaudited. Past performance does not guarantee future returns. There can be no assurance that investments will achieve any targeted rates of return, and there is no guarantee against the loss of your entire investment.
POTENTIAL CONFLICT OF INTEREST DISCLOSURE (as on date of report) Disclosure of interest statement – • Analyst interest of the stock /Instrument(s): - No. • Firm interest of the stock / Instrument (s): - No.
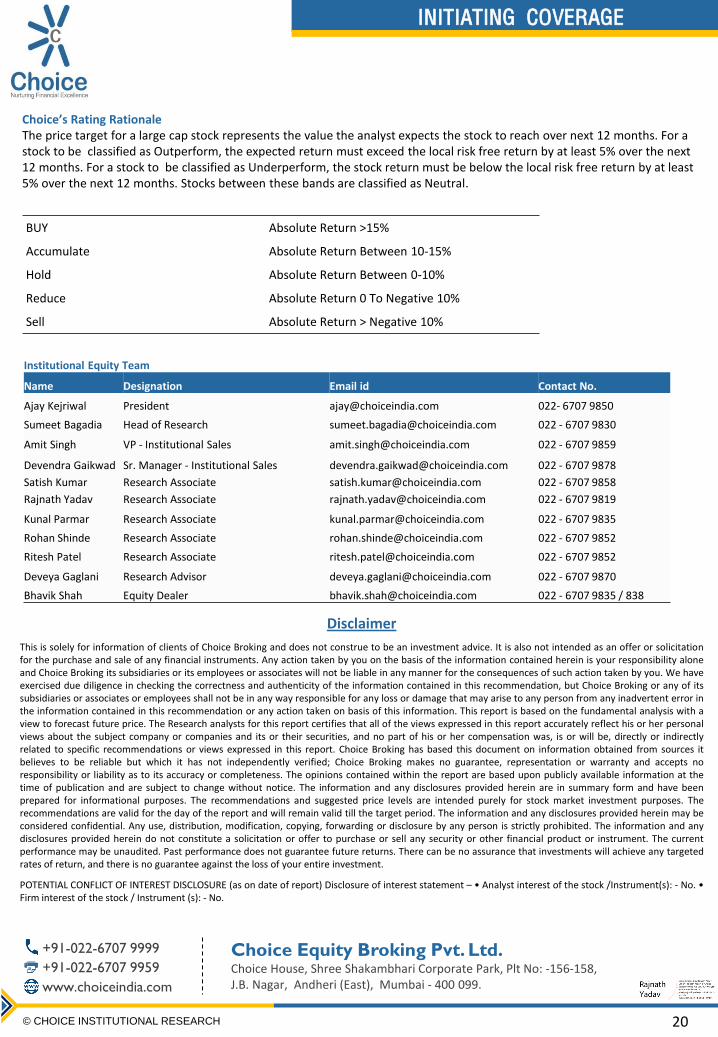
Choice’s Rating Rationale The price target for a large cap stock represents the value the analyst expects the stock to reach over next 12 months. For a stock to be classified as Outperform, the expected return must exceed the local risk free return by at least 5% over the next 12 months. For a stock to be classified as Underperform, the stock return must be below the local risk free return by at least 5% over the next 12 months. Stocks between these bands are classified as Neutral.
BUY Absolute Return >15%
Accumulate Absolute Return Between 10-15%
Hold Absolute Return Between 0-10%
Reduce Absolute Return 0 To Negative 10%
Sell Absolute Return > Negative 10%
Choice Equity Broking Pvt. Ltd. Choice House, Shree Shakambhari Corporate Park, Plt No: -156-158, J.B. Nagar, Andheri (East), Mumbai - 400 099.
+91-022-6707 9999
+91-022-6707 9959
www.choiceindia.com
Institutional Equity Team
Name Designation Email id Contact No.
Ajay Kejriwal President [email protected] 022- 6707 9850
Sumeet Bagadia Head of Research [email protected] 022 - 6707 9830
Amit Singh VP - Institutional Sales [email protected] 022 - 6707 9859
Devendra Gaikwad Sr. Manager - Institutional Sales [email protected] 022 - 6707 9878
Satish Kumar Research Associate [email protected] 022 - 6707 9858
Rajnath Yadav Research Associate [email protected] 022 - 6707 9819
Kunal Parmar Research Associate [email protected] 022 - 6707 9835
Rohan Shinde Research Associate [email protected] 022 - 6707 9852
Ritesh Patel Research Associate [email protected] 022 - 6707 9852
Deveya Gaglani Research Advisor [email protected] 022 - 6707 9870
Bhavik Shah Equity Dealer [email protected] 022 - 6707 9835 / 838