initial risk analysis and decision making framework · initial risk analysis and decision making...
TRANSCRIPT

PNNL- 20932
Prepared for the U.S. Department of Energy under Contract DE-AC05-76RL01830
Initial Risk Analysis and Decision Making Framework DW Engel February 2012

DISCLAIMER This report was prepared as an account of work sponsored by an agency of the United States Government. Neither the United States Government nor any agency thereof, nor Battelle Memorial Institute, nor any of their employees, makes any warranty, express or implied, or assumes any legal liability or responsibility for the accuracy, completeness, or usefulness of any information, apparatus, product, or process disclosed, or represents that its use would not infringe privately owned rights. Reference herein to any specific commercial product, process, or service by trade name, trademark, manufacturer, or otherwise does not necessarily constitute or imply its endorsement, recommendation, or favoring by the United States Government or any agency thereof, or Battelle Memorial Institute. The views and opinions of authors expressed herein do not necessarily state or reflect those of the United States Government or any agency thereof. PACIFIC NORTHWEST NATIONAL LABORATORY operated by BATTELLE for the UNITED STATES DEPARTMENT OF ENERGY under Contract DE-AC05-76RL01830 Printed in the United States of America Available to DOE and DOE contractors from the Office of Scientific and Technical Information,
P.O. Box 62, Oak Ridge, TN 37831-0062; ph: (865) 576-8401 fax: (865) 576-5728
email: [email protected] Available to the public from the National Technical Information Service, U.S. Department of Commerce, 5285 Port Royal Rd., Springfield, VA 22161
ph: (800) 553-6847 fax: (703) 605-6900
email: [email protected] online ordering: http://www.ntis.gov/ordering.htm
This document was printed on recycled paper.
(9/2003)
PNNL- 20932
Initial Risk Analysis and Decision Making Framework DW Engel February 2012 Prepared for the U.S. Department of Energy under Contract DE-AC05-76RL01830 Pacific Northwest National Laboratory Richland, Washington 99352

Initial Risk Analysis and Decision Making Framework
Contents 1.0 Introduction ................................................................................................................................ 3
2.0 Results ........................................................................................................................................ 3
3.0 Approach and Method ................................................................................................................ 4
4.0 Case Study Approach ................................................................................................................. 4
5.0 Technical Risk Model ................................................................................................................. 9
5.1 Background ........................................................................................................................ 9
5.2 Technology Readiness Level ........................................................................................... 10
5.3 Qualitative Expert Elicitation ........................................................................................... 12
6.0 Reference .................................................................................................................................. 14
Figures Figure 1 Coal plant parameters (factors): common to Cases A and B .............................................. 5
Figure 2 CC system specific parameters: changed under Cases A and B ......................................... 5
Figure 4 Discounted net present value of net receipts: Case A (red bar) versus Case B .................. 8
Figure 5 Discounted net present value of net receipts: Case A (red bar) versus Case B .................. 9
Figure 6 Information flow for the CCSI decision making framework ............................................ 10
Figure 7 Qualitative risk contribution tree showing categorical pillars of Technical, Economic and Regulatory/Societal concerns. Sub topics illustrate a taxonomy for further refinement of each topic. ................................................................................................................................. 16
Tables Table 1 Initial financial, operating, and market assumptions ............................................................ 6
Table 2 Initial distributions of the five random factors ..................................................................... 7
Table 3 Proposed TRL scale for carbon capture ............................................................................. 11
Table 4 Sample TRL-3 check list to evaluate a technology maturity ............................................. 12
Table 5 Sample of qualitative elicitation form for collecting expert opinion on topical risk concerns .................................................................................................................................... 17
Table 6 Qualitative risk factor definitions ....................................................................................... 18
Table 7 Qualitative risk drivers ....................................................................................................... 18

Initial Risk Analysis and Decision Making Framework
Introduction
Commercialization of new carbon capture simulation initiative (CCSI) technology will include two key elements of risk management, namely, technical risk (will process and plant performance be effective, safe, and reliable) and enterprise risk (can project losses and costs be controlled within the constraints of market demand to maintain profitability and investor confidence). Both of these elements of risk are incorporated into the risk analysis subtask of Task 7. Thus far, this subtask has developed a prototype demonstration tool that quantifies risk based on the expected profitability of expenditures when retrofitting carbon capture technology on a stylized 650 MW pulverized coal electric power generator. The prototype is based on the selection of specific technical and financial factors believed to be important determinants of the expected profitability of carbon capture, subject to uncertainty. The uncertainty surrounding the technical performance and financial variables selected thus far is propagated in a model that calculates the expected profitability of investments in carbon capture and measures risk in terms of variability in expected net returns from these investments. Given the preliminary nature of the results of this prototype, additional work is required to expand the scope of the model to include additional risk factors, additional information on extant and proposed risk factors, the results of a qualitative risk factor elicitation process, and feedback from utilities and other interested parties involved in the carbon capture project. Additional information on proposed distributions of these risk factors will be integrated into a commercial implementation framework for the purpose of a comparative technology investment analysis.
1.0 Results
Thus far, the key accomplishment of this subtask is to illustrate risk attribute propagation through a financial balance sheet that incorporates variable technological features, lifecycle costs and other factors related to carbon capture. The significance of this subtask is that it provides a case study for illustrating information flow from quantitative and qualitative risk factor assignment and uncertainty quantification (UQ) from other CCSI tasks into familiar decision metrics like 30-year net present value, and it incorporates probabilistic decision making for eliciting industry feedback. Summarized here are some of the key results observed from the prototype risk analysis tool. These specific results are meant only to illustrate the utility of the prototype risk analysis tool for integrating and comparing the impacts of diverse sources of uncertainty. The results could change significantly as risk factors, uncertainties and new risk metrics are considered based on integration of data and methods from the other tasks and on industry feedback. As explained later, many of these results are gleaned by statistically compiling the results of several thousand calculations that each represents one independent technology performance and investment scenario.
One can afford to double or triple the construction cost of the carbon capture (CC) system if it means reducing its parasitic power significantly, increasing its capture percentage or lowering its operating cost – and – to a lesser degree, keeping the CC system duty factor penalty low (any decrease in duty factor due to the CC retrofit).
One can afford to give up some on the CC duty factor penalty (let the penalty increase) if it means lowering the parasitic power requirements or the CC system operating costs.
The CC option is competitive with a no capture baseline in less than 1% of all random scenarios, but with more optimistic assumptions for the distribution of possible parasitic power and CC operating costs, CC can be competitive 15% - 20% of the time.
All of these results, including the likelihood of CC being competitive with the non-CC baseline are sensitive to the assumption for carbon tax (nominally $25/tonne).

Initial Risk Analysis and Decision Making Framework
A carbon tax of $45/tonne represents the point where an equal number of cases are better and worse than the non-CC baseline.
Again, it must be emphasized that these results are illustrative only, to demonstrate the utility of the tool being developed to assess risk based on key technical and financial factors that will evolve as the tool is improved and integration with the other tasks and the industry partners is fully achieved.
2.0 Approach and Method
The approach requires translating technical and financial risk factors, along with uncertainties, into measures that can be included in estimating variability in expected financial returns, which is the principal metric used in this financial risk analysis. For a typical electric generating unit without carbon capture, construction costs will be incurred during the first few years of the life cycle, operations and maintenance (O&M) expenditures will be incurred and receipts will accrue over each year of operations once construction of the plant is completed. If the plant is retrofitted to capture carbon sometime during its useful life, generation will be interrupted temporarily, additional construction expenditures will be incurred, and additional O&M expenditures will be incurred once the retrofit is completed. All of these factors will affect the amount and timing of plant expenditures and revenues over the life cycle of the plant and, over the life cycle of the utility plant with a carbon capture retrofit, will affect the net profitability of the plant. In order to aggregate these revenue and expenditures into a single metric, these annual estimates of revenues and expenditures need to be converted to a common base year. This conversion is done through discounting, which applies an adjustment factor (usually expressed as an interest rate called the discount rate) to revenues and expenditures in each year. For each year, discounted net receipts (revenues less expenditures, discounted) are added up into a final discounted net receipt
The formula for the discounted net present value (NPV) is given by the following:
NPV 1
(1 r)t [Rt Ct ]t1
T
where t indicates each year and T is the total number of years in the life cycle (e.g., 30-years), r is the discount rate, Rt is revenues in year t, and Ct is expenditures in year t. For this analysis, risk is defined as variability in the discounted net present value of receipts, and variability is propagated by uncertainty with respect to different technical attributes, revenue and cost estimates.
3.0 Case Study Approach
The initial demonstration of this methodology involved creating a baseline net present value calculation without carbon capture (Case A) and comparing that to an alterative net present value calculation with carbon capture retrofit (Case B). For Case B, NPV estimates were made given a distribution of values for selected factors that vary due to risk and uncertainty. Once this methodology is refined, it can be used to identify the best candidate factors for risk retirement and can be used to compare multiple carbon capture alternatives, instead of just comparing one carbon capture option to one “no carbon capture” scenario.

Initial Risk Analysis and Decision Making Framework
The following discussion explains four steps that should be understood conceptually before attempting to interpret findings of the model. Conceptual understanding of these steps will also facilitate recommendations for refinement of the assumptions and expansion of the methods to alternative metrics of interest. It should be noted that the present model is evaluated in the familiar format of an Excel spreadsheet that can be made available to interested users and collaborators. The first step of this demonstration is to determine a set of financial and technical factors common to both Cases A and B. These factors are shown in Figure 1. These factors are assumed to be known with certainty, even though they can vary throughout the life cycle of the plant. Subsequent analysis will add many of these variables to the list of factors allowed to vary according to some distribution of uncertainty.
The second step of the demonstration is to determine which set of factors would be subject to uncertainty. These factors are shown in Figure 2. The factors in Figure 2 were selected to demonstrate this methodology since they specifically characterize some of the key technical and financial performance measures of the carbon capture system. The initial nominal values of these variables (factors) were determined from the U.S. Department of Energy and other publications. The initial ranges were determined judgmentally. As the project progresses, additional factors will be included in the financial risk assessment in order to capture a fuller range of technical and financial uncertainties relating to carbon capture.
Figure 1 Coal plant parameters (factors): common to Cases A and B
Figure 2 CC system specific parameters: changed under Cases A and B

Initial Risk Analysis and Decision Making Framework
Table 1 shows the initial assumptions used in the Case A baseline. The variables whose initial values are presented in blue are user-selectable. For example, if the user wants to reduce the duty cycle of the plant, they can reduce the Plant Average Hours of Operation per Day variable from the initial value of 20 hours to some lower value. This will recalculate the discounted net present value for both the Case A baseline and the Case B scenario. In addition, the impacts of some of these factors on the NPV calculation will be affected by timing; construction expenditures, for example, could occur over a five-year period instead of the default period of two years. In this case, the timing of construction costs, as well as the timing of revenues from generation, will change and this change would be captured in the revised NPV calculation.
Table 1 Initial financial, operating, and market assumptions Rate, Tax and Growth Assumptions Value Units
Utility PPA per MWh 60 $ per MWh PPA Inflation Rate 1.5% Percent
Federal tax rate 35% Percent State tax rate 7.0% Percent Discount rate 7.0% Percent
Tax life of plant 30 Years Federal PTC 0.0% Percent Federal ITC 30.0% Percent State ITC 7.0% Percent
State PTC multiplier 1 Units
Electric v. Thermal Power Production Value Units Electric Power Output 650 MWe Thermal Power Output 1,759 MWth
Replacement Power Value Units
CCS Parasitic Power Requirements 210 MWe CCS Parasitic Power Recirculating Fraction 0.3231 - Plant Average Hours of Operation per Day 20 hours/day Plant Average Days of Operation per Year 350 days/year
Plant Capacity Factor without CCS 0.799 - Drop in Duty Factor due to CCS 5.0% percent
Duty Factor with CCS 0.759 - Replacement Power Required 236 MWe
Unit Cost of Replacement Power 60.0 $/MWe
Plant Construction Expenses Value Units Total Capital Costs 2 $B Construction Period 2 Years
Operating Expenses Value Units
Operating Expense Inflation Rate 1.5% Percent Carbon Capture Percentage 90% Percent
Carbon Tax 25 $ per ton Fixed O&M Base Year Cost 23 $M
Variable O&M Cost per mWh 4.25 $ per MWh
Carbon Capture Retrofit Value Units CCS Construction Costs 1.6 $B CCS Fixed O&M Costs 50 $M/year
Variable O&M Costs 0.0087 $ per kW Construction Period 2 years

Initial Risk Analysis and Decision Making Framework
The third step is to assign ranges to the initial set of five variables (CCS Parasitic Power Requirements, Drop in Duty Due to CCS, Carbon Capture Percentage, CCS Construction Costs, and CCS Fixed O&M Costs) that are allowed to vary randomly in this version of the model. The variables whose values are presented in black and bold in Table 1 are ones that can have their distribution changed by the user. In this version of the model, variation in these factors is incorporated into the financial risk analysis by changing the range (i.e., the minimum and maximum value) of the variable of interest. Table 2 shows the nominal value of each of the initial set of these variables, and their assumed low and high values.
Table 2 Initial distributions of the five random factors
Replacement Power Value Units Min Max Average
CCS Parasitic Power Requirements 210 MWe 160 260 210
Drop in Duty Factor due to CCS 5.0% percent 0% 10% 5.0%
Operating Expenses Value Units Min Max Average
Carbon Capture Percentage 90.0% Percent 85.0% 95.0% 90.0%
Carbon Capture Retrofit Value Units Min Max Average
CCS Construction Costs 1.6 $B 0.5 3.0 1.6
CCS Fixed O&M Costs 50 $M/year 25.0 100.0 50.0 The fourth step is to calculate alternative net discounted present values using Monte Carlo simulation methods incorporating 3000 cases and create a histogram that shows the distribution of discounted net present value estimates using the distributions for the five variables listed in Table 2. For purposes of this demonstration, we assume that these values are distributed uniformly, but subsequent analyses (based in part on the results of the UQ task) will allow for alternative statistical distributions (e.g., normal, lognormal and beta distributions). Under the assumed values in Tables 1 and 2, the resulting distribution of NPV is given in Figure 3. The distribution represents the binned estimated discounted present value of net receipts. The estimated discounted present value of net receipts given by the red bar is the Case A baseline estimate. The results of this comparison suggest that virtually all Case B discounted net present values are less than that which occurs under the Case A baseline. A small percentage of cases with carbon capture can have a higher discounted net present value for those random scenarios having higher revenues combined with lower costs, as well as higher duty factors, but these cases represent but a small number of possible cases (less than 5 percent). To illustrate how the tool can be used for comparative analyses, consider the case where we shift the range on parasitic power by lowering the minimum and maximum values by one-half. Instead of a baseline parasitic power distribution range of 160MWe and 260MWe, we lower that range to 80MWe and 130MWe. In effect, this lessens parasitic power losses and should improve carbon capture relative to the baseline without carbon capture. Figure 4 illustrates that with lower parasitic power losses, the distribution of discounted net present values under carbon capture shifts to the right, with roughly 20 percent of the carbon capture cases exceeding the no-carbon-capture baseline.

Initial Risk Analysis and Decision Making Framework
Figure 3 Discounted net present value of net receipts: Case A (red bar) versus Case B
This tool demonstrates one example of how risk attributes can propagate through a financial balance sheet that incorporates variable technological factors, lifecycle costs and other factors related to carbon capture. The significance of this subtask is that it provides a case study for illustrating information flow from risk factor assignment and uncertainty quantification (UQ) from other CCSI tasks into familiar decision metrics like 30-year net present value, and it incorporates probabilistic decision making for eliciting industry feedback. In addition, it presents risk propagation in a manner that will be accessible and understandable to the very audience (utility financial managers) that will be involved in making decisions on carbon capture investments. A regression analysis was also performed to examine the relative importance of the five CC characteristics in determining the outcome of interest (in this case NPV). For the purposes of this illustration the carbon capture NPV is assumed to be made up of a linear combination of these characteristics and the resulting coefficients in the regression are indicative of the relative contribution of each of the five CC characteristics to NPV. We have chosen NPV as the outcome of interest for this illustration of the tool but other outcomes could just as easily be used.
0.00%
10.00%
20.00%
30.00%
40.00%
50.00%
60.00%
70.00%
80.00%
90.00%
100.00%
0
50
100
150
200
250
300
350
400
450
122 192 262 332 402 471 541 611 681 751 821 891
Frequency
NPV Bin Midpoint ($M)
Discounted Present Value of Net Receipts
Frequency Cumulative %

Initial Risk Analysis and Decision Making Framework
Figure 4 Discounted net present value of net receipts: Case A (red bar) versus Case B
Given the preliminary nature of the results of this prototype, additional work is required to expand the scope of the model to include additional risk factors, additional information on extant and proposed risk factors, the results of the risk factor elicitation process, and feedback from utilities and other interested parties involved in the carbon capture project.
4.0 Technical Risk Model
The Technical Risk Model will be a software system to estimate uncertainties and risks for the major technical components of a carbon capture system. To accomplish this task, we will develop a new (novel) Technology Readiness Level Uncertainty model and a Qualitative Elicitation Uncertainty model to be coupled with results from the Process Synthesis and Design Modeling team (Task 3) including estimated uncertainties (Task 6) to estimate the technical risks.
4.1 Background For the development of the overall decision making framework, we will be utilizing a “top-down” approach, driven by our Life Cycle Business (Financial) Model (LCBM). Therefore, the components that feed directly into the LCBM will be key factors. We will need to identify the risk performance measures from these factors and identify needed uncertainties to be modeled by the Uncertainty Quantification team. The decision making framework will be based on the information flow shown in Figure 5. In this figure, the LCBM is represented by the Life Cycle Business Perspective, while the Technical Risk Model will couple the three risk models shown on the left side of the figure.
0.00%
10.00%
20.00%
30.00%
40.00%
50.00%
60.00%
70.00%
80.00%
90.00%
100.00%
0
50
100
150
200
250
300
350
400
450
302 369 436 503 571 638 705 772 839 907 974 1,041
Frequency
NPV Bin Midpoint ($M)
Discounted Present Value of Net Receipts
Frequency Cumulative %

Initial Risk Analysis and Decision Making Framework
We define “technical risk” as the likelihood that a system will not reach its goals for performance, cost or schedule due to technology risks, to risks which arise in the integration of critical technologies and/or sub-systems dependent on them, or to the system integration. Technical risk denotes the risk that a project will fail to meet its performance criteria. In essence, Risk is the uncertainty that a product design will not satisfy desired technical requirements and the consequences thereof. In FY11, a design of the LCBM was developed and a prototype system was created. Many inputs into this model are of the technical type and will be modeled using this new Technical Risk Model. Some of these parameters (Technical Performance shown in Figure 5) will come from the process synthesis and design modeling (Task 3), with uncertainties being simulated by the modeling team with input distributions and uncertainty analysis methods defined by the Uncertainty Quantification team (Task 6). The marginal distributions for these technical risk factors will then be input into the LCBM. Other parameters will not be modeled by the Process Synthesis & Design Modeling team. To estimate these parameters (including uncertainties), we identified two new modeling efforts:
Technology Readiness Level (TRL) Risk Model, and Qualitative Expert Elicitation Risk Model.
4.2 Technology Readiness Level Measuring a technology’s maturity provides one measure that can be an indicator of program risk. As the GAO report states (GAO-10-675 2010), “Once a technology’s readiness level has been established, the risks of including that technology in a product development can be assessed. Unlike S&T projects, for which the main objective is to develop knowledge, a product development’s objective is to deliver products that meet strict cost, schedule, and performance targets.” The report goes on to argue that a low level of readiness (low TRL) represents a high risk, because there are many unknowns that still need to be resolved in developing the technology. These unknowns create programmatic risk because, until they are satisfactorily resolved, we don’t know whether the selected technology can meet the program’s cost, schedule, and performance goals. The gap between the maturity of the technology and the product’s requirements represents the risks or unknowns about the technology.
Tec
hnic
al R
isk
Mod
el
Figure 5 Information flow for the CCSI decision making framework

Initial Risk Analysis and Decision Making Framework
The TRL is a measure used to assess the maturity of evolving technologies prior to incorporating the technology into a system/subsystem (Mankins 1995). The qualitative TRL can be used to roughly estimate the uncertainty bounds in a comparison of technologies (Mathews 2010). This methodology will be used to help quantify technical risks and used to accomplish the following objectives:
yard stick to measure accelerated development against traditional development, and introduce uncertainty into framework of technical risk model.
To compare an accelerated development to a traditional development, the tradition development needs to be defined. Table 3 shows a proposed traditional maturity scale for this development. This table was developed by combining similar ideas developed by EPRI and the GAO (Freeman and Bhown 2011 and GAO-10-675 2010)
Table 3 Proposed TRL scale for carbon capture
Technology Readiness Level (TRL)
9 Commercial operation in relevant environment
8 Commercial demonstration, full scale deployment in final form 650 MW
7 System prototype in an operational environment > 100 MW
6 Fully integrated pilot (prototype) tested in a relevant environment 10 - 50 MW
5 Component validation in relevant environment (coal plant) 1 MW
4 Component validation tests in laboratory environment 1 kW
3 Analytical and experimental critical function proof-of-concept
2 Formulation of application
1 Basic principals
EPRI 2011 (Freeman and Bhown) & GAO 2010
In order to access the maturity of a technology, a system for the assessment is needed. Such a system was developed by the U.S. Air Force (Nolte et al., 2003). This system contains a check list for each readiness level. An abbreviate example for the TRL-3 is shown in Table 4. For our purpose, we will modify the questions within the check list and apply them to the different technologies.

Initial Risk Analysis and Decision Making Framework
Utilizing the results of the check list for each readiness level, an uncertainty model is being developed, which utilizes the following form: Where the estimated TRL uncertainty bound can be calculated using algorithms developed by Mathews (Mathews 2009) and is the probability that a given technology is at a certain readiness level, estimated using the following binomial probability distribution: This uncertainty estimate can then be used in the decision making model. In the uncertainty realm, you can think of this as a model uncertainty that can be access directly to the performance measure.
4.3 Qualitative Expert Elicitation As explained above, risks associated with new technology development and adoption can broadly be
described by the residual uncertainties involved with numerous factors such as performance, cost, reliability, etc. During initial development of a nascent technology, like carbon capture, it can be difficult to quantify the full spectrum of risk contributors, but it is always valuable to characterize and organize the concerns that are inevitably raised by various stakeholders. The process of enumeration and categorization is an important step towards systematic prioritization and ultimate resolution of the driving risk elements. The subtask of Qualitative Expert Elicitation attempts to leverage the diverse expertise of CCSI industry collaborators and national laboratory subject matter experts to capture the range of topical concerns and establish a format for pseudo quantitative ranking. The ranking schema will support comparative prioritization and will facilitate introduction of qualitative risk factors in the LCBM. Many performance related risk factors like capture efficiency and plant-performance impacts are presently being simulated by other working groups within CCSI. Computational variables that are subject to uncertainty are amenable to propagation and diagnostic analysis using tools developed by the
F Risk/ Uncertainty
AFRL TRL Calculator, version 2.2 (abbreviated list)
Table 4 Sample TRL-3 check list to evaluate a technology maturity
Initial Risk Analysis and Decision Making Framework
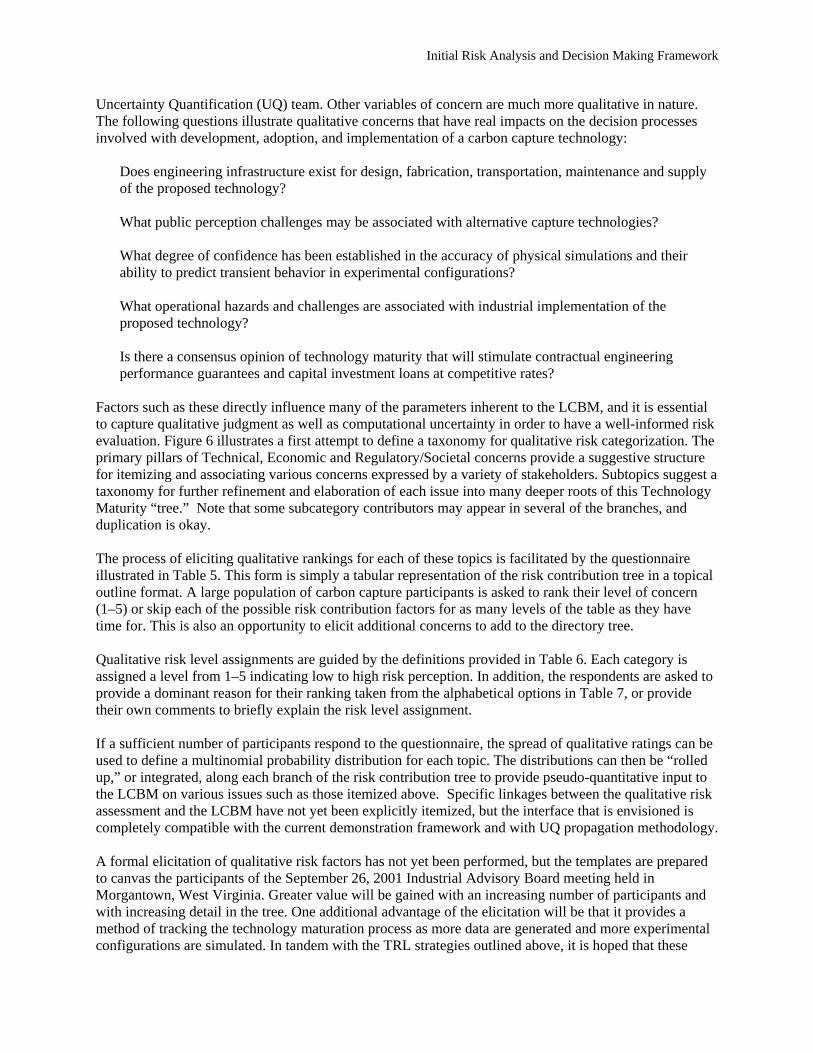
Uncertainty Quantification (UQ) team. Other variables of concern are much more qualitative in nature. The following questions illustrate qualitative concerns that have real impacts on the decision processes involved with development, adoption, and implementation of a carbon capture technology: Does engineering infrastructure exist for design, fabrication, transportation, maintenance and supply of the proposed technology? What public perception challenges may be associated with alternative capture technologies?
What degree of confidence has been established in the accuracy of physical simulations and their ability to predict transient behavior in experimental configurations?
What operational hazards and challenges are associated with industrial implementation of the proposed technology?
Is there a consensus opinion of technology maturity that will stimulate contractual engineering performance guarantees and capital investment loans at competitive rates?
Factors such as these directly influence many of the parameters inherent to the LCBM, and it is essential to capture qualitative judgment as well as computational uncertainty in order to have a well-informed risk evaluation. Figure 6 illustrates a first attempt to define a taxonomy for qualitative risk categorization. The primary pillars of Technical, Economic and Regulatory/Societal concerns provide a suggestive structure for itemizing and associating various concerns expressed by a variety of stakeholders. Subtopics suggest a taxonomy for further refinement and elaboration of each issue into many deeper roots of this Technology Maturity “tree.” Note that some subcategory contributors may appear in several of the branches, and duplication is okay. The process of eliciting qualitative rankings for each of these topics is facilitated by the questionnaire illustrated in Table 5. This form is simply a tabular representation of the risk contribution tree in a topical outline format. A large population of carbon capture participants is asked to rank their level of concern (1–5) or skip each of the possible risk contribution factors for as many levels of the table as they have time for. This is also an opportunity to elicit additional concerns to add to the directory tree. Qualitative risk level assignments are guided by the definitions provided in Table 6. Each category is assigned a level from 1–5 indicating low to high risk perception. In addition, the respondents are asked to provide a dominant reason for their ranking taken from the alphabetical options in Table 7, or provide their own comments to briefly explain the risk level assignment. If a sufficient number of participants respond to the questionnaire, the spread of qualitative ratings can be used to define a multinomial probability distribution for each topic. The distributions can then be “rolled up,” or integrated, along each branch of the risk contribution tree to provide pseudo-quantitative input to the LCBM on various issues such as those itemized above. Specific linkages between the qualitative risk assessment and the LCBM have not yet been explicitly itemized, but the interface that is envisioned is completely compatible with the current demonstration framework and with UQ propagation methodology. A formal elicitation of qualitative risk factors has not yet been performed, but the templates are prepared to canvas the participants of the September 26, 2001 Industrial Advisory Board meeting held in Morgantown, West Virginia. Greater value will be gained with an increasing number of participants and with increasing detail in the tree. One additional advantage of the elicitation will be that it provides a method of tracking the technology maturation process as more data are generated and more experimental configurations are simulated. In tandem with the TRL strategies outlined above, it is hoped that these

Initial Risk Analysis and Decision Making Framework
complementary approaches will be useful in accelerating the consensus of technology maturity that is needed for wide-scale industry deployment of candidate carbon capture options.
5.0 Reference
Freeman, BC & Bhown, AS, Assessment of the technology readiness of post-combustion CO2 capture technologies, Energy Procedia, 4, p.1791-1796, 2011.
Mathews, S, Valuing risky projects with real options. Research-Technology Management 52(5): 32–41, 2009.
Mankins, JC, Technology Readiness Levels: A White Paper, NASA, Office of Space Access and Technology, Advanced Concepts Office, 1995.
Nolte, WL, et al., Technology Readiness Level Calculator, Air Force Research Laboratory, presented at the NDIA Systems Engineering Conference, 2003.
United States General Accounting Office, Coal Power Plants: Opportunities Exist for DOE to Provide Better Information on the Maturity of Key Technologies to Reduce Carbon Dioxide Emissions, Washington D.C.: US GAO, GAO-10-675, 2010.

Figure 6 Qualitative risk contribution tree showing categorical pillars of Technical, Economic and Regulatory/Societal concerns. Sub topics illustrate a taxonomy for further refinement of each topic.
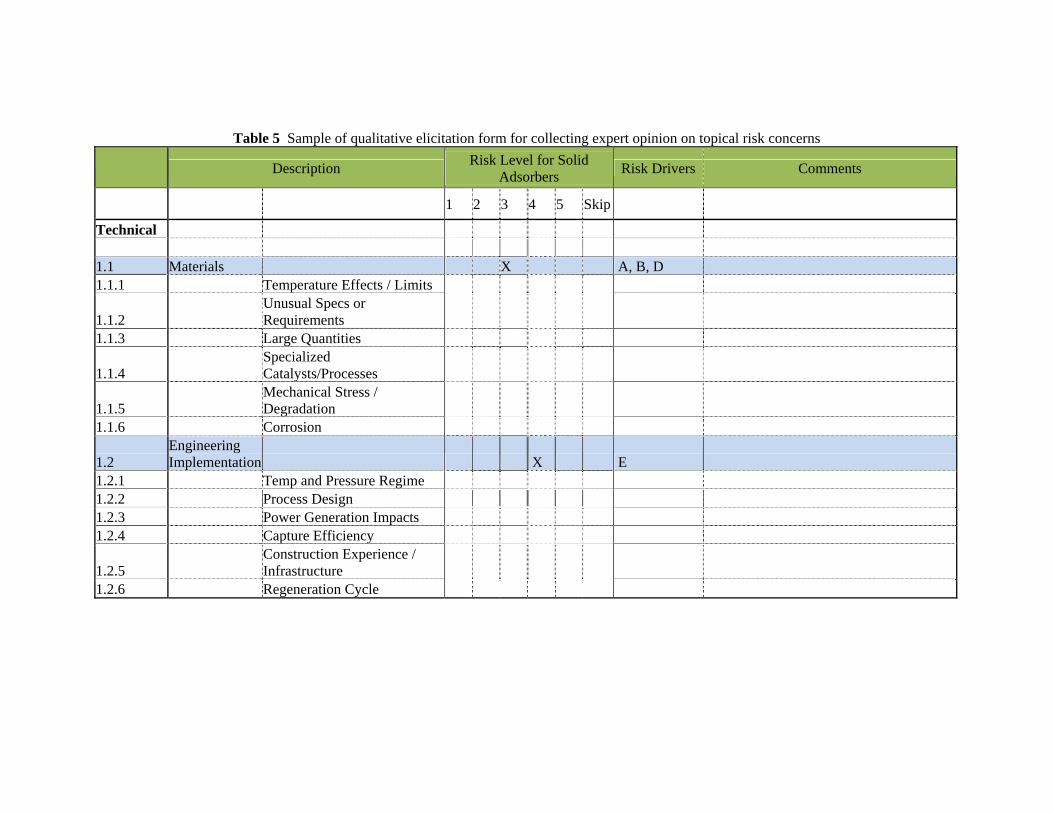
Table 5 Sample of qualitative elicitation form for collecting expert opinion on topical risk concerns
Description
Risk Level for Solid Adsorbers
Risk Drivers Comments
1 2 3 4 5 Skip Technical 1.1 Materials X A, B, D 1.1.1 Temperature Effects / Limits
1.1.2 Unusual Specs or Requirements
1.1.3 Large Quantities
1.1.4 Specialized Catalysts/Processes
1.1.5 Mechanical Stress / Degradation
1.1.6 Corrosion
1.2 Engineering Implementation X E
1.2.1 Temp and Pressure Regime 1.2.2 Process Design 1.2.3 Power Generation Impacts 1.2.4 Capture Efficiency
1.2.5 Construction Experience / Infrastructure
1.2.6 Regeneration Cycle
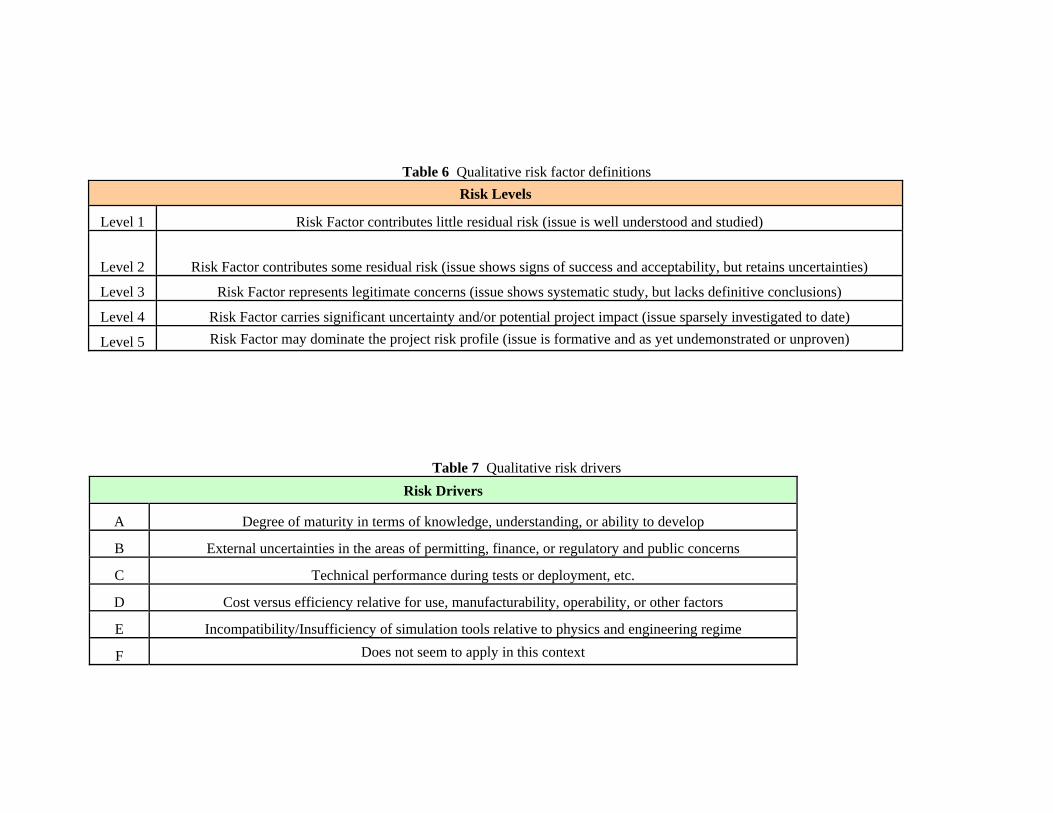
Table 6 Qualitative risk factor definitions
Risk Levels
Level 1 Risk Factor contributes little residual risk (issue is well understood and studied)
Level 2 Risk Factor contributes some residual risk (issue shows signs of success and acceptability, but retains uncertainties)
Level 3 Risk Factor represents legitimate concerns (issue shows systematic study, but lacks definitive conclusions)
Level 4 Risk Factor carries significant uncertainty and/or potential project impact (issue sparsely investigated to date)
Level 5 Risk Factor may dominate the project risk profile (issue is formative and as yet undemonstrated or unproven)
Table 7 Qualitative risk drivers
Risk Drivers
A Degree of maturity in terms of knowledge, understanding, or ability to develop
B External uncertainties in the areas of permitting, finance, or regulatory and public concerns
C Technical performance during tests or deployment, etc.
D Cost versus efficiency relative for use, manufacturability, operability, or other factors
E Incompatibility/Insufficiency of simulation tools relative to physics and engineering regime
F Does not seem to apply in this context

