initial public offering and corporate governance in china's transitional economy
TRANSCRIPT

185
7.1 Introduction
During periods of institutional transformation—given that informalconstraints such as culture, rules, and values are difficult to change onceformed, and that the transformation may result in the development of aninefficient system—there could be obstacles to transformation that lockthe institution into its original path of evolution. Other institutions display-ing better performance consequently would be unable to emerge (North1991, 1994). An efficient institution thus can be beneficial to institutionaltransformation and to the spontaneous evolution of society (Hayek1960).
In the process of institutional transformation, whereby China graduallyhas moved away from a centrally planned economy toward a market econ-omy, the emphasis has been on the establishment of a sound system ofproperty rights and a stable financial system. The reform of the financialsystem has attracted the most attention. The financial system is closelybound up with the reform of state-owned enterprises (SOEs) and of the fis-cal system; thus the reform of the financial system will have a significantimpact on the institutional transformation of China’s economy as a whole.The establishment of the Shanghai Stock Exchange in December 1990 wasa landmark in the development of the stock market in China. As the nec-essary infrastructure was established, the calls for a direct-financing mar-ket grew louder. The stock market began to blossom, and there was rapiddevelopment within a relatively short period of time.
7Initial Public Offering andCorporate Governance in China’sTransitional Economy
Chen Chien-Hsun and Shih Hui-Tzu
Chen Chien-Hsun is a research fellow at the Chung-Hua Institution for Economic Re-search. Shih Hui-Tzu is a research fellow at the Chung-Hua Institution for Economic Re-search.

The types of shares traded in China’s stock market can be divided intothree main categories: A-, B-, and H-shares. A-shares are available to do-mestic holders, B-shares are available exclusively to foreign investors andcertain authorized domestic securities firms, and H-shares are listed on theHong Kong Stock Exchange.1 Since 1987, A-shares have steadily becomemore popular; as of December 2000, the total amount raised through theissuing of new shares and allotment shares came to 324.213 billion ren-minbi (RMB). As regards B-shares, since they were first issued in 1992,they have become one of the main means by which China secures its for-eign investment. However, the amount of money raised through B-shareshas been less than the amount raised from A-, H-, or N-shares (N-sharesare listed on the New York Stock Exchange). H-shares were first issued in1993 as another means by which the stock markets could secure foreigncapital. By 2000, the total amount of funds secured by the issuing of newshares and allotment shares came to RMB 225.226 billion (see the ChinaSecurities Regulatory Commission Web site: www.csrc.gov.cn).2
Several recent empirical studies have provided evidence of the perfor-mance of initial public offerings (IPOs) for China’s stock markets; for ex-ample, Mok and Hui (1998) found that A-share IPOs in Shanghai were 289percent underpriced between 19 December 1990 and 31 December 1993,due to the excessive demand for the limited supply of negotiable shares.B-share IPOs were only 26 percent underpriced. Different ownership struc-tures, a long time-lag between offering and listing, and information asym-metry all contributed to IPO underpricing. Using data on 308 firm-commitment IPOs from 1 January 1987 through to 31 December 1995, Suand Fleisher (1999) found that IPO underpricing was a strategy for firmsto signal their value to investors. From a sample of eighty-three IPOs com-pleted between 1992 and 1995, Aharony, Lee, and Wong (2000) found thatthe median firm return on assets (ROA) peaked in the IPO year and de-clined thereafter. The post-IPO decline in ROA is statistically insignificantin protected industries such as petrochemicals, energy, and raw materials;firms in the protected industries are favored by the Chinese government inthe selection process. Chen, Firth, and Kim (2000) considered 277 A-shareand 65 B-share IPOs during the 1992–1995 period, with their results show-ing that B-share IPOs underperformed A-share IPOs during the postissueperiods for up to three years.
In this paper, we extend the prior works on Chinese IPOs and empiricallyexamine IPO performance. Our sample consists of 437 companies listed onthe Shanghai Stock Exchange, and 447 companies listed on the Shenzhenexchange (for a longer time period) from 1995 to 1999. Investigation ofChina’s IPOs is appealing and timely, since most of the listed companies are
186 Chen Chien-Hsun and Shih Hui-Tzu
1. From 20 February 2001, B-shares were made available to domestic residents.2. Xu (2000) indicates there is no significant evidence of any causal relationship between
volume and volatility for Shanghai B-shares. Sun and Tong (2000) also find foreign investorsare more sensitive to currency risk.

SOEs, and establishing effective corporate governance of SOEs has becomea key priority for China’s policymakers during the transitional period.
The remainder of the paper is organized as follows. Section 7.2 containsa discussion on equity structure and the corporate governance mechanism.Section 7.3 establishes financial indicators to evaluate the operational per-formance of listed companies. The empirical results of IPOs’ performanceare reported in section 7.4, with section 7.5 providing concluding remarksto this study.
7.2 Equity Structure and Corporate Governance
The methods by which stocks are listed and shares issued in China’s stockmarkets violate the market principle. Equity in listed companies is artifi-cially divided into different categories of shares in the same stock that havedifferent rights: state shares, legal person shares, public shares, and internalemployee shares. State shares are held by the state and its varied ministries,bureaus, and regional governments; legal person shares are kept by otherSOEs; public shares are retained by individuals or private entities; and in-ternal employee shares are maintained by managers and employees. For ex-ample, holders of state shares can transfer their allotment rights in part orin whole to the holders of public shares; while holders of state shares canmaintain their right to share in the benefits from share allotment, or choosenot to participate in share allotment, thereby transferring the risk onto theshoulders of the holders of public shares. By contrast, the holders of publicshares can buy and sell shares only on the secondary market.
Table 7.1 provides details of the equity structure of listed companies inChina and the changes to that structure during the period from the end of1992 to the end of 2000.
State shares remained the dominant proportion of total shares, but theproportion of state shares in the equity structure of listed companies fellfrom 41.38 percent to 38.90 percent, a decrease of 2.48 percent. The rea-sons for this decline were as follows: (1) Owing to the fall in central gov-ernment revenue, China stopped increasing the capitalization of SOEs;however, listed companies were constantly implementing capital incre-ments to increase the proportion of public shares, which therefore causedthe proportion of state shares to fall. (2) In the last few years there has beena series of cases of state shares’ being privately transferred to legal persons,which has increased the proportion of legal person shares.
The reform of SOEs is nevertheless still making use mainly of state-owned holding companies, with the government insisting that listed com-panies must still be subsidiaries of a state-owned holding company. The re-form of the SOEs therefore does not involve wholesale privatization, andstate shares therefore continue to play an important role.
As far as founders’ stocks are concerned, the proportion of domestic le-gal person shares has risen from 13.14 percent to 16.94 percent, an increase
Initial Public Offering and Corporate Governance 187

Tab
le 7
.1E
quit
y S
truc
ture
of S
tock
s L
iste
d on
Chi
na’s
Sto
ck M
arke
ts
End
199
2E
nd 1
997
End
199
8E
nd 1
999
End
200
0
Bill
ions
Bill
ions
Bill
ions
Bill
ions
Bill
ions
Shar
e Ty
peof
Sha
res
%of
Sha
res
%of
Sha
res
%of
Sha
res
%of
Sha
res
%
Shar
es n
ot y
et in
cir
cula
tion
4.76
969
.25
127.
124
65.4
416
6.48
565
.89
200.
7165
.02
243.
743
64.2
8F
ound
er’s
stoc
k4.
035
58.5
910
7.82
655
.50
142.
934
56.5
717
4.70
956
.60
216.
5457
.11
Stat
e sh
ares
2.85
041
.38
61.2
2831
.52
86.5
5134
.25
111.
607
36.1
614
7.51
338
.90
Dom
esti
c le
gal p
erso
n sh
ares
0.90
513
.14
43.9
9122
.64
52.8
0620
.90
59.0
5119
.13
64.2
5516
.94
For
eign
lega
l per
son
shar
es0.
280
4.07
2.60
71.
343.
577
1.42
4.05
11.
314.
621.
22F
und-
rais
ing
lega
l per
son
shar
es0.
649
9.42
13.0
496.
7215
.234
6.03
19.0
16.
1621
.421
5.65
Inte
rnal
em
ploy
ee s
hare
s0.
085
1.23
3.96
22.
045.
170
2.05
3.67
11.
192.
429
0.64
Oth
er (t
rans
ferr
ed a
llotm
ent)
0.00
0.00
2.28
71.
183.
147
1.25
3.32
1.08
2.46
20.
65Sh
ares
in c
ircu
lati
on2.
118
30.7
567
.144
34.5
686
.194
34.1
110
7.96
534
.98
135.
427
35.7
2D
omes
tica
lly li
sted
Ren
min
bi s
hare
s (A
-sha
res)
1.09
315
.87
44.2
6822
.79
60.8
0324
.06
81.3
1826
.34
107.
817
28.4
4D
omes
tica
lly li
sted
fore
ign
capi
tal s
hare
s (B
-sha
res)
1.02
514
.88
11.7
316.
0413
.396
5.30
14.1
924.
6015
.157
4.00
Ove
rsea
s-lis
ted
fore
ign
capi
tal s
hare
s (H
-sha
res)
0.00
0.00
11.1
455.
7411
.995
4.75
12.4
544.
0312
.454
3.28
Sou
rces
:Chi
na S
ecur
itie
s R
egul
ator
y C
omm
issi
on (C
SRC
; 200
0, 1
89) a
nd th
e C
SRC
Web
sit
e (w
ww
.csr
c.go
v.cn
).N
ote:
Eac
h sh
are
has
a fa
ce v
alue
of R
MB
1.0
0.

of 3.80 percent, while the proportion of fund-raising legal person shareshas fallen from 9.42 percent to 5.65 percent, a decrease of 3.77 percent.The reasons for this are as follows:
1. Most listed companies have been transformed from SOEs; listing isusually implemented as part of the restructuring of SOEs, and the propor-tion of total capitalization accounted for by the former SOEs’ internal re-serves is defined as founder’s stock after listing.
2. Many listed companies are the profitable parts of SOEs which werespun off, with the SOEs retaining founder’s stock; this has led to a signifi-cant increase in the proportion of founder’s stock.
3. Owing to the general decline in enterprise performance over the lastfew years, and the restrictions on the circulation of legal person shares, themarket for legal person shares is not sufficiently lively and market pricesare unattractively low; as a result, there has been a general decrease in mu-tual investment between unrelated legal persons, so that the proportion offund-raising legal person shares has fallen gradually.
The proportion of employee shares in unlisted companies rose from 1.23percent to 2.04 percent, and then declined to 0.64 percent. This reflects theway in which, during the process of institutional transformation, enter-prises have used employee stock options as a means of improving employeewelfare.
With regard to the proportion of total equity accounted for by the vari-ous types of shares, the continual implementation of capital increments toincrease the number of public shares and the private transfer of state sharesto legal persons has caused the proportion of listed company equity ac-counted for by state shares to fall from 41.38 percent in 1992 to 38.0 per-cent in 2000. State shares are, however, still the most numerous category ofshares. At the same time, because shares that cannot be traded freely (in-cluding state shares) account for 60 percent of total equity, company man-agers do not have to worry that poor management may cause their enter-prises’ stock prices to fall, or that their company will be faced with thethreat of being taken over. In other words, holders of public shares cannot“vote with their feet” and managers are not concerned about the rights ofpublic shareholders (Xu and Wang 1999).
In 2000, the Chinese government began undertaking reform of its SOEsin the petrochemical,3 communications,4 rail transport, and electric power
Initial Public Offering and Corporate Governance 189
3. China Petroleum and Natural Gas Ltd. implemented an IPO using H-shares and Amer-ican depository receipts (ADR) in both Hong Kong and New York in March 2000, afterwhich the state shares in the company held by its parent company, China National PetroleumCorporation (CNPC), was reduced to 90 percent (Wu 2001).
4. In June 2000, following reorganization, Zhong Lian Tung secured a stock market listingin both Hong Kong and New York using “red chip” shares and ADR. The amount of capitalraised was US$6.278 billion, making this the largest IPO ever involving an Asian company(other than Japanese companies). Following the IPO, the shares in Zhong Lian Tung held bythe state fell by 80 percent (Wu 2001).

sectors, seeking to reorganize the entire industry and establish a regulatedcompany system. The aim was to have these reorganized companies listedon the domestic and overseas stock markets, establishing a regulated frame-work for corporate governance and turning the old SOEs into real bus-inesses.
The developing capital markets can, on the one hand, enable enterprisesto increase their capitalization; while at the same time change in enter-prises’ equity and corporate governance structures can be used to create asolid foundation for dealing with the underlying causes of indebtedness.However, China’s capital markets have not had long to develop, and theiroverall level of development is still low. Too little in-depth thinking hasgone into directing the course of their development, and various levels ofdisparity exist in certain areas. Furthermore, theoretically speaking, thecorporate governance structure requires a separation between investorsand managers; a set of incentive mechanisms and restrictive mechanismsneed to be developed to reduce agency costs and ensure that the investorsreceive a return on their investment. However, there are inherent weak-nesses in the governance structure of China’s SOEs. First of all, as far as in-centive mechanisms are concerned, despite twenty years of reform therehas been no systematic improvement in the incentive mechanisms ofChina’s SOEs, and their attempts to imitate the incentive mechanisms ofprivate enterprises have run into two major problems. First of all, it is verydifficult to find suitable indicators for implementing rewards and punish-ments in SOEs, wherein both the starting point and the policy burden aredifferent; and second, there is a lack of faith in the commitments made. TheSOEs’ restrictive mechanisms are characterized by excessive administra-tive interference and the simultaneous existence of excessive internal con-trols.5 As a result, enterprise management tends to become divorced fromthe owners’ interest. It is therefore not enough to rely on the capital mar-kets alone to transform the SOEs; a strategic withdrawal is needed fromstate involvement in the economy, and a favorable environment for privati-zation has to be created. This is the only way in which the reform of theSOEs can really be facilitated (Wu and Zhao 2000).
7.3 The Operational Performance of Listed Companies
We will explore the operational performance of listed companies inChina in terms of the growth, profitability, and stability of these compa-nies, taking into consideration differences between stock exchanges andindustries. The selection of financial indicators is based on (1) the use of
190 Chen Chien-Hsun and Shih Hui-Tzu
5. One example is Zhonguo Yituo Ltd. in Henan Province. Although Zhonguo Yituo suc-ceeded in securing RMB 1.6 billion through the stock market in 1997, the lack of sound man-agement mechanisms led to errors being made with respect to the company’s expansion, andconsequently, the company’s operational performance was poor.

listed companies’ operating revenue and net profit growth rates to explorethe performance of listed companies in terms of growth, as well as thedifferences between stock exchanges and industries; (2) the use of listedcompanies’ earnings per share (EPS) and return on equity (ROE, whichequals net profit/shareholders’ equity) to explore listed companies’ perfor-mance in terms of profitability, as well as the differences between stock ex-changes and industries; and (3) the use of listed companies’ quick ratios([current asset – inventory]/current ratio) and current ratio (current asset/current liability) to explore listed companies’ performance in terms of sta-bility, as well as the differences between stock exchanges and industries.Empirical verification is then undertaken with regard to the impact ofIPOs on the operational performance of listed companies, to determine theimpact of the stock market on China’s economic development as it pro-gresses through this period of institutional transformation.
7.3.1 Data Description and Methodology
Listed companies’ interim financial reports for 1999 published by ChinaSecurities Regulatory Commission (CSRC) were used for empirical esti-mation. The data given covered the period from mid-1995 to mid-1999.The CSRC data include listed companies’ operating revenue, net profitrates, EPS, ROE, quick ratio, and current ratio. The sample consisted of884 companies (including both A-shares and B-shares); 437 of the compa-nies were listed on the Shanghai Stock Market and 447 were listed on theShenzhen Stock Market.
As regards industry classification, the Shanghai Stock Market divides alllisted companies into five categories: industrial, commercial, real estate,public utilities, and general. The Shenzhen Stock Market divides all listedcompanies into six categories: industrial, commercial, financial, real es-tate, public utilities, and general. Such classifications are inappropriate,partly because the two stock exchanges use different classification systems,and partly because the classifications are not sufficiently precise. If the in-dustry data produced by the Shanghai and Shenzhen stock markets areused, not only is the classification too precise, but the disparity between thenumbers of enterprises in each category is too obvious. To facilitate com-parison, for the purposes of this study all listed companies were dividedinto twenty-one industries: agriculture; mining; food, textiles, and gar-ments; printing and papermaking; metals and metal products; chemical in-dustry; pharmaceuticals; construction materials; machinery; electronicsand electrical appliances; precision instruments; vehicles; miscellaneous;public utilities; transportation; finance; real estate and construction; traveland hotels; commerce; foreign trade; and information (see table 7.2).
The data cover the period 1995–1999, during which both the Asian fi-nancial crisis and China’s economic recovery occurred. Therefore it is in-appropriate to compare the data for different years. In addition, regarding
Initial Public Offering and Corporate Governance 191

the comparison of financial indicators between listed companies, a rea-sonable level of comprehension already has been achieved with respect tolisted companies’ financial statements; thus the main emphasis in the fol-lowing analysis will be on the comparison of industry performance in eachyear and on industry performance within the sample as a whole.
The industries to which listed companies belong are grouped into fivecategories: (1) those industries that have performed very well by compari-son with the average for all industries (e.g., the financial indicator for theindustry in question was 50 percent higher than the average for all indus-
192 Chen Chien-Hsun and Shih Hui-Tzu
Table 7.2 Sample Data Industry Categories
Industry Category Original Category Industry Category Original Category
Agriculture AgricultureForestryFisheriesLivestock
Mining MiningMachinery Agricultural machinery
MachineryMilling machines and
materialsTextile machinery
Electronics and Electromechanicalelectrical appliances Electronic appliances
Wire and cableRefrigeration
equipmentHome appliances
Precision instruments Instruments and metersMedical instruments
Vehicles BicyclesMotorcyclesAuto accessoriesAuto manufacturingShipbuildingAircraft manufacturing
Metals and metal Iron and steelproducts Metallurgy
Pharmaceuticals PharmaceuticalsBiotechnology
Miscellaneous PensToysJewelrySportsIndustrial
Travel and hotels TravelHotelsBrewing
Commerce CommerceRentalPackagingGeneral
Information ComputersCommunications
Foreign trade TradeFood, textiles, and Food
garments TextilesGarments
Printing and Printingpapermaking Paper industry
Chemical industry ChemicalsArtificial fiberPaints
Construction materials GlassConstruction
materialsCement
Real estate and Materialsconstruction Ceramics
Basic constructionHighway constructionHarbor construction
Public utilities Industrial districtsReal estateBuilding contractorsPublic utilitiesEnergyWater supply
Transportation WarehousingTransportationContainers
Finance Finance

tries for that year or period); (2) those industries that performed betterthan the average for all industries (e.g., the financial indicator for the in-dustry in question was higher than—but less than 50 percent higherthan—the average for all industries for that year or period); (3) those in-dustries that performed worse than the average for all industries (e.g., thefinancial indicator for the industry in question was lower than—but lessthan 50 percent lower than—the average for all industries for that year orperiod); (4) those industries that performed significantly worse than the av-erage for all industries (e.g., the financial indicator for the industry in ques-tion was less than 0.5 percent of the average for all industries for that yearor period); (5) those industries that performed markedly worse than the av-erage for all industries (e.g., the financial indicator for the industry in ques-tion was less than 0.1 percent of the average for all industries for that yearor period).
To assess the pre- and post-IPO operational performance of listed com-panies, according to Greene (1993), the analysis of variance (ANOVA)tests the null hypothesis that all coefficients of the regression other than theintercept are zero; the ANOVA test rather than regression method can beused to conduct empirical assessment. Therefore, the ANOVA method wasutilized to verify the impact of the IPOs on the operational performance oflisted companies, to determine whether the null hypothesis could be ac-cepted—the null hypothesis was that a listed company’s operational per-formance would not change after its IPO; namely, there would be no differ-ence in the financial indicators between the average values of the IPO yearand the average values of the subsequent three years.
We begin by analyzing the overall operational performance of the in-dustries to which China’s listed companies belong, from the points of viewof growth, profitability, and stability. First, we conduct a combined anal-ysis of operating revenue and profitability by industry. Then we calculatethe overall financial indicator ratings for each stock exchange and each in-dustry, in order to evaluate the overall relative operational performance oflisted companies in China.
Regarding the analysis of overall industry operating revenue and prof-itability, the financial indicators that can best represent a listed company’soperating revenue and profitability are the operating revenue growth rateand ROE (Li 1999). The industry’s growth rate in operating revenue istaken as the horizontal axis, with ROE as the vertical axis, and the relevantvalues from the Shanghai and Shenzhen stock exchanges are then plottedon the graph. The average value for all companies listed on the two ex-changes is taken as the demarcation point, and all industries are dividedinto four categories: (1) industries with high growth and high profits (thefirst quadrant on the graph); (2) industries with low growth but high prof-its (the second quadrant); (3) industries with low growth but low profits(the third quadrant); and (4) industries with high growth and low profits
Initial Public Offering and Corporate Governance 193

(the fourth quadrant). Those industries with high growth and high profitshave the highest overall revenue and profitability; those industries with lowgrowth and low profits have the lowest overall revenue and profitability;those industries with high growth and low profits or low growth and highprofits lie between the two (see figs. 7.1 and 7.2).
Industries with High Growth and High Profitability
This category includes public utilities and trade. Their chief characteris-tics are that they have a large potential market and good development po-tential.
Industries with Low Growth and High Profitability
This category includes transportation, pharmaceuticals, agriculture,and mining. These industries have stable market prices, and while they doexperience temporary slumps, overall they are stable, mature industrieswith high profitability.
Industries with High Growth and Low Profitability
On the Shanghai Stock Exchange, this category includes a total of sixindustries: precision instruments, information, electronics and electricalappliances, the chemical industry, commerce, and miscellaneous. On theShenzhen Stock Exchange it includes a total of five industries: food, tex-tiles, and garments; pharmaceuticals; printing and papermaking; machin-ery; and information. The chief characteristic of these industries is thatcompetition is very fierce within each industry. Although overall demandis still increasing, the rate of increase in supply is far higher than the rate ofincrease in demand. As a result, price-cutting competition is causing earn-ings to fall, and there is market polarization in the performance of compa-nies in the industry. However, the prospects for the industry as a whole arestill good, and there is considerable potential for development in themedium and long terms.
Industries with Low Growth and Low Profits
On the Shanghai Stock Exchange this category includes a total of nineindustries: real estate and construction; travel and hotels; constructionmaterials; metals and metal products; finance; vehicles; machinery; food,textiles, and garments; and printing and papermaking. On the ShenzhenStock Exchange, it includes a total of fourteen industries: real estate andconstruction, travel and hotels, construction materials, metals and metalproducts, finance, vehicles, electronics and electrical appliances, the chem-ical industry, commerce, miscellaneous, agriculture, precision instru-ments, trade, and transportation. The main characteristic of these indus-tries is that many of them are primary industries. In recent years, the pricesof raw materials and energy in China have risen, but the price of finished
194 Chen Chien-Hsun and Shih Hui-Tzu
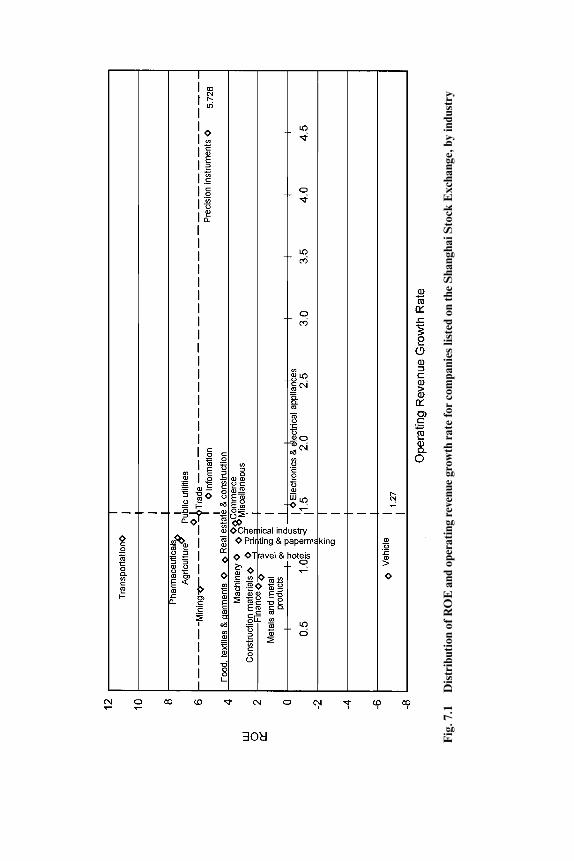
Fig
. 7.1
Dis
trib
utio
n of
RO
E a
nd o
pera
ting
reve
nue
grow
th ra
te fo
r co
mpa
nies
list
ed o
n th
e S
hang
hai S
tock
Exc
hang
e, b
y in
dust
ry

Fig
. 7.2
Dis
trib
utio
n of
RO
E a
nd o
pera
ting
reve
nue
grow
th ra
te fo
r co
mpa
nies
list
ed o
n th
e S
henz
hen
Sto
ck E
xcha
nge,
by
indu
stry

products has fallen. As a result, the market has contracted, competitionhas become much fiercer, and overall industry performance has fallen.
Finally, we calculate the overall financial indicator scores for each stockexchange and each industry in order to evaluate the overall relative opera-tional performance of listed companies in China. The standard for evalu-ation is based on the principles of analysis described above. Those indus-tries displaying good performance are awarded 5 points, those displayingacceptable performance are awarded 4 points, those displaying relativelypoor performance are awarded 3 points, those displaying bad performanceare awarded 2 points, and those displaying very bad performance areawarded just 1 point.
The only industries to display good overall performance (with a totalscore of 4 or higher) are the public-utility, transportation, and finance in-dustries. In terms of the stock exchange, for the Shanghai Stock Exchangethose industries that displayed relatively good performance were thepublic-utility, chemical, trade, and precision instruments industries; forthe Shenzhen Stock Exchange they were the transportation and finance in-dustries. Clearly, the overall operational performance of most industries ispoor, and those that demonstrate better performance are China’s “sunrise”industries. Furthermore, of the companies listed on the Shanghai StockExchange, the overall performance of those in agriculture; food, textiles,and garments; metals and metal products; chemical industry; pharmaceu-ticals; precision instruments; miscellaneous; public utilities; real estate;commerce; trade; and information is superior to that of those listed on theShenzhen Stock Exchange (see tables 7.3–7.5).
7.4 The Impact of IPOs on Listed Companies
In the previous section, we undertook structural analysis of the financialindicators of listed companies in China. However, more analysis is neededto determine whether an IPO does in fact have a positive impact on a com-pany’s operations.6 In this study, we use the ANOVA method, which is ap-plied to the data for the year of IPO and the subsequent three years, to un-dertake a mean value parity assumption verification analysis with respectto companies’ operating revenue growth rate, net profit growth rate, EPS,and ROE. The results are shown in table 7.6. The results of the ANOVAanalysis show that following IPO, the only financial indicators in whichthere is any statistically significant change are ROE and EPS (for compa-nies listed on the Shanghai Stock Exchange only); in other words, only inthe profitability indicators is there any change.
Initial Public Offering and Corporate Governance 197
6. According to Chinese Company Law, the stock shares of listed companies shall not beless than 5,000 shares. If they reach 5,000 shares, there is no need to issue new shares; there-fore, a dilution effect by IPOs does not exist. Otherwise, if there were less than 5,000 shares,the dilution effect may be pervasive.

We further classify the industry into six subcategories: agriculture, man-ufacturing, public utilities, real estate and construction, finance and com-merce, and general. The results of ANOVA in table 7.7 indicate that fol-lowing IPO, the financial indicators in which there are statisticallysignificant changes are ROE for manufacturing and for finance and com-merce, since they are state monopolies. If the listed companies are groupedby share classes (as in table 7.8), the results of ANOVA indicate that onlyROE has any significant change for both A-shares and B-shares.
If the financial indicators for listed companies before and after IPO aregrouped in sets of two years, regardless of whether the company is listed onthe Shanghai or Shenzhen Stock Exchange, we can see from the results that(1) operating revenue growth rate tends to decline sharply after IPO, witha clear disparity with the annual statistics reported at the time of IPO; (2)net profit growth rate tends to decline sharply after IPO, with a clear dis-parity with the annual statistics reported at the time of IPO; (3) ROE tends
198 Chen Chien-Hsun and Shih Hui-Tzu
Table 7.3 Overall Financial Indicator Ratings, Listed Companies in China
Operating Net Profit Quick CurrentName of Industry Revenue Rate ROE EPS Ratio Ratio Average
Agriculture 3 3 3 3 4 4 3.33Mining 2 3 5 4 4 3 3.50Food, textiles, and
garments 2 3 3 3 4 4 3.17Printing and papermaking 2 3 3 3 4 4 3.17Metals and metal products 5 4 3 3 3 3 3.50Chemical industry 4 4 3 3 4 4 3.67Pharmaceuticals 3 3 3 3 4 3 3.17Construction materials 2 3 3 3 3 3 2.83Machinery 3 3 3 3 3 4 3.17Electronics and electrical
appliances 5 5 3 4 3 3 3.83Precision instruments 2 4 3 5 4 4 3.67Vehicles 5 3 2 3 3 3 3.17Miscellaneous 2 3 4 4 4 4 3.50Public utilities 3 5 4 4 4 4 4.00Transportation 4 3 4 4 5 5 4.17Finance 4 5 4 5 3 3 4.00Real estate and
construction 3 4 3 3 3 3 3.17Travel and hotels 3 4 3 4 4 4 3.67Commerce 3 3 5 3 3 3 3.33Foreign trade 5 3 3 4 4 4 3.83Information 3 4 2 4 4 4 3.50
Notes: Those industries displaying superior performance are given 5 points; those displaying reasonableperformance are given 4 points; those displaying relatively poor performance are given 3 points; thosedisplaying poor performance are given 2 points; and those displaying very bad performance are given 1point.

to fall sharply after IPO, with a clear disparity with the financial statementssubmitted at the time of IPO; and (4) EPS tend to fall sharply after IPO; inthe case of companies listed on the Shanghai Stock Exchange, there is aclear disparity with the financial statements submitted at the time of IPO,while for companies listed on the Shenzhen Stock Exchange this is not thecase, and some improvement can be seen in the tendency for earnings pershare to fall.
The above analysis shows that for enterprises in China’s stock markets,IPO does not present any marked benefits with respect to operational per-formance, and in fact performance tends to worsen. One of the reasons forthis is that in order to implement the IPO and secure a stock market listing,companies tend to submit inflated figures in the financial statements thatthey are required to provide; the real situation is reflected gradually afterthe company has secured a listing. In addition, the state still retains a ma-jority share in most listed SOEs in China; thus, the fundamental characterof these enterprises is unchanged and the influence of the original SOE
Initial Public Offering and Corporate Governance 199
Table 7.4 Overall Financial Indicator Ratings, Companies Listed on the ShanghaiStock Exchange
Operating Net Profit Quick CurrentName of Industry Revenue Rate ROE EPS Ratio Ratio Average
Agriculture 3 4 4 4 4 4 3.83Mining 2 3 4 3 3 3 3.00Food, textiles, and
garments 2 3 4 4 4 4 3.50Printing and papermaking 2 3 3 3 3 3 2.83Metals and metal products 5 4 3 3 3 3 3.50Chemical industry 5 5 4 3 4 4 4.17Pharmaceuticals 3 3 4 4 3 3 3.33Construction materials 2 2 3 2 3 3 2.50Machinery 3 3 3 3 3 4 3.17Electronics and electrical
appliances 4 4 3 4 3 3 3.50Precision instruments 3 3 4 4 5 5 4.00Vehicles 4 3 2 3 3 3 3.00Miscellaneous 2 3 4 4 4 4 3.50Public utilities 3 5 5 4 4 4 4.17Transportation 3 3 5 4 4 4 3.83Finance 2 5 4 5 3 3 3.67Real estate and
construction 3 4 4 4 3 3 3.50Travel and hotels 2 3 3 3 4 4 3.17Commerce 3 3 4 4 3 3 3.33Foreign trade 5 4 4 5 4 4 4.33Information 3 4 4 4 3 3 3.50
Notes: See table 7.3.

systems and structures is not erased. In particular, the government stilldirectly appoints, or interferes in the appointment of, senior managersfor some companies; a company chairman or president is frequently ap-pointed by government authorities. In their governance structure, there-fore, many listed companies retain an agency relationship within the com-pany, rather than a property-ownership relationship. At best, governance
200 Chen Chien-Hsun and Shih Hui-Tzu
Table 7.6 Empirical Results of ANOVA, by Stock Exchange
Shanghai Shenzhen
Financial Indicator F value Pr � F value F value Pr � F value
Operating revenue growth rate 0.16 0.926 0.86 0.4600Net profit growth rate 0.16 0.926 1.07 0.3602EPS 8.10 0.0001* 1.15 0.3340ROE 9.12 0.0001* 10.55 0.0001*
*Significant at the 1 percent level.
Table 7.5 Overall Financial Indicator Ratings, Companies Listed on the ShenzhenStock Exchange
Operating Net Profit Quick CurrentName of Industry Revenue Rate ROE EPS Ratio Ratio Average
Agriculture 3 2 2 3 4 4 3.00Mining 2 3 5 4 5 4 3.83Food, textiles, and
garments 2 2 2 2 3 3 2.33Printing and papermaking 3 3 2 3 4 4 3.17Metals and metal products 5 4 2 3 3 3 3.33Chemical industry 4 3 3 3 3 3 3.17Pharmaceuticals 3 2 2 3 4 4 3.00Construction materials 3 3 3 4 4 4 3.50Machinery 4 3 3 4 3 4 3.50Electronics and electrical
appliances 5 5 3 4 3 3 3.83Precision instruments 2 4 2 5 4 4 3.50Vehicles 5 4 2 3 3 3 3.33Miscellaneous 2 3 4 5 3 3 3.33Public utilities 3 5 3 4 4 4 3.83Transportation 4 4 3 4 5 5 4.17Finance 5 5 4 4 3 3 4.00Real estate and
construction 3 4 2 3 3 3 3.00Travel and hotels 3 5 3 4 4 4 3.83Commerce 3 2 5 3 3 3 3.17Foreign trade 3 2 2 2 3 3 2.50Information 3 4 1 4 4 4 3.33
Notes: See table 7.3.

Tab
le 7
.7E
mpi
rica
l Res
ults
of A
NO
VA, b
y In
dust
ry
Rea
l Est
ate
and
Fin
ance
and
C
onst
ruct
ion
Com
mer
ceA
gric
ultu
reM
anuf
actu
ring
Pub
lic U
tilit
ies
Gen
eral
Fin
anci
al I
ndic
ator
FP
r �
FF
FP
r �
FF
Pr
�F
Pr
�F
FP
r �
FF
Pr
�F
Ope
rati
ng r
even
ue g
row
th r
ate
3.34
0.04
81.
260.
2860
0.43
0.73
20.
510.
677
0.23
40.
878
0.06
0.98
1N
et p
rofit
gro
wth
rat
e0.
750.
480
0.50
0.65
701.
280.
297
0.91
0.44
20.
790.
502
0.41
0.74
3E
PS
1.51
0.22
90.
820.
4850
1.79
0.16
24.
010.
011
1.50
0.21
52.
830.
042
RO
E1.
240.
310
10.5
90.
0001
*0.
780.
511
3.64
0.01
75.
470.
001*
0.07
0.97
7
Not
es:
Agr
icul
ture
incl
udes
the
agr
icul
ture
, for
estr
y, fi
sher
ies,
and
live
stoc
k se
ctor
s. M
anuf
actu
ring
incl
udes
the
min
ing;
food
, tex
tile
s, a
nd g
arm
ents
; pri
ntin
gan
d pa
per
mak
ing;
che
mic
al in
dust
ry; p
harm
aceu
tica
ls; c
onst
ruct
ion
mat
eria
ls; m
achi
nery
; ele
ctro
nics
and
ele
ctri
cal a
pplia
nces
; pre
cisi
on in
stru
men
ts; v
ehic
les;
met
als
and
met
al p
rodu
cts;
info
rmat
ion;
and
mis
cella
neou
s se
ctor
s. G
ener
al in
clud
es th
e tr
ansp
orta
tion
, tra
vel a
nd h
otel
s, a
nd fo
reig
n tr
ade
sect
ors.
*T
he n
ull h
ypot
hesi
s is
rej
ecte
d w
ithi
n a
1 p
erce
nt le
vel o
f sig
nific
ance
.

in these companies is a mixture of political interest and economic interest.What’s more, the control that holders of “state shares” exercise over thecompany tends to be weak in economic terms but strong in political terms.As a result, in their role as “agents,” the managers tend to be opportunisticwith respect to political matters, and to be affected by moral hazard withrespect to economic matters. Using firm-level data from over 300 stockcompanies from 1993 to 1995, Xu and Wang (1999) found that there was arelationship between ownership structure and corporate performance, in-dicating the positive role of legal person shares and the negative role ofstate shares. Chen (2001) used a sample of 434 manufacturing firms listedon the Chinese stock exchange; his findings showed that state shares play anegative role in corporate governance, while domestic institutional andmanagerial shareholdings improve firm’s performance.
Owing to the dual identity of the manager-agent, the mechanism for en-couragement and sanction by the company’s managers cannot lead to themaximization of benefits for the company. There are further serious prob-lems, such as the fact that internal control of company personnel is notkept within reasonable limits (Li and Huang 1999). In other words, the in-herent defects of the governance structure of Chinese companies led topoor operational performance (He and Liu 2000; Wu and Zhao 2000). Forexample, it is unclear how much control the ownership of “state shares”confers, there is too much insider trading, the responsibilities of the boardsof directors are not sufficiently defined, there is too much administrativeinterference, too many problems of internal control, and so on. As a result,although working capital may have increased after listing, there has beenno corresponding improvement in operational management. Conse-quently, the improvement in the company’s operational performance as aresult of IPO is not that dramatic. Of course, operational performance isalso affected by other factors not directly related to the company itself,such as the business cycle, the government’s industrial policy, and develop-ments in related industries; that is to say, the fact that the Asian financialcrisis and a weakening of demand in China occurred during the period cov-
202 Chen Chien-Hsun and Shih Hui-Tzu
Table 7.8 Empirical Results of ANOVA, by Share Class
A-Share B-Share
Financial Indicator F Pr � F F Pr � F
Operating revenue growth rate 0.83 0.478 0.53 0.595Net profit growth rate 1.55 0.200 0.61 0.552EPS 2.49 0.059 3.20 0.034ROE 15.93 0.001* 6.83 0.001*
*The null hypothesis is rejected within a 1 percent level of significance.

ered by the sample is another reason for the sudden fall in the financial in-dicators.
7.5 Conclusions
Whether one looks at growth, profitability, and stability individually orall together, it can be seen that the only industries in China in which listedcompanies display strong performance are the public utilities, transporta-tion, and finance; that is to say, China’s “sunrise” industries. The overalloperational performance of all other industries is clearly unsatisfactory,and poor performance is particularly widespread with respect to growth.Owing to the weak demand within China, there is excessive supply, intra-industry competition has become increasingly fierce, and enterprises’profit margins have been squeezed. In reality, the majority of enterprises inmost industries have lost their ability to secure further financing, makingit difficult for them to develop their operations further. In other words,listed companies have been willing to trade reduced profits for increasedoperating revenue and market share, which has affected their ability to se-cure financing.
An examination of the changes in listed companies’ financial indicatorsfollowing IPO reveals that, with the exception of earnings-related indica-tors (EPS and ROE), there is no significant change. What’s more, the fi-nancial indicators tend to fall rapidly year on year. This means that the IPOis of little obvious help to companies’ operational performance, and mayactually make it worse. One of the reasons for this is that, in order to im-plement the IPO and secure a stock market listing, companies tend to sub-mit inflated figures in the financial statements they are required to provide;the real situation is only gradually reflected after the company has secureda listing. Another possible factor is the poor corporate-governance char-acteristics of Chinese enterprises. For example, it is unclear how much con-trol the ownership of “state shares” confers, there is too much insider trad-ing, the responsibilities of the boards of directors are not sufficientlydefined, and there is too much administrative interference and too manyproblems of internal control. As a result, although working capital may in-crease after listing, there is no corresponding improvement in operationalmanagement. Consequently, the improvement in the company’s opera-tional performance as a result of IPO is not that dramatic. Of course, an-other factor causing the financial indicators to fall rapidly is the fact thatthe Asian financial crisis and a falling-off in domestic demand occurredduring the period covered by the sample.
The quality of listed companies is a prerequisite and a foundation for thedevelopment of capital markets. Only when listed companies displaystrong performance and growth can the ongoing development of the mar-
Initial Public Offering and Corporate Governance 203

ket be maintained. One of the things that needs to be done in order to im-prove the quality of listed companies is to select for listing those companiesthat display strong performance, have strong development potential, andoccupy a leading or advantageous position within their industries, encour-aging hi-tech enterprises and companies in other emerging industries tomake use of the capital markets. The second task is to ensure that the cap-ital raised through IPO is used more efficiently; companies’ listing plansshould be in conformity with their inventory and asset adjustment andtheir technology upgrading. Third, listed companies need to thoroughlytransform their management mechanisms, establishing efficient corporategovernance structures and corresponding stock option incentive mecha-nisms. Furthermore, the operations of listed companies need to be im-proved. Support can be provided for listed companies to improve their as-set and liability structures through debt-for-equity swaps and refinancing,and the Chinese government could encourage interregional, cross-industrymergers; acquisitions; and asset reorganization between listed companiesas well as between listed and nonlisted companies, and between companieswith different ownership structures. In this way, it will be possible to im-prove the operational efficiency of listed companies, cultivating a group oflarge listed companies with strong capabilities that will be competitive ininternational markets, making listed companies the core element in themarket and allowing them to exercise the function of market stabilization.
References
Aharony, J., C. W. J. Lee, and T. J. Wong. 2000. Financial packaging of IPO firmsin China. Journal of Accounting Research 38 (Spring): 103–126.
Chen, G., M. Firth, and J. B. Kim. 2000. The post-issue market performance of ini-tial public offerings in China’s new stock markets. Review of Quantitative Financeand Accounting 14 (June): 319–339.
Chen, J. 2001. Ownership structure as corporate governance mechanism: Evidencefrom Chinese listed companies. Economics of Planning 34:53–72.
China Securities Regulatory Commission. 2000. China securities and futures statis-tical yearbook, 2000. Beijing: Zhongguo Caizheng Jingji Press.
Greene, W. H. 1993. Econometric analysis. New York: Macmillan.Hayek, F. A. 1960. The constitution of liberty. Chicago: University of Chicago
Press.He, Shunwen, and Xing Liu. 2000. Problems relating to the control and equity
structure of listed companies in China. Xin Bao, 18 May.Li, Geping, and Bin Huang. 1999. The improvement of transferring state shares
and listed companies governance. Caimao Jingji 8:36–42.Li, Kan. 1999. Zhongguo Gushi Bodong Guilu Jiqi Fenxifangfa (China’s stock price
fluctuation and analysis method). Beijing: Jingji Kexue Press.Mok, H. M. K., and Y. V. Hui. 1998. Underpricing and aftermarket performance of
IPOs in Shanghai, China. Pacific-Basin Finance Journal 6 (November): 453–474.
204 Chen Chien-Hsun and Shih Hui-Tzu

North, D. C. 1991. Institutions, institutional change, and economic performance.New York: Cambridge University Press.
———. 1994. Economic performance through time. American Economic Review 84(June): 359–368.
Su, D., and B. M. Fleisher. 1999. An empirical investigation of underpricing in Chi-nese IPOs. Pacific-Basin Finance Journal 7 (May): 173–202.
Sun, Q., and W. H. S. Tong. 2000. The effect of market segmentation on stock prices:The China syndrome. Journal of Banking and Finance 24 (December): 1875–1902.
Wu, Jinglian. 2001. China’s financial sector: Perfecting the governance structure oflisted companies. Da Gong Bao, 20 February.
Wu, Youchang, and Xiao Zhao. 2000. Debt-to-equity swap: A theoretical and pol-icy analysis based on corporate governance. Jingji Yanjiu 2:26–33.
Xu, C. K. 2000. The microstructure of the Chinese stock market. China EconomicReview 11:79–97.
Xu, X., and Y. Wang. 1999. Ownership structure and corporate governance in Chi-nese stock companies. China Economic Review 10:75–98.
Comment Deunden Nikomborirak
The objective of this paper is to determine, with the use of empirical dataon listed companies, whether getting listed in the stock market improvesthe financial performance of enterprises. The conclusion reached is that fi-nancial performance actually deteriorates after the listing year for fourmain reasons:
1. Initial figures tend to be inflated.2. Despite privatization, state corporate control remains.3. Listed companies in the Chinese stock markets are not subject to
market discipline since equity shares in listed companies are divided upinto state shares, legal person shares, public shares, and internal employeeshares. Public shares can be traded only in the secondary market and stateshares are not traded freely.
4. The Asian crisis may have contributed to the overall inferior financialperformance of listed companies.
While these are valid reasons for explaining the lack of improvement inthe financial performance of listed companies, they are not supported bythe empirical tests undertaken. This is because the empirical study fails todisaggregate each of these effects. It simply confirms that there is a nega-tive change in the EPS and ROE after the listing. On this note, I would liketo make some suggestions with regard to how the effects may be disaggre-gated so that the authors’ conclusions may be better supported.
Initial Public Offering and Corporate Governance 205
Deunden Nikomborirak is research director for economic governance in the Sectoral Eco-nomics Program at the Thailand Development Research Institute.

First, to examine the extent of the inflation of the initial figures, one mayuse the difference in the financial figures (i.e., the ROE and EPS) of newlylisted companies and those of the incumbents in the market in a similar in-dustry. Second, to isolate the impact of sustained state control of formerSOEs, dummies may be introduced for listed companies that are formerSOEs. Third, to determine whether the listed company is subject to suffi-cient market discipline, the proportion of equity shares that are traded onthe stock exchange may be used as a proxy. Finally, the impact of the Asiancrisis may be isolated by using the average industry’s performance as abenchmark.
Comment Changqi Wu
This is an interesting and timely paper addressing an important issue inthe process of China’s economic development, namely, the role of stockmarkets. In China’s effort to establish a market economy in the last twodecades, hardly any other industry or institution has caught so much at-tention and debate as the development of stock markets. It has been morethan ten years since China reestablished its first stock exchange. China’stwo stock exchanges in Shanghai and Shenzhen are featured permanentlyin Asia’s financial market. But the problems abound. From the very begin-ning of the economic reform, the role of the stock market has been contro-versial. This is also a thorny and hotly debated issue within China.
In the industrialized economies, stock markets are an important com-ponent of the overall market institutions. As part of the financial system,stock markets facilitate resource allocation within the economy and helpcompanies to raise capital. In addition, the stock prices transmit and re-flect information on firms’ performance to the general public. Stock mar-kets also impose discipline on managers’ behavior.
In the case of China and other emerging markets, because of underde-velopment of the market institutions and lack of sophisticated and trans-parent financial systems, the stock markets may not be able to play thoseroles. The two authors address some of those problems in their paper.
The authors try to assess the impact of stock listing on the performanceof the listed companies in two stock exchanges in China. They find that theperformance of those companies depends critically on industrial charac-teristics. Those firms operating in less competitive industries perform bet-ter than others. The authors do not find any significant improvement inperformance before and after the stock listing. Instead, the listed firms’
206 Chen Chien-Hsun and Shih Hui-Tzu
Changqi Wu is professor of strategy and public policy at Guanghua School of Manage-ment, Peking University.

performance deteriorated across the board after their IPOs, despite the in-jection of new capital into those companies. The authors suggest that thedeterioration in performance may be attributable to manipulation of ac-counts and bad corporate governance. They argue that improving corpo-rate governance is essential to improving the performance of listed com-panies.
My comments on this paper are focused on three issues: measurement,data methodology, and results. I hope that my comments can be useful tothe authors.
Measurement
The authors have used three indicators to measure the performance ofcompanies immediately before and after the IPOs: growth of net profit,ROE, and quick ratio. These indicators are all calculated based on ac-counting information available. They are clearly useful and reflect the per-formance of those companies to a large extent, although attention is calledto a few specific factors that are unique in the operating environment inChina.
For instance, the authors use ROE as the performance of the listed com-panies. As is well known, ROE is influenced strongly by the debt-equity ra-tio. Moreover, ROE may not reflect the efficient use of total capital em-ployed by the company. As in the case of China, the SOEs benefit fromindirect government subsidies through subsidized loans from the state-owned banks. That may distort the measure of ROE. One should also notethat China experienced double-digit inflation in the first half of 1990s; us-ing the ROE as the performance measure in the high inflation environmentmay build in an upward bias.
The authors use the quick ratio and the current ratio as firms’ stabilitymeasures. Both ratios measure the possibility of default of the listed com-panies. A unique feature of listed companies in China’s stock markets isthat the majority of the listed companies are SOEs. Those SOEs often areunder the protection of the various levels of government. Although it istheoretically possible for an SOE to go under, practically speaking it is verydifficult for this to happen because the government agencies will try allmeans to keep the company afloat.
Data and Methodology
The authors examine the performance of listed companies using datafrom the China Securities Regulatory Commission, covering a five-yearperiod from 1995 to 1999. The advantage of skipping the early period ofIPO data is obvious. The nature of the emerging stock markets in Chinamay not warranty the availability and quality of the data. It is up to the au-thors to choose which time period to use in their study. There are otherdatabases available in the market. For instance, the electronic database
Initial Public Offering and Corporate Governance 207

developed by the Taiwan Economic Journal covers a longer period, 1991 to2000. That database also contains financial market information, such asstock prices and trading volumes.
The authors use the ANOVA method to detect the impact of IPO on per-formance with panel data. An alternative is to use the event-study methodthat can capture the impact of IPOs. For instance, if the performance datacover a six-year period, with the first three years covering the operationsprior to the time of the IPO and the second three years covering data afterthe IPO, that may make the results more significant.
The Results
In the introduction and conclusion, the authors interpret the better per-formance of listed companies in industries such as utilities and finance asthe result of their being “sunrise” industries. The reason is that those in-dustries are underdeveloped; therefore the early movers can enjoy a betterreturn. I would consider that the term “sunrise industry” is not a good ex-planation for those companies’ outperformance of the others. An alterna-tive explanation that is plausible is that, because those sectors are pro-tected by the government, those firms are enjoying the monopoly rent.
The authors construct figure 7.1 to map the clusters of companies in thecoordinates with the vertical axis denoting ROE, representing current per-formance, and the horizontal axis, growth rate of profit, representing thefuture growth potential. When the authors calculate the industry average,the means of all listed companies of both variables are used. This runs therisk of possible selection bias. A better benchmark is the average of allfirms in China, not only the listed companies, which are not representativeof all enterprises in China. Moreover, alternative combinations can bemade between current profitability and Tobin’s Q-ratio. The latter may re-flect the monopoly rent or future unrealized profit.
Tables 7.3 to 7.5 show how the industry proxy is calculated. We must bevery careful when summing measures of different natures together. Be-cause of incompatibility among these individual measures, it is hard tomake meaningful adjustments for the weight in each category. The equal-weight method looks arbitrary.
The authors report that the statistically significant indicators are EPSand ROE. That result is expected, because IPOs of an ongoing concern willintroduce a dilution effect on both EPS and ROE because more shares arebeing issued. The result essentially indicates that an IPO has no economi-cally significant impact on the performance of the privatized firms.
I now come back to the question in the title of the paper: What is corpo-rate governance? In its narrow sense, the question of corporate governanceshould include the following issues: What is the composition of the boardand the voting rules? Who are the board members? How are decisions
208 Chen Chien-Hsun and Shih Hui-Tzu

made? How can the small shareholder’s interests be protected? The authorsdo not address this problem directly.
The authors point out that corporate governance of those listed compa-nies does not change much despite the so-called partial privatization. It islargely because the core of corporate governance does not change. Thelarge shareholders are still government agencies and other SOEs. Onlywhen ownership and corporate governance are changed fundamentallycan one hope that China’s stock markets will function as they should.
To sum up, the authors have done some interesting work. They show thatstock market listings without fundamental change in the nature of the en-terprises may not induce improvement in efficiency and performance of en-terprises in China. Given that the majority of listed firms in China is stillstate owned and operated, this result does not seem surprising. Neverthe-less, the results call for an effort to reform those enterprises.
Initial Public Offering and Corporate Governance 209
