iġnik sikumi gas hydrate field trial completed · the well’s mechanical integrity. the well was...
TRANSCRIPT

1
ContentsIġnik Sikumi Gas Hydrate Field Trial Completed .............................1
Ocean Warming and Methane Hydrates in the Arctic Ocean ....4
Methane Dynamics Associated with Long-Term Climate Change on the Alaskan Beaufort Sea Inner Shelf ........................................7
Geohazards Associated with Naturally-occurring Gas Hydrate ...........................................11
Overview of the Inter-laboratory Comparison of Wave Velocity Measurements in Sand with Gas Hydrate and other Pore-filling Material .......................................... 16
Announcements ...................... 22
• Update on the Gulf of Mexico Joint Industry Project
• Gulf of Mexico Joint Industry Program Leg II Scientific Results Volume
• New Video on the 2012 Iġnik Sikumi Gas Hydrate Field Trial Now Online
• Call for Papersspotlight on Research .......... 24
Tina Treude
ContACtRay Boswell Technology Manager—Methane Hydrates, Strategic Center for Natural Gas & Oil
304-285-4541 [email protected]
Methane Hydrate NewsletterVol. 12, Issue 1
IġnIk SIkumI GaS Hydrate FIeld trIal CompletedBy the Iġnik Sikumi Gas Hydrate Exchange Trial Project Team
On May 5, 2012, ConocoPhillips, in a cooperative effort with the Japan Oil, Gas, and Metals National Corporation and the U.S. Department of Energy, completed the first field program designed to investigate the potential for CO2-CH4 exchange in naturally-occurring methane hydrate reservoirs. The field team, operating from a temporary ice pad constructed in the Prudhoe Bay Unit on the Alaska North Slope (see Schoderbek and Boswell, FITI, Vol. 11, Iss. 1), achieved incident- and injury-free operations. The program met its primary goal of conducting a controlled scientific experiment in a field setting to further our understanding of the response of gas hydrate reservoirs to gas injection. For further background and information on the Iġnik Sikumi project, please see the project webpage (www.netl.doe.gov/technologies/oil-gas/FutureSupply/MethaneHydrates/projects/DOEProjects/MH_06553HydrateProdTrial.html) as well as prior reports in this newsletter that detail the experimental background of the project (FITI, Vol. 8, Iss. 4); an overview of the exchange concept (FITI, Vol. 10, Iss. 3) and a review of the winter 2011 Iġnik Sikumi drilling, logging, and well completion program (FITI, Vol. 11, Iss. 1).
the 2012 Field Program
Operations for the winter 2012 gas injection and production phase of the Iġnik Sikumi field trial began in December, 2011, with the reconstruction
Figure 1: Iġnik Sikumi Field Trial Site, North Slope, Alaska

2
of the ice pad around the well head installed the prior winter (Figure 1). Throughout January and February, ConocoPhillips staged and positioned the equipment required to conduct the exchange trial, connected the pumps, tanks, and meters to the well head, and re-circulated fluids to confirm the well’s mechanical integrity. The well was then filled with a mixture of CO2 (23%) and N2 gas (77%) that displaced the well preservation fluids. An oriented perforating gun was lowered, and a 30-ft interval of casing was perforated at six-inch spacing with no damage to the downhole pressure-temperature gauges or the fiber-optic cables. A sand screen designed to control sand production was then set across the perforated interval.
Between February 15 and February 28, 210,000 standard cubic feet (scf) of blended CO2 and N2, along with small volumes of chemical tracers, were successfully injected into the formation. Mixed gas was used rather than pure CO2 to enhance opportunities for carbon dioxide to interact with native methane-hydrate by inhibiting formation of secondary CO2-hydrate -- both by displacing movable formation water and by changing the reservoir chemistry near the wellbore. The injection phase proceeded smoothly, and injectivity increased slowly and steadily during the test, without any indications of formation fracturing. Once the planned gas volumes were injected, the well was shut-in and reconfigured for flow back.
On March 4, the well was re-opened and produced a mixture of gases under its own energy, for one-and-a-half days, before it was shut-in for installation of a downhole jet pump. For the next seven days, the well was produced by pumping fluids from the wellbore, thereby lowering pressure at the level of the perforations to draw fluids from the formation, while remaining above the pressure that would destabilize any native CH4-hydrate. Iġnik Sikumi #1 produced water and gas at a wide range of rates during this phase, accompanied by intermittent recovery of very fine-grained sand. Operational issues were successfully mitigated and included a two-day shut-in for valve repair in the surface separator.
Jet pump-assisted production was re-started March 15, with the goal of drawdown below methane-hydrate stability pressure. During this phase of the field test, hydrate dissociation was successfully initiated and gas production rates peaked. After producing for two and a half days, the wellbore was shut-in to mitigate an ice plug that formed in the flare line. During this shut-in period, the downhole jet pump was also replaced with a model that permitted lower drawdown pressures. Production was re-initiated on March 23, and the well flowed continuously for the next 19 days, until final shut-in on April 11. During this final period, flowing reservoir pressures were smoothly lowered and production rates steadily increased. The recovered gas was progressively dominated by methane. Overall, the well produced for 30 days during the 38-day flow-back period, with
national energy technology Laboratory
1450 Queen Avenue SWAlbany, OR 97321541-967-5892
2175 University Avenue South Suite 201Fairbanks, AK 99709907-452-2559
3610 Collins Ferry RoadP.O. Box 880Morgantown, WV 26507-0880304-285-4764
626 Cochrans Mill RoadP.O. Box 10940Pittsburgh, PA 15236-0940412-386-4687
13131 Dairy Ashford, Suite 225 Sugar Land, TX 77478 281-494-2516
Visit the NETL website at:www.netl.doe.gov
Customer Service:1-800-553-7681
Fire in the Ice is published by the National Energy Technology Laboratory to promote the exchange of information among those involved in gas hydrates research and development.
Interested in contributing an article to Fire in the Ice?This newsletter now reaches more than 1400 scientists and other individuals interested in hydrates in sixteen countries. If you would like to submit an article about the progress of your methane hydrates research project, please contact Jennifer Presley at 281-494-2560 or
this newsletter is available online at http://www.netl.doe.gov/MethaneHydrates
Figure 2: After measurement and compositional analysis, gas is flared at the Iġnik Sikumi # 1 well site.
3
cumulative gas production approaching one million standard cubic feet. The well was plugged and abandoned in accordance with the regulations of the Alaska Oil and Gas Conservation Commission, including filling the wellbore to surface with cement, capping the well, cutting the well off below ground surface, then backfilling it to fit the pre-existing tundra landscape. The site will continue to be visually monitored as spring thaw removes all visible signs of the test site.
Challenges Met
The Iġnik Sikumi field trial overcame a number of challenges. First, careful program planning and management enabled a complex scientific field experiment to be conducted in the midst of normal operation activities in the Prudhoe Bay Unit with no interference with the simultaneous production operations. Second, the field team successfully managed the oriented perforating of the target zone with no damage to the well’s extensive downhole monitoring equipment, enabling full collection of data throughout the duration of the test. Third, careful engineering of the gas injection phase enabled the precise mixing and control of injectant components, as well as the management of injection pressure such that the targeted volume of 210,000 scf of gas was injected within the allotted time without fracturing the formation, an event that would have made real-time monitoring and post-test modeling more difficult. Fourth, the team addressed the potential for rapid loss of injectivity due to direct CO2-hydrate formation through the use of a N2-CO2 gas mixture. This mixture met the program goal of modifying the near-wellbore physical and chemical environment in such a way that injection could occur without adversely affecting the hydrate-bearing reservoir. Fifth, the well was successfully transitioned from injection to production, during which the downhole pressure was lowered in a controlled manner, enabling the measurement and management of produced gases, fluids, and solids, at pressures both above and below the dissociation pressure of native CH4-hydrate. Iġnik Sikumi #1 flowed for approximately 30 days, at rates as high as 175,000 scf/d. During the final phase of drawdown testing, gas rates steadily increased from 20,000 scf/day to 45,000 scf/day while significantly exceeding both the duration and the cumulative gas recovery of prior field testing programs. Finally, water and fine formation sand were liberated as by-products of dissociation, and the production of both were efficiently managed as the test progressed. To complete this test safely and efficiently under Arctic winter conditions, during which temperatures dropped below -50° F and wind chills exceeded -80° F, required a dedicated and well-coordinated Iġnik Sikumi project team.
next steps
The project team is currently checking and validating the field data, after which the final quantification of time-series downhole pressures and temperatures synchronized to gas and fluid flow rates and chemistries will be available. These data, in conjunction with the various associated pressure and temperature datasets from sensors installed in the well, will then be analyzed to interpret the nature of the various processes that occurred during the test. These data will also be made public via the NETL website, so that all research groups with an interest in studying the in-situ behavior of gas hydrate reservoirs may use the data. Please continue to check the website for further updates.
3
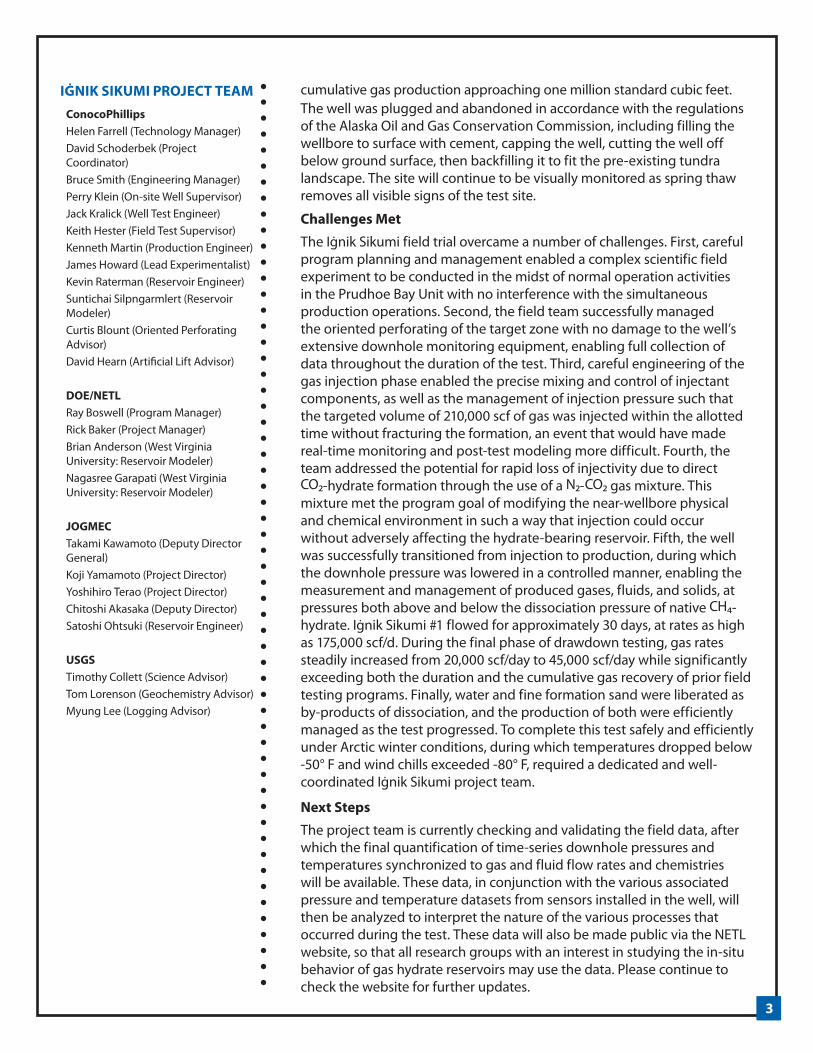
IġnIk sIkuMI PRojeCt teAMConocoPhillipsHelen Farrell (Technology Manager)David Schoderbek (Project Coordinator)Bruce Smith (Engineering Manager)Perry Klein (On-site Well Supervisor)Jack Kralick (Well Test Engineer)Keith Hester (Field Test Supervisor)Kenneth Martin (Production Engineer)James Howard (Lead Experimentalist)Kevin Raterman (Reservoir Engineer)Suntichai Silpngarmlert (Reservoir Modeler)Curtis Blount (Oriented Perforating Advisor)David Hearn (Artificial Lift Advisor)
Doe/netLRay Boswell (Program Manager)Rick Baker (Project Manager)Brian Anderson (West Virginia University: Reservoir Modeler)Nagasree Garapati (West Virginia University: Reservoir Modeler)
joGMeCTakami Kawamoto (Deputy Director General)Koji Yamamoto (Project Director)Yoshihiro Terao (Project Director)Chitoshi Akasaka (Deputy Director)Satoshi Ohtsuki (Reservoir Engineer)
usGsTimothy Collett (Science Advisor)Tom Lorenson (Geochemistry Advisor)Myung Lee (Logging Advisor)

4
oCean WarmInG and metHane HydrateS In tHe arCtIC oCeanBy Arne Biastoch, Tina Treude, and Lars H. Rüpke (Helmholtz Centre for Ocean Research Kiel [GEOMAR])
The global methane hydrate inventory forms a vulnerable constituent of the global climate system. Although currently bound in solid form in sediments below the seafloor there is a risk that changes in the oceanic conditions could cause the methane to outgas into the open ocean and potentially reach the atmosphere. Being a potent greenhouse gas, methane would then further amplify global warming.
Owing to high pressure and cold temperature conditions methane remains in stable hydrate form below 300 m water depth (Tishchenko et al., 2005); any changes in sea level and/or deep oceanic warming could cause a transition from the hydrate into the gas phase, therefore would allow outgassing into the overlying ocean. Since the current and near-future evolution of sea level rise remain in the range of few decimeters (Church et al., 2011), it is mainly the warming of the mid-depth and deep oceans that has the potential to significantly alter the stable conditions of methane hydrates.
Evidence for methane outgassing has been reported for the Arctic Ocean (Westbrook et al., 2009), a region that stands out with highest temperature changes in global warming (Solomon et al., 2007). The observations of methane bubbles caused media hype but did not necessarily promote a serious scientific discussion (Kerr, 2010). Nevertheless, it remains likely that any impacts from climate-driven gas hydrate instability would occur first in the sensitive environment of the Arctic Ocean.
In a multi-disciplinary approach (Biastoch et al., 2011), the future evolution of methane hydrates bound below the Arctic Ocean was estimated using a combination of numerical models, covering an ocean/sea-ice hindcast of the past decades (Figure 1a), a coupled ocean/atmosphere climate model of the next 100 years (Figure 1b), a geophysical model (Figure 1c), and a geochemical calculation (Figure 1d). Using an ensemble set of global warming scenarios the evolution of near-bottom oceanic temperatures was projected for the next 100 years (Figure 1b). The resulting warming appears spatially inhomogeneous, mainly determined by the inflow from the Atlantic Ocean due to the intrusion of warmer waters through the Fram Strait; this warming is strongest in shallow and mid-water depths.
The increased temperature would act to potentially shift methane hydrates around 500 m depth into the gas phase (Figure 2). However, since heat only slowly progresses from the ocean into the sediment, a corresponding simulation of the gas hydrate stability zone (GHSZ, Figure 1c) simulation shows that the reduction of the solid phase is limited within the next 100 years. Within that time span the amount of released methane (if allowed to reach the atmosphere through the water column) is small. On longer time scales, though, due to the inertia of the ocean and the delayed intrusion

5
Figure 1: Maps of the Arctic Ocean for (a) time‐mean (1985–2004) bottom water temperatures (in °C) in the ocean model, (b) temperature trend (in °C per 100 years) in the climate model simulation under CO2 increase, (c) resulting changes in thickness of the GHSZ (in m) caused by the temperature increase, and (d) changes in pH due to the release of 50% of the methane from hydrates within the first 100 years and distributed over the first 100 m above the bottom. (Adapted from Biastoch et al., 2011)
Figure 2: Phase diagram of methane hydrate as a function of pressure and temperature (constant salinity of S = 35 p.s.u.). Open symbols mark the bottom water temperatures along the European Nordic Sea (cycles) and Russian (squares) slopes in the present climate run, closed symbols the shift due to the greenhouse warming experiments with the coupled climate model. (Adapted from Biastoch et al., 2011)
of heat into the sediments, the process of methane release is irreversible and will continue, even long after the global warming has stopped. On millennial time scales, such persistent methane release has real potential to significantly alter the climate system.
Despite the limited amount of released methane within the next century, it is large enough to cause ocean acidification and oxygen depletion of the near-bottom ocean. An exact quantification remains difficult, e.g. due to the unknown amount of methane consumed by microbes in the sediment. The liberated amount of methane entering the water column is then utilized by microbial aerobic oxidation, converting methane with oxygen into CO2 impacting oceanic pH. Due to the assumed limited horizontal mixing with ambient water masses, the resulting acidification pattern (Figure 1d) is similar to the GHSZ reduction (Figure 1c) and remains regionally focused, with increased pH values up to 0.25. Since the source is located in the sediment, this acidification pattern is clearly separated from the atmospheric-related input of CO2 and acts on top of the acidification entering the ocean through the surface.
An important finding of the study is that warming and resulting methane release are strongly inhomogeneous and concentrated along the shelves. In particular, the circulation in the warming Atlantic Ocean and the exchange with the Arctic Ocean will play a major role in the fate of Arctic gas hydrates.
6
suGGesteD ReADInGBiastoch, A., T. Treude, L. Rüpke, U. Riebesell, C. Roth, E. Burwicz, W. Park, M. Latif, C. W. Böning, G. Madec, and K. Wallmann, 2011. "Rising Arctic Ocean temperatures cause gas hydrate destabilization and ocean acidification." Geophys. Res. Lett., 38, L08602, doi: 10.1029/2011GL047222.
Church, J. A., J. M. Gregory, N. J. White, S. M. Platten, and J. X. Mitrovica, 2011. "Understanding and projecting sea level change." Oceanography, 24(2), 130–143.
Kerr, R.A., 2010. "’Arctic Armageddon’ Needs More Science, Less Hype." Science, 329, 620.
Solomon, S., D. Qin, M. Manning, Z. Chen, M. Marquis, K. B. Averyt, M. Tignor, and H. L. Miller (Eds.), 2007. Climate Change 2007: The Physical Science Basis. Contribution of Working Group I to the Fourth Assessment Report of the Intergovernmental Panel on Climate Change, Cambridge University Press, Cambridge, United Kingdom and New York, NY, USA.
Tishchenko, P., C. Hensen, K. Wallmann, and C. S. Wong, 2005. "Calculation of the stability and solubility of methane hydrate in seawater." Chemical Geology, 219, 37–52.
Westbrook, G.K., K.E. Thatcher, E.J. Rohling, A.M. Piotrowski, H. Pälike, A.H. Osborne, E.G. Nisbet, T.A. Minshull, M. Lanoisellé, R.H. James, et al., 2009. "Escape of methane gas from the seabed along the West Spitsbergen continental margin." Geophys. Res. Lett., 36, L15608.

7
metHane dynamICS aSSoCIated WItH lonG-term ClImate CHanGe on tHe alaSkan BeauFort Sea Inner SHelFBy C. Ruppel1 , L. Brothers1, P. Hart1, C. Maue2 , J. Pohlman1, J. Kessler3, K.J. Sparrow3, and C. Worley1
1U.S. Geological Survey, Woods Hole, Massachusetts, USA2Stanford University, Stanford, California, USA3Texas A&M University, College Station, Texas, USA
It is estimated that less than 1% of the global gas hydrate inventory occurs within or beneath permafrost. The top of the gas hydrate stability zone in areas of thick permafrost typically lies at greater than 200 m depth, and studies have shown that these permafrost-associated gas hydrates are stable for millennia under various realistic climate warming scenarios. The subset of permafrost-associated gas hydrates that occurs on shallow, unglaciated, circum-Arctic Ocean shelves lies at the same depths, but prevailing conditions render these gas hydrates far more susceptible to warming-driven dissociation. In these areas, sea level rise since Late Pleistocene time has led to inundation and sustained warming of thick permafrost that was formerly at the ocean’s edge. The result has been thawing and landward retreat of the subsea permafrost, increased microbial methane production in newly thawed sediments, dissociation of the gas hydrate within and beneath the former permafrost zone, and dramatic thinning of the remaining permafrost on the most recently inundated areas on the inner shelf. The most advanced studies of these issues have been conducted on the East Siberian Arctic Shelf (ESAS)
The Alaskan Beaufort Sea shelf is an analogous setting to ESAS, but has a different morphology and inundation history. With support from DOE, the USGS Gas Hydrates Project has adopted a two-pronged approach to studying the interaction of climate change, relict permafrost, and gas hydrates in this area. One component focuses on compiling a regional map of subsea permafrost based on the analysis of 1970s-era seismic data supplemented by legacy borehole logs. DOE-NETL’s Methane Hydrates R&D Program currently supports L. Brothers as a NRC/DOE postdoctoral fellow to work at the USGS Woods Hole Science Center on this activity. The new map provides clues about the probable distribution of intact and possibly dissociating gas hydrates offshore. The second component of the research focuses on verifying the subsea permafrost map and acquiring new geophysical and geochemical data during research cruises in August 2010 and 2011. When combined with the long tradition of research on Alaskan North Slope gas hydrates and permafrost, these new activities form a foundation for possible scientific drilling across the Beaufort shelf and upper continental slope in the future.
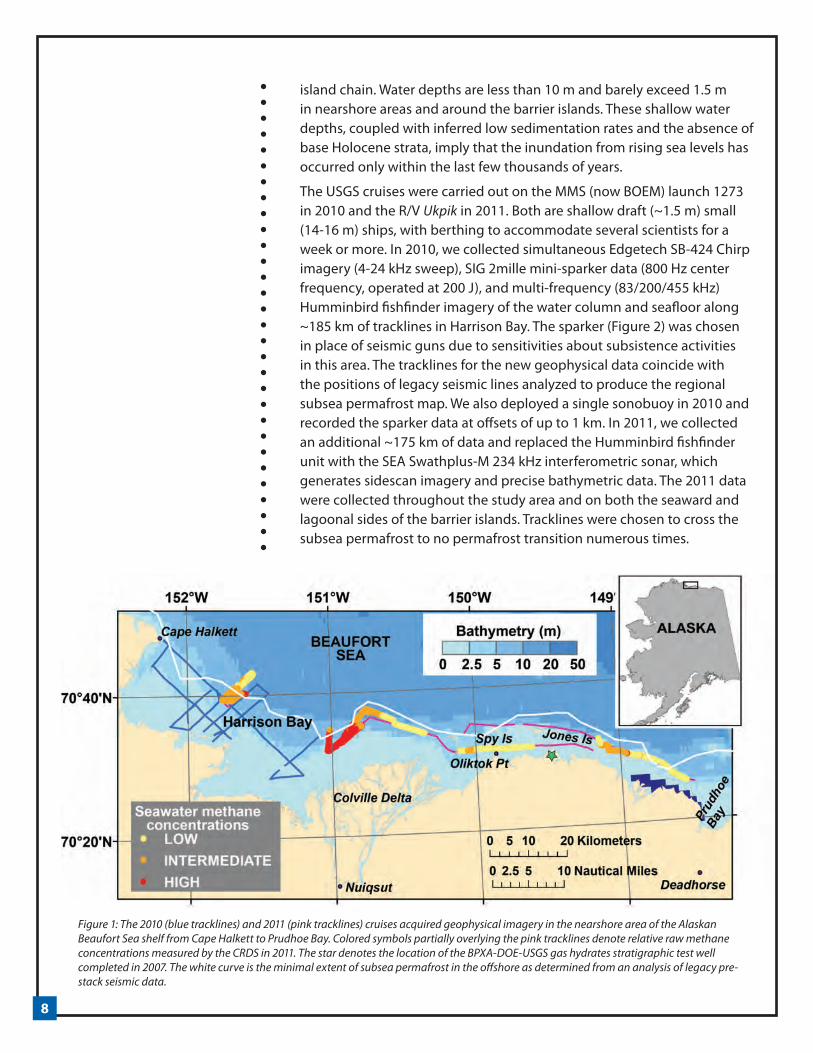
The 2010 and 2011 cruises focused on the central Alaskan Beaufort shelf between Cape Halkett and Prudhoe Bay (Figure 1), including Harrison Bay, the submerged part of the Colville River Delta, and the barrier
8
island chain. Water depths are less than 10 m and barely exceed 1.5 m in nearshore areas and around the barrier islands. These shallow water depths, coupled with inferred low sedimentation rates and the absence of base Holocene strata, imply that the inundation from rising sea levels has occurred only within the last few thousands of years.
The USGS cruises were carried out on the MMS (now BOEM) launch 1273 in 2010 and the R/V Ukpik in 2011. Both are shallow draft (~1.5 m) small (14-16 m) ships, with berthing to accommodate several scientists for a week or more. In 2010, we collected simultaneous Edgetech SB-424 Chirp imagery (4-24 kHz sweep), SIG 2mille mini-sparker data (800 Hz center frequency, operated at 200 J), and multi-frequency (83/200/455 kHz) Humminbird fishfinder imagery of the water column and seafloor along ~185 km of tracklines in Harrison Bay. The sparker (Figure 2) was chosen in place of seismic guns due to sensitivities about subsistence activities in this area. The tracklines for the new geophysical data coincide with the positions of legacy seismic lines analyzed to produce the regional subsea permafrost map. We also deployed a single sonobuoy in 2010 and recorded the sparker data at offsets of up to 1 km. In 2011, we collected an additional ~175 km of data and replaced the Humminbird fishfinder unit with the SEA Swathplus-M 234 kHz interferometric sonar, which generates sidescan imagery and precise bathymetric data. The 2011 data were collected throughout the study area and on both the seaward and lagoonal sides of the barrier islands. Tracklines were chosen to cross the subsea permafrost to no permafrost transition numerous times.
Figure 1: The 2010 (blue tracklines) and 2011 (pink tracklines) cruises acquired geophysical imagery in the nearshore area of the Alaskan Beaufort Sea shelf from Cape Halkett to Prudhoe Bay. Colored symbols partially overlying the pink tracklines denote relative raw methane concentrations measured by the CRDS in 2011. The star denotes the location of the BPXA-DOE-USGS gas hydrates stratigraphic test well completed in 2007. The white curve is the minimal extent of subsea permafrost in the offshore as determined from an analysis of legacy pre-stack seismic data.
9
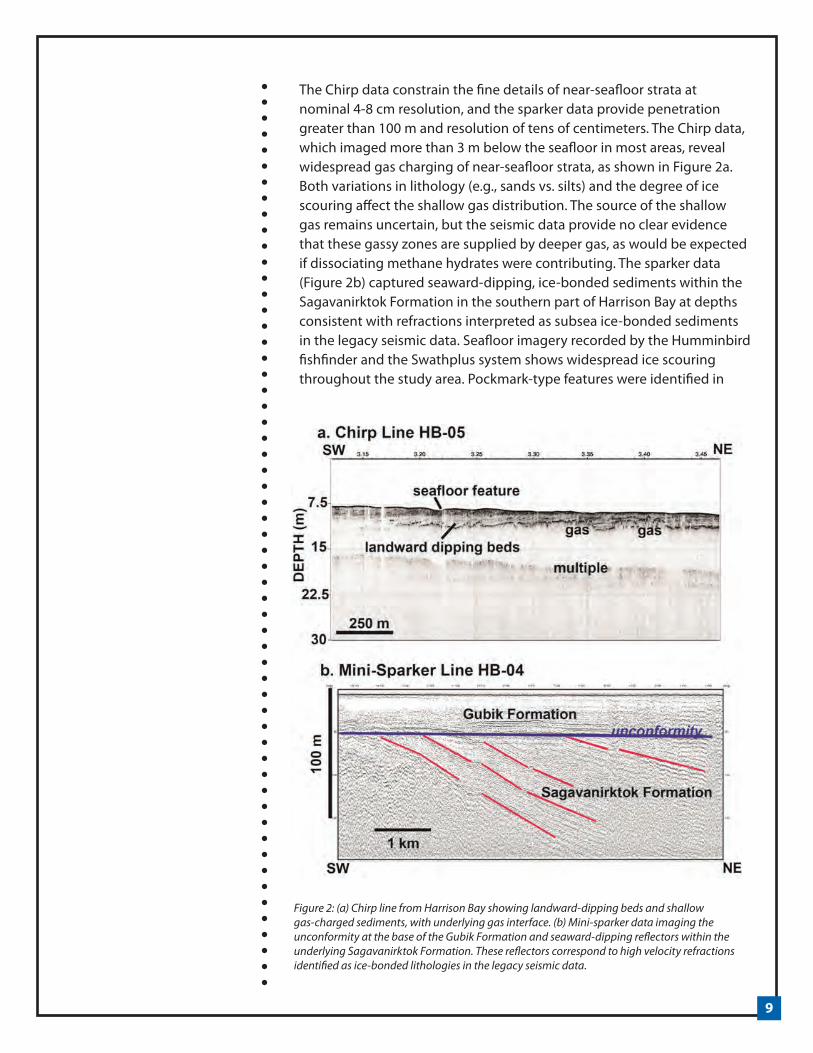
The Chirp data constrain the fine details of near-seafloor strata at nominal 4-8 cm resolution, and the sparker data provide penetration greater than 100 m and resolution of tens of centimeters. The Chirp data, which imaged more than 3 m below the seafloor in most areas, reveal widespread gas charging of near-seafloor strata, as shown in Figure 2a. Both variations in lithology (e.g., sands vs. silts) and the degree of ice scouring affect the shallow gas distribution. The source of the shallow gas remains uncertain, but the seismic data provide no clear evidence that these gassy zones are supplied by deeper gas, as would be expected if dissociating methane hydrates were contributing. The sparker data (Figure 2b) captured seaward-dipping, ice-bonded sediments within the Sagavanirktok Formation in the southern part of Harrison Bay at depths consistent with refractions interpreted as subsea ice-bonded sediments in the legacy seismic data. Seafloor imagery recorded by the Humminbird fishfinder and the Swathplus system shows widespread ice scouring throughout the study area. Pockmark-type features were identified in
Figure 2: (a) Chirp line from Harrison Bay showing landward-dipping beds and shallow gas-charged sediments, with underlying gas interface. (b) Mini-sparker data imaging the unconformity at the base of the Gubik Formation and seaward-dipping reflectors within the underlying Sagavanirktok Formation. These reflectors correspond to high velocity refractions identified as ice-bonded lithologies in the legacy seismic data.

10
southern Harrison Bay and seaward of the Colville River Delta, but there was no evidence for active venting of gas during the time of our surveys.
For the 2011 cruise, the USGS collaborated with J. Kessler from Texas A&M University (TAMU), who was funded by the National Science Foundation, to measure real-time seawater methane concentrations along tracklines where geophysical data had been collected. These measurements relied on cavity ringdown spectroscopy (CRDS), not methane sniffers or gas chromatography on recovered water samples. Both the USGS and TAMU brought Picarro CRDS units with customized seawater equilibrator systems built according to a design by S.Yvon-Lewis. Seawater CH4 and CO2 concentrations, along with occasional atmospheric data, were recorded every few seconds along 75 km of tracklines that crossed the transition from subsea permafrost to no permafrost several times. Figure 1 shows the qualitative variation in the raw methane concentrations recorded by the USGS CRDS.
Several new approaches will be required to determine whether the dissociation of gas hydrate associated with thawing subsea permafrost contributes methane to the water column and/or atmosphere in the Alaskan Beaufort area. First, the contributions of various methane sources to seawater and atmospheric methane must be unraveled using isotopic and other techniques, and the sediment and water column methane sinks should be quantified. Second, complementary geophysical methods might be used to provide better constraints on the distribution of contemporary subsea permafrost.
Acknowledgements
DOE-USGS interagency agreements DE-FE0002911 and DE-AI26-05NT42496 provided partial support for the cruises. L. Brothers is sponsored by a NRC/DOE-NETL postdoctoral fellowship, and C. Maue was sponsored by the WHOI Summer Student Fellow program. Support for Texas A&M University was provided by NSF OCE-1139203 to S. Yvon-Lewis and J. Kessler. The North Slope Borough, the Native Village of Nuiqsut, the Alaska Eskimo Whaling Commission, NOAA’s Office of Protected Resources, and the U.S. Fish and Wildlife Service assisted with permitting. C. Coon and B. Kopplin managed ship operations. E. Bergeron, E. Moore, T. O’Brien, and P.J. Bernard provided technical and logistical support, and M. Wooller provided laboratory space in Fairbanks. Mention of trade names does not imply U.S. government endorsement of commercial products.
suGGesteD ReADInGBrothers, L.L., Hart, P.E., et al., 2011. “Subsea permafrost mapped across the U.S. Beaufort Sea using multichannel seismic data,” AGU Fall Meeting, GC51L-06.
Isaksen, I.S.A., Gauss, M., et al., 2011. “Strong atmospheric chemistry feedback to climate impact from permafrost methane emissions,” Global Biogeochemical Cycles, 25, GB2002. doi:10.1029/2010GB003845
Pohlman, J., Kessler, J.K., et al., 2012. “Methane fluxes to the atmosphere over thawing permafrost in the shallow Beaufort Sea, Alaska,” Ocean Sciences Meeting, February.
Rachold V, Bolshiyanov D, et al., 2007. “Near-shore arctic subsea permafrost in transition,” Eos Transactions of the American Geophysical Union, 88, 149–56
Ruppel, C.D., 2011. “Methane Hydrates and Contemporary Climate Change,” Nature Education Knowledge 2(12):12. http://www.nature.com/scitable/knowledge/library/methane-hydrates-and-contemporary-climate-change-24314790
Shakhova, N., Semiletov, I., et al., 2010. “Extensive methane venting to the atmosphere from sediments of the East Siberian Arctic Shelf,” Science 327, 1246-1250. doi:10.1126/science.1182221.

11
GeoHazardS aSSoCIated WItH naturally-oCCurrInG GaS HydrateBy Ray Boswell (US DOE), Tim Collett (USGS), Scott Dallimore (Natural Resources –Canada), Matthew Frye (US BOEM)
The impetus to study naturally-occurring gas hydrates has historically been related to understanding three primary issues: 1) energy resource potential; 2) implications for a range of global environmental processes, such as long-term carbon cycling and climate change; and 3) association with various “geohazards”. While much of the published literature on gas hydrate in nature has focused on the first two issues, we would like to provide a brief summary of the third. We define the term “geohazard” to encompass any natural condition that has the potential to add significant costs and/or risks to human activities and have grouped geohazards into two categories; “naturally-occurring” geohazards that emerge wholly from geologic processes and “industrial” geohazards that represent latent natural hazards that may be directly triggered by human activities (Figure 1).
naturally-occurring Geohazards
Submarine landslides and slope instability: The presence of gas hydrate increases the mechanical strength of the sediment within which it resides. Dissociation of that gas hydrate releases free gas and excess pore water and can substantially reduce the geomechanical stability of the affected sediments. Natural phenomena such as pressure decline due to sea-level drop or temperature rise due to changes in climate or oceanic conditions, can create intervals of potential sediment weakness that could contribute to both large scale shelf-slope failure (see Grozic, 2010) or more localized zones of instability. The association of large-scale mass wasting events to the dissociation of gas hydrates has been a topic of interest over the past decade with a number of extensive field investigations being conducted, including the Storegga (offshore Norway: Kvalstad et al., 2005) and Cape Fear (U.S. Atlantic Coast: Hornbach et al., 2007) slides. To date, these studies have not confirmed a significant role for gas-hydrate dissociation. While the case for major past episodes of globally-synchronized, gas hydrate-related, seafloor failures remain poorly supported with available data, gas hydrate likely does play a role in certain local seafloor failures (for example, see Lopez et al., 2011). One environment of particular interest are shallow-water shelves in the Arctic where gas hydrate is dissociating by thermal warming associated with post-glacial marine transgression.
Large-scale gas venting: Gas venting occurs in many marine settings with much of that venting occurring in a manner that would generally not equate to a geohazard. However, areas of concentrated pockmarks and associated gas “pipes” and “chimneys” are widely documented (see Cathles et al., 2010), and the largest of these features may represent locales of catastrophic, large-scale gas and sediment expulsion that may, under certain circumstances, represent potential geohazards.

12
suGGesteD ReADInGBoswell, R., Collett, T., 2011. “Current perspectives on gas hydrate resources.” En. & Env. Science.
Cathles, L., Su, Z., Chen, D., 2010. “The physics of gas chimney and pockmark formation, with implications for assessment of seafloor hazards and gas sequestration.” J. Mar Pet Geol. 27, 82-91.
Collett, T., Dallimore, S., 2002. “Detailed analysis of gas hydrate induced drilling and production hazards; Proceedings.” 4th ICGH: 47-52.
Gharib, J., McConnell, D., Digby, A., Henderson, J., Danque, H., Orange, D., 2008. “Improved assessment of chemosynthetic community presence in areas of potential deepwater oil and gas development by modification of routine sampling methods.” OTC-19461, p. 10.
Grozic, J., 2010. “Interplay between gas hydrates and submarine slope failure.” Adv in Natural and Technological Hazards Research, v 28, p. 11-30.
Hadley, C., Peters, D., Vaughn, A., Bean, D., 2008. “Gumusut-Kakap project: geohazard characterization and impact on field development plans.” Proc. IPTC, IPTC #12554.
Holbrook, W., Lizarralde, D., Pecher, I., Gorman, A., Hackwith, K., Hornbach, M., Saffer, D., 2002. “Escape of methane gas through sediment waves in a large methane hydrate province.” Geology, 30, 467-470.
Hornbach, M., Lavier, L., Ruppel, C., 2007. “Triggering mechanism and tsunamogenic potential of the Cape Fear Slide complex, U.S. Atlantic margin.” Geochem Geophys Geosyst 8.
Kvalstad, T., Andresen, L., Forsberg, C., Berg, K., 2005. “The Storegga slide: evaluation of triggering sources and slide mechanics.” J. Mar Pet Geol. 22 245-256.
These events are possibly triggered by free gas accumulations that exceed some critical overpressure at a horizon of reduced sediment permeability, possibly at the base of the gas hydrate stability zone. Catastrophic gas venting has been invoked to explain certain features along the crest of the Blake Ridge, although subsequent detailed examination indicated these as manifestations of sediment erosion and sand-wave deposition (Holbrook et al., 2002). Perhaps the most compelling evidence reported in the recent literature are the “pingo-like features” observed on the shallow Beaufort Shelf, arctic Canada, that have been interpreted to reflect gas and sediment expulsion associated with ongoing destabilization of permafrost-associated gas hydrate related to post ice-age shelf inundation (see Paull et al., 2007). Many chimney-type structures are found to have a central core of gas hydrate (Ryu et al., 2010) suggesting that gas hydrate formation may have a role in mediating the flow of gas through such features, although the processes are not well understood.
“Industrial” Geohazards
“Industrial” gas hydrate-related geohazards relate primarily to oil and gas production activities and can be categorized as 1) shallow foundational issues related to the installation of infrastructure in areas of surficial gas hydrates; 2) shallow drilling and well-installation hazards that are encountered by wells targeting deeper horizons (“drilling through”), 3) long-term hazards associated with producing warm hydrocarbons from deeper zones through shallow gas hydrate-bearing intervals (“producing through”), and 4) geomechanical failure of reservoirs during production of gas hydrate-bearing intervals (“producing from”). These hazards exist in both deepwater and permafrost associated settings.
Hazards to sea-floor infrastructure: Oil and gas production and transportation infrastructure that is installed on the seafloor, such as pipelines, can transmit various stresses, particularly heat, to the shallow substrate. Should such facilities be placed upon surficial hydrates (such as solid sea-floor mounds associated with vents), hydrate dissociation could occur, leading to changes in sediment properties or mass movements that could potentially damage those facilities. Such hazards are effectively mitigated within industry by pre-development shallow hazards surveys (for example, see Gharib et al., 2008) that detect significant seafloor gas hydrate occurrences and enable them to be avoided.
Drilling through gas hydrate: Gas hydrates, like free gas and overpressured water-bearing sands, are recognized drilling geohazards both in the deepwater and in terrestrial areas with thick permafrost occurrences. In deepwater, despite the drilling of thousands of wells worldwide in areas where gas hydrate could occur (Smith et al., 2005) there have been only a small number of reported and minor drilling incidents (ex., Nimblett et al., 2005). Work conducted within the Gulf of Mexico gas hydrate Joint Industry Project (the JIP) has confirmed that

13
careful drilling fluid temperature control is sufficient to mitigate the risk of gas hydrate dissociation while drilling through low-saturation, shale-hosted gas hydrates accumulations (see Birchwood et al., FITI v.8). Similarly, sea-floor gas hydrate mounds and thick gas-hydrate bearing subsurface sands can be effectively detected and avoided with existing shallow-hazard assessment methods. Perhaps the least well-constrained gas hydrate-related drilling hazard may be those instances where thick, highly-saturated, gas hydrate-bearing sands at the base of the hydrate stability zone hinder the detection of underlying free gas hazards (McConnell et al., 2012). In arctic settings, gas hydrate typically occurs at high concentrations in sand reservoirs both within and below permafrost. Arctic gas hydrate has been associated with a small number of well control incidents, most notably the 1992 Cirque #1 well in Alaska, where efforts to control a gas flow from deeper sources prior to placement of shallow well casing likely promoted dissociation of shallower gas hydrate-bearing zones (Collett and Dallimore, 2002). Subsequently, drilling protocols have emerged that enable safe drilling to occur. Drilling on shallow-water Arctic shelves, where permafrost and gas hydrate are actively degrading in response to recent shelf inundation by rising sea-level, will likely require managing similar drilling hazards. In both arctic and deepwater settings, once a gas-hydrate-bearing section is penetrated, well casing must be set and cemented, which can impart additional thermal stresses, a hazard that can be mitigated using low-heat-of-hydration cements (Collett and Dallimore, 2002).
Producing through gas hydrate: Successful deepwater or arctic exploration wells must enable the long-term production of warm fluids through the shallow sections of well-bores that may be enclosed by gas-hydrate-bearing sediments. This production will impart thermal stresses that can lead to gas hydrate dissociation and sediment physical property changes including strength reduction. Under some circumstances, this can result in strains that lead to potential casing damage (Moridis and Kowalsky, 2007) or development of conduits for gas migration outside casing. For a recent industry development offshore Malaysia, numerical modeling calibrated with pressure-core and log-derived data indicated that heat transfer from producing well bores would generate a dissociation front within low-saturation, clay-hosted gas hydrate deposits that could advance from 60 to 90 m from the center of a six-well cluster during a typical 30-year production period (Hadley et al., 2008). Measures such as well-bore insulation were determined to mitigate, but not eliminate the hazard. Silpngarmlert (FITI Vol. 10, Iss. 3) has reported on the thermal impacts of oil production on overlying high-saturation, sand-hosted gas hydrates on the Alaska North Slope. Additional research is clearly needed on this topic.
Producing from gas hydrate: Given the lack of field tests of hydrate production, very little is conclusively known about the geomechanical responses of gas-hydrate-bearing reservoirs and associated seals to
suGGesteD ReADInGLopez, C., Spence, G., Hyndman, R., Kelley, D., 2010. “Frontal ridge slope failure at the northern Cascadia margin: Margin-normal fault and gas hydrate control.” Geology 398 (11) 968-970.
McConnell, D., Zhang, Z., Boswell, R., 2012. “Progress in evaluating gas hydrate drilling hazards.” J. Mar. Pet. Geology 34 (1),
Moridis, G., Kowalsky, M., 2007. “Response of oceanic hydrate-bearing sediments to thermal stresses.” SPE Journal, 12 (2), 253-268.
Moridis, G., Collett, T., Pooladi-Darvish, M., Hancock, S., Santamarina, J., Boswell, R., Kneafsey, T., Rutqvist, J., Kowalsky, M., Reagan, M., Sloan, D., Sum, A., Koh, C., 2011. “Challenges, uncertainties, and issues facing gas production from gas hydrate deposits.” SPE Res. Eng. Eval. 14 (1) 76-112.
Nimblett, J., Shipp, C., Strijbos, F., 2005. “Gas hydrate as a drilling hazard: examples from global deepwater settings.” OTC-17476.
Paull, C., Ussler, W., Dallimore, S., Blasco, S., Lorenson, T., Melling, H., Medioli, B., Nixon, F., McLaughlin, F., 2007. “Origin of pingo-like features on the Beaufort Sea shelf and their possible relationship to decomposing methane gas hydrates.” Geoph. Res. Lett 43
Ryu, B-J., Riedel, M., Kim, J-H., Hyndman, R., Lee, Y-J., Chung, B-H., Kim, I-S., 2010. “Gas hydrates in the western deep-water Ulleung Basin, East Sea of Korea.” J. Mar. Pet. Geol. 26 1483-1498.
Smith, M., Kou, W., Ahmed, A., Kouzela, R., 2005. “The significance of gas hydrate as a geohazard in Gulf of Mexico exploration and production.” OTC-17655.

14
Figure 1: Overview of general locale and nature of gas-hydrate related “naturally-occurring” and “industrial” geohazards
Naturally-occurring Gas Hydrate GeohazardsDuring period of climate warming and sea-level rise
Low-saturation GH in Clays
High-saturation GH in Sands
Permafrost
Gas Hydrate Stability Zone
Low-saturation Free Gas in Clays
Gas Hydrate Mound
High-saturation Free Gas in Sand
Vents, Chimneys
Potential instabilityOverpressure driven-gas release
subsidence
Potential Thermal Stresses
Potential gas release, sediment instability,
slumps, slides
Potential greenhouse gas release
Gas Hydrate “Industrial” Geohazards
Drilling Through GH
Drilling Through GH
Producing Through GH
Producing Through GH
ProducingFrom GH
ProducingFrom GH
Drilling Through GH
Mitigate via proven avoidance methods
Free-gas fully masked by hydrate Poorly-constrained hazard
Mitigate via known drilling
protocols
Sediment mobilization? Poorly-constrained hazard
Likely subsidence and instabilityPoorly-constrained Hazard
Mitigate via proven avoidance methods
Mitigated via known
drilling protocols
Potential Subsidence and InstabilityPoorly-constrained Hazard
Warm Fluids Warm Fluids
Mitigate via proven avoidance methods
Sediment mobilization
Poorly-constrained hazards
Mitigate via knowncompletion approaches
Poorly-constrained hazard
Overpressure-drivengas release
Thermal stress due to sea inundation
Thermal stress due to climate-driven
bottom-water warming (progressively longer time delay
of impact with depth)
Impacts to Ocean Ecology Geochemistry
ARCTIC REGION

15
hydrate dissociation and gas production. Unique production hazards for marine gas hydrates are likely to be due to the relatively shallow occurrence of producing horizons. These reservoirs will typically be highly unconsolidated in their native state (i.e. without gas hydrate) and overlain by relatively soft, unconsolidated mud-dominated sediments. Therefore, the geohazards associated with potential gas hydrate production include wellbore collapse from sediment mobilization, seafloor instability and surface subsidence, and gas migration.
Work is ongoing to better understand these issues, including preparations for baseline and monitoring studies before, during, and after planned production tests (Nagakubo et al., 2010, FITI, v.10, Iss. 3), as well as experimental efforts and coupling of the leading gas hydrate production simulators with geomechanical codes. The relatively lower formation pressures of gas hydrate reservoirs render catastrophic well control issues unlikely in gas hydrate development as compared to typical deepwater development. Modeling studies focused on permafrost-associated settings have indicated hazards of the same nature as discussed for deepwater gas hydrate settings, although the potential for significant land subsidence is significantly reduced due to the mechanical strength of the permafrost-bearing overburden (see Moridis et al., 2011). Consideration of these geohazards are expected to contribute to the focus of initial gas hydrate exploration and production to the most geomechanically-stable settings, which include the more technically-viable, deeply buried, sand-rich, accumulations (Boswell and Collett, 2011).

16
overvIeW oF tHe Inter-laBoratory ComparISon oF Wave veloCIty meaSurementS In Sand WItH GaS Hydrate and otHer pore-FIllInG materIalBy W.F. Waite1, J.C. Santamarina2, M. Rydzy3, S.H. Chong2, J.L.H. Grozic4, K. Hester5, J. Howard5, T.J. Kneafsey6, J.Y. Lee7, S. Nakagawa6, J. Priest8, E. Rees6, C. Koh3, E.D. Sloan3, and A. Sultaniya8
1 U.S. Geological Survey, Woods Hole, Massachusetts, USA2 Georgia Institute of Technology, Atlanta, Georgia, USA3 Colorado School of Mines, Golden, Colorado, USA4 University of Calgary, Calgary, Alberta, Canada5 ConocoPhillips, Bartlesville, Oklahoma, USA 6 Lawrence Berkeley National Laboratory, Berkeley, California, USA7 Korea Institute of Geoscience and Mineral Resources, Deajeon, South Korea8 University of Southampton, Southampton, England
The physical properties of gas-hydrate-bearing sediment depend on the pore-scale and specimen-scale distribution of gas hydrate. These distributions are controlled by the manner in which gas hydrate is grown in sediment, meaning published measurement values can be significantly influenced by how a test specimen is formed. Direct comparisons between published results are further complicated by differences in the equipment, experimental procedures, and analytic approaches used in each laboratory.
To help distinguish between major sources of specimen-, measurement-, and analysis-induced uncertainties, eight independent research groups
0
10
20
30
40
50
60
70
80
90
100
10 100 1000
Perc
ent P
assi
ng (%
)
Grain Size (mm)
U.S. Silica
#1, test 2
#1, test 3
#3
#5
#8, test 1
#8, test 2
#8, test 3
-1.5
-1
-0.5
0
0.5
1
1.5
0 20 40 60 80 100 120
Sign
al A
mpl
itude
(V)
Time (microseconds)-0.6
-0.4
-0.2
0
0.2
0.4
0.6
0.8
20 30 40 50 60 70 80 90 100
Sign
al A
mpl
itude
(V)
Time (microseconds)
Osc
illat
ion
Am
plitu
de (V
)
Frequencyfc
A B
C D
Resonance at frequency, fc: Used by Laboratory #1, 2
First Break: Picked by Laboratory #4-6, 8
First Break: Picked by Laboratory #3,4,6,8
First Trough: Picked by Laboratory #7
P-Wave S-Wave
First Peak: Picked by Laboratory #5,7
Precursor P-wave, used by Laboratory #8 to obtain VP
Peak width at .707 of the peak height: Used byLaboratory #2
Resonance Peak
Figure 1: A) Measured grain size distribution of the F110 Ottawa sand used in this study. Solid symbols represent sieve-based measurements, the connected open green circles represent measurements using a laser diffraction system. The offset between the laser and sieve results, caused by the oblong nature of the sand grains (inset) is an example of how different techniques yield different results on identical specimens [F110 SEM image courtesy A. Palomino]. B) Typical frequency response of a resonating system. System resonates at frequency, fc, used by Laboratories #1 and 2 to calculate moduli and wave velocities. The signal peak’s width at 0.707•height can also be used to determine the attenuation. C) P-wave, and D) S-wave signals showing the waveform features chosen by the given laboratory groups to calculate wave velocities. For additional details, see Waite et al., 2011 [Waveforms courtesy M. Rydzy].
17
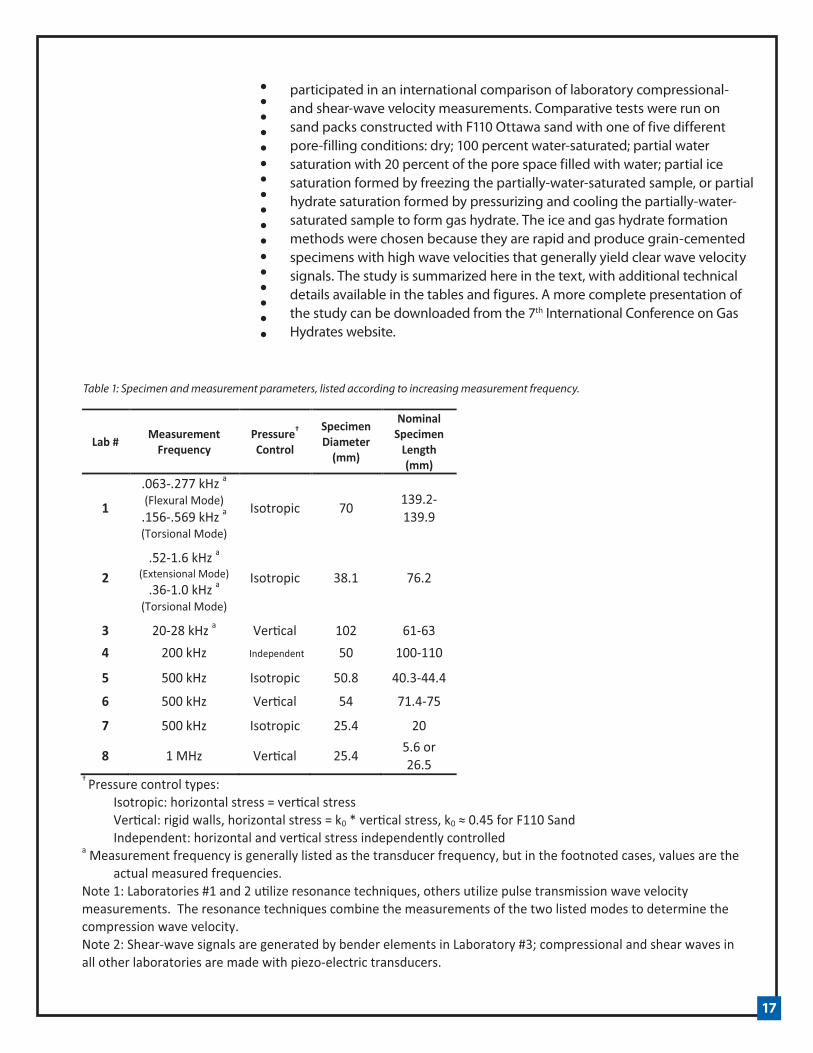
participated in an international comparison of laboratory compressional- and shear-wave velocity measurements. Comparative tests were run on sand packs constructed with F110 Ottawa sand with one of five different pore-filling conditions: dry; 100 percent water-saturated; partial water saturation with 20 percent of the pore space filled with water; partial ice saturation formed by freezing the partially-water-saturated sample, or partial hydrate saturation formed by pressurizing and cooling the partially-water-saturated sample to form gas hydrate. The ice and gas hydrate formation methods were chosen because they are rapid and produce grain-cemented specimens with high wave velocities that generally yield clear wave velocity signals. The study is summarized here in the text, with additional technical details available in the tables and figures. A more complete presentation of the study can be downloaded from the 7th International Conference on Gas Hydrates website.
Table 1: Specimen and measurement parameters, listed according to increasing measurement frequency.

18
In addition to the standardized set of five specimen types summarized above, a standardized set of measurements and effective stresses were used, and all tests were run using F110 Ottawa sand distributed to each laboratory from a single batch (Figure 1A). Though test materials and conditions were consistent across the groups, the measurement systems, experimental techniques and analytical approaches were not (Table 1). These differences led to observable differences in the measured results. As suggested in Figures 1B, C, and D, there were two fundamentally different wave velocity measurement techniques: (1) Resonance, and (2) Pulse Transmission. In resonance measurements, a specimen is oscillated over a range of frequencies. The frequency at which the specimen responds with the greatest movement is the resonance frequency. From this frequency and the resonance curve shape (Figure 1B), the stiffness and wave velocity can be calculated for a test specimen of known geometry and density. In the pulse transmission technique, a short vibration is generated at one end of a specimen of known length, and recorded when it arrives at the opposite end of the sample. Velocities are calculated from the waveform arrival time (Figures 1C and D) and specimen length.
The wave velocity results are plotted in Figure 2, and the primary uncertainty sources are summarized in Table 2. Though this study was motivated by physical property measurement variability for gas hydrate-bearing sediment, the results are applicable to wave velocity measurements in porous media regardless of the pore constituents. For example, three key factors contributing to scatter in wave velocity measurements are void ratio, heterogeneity and measurement frequency, all of which must be considered even in the absence of gas hydrate. Summarizing their effects illustrates the impact of sample preparation and measurement apparatus on wave velocity measurements.
A specimen prepared such that sediment grains are densely packed will have a low void ratio, meaning the specimen has relatively little free space and a relatively high wave velocity. Depending on the method of preparation, the void ratio may not be constant throughout the specimen, leading to zones of differing wave velocity. The impact of this heterogeneity can be compounded depending on the pore-filling material. For example, partial water saturation introduces additional heterogeneity in the form of patches of 100% water-saturated porosity that can form on ~200-500 μm length scales.
Heterogeneities are particularly important in high-frequency wave velocity measurements. Higher-frequency measurements are affected by smaller-scale variations in a specimen, and megahertz-frequency measurements can detect these ~200-500 μm length scale patches as stiff, high velocity zones that increase the apparent wave velocity of the specimen as a whole. At high frequencies, the waveform oscillations (Figures 1C and D) generate pressure in the water within each patch that does not have time to dissipate, meaning each patch resists
suGGesteD ReADInGBlott, S.J. and K. Pye, 2006. “Particle size distribution analysis of sand-sized particles by laser diffraction: an experimental investigation of instrument sensitivity and the effects of particle shape.” Sedimentology, 53(3): p. 671-685.
Lee, J.S. and J.C. Santamarina, 2005. “Bender elements: Performance and signal interpretation.” Journal of Geotechnical and Geoenvironmental Engineering, 131(9): p. 1063-1070.
Li, X., L. Zhong, and L.J. Pyrak-Nolte, 2001. “Physics of partially saturated porous media: residual saturation and seismic-wave propagation.” Annual Review of Earth and Planetary Sciences, 29: p. 419-460.
White, J. E., 1975. “Computed seismic speeds and attenuation in rocks with partial gas saturation.” Geophysics, 40, p. 224-232.
Waite, W. F., J.C. Santamarina, M. Rydzy, S.H. Chong, J.L.H. Grozic, K. Hester, J. Howard, T.J. Kneafsey, J.Y. Lee, S. Nakagawa, J. Priest, E. Rees, C. Koh, E.D. Sloan, A. Sultaniya, 2011. “Inter-laboratory comparison of wave velocity measurements in a sand under hydrate-bearing and other set conditions,” in Proceedings of the 7th International Conference on Gas Hydrates. Edinburgh, Scotland, United Kingdom, Paper 195, http://www.pet.hw.ac.uk/icgh7/papers/icgh2011Final00195.pdf
Zimmer, M.A., M. Prasad, G. Mavko, and A. Nur, 2007. “Seismic velocities of unconsolidated sands: Part 2 - Influence of sorting- and compaction-induced porosity variation.” Geophysics, 72(1): p. E15-E25.

19
100
200
300
400
500
600
700
800 900
1000
2000
3000
100
200
300
400
500
600
700
800 900
1000
2000
3000
0.01 0.1 1 10 Vertical Effective Stress (MPa)
0.01 0.1 1 10 Mean Effective Stress (MPa)
Compressional Wave Velocity
(m/s)
ShearWave Velocity
(m/s)
L1 (0.54) L2 (0.58) L4 (0.35) L5 (0.64) L5 (0.69) L5 (0.69) L5 (0.64) L6 (0.56) L6 (0.67) L7 (0.72) L7 (0.61) L7 (0.67) L7 (0.64) L7 (0.61) L8 (0.57) L8 (0.59) L8 (0.61) L1 (0.55) L4 (0.54) L6 (0.56) L6 (0.67) L8 (0.65) L1 (0.61) L2 (0.55) L2 (0.55) L4 (0.59) L5 (0.79) L5 (0.72) L5 (0.69) L5 (0.79) L5 (0.69) L6 (0.56) L6 (0.67) L7 (0.61) L7 (0.82) L7 (0.64) L8 (0.55) L1 (0.61) L4 (0.59) L6 (0.56) L6 (0.67) L7 (0.82) L7 (0.64) L8 (0.56) L1 (0.61) L2 (0.56) L2 (0.56) L4 (0.59) L5 (0.69) L5 (0.67) L6 (0.56) L6 (0.67) L7 (0.64) L8 (0.53)
L1 (0.54) L2 (0.58) L3 (0.71) L3 (0.55) L5 (0.64) L5 (0.69) L5 (0.69) L5 (0.64) L7 (0.64) L7 (0.61) L8 (0.57) L8 (0.59) L8 (0.61) L1 (0.55) L3 (0.71) L3 (0.55) L4 (0.54) L8 (0.65) L1 (0.61) L2 (0.55) L2 (0.55) L3 (0.66) L3 (0.55) L4 (0.59) L5 (0.79) L5 (0.72) L5 (0.69) L5 (0.79) L5 (0.69) L7 (0.61) L7 (0.82) L7 (0.64) L8 (0.55) L1 (0.61) L4 (0.59) L7 (0.82) L7 (0.64) L8 (0.56) L1 (0.61) L2 (0.56) L2 (0.56) L5 (0.69) L5 (0.67) L7 (0.64) L8 (0.53)
Lab # and void ratio (e)
Dry
Dam
pFr
ozen
Wat
er
Sat.
Hyd
rate
-B
earin
g
A B
Figure 2: Compressional and shear wave velocity summary for F110 Ottawa sand. Specimen types are color coded according to pore fill. Symbols are numerically coded L1 to L8 according to the laboratory designations in Table 1, and paired with the void ratio for each specimen. To view the wave velocities in relation to the primary stress upon which the velocity depends, P-wave velocities are plotted as a function of vertical effective stress, whereas the S-wave velocities are plotted as a function of mean effective stress, the average of the vertical and horizontal stress. The same scales are used in each plot to facilitate comparisons between P- and S-wave velocities.
20
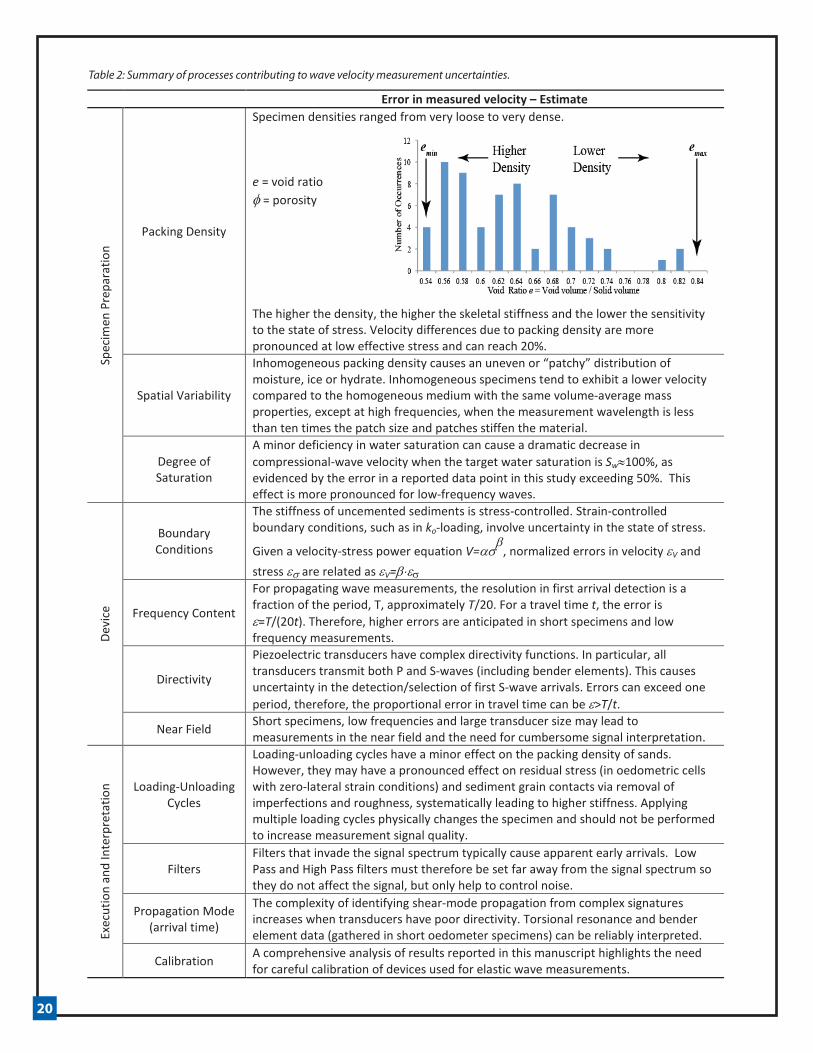
Table 2: Summary of processes contributing to wave velocity measurement uncertainties.
Error in measured velocity – Estimate Sp
ecim
en P
repa
ratio
n
Packing Density
Specimen densities ranged from very loose to very dense.
e = void ratio φ = porosity
The higher the density, the higher the skeletal stiffness and the lower the sensitivity to the state of stress. Velocity differences due to packing density are more pronounced at low effective stress and can reach 20%.
Spatial Variability
Inhomogeneous packing density causes an uneven or “patchy” distribution of moisture, ice or hydrate. Inhomogeneous specimens tend to exhibit a lower velocity compared to the homogeneous medium with the same volume-average mass properties, except at high frequencies, when the measurement wavelength is less than ten times the patch size and patches stiffen the material.
Degree of Saturation
A minor deficiency in water saturation can cause a dramatic decrease in compressional-wave velocity when the target water saturation is Sw≈100%, as evidenced by the error in a reported data point in this study exceeding 50%. This effect is more pronounced for low-frequency waves.
Devi
ce
Boundary Conditions
The stiffness of uncemented sediments is stress-controlled. Strain-controlled boundary conditions, such as in ko-loading, involve uncertainty in the state of stress.
Given a velocity-stress power equation V=ασβ
, normalized errors in velocity εV and stress εσ are related as εV=β⋅εσ
Frequency Content
For propagating wave measurements, the resolution in first arrival detection is a fraction of the period, T, approximately T/20. For a travel time t, the error is ε=T/(20t). Therefore, higher errors are anticipated in short specimens and low frequency measurements.
Directivity
Piezoelectric transducers have complex directivity functions. In particular, all transducers transmit both P and S-waves (including bender elements). This causes uncertainty in the detection/selection of first S-wave arrivals. Errors can exceed one period, therefore, the proportional error in travel time can be ε>T/t.
Near Field Short specimens, low frequencies and large transducer size may lead to measurements in the near field and the need for cumbersome signal interpretation.
Exec
utio
n an
d In
terp
reta
tion Loading-Unloading
Cycles
Loading-unloading cycles have a minor effect on the packing density of sands. However, they may have a pronounced effect on residual stress (in oedometric cells with zero-lateral strain conditions) and sediment grain contacts via removal of imperfections and roughness, systematically leading to higher stiffness. Applying multiple loading cycles physically changes the specimen and should not be performed to increase measurement signal quality.
Filters Filters that invade the signal spectrum typically cause apparent early arrivals. Low Pass and High Pass filters must therefore be set far away from the signal spectrum so they do not affect the signal, but only help to control noise.
Propagation Mode (arrival time)
The complexity of identifying shear-mode propagation from complex signatures increases when transducers have poor directivity. Torsional resonance and bender element data (gathered in short oedometer specimens) can be reliably interpreted.
Calibration A comprehensive analysis of results reported in this manuscript highlights the need for careful calibration of devices used for elastic wave measurements.
Table 2: Summary of processes contributing to wave velocity measurement uncertainties.

21
compression, appears stiff, and consequently has a high wave velocity. This “patchy saturation” effect decreases for measurements made at lower frequencies that allow pressure in a patch to dissipate. The shift from partially water-saturated to partially ice- or gas-hydrate-bearing specimens further increases the impact of heterogeneity because the stiffness and wave-velocity contrast between water-filled patches and the surrounding gas-filled patches significantly increases when water converts to ice or gas hydrate.
As summarized in Table 2, void ratio, heterogeneity and measurement frequency are only three of many sources of uncertainty, but the impact of the uncertainties listed in Table 2 can be minimized. Specimen-to-specimen differences can be accounted for or evaluated if published results clearly indicate critical parameters such as the grain size, void ratio, state of stress and pore contents. Where gas hydrate-bearing specimens are concerned, the method by which gas hydrate was formed must also be carefully described in order to capture both the pore-scale and specimen-scale distribution of gas hydrate, both of which impact the overall wave velocity measurement. Measurement and analysis uncertainties can be accounted for with extensive calibration and a recognition that measurements at different frequencies differ in their sensitivities to specimen geometry and heterogeneity.
This study does not specifically address the impact of gas hydrate formation mechanism on the measured wave velocity, but gas hydrate formed from methane in the dissolved phase will have a lower overall wave velocity than the grain cementing gas hydrates formed for this study in water limited specimens. Additionally, it is anticipated that gas hydrates may be distributed in a less uniform, patchier distribution when formed from methane in the dissolved phase. Such specimens are therefore likely to exhibit more wave velocity variability than the cemented specimens utilized in this study.
Acknowledgments
U.S. Geological Survey contributions were supported by the Gas Hydrate Project of the U.S. Geological Survey's Coastal and Marine Geology Program as well as through Interagency Agreement DE-FE0002911 between the USGS Gas Hydrates Project and the U.S. Department of Energy's Methane Hydrates R&D Program. Georgia Tech contributions were supported by the U.S. Dept. of Energy and the Goizueta Foundation. KIGAM contributions were supported by the KIGAM, GHDO, and MKE. S. Nakagawa, T. Kneafsey, and E. Rees were supported by the Assistant Secretary for Fossil Energy, Office of Oil and Natural Gas, through the National Energy Technology Laboratory of the U.S. Department of Energy under Contract No. DE-AC02-05CH11231. Many of the Colorado School of Mines measurements were made by M. Pohl and M. Schindler. Any use of trade names is for descriptive purposes only and does not imply endorsement by the U.S. Government.

Announcements
22
update on tHe GulF oF mexICo JoInt InduStry proJeCt In 2001, the Gulf of Mexico Hydrate Joint Industry Project (JIP) partnered with the U.S. Department of Energy (DOE) to investigate the implications of gas hydrates in the deepwater Gulf of Mexico. The JIP includes Chevron, ConocoPhillips, Japan Oil Gas and Metals National Corporation, Statoil, Total, Schlumberger, Halliburton, Korea National Oil Company, Reliance Industries Limited, and the U.S. Bureau of Ocean Energy Management. Chevron manages the JIP and has a Cooperative Agreement with the DOE.
Highlights of this eleven year effort include two drilling programs (the 2005 “Leg I” program: see FITI, Volume 5, Issue 3 & Volume 8, Issue 1; and the 2009 “Leg II” program; see FITI, Volume 9, Issue 2 & Volume 9, Issue 3) that have greatly advanced fundamental gas hydrate science and played a pivotal role in advancing the understanding of gas hydrate drilling hazards and the petroleum systems approach to gas hydrate exploration. As the project moves toward its conclusion, the JIP and DOE have determined that they will focus full attention on the development and testing of an integrated suite of pressure coring and pressure core analysis devices with research and development experts in the U.S. Geological Survey, Georgia Institute of Technology, Aumann and Associates, Inc., Geotek and other academic institutions and contractors. No other drilling programs will be conducted.
GulF oF mexICo JoInt InduStry proGram leG II SCIentIFIC reSultS volume
Scientific Results of the Gulf of Mexico JIP's 2009 "Leg II" Logging-While-Drilling (LWD) program are slated to be compiled in the June 2012, Issue 34 of the Journal of Marine and Petroleum Geology. The volume, co-edited by Timothy S. Collett (USGS) and Ray Boswell (DOE-NETL), will contain 14 full-length papers that detail the geophysical/geological program that guided the selection of the drill sites, describe the field operations, and report on the scientific interpretations derived from the acquired LWD data. Contributors to the papers include scientists from the National Energy Technology Laboratory, the U.S. Geological Survey, the Bureau of Ocean Energy Management, Columbia University, Schlumberger, and AOA Geophysics.

23
Announcements
neW vIdeo on tHe 2012 IġnIk SIkumI GaS Hydrate FIeld trIal In a new online video, watch Rick Baker (DOE-NETL) and David Schoderbek (ConocoPhilips) as they present an in-depth overview of the Iġnik Sikumi, Fire in the Ice, methane hydrates research field trial. This nine-minute long video is available for viewing from the project web page at http://www.netl.doe.gov/technologies/oil-gas/FutureSupply/MethaneHydrates/rd-program/ANSWell/co2_ch4exchange.html.
Call For paperS - deadlIneS approaCHInGAGu Fall Meeting 2012
Submission deadline for abstracts for the AGU Fall Meeting 2012 is August 8, 2012. Additional information regarding abstract submissions and the meeting can be found online at http://fallmeeting.agu.org/2012/.
2013 offshore technology Conference
Submission deadline for paper proposals for the 2013 Offshore Technology Conference is September 10, 2012. Additional information regarding proposal submissions and the meeting can be found online at www.otc.net.org/2013.
ICGH 7 proCeedInGS noW onlIneProceedings of the 7th International Conference on Gas Hydrates (ICGH) held in Edinburgh, Scotland, United Kingdom, are now available online. The Conference featured over 550 papers and presentations from authors from around the world. Over 600 delegates came together to exchange information and to share their professional knowledge in the field of gas hydrates. To access the Proceedings, please visit http://www.pet.hw.ac.uk/icgh7/.

24
spotlight on Research
Answering the age-old question of “What do I want to be when I grow up?” was never difficult for Tina Treude. An early fascination with animals and oceans has guided her throughout her life. “I knew I wanted to be a scientist since I was 7 years old. I was intrigued by zoology and my parents encouraged this passion by letting me keep any pet that I wanted. They also provided access to plenty of animal books,” she recalls. “When I was 13, my family’s neighbor taught me how to SCUBA dive. He also had a seawater aquarium with all sorts of animals including a brittle star which I was allowed to feed. It was at this time that I decided to become a marine biologist.”
Several years later, Tina graduated from Christian-Albrechts University in Kiel, Germany with a diploma in Biology and received her PhD in Biology from the Max Planck Institute for Marine Microbiology at Bremen University in 2004. Tina returned to Kiel, where she is now the leader of the Marine Geobiology team at Helmholtz Centre for Ocean Research (GEOMAR). She spends her days “investigating all sorts of microbial activity and biogeochemical processes in marine sediments.” A current investigation topic finds her determining the effectiveness of “marine methanotrophic microbes in reducing methane fluxes to the atmosphere if gas hydrates melt due to global warming, especially in sensitive Arctic regions.”
Tina’s first contact with hydrates came during an expedition on the German research vessel Sonne at Hydrate Ridge off the Oregon coast in 1999. “I participated as a student assistant to help with biogeochemical analyses in the lab,” she shares. “I was fascinated by the ‘burning ice’ that was brought on deck and thought that I should get involved in the study of it.”
It was also on the Sonne expedition that she experienced firsthand the joy gas hydrate can bring to a cramped back deck. “When I was a PhD student working on Hydrate Ridge, we sampled hydrates with a giant TV-grab. I was standing on deck smoking a cigarette and watching the grab come onto the deck. It was filled with big chunks of hydrates,” she says. “Someone asked me to extinguish the cigarette, because the atmosphere could ignite from the methane being released by the melting hydrates. I quickly did so, but just a few seconds after, I saw a colleague throw hydrates into a bucket, ignite them with a lighter, and then take pictures of the flaming scenario. I guess, when it comes to gas hydrates, scientists can sometimes become children again.”
Tina encourages aspiring hydrates researchers to “go out into the field and see hydrates. Only then can they really grasp the concept of it.” Being in the field is also one of the most rewarding aspects of research for Tina. “I deeply enjoy being on the ocean and working with heavy instruments.” The most frustrating aspect of research would be that “we lose most of the hydrates and methane from our samples when we bring them on board, because of the decompression,” she says. “This makes it very hard to interpret data and that is why more and more studies are made in situ, if technically feasible.”
tInA tReuDeProfessor, Helmholtz Centre for Ocean Research (GEOMAR)
As for downtime, Tina says that she doesn’t have a hobby, because she “turned it into a job, which is the nice part about doing science, right? You get paid for your hobby.” So, when she is not working on her hobby, she loves movies, and “spending time with friends and family over long dinners with tasty wine.”