inhibition of catechol-o …library.iyte.edu.tr/tezler/master/kimyamuh/t000081.pdfcomt enzyme...
TRANSCRIPT

INHIBITION OF CATECHOL-O-METHYLTRANSFERASE (COMT) ENZYME
ACTIVITY BY SOME PLANT-DERIVED ALKALOIDS AND PHENOLS
A Thesis Submitted to the Graduate School of Engineering and Sciences of
Izmir Institute of Technology in Partial Fulfillment of the Requirements for the Degree of
MASTER OF SCIENCE
in Chemical Engineering
by Dilek YALÇIN
December 2009 IZMIR

We approve the thesis of Dilek YALÇIN Assoc. Prof. Dr. Oğuz BAYRAKTAR Supervisor Assist. Prof. Dr. Ayşegül BATIGÜN Committee Member Assist. Prof. Dr. Ali ÇAĞIR Committee Member 17 December 2009 Prof. Dr. Devrim BALKÖSE Assoc. Prof. Dr. Talat YALÇIN Head of the Department of Dean of the Graduate School of Chemical Engineering Engineering and Sciences

ACKNOWLEDGEMENTS
This study was carried out at the Department of Chemical Engineering, Izmir
Institute of Technology during the years 2007-2009.
I would like to express my sincere gratitude to my advisor, Assoc. Prof. Dr.
Oğuz Bayraktar for his supervision, guidance, support, encouragement and endless
optimism during my studies.
I wish to give my special thanks to the research assistant Evren Altıok for his
valuable help and suggestions in my analysis and experiments. And special thanks to
research assistants Ali Emrah Çetin, Dilek Demirbüker Kavak, Zelal Polat, Gözde
Genç, Diren Kaçar, Dane Rusçuklu and Güler Narin for their helps and for their
knowledge they shared with me.
I would like also thank to whole staff of Department of Chemical Engineering
for their technical assistance for the material support.
I thank to my dear friends Selvi Şimşek, Tuğçe Aksu and all others for their
unfailing encouragement, neverending support and friendship during my study and my
life.
My very special thanks go to my family for their endless support, tolerance and
understanding.
My warmest thanks go to my best friend and life-mate, Dağıstan Derya Tuncalı
for his endless support, unbelievable patience, helps, encouragement and neverending
love during my whole life.
The financial support of Turkish Scientific Research Council in this study is
gratefully acknowledged.

iv
ABSTRACT
INHIBITION OF CATECHOL-O-METHYLTRANSFERASE (COMT) ENZYME ACTIVITY BY SOME PLANT-DERIVED
ALKALOIDS AND PHENOLS
In this study, inhibition potentials of harmal seed alkaloids and olive leaf
polyphenols were investigated on COMT catalyzed methylation reaction. Inhibition
performances of natural alkaloids and polyphenolics whose purities were attempted to
be increased by extraction and fractionation were compared with standards of these
compounds and the best known COMT inhibitor, 3,5-dinitrocatechol.
COMT enzyme inhibition experiments were performed with sentitive
fluorometric method. In this method, Km values for SAM and aesculetin substrates were
found as 3.5 ± 0.3 µM and 6.4 ± 0.4 µM, respectively. As a result of the inhibition
study, the highest inhibitory effect is observed for harmine and harmaline rich fractions
among harmal seed alkaloids. Inhibition constants indicating degree of competitiveness
and noncompetitiveness (Ki and αKi) of the harmine fraction which has the highest
inhibition performance were calculated as 0.15±0.07 µg/ml and 1.28±0.06 µg/ml,
respectively.
In the studies performed with standards of olive leaf polyphenols, while it was
observed that rutin has inhibitory effect, oleuropein was found less effective. However,
oleuropein rich fraction of olive leaf extract showed higher inhibitory effect than crude
extract and rutin. It was also observed that polyphenolic extracts obtained from vitex,
terebinth and mastic leaves showed high inhibition capacities, it was thought that
fractionation should be performed for these plants.
As a more general conclusion, it was revealed that harmal seed alkaloids and
olive leaf fractions with high purity are promising natural COMT inhibitors. By
performing this study, the kinetic inhibition constants of extracts, their fractions and
standards could be determined and they could be reported into literature.

v
ÖZET
KATEŞOL-O-METİLTRANSFERAZ (KOMT) ENZİM AKTİVİTESİNİN BİTKİLERDEN ELDE EDİLEN BAZI ALKALOİTLER
VE FENOLLERLE ENGELLENMESİ
Bu çalışmada, üzerlik tohumu alkaloitleri ve zeytin yaprağı polifenollerinin
KOMT tarafından katalizlenen metillenme reaksiyonunu engelleyebilme potansiyelleri
araştırılmıştır. Ekstraksiyon ve fraksiyonlama işlemleri ile saflıkları arttırılmaya
çalışılmış alkaloitlerinin ve polifenollerinin KOMT enzim inhibisyonu performansları,
bu bileşiklerin standartları ve bilinen en iyi KOMT inhibitörü olan 3,5-dinitrokateşol ile
kıyaslanmıştır.
KOMT enzim inhibisyon deneyleri, hassasiyeti yüksek ve ekonomik olan
florometrik metot ile gerçekleştirilmiştir. Bu metotta metil verici ve metil alıcı substrat
olarak kullanılan SAM ve Eskuletin için inhibitörsüz ortamdaki Km değerleri sırasıyla
3,5 ± 0,3 µM ve 6,4 ± 0,4 µM olarak hesaplanmıştır. Toplam 18 adet standart, özüt ve
fraksiyonun kullanıldığı inhibisyon çalışması sonucunda, üzerlik tohumu alkaloitleri
arasından harmin ve harmalin alkaloitleri için en yüksek inhibisyon etkisi görülmüştür.
İnhibisyon performansı en yüksek olan üzerlik tohumunun harmin fraksiyonunun
kompetitiflik ve nonkompetitiflik derecelerine ait inhibisyon sabitleri (Ki ve αKi)
sırasıyla 0,15±0,07 µg/ml ve 1,28±0,06 µg/ml olarak hesaplanmıştır.
Zeytin yaprağı polifenollerinin standartları ile yapılan çalışmada rutinin KOMT
enzimini inhibe etme özelliği görülürken oleuropeinin daha az etkili olduğu
görülmüştür. Zeytin yaprağı özütünün oleuropeince zengin fraksiyonu ise oleuropein
standardı, ham özüt ve rutine göre daha yüksek inhibisyon etkisi göstermiştir. Ayrıca,
laden, menengiç ve sakız özütleri yüksek inhibisyon kapasitesine sahip olduklarından
dolayı fraksiyonlama yapılması gereken bitki türleri olarak belirlenmiştir.
Sonuç olarak, üzerlik tohumu alkaloitleri ve saflığı arttırılmış zeytin yaprağı
fraksiyonları umut vaad eden doğal KOMT inhibitörleri oldukları tespit edilmiş ve
inhibisyon kinetiği sabitleri literatüre kazandırılmıştır. Ayrıca, bu alkaloit ve polifenolik
bazlı doğal bileşiklerin bilinen antioksidan ve antimikrobiyal özelliklerinin de olması
nedeniyle çok fonksiyonlu bileşikler olarak bir çok sektörde kullanılabilecekleri
anlaşılmıştır.

vi
TABLE OF CONTENTS
LIST OF FIGURES..........................................................................................................ix
LIST OF TABLES.........................................................................................................xiii
LIST OF ABBREVIATIONS........................................................................................xiv
CHAPTER 1. INTRODUCTION..................................................................................... 1
CHAPTER 2. LITERATURE REVIEW...........................................................................4
2.1. Neurodegenerative Diseases…………………………………………. 4
2.1.1. Parkinson Disease………………………………………………5
2.1.2. Treatment Methods for Parkinson Disease…………………….. 6
2.1.2.1. Pharmacotherapy (Drug Treatment)………………………7
2.1.2.2. Surgical Operations……………………………………….9
2.1.3. Important Criteria in Drug Development for the
Treatment of Parkinson Disease………………………..…........10
2.1.3.1. Blood-Brain Barrier……………………………………...10
2.1.3.2. Brain-Spinal Cord (Cerebrospinal) Fluid Barrier……......11
2.1.4. COMT Enzyme and Its Role in Parkinson Disease……………12
2.2. COMT Inhibitors…………………………………………………….17
2.2.1. Synthetic Inhibitors…………………………………………….17
2.2.1.1. First Generation COMT Inhibitors………………………17
2.2.1.2. Second Generation COMT Inhibitors……………………18
2.2.1.3. Last Generation - Nontypical COMT inhibitors…………20
2.2.2. Natural Inhibitors........................................................................21
2.2.2.1. Harmal (Peganum harmala) Seed.....................................26
2.2.2.2. Olive (Olea europaea) Leaf……………………………..28
2.3. Enzyme Activation and Inhibition Determination Methods…………30
2.3.1. Spectrophotometric Method…………………………………...31
2.3.2. Fluorometric Method…………………………………………..31
2.3.3. Radiochemical Method………………………………………...32

vii
2.3.4. COMT Enzyme Activity/Inhibition Assays…………………...33
2.4. Enzyme Inhibition Mechanisms……………………………………..37
2.4.1. Competitive Inhibitors…………………………………………37
2.4.2. Noncompetitive Inhibitors……………………………………..40
2.4.3. Uncompetitive Inhibitors………………………………………42
2.4.4. Mixed Type Inhibitors (Noncompetitive and Competitive)…...44
2.4.5. Inhibitor Substrates…………………………………………….45
CHAPTER 3. OBJECTIVES..........................................................................................47
CHAPTER 4. EXPERIMENTAL STUDY.....................................................................48
4.1. Materials……………………………………………………………..48
4.2. Methods……………………………………………………………...49
4.2.1. Extraction of the Inhibitors…………………………………….49
4.2.1.1. Extraction of Harmal (P. harmala) Seeds…………….....49
4.2.1.2. Extraction of Olive (O. europaea) Leaves………………52
4.2.2. Fractionation of the Extracts…………………………………...53
4.2.2.1. Fractionation of the Harmal (P. harmala) Seed Extract…53
4.2.2.2. Fractionation of the Olive (O. europaea) Leaf Extract….54
4.2.3. Characterization of the Inhibitors……………………………...55
4.2.3.1. Characterization of the Harmal (P. harmala) Seed
Extract ……………………………………………………55
4.2.3.2. Characterization of the Olive (O. europaea) Leaf
Extract ……………………………………………………56
4.2.4. Determination of Protein Amount……………………………..58
4.2.5. Determination of Enzyme Activity of COMT and
Inhibition Kinetics…………………………………………..….58
4.2.5.1. COMT Activity Determination by
Spectrophotometric Method……………………………...59
4.2.5.2. COMT Activity and Inhibition Kinetics
Determination by Fluorometric Method………….............60
4.2.6. Analysis of Enzyme Activity and Inhibition Kinetics Data…...61

viii
CHAPTER 5. RESULTS AND DISCUSSION..............................................................62
5.1. Obtaining and Characterization of Extracts………………………….62
5.1.1. Extraction of Harmal (P. harmala) Seed and its
Characterization ………………………………………………..62
5.1.2. Extraction of Olive (O. europaea) Leaf and its
Characterization ………………………………………………..67
5.2. Fractionation and Characterization of Extracts……………………...68
5.2.1. Fractionation and Characterization of Harmal Seed Extract…..68
5.2.2. Fractionation and Characterization of Olive Leaf Extract……..71
5.3. Determination of Protein Amount…………………………………...76
5.4. Determination of COMT Activity and Inhibition Kinetics………….78
5.4.1. Activity Determination by Spectrophotometric Method………78
5.4.2. Determination Activity and Inhibition Kinetics by
Fluorometric Method…………………….……………………..80
5.4.2.1. Activity Determination by Fluorometric Method……......80
5.4.2.2. Inhibition Study by Fluorometric Method……………….85
CHAPTER 6. CONCLUSION......................................................................................104
REFERENCES..............................................................................................................108
APPENDICES
APPENDIX A. CALIBRATION CURVES OF ALKALOIDS
AND SAMPLE CALCULATION ....................................................118
APPENDIX B. CALIBRATION CURVES OF OLEUROPEIN AND RUTIN
AND SAMPLE CALCULATION ....................................................121
APPENDIX C. CALIBRATION CURVE OF SCOPOLETIN
AND SAMPLE CALCULATION ....................................................123

ix
LIST OF FIGURES
Figure Page
Figure 2.1. Factors resulting in neuron death and general impression mechanisms…….4
Figure 2.2. Important parts of brain……………………………………………………...5
Figure 2.3. Algorithm for the treatment method of Parkinson disease depending
on its stage……………………………………..…………………………… 8
Figure 2.4. Possible transport types through BBB……………………………………..11
Figure 2.5. 3D representation of S-COMT isolated from rat..........................................13
Figure 2.6. Catalytic region of S-COMT……………………………………………….14
Figure 2.7. General mechanism of the COMT catalyzed methylation reaction………..15
Figure 2.8. Metabolic routes effective in Parkinson disease…………………………...16
Figure 2.9. Some second generation COMT inhibitors………………………………...18
Figure 2.10. Some last generation COMT inhibitors…………………………………..20
Figure 2.11. Some polyphenolics used as COMT inhibitors…………………………...24
Figure 2.12. Some major alkaloids found in harmal seed……………………………...27
Figure 2.13. Chemical structures of major polyphenolics in olive leaf………………...29
Figure 2.14. General enzymatic reaction progression curve…………………………...30
Figure 2.15. Simple competitive inhibition…………………………………………….37
Figure 2.16. Lineweaver-Burk graph for competitive inhibition……………………....39
Figure 2.17. Simple noncompetitive inhibition………………………………………...40
Figure 2.18. Lineweaver-Burk graph for noncompetitive inhibition…………………..41
Figure 2.19. Simple uncompetitive inhibition………………………………………….42
Figure 2.20. Lineweaver-Burk graph for uncompetitive inhibition…………………....43
Figure 2.21. Lineweaver-Burk graph for mixed type inhibition……………………….45
Figure 2.22. Lineweaver-Burk graph for substrate inhibition………………………….46
Figure 4.1. Schematic representation of the experimental studies……………………..50
Figure 5.1. Sample chromatogram of the crude alkaloid extract (1) harmol,
(2) harmalol, (3) harmine, (4) harmaline (analytical column)…..………….65
Figure 5.2. Sample chromatogram of the mixture of alkaloid standards (1) harmol,
(2) harmalol, (3) harmine, (4) harmaline (analytical column)………...……65

x
Figure 5.3. Sample chromatogram of crude olive leaf extract (1) rutin,
(2) oleuropein (Mobile phase flow rate: 1 ml/min, column
temperature 30 °C, analytical column)……………………………………..67
Figure 5.4. Sample chromatogram of crude harmal seed extract before fractioning
(1) harmol, (2) harmalol, (3) harmine, (4) harmaline………………………69
Figure 5.5. Sample chromatogram of harmine fraction (FP 2) (3) harmine,
(4) harmaline …..…………………………………………………………...70
Figure 5.6. Sample chromatogram of harmaline fraction (4) harmaline……………….70
Figure 5.7. Chromatogram of olive leaf fraction coded as FO 1……………………….72
Figure 5.8. Chromatogram of olive leaf fraction coded as FO 2 (1) rutin,
(2) verbascoside, (3) oleuropein……………..……………………………..73
Figure 5.9. Chromatogram of olive leaf fraction coded as FO 3 (1) rutin,
(2) luteolin-7-glycoside, (3) verbascoside, (4) oleuropein……….………...73
Figure 5.10. Chromatogram of olive leaf fraction coded as FO 4 (1) rutin,
(2) luteolin-7-glycoside, (3) verbascoside, (4) oleuropein………….……...74
Figure 5.11. Chromatogram of olive leaf fraction coded as FO 5 (1) rutin,
(2) verbascoside…………………………..………………………………...74
Figure 5.12. Chromatogram of olive leaf fraction coded as FO 6 (other forms of
glycosides with low polarity)………………………………………………75
Figure 5.13. Spectral scanning for different BSA concentration………………………77
Figure 5.14. Calibration curves obtained for proteins………………………………….77
Figure 5.15. A: Michaelis and B: Lineweaver-Burk graphs of
spectrophotometrically determined enzyme activity………………..……...79
Figure 5.16. Product formation kinetics obtained at E1-ES3-SAM1 concentrations
(10 hours)………………………..………………………………………….81
Figure 5.17. Product formation kinetics obtained at E1-ES3-SAM1 (2 hours)………..82
Figure 5.18. A: Michaelis and B: Lineweaver-Burk graphs of formation rate of
scopoletin against various SAM concentrations in presence of different
enzyme concentrations ([ES] was fixed at 4 µM)………………………….83
Figure 5.19. A: Michaelis and B: Lineweaver-Burk graphs of formation rate of
scopoletin up to 100 µM SAM concentrations in presence of different
enzyme concentrations ([ES] was fixed at 4 µM)………………………….83

xi
Figure 5.20. A: Michaelis ve B: Lineweaver-Burk graphs of formation rate of
scopoletin against various ES concentrations in presence of different
SAM concentrations (enzyme concentration was fixed in
11.0 µg protein/ml (E2))…………………………………………………....84
Figure 5.21. Inhibition percentages of alkaloid standards, extracts and fractions……..87
Figure 5.22. Inhibition percentages of polyphenolic standards and extracts
and fractions...……………………………………………………………...87
Figure 5.23. A: Michaelis and B: Lineweaver-Burk graphs of formation rate of
scopoletin against various SAM concentrations in presence of different
I1 (3,5-DNC) concentrations……………………………………………….88
Figure 5.24. A: Michaelis and B: Lineweaver-Burk graphs of formation rate of
scopoletin against various SAM concentrations in presence of different
I2 (harmol standard) concentrations………………………………………..89
Figure 5.25. A: Michaelis and B: Lineweaver-Burk graphs of formation rate of
scopoletin against various SAM concentrations in presence of different
I3 (harmalol standard) concentrations……………………………………...89
Figure 5.26. A: Michaelis and B: Lineweaver-Burk graphs of formation rate of
scopoletin against various SAM concentrations in presence of different
I4 (harmine standard) concentrations………………...…………………….90
Figure 5.27. A: Michaelis and B: Lineweaver-Burk graphs of formation rate of
scopoletin against various SAM concentrations in presence of different
I5 (harmaline standard) concentrations……………...……………………..91
Figure 5.28. A: Michaelis and B: Lineweaver-Burk graphs of formation rate of
scopoletin against various SAM concentrations in presence of different
I6 (harmal seed crude extract) concentrations……………………………...92
Figure 5.29. A: Michaelis and B: Lineweaver-Burk graphs of formation rate of
scopoletin against various SAM concentrations in presence of different
I7 (harmal seed fraction no FP1) concentrations…………………………...93
Figure 5.30. A: Michaelis and B: Lineweaver-Burk graphs of formation rate of
scopoletin against various SAM concentrations in presence of different
I8 (harmal seed fraction no FP2) concentrations…………………………...94
Figure 5.31. A: Michaelis and B: Lineweaver-Burk graphs of formation rate of
scopoletin against various SAM concentrations in presence of different
I9 (harmal seed fraction no FP3) concentrations…………………………...94

xii
Figure 5.32. A: Michaelis and B: Lineweaver-Burk graphs of formation rate of
scopoletin against various SAM concentrations in presence of different
I10 (oleuropein standard) concentrations…………………………….…….95
Figure 5.33. A: Michaelis and B: Lineweaver-Burk graphs of formation rate of
scopoletin against various SAM concentrations in presence of different
I11 (rutin standard) concentrations………………………….……………...96
Figure 5.34. A: Michaelis and B: Lineweaver-Burk graphs of formation rate of
scopoletin against various SAM concentrations in presence of different
I12 (olive leaf crude extract) concentrations……………………..………..97
Figure 5.35. A: Michaelis and B: Lineweaver-Burk graphs of formation rate of
scopoletin against various SAM concentrations in presence of different
I13 (olive leaf fraction no FO1) concentrations…………………….……...98
Figure 5.36. A: Michaelis and B: Lineweaver-Burk graphs of formation rate of
scopoletin against various SAM concentrations in presence of different
I14 (olive leaf fraction no FO5) concentrations………………….………...99
Figure 5.37. A: Michaelis and B: Lineweaver-Burk graphs of formation rate of
scopoletin against various SAM concentrations in presence of different
I15 (vitex leaf crude extract) concentrations…………………………..….100
Figure 5.38. A: Michaelis and B: Lineweaver-Burk graphs of formation rate of
scopoletin against various SAM concentrations in presence of different
I16 (cistus leaf crude extract) concentrations………………………..…....101
Figure 5.39. A: Michaelis and B: Lineweaver-Burk graphs of formation rate of
scopoletin against various SAM concentrations in presence of different
I17 (terebinth leaf crude extract) concentrations…………………..……...102
Figure 5.40. A: Michaelis and B: Lineweaver-Burk graphs of formation rate of
scopoletin against various SAM concentrations in presence of different
I18 (mastic leaf crude extract) concentrations……………..……………...102
Figure A1. Harmol calibration curve………………………………………………….118
Figure A2. Harmalol calibration curve………………………………………………..119
Figure A3. Harmine calibration curve………………………………………………...119
Figure A4. Harmaline calibration curve………………………………………………119
Figure B1. Oleuropein calibration curve……………………………………………...121
Figure B2. Rutin calibration curve……………………………………………………121
Figure C1: Scopoletin calibration curve………………………………………………123

xiii
LIST OF TABLES
Table Page
Table 2.1. Plants of which therapeutic potentials have been investigated in the
treatment of Alzheimer and Parkinson diseases……………………………...22
Tablo 2.2. COMT activity/inhibition assays…………………………………………...34
Table 4.1. The operating conditions and properties of the HPLC (Alkaloid
Fractionation)………………………………………………………………....53
Table 4.2. HPLC elution program (Alkaloid Fractionation)…………………………...54
Table 4.3. Operating conditions and properties of the HPLC (Alkaloid
Characterization)………………………………………………………...…...55
Table 4.4. HPLC elution program (Alkaloid Characterization)………………………..56
Table 4.5. Operating conditions and properties of the HPLC (Polyphenolic
Characterization)…………………………………………………………...57
Table 4.6. HPLC elution program (Polyphenolic Characterization)…………………...57
Table 4.7. Reaction medium for spectrophotometric method………………………….59
Table 4.8. Reaction medium for fluorometric method…………………………………61
Table 5.1. Operation conditions for alkaloid extraction methods……………………...63
Table 5.2. Alkaloid contents and efficiencies of crude extracts obtained from
harmal seed…………………………………………………………………...63
Table 5.3. Concentration ranges of alkaloids used for calibration……………………..66
Table 5.4. Characterization results of major alkaloid fractions obtained from
harmal seed……………………………………………………………….......71
Table 5.5. Elution solvents and contents of fractions obtained from olive leaf extract..72
Table 5.6. Oleuropein contents of olive leaf fractions………………………………....75
Table 5.7. Reaction Medium and Absorbances for Spectrophotometric Method……..78
Table 5.8. Enzyme Activities (spectrophotometric)…………………………………...79
Table 5.9. Concentration changes of enzyme and substrates………………………….81
Table 5.10. The plant extracts, fractions and their standards used as COMT
inhibitors in this study……………………...………………………………..86

xiv
LIST OF ABBREVIATIONS
COMT Catechol O-methyltransferase
SAM S-(5′-Adenosyl)-L-methionine
L-DOPA 3-(3,4-dihydroxyphenyl)-L-alanine (levodopa)
AChE Acetylcholine esteraz
MAO Monoaminoxidase
AADC Aromatic aminoacid decarboxylase
CNS Central Nervous System
BBB Blood-Brain Barrier
CSF Cerebrospinal Fluid
S-COMT Soluble catechol O-methyltransferase
MB-KOMT Membrane bound catechol O-methyltransferase
3,5-DNC 3,5-dinitrocatechol
Vmax Maximum velocity of enzymatic reactions
Vmax,app Maximum velocity of enzymatic reactions
in presence of inhibitors
Km Affinity of substrate
Km,app Affinity of substrate in presence of inhibitors
α Alpha (constant determining the inhibition mechanism)
Ki Inhibition constant (affecting to competitive inhibition)
αKi Inhibition constant (affecting to noncompetitive inhibition)
IC50 50 % inhibitory concentration
HPLC High Performance Liquid Chromatography
BSA Bovine Serum Albumin
DHAP 3,4-dihydroxyacetophenone (substrate; spectrophotometric
method)
ES Aeskuletin (substrate; fluorometric method)
SAH S-(Adenosyl)-homocystein
3H4MAP O-methylated form of DHAP
4H3MAP O-methylated isoform of DHAP
FP1 Harmal seed fraction rich in harmol and harmalol
FP2 Harmal seed fraction rich in harmine

xv
FP3 Harmal seed fraction rich in harmaline
FO1 Olive leaf fraction rich in oleuropein (water fraction)
FO5 Olive leaf fraction rich in rutin and other glycosides
(ethanol fraction)

1
CHAPTER 1
INTRODUCTION
Catechol O-methyltransferase (COMT) enzyme catalyzes methylation of the O-
hydroxyl groups in the structure of catechol by using S-(5'-Adenosyl)-L-methionine
(SAM) as the methyl source (Mannistö et al., 1999). In mammalians, COMT presents in
brain and peripheral tissues. The highest activity of COMT exists in liver, kidney and
gastrointestinal tract (stomach-bowel) in rats and humans (Guldberg et al., 1975).
COMT enzyme presents in its soluble form in many tissues but mainly bound to the
membrane in the human brain. Primary physiological function of COMT enzyme is
deactivation of catechols in and out of the cell having biological activity.
Catecholestrogens, catecholamine neurotransmitters (dopamine, norepinephrine
and epinephrine) and 3-(3,4-dihydroxyphenyl)-L-alanine) L-DOPA (levodopa), are the
important substrates of the COMT. Among these, dopamine and levodopa, are known as
in relationship with each other and the most important substrates. L-DOPA synthesized
through hydroxylation of tyrosine in the sympathetic neuron terminals and adrenal
glands, transfroms to 2-(3,4-dihydroxyphenyl)-ethylamine (dopamine) as a result of the
reaction catalyzed by a pyridoxal phosphate enzyme dopa decarboxylase.
Destruction of the dopaminergic neurons in the brain leads to the lack of
dopamine and cause the starting of symptoms of the Parkinson disease. During
pharmacological therapy, by taking of levodopa with dopa decarboxylase inhibitors,
peripheral metabolism of levodopa is reduced thereby dopamine level in the brain can
be increased (Bonifati et al., 1999; Dingemanse, 1997). Moreover, use of COMT
inhibitors together with the levodopa and dopa carboxylase inhibitors plays a significant
role in the therapy of the disease (Singh et al., 2007; Lerner et al., 2003).
Among the COMT inhibitors that have been developed since 1960s, inhibitors
that have been used clinically such as entacapone and tolcapone are known as the
synthetic nitrocatechol compounds. Human liver besides being one of the most
important tissue where compounds containing these types of catechols are metabolized,
is one of organs where the highest activity of COMT presents (Vieria-Coelho et al.,
1996; Guldberg et al., 1975). Since the cytotoxic effects of the nitrocatecholic inhibitors

2
used in the therapy of Parkinson disease are known, the discovering and development of
non-toxic natural inhibitors have ultimate importance.
Moreover, it is known that in Parkinson patients, increase in the lipid
peroxidation in the region of the brain known as substantia nigra (black matter) leads to
increase in the production of free radicals (Sudha et al., 2003). In the researches, it has
been stated that parkinsonism progresses due to increase in neuron degeneration
resulted from the formation of free radicals. Thus, importance given to the use of
natural compounds having antioxidant capacity as COMT inhibitors has increased
(Chen et al., 2006; Esposito et al., 2002; Chiueh et al., 2000).
Phytochemicals that are the indispensable chemicals of the traditional medicine
and can be metabolized easily in the body are known have less toxic effects. Besides,
due to that phytochemicals have antioxidant, antimicrobial and antitumour activities,
they have been used increasingly in the modern therapy. Recently, the studies on the
utilization of natural compounds in therapy of neurodegenarative diseases have gained
importance. (Chen et al., 2005; Perry et al., 1999). In literature, for the therapy of
Parkinson disease, utilization of many plant species that are rich in alkaloids and
polyphenolics as especially COMT inhibitors has been investigated and the results have
been reported.
Alkaloids are compounds that can be biologically synthesized and have several
pharmacological activities. Since the ancient times, they are not only used as medicine
but also as a source of madder. Several kinds of these compounds that structurally
contain nitrogen exist in nature. Tropane, ergot, and indole alkaloids are classes that are
widely known and are usually used for narcotic purposes. The harmal plant (Peganum
harmala), which is rich in one of the subclass of indole alkaloids that are β-carboline
derived alkaloids, is a plant belonging to the wild cummin (zygophyllaceae) family. It is
known that the harmal has been used for pharmaceutical purposes in ancient Greek and
India as well as it is used today in modern medicine for worm omitting and narkotic
puposes and as stimulant on the central nervous system. In the seeds of the harmal,
alkaloids including harmaline, harmine, harmalol and harmol, and etheric oils present.
In the studies on the harmal, it has been revealed that the harmal alkaloids prevent the
degeneration of acetylcholine and dopamine by inhibiting acetylcholine esterase
(AChE) and monoamin oxidase (MAO) enzymes that have important roles on the
metabolic pathways of the Parkinson disease (Theodore et al., 1999). Furhermore, a red
dye can be extracted from its seeds (Akalın, 2003).

3
Another important class of the phytochemicals is known as polyphenols. Similar
to alkaloids, polyphenols have also been utilized in pharmaceutics, chemicals and food
applications since ancient times and most of them have been extracted mainly from
plants.
Compounds such as oleuropein and rutin which majorly exist in the olive (Olea
europaea) leaves and apigenin glycosides belong to the widest class of polyphenols and
they are known as flavanoids. These subtances for which antimicrobial and antioxidant
activities have been stated by the researches, can neutralize or delay the effects of the
free radicals causing many diseases including hearth disease, cancer, diabetes, aging
and cataract (Garcia et al., 2000). On account of these properties, it has been thought
that they may prevent the free radicals formed upon neuron degeneration causing to the
Parkinson disease and especially oleuropein ve rutin can inhibit the COMT enzyme.
This study aims investigation of effects of olive leaf polyphenols such as
oleuropein ve rutin having antioxidant, antimicrobial, anticarcinogenic and antiviral
activities and of harmal seed alkaloids including harmaline, harmine, harmalol and
harmol as COMT inhibitors. In accordance to this purpose, the extracts obtained from
these plants are fractionated and also performances of each fraction are examined as
COMT inhibitors. The performances of the natural inhibitors are compared with those
of the synthetic COMT inhibitors that are commercially used currently and have some
adverse health effects.

4
CHAPTER 2
LITERATURE REVIEW
2.1. Neurodegenerative Diseases
Neurodegenerative diseases, one of the matters that could not been illuminated
by the medical science, involves many negative situations resulted from destruction of
especially central nervous system (CNS) neurons and their chronic dysfunctions.
Mitochondrial defects, protein aggregation, high metal concentration and oxidative
stress are known as the most significant reasons for death and destruction of the neurons
(Cavalli et al., 2008).
Protein Aggregation High
[Metal]
Oxidative Stress
Protein misfolding
Altered protein phosphorilation
Mitochondrial dysfunction
Neuronal Death
Protein Aggregation High
[Metal]
Oxidative Stress
Protein misfolding
Altered protein phosphorilation
Mitochondrial dysfunction
Neuronal DeathNeuronal Death
Figure 2.1. Factors resulting in neuron death and general impression mechanisms
(Source: Cavalli et al., 2008).
Many neurological disorders such as multiple sclerosis (MS), Alexander disease,
amiyotrophic lateral sclerosis (ALS), bovine spongioform encephalopathy (BSE),
Creutzfeldt-Jakob disease, schizophrenia, epilepsy and lethargy that are still under
etiologic investigation occur in humans. Alzheimer and Parkinson diseases are known

5
as the most important diseases among the neurological disorders that are commonly
seen at older ages as revealed by the researches (Institute of Neurodegenerative
Diseases, 2009). Alzheimer disease is a kind of neurological disorder is characterized
primarily by comprehension loss and dotage. In early periods of the Alzheimer disease,
which begins with dotage generally above the age of 65 and progresses, symptoms such
as loss in comprehension and memory are observed while symptoms such as speech
disturbance, depression and mental instability are also frequently observed in the late
periods (Houghton et al., 2005).
2.1.1. Parkinson Disease
Parkinson disease was first described in 1817 by an English surgeon Sir James
Parkinson as a syndrome of trembling of muscles unwillingly (Zhu, 2004). From
pathological point of view, although the etiology of Parkinson disease has not been
explained clearly it is characterized as chronic and ascending disorders of the CNS
neurons and known that it is caused by degeneration of dopaminergic neurons existing
in the nucleus part of the midbrain called as substantia nigra pars compacta (SNpc).
Figure 2.2. Important parts of brain. (*Pons: Mass consisted of CNS nerve cells and
fibers in front of the cerebellum **Corpus Callosum: Center controlling generally paresis ve physical disorders)

6
In addition, since presence of neurons deposited in the cytoplasm called Lewy
bodies and increased oxidative stress depending on increase in the reactive oxygen
species in the midbrain lead to death of the dopamine producing neurons, they are
shown amongst the causes of the disease (Houghton et al., 2005). The other important
reasons of Parkinson disease related to these factors are known as;
• Decrease in dopamine level in the brain,
• Imbalance between neurotransmitters (Gamma-aminobutyric acid (GABA),
Acetylcholine, Norepinephrine, Serotonin),
• Formation of free radicals.
Although Parkinson disease seen in many people commonly in elders, even
rarely it has been observed also in people below the age of 40 (Houghton et al., 2005).
Increase in tremors in arms and legs, muscular rigidity (dyskinesia), slowing down of
movement (bradykinesia) and loss of balance as well as cognitive dysfunction and
memory loss that are also seen in Alzheimer disease are known as clinical symptoms of
Parkinson disease (Zhu, 2004; Dingemanse, 1997). In later stages of the disease,
depression, impairment in speech, mental confusion, sleeping disorder, dotage, and
constipation are observed as secondary symptoms (Polymeropoulos et al., 1996).
2.1.2. Treatment Methods for Parkinson Disease
Until the late of 1950s, memory loss and tremor have been known as common
symptoms of many neurodegenerative disorders and the patients have generally been
using common treatment methods and drugs against these symptoms.
Currently, it has been partly possible to distinguish between neurodegenerative
disorders that have not been treated yet exactly and specific drugs to each of them have
been developed by also taking the advantage of the knowledge and experiences
(Houghton et al., 2005). Various drugs developed for the treatment of Parkinson disease
have been categorized into subclasses and these have been used clinically either solely
or together depending on the stage of the disease. Furthermore, surgical operations have
been applied for the treatment at later stages of the disease.

7
2.1.2.1. Pharmacotherapy (Drug Treatment)
The commercially available drugs that control the various symptoms of
Parkinson disease include:
o Dopamine agonists (substances exhibiting similar effects of dopamine),
o Levodopa/dopa decarboxylase inhibitors (benserazide, carbidopa),
o Anticholinergic agents1,
o Amantadine2,
o Monoamine oxidase-B (MAO-B)3 inhibitors (selegiline),
o Catechol O-methyltransferase (COMT) inhibitors (Nadeau, 1997).
Although these drugs can not behave exactly as dopamine and can not supply the
lack of dopamine which is the main reason of Parkinson disease, they can prevent the
decrease and balance the levels of dopamine and acetylcholine in the brain. The drugs
clinically used in the treatment of Parkinson disease can not treat the disease completely
but can provide improvement by decreasing the symptoms observed in the patients
(Nadeau, 1997).
It is the most important criteria to determine the stage of the disease in selection
of the drug that will be applied in the pharmacological treatment. Before deciding on
any drug, the Parkinsonizm level of the patient must be determined. The algorithm for
the treatment methods applied depending on the stage of the disease is shown in Figure
2.3.
1 Anticholinergic agents: substance or agent withstanding the effects of acetylcholine and paralyzing the glands and muscle elements inerved by the cholinergic fibres (atropine, scopolamine)
2 Amantadine: compound (drug) which is known to have dopaminergic, adrenergic and slightly anticholinergic affects that diminishes the conditions such as nervousness, insomnia and anxiety as well as the Parkinsonism symptoms.
3 Monoamine oxidase-B: Monoamine oxidase enzyme catalyzes the oxidation rection of the monoamines. It metabolizes amine neurotransmitters such as dopamine, norepinefrine and serotonin. This enzyme is present on the outer membrane of mitochondria and is synthesized by monoamine oxidase A gene. It has two types called MAO-A and MAO-B. Both are present in neurons and astroglias. MAO-A is present in liver, digestion system and plesanta as well as in central nervous system. MAO-B is present mostly in blood platelets.

8
Conservative use of L-Dopa/decarboxylase
inhibitors
Yes NoFunction loss Function loss
Yes
Yes
Early Stage
No medication Medication
Education, nutrition and exercise
Age < 60 years
Cognition intact?Cognition intact?
No
NoNoYes Yes
Consider Selegiline Consider SelegilineFunction lossNo
L-Dopa/decarboxylase inhibitors
Dopamine Agonists
Amantadin
Anticholinergics
increasing tremor
Dopamine Agonists
Amantadin
Yes No
L-Dopa/decarboxylase inhibitors
Conservative use of L-Dopa/decarboxylase
inhibitors
Conservative use of L-Dopa/decarboxylase
inhibitors
Yes NoFunction lossFunction loss Function lossFunction loss
Yes
Yes
Early Stage
No medication Medication
Education, nutrition and exercise
Age < 60 years
Cognition intact?Cognition intact?
No
NoNoYes Yes
Consider Selegiline Consider SelegilineFunction lossNoYes
Yes
Early Stage
No medication Medication
Education, nutrition and exercise
Age < 60 years
Cognition intact?Cognition intact?
No
NoNoYes Yes
Yes
Early Stage
No medication Medication
Education, nutrition and exercise
Age < 60 years
Cognition intact?Cognition intact?
NoYes
Early Stage
No medication Medication
Early StageEarly Stage
No medication Medication
Education, nutrition and exercise
Age < 60 yearsEducation, nutrition and exercise
Age < 60 years
Cognition intact?Cognition intact?
No
NoNoYes Yes
Consider Selegiline Consider Selegiline Consider SelegilineConsider SelegilineFunction lossFunction lossNo
L-Dopa/decarboxylase inhibitors
Dopamine Agonists
Amantadin
Anticholinergics
increasing tremor
L-Dopa/decarboxylase inhibitors
L-Dopa/decarboxylase inhibitors
Dopamine AgonistsDopamine Agonists
AmantadinAmantadin
AnticholinergicsAnticholinergics
increasing tremorincreasing tremor
Dopamine Agonists
Amantadin
Yes No
L-Dopa/decarboxylase inhibitors
Dopamine AgonistsDopamine Agonists
AmantadinAmantadin
Yes No
L-Dopa/decarboxylase inhibitors
Yes No
L-Dopa/decarboxylase inhibitors
Yes No
L-Dopa/decarboxylase inhibitors
YesYes No
L-Dopa/decarboxylase inhibitors
L-Dopa/decarboxylase inhibitors
Together with dopamine agonists Together with L-Dopa/decarboxylase inhibitors
Increase dose
Add L-Dopa/decarboxylase inhibitors
Increase dose
Change in L-Dopa/decarboxylase inhibitor and/or
Add Selegiline and/or
Add COMT inhibitor and/or
Add Amantadine and/or
Surgical operation
Increase dose
Change in L-Dopa/decarboxylase inhibitor and/or
Add Selegiline and/or
Add COMT inhibitor and/or
Add dopamine agonists and/or
Add Amantadine and/or
Surgical operation
Later Stage
Comprehensive physical and speech therapy
Together with dopamine agonistsTogether with dopamine agonists Together with L-Dopa/decarboxylase inhibitorsTogether with L-Dopa/decarboxylase inhibitors
Increase doseIncrease dose
Add L-Dopa/decarboxylase inhibitorsAdd L-Dopa/decarboxylase inhibitors
Increase dose Increase dose
Change in L-Dopa/decarboxylase inhibitor and/orChange in L-Dopa/decarboxylase inhibitor and/or
Add Selegiline and/orAdd Selegiline and/or
Add COMT inhibitor and/orAdd COMT inhibitor and/or
Add Amantadine and/orAdd Amantadine and/or
Surgical operationSurgical operation
Increase doseIncrease dose
Change in L-Dopa/decarboxylase inhibitor and/orChange in L-Dopa/decarboxylase inhibitor and/or
Add Selegiline and/orAdd Selegiline and/or
Add COMT inhibitor and/orAdd COMT inhibitor and/or
Add dopamine agonists and/orAdd dopamine agonists and/or
Add Amantadine and/orAdd Amantadine and/or
Surgical operationSurgical operation
Later Stage
Comprehensive physical and speech therapy
Later StageLater Stage
Comprehensive physical and speech therapyComprehensive physical and speech therapy
Figure 2.3. Algorithm for the treatment method of Parkinson disease depending on its stage

9
2.1.2.2. Surgical Operations
Before the development of L-dopa which is the main drug for treatment of
Parkinson disease, the patients have been subjected to surgical operations at early stages
of the disease. As seen from the algorithm given in Figure 2.3, today surgery is the last
choice at the stage where the drug treatment applied has no use in relief of the
symptoms. The main purpose of the surgery is breaking off the nerve connections in
thalamus1 and globus pallidus2 parts in the brain (Lozano et al., 1998).
• Stereotaxic technique: It was firstly employed in 1950 before the development
of L-dopa. This technique is used in neurosurgery and neuroradiology for the
purpose of 3-dimensional radiographic and topographic investigations of the
deep parts of the brain by means of an electrode inserted through a hole opened
on the skull (Singh et al., 2007).
• Pallidotomy: This technique firstly employed in 1940’s is still used for the
surgical treatment of Parkinson disease (Lozano et al., 1998). In the application
of pallidotomy, again a hole is opened through the skull and the globus pallidus
part is burned by means of a heated wire inserted through the hole. Although this
technique carries many risks, the symptoms of the disease can be alleviated by
breaking off the connection of the dopamine circuit with the thalamus. After the
pallidotomy application, the patients continue to take their drugs at the previous
dosage (National Institute of Neurological Disorders and Stroke, 2009; National
Parkinson Foundation, 2009; Singh et al., 2007).
• Thalamotomy: Tthis technique carrying risks as much as pallidotomy was first
applied in 1950’s. During application, lesions formed in the nucleus of the
thalamus are removed using an extremely cold metal rod and thereby the
tremblings of the patients are reduced (Lozano et al., 1998).
• Stimulation of the Brain: In this technique, which was first practisized in 1997,
the brain is stimulated by use of electrodes inserted in specific parts of the
thalamus (Singh et al., 2007).
1 Thalamus: Center which is present in the inner center of the brain controlling all senses except for the scent and responsible for transmission of knowledge to other control centers.
2 Globus Pallidus: One of the important ganglions presents out of and above the thalamus including nerves responsible for transmission of movement, emotions and senses.

10
• Transplantation: In transplantation method, cells taken from medulla of the
patient’s own adrenal gland are transplanted in place of the diseased cells
(Parkinson’s Disease Society, 2009; Singh et al., 2007).
Due to severity and intensity of the methods applied for the treatment of
Parkinson disease including pharmaceutical therapy and surgery, they are still hot topics
for the researchers. From this point, pathology, etiology, synthetic and natural treatment
methods of the disease have been extensively investigated.
2.1.3. Important Criteria in Drug Development for the Treatment of Parkinson Disease
Similar to the most of neurodegenerative diseases, difficulty in delivery of
substances used as drug in the treatment of Parkinson disease to the specific parts of the
brain is one of the most important problems encountered. Therefore, during drug
discovery and development, structural characteristics and functions of the certain parts,
naturally present in the structure of the brain where transition of chemical substances
takes place, have been investigated.
2.1.3.1. Blood-Brain Barrier
Blood-Brain Barrier (BBB) is a highly specific barrier system that is consisted of
epithel cells. Besides, it includes pericyte, astrocyte and neuronal cells in its structure
(De Boer et al., 2007). Since the epithel cells in the form of segments that are attached
to each other allow partial transition of the molecules, they provide most of selectivity
to the barrier. The most vital function of the BBB that is responsible for the transition of
molecules, DNA and enzymes is to protect the brain stability and to separate the brain
cells from the blood (De Boer et al., 2007; Sumio, 2004). Moreover, BBB has functions
of transition of agents that can be used in diagnosis and treatment of the neurological
diseases and consequently transmission of those agents to the brain.
Although dopamine, for which decrease in its level in the brain is the main
reason of Parkinson disease, is a neurotransmitter that can not pass through the BBB, L-
dopa, which is known as the precursor of dopamine, can pass through the BBB
(Dingemanse, 1997). Yet, since transition of most of the therapeutic molecules like
dopamine and genes through the BBB in desired amounts cannot be allowed, it is a

11
criteria that should be taken into account during the drug development. The potential
transport types through the BBB are explained by the known diffusion mechanisms in
Figure 2.4 (De Boer et al., 2007).
Epithel cellsMetabolism
Tight Junctions
Membrane
BRAIN
Brain cells (astrocytes, pericytes ve neurons)
Transport Types in the Blood-Brain Barrier
21 3 4 5 6
BLOOD
Epithel cellsMetabolism
Tight Junctions
Membrane
BRAIN
Brain cells (astrocytes, pericytes ve neurons)
Transport Types in the Blood-Brain Barrier
21 3 4 5 6
Epithel cellsMetabolism
Tight Junctions
Membrane
Epithel cellsMetabolismMetabolism
Tight Junctions
Membrane
BRAIN
Brain cells (astrocytes, pericytes ve neurons)Brain cells (astrocytes, pericytes ve neurons)
Transport Types in the Blood-Brain Barrier
21 3 4 5 6
BLOOD
Figure 2.4. Possible transport types through BBB. (1. Lipophilic transport, 2. Ionic transfer, 3. Hydrophilic transport, 4. Transport with carriers, 5. Transport by adsorption, 6. Transport with receptors)
2.1.3.2. Brain-Spinal Cord (Cerebrospinal) Fluid Barrier
The fluid in the subaracnoid gap and in the spinal cord channel which is one of
the brain membranes is called as cerebrospinal fluid (CSF). CSF is generally formed
within the glomus of capillaries (coroid plexus) extended to specific regions on the wall
of small voids (ventricules). CSF, which is a dynamic fluid, joins to the blood
circulation through being absorbed by the veins in the brain. This liquid formed in the
coroid plexus, plays an important role in the drug metabolism and transfer as well as in
the cell regeneration and neuron transmission (De Boer et al., 2007; Zheng et al., 2004).
Moreover, CSF helps the phase I-II and III enzymes present in the coroid plexus to
preserve their activation (De Boer et al., 2007).

12
The activation of COMT, which is one of the important phase I-III enzymes as
explained in detail in Section 2.1.4, and regulation of the metabolic reactions related to
this enzyme are also controlled by CSF (Zheng et al., 2004).
2.1.4. COMT Enzyme and Its Role in Parkinson Disease
The drugs used in the treatment of neurodegenerative disorders are first adsorbed
and then delivered to the specific targets in the body. The drugs reached to the target are
metabolized and excreted (Lautala, 2000). The metabolic transformation of the drugs
occurs through many enzymatic reactions. The enzymes taking part in the metabolic
reactions are called as phase I-II and III enzymes. The phase I enzymes such as
Cytochrome P-450 and MAO contribute to the oxidation, reduction and hydrolysis
reactions and thereby the forms of the drugs that can bind to the related functional
groups are obtained (De Boer et al., 2007; Lautala, 2000). The phase II enzymes, mainly
including glucuronozyl, glutathione, sulfo, acetyl and methyltransferases, catalyze the
reactions required for the metabolizing of the conjugated forms of the drugs (Lautala,
2000). As a result of these reactions, pharmacologically active compounds are formed.
Stability of the formed active compounds and the microenvironment where they present
is preserved by the phase III enzymes known as sodium-dicarboxylate, ascorbic acid,
organic anion and cation carriers (De Boer et al., 2007).
Catechol O-methyltransferase (COMT; EC 2.1.1.6), which is one of the phase II
enzymes, present in kidney, liver and brain in mammalians. Furthermore, the activity of
COMT was also observed in the gastrointestinal channel, muscles, erytrocytes, and in
some organs and tissues (Reenilä, 1999; Guldberg et al., 1975). The COMT enzyme,
which is coded by a single gene and different promoters, has two different forms having
different amino acid chain numbers (Lotta et al., 1995). The activities of the soluble (S-
COMT) and membrane-bound (MB-COMT) forms change depending on their cellular
distribution, sex and age (Bonifacio et al., 2007; Lautala, 2000; Gogos et al., 1998; De
Santi et al., 1998).
S-COMT that present in humans and recombinant S-COMT isolated from rat
exhibited structural similarities in 81% as revealed by the molecular biologists (Lautala,
2000). Hence, in the studies on determination of COMT activity in vitro, recombinant
S-COMT isolated from rat has been used. Firstly in 1994, Vidgren and co-workers
studied the three dimensional structure of the complex that is formed by the enzyme and

13
its substrates and the inhibitor in order to elucidate the activity of recombinant S-COMT
isolated from rat and molecular mechanism of the methylation reaction (Bonifacio et al.
2007; Lautala, 2000). According to the results of this study on the crystal structure of S-
COMT, complex β-sheets and eight α-helixes surrounding them are present in the
center of the enzyme. This topology is also observed in other methyltransferases that
use S-adenosyl-L-methionine (SAM) like DNA and RNA methyltransferases. Also, it
was revealed that the catalytic region of the COMT enzyme is present at the center and
on the surface of the giant protein structure (Bonifacio et al., 2007). In the catalytic
region of the enzyme schematically illustrated in Figure 2.5, there are two distinct
regions, the one where SAM binds and the other where catecholic substrate binds
(Bonifacio et al., 2007). SAM, which is the methyl source, is buried in the structure at
the catalytic region, while the other region, where the catecholic substrate binds, is in
the space on the surface (Lautala, 2000).
Figure 2.5. 3D representation of S-COMT isolated from rat. (3,5-DNC: 3,5-dinitro-catechol (COMT inhibitor))
14
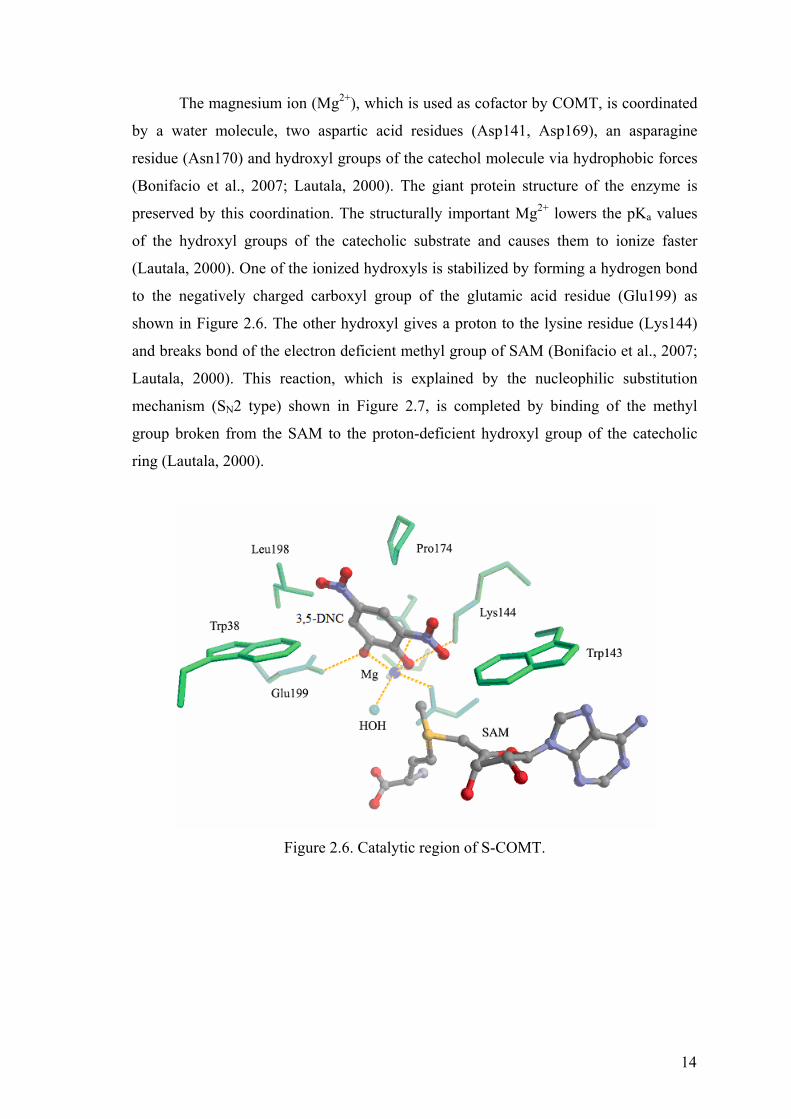
The magnesium ion (Mg2+), which is used as cofactor by COMT, is coordinated
by a water molecule, two aspartic acid residues (Asp141, Asp169), an asparagine
residue (Asn170) and hydroxyl groups of the catechol molecule via hydrophobic forces
(Bonifacio et al., 2007; Lautala, 2000). The giant protein structure of the enzyme is
preserved by this coordination. The structurally important Mg2+ lowers the pKa values
of the hydroxyl groups of the catecholic substrate and causes them to ionize faster
(Lautala, 2000). One of the ionized hydroxyls is stabilized by forming a hydrogen bond
to the negatively charged carboxyl group of the glutamic acid residue (Glu199) as
shown in Figure 2.6. The other hydroxyl gives a proton to the lysine residue (Lys144)
and breaks bond of the electron deficient methyl group of SAM (Bonifacio et al., 2007;
Lautala, 2000). This reaction, which is explained by the nucleophilic substitution
mechanism (SN2 type) shown in Figure 2.7, is completed by binding of the methyl
group broken from the SAM to the proton-deficient hydroxyl group of the catecholic
ring (Lautala, 2000).
Figure 2.6. Catalytic region of S-COMT.

15
Figure 2.7. General mechanism of the COMT catalyzed methylation reaction.
In the molecular level studies related to the COMT enzyme, the best known
inhibitor of the enzyme 3,5-dinitrocatechol, has been used as the catecholic compound
which are given in Figures 2.6 and 2.7. However, biologically active or xenobiotic
endogenous and exogenous catecholic compounds are the substrates of physiological
COMT and metabolized through O-methylation reaction (Bai et al., 2007; Kurkela et
al., 2004; Erdal et al., 2002; Ruottinen et al., 1998; Lotta et al., 1995). The
catecholamines (dopamine, epinephrine, norepinephrine), catecholestrogens (2 and 4-
hydroxyestradiol), L-dopa (levodopa) and ascorbic acid that can be methylated by
COMT enzyme are the well-known endogenous catecholic substrates (Chen et al., 2005;
Mannistö et al., 1999; Lotta et al., 1995). The exogenous catecholic substrates are
known as compounds in our dietaries and some medicines such as triphenols,
flavonoids, benserazide, carbidopa and dihydroxyphenyl serine (Bai et al., 2007; Chen
et al., 2005; Lautala, 2000; Mannistö et al., 1999).
These catecholic compounds, also used as substrates of COMT, are administered
solely or in accompaniment to the other drugs as previously mentioned in the Section
2.1.2.1. The metabolic roles of the COMT inhibitors, of catecholic compounds,
especially of levodopa which can pass through the blood-brain barrier (BBB), and of
aromatic L-aminoacid decarboxylase (AADC) and MAO-B inhibitors in the treatment
of Parkinson disease are summarized in Figure 2.8.

16
Figure 2.8. Metabolic routes effective in Parkinson disease. 3-OMD: 3-O-methyldopa,
Dopac: 3,4-dihydroxyphenylacetic acid, 3-MT: 3-methoxytyramine, HVA: homovanillic acid (Source: Dingemanse, 1997).
It was previously stated in detail in the Section 2.1.1 that the deficiency of
dopamine level in the brain (central) is one of the most important reasons of Parkinson
disease. In the treatment of the disease, it was claimed that co-administration of
compounds like carbidopa, which is used as the AADC inhibitor, with the COMT
inhibitors leads to decrease in the peripheral dopamine level (Dingemanse, 1997).
However, by this treatment method, the level of levodopa, which is the precursor of
dopamine and can pass through the blood-brain barrier (BBB), can be increased and
thereby the central dopamine level can be adjusted to the desired levels. In Figure 2.8,
the reactions catalyzed by MAO-B and COMT enzymes causing transformation of the
central dopamine are shown. From this point, during the treatment depending on the
stages of disease, the MAO-B inhibitors such as selegiline is used in addition to the
COMT inhibitors so that the central dopamine level can be adjusted at the desired level
(Mannistö et al., 1992).

17
2.2. COMT Inhibitors
Towards the end of 1950’s, the purification techniques have been improved and
studies on discovery and development of inhibitor for the structurally-characterized
COMT enzyme have been emerged. The standard substances used as COMT inhibitors
or their chemically-synthesized forms can be classified into the groups based on their
historical development.
2.2.1. Synthetic Inhibitors
2.2.1.1. First Generation COMT Inhibitors
Pyrogallol which was invented by Axelrod and LaRoche in 1959 was defined as
the first potential COMT inhibitor and has been used in the following years as the
model inhibitor in the studies on the inhibitor development (Guldberg et al., 1975). The
substances developed as the first generation inhibitors including gallic acid, caffeic acid,
3`,4`-dihydroxy-2-methyl-propiophenon (U-0521), 2-hydroxyestrogen are the
derivatives of pyrogallol and catechol (Bonifacio et al., 2007; Bailey et al., 2005).
Among the non-catecholic substances, ascorbic acid, tropolone, 8-hydroxyquinoline
derivatives, 3-hydroxylated pyrones and pyridones are also used as the first generation
COMT inhibitors (Bonifacio et al., 2007; Mannistö et al., 1999). Furthermore, some
flavonoids such as quercetin and rutin are also known as inhibitors of this class of
inhibitors (Bonifacio et al., 2007).
Although the first generation COMT inhibitors have high in vitro inhibition
performances, results of the animal tests did not show the successful inhibition. These
inhibitors with low in vivo inhibition properties and selectivity, with short efficacy
periods and having toxicity could not been found a role in clinical applications
(Mannistö et al., 1999; Dingemanse, 1997; Guldberg et al., 1975).

18
2.2.1.2. Second Generation COMT Inhibitors
New COMT inhibitors most in nitrocatecholic structure were synthesized in the
late 1980’s. As structurally shown in Figure 2.9, entacapone [OR-611; (E)-2-cyano-
N,N-diethyl-3-(3,4-dihydroxy-5-nitrocinnamide)], nitecapone [OR-462; 3-(3,4-
dihydroxy-5-nitro-benzylidine)-2,4-pentadion], tolcapone [Ro 40-7592; 4`-methyl-3,4-
dihydroxy-5-nitro-benzophenon], nebicapone [BIA 3-202; 1-(3,4-dihydroxy-5-
nitrophenyl)-2-phenyl-ethanone], some nitrobenzaldehydes and nitronoradrenalines are
nitrocatecholic substances developed as second generation COMT inhibitors (Bonifacio
et al., 2007; Loureiro et al., 2006; Mannistö et al., 1999). Other than the nitrocatecholic
inhibitors, the inhibitor coded as CGP 28014, a pyridine derivative, is also known as
second generation COMT inhibitor (Mannistö et al., 1999; Dingemanse, 1997).
Figure 2.9. Some second generation COMT inhibitors
(Source: Bonifacio et al., 2007; Palma et al., 2006; Mannistö et al., 1999).
The nitrocatecholic inhibitors are synthesized from the well-known synthetic
COMT inhibitor 3,5-dinitrocatechol (3,5-DNC) compound. As shown in Figure 2.9, the
synthesis is performed by binding of another functional group in place of one of the
nitro groups which is present in orto and para positions of the catechol ring (generally

19
para position) in the structure of 3,5-DNC with respect to the same hydroxyl group
(Bonifacio et al., 2007; Learmonth et al., 2002; Bäckstrom et al., 1989). The CGP
28014 coded pyridine derivative inhibitor is obtained by addition of specific functional
group after being transformed to pyridone (Waidmeier et al., 1990).
Among the inhibitors with higher potential and selectivity as compared to the
first generation inhibitors, nitecapone, entacapone and tolcapone are known as the
second generation inhibitors which have been used clinically (Ruottinen et al., 1998;
Dingemanse, 1997). It was reported that these inhibitors in nitrocatecholic structure are
known as reversible and tight binding inhibitors of COMT (Bonifacio et al., 2007;
Palma et al., 2006; Mannistö et al., 1999). The concentrations of nitecapone, entacapone
and tolcapone required to decrease the peripheral COMT activity by 50 percent (IC50)
were reported as 300 nM, 150 nM and 36 nM, respectively. The IC50 values of them for
the brain COMT activity were found to be 10 nM, 20 nM and 0.3 nM, respectively
(Bonifacio et al., 2007; Mannistö et al., 1999). These values indicated that the
nitrocatecholic inhibitors were 1000 times more effective than the first generation
inhibitors (Bonifacio et al., 2007).
It was found that mode of action of nitecapone is primarily effective on
duodenum so, its use in the treatment of Parkinson disease has been limited (Nissinen et
al., 1988). Currently, the other potential COMT inhibitors (entacapone and tolcapone)
are used in combination with MAO-B and AADC inhibitors, and levodopa (Singh et al.,
2007; Ruottinen et al., 1998; Dingemanse, 1997).
According to the results of the studies on treatment methods applied to the
Parkinsonians, entacapone showed high peripheral COMT inhibition, while tolcapone,
which can pass through the blood-brain barrier, decreased the both central and
peripheral COMT activity. Moreover, the efficacy period of tolcapone was found to be
longer than that of entacapone almost twice (Bonifacio et al., 2007; Mannistö et al.,
1999; Ruottinen et al., 1998).
Although new COMT inhibitors as effective and clinically applicable as these
two compounds have not been developed yet, it is known that their use in high
concentrations caused some toxic or carcinogenic effects on the liver (Singh et al.,
2007; Bonifacio et al., 2007; Mannistö et al., 1999; Ruottinen et al., 1998). The
administration of tolcapone, which has higher hepatoxicity as compared to entacapone,
has been banned in some countries (Europe and Canada) (Singh et al., 2007; Mannistö
et al., 1999; Nissinen et al., 1992).

20
The researches on the development of catecholic based inhibitors with high
selectivity have been going on in spite of the inhibitors in nitrocatecholic structure
which are highly effective in inhibition but have significant adverse side effects.
2.2.1.3. Last Generation – Non-typical COMT inhibitors
According to the classification of the COMT inhibitors based on their historical
development, CGP 28014 coded compound defined as a second generation inhibitor has
been later included in the group of non-typical COMT inhibitors. This compound that is
unsuccessful in in vitro COMT inhibition, it resulted in significant inhibition effect
especially on the central COMT inhibition (Mannistö et al., 1999, 1992; Dingemanse,
1997). However, studies on mode of action and toxicity of this compound have not been
completed yet.
Many COMT inhibitors included in this class are compounds that are
structurally modified from the nitrocatecholics and are gained some specific properties
(Bonifacio et al., 2007; Paulini et al., 2006).
Figure 2.10. Some last generation COMT inhibitors.
Bisubstrate inhibitors are synthesized as structures that can bind to the SAM and
catechol binding regions in the active site of COMT enzyme and thereby it might
prevent the interaction of the enzyme with its substrates that may lead to the disease
(Paulini et al., 2006; Learmonth et al., 2005; Lerner et al., 2003). Among the bisubstrate
inhibitors having several structurally-characterized derivatives, the in vitro IC50 value
21
for the [N-{(E)-3-[(2R,3S,4R,5R)-5-(6-Amino-9H-purin-9-yl)-3,4-dihydroxytetrahydro-
furan-2-yl]prop-2-enyl}-2,3-dihydroxy-5-nitrobenzene-1-carboxa-mide] compound was
found as 9 nM (Bonifacio et al., 2007; Lerner et al., 2003).
The bifunctional inhibitors are formed through synthesis of two catechol rings, a
nitro group is added to each. It was claimed that in vitro inhibition potentials of these
types of compounds are higher than those of their analogs with single catechol ring
(Bailey et al., 2005).
On the other hand, in vivo data on the bisubstrate inhibitors as well as the
bifunctional ones has not been confirmed, the mechanisms of them have not been
elucidated and the toxicity studies have not been performed yet (Bonifacio et al., 2007).
2.2.2. Natural Inhibitors
During last years, researches on the potential utilization of some natural
compounds that are generally obtained from plants (phytochemicals) in the treatment of
neurodegenerative diseases have been increased. Since plant-based compounds can be
metabolized easily in the body and have less side effects, their utilization in inhibition
of enzymes catalyzing some metabolic reactions causing neurodegenerative diseases is
extremely important (Perry et al., 1999).
In the literature, within the large class of phytochemicals, studies on inhibition
of AChE (acetylcholine esterase), COMT (catechol-O-methyltransferase) and MAO
(monoaminoxidase) enzymes playing important roles in Alzheimer and Parkinson
diseases by especially flavonoids, flavonoid glycosides, catechins and alkaloids are
available (Chen et al., 2006; Kadowaki et al., 2005; Kong et al., 2004; Perry et al.,
1999). On the other hand, according to these studies, in order to accept a substance that
can inhibit at least one of these enzymes as a new drug, the interactions of this
compound with the other enzymes, metabolites and receptors must be elucidated.
Therefore, the plants employed to inhibit AChE, COMT and MAO enzymes are
summarized in Table 2.1.

22
Table 2.1. Plants of which therapeutic potentials have been investigated in the treatment of Alzheimer and Parkinson diseases.
Family Botanical name Known name Active Ingredients Metabolic Functions Reference (s)
Theaceae Camellia sinensis Tea (green) Catechin and catechin gallats COMT inhibition Chen et al., 2005 Nagai et al., 2004 Zhu et al., 2004
Arecaceae Areca catechu Areca nut palm alkaloids (pilocarpin), tannin and gallic acid AChE inhibition Houghton et al., 2005
Piperaceae Piper betel Betel pepper catechins and alkaloids AChE inhibition Houghton et al., 2005
Labiateae Salvia officinalis sage Flavonoids and essential oils AChE inhibition Houghton et al., 2005
Labiateae Melissa officinalis melisse monoterpenes (essential oils) AChE inhibition, antidepressant Houghton et al., 2005 Wake et al., 2000
Labiateae Salvis Lavandulaefolia Not known monoterpenes (essential oils) AChE inhibition Perry et al., 2002
Ginkgoaceae Ginkgo biloba Ginkgo, Maidenhair Tree
Flavonoid glycosides, terpenes AChE and MAO inhibition Sloley et al., 2000
Perry et al., 1999
Malpighiaceae Banisteriopsis caapi Ayahuasca, caapi alkaloids (beta carbolines) COMT and MAO inhibition Schwarz et al., 2003
Cannabaceae Cannabis sativa cannabis Cannabinoids Cholinergic and dopaminergic activity increase Joy et al., 1999
Cupressaceae Biota orientalis Platycladus Not known Anticholinergic agent, MAO inhibition
Howes et al., 2003 Lin et al., 2003
Liliaceae Lilium brownii Brownii lily steroid saponines and alkaloids MAO inhibition Lin et al., 2003
Rubiaceae Gardenia jasminoides Gardenia Glycosides and phenolic acids MAO inhibition Lin et al., 2003
Rubiaceae Uncaria rhynchophylla caper berry alkaloids (indole) AChE and MAO inhibition Hou et al., 2005
Mamedov, 2005
Huperziaceae Huperzia serrata cinque foli alkaloids (huperizin A) AChE inhibition Cheng et al., 1998, 1996 Zhang et al., 1991
(continued on next page)

23
Table 2.1. (cont.)
Family Binomial name Known name Active ingredients Metabolic Functions Reference (s) Labiatae Origanum majorana Marjoram Flavonoids and essential oils AChE inhibition Chung et al., 2001
Apiaceae Bacopa monniera Coastal waterhyssop, Brahmi
Alkaloids and saponins (bacosite)
Learning and comprehension strength
Howes et al., 2003 Perry et al., 1999
Solanaceae Withania somnifera chinese lantern Steroids (witanolites) Anticholinergic agent Perry et al., 1999 Schliebs et al., 1997
Guttiferae Hypericum perfaratum St.John's wort flavonoids, tannins, naphtodiantrons (hyperphorin, hypericin)
Memory strength, antidepressantMamedov, 2005 Perry et al., 1999 Chatterjee et al., 1998
Zygophyllaceae Peganum harmala Harmal Alkaloids (beta carbolins) KOMT and MAO inhibition Akalın, 2003 Schliebs et al., 1997
Rosaceae Rosa Damascena Rose Essential oils Learning and comprehension strength Köse et al., 2007
Fabaceace Mucuna pruriens A kind of aquarium plant Not known Dopamine agonist Manyam et al., 2004
Papaveraceae Papaver somniferum Poppy Alkaloids (papaverin, codein) AChE and COMT inhibition Perry et al., 1999
Alliaceae Galanthus nivalis Snowdrop Alkaloids (galantamine) AChE inhibition, memory strength Olin et al., 2001a, 2001b

24
Regarding the divergence of the plants given in Table 2.1, they serve many
resources that can be applied for the treatment of diseases of those etiologies have not
been entirely defined yet and seen in many people around the world such as Alzheimer
and Parkinson diseases. It was reported that plants that are specifically rich in alkaloids,
terpenes, flavonoids and flavonoid glycosides as active ingredients have potential
therapeutic applications.
However, since isolation of each of the active ingredients of plants separately,
given in Table 2.1, requires time and money, the raw extracts of these plants and rarely
their standards have been used in the studies. Among the plants that are active in
inhibition of COMT enzyme, generally the Camellia sinensis (green tea) extract rich in
catechin and catechin derivatives and the standards of the fractions has been studied in
detail.
Tea catechins and flavonoids found in abundant amounts in our dietaries are
compounds having catechol ring and the structures of those used in the COMT
inhibition are represented in Figure 2.11 (Zhu et al., 2004).
Figure 2.11. Some polyphenolics used as COMT inhibitors.
In the studies performed using the compounds shown in Figure 2.11, it was
reported that the structure-activity relationship between polyphenolics and
catecholestrogens found in human liver for their COMT catalyzed O-methylation

25
inhibition (Zhu et al., 2008; Bai et al., 2007). It was revealed that catechins containing
galloil type D-rings (ECG and EGCG) have higher potential than quercetin which is
known as a strong inhibitor (Chen et al., 2005; Nagai et al., 2004; Zhu et al., 2001). It
was suggested that 4`,4``-di-O-methyl-EGKG which is a metabolite formed by
methylation of (-)-Epilgallocatechin gallate (EGCG), which exhibits the highest
inhibition effect in the enzyme kinetic analysis, might also be a new type of COMT
inhibitor (Chen et al., 2005; Kadowaki et al., 2005; Weinreb et al., 2004).
It has become a desired property that the drugs developed especially for the
treatment of cancer and neurological diseases have multifunction. It was also known
that Parkinson disease is a neurological disease that is caused by several mechanisms.
Among these mechanisms, increase in oxidative stress (increase in free radical
formation) is one of the mechanisms triggering the disease as previously mentioned
(Cavalli et al., 2008). Consequently, the compounds administered against Parkinson
disease should have antioxidant capacity as well as they have ability to inhibit the
COMT enzyme.
It was reported that due to decrease in glutathione concentration in the
substantia nigra of the Parkinson patients, lipid peroxidation has increased (Akyol,
2004). This substance is used as co-enzyme in the transformation reaction of peroxyl
radicals to water molecule which is catalyzed by glutathione peroxidase enzyme
(Akyol, 2004; Sirnonian et al., 1996). It was also known that increasing peroxyl radicals
due to glutathione deficiency causes to loose the activity of alkaline phosphatase
enzyme which is responsible for prevention of many proteins in the body (Bertolini et
al., 2007). As a result of these mechanisms which are closely interrelated, destruction or
misfolding of protein structures and increase in oxidative stress have been observed.
Therefore, neuron deaths triggering Parkinson disease occur (Cavalli et al., 2008).
In order to prevent these effects of the free radicals, quercetin which can inhibit
COMT enzyme and possesses antioxidant capacity has been employed in the studies.
Quercetin, shown as one of the synthetic inhibitors of COMT enzyme, was found to
have higher protective effect on alkaline phosphatase activity and its structure than
currently-used drug tolcapone. Moreover, its potential to deactivate the free radicals is
known higher than those of most nitrocatecholic COMT inhibitors (Bertolini et al.,
2007).
Although it was confirmed that antioxidants can prevent Parkinson disease and
retard its progress, they increase risk of especially breast cancer due to decrease in the

26
COMT activity (Chen et al., 2006; Van Duursen et al., 2004; Esposito et al., 2002; Suk
Yin, 2002; Chiueh et al., 2000). It was reported that transformation of catecholestrogens
and catecholamines, due to they can not undergo the methylation reaction, to the
quinone forms raises the cancer risk (Van Duursen et al., 2004; Suk Yin, 2002).
2.2.2.1. Harmal (Peganum harmala) Seed
Harmal (Peganum harmala), one of the plants listed in Table 2.1, is a plant of
the family zygophyllaceae. In ancient times, medicine obtained from the seeds of this
plant was used as an anthelmintic (to omit parasitic worms) and as narcotics. It was also
used to prepare antidotes against poisoning and snake bites. Greeks and Romans used
harmal against diarrhea. Today, in modern medicine, harmal is used as an anthelmintic
and as a central nervous system stimulant (Akalın, 2003). Moreover, in ancient
societies, since it has aphrodisiacal properties, it was used to increase sexual power
(Akalın, 2003).
Harmal seeds contain several types of alkaloids including betacarboline,
tetrabetacarboline, quinasoline derivatives in more than 25 percent (Juma, 2005;
Molchanov et al., 1996). The remaining part includes etheric oil, flavonoids and
glycosides (Akalın, 2003; Sharaf et al., 1997). The seeds mostly contain betacarboline
derivative alkaloids in 2-7 percent. Especially harmaline and harmine and other
betacarboline derivative alkaloids such as harmalol, harmol, harman and peganin are the
major alkaloids present in harmal seeds (Figure 2.12) (Grella et al., 1998; Ott, 1996;
Khan, 1990). Additionally, a red dye can be extracted from the harmal seeds (Akalın,
2003; Kartal et al., 2003).

27
Figure 2.12. Some major alkaloids found in harmal seed.
(Source: Srivastava et al., 2001; Grella et al., 1998; Khan, 1990).
The numerous studies using especially harmaline and harmine as well as other
harmal alkaloids shown in Figure 2.12 have been performed. These alkaloids can
substitute serotonin, inhibit MAO enzyme, stimulate central nervous system, have
amplification effect on immune system as well as hallucinogenic and antioxidant effects
(Halpern, 2004; Kartal et al., 2003).
Moreover, peganine, which can pass through the blood-brain barrier, inhibits
acetylcholine esterase and monoaminoxidase enzymes and thereby controls the
acetylcholine and dopamine levels in the brain (Theodore, 1999). Although for most of
the plants containing alkaloids, in vivo and cytotoxicity studies have not been completed
yet, it was claimed that the alkaloids extracted from the plants in the belladonna,
harmala and aporphine families can be utilized in the treatment at early stages of
Parkinson disease (Theodore, 1999).

28
2.2.2.2. Olive (Olea europaea) Leaf
Olive tree, the most important member of the oleaceae family, is known as
symbol of Mediterranean and peace since ancient times (Bonilla et al., 2006; Al-
Azzawie et al., 2006). Olive leaves, which are referred even in the Bible, have been
used as a medicine against fever and malaria since ages (Lee-Huang et al., 2003).
Furthermore, since it can decrease the blood pressure and prevent spasms, it has been
used for treatment purposes in animals and humans (Garcia et al., 2000). Today, the
clinical studies and our daily experiences have showed that olive leaf extract is effective
against diabetes, hepatitis, flu, open wounds, bacterial and viral infections and even
HIV (Page, 2002).
It was stated that the high polyphenolics content of olive leaves is responsible
for the health beneficial and therapeutic properties of olive leaves against several
diseases. It was reported that oleuropein and its derivatives (verbascoside); flavones
(luteolin-7-glycoside, apigenin-7-glycoside, diosmetin-7-glycoside, luteolin and
diosmetin); flavonoles (rutin); flavan-3-ols (catechins) and substituted phenolics
(tyrosol, hydroxytyrosol, vanillin, vanillic acid and caffeic acid) are the most widely
present polyphenols in olive leaves (Garcia et al., 2000).
Among these polyphenolics, it was revealed that rutin, luteolin, hydroxytyrosol
and oleuropein have the highest antioxidant capacities (Baycin et al., 2007; Garcia et al.,
2000). Moreover, it has been possible to isolate the major polyphenolics rutin and
oleuropein present in olive leaves of which the chemical structures are shown in Figure
2.13 by the silk fibroin adsorption technique (Baycin et al., 2007; Savournin et al.,
2001; Garcia et al., 2000).

29
Figure 2.13. Chemical structures of major polyphenolics in olive leaf.
The studies on major olive leaf polyphenolics have shown that they have several
health beneficial properties. Moreover, it was known that oleuropein has blood pressure
and immune system regulating and therapeutic effects mainly against heart related
diseases and diabetes as well as has antibacterial and antitumour activities. Besides, it
was revealed that oleuropein and hydroxytyrosol which is an oleuropein derived
metabolite have significant antioxidant capacity (Ranalli et al., 2006; Al-Azzawie et al.,
2006).
There exists also infection preventing, antitumour, antibacterial, and antioxidant
effects of rutin that is the secondary major polyphenolics present in olive leaves (Ghica
et al., 2005). In addition, rutin is a compound which has been used for treatment against
several diseases due to its preventing effect against DNA destruction and also used
mostly in our dietaries (Kurisawa et al., 2003).
The researches on the use of phytochemicals against neurological disorders as
well as several diseases have still been performed (Perry et al., 1999). The importance
of these compounds in the drug discovery and development point of view has been
increasing due to their possible uses in several metabolic routes as substrates, protective
and reaction initiating agents and also stabilizers (Sheu et al., 2004).

30
2.3. Enzyme Activation and Inhibition Determination Methods
Most of the enzymatic reactions can be explained using equations known as
simple Michaelis kinetics. According to Michaelis kinetics, reaction velocity (v) is
mathematically associated with enzyme (E), substrate (S), enzyme-substrate complex
(ES), product (P) and reaction constants (k1, k-1 and k2) as given in Equation 2.1.
E + S ES E + Pk1
k -1
k2 E + S ES E + Pk1
k -1
k1
k -1
k1
k -1
k2 k2
[ ] [ ] [ ][ ]SKSV
vdtPd
dtSd
m +===
− max (2.1)
where [ ]02max EkV = and ( )1
21k
kkKm+= − .
The enzyme activity revealing the kinetic progression (Figure 2.14) of reaction
can be followed by many physicochemical methods. Spectrophotometric, fluorometric
and radioactive methods are referred as the most widely used techniques in the literature
(Copeland, 2000). However, as given in the equations above, since the reaction rate can
be calculated according to substrate and the product, it is quite important to define the
materials of which the kinetic data will be recorded in choosing kinetic definition
method.
Figure 2.14. General enzymatic reaction progression curve

31
2.3.1. Spectrophotometric Method
In spectrophotometric method, the changes in the electronic orientation of a
molecule after exposure to a light source are observed. The light energy absorbed by the
molecule and which will cause required amount of change in the electronic orientation
of the molecule, is present in regions of electromagnetic spectrum known as ultraviolet
(UV) and visible regions (totally 200-800 nm range) (Copeland, 2000).
In reactions followed with spectrophotometric method, the molecule, kinetic
data of which will be collected, should firstly be exposed to a total spectral energy
range. Thus, the wavelength (λmax) of the maximum light energy absorbed by the
molecule is defined and this wavelength is used for most accurate kinetic results.
Absorption values and concentrations of materials in the solution obtained as a
result of kinetic measurements at maximum wavelength are analytically associated
using Beer Law (Copeland, 2000). According to Beer Law;
clA ε=
where A (absorbance) is a unitless quantity, and it is shown that it changes in correlation
with concentration value defined as C (molarity, M), l (the pathlenght of light, distance
passed by the light in the solution, cm) and ε (molar absorptivity coefficient, (M.cm)-1)
(Copeland, 2000).
2.3.2. Fluorometric Method
As in spectrophotometric method, in fluorometric method the molecule is
exposed to a light source. However, the light absorbed by the molecule in this method
does not cause a change in electron orientation. Electrons, using the applied light
energy, achieve high energy level for a short while and then turn to their initial energy
level. The energy used during this change is given to reaction medium and recorded as
increases or decreases in fluorescence (Copeland, 2000).
In fluorometric method, 2 maximum wavelengths are defined for the molecule
whose kinetic data will be collected. Maximum wavelengths where the light is absorbed
(emission) and electrons reach high energy level (excitation) are found with spectral
scanning and measurements at these wavelengths are recorded.

32
The relationship between concentration and fluorescence can be calculated with
a method similar to Beer’s law used in spectrophotometric method. In fluorometric
calculations, molar quantum constant (φ) is used instead of molar absorptivity.
However, it is recommended that in practice a calibration curve is obtained for the
material whose kinetic data will be collected instead of using this constant (Copeland,
2000).
Since fluorescence devices are more sensitive and less interference is observed,
this method is more advantageous than absorption and used more for enzymatic
reactions (Copeland, 2000).
2.3.3. Radiochemical Method
The basic strategy in this method is the use of radioisotopes combined with
substrate (such as carbon-14, phosphorus-32, tritium, etc.). Such materials which are
subject to radioactive decay pass to the product as a result of enzymatic reaction. After
substrate and product fractions are obtained using appropriate separation techniques,
reaction rate is determined according to the amount of radioactive material left in the
substrate (or passed in the product) (Copeland, 2000).
Radioactive decay is expressed with Curie unit (Ci). 1 Ci equals to complete
decay rate of 1 gram of radium-226. After the amount of decay in one minute is defined
for every isotopes used in the reaction, the reaction rate can be calculated (Copeland,
2000).
Physically, the light emerging as a result of scintillation by the radioactive
material is absorbed by other materials in the reaction medium. The absorbed light is
recorded by a scintillation counter. In this method which requires a separation, the
scintillation counter is usually connected to a chromatography device. This method is
known as a method as sensitive as fluorescence and is widely used.
Other than these methods used for kinetic measurements of enzymatic reactions,
some different techniques such as polarography, electrophoretic separation,
chromatographic separation and immunological reactivity are also used (Copeland,
2000).

33
2.3.4. COMT Enzyme Activity/Inhibition Assays
It is known that the COMT enzyme, which is usually obtained by isolating from
livers, kidneys and brains of animals and humans, can be used many catecholic
substrates together with SAM as substrate. In studies since 1958, COMT enzyme
activity is tried to be determined by fluorometric, spectrophotometric and radioactive
methods. Among these, radioactive method is preferred since it does not require a
reference standard. In this method, usually carbon-14 (14C) and tritium (3H)
radioisotopes bound SAM is used as methyl donor substrate. However, because of
inability to separate several isomeric O-methylated products formed in in vitro
experiments by using liquid-liquid extraction and primitive chromatography techniques,
radioactive methods can not always be applied (Lautala, 2000).
With the help of improved separation methods in recent years, it is possible to
use multiple detectors compatible with liquid and gas chromatography devices. Thus,
spectrophotometric, fluorometric and radioactive methods with increased sensitivity
have been used in many studies in order to determine COMT activity. However, since
fluorometric and radioactive methods are preferred more since they have the capacity to
measure very low concentration values (Lautala, 2000; Reenilä, 1999).
In Table 2.2, the studies employed in order to determine enzyme activity or
inhibition, are summarized by giving information about reaction medium, substrate
selections and some kinetic data. As it can be seen from this table, COMT activity can
be determined by using a variety of methods from simple optical methods to modern
techniques.

34
Table 2.2. COMT activity/inhibition assays
Reference(s) Assay conditions Method of Analysis Catecholic
Substrate
[Catecholic
Substrate] [SAM]
Enzyme source
(amount) Additional information
Tsunoda et al.,
2002
pH=7.8, 37 °C,
total rxn. volume=300 µl,
incubation time=60 min.
HPLC-Fluorescence
(excitation 430 nm;
emission 505 nm)
Norepinephrine
(NE) 2 mM 200 µM
human
S-COMT
[NE] concentration range
10-2000 µM
Tsunoda et al.,
2002
pH=7.4, 37 °C,
total rxn. volume=300 µl,
incubation time=60 min.
HPLC-Fluorescence
(excitation 430 nm;
emission 505 nm)
Norepinephrine
(NE) 0.1 mM 200 µM
human
MB-COMT
[NE] concentration range
1-100 µM
Salyan et al., 2006
pH=7.5, 37 °C,
total rxn. volume=200 µl,
incubation time =90 min.
LC-MS1 1) Dopamine
2) DOBA2
2-128 µM
(for both
substrates)
10 µM S-COMT
(2 µg/ml)
Km (DOBA) = 11 µM
Km (Dopamine) = 42 µM
Aoyama et al.,
2005
pH=7.8, 37 °C,
total rxn. volume=250 µl,
incubation time =60 min.
HPLC-Fluorescence
(excitation 430 nm;
emission 505 nm)
Norepinephrine
(NE) 1.5 mM 200 µM
S-COMT
(62 µg/ml)
Km (NE) = 503 µM
(inhibition with pyrogallol
and 3,5-dinitrocatechol )
Shen et al., 2005
pH=7.8, 37 °C,
total rxn. volume=1 ml,
incubation time =60 min.
HPLC-Fluorescence
(excitation 260 nm;
emission 400 nm)
DOBA 25 µM 100 µM S-COMT
(0.5 mg/ml)
Lautala et al.,
2001, 1999
pH=7.4, 37 °C,
total rxn. volume=250 µl,
incubation time =30-60
min.
Radioactivity-UV
detection (260 nm)
HPLC
DOBA 5-300 µM 150 µM S-COMT
(12.5-100 µg)
Inhibition and Validation
study
(continued on next page)

35
Table 2.2. (cont.)
Reference(s) Assay conditions Method of Analysis Catecholic
Substrate
[Catecholic
Substrate] [SAM]
Enzyme source
(amount) Additional Information
Chen et al., 2005 pH=7.4, 37 °C,
total rxn. volume=100 µl, incubation time=30 min.
HPLC Electrochemical Detection (ECD)
1) 2-OH-E23
2) 4-OH-E24 50 µM 60 µM
Human liver COMT
(0.2 mg)
Inhibition study (substrate concentrations vary between 5-200 µM )
Bailey et al., 2004 pH=7.45, 37 °C,
total rxn. volume=60 µl, incubation time=60 min.
HPLC - UV detection (370 nm)
Catecholic Azo-dyes 0.5-150 µM 20 mM
Porcine liver COMT
(125 U/ml)
Inhibition study (inhibitor concentrations vary between 0-21 µM )
Kurkela et al., 2004
pH=7.4, 37 °C, total rxn. volume=100 µl, incubation time=60 min.
Microplate Reader - Fluorescence
(excitation 355 nm; emission 460 nm)
Esculetin Not given 10 µM Human liver
COMT (15 µg/ml)
Inhibition study (6 different catecholic
compound)
Veser, 1987 pH=7.4, 37 °C,
total rxn. volume=500 µl, incubation time=30 min.
Fluorescence (excitation 390 nm; emission 465 nm)
Esculetin 4 µM 600 µM
Candida tropicalis S-COMT (20-50 µl)
[Esculetin] = 1.2-5 µM [SAM] constant at 460, 46
and 7.7 µM
Hirano et al., 2007
pH=7.8, 37 °C, total rxn. volume=200 µl, incubation time=30-120
min.
HPLC-Fluorescence (excitation 430 nm; emission 505 nm)
Norepinephrine (NE) 1.5 mM 200 µM rat brain
S-COMT
Activity test for COMT isolated from several regions of rat brain
(continued on next page)

36
Tablo 2.2. (cont.)
Reference(s) Assay conditions Method of Analysis Catecholic
Substrate
[Catecholic
Substrate] [SAM]
Enzyme source
(amount) Additional Information
Hirano et al., 2007
pH=7.0, 37 °C, total rxn. volume=200 µl, incubation time=30-120
min.
HPLC-Fluorescence (excitation 430 nm; emission 505 nm)
Norepinephrine (NE) 200 µM 200 µM rat brain
MB-COMT
Activity test for COMT isolated from several regions of rat brain
Dhar et al., 2000 pH=7.5, 35 °C,
total rxn. volume=1 ml, incubation time=30 min.
Spectroscopy (absorbance 510 nm) Esculetin 1 mM 2 mM
Streptomyces griseus
S-COMT (20-200 µg)
Km (esculetin) = 500 µM Km (SAM) = 600 µM
Homocystein (product) inhibition (Ki=224 µM)
Zhu et al., 2001 pH=7.4 and 10.0, 37 °C, total rxn. volume=1 ml, incubation time=20 min.
Radioactivity-UV detection (254 nm)
HPLC-MS Tea catechins 10-100 µM 50 µM
Human liver COMT
(0.5 mg/ml)
Inhibition with tea catechins (10-100 µM)
Palma et al., 2006 pH=7.8, 37 °C,
total rxn. volume=1 ml, incubation time=15 min.
HPLC-EIMS5
Nitrobenzo-phenone
derivatives (bisubstrates)
10 µM 500 µM rat
S-COMT (1 mg/ml)
Inhibition with bisubstrate inhibitors (10 µM)
1 LC-MS: Liquid chromatography-mass spectroscopy 2 DOBA: 3,4-dihydroxy-benzoic acid 3 2-OH-E2: 2-hydroxy-estradiol 4 4-OH-E2: 4-hydroxy-estradiol 5 HPLC-EIMS: High pressure liquid chromatography - electrospray ionization mass spectroscopy

37
2.4. Enzyme Inhibition Mechanisms
Activity of an enzyme can be blocked by various methods. It has been known
that hundreds of natural compounds and thousands of synthetic chemicals can inhibit
catalytic activity of enzymes. Basically these compounds cause reduction in rate of the
enzyme catalyzed reactions (Leskovac, 2003; Copeland, 2000). Inhibition is a situation,
which is sometimes undesirable although it is necessary for some enzymatic reactions.
Especially, inhibition of enzymatic reactions in living organisms is widely discussed in
food and pharmaceutical fields.
Inhibition is simply caused by materials which are directly or indirectly added to
the reaction medium. These materials are called inhibitors and they are classified
according to their effects on the reaction. The equations derived by Michaelis and
Menten in order to calculate the rate of a simple enzymatic reaction given in Section
2.3, are modified according to the type of the inhibitor. Despite the fact that, new rate
equations are derived in order to explain complex mechanisms nowadays, most
enzymatic reactions can be explained with Michaelis-Menten approach (Pekin, 1970).
Therefore in this study, equations derived for inhibitors explained by linear inhibition
mechanisms are used.
2.4.1. Competitive Inhibitors
Competitive inhibitors are usually compounds having similar structures to
substrate of the enzyme and therefore they are bound to the same active site of enzyme
with the substrate (Leskovac, 2003). Consequently, they reduce the production rate by
forming an enzyme-inhibitor complex (EI) (Figure 2.15).
Figure 2.15. Simple competitive inhibition (Source: Copeland, 2000).

38
Possible competitive inhibition reaction shown in Figure 2.15 occurs as given
below.
Rate of reaction for the reaction in which the medium does not include any
inhibitors is mathematically derived as given in Equation 2.1.
[ ] [ ] [ ][ ]SKSV
vdtPd
dtSd
m +===
− max (2.1)
In this equation [ ]0max EkV cat= and it is defined as the maximum velocity of
reaction. ( )1
21k
kkK m+= − , which is the affinity of the substrate, is the equilibrium
constant of the reaction where enzyme-substrate complex (ES) forms. In cases where
there is a competitive inhibitor (I) in such reaction medium, the rate equation given in
Equation 2.1 can be derived as in Equation 2.2 by Michaelis-Menten approach (mass
balance is made for total E amount taking into consideration the pseudo-steady state
hypothesis) (Shuler, 2001; Copeland, 2000).
[ ][ ] [ ]SKIK
SVv
im +⎟⎟
⎠
⎞⎜⎜⎝
⎛+
=1
max (2.2)
Ki, the equilibrium constant of the reaction through which the enzyme-inhibitor
(EI) complex is formed, is defined as inhibition constant and it has the same unit with
concentration. Using rate equations known as Michaelis-Menten equations,
determination of inhibition mechanism and kinetic constants require complex
calculations. For this purpose, some researchers such as Lineweaver and Burk, Hanes
and Dixon have linearized these equations (Leskovac, 2003). Among these, linear
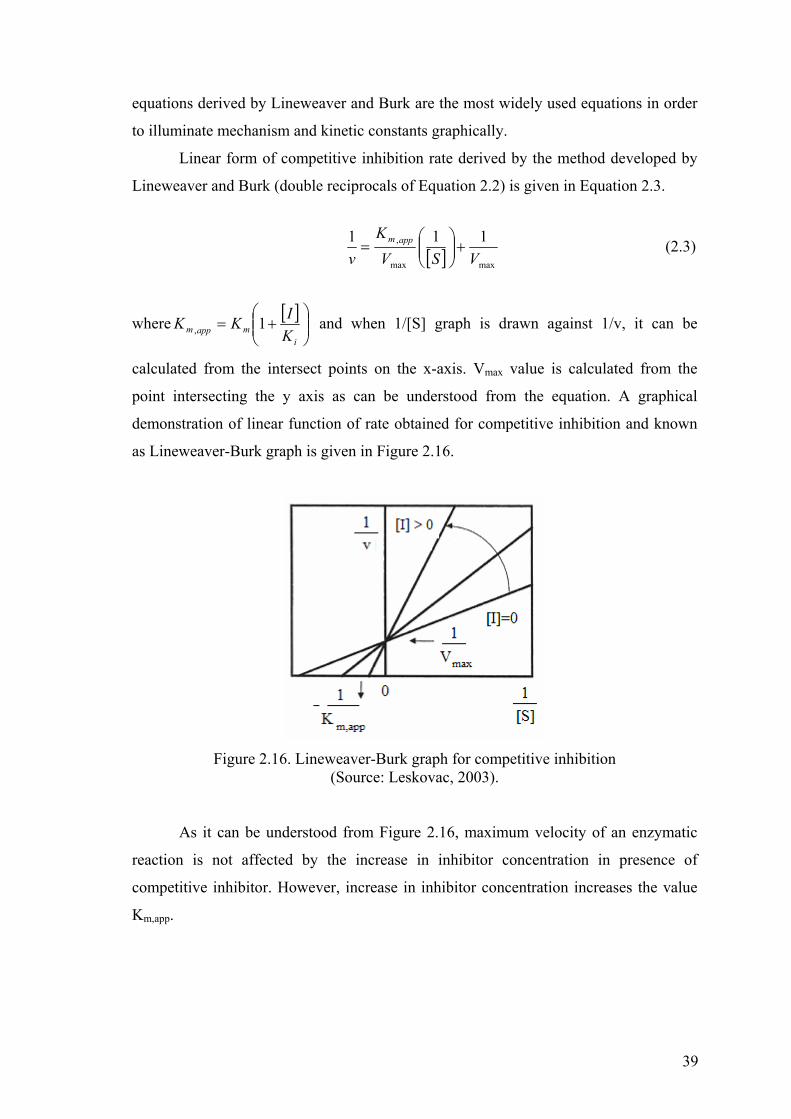
39
equations derived by Lineweaver and Burk are the most widely used equations in order
to illuminate mechanism and kinetic constants graphically.
Linear form of competitive inhibition rate derived by the method developed by
Lineweaver and Burk (double reciprocals of Equation 2.2) is given in Equation 2.3.
[ ] maxmax
, 111VSV
Kv
appm +⎟⎟⎠
⎞⎜⎜⎝
⎛= (2.3)
where [ ]⎟⎟⎠
⎞⎜⎜⎝
⎛+=
imappm K
IKK 1, and when 1/[S] graph is drawn against 1/v, it can be
calculated from the intersect points on the x-axis. Vmax value is calculated from the
point intersecting the y axis as can be understood from the equation. A graphical
demonstration of linear function of rate obtained for competitive inhibition and known
as Lineweaver-Burk graph is given in Figure 2.16.
Figure 2.16. Lineweaver-Burk graph for competitive inhibition
(Source: Leskovac, 2003).
As it can be understood from Figure 2.16, maximum velocity of an enzymatic
reaction is not affected by the increase in inhibitor concentration in presence of
competitive inhibitor. However, increase in inhibitor concentration increases the value
Km,app.
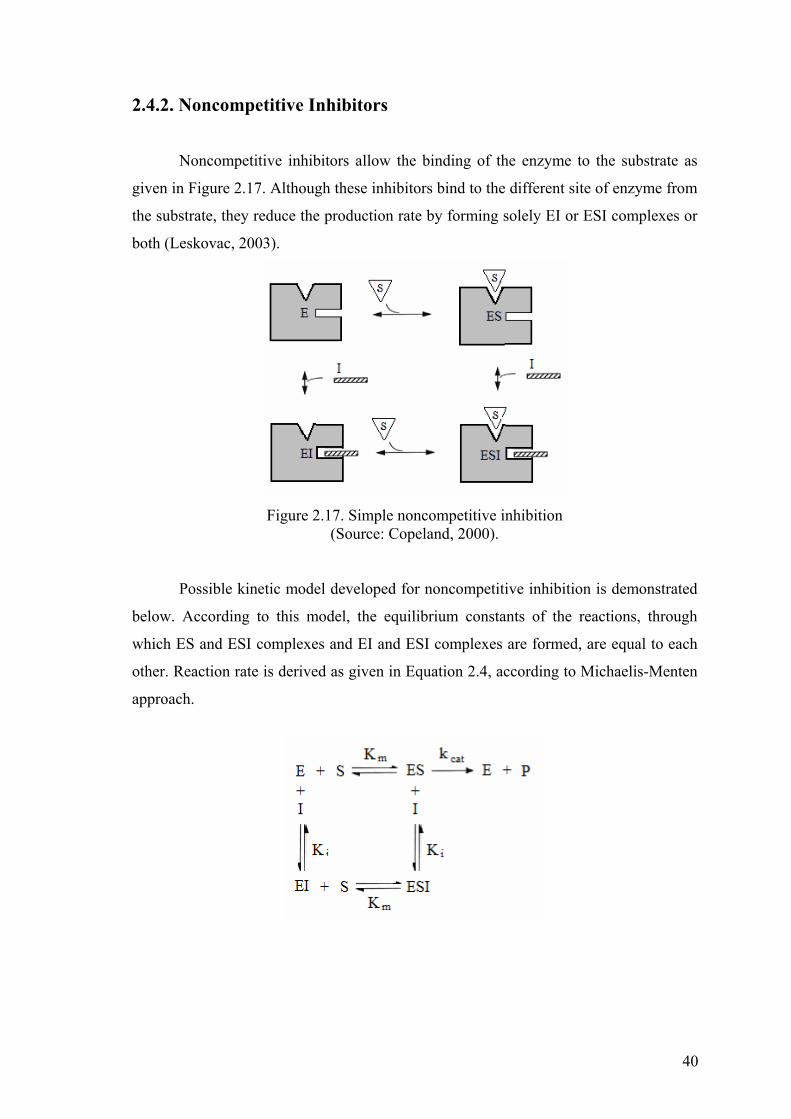
40
2.4.2. Noncompetitive Inhibitors
Noncompetitive inhibitors allow the binding of the enzyme to the substrate as
given in Figure 2.17. Although these inhibitors bind to the different site of enzyme from
the substrate, they reduce the production rate by forming solely EI or ESI complexes or
both (Leskovac, 2003).
Figure 2.17. Simple noncompetitive inhibition
(Source: Copeland, 2000).
Possible kinetic model developed for noncompetitive inhibition is demonstrated
below. According to this model, the equilibrium constants of the reactions, through
which ES and ESI complexes and EI and ESI complexes are formed, are equal to each
other. Reaction rate is derived as given in Equation 2.4, according to Michaelis-Menten
approach.
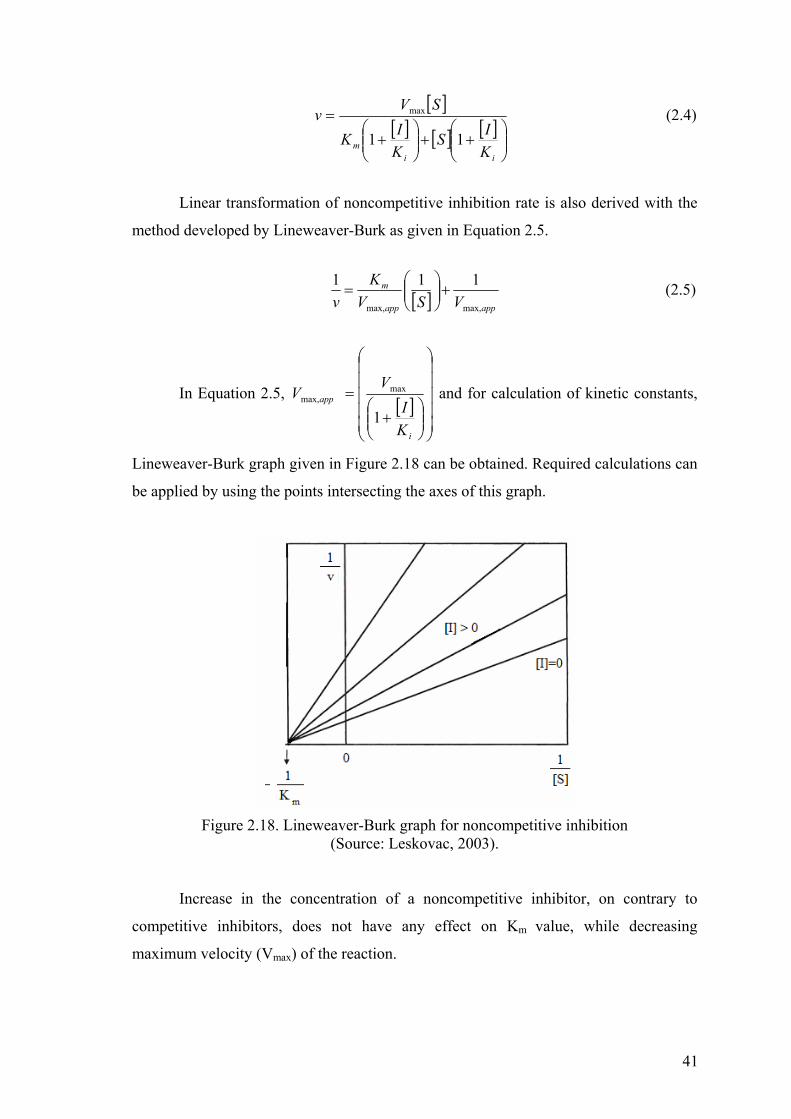
41
[ ]
[ ] [ ] [ ]⎟⎟⎠
⎞⎜⎜⎝
⎛++⎟⎟
⎠
⎞⎜⎜⎝
⎛+
=
iim K
ISKIK
SVv
11
max (2.4)
Linear transformation of noncompetitive inhibition rate is also derived with the
method developed by Lineweaver-Burk as given in Equation 2.5.
[ ] appapp
m
VSVK
v max,max,
111+⎟⎟⎠
⎞⎜⎜⎝
⎛= (2.5)
In Equation 2.5, [ ]
⎟⎟⎟⎟⎟
⎠
⎞
⎜⎜⎜⎜⎜
⎝
⎛
⎟⎟⎠
⎞⎜⎜⎝
⎛+
=
i
app
KI
VV
1
maxmax, and for calculation of kinetic constants,
Lineweaver-Burk graph given in Figure 2.18 can be obtained. Required calculations can
be applied by using the points intersecting the axes of this graph.
Figure 2.18. Lineweaver-Burk graph for noncompetitive inhibition
(Source: Leskovac, 2003).
Increase in the concentration of a noncompetitive inhibitor, on contrary to
competitive inhibitors, does not have any effect on Km value, while decreasing
maximum velocity (Vmax) of the reaction.

42
2.4.3. Uncompetitive Inhibitors
Uncompetitive inhibitors are bound to the appropriate active site which is lately
formed on ES complex structure after the binding of substrate as demonstrated in Figure
2.19. Newly formed ESI is an inactive complex and thereby it reduces the catalytic
activity of the enzyme by preventing product formation.
Figure 2.19. Simple uncompetitive inhibition (Source: Copeland, 2000).
Kinetic model developed for possible uncompetitive inhibition is given below.
Equilibrium constant of the reaction where ESI complex is formed is also defined as
inhibition constant (Ki). In rate equation derived according to Michaelis-Menten
approach (Equation 2.6) inhibition constant is indicated with an alpha (α) constant. (α)
constant, which also exists in rate equations of competitive and noncompetitive
inhibition but provides simplification of equations according to the value it takes, is the
most important mathematical parameter determining the inhibition mechanism
(Copeland, 2000). (α) constant is used in rate equations in order to explain the affinity
of the enzyme to the substrate with binding degree of the inhibitor.

43
[ ]
[ ] [ ]⎟⎟⎠
⎞⎜⎜⎝
⎛++
=
im K
ISK
SVv
α1
max (2.6)
According to this, for values of (α) much higher than 1, (α>>1) inhibition
mechanism is explained as competitive, and for its values much lower than 1 (0<α<<1)
it is explained as uncompetitive. For noncompetitive inhibition (α) constant equals to 1.
In mixed type inhibitions where degree of competitiveness or noncompetitiveness can
be determined, it is known that the (α) constant takes a certain lower or higher values
close to 1 (α<1 or α>1) (Copeland, 2000).
Linearized rate equation derived in order to explain the uncompetitive inhibition
mechanism graphically is given in Equation 2.7.
[ ] appapp
appm
VSVK
v max,max,
, 111+⎟⎟
⎠
⎞⎜⎜⎝
⎛= (2.7)
where [ ]
⎟⎟⎟⎟⎟
⎠
⎞
⎜⎜⎜⎜⎜
⎝
⎛
⎟⎟⎠
⎞⎜⎜⎝
⎛+
=
i
mappm
KI
KK
α1
, and [ ]
⎟⎟⎟⎟⎟
⎠
⎞
⎜⎜⎜⎜⎜
⎝
⎛
⎟⎟⎠
⎞⎜⎜⎝
⎛+
=
i
app
KI
VV
α1
maxmax, . In Figure 2.20, Lineweaver-
Burk graph obtained in order to calculate kinetic constants given in linear rate equations
of uncompetitive inhibition is given.
Figure 2.20. Lineweaver-Burk graph for uncompetitive inhibition
(Source: Leskovac, 2003).

44
2.4.4. Mixed Type Inhibitors (Noncompetitive and Competitive)
In mixed type inhibitions which are similar to noncompetitive inhibition as
kinetic model, affinity of inhibitor material to E and ES complex are different. (α)
constant expressed in explaining uncompetitive inhibition can give information about
the dominant mechanism of mixed type inhibition. In this inhibition type, whose
reaction rate equation (Equation 2.8), (α) constant takes a certain lower or higher values
close to 1 (α<1 or α>1).
[ ]
[ ] [ ] [ ]⎟⎟⎠
⎞⎜⎜⎝
⎛++⎟⎟
⎠
⎞⎜⎜⎝
⎛+
=
iim K
ISKIK
SVv
α11
max (2.8)
Linearized rate equation, derived in order to explain this mechanism graphically
where competitive and noncompetitive inhibitions occur simultaneously, is given in
Equation 2.9.
[ ] app
appm
VSVK
v max,max
, 111+⎟⎟
⎠
⎞⎜⎜⎝
⎛= (2.9)
In this equation it is defined that; [ ]⎟⎟⎠
⎞⎜⎜⎝
⎛+=
imappm K
IKK 1, and [ ]
⎟⎟⎟⎟⎟
⎠
⎞
⎜⎜⎜⎜⎜
⎝
⎛
⎟⎟⎠
⎞⎜⎜⎝
⎛+
=
i
app
KI
VV
α1
maxmax, .
Lineweaver-Burk graph obtained by linear rate equation of mixed type inhibition is
given in Figure 2.21.

45
Figure 2.21. Lineweaver-Burk graph for mixed type inhibition
(Source: Leskovac, 2003).
As it can be understood from Figure 2.21, an inhibitor behavouring in mixed
type manner affects both Km and Vmax values, however while Km increases, Vmax
decreases.
2.4.5. Inhibitor Substrates
Despite there is no inhibitor in the reaction medium, a decrease in catalytic
activity is observed. It is indicated that high substrate concentration is the main reason
of this situation. Because the substrate can bind to both enzyme and ES complex
simultaneously, inactive ES2 complex forms as indicated in the kinetic model below.
Inhibition of enzyme by its substrate can again be expressed mathematically by
Michaelis-Menten approach and the derived rate equation is given in Equation 2.10.

46
[ ]
[ ] [ ][ ]
[ ]i
m
im K
SS
KV
KSSK
SVv
++=
⎟⎟⎠
⎞⎜⎜⎝
⎛++
=11
maxmax (2.10)
As can be understood from Equation 2.10, enzyme kinetics where substrate
inhibition is observed can be explained mathematically by hyperbolic functions. In this
respect, Lineweaver-Burk graph developed for determining kinetic constants in case of
substrate inhibition is obtained through hyperbolic linearization techniques (Figure
2.22).
Figure 2.22. Lineweaver-Burk graph for substrate inhibition
(Source: Shuler, 2001).
In order to find the kinetic constants in points intersecting the axes, from the
hyperbolic function obtained according to the substrate concentration, a linear line
equation which is tangent of the area belonging to the low substrate concentrations is
derived. From the points of this tangent intersecting the axes, Vmax and Km values can be
calculated.

47
CHAPTER 3
OBJECTIVES
The main aim of this study is to investigate the inhibition potentials of alkaloid
and polyphenolic based extracts and fractions obtained especially from harmal (P.
harmala) seeds and olive (O. europaea) leaves and also from leaves of some plants
which are known to have high polyphenolic content like olive against COMT enzyme
activity. In accordance to this aim, the goals of the study are listed below:
To extract of harmal seed alkaloids and olive leaf polyphenols by the highest
yield methods,
To examine the parameters affecting extraction efficiency such as
temperature, pH and solvent type,
To fractionate extracts obtained from harmal seed and olive leaf and thus to
obtain alkaloid and polyphenolic compounds at high purity,
To characterize alkaloid and polyphenolic based extracts and fractions
quantitatively and qualitatively,
To determine active protein amount of COMT enzyme,
To determine the COMT enzyme activity spectrophotometrically and
fluorometrically and to perform inhibition studies with the most sensitive
method,
To examine the inhibition potentials of eighteen alkaloid and polyphenolic
based standards, extracts and fractions against COMT enzyme activity,
To compare kinetic parameters obtained as a result of inhibition study with
values reported in literature and to report these data into the literature.

48
CHAPTER 4
EXPERIMENTAL STUDY
4.1. Materials
The olive leaf (Olea europaea) and the other 4 plant leaves that were used in the
inhibition studies; vitex (Vitex agnus-castus), terebinth (Pistacia terebinthus), mastic
(Pistacia lentiscus) and cistus (Cistus parviflorus) were collected in May, 2006 from
Izmir Institute of Technology Campus (Urla) and Karaburun region. The harmal
(Peganum harmala) seeds were purchased from local herbalist. Analytical grade ethanol
(C2H5OH) used in extraction of the plants other than the harmal was obtained from
Sigma-Aldrich Chemie GmbH (Germany). HPLC-grade methanol (CH3OH),
ammonium hydroxide (NH4OH) and chloroform (CHCl3) solvents used in the extraction
of alkaloids present in the harmal seed were also purchased from Sigma-Aldrich
Chemie GmbH (Germany). Petrolium ether and hydrochloric acid (HCl) used in the
extraction of the alkaloids were taken from Riedel-de Haen (Germany) and Merck
KGaA (Germany), respectively. Several solvents were used in the analysis of the
exctracts obtained from the plants and their fractions by High Performance Liquid
Chromatography (HPLC) as mobile phases. These were acetonitrile (CH3CN) that was
purchased from Sigma-Aldrich Chemie GmbH (Germany), isopropyl alcohol (C3H7OH)
and triethylamine (N(CH2CH3)3) that were obtained from Riedel-de Haen (Germany),
formic acid (HCOOH) and acetic acid (CH3COOH) that were purchased from Merck
KGaA (Germany).
In the experiment of determination of the protein amount by Bradford method,
Bovine Serum Albumin (BSA) which was obtained from Merck KGaA (Germany) was
used as the reference protein. Catechol-O-methyltransferase (COMT) enzyme isolated
from porcine liver and the substrate used as methyl source, S-adenosyl-L-methionine
(SAM), was supplied from Sigma-Aldrich Chemie GmbH (Germany). Other reactants
used in the fluorometric enzyme activity assays, aesculetin (6,7-dihydroxycoumarin),
magnesium chloride (MgCl2) and L-cysteine, were also purchased from Sigma-Aldrich
Chemie GmbH (Germany). Potassium phosphate (K2HPO4/KH2PO4) used as the buffer

49
solution was obtained from Fluka/Merck (Germany). Dimethylsulfoxide (DMSO) used
as the solvent of the inhibitor was supplied from Carlo-Erba Reagents (Spain). The
reactants used in the enzyme activity experiments performed by spectrophotometric
method, dihydroxyacetophenone (substrate-DHAP), dithiothreitol (DTT), and N-
Tris(hydroxymethyl)-methyl-2-aminoethane sulphonic acid (TES) used as buffer
solution, and boric acid were purchased from Sigma-Aldrich Chemie GmbH
(Germany). Sodium hydroxide (NaOH) used in order to adjust the pH of the buffer
solution was supplied from Riedel-de Haen (Germany).
The standards used in the enzyme inhibition experiments, 3,5-dinitrocatechol
(3,5-DNC), harmine ve harmol hydrochloride dihydrate, were purchased from Sigma-
Aldrich Chemie GmbH (Germany), and harmaline ve harmalol hydrochloride dihydrate
from Fluka (Germany). The oleuropein and rutin standards were supplied from
Extrasynthese (Genay, France) and Merck KGaA (Germany), respectively.
4.2. Methods
The methods developed and used in this study consist of six steps. In the first
three steps, the plant extracts and their fractions that were used as inhibitors were
obtained and characterized by using High Performance Liquid Chromatography
(HPLC). In the other steps, protein amount and activity of the enzyme were determined
and enzyme inhibition kinetic studies were performed using the plant extracts and their
fractions. Two different analysis methods were applied in the activity determination and
inhibition studies and their sensitivities were compared. The schematic representation of
the strategy and methods followed during the study is shown in Figure 4.1.
4.2.1. Extraction of the Inhibitors
4.2.1.1. Extraction of Harmal (P. harmala) Seeds
For the extraction of alkaloids present in the seed of harmal (P. harmala),
different extraction methods reported in the literature were reviewed, applied in this
study and the generally used methods including maceration, soaking and Soxhlet
extraction were compared based on the yield. The details of the methods were given

50
below by which some parameters affecting to the extraction efficiency such as solvent
type, temperature, extraction period and pH were investigated.
Figure 4.1. Schematic representation of the experimental studies
Method A (Maceration using Methanol): In this method where methanol was
used as solvent, the effects of extraction period and pH on the extraction yield were
studied.
Step 1: An amount of dried and ground P. harmala seeds,
System 1 (S1): was macerated using 50 ml methanol for 1 hour for
each four times in a stirred jacketed heater which was kept at constant
temperature of 50 ºC
System 2 (S2): was macerated using methanol for 24 hours in a water
bath at 50 oC and 150 rpm.
Step 2: The methanol solutions obtained from these two systems were filtered.
The methanol was removed from the filtered solutions by means of SpeedVac
vacuum evaporator. The remaining part was filtered after being dissolved in 50

51
ml of 2% HCl. The acidic solution was subjected two times to liquid-liquid
extraction using 20 ml of petrolium ether and the acidic part was collected using
a separation funnel.
Step 3: In the third step, in order to examine the effect of pH on the extraction
yield, pH values of the solutions obtained from the two systems were increased
by addition of ammonium hydroxide. The pH values of the final solutions are
given below.
System 1-1 (S1-1): pH = 10.0
System 2-1 (S2-1): pH = 11.0
System 2-2 (S2-2): pH = 8.5
Step 4: Finally the three solutions obtained with different acidity were subjected
to liquid-liquid extraction using 50 ml of chloroform for four times. The
chloroform parts were collected by using again a separation funnel and then
chloroform was evaporated to obtain crude alkaloid extracts.
Method B (Soaking): In the extraction experiments performed according to the
soaking method, 3 different systems were studied using 3 different solvents.
System 1 (S1): The same procedure as in the S1-1 system of the
Method A was also applied in all the steps in Method B except for the
first step. In the first step methanol was soaked to dry and ground
harmal seed in a water bath at 55 oC and 150 rpm for 30 hours.
System 2 (S2): Firstly, in order to separate oil and relevant plant
materials present in the harmal seeds, petrolium ether was used as first
extraction solvent. After soaking petrolium ether to the seeds at 25 oC
for 48 hours, filtration was applied and methanol was soaked to the
seeds at 50 oC for 8 hours. After removal of the methanol the
remaining solid particles were dissolved in the acidic solution as
described in the Method A, S1-1 and pH of the solution was adjusted to
10.0 using basic solution. After that it was subjected to liquid-liquid
extraction using chloroform.
System 3 (S3): In this system, ethyl acetate was used as the extraction
solvent. After being mixed with some sodium bicarbonate, it was
soaked twice to harmal seeds at 25 oC for 24 hours. After the each 24-
hour soaking period, the basic ethyl acetate parts were collected by

52
filtration and they were subjected to liquid-liquid extraction using 25
ml of %5 HCl. The pH of the solution after the acidic portion was
removed by means of a separation funnel was adjusted to 3.5 by
addition of some 5M of NaOH solution.
Method C (Soxhlet Extraction): Methanol was used as solvent in this method
in which Soxhlet apparatus was used. The effect of the extraction period on the
extraction yield was examined. For this purpose, some ground harmal seeds were
extracted at 70 oC for
System 1 (S1): 7.5 hours
System 2 (S2): 20 hours
System 3 (S3): 26 hours.
After that, the steps given in Method A were followed. In this method, the pH of
the solution was adjusted to 10.0 before the extraction with chloroform.
The results obtained from different methods applied for the extraction of
alkaloids in the harmal (P. harmala) seeds were compared with each other. The extracts
obtained by the method which provided the optimum yield were stored in dark glass
bottles in a cool environment.
4.2.1.2. Extraction of Olive (O. europaea) Leaves
The extracts from the leaves of olive and of other plants (vitex, cistus, terebinth
and mastic) were obtained by the same manner as reported in the literature (Altıok et al.,
2008; Baycin et al., 2007). First, the washed and dried leaves were ground and then
subjected to extraction with % 70 aqueous ethanol solution. The extraction process was
carried out in a thermoshaker at 25 oC and 250 rpm for 2 hours keeping solid/liquid
ratio at 1/20. The extract obtained in the 70% aqueous ethanol solution after filtration
was subjected to rotary vacuum evaporator in order to remove the ethanol. The extract
in the remaining aqueous solution was dried in a freeze drier (Telstar Cryodos) of which
the operational conditions were kept at –52 oC and at a lower pressure than 0.2 mbar. As
a result of freeze drying, the crude extract was obtained and kept in dark glass bottles in
a cool environment for further use in the enzyme inhibition experiments.

53
4.2.2. Fractionation of the Extracts
Different fractionation techniques were applied for each of the extracts rich in
alkaloids and polyphenolics that were obtained by the optimized extraction methods.
4.2.2.1. Fractionation of the Harmal (P. harmala) Seed Extract
The raw extract of the harmal seed was fractionated by use of a fraction collector
unit (Gilson) compatible with the High Performance Liquid Chromatograph (HPLC)
(Agilent 1100 series). The operating conditions and properties of HPLC used for
alkaloid fractionation are given in Table 4.1.
Table 4.1. The operating conditions and properties of HPLC (Alkaloid Fractionation)
Units and Parameters Properties and Conditions
Column Zorbax SB-C18 semipreparative column
Column length 25 cm
Column diameter 9.4 mm
Particle size 5 µm
Mobile phase A: Acetonitrile/isopropyl alcohol (1:1) (by volume)
Mobile phase(s) Mobile phase B: Acetonitrile/isopropyl alcohol/Deionized
water/Formic acid (100:100:300:0.3) (ml) (pH of the solution was
adjusted to 8.6 by addition of triethylamine)
Flow rate 1 ml/min
Temperature 30 °C
Pressure 60-70 bar
Detector type Diode Array Detector (DAD)
Wavelength 330 nm
The optimum elution program for the alkaloid fractionation was determined by
changing the polarities of the mobile phases. The changes in the concentration of the
mobile phases during analysis are given in Table 4.2.

54
Table 4.2. HPLC elution program (Alkaloid Fractionation)
Time (min) Mobile Phase A (%) Mobile Phase B (%)
0 5 95
18 5 95
21 30 70
24 38 62
27 36 64
30 35 65
35 0 100
40 0 100
According to the results of the HPLC analysis performed for the crude alkaloid
extract, the harmal seed alkaloids were collected in 3 fractions. These fractions collected
being dissolved in the mobile phase, were obtained as their powder forms after removal
of solvents by using vacuum evaporator. The powdered alkaloid fractions in were stored
under appropriate condition until further use in HPLC characterization and enzyme
inhibition experiments.
4.2.2.2. Fractionation of the Olive (O. europaea) Leaf Extract
The polyphenolics in olive leaf were fractionated using silk fibroin packed
column as previously reported in literature (Baycin et al., 2007). Firstly, the column
packed with 15 g of silk fibroin was eluted by deionized water, ethanol and again
deionized water, respectively in order to remove the impurities on the packed material
and to activate it. Then 20 g of the crude extract dissolved in 250 ml water was fed to
the column until saturation. In order to firstly fractionate the water-soluble
polyphenolics having high polarity such as oleuropein, the column was eluted with
water for 9 times. The 9 water fractions were then combined into 4 main fractions based
on their compositions determined by the HPLC analysis.
After that, in order to fractionate the less polar polyphenolics such as rutin and
other glycosides, the column was eluted with % 70 aqueous ethanol solution for 4 times.
The fractions obtained were also combined into 2 main fractions according to the HPLC
analysis results. The fractions rich in oleuropein and rutin were lyophilized and stored
55
in appropriate conditions for further use in the enzyme inhibition and HPLC
characterization experiments.
4.2.3. Characterization of the Inhibitors
The plant extracts and their fractions obtained for investigation of their enzyme
inhibition potentials were first characterized by HPLC.
4.2.3.1. Characterization of the Harmal (P. harmala) Seed Extract
Qualitative and quantitative characterization study of the crude harmal seed
extract and their fractions were performed by HPLC. The obtained samples were
filtered through 0.45 µm membrane filters prior to the analysis. The properties of the
HPLC system and the operating conditions for analysis proper for the characterization
of the alkaloids are given in Table 4.3.
Table 4.3. Operating conditions and properties of the HPLC (Alkaloid Characterization)
Units and Parameters Property and Conditions
Column LiChrospher 100 RP-18 analytical column
Column length 25 cm
Column diameter 4 mm
Particle size 5 µm
Mobil phase A: Acetonitrile/isopropyl alcohol (1:1) (by volume)
Mobile phase(s) Mobile pahse B: Acetonitrile/isopropyl alcohol/Deionized
water/Formic acid (100:100:300:0.3) (ml) (pH of the solution was
adjusted to 8.6 by addition of triethylamine)
Flow rate 1 ml/min
Temperature 30 °C
Pressure 170-180 bar
Detector type Diode Array Detector (DAD)
Wavelength 330 nm

56
The elution program by which the optimum separation in the fractionation was
yielded was determined by changing the polarities of the mobile phases. The changes in
the concentrations of the mobile phases are given in Table 4.4.
Table 4.4. HPLC elution program (Alkaloid Characterization)
Time (min) Mobile Phase A (%) Mobile Phase B (%)
0 10 90
3 10 90
6 15 85
15 15 85
18 18 82
20 0 100
The measurement wavelength of 330 nm applied in both fractionation and
characterization of the alkaloids was chosen based on the spectrophotometric scanning
of the crude extract, its fractions and alkaloid standards performed by using microplate
reader (Multiskan, Thermo). Furthermore, calibration curves for each alkaloid standard
were obtained, and detection and quantification limits for the each standard were
determined as a result of the HPLC analysis (Appendix A. Calibration Curves of
Alkaloids and Sample Calculation).
4.2.3.2. Characterization of the Olive (O. europaea) Leaf Extract
Characterization of the polyphenolics in the olive leaf extract such as oleuropein
and rutin was also carried out by HPLC in a manner reported in the literature (Altıok et
al., 2008; Baycin et al., 2007). The properties of the HPLC system and the operating
conditions of analysis proper for the characterization of the polyphenolics are given in
Table 4.5.

57
Table 4.5.Operating conditions and properties of HPLC (Polyphenolic Characterization)
Units and Parameters Property and Conditions
Column LiChrospher 100 RP-18 analytical column
Column length 25 cm
Column diameter 4 mm
Particle size 5 µm
Mobile phase A: % 2.5 aqueous acetic acid solution Mobile phase(s)
Mobile phase B: Acetonitrile
Flow rate 1 ml/min
Temperature 30 °C
Pressure 120-130 bar
Detector type Diode Array Detector (DAD)
Wavelength 280 nm
In order to characterize the polyphenolics present in the olive leaf extracts, the
optimum elution program for HPLC analysis which was reported in the literature was
given in Table 4.6.
Table 4.6. HPLC elution program (Polyphenolic Characterization)
Time (min) Mobile Phase A (%) Mobile Phase B (%)
0 95 5
20 75 25
40 50 50
50 20 80
60 5 95
The concentrations of oleuropein and rutin, which are the major polyphenolics
present in olive leaf extract which is composed of several polyphenolics, were
determined based on the calibration curves prepared using their standards (Appendix B.
Calibration Curves of Oleuropein and Rutin and Sample Calculation).

58
4.2.4. Determination of Protein Amount
It is important to determine the amount of active protein for accurate kinetic
calculations of an enzymatic reaction. Among the several methods reported in the
literature for protein analysis, Bradford method was preferred in this study due to its
high sensitivity (Rosenberg, 1996). The main principle of the Bradford method is the
measurement of change in the absorbance value of the protein solution resulted from
addition of an acidic dye which tends to bind to basic and aromatic amino acids into the
solutions with different protein concentrations. In this method, calibration curves for
both reference and sample proteins are prepared using the absorbance values obtained
from different protein concentrations (Pierce Biotechnology Inc., 2009).
Based on this principle, in the analysis of the active protein of the standard
COMT enzyme isolated from porcine liver by the Bradford method, Bovine Serum
Albumin (BSA) was used as the reference protein and Commassie Blue was used as the
acidic dye. The stock solutions of COMT and BSA proteins in 1 mg/ml concentration
were prepared. The calibration curves for the each protein were prepared based on the
spectrophotometric measurements at the optimum wavelength for the 5 different
concentrations prepared in the range of 0-16 μg/ml. In accordance with the results of the
spectral scanning performed in wavelength range of 400-700 nm by using a microplate
reader (Multiskan, Thermo), the optimum wavelength was determined as 595 nm.
The active protein amount of COMT enzyme was estimated from the ratio of the
slopes of the calibration curves prepared for both BSA and COMT.
4.2.5. Determination of Enzyme Activity of COMT and Inhibition Kinetics
The enzyme activity of COMT was determined spectrophotometrically and
fluorometrically according to the protocols given in the literature. The inhibition
experiments were performed by the fluorometric method which is more sensitive, less
time consuming and more cost effective.

59
4.2.5.1. COMT Activity Determination by Spectrophotometric Method
In order to determine the activity of COMT spectrophotometrically, the protocol
prepared by Sigma-Aldrich Chemie GmbH was applied. According to this protocol, the
absorbance values of the O-methylated products of DHAP formed as a result of the
possible COMT catalyzed methylation reaction given below were measured at 344 nm
by using a spectrophotometer (Multiskan, Thermo).
DHAP + SAM ⎯⎯ →⎯COMT SAH + 3H4MAP + 4H3MAP
According to this protocol which was prepared on the basis of stop rate
determination method, the reaction was carried out at 37 °C and at the pH value of 7.6.
Total reaction volume was kept constant at 1 ml. While concentrations of methyl donor
substrate of reaction, SAM were varied between 4-0.2 mM (serially dilutions were
made 5, 10, 15 and 20 times), the concentration of the methyl acceptor substrate, DHAP
was kept constant at 0.5 mM. The 150 U of COMT standard enzyme (contains 1.9 mg
solid) was prepared in TES buffer solution having concentration of 2.55 mg solid/ml. In
Table 4.7, the order and amount of reactants added to the reaction medium were given.
Table 4.7. Reaction medium for spectrophotometric method
Reactants Test solution (µl) Blank solution (µl)
TES1 200 300
DHAP 100 100
SAM 100 -
COMT 100 100
Sodium Borate2 500 500
The enzyme activities were calculated using the mathematical equation given in
the applied protocol and the results obtained for this method were given in Results and
Discussion section of the study.
1 0.2 M TES (buffer solution used in enzyme dilutions) contains 6 mM MgCl2 and 20 mM DTT. The pH was adjusted to 7.6 using 1 M of NaOH. 2 0.4 M Sodium borate (stop solution) was prepared by adjusting the pH of boric acid solution to 10.0 using 1 M of NaOH.

60
4.2.5.2. COMT Activity and Inhibition Kinetics Determination by Fluorometric Method
In determining COMT activity fluorometrically, some studies employed by
almost the same manner were taken as basis (Kurkela et al., 2004; Veser, 1987). In this
method, Aesculetin (ES) was used as the methyl acceptor substrate of possible COMT
catalyzed methylation reaction given below. The transformation rate of ES to scopoletin
was measured fluorometrically at 355 nm excitation and 460 nm emission wavelengths
by using microplate reader (Varioskan, Thermo) for totally 2 hours during which the
fluorescences were recorded at every 30 seconds time intervals.
ES + SAM ⎯⎯ →⎯COMT SAH + Scopoletin
The two fluorescence values measured at the first 30 min. time interval of the
steady state phase of reaction were used in kinetic calculations. One unit increment in
fluorescence was related to the produced scopoletin concentration by using the
calibration curve prepared with the scopoletin standard (Appendix C).
In activity determination and inhibition studies, the total volume of reactions,
which were carried out at 37°C and pH of 7.4, were 200 µl and 250 µl, respectively.
Potassium phosphate solution was prepared at a concentration of 100 mM containing 5
mM MgCl2 and 20 mM L-cystein was used as buffer solution in fluorometric method.
In the fluorometric analysis, first the linear working concentrations were determined for
both enzyme and substrates. As a result of this experiment, the optimum concentrations
of enzyme and ES were found as 11 µg protein/ml and 4 µM, respectively and the
concentrations of enzyme and ES in inhibition study were kept constant at these
optimum values. SAM concentrations were varied between 10-600 µM throughout the
study.
The required concentrations for plant extracts, fractions and their standards that
were used in inhibition study were determined for each of them. Thus, the 3,5-DNC was
prepared in the concentration range of 0.1-0.005 µg/ml, while the concentration of other
inhibitors were varied between 0.5-10 µg/ml. In Table 4.8, the amounts of reactants
added to reaction medium were given for both activity determination and inhibition
studies.

61
Table 4.8. Reaction medium for fluorometric method
Reactants Test solution
(µl)
Blank solution
(µl)
Test solution
(µl)
Blank solution
(µl)
SAM 50 - 50 -
ES 75 75 125 125
COMT 50 50 50 50
Buffer 25 75 - 50
Inhibitor(s) - - 25 25
4.2.6. Analysis of Enzyme Activity and Inhibition Kinetics Data
The reaction velocity data obtained from the results of studies employed for
determination of activity and inhibition kinetics were analyzed on the basis of the
knowledge given in Section 2.3 and 2.4. In data analysis, a nonlinear regression
program known as GraphPad Prism 5.0, in which the same enzyme kinetic model
equations with those of given in Section 2.4 referring also the same kinetic models
reported in Copeland, 2000’s book, were used. The obtained kinetic velocity data were
analyzed by fitting them to the appropriate kinetic models which were previously given
as Equation 2.1, 2.2, 2.4, 2.6 and 2.8. Thus, the kinetic parameters for activity and
inhibition could be calculated. In order to test the convenience of the chosen model,
Lineweaver-Burk graphs were also drawn for each kinetic data set. Moreover, the
goodness of fit of the model was statistically analyzed by applying analysis of variance
(ANOVA) to the data set which was fallowed by the Tukey’s multiple comparison tests.

62
CHAPTER 5
RESULTS AND DISCUSSION
Results of extraction, fractionation, characterization and enzyme
activity/inhibition determination experiments performed by methods explained in detail
in Chapter 4 are given in this section respectively.
5.1. Obtaining and Characterization of Extracts
5.1.1. Extraction of Harmal (P. harmala) Seed and its Characterization
In order to obtain the alkaloids in harmal (P. harmala) seeds various methods
whose details are given in methods section had been tried. According to this, results
obtained from studies with maceration, soaking and Soxhlet extractions were compared
with respect to their efficiencies.
It is known that harmal seed dominantly consists of harmine, harmaline, harmol
and harmalol alkaloids. In this respect, extracts obtained using different extraction
methods were initially characterized by using High Performance Liquid
Chromatography (HPLC). For the characterization, firstly calibration curves are
obtained for each alkaloid standards (Appendix A. Calibration Curves of Alkaloids and
Sample Calculation). According to this, amounts of major alkaloids present in crude
extracts obtained with each extraction method were calculated. Extraction conditions of
methods, in performing which some parameters such as solvent type, temperature,
extraction time and pH were changed, were summarized in Table 5.1.

63
Table 5.1. Operation conditions for alkaloid extraction methods
Extraction Method Solvent Type Temperature
(°C) pH
Extraction
Time (hours)
Method A*, S1-1 Methanol 50 10.0 4
Method A, S2-1 Methanol 50 11.0 4
Method A, S2-2 Methanol 50 8.5 4
Method B*, S1 Methanol 55 10.0 30
Method B, S2 Petrolium Ether
/Methanol 50 10.0 56
Method B, S3 Ethyl Acetate 25 3.4 48
Method C*, S1 Methanol 70 10.0 7.5
Method C, S2 Methanol 70 10.0 20
Method C, S3 Methanol 70 10.0 26
* Method A: maceration, Method B: Solvent soaking, Method C: Soxhlet The alkaloid contents and efficiencies of extracts obtained with methods given in
Table 5.1 were calculated using calibration curves obtained for alkaloid standards were
given in Table 5.2.
Table 5.2. Alkaloid contents and efficiencies of crude extracts obtained from harmal seed
Extraction
Method
Harmol
(mg)
Harmaline
(mg)
Harmine
(mg)
Total amount
of extract
(mg)
Initial seed
amount (mg)
efficiency (%) =
(mg alkaloid*100/
mg seed)
Meth. A, S1-1 14.85 61.48 38.72 115.05 2000 5.75
Meth. A, S2-1 - 53.45 35.43 88.88 1550 5.73
Meth. A, S2-2 - 43.82 26.95 70.77 1550 4.57
Meth. B, S1 8.88 77.01 52.27 138.16 2000 6.91
Meth. B, S2 - 44.47 28.07 72.54 9770 0.74
Meth. B, S3 - 23.03 11.63 34.66 3100 1.12
Meth. C, S1 - 97.06 68.70 165.76 2500 6.63
Meth. C, S2 - 126.57 86.50 213.07 3500 6.09
Meth. C, S3 18.30 81.85 55.52 155.68 3500 4.45

64
It is known according to the literature that harmal seed includes 2-7% of alkaloid
(Ott, 1996). When this percentage is taken into consideration, most of the extraction
methods given in Table 5.2 had been found adequate with respect to efficiency. Among
the extraction parameters, effect of pH on efficiency was analyzed in Method A.
Therefore, as it can be understood from Tables 5.1 and 5.2, extraction efficiency was
increased when the solution pH value was 10.0 or higher. Consequently, the optimum
pH value was determined as 10.0.
According to the results obtained for Method B developed in order to observe
the effect of solvent type, it was indicated that methanol was the most appropriate
solvent for alkaloid extraction. Moreover, the highest efficiency was obtained with the
S1 system of Method B in which methanol was used as solvent among the others.
Soxhlet apparatus (Method C) was used in order to analyze the effect of
extraction time on efficiency. It was found that as time passed more than one day
period, efficiencies of extracts decreased. As it can be seen from Tables 5.1 and 5.2,
efficiency values obtained with Method C-S1 and Method B-S1 were found very close
to each other.
Since, by applying Method C-S1, the required amount of efficiency could be
achieved in a shorter time among these two methods, so it was defined as the optimum
alkaloid extraction method. Sample chromatograms of crude alkaloid extract obtained
using optimum alkaloid extraction method and of the mixture of standards prepared in
order to characterize each alkaloids present in crude extract were given in Figure 5.1
and 5.2, respectively.

65
min0 2 4 6 8 10 12 14 16
mAU
0
100
200
300
400
500
600
DAD1 A, Sig=330,4 Ref=off (06-10-08\SIG01352.D)
3.9
98
4.6
64 5
.220
7.3
11
10.
529
(1)(2)
(4)
(3)
(*)
Figure 5.1. Sample chromatogram of the crude alkaloid extract (1) harmol, (2) harmalol, (3) harmine, (4) harmaline (analytical column)
min0 2 4 6 8 10 12 14 16
mAU
0
200
400
600
800
1000
DAD1 A, Sig=330,4 Ref=off (06-10-08\SIG01338.D)
3.8
00 4
.341
7.2
68
9.4
14
(1)
(2) (3)
(4)
Figure 5.2. Sample chromatogram of the mixture of alkaloid standards (1) harmol, (2) harmalol, (3) harmine, (4) harmaline (analytical column)
According to HPLC chromatogram obtained for the mixture of alkaloid
standards in Figure 5.2, retention times of alkaloids in non-polar column were
determined respectively as 3.8 min. for Harmol, 4.3 min. for Harmalol, 7.3 and 9.4 min.
for Harmine and Harmaline. Therefore, alkaloids in harmal seed extract were

66
characterized according to their retention times (Figure 5.1). Accordingly, elusion with
highly polar mobile phases caused high polarity alkaloids to leave the column in a
shorter time.
It was also observed from the HPLC analysis of crude alkaloid extracts and
alkaloid standards mixture of which the obtained chromatograms given in Figure 5.1
and 5.2, a shift occurred in retention times of alkaloids in crude extract. It was thought
that the shift in the retention times may be caused by other compounds obtained from
plant material during extraction process, their amounts and intermolecular interaction.
As it can be observed from the sample chromatogram (Figure 5.1) given for the
crude extract, harmine and harmaline were dominantly present alkaloids in harmal seed
and their amounts were given in Table 5.2. Besides, harmol and harmalol content of the
extract obtained by the Soxhlet method was found below the detection limits
determined by their corresponding alkaloid standards, therefore amounts of them could
not be calculated. Detection and quantification limits of standard alkaloids determined
by their calibration concentrations were given in bold characters in Table 5.3.
Table 5.3. Concentration ranges of alkaloids used for calibration
Alkaloid Type Harmol (1) Harmalol (2) Harmine (3) Harmaline (4)
1050 1270 983 1180
525 635 492 590
210 254 196 236
105 127 98 118
Con
cent
ratio
n
rang
e (µ
g/m
l)
42 51 39 47
Moreover, an unidentified peak other than those of the four main alkaloids was
observed and could be seen on the chromatogram of crude extract given in Figure 5.1. It
was thought that this peak marked as (*) may be a derivative of harmol or harmalol
alkaloids. However, it had not been characterized since it was not as dominant as the
main alkaloids in the crude extract.

67
5.1.2. Extraction of Olive (O. europaea) Leaf and its Characterization
As given in the methods section, extraction process for obtaining olive leaf
polyphenolics was performed according to the optimum conditions in the literature
(Altiok et al., 2008; Baycin et al., 2007). Accordingly, the powdered olive leaves
obtained after some pretreatment processes were extracted in 70 % aqueous ethanol
solution for 2 hours at 250 rpm and 30 °C, solid/liquid ratio was 1/20 for the extraction
of polyphenolics.
The obtained crude extract of polyphenolics were characterized by using HPLC
as well as it was performed for the alkaloids and it was found that olive leaf extract
were rich in oleuropein and rutin. Quantifications of these two main polyphenolics in
the extract were determined by calibration of their corresponding standards. Calibration
curves obtained for oleuropein and rutin standards were given in Appendix B with
sample calculations. Sample chromatogram of the crude extract obtained from olive leaf
was demonstrated in Figure 5.3.
min0 10 20 30 40 50
mAU
0
500
1000
1500
2000
2.6
86
5.0
19
9.8
02
15.
093
17.
517
19.
450
20.
490
21.
578
23.
469
(1)
(2)
Figure 5.3. Sample chromatogram of crude olive leaf extract (1) rutin, (2) oleuropein (Mobile phase flow rate: 1 ml/min, column temperature 30 °C, analytical column)

68
As it can be seen from the chromatogram, it was found that oleuropein was the
most dominant polyphenol present in the olive leaf extract. Based on the polarities of
polyphenolics, it was observed that rutin was more polar than oleuropein and retention
times of both on the column were determined as 17.5 and 21.6 minutes. Other peaks
which were not quantitatively dominant were characterized as glycosides and glycoside
derivative polyphenolics such as luteolin-7-glycoside, verbascoside, apigenin-7-
glycoside and luteolin in the study of Altiok et al., 2008.
Moreover, according to calibration curves obtained for oleuropein and rutin
standards, their amounts in the crude olive leaf extract were found as 9.0% and 0.9%,
respectively.
5.2. Fractionation and Characterization of Extracts
The fractionation techniques applied for extracts rich in alkaloids and
polyphenolics which were extracted at optimum conditions were given in detail in
methods section.
5.2.1. Fractionation and Characterization of Harmal Seed Extract
Harmal seed alkaloids obtained with Soxhlet extraction method (70 °C, 7.5
hours) were collected as three different fractions by using HPLC compatible fractioning
apparatus as given in the methods section. Fractions were characterized also by using
HPLC-analytical column. In Figure 5.4, the chromatogram of the crude harmal seed
extract performed in HPLC-semipreparative column conditions was given.

69
min0 5 10 15 20 25 30 35
mAU
0
500
1000
1500
2000
2500
15.
552
16.
238
21.
551
28.
259
(1)(2)
(3) (4)
FP 2 FP 3FP 1
Figure 5.4. Sample chromatogram of crude harmal seed extract before fractioning (1) harmol, (2) harmalol, (3) harmine, (4) harmaline (Mobile phase flow rate: 1 ml/min, column temperature 30 °C, semipreparative column)
According to the HPLC analysis of crude alkaloid extract with semipreparative
column, retention times of alkaloids were found 15.6 min. for harmol, 16.2 min. for
harmalol and 21.6 min. and 28.3 min. for harmine and harmaline, respectively. Crude
extract was separated into 3 parts according to the retention times and their majorities in
the extract during fractioning. As shown on the chromatogram given in Figure 5.4,
while 1st and 2nd alkaloids detected between 14th and 18th minutes were determined as
the first P. harmala fraction (FP 1), harmine fraction (FP 2) was collected between 20th
and 24th minutes. Harmaline fraction (FP 3) was obtained by collecting between 27th
and 31st minutes.
The quantifications of the compounds in each fraction were determined
according to calibration curves obtained for alkaloid standards after being analyzed
them by using HPLC-analytical column. In Figure 5.5 and 5.6, chromatograms of
harmine and harmaline fractions obtained as a result of HPLC analytical column
analyses were given, respectively.

70
min0 2 4 6 8 10 12 14 16 18
mAU
0
10
20
30
40
50
60
70 8.3
13
13.
478
(3)
(4)
Figure 5.5. Sample chromatogram of harmine fraction (FP 2) (3) harmine, (4) harmaline (Mobile phase flow rate: 1 ml/min, column temperature 30 °C, analytical column)
min0 2 4 6 8 10 12 14 16 18
mAU
0
5
10
15
20
25 14.
612
(4)
Figure 5.6. Sample chromatogram of harmaline fraction (4) harmaline (Mobile phase flow rate: 1 ml/min, column temperature 30 °C, analytical column)
As it can be seen from the chromatograms of fractions, after fractioning there
was a shift in retention times of the 3rd and 4th alkaloids which were determined as
harmine and harmaline alkaloids by the crude extract analysis (Figure 5.1). According
to this, retention time of harmine peak was delayed to 8.3 minutes from 7.3 minutes,
and retention time of harmaline peak shifted to 14 minutes from 10.5 minutes. This

71
result indicated that the polarities of fractions, of which the purities had been attempted
to increase, decreased after fractioning.
Purities of the fractions obtained for the major alkaloids of crude extract were
calculated using the calibrations of the standards and the results were given in Table
5.4.
Table 5.4.Characterization results of major alkaloid fractions obtained from harmal seed
Fraction No. Peak Percentage of Fractions (%) Alkaloid Name
FP 2 FP 3 FP 2 FP 3
Harmine peak yes traces 77.0 6.1
Harmaline peak yes yes 22.5 93.2
Other than these, HPLC analyses of FP 1 where harmol and harmalol alkaloids
were dominant were also performed. However, according to the results, traces of many
peaks which were thought to be derivatives of harmala alkaloids were observed. Each
alkaloid fraction was collected, dried and stored in appropriate conditions in adequate
amounts in order to further use in enzyme inhibition experiments.
5.2.2. Fractionation and Characterization of Olive Leaf Extract
Extraction, characterization and fractionation of polyphenolics in olive leaf were
performed based on the studies of Altıok et al., 2008 and Baycin et al., 2007 as it was
explained in detail in methods section. As can be seen from the chromatogram of crude
extract (Figure 5.3), oleuropein and rutin polyphenols were found as dominant in olive
leaf. Other than these, many glycoside derivatives in the crude extract were
characterized in the study of Altıok et al., 2008. In the fractioning process performed
using silk fibroin packed column, 6 fractions were collected whose elution solvents
were given in Table 5.5.

72
Table 5.5. Elution solvents and contents of fractions obtained from olive leaf extract
Fraction No. Elution Solvents and Contents
FO 1 1st and 2nd water fraction
FO 2 3rd and 4th water fraction
FO 3 5th and 6th water fraction
FO 4 7th, 8th and 9th water fraction
FO 5 1st and 2nd 70% aqueous ethanol fraction
FO 6 3rd and 4th 70% aqueous ethanol fraction
Chromatograms of olive leaf fractions were given from Figure 5.7 to 5.12 with
respect to their order given in Table 5.5. As a results of HPLC analysis of fractions
which can also be understood from following chromatograms, it was found that water
fractions were characterized as rich in oleuropein, and aqueous ethanol fractions were
found rich in rutin and glycosides.
min0 5 10 15 20 25 30 35
mAU
0
250
500
750
1000
1250
1500
1750 21.
821
23.
661
(oleuropein)
Figure 5.7. Chromatogram of olive leaf fraction coded as FO 1
The purity of oleuropein of which the retention time was 21.6 minutes, was
calculated as 91.0 % in the first 2 water fractions (FO 1).

73
min0 5 10 15 20 25 30 35 40
mAU
0
250
500
750
1000
1250
1500
1750
17.
932
20.
919
22.
042
23.
876(1) (2)
(3)
Figure 5.8. Chromatogram of olive leaf fraction coded as FO 2 (1) rutin, (2) verbascoside, (3) oleuropein
As a result of further elution the silk fibroin column with water, oleuropein
percentage of olive leaf fraction was reduced while less amounts of polyphenolics such
as rutin and verbascoside were observed.
min0 5 10 15 20 25 30 35
mAU
0
200
400
600
800
1000
1200
1400
1600
1800
17.
944
19.
744
20.
950
22.
113
(1) (2)(3)
(4)
Figure 5.9. Chromatogram of olive leaf fraction coded as FO 3 (1) rutin, (2) luteolin-7-
glycoside, (3) verbascoside, (4) oleuropein
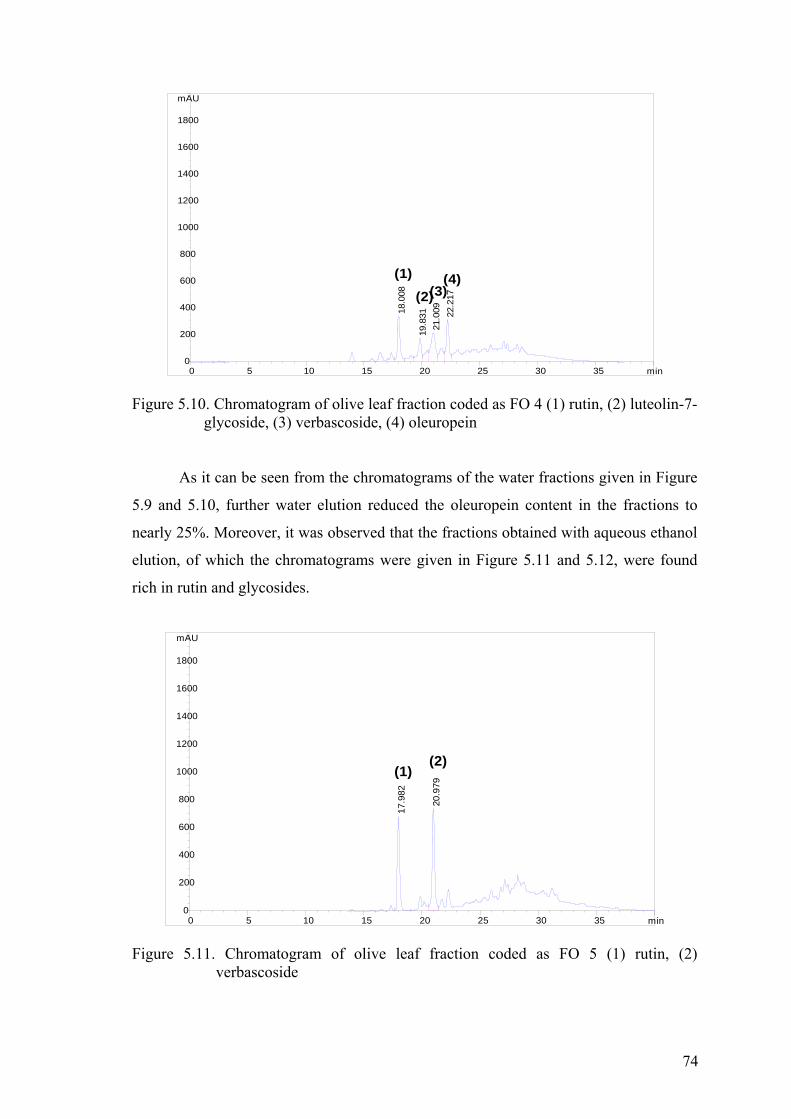
74
min0 5 10 15 20 25 30 35
mAU
0
200
400
600
800
1000
1200
1400
1600
1800
18.
008
19.
831
21.
009
22.
217
(1)(2)(3)
(4)
Figure 5.10. Chromatogram of olive leaf fraction coded as FO 4 (1) rutin, (2) luteolin-7-
glycoside, (3) verbascoside, (4) oleuropein
As it can be seen from the chromatograms of the water fractions given in Figure
5.9 and 5.10, further water elution reduced the oleuropein content in the fractions to
nearly 25%. Moreover, it was observed that the fractions obtained with aqueous ethanol
elution, of which the chromatograms were given in Figure 5.11 and 5.12, were found
rich in rutin and glycosides.
min0 5 10 15 20 25 30 35
mAU
0
200
400
600
800
1000
1200
1400
1600
1800
17.
982
20.
979
(1)(2)
Figure 5.11. Chromatogram of olive leaf fraction coded as FO 5 (1) rutin, (2) verbascoside

75
min0 5 10 15 20 25 30 35
mAU
0
200
400
600
800
1000
1200
1400
1600
1800
Figure 5.12. Chromatogram of olive leaf fraction coded as FO 6 (other forms of
glycosides with low polarity)
It was found that oleuropein contents of fraction coded as FO 5 and FO 6
obtained with aqueous ethanol elution were below detection limits even it was not
observed. Despite this, as it can be seen from the chromatograms, fraction coded as FO
5 and FO 6 were characterized as fractions rich in rutin and glycosides. As a result of
fractioning of olive leaf extract, oleuropein contents of fractions were calculated as
percentage according to calibration curves and the results were summarized in Table
5.6.
Table 5.6. Oleuropein contents of olive leaf fractions
Fraction No. Time (min.) Peak Intensity (%)
FO 1 21.8 90.95
FO 2 22.0 78.15
FO 3 22.1 54.70
FO 4 22.2 26.86
FO 5 No oleuropein peak -
FO 6 No oleuropein peak -
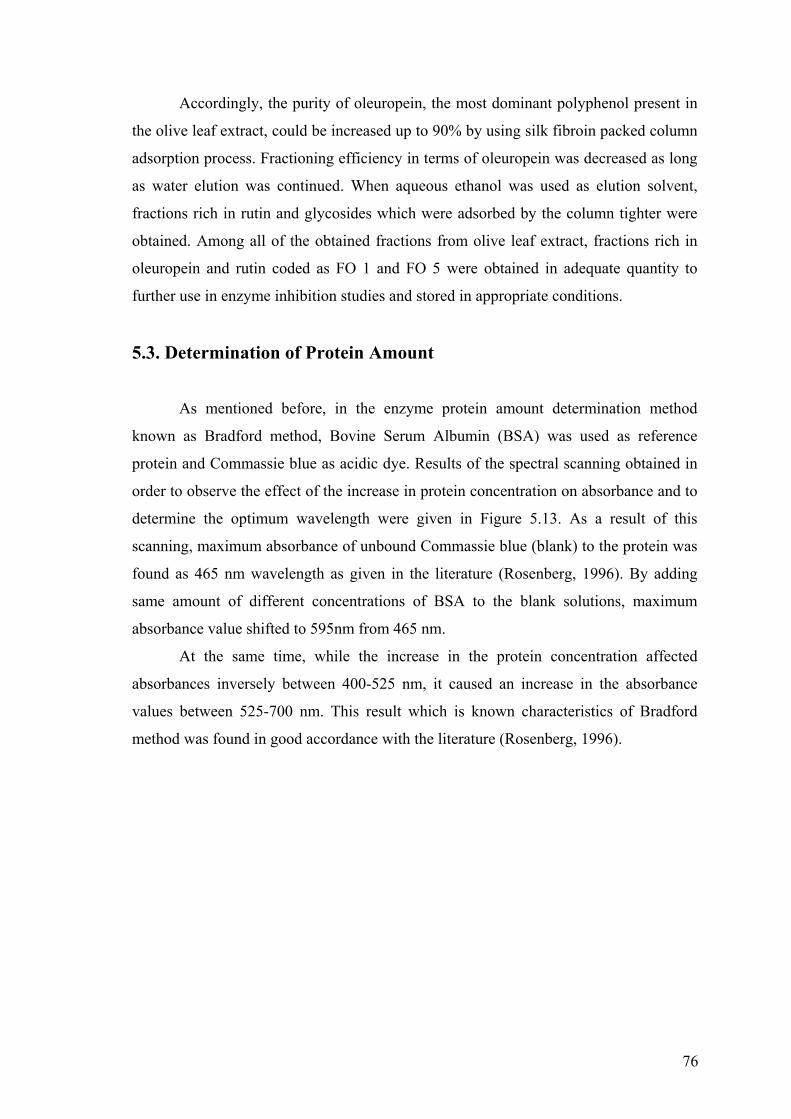
76
Accordingly, the purity of oleuropein, the most dominant polyphenol present in
the olive leaf extract, could be increased up to 90% by using silk fibroin packed column
adsorption process. Fractioning efficiency in terms of oleuropein was decreased as long
as water elution was continued. When aqueous ethanol was used as elution solvent,
fractions rich in rutin and glycosides which were adsorbed by the column tighter were
obtained. Among all of the obtained fractions from olive leaf extract, fractions rich in
oleuropein and rutin coded as FO 1 and FO 5 were obtained in adequate quantity to
further use in enzyme inhibition studies and stored in appropriate conditions.
5.3. Determination of Protein Amount
As mentioned before, in the enzyme protein amount determination method
known as Bradford method, Bovine Serum Albumin (BSA) was used as reference
protein and Commassie blue as acidic dye. Results of the spectral scanning obtained in
order to observe the effect of the increase in protein concentration on absorbance and to
determine the optimum wavelength were given in Figure 5.13. As a result of this
scanning, maximum absorbance of unbound Commassie blue (blank) to the protein was
found as 465 nm wavelength as given in the literature (Rosenberg, 1996). By adding
same amount of different concentrations of BSA to the blank solutions, maximum
absorbance value shifted to 595nm from 465 nm.
At the same time, while the increase in the protein concentration affected
absorbances inversely between 400-525 nm, it caused an increase in the absorbance
values between 525-700 nm. This result which is known characteristics of Bradford
method was found in good accordance with the literature (Rosenberg, 1996).

77
0
0,1
0,2
0,3
0,4
0,5
0,6
400 450 500 550 600 650 700 750Wavelength (nm)
Abs
orba
nce blank
2E-3 mg/ml4E-3 mg/ml8E-3 mg/ml16E-3 mg/ml
Figure 5.13. Spectral scanning for different BSA concentration
Spectrophotometric measurements were performed at 595 nm which was found
as the optimum wavelength in order to determine the protein amount of the COMT
enzyme isolated from porcine liver used as the enzyme source of this study. Calibration
curves given in Figure 5.14 were obtained by using the measured absorbance values at
595 nm of BSA and COMT solutions prepared in 0-16 µg/ml concentrations.
y = 19,871xR2 = 0,9907
y = 5,4957xR2 = 0,9561
0,00
0,05
0,10
0,15
0,20
0,25
0,30
0,35
0,40
0,45
0,000 0,005 0,010 0,015 0,020 0,025
Concentration (mg/ml)
Abs
orba
nce
(595
nm
)
BSA
COMT
Figure 5.14. Calibration curves obtained for proteins
By taking into consideration of the ratio of estimated slopes given on calibration
curves, it was determined that the active protein amount of COMT enzyme was found
27.7% according to BSA reference protein.

78
5.4. Determination of COMT Activity and Inhibition Kinetics
5.4.1. Activity Determination by Spectrophotometric Method
According to the protocol, by which the COMT enzyme activity was determined
spectrophotometrically, absorbances of produced the O-methylated forms of DHAP
were measured at 344 nm.
DHAP + SAM ⎯⎯ →⎯COMT SAH + 3H4MAP + 4H3MAP
The possible reaction given above was incubated at pH of 7.6 and 37 °C for one hour. In
the reaction performed in a total volume of 500 µl, while DHAP final concentration was
fixed at 0.1 mM, varying SAM concentrations were given in Table 5.7. Final
concentration of 150-unit COMT standard enzyme in the reaction medium was kept
constant at 0.51 mg solid/ml. Absorbances of test and blank solutions measured at 344
nm after the reaction was terminated by adding 500 µl of sodium borate at the end of
one hour were also given in Table 5.7.
Table 5.7. Reaction Medium and Absorbances for Spectrophotometric Method
Reaction No. SAM Concentration (mM) Absorbance (344 nm)
Blank* - 0.481
Test 1 0.800 0.512
Test 2 0.160 0.498
Test 3 0.080 0.492
Test 4 0.053 0.490
Test 5 0.040 0.488
* According to the protocol, blank solution absorbance value should be between 0.3-0.5.
Enzyme activity was calculated using the mathematical equations defined in the
applied protocol as following;
1.0
))(2.126)((/
ctordilutionfaAAmlUnit blanktest −= ; (5.1)

79
mlmgprotein
mlUnitmgproteinUnit/
// = (5.2)
where 126.2 was the conversion factor defined for 1 ml reaction volume and 0.1 was the
volume of enzyme added to reaction medium (ml). Accordingly, enzyme activities1
obtained for test solutions were given in Table 5.8.
Table 5.8. Enzyme Activities (spectrophotometric)
Reaction
No. Unit/ml
Unit/mg
protein
Unit/mg
solid*
v (nmol/mg
protein. min.)
1/v (nmol/mg
protein. min.)-1
Test 1 195.61 276.93 76.70 4.62 ± 0.10 0.22 ± 0.02
Test 2 107.27 151.86 42.06 2.53 ± 0.16 0.39 ± 0.04
Test 3 69.41 98.26 27.21 1.64 ± 0.11 0.61 ± 0.01
Test 4 56.79 80.39 22.27 1.34 ± 0.10 0.75 ± 0.02
Test 5 44.17 62.53 17.32 1.04 ± 0.13 0.96 ± 0.01
* 27.7 % of one mg solid material was taken as active protein (see Bradford method)
Reaction velocity (v) and inverse reaction velocity (1/v) values in Table 5.8 were
analyzed with linear and nonlinear regression analyses performed by using GraphPad
Prism 5.0 program as explained in 4.2.6. Enzyme Activity and Inhibition Kinetics Data
Analysis section. The obtained Michaelis and Lineweaver-Burk graphs were given in
Figure 5.15.
Figure 5.15. A: Michaelis and B: Lineweaver-Burk graphs of spectrophotometrically determined enzyme activity
1 1 unit of enzyme activity = 1 nmol of O-methylated forms of DHAP produced in one minute per mg of protein.
-10 -5 0 5 10 15 20 25
0.2
0.4
0.6
0.8
1.0 B
1/SAM (mM)-1
1/V
(nm
ole/
min
.m
g pr
otei
n)-1
0.0 0.2 0.4 0.6 0.8 1.00
1
2
3
4
5 A
[SAM] (mM)
V (n
mol
e/m
in. m
g pr
otei
n)

80
Vmax and Km values for this reaction performed in non-inhibitor medium were
found as 5.69 ± 0.15 nmol/min. mg protein and 0.19 ± 0.01 mM, respectively. Due to
the fact that, the required amounts of enzyme and substrate in spectrophotometric
method were quite high and the protocol was developed for reactions performed in optic
cuvettes causing to consume more time, the inhibition study were performed by
fluorometric method using 96 well microplates. Since the entire spectrophotometric
method was a commercial protocol, it was not possible to compare the obtained results
with the literature. However, by performing this protocol, active protein capacity and
activity of standard COMT enzyme could be tested.
5.4.2. Determination Activity and Inhibition Kinetics by Fluorometric Method
It was known that the results obtained for enzymatic reactions monitored by
fluorometric method were more sensitive than absorption and less interference was
observed (Copeland, 2000). Therefore, the protocol modified for determination of
COMT activity and inhibition kinetics from the studies employed based on fluorometric
method was applied in this study (Kurkela et al., 2004; Veser, 1987).
In this method, transformation rate of aesculetin (ES) to scopoletin by COMT
catalyzed O-methylation reaction and thereby change in fluorescence was measured at
355 nm excitation and 460 nm emission wavelengths.
ES + SAM ⎯⎯ →⎯COMT SAH + Scopoletin
Total reaction volumes in activity determination and inhibition studies
performed at 37 °C and pH of 7.4 were determined as 200 µl and 250 µl, respectively.
5.4.2.1. Activity Determination by Fluorometric Method
In the activity determination study by fluorometric method, firstly a linear
working range for different enzyme and substrate concentrations was found.
Concentration changes of enzyme and substrates in these reactions were given in Table
5.9.

81
Table 5.9. Concentration changes of enzyme and substrates
Enzyme concentrations (µg protein/ml)
E1 16.5
E2 11.0
E3 8.5
SAM concentrations (µM) Aesculetin concentrations (µM)
SAM 1 10 ES1 2
SAM 2 50 ES2 3
SAM 3 100 ES3 4
SAM 4 200 ES4 5
SAM 5 300 ES5 7
SAM 6 500 ES6 10
SAM 7 600
In these reactions, which are known to have a total reaction time of 6-8 hours,
activity was determined by taking the change of fluorescence values between two points
after reaction progressed at steady state. In order to determine the accurate steady state
phase of reactions, fluorescent measurements were recorded for 10 hours and kinetic
data of the sample reaction occurred at the condition of E1-ES3-SAM1 concentrations
were given in Figure 5.16.
0,00
20,00
40,00
60,00
80,00
100,00
120,00
140,00
0 7200 14400 21600 28800 36000 43200Time (second)
Rel
ativ
e Fl
uore
scen
ce U
nit (
RFU
)
Figure 5.16. Product formation kinetics obtained at E1-ES3-SAM1 concentrations (10 hours)

82
Based on the kinetic data recorded in 10 hr. time interval given in Figure 5.16, it
was found adequate to measure the first two hours of fluorescent change for reactions
catalyzed by COMT. Moreover, fluorescent reduction in the first 20 minutes was a
characteristic feature of the reaction and the kinetic measurements to be used for
activity calculations was composed of the values in the first 30 minutes after this period.
For this purpose, a total two hours of fluorescent measurement obtained for the same
reaction conditions was given in Figure 5.17.
0,00
5,00
10,00
15,00
20,00
25,00
30,00
35,00
40,00
0 1000 2000 3000 4000 5000 6000 7000 8000
Time (second)
Rel
ativ
e Fl
uore
scen
ce U
nit (
RFU
)
Figure 5.17. Product formation kinetics obtained at E1-ES3-SAM1 (2 hours)
Kinetic data were obtained for all reactions occurred at every concentration
values given in Table 5.9, as it was obtained as a result of the reaction given as an
example in Figure 5.17. Accordingly, it was determined that the measurements recorded
at the first 30 minute after the 1500th second indicated the ones obtained from steady
state phase of reactions. Fluorescent change in this 30 min. time interval was
transformed into enzyme activity data by using the value indicating the effect of one
nanomole of scopoletin formation on the fluorescence obtained as a result of its
calibration. Sample calculation of the data transformation and scopoletin calibration
curve were also given in Appendix C.
Accordingly, results of the studies, performed in order to determine the linear
enzyme-substrate concentration range and where the change of the reaction rate
according to SAM and ES substrates was examined, were given as enzyme activity data
in Figure 5.18 and 5.19, respectively.

83
Figure 5.18. A: Michaelis and B: Lineweaver-Burk graphs of formation rate of scopoletin against various SAM concentrations in presence of different enzyme concentrations ([ES] was fixed at 4 µM).
It can be seen from Figure 5.18A, increasing enzyme concentration increased
reaction rate as expected. However, it is known that in high concentration of SAM
caused substrate inhibition takes place (Yassin et al., 1998; Veser, 1987). Therefore it
was observed that the reaction rate obtained at the lowest enzyme concentration E3 (8.5
µg protein/ml) deviated from linearity (Figure 5.18B). This deviation which was
thought to be arising from substrate inhibition was slightly observed for rates obtained
at E2 and E1 concentrations. However, the reaction rate obtained at E2 and E1
concentrations did not deviated from linearity up to 100 µM SAM concentration as
given in Figure 5.19.
Figure 5.19. A: Michaelis and B: Lineweaver-Burk graphs of formation rate of
scopoletin up to 100 µM SAM concentrations in presence of different enzyme concentrations ([ES] was fixed at 4 µM).
E2 concentration by which it was able to perform reactions in linear
concentration range more economically with respect to E1 was chosen as the fixed
-0.8 -0.6 -0.4 -0.2 -0.0 0.2
1
2
3
4B
1/SAM (μM)-1
1/V
(nm
ole/
min
.m
g pr
otei
n)-1
0.0 50.0 100.0 150.00.0
0.5
1.0
1.5
2.0 A E3E2E1
[SAM] (μM)
V (n
mol
e/m
in. m
g pr
otei
n)
0.0 200.0 400.0 600.0 800.00.0
0.5
1.0
1.5
2.0 A E3E2E1
[SAM] (μM)
V (n
mol
e/m
in. m
g pr
otei
n)
-0.6 -0.5 -0.4 -0.3 -0.2 -0.1 0.0 0.1 0.2
1
2
3
4B
1/SAM (μM)-1
1/V
(nm
ole/
min
.m
g pr
otei
n)-1

84
enzyme concentration to be used in inhibition study. Moreover, in order to reveal the
relationship of substrates, reactions, of which the results were given in Figure 5.20 as
reaction rate data, were performed at fixed E2 concentration while both SAM and ES
concentrations were varied.
Figure 5.20. A: Michaelis ve B: Lineweaver-Burk graphs of formation rate of scopoletin against various ES concentrations in presence of different SAM concentrations (enzyme concentration was fixed in 11.0 µg protein/ml (E2))
It was observed that the reaction rate increased with the increasing SAM
concentration and did not deviate from linearity in this concentration range. As a result
of this study performed in order to determine the enzyme-substrate relationship, Km
values for SAM and ES were calculated as 3.5 ± 0.3 µM and 6.4 ± 0.4 µM, respectively.
Km value for aesculetin in Veser, 1987’s study was reported as 6.2 µM. Km values found
for SAM in several studies have varied according to the used COMT enzyme source
and difference in the linear concentration ranges. However, it was found that SAM
which was the methyl donor substrate of COMT catalyzed methylation reaction was the
rate limiting reactant.
Based on the results obtained from fluorometric activity tests, it was determined
that in inhibition studies, the concentrations of both ES and enzyme should be kept at 4
µM and 11 µg protein/ml, respectively. On the other hand, SAM concentrations were
varied between the ranges of 10-300 µM.
-0.2 0.2 0.4 0.6
1
2
3
4
5 B
1/ES (μM)-1
1/V
(nm
ole/
min
.m
g pr
otei
n)-1
0.0 3.0 6.0 9.0 12.00.0
0.5
1.0
1.5 A SAM 1SAM 2SAM 3
[ES] (μM)
V (n
mol
e/m
in. m
g pr
otei
n)

85
5.4.2.2. Inhibition Study by Fluorometric Method
On the basis of the results obtained for fluorometric activity determination,
reducing in COMT catalyzed reaction rate was also analyzed fluorometrically by using
some plant-derived alkaloids, polyphenolics and their standards as inhibitor.
In inhibition study performed in presence of inhibitors given in Table 5.10,
enzyme kinetic measurements were recorded at 355 nm excitation and 460 nm emission
wavelengths. Total reaction volume was 250 µl in these experiments performed at 37 °C
and pH of 7.4. While the SAM concentrations was changed between 10-100 µM for
first 16 inhibitors given in Table 5.10, its concentration was varied between 10-300 µM
in studies performed with 17th and 18th inhibitors.
Among the inhibitors given in Table 5.10, 3,5-DNC was used as positive control
and the inhibition performances of other inhibitors were compared with that of the
positive control. The obtained inhibition performances of alkaloid and polyphenolics
based standards, extracts and fractions at 100 µM SAM concentration were given in
Figure 5.21 and 5.22. In calculation of inhibition percentages of inhibitors, reaction rate
obtained at the medium where any inhibitor was present was used as reference rate.

86
Table 5.10. The plant extracts, fractions and their standards used as COMT inhibitors in this study
Inhibitor Name Code Concentration (µg/ml) Inhibitor Name Code Concentration (µg/ml) I1a 0.1 I10a 10 I1b 0.02 I10b 5
3,5-dinitrocatechol (3,5-DNC)
I1c 0.005 Oleuropein
I10c 2 I2a 5 I11a 10 I2b 2 I11b 5 Harmol I2c 0.5
Rutin I11c 2
I3a 5 I12a 10 I3b 2 I12b 5 Harmalol I3c 0.5
Olive (O. europaea) leaf crude extract
I12c 2 I4a 5 I13a 10 I4b 2 I13b 5 Harmine I4c 0.5
Fraction rich in Oleuropein (FO 1)
I13c 2 I5a 5 I14a 10 I5b 2 I14b 5 Harmaline I5c 0.5
Fraction rich in Rutin and glycosides (FO 5)
I14c 2 I6a 5 I15a 10 I6b 2 I15b 5 Harmal (P. harmala)
seed crude extract I6c 0.5
Vitex (V. agnus-cactus) leaf crude extract
I15c 2 I7a 5 I16a 10 I7b 2 I16b 5 Harmol and Harmalol
fraction (FP 1) I7c 0.5
Cistus (C. parviflorus) leaf crude extract
I16c 2 I8a 5 I17a 10 I8b 2 I17b 5
Harmine fraction (FP 2)
I8c 0.5
Terebinth (P. terebinthus) leaf crude extract
I17c 2 I9a 5 I18a 10 I9b 2 I18b 5 Harmaline fraction (FP
3) I9c 0.5
Mastic (P. lentiscus) leaf crude extract
I18c 2

87
0
10
20
30
40
50
60
70
80
90
100
I1a
I2a
I3a
I4a
I5a
I6a
I7a
I8a
I9a
Inhi
bitio
n Pe
rcen
tage
(%)
Figure 5.21. Inhibition percentages of alkaloid standards, extracts and fractions
0
10
20
30
40
50
60
70
80
90
100
I1a
I10a
I11a
I12a
I13a
I14a
I15a
I16a
I17a
I18a
Inhi
bitio
n Pe
rcen
tage
(%)
Figure 5.22. Inhibition percentages of polyphenolic standards and extracts and fractions
As it can be seen from Figures 5.21 and 5.22, inhibition performances of
alkaloid and polyphenolic standards, extracts and fractions used in this study were
compared to that of positive control, 3,5-DNC which is the best known COMT
inhibitor. Accordingly, while it was found that inhibition performance of 3,5-DNC was
100 times higher than those of especially harmine and harmaline alkaloid standards and
fractions, 3,5-DNC demonstrated about 200 and 300 times higher inhibitory effect than

88
those of polyphenolics when taking into consideration the concentration ranges of
inhibitors.
Although their performances were not found as effective as positive control, it
was revealed that inhibitors coded as I6 (P. harmala-harmal), I16 (C. parviflorus-
cistus), I17 (P. terebinthus-terebinth) and I18 (P. lentiscus-mastic) crude extracts
demonstrated quite high reducing effect against the COMT catalyzed reaction rate.
Moreover, it was observed that as a result of the characterization of P. harmala
seed crude extract, harmine and harmaline alkaloids were the major alkaloids present in
crude extract. Therefore, it was thought that these major alkaloids in harmal seed were
the compounds responsible for inhibition when similarities in the inhibition
performances of crude extract (I6) and its harmine (I8) and harmaline (I9) fractions
were also taking into consideration.
In order to explain the inhibition mechanism of each inhibitor used in this study,
the mathematically derived enzyme inhibition kinetics model equations were used as
mentioned before in experimental section. The results of the most statistically
appropriate model, fitted to the experimental enzyme activity data obtained in presence
of 18 different inhibitors, were given as graphically from Figure 5.23 to Figure 5.40.
Figure 5.23. A: Michaelis and B: Lineweaver-Burk graphs of formation rate of scopoletin against various SAM concentrations in presence of different I1 (3,5-DNC) concentrations ([E] and [ES] were fixed at 11.0 µg protein/ml and 4 µM, respectively)
As reported in Bonifacio et al., 2007’s study, it is known that almost all
nitrocatecholics are the tight binding and uncompetitive inhibitors of COMT enzyme.
As it can be seen from Figure 5.23B, 3,5-DNC which was used as positive control in
this study was found as a COMT inhibitor with uncompetitive behavior in good
accordance with literature. The presence of 3,5-DNC even in its low concentrations in
-0.05 0.00 0.05 0.10 0.15
5
10
15control[I]=0.1 μg/ml[I]=0.020 μg/ml[I]=0.005 μg/ml
B
1/[SAM] (μM)-1
1/V
(nm
ole/
min
. mg
prot
ein)
-1
0 20 40 60 80 100 1200.0
0.4
0.8
1.2 A
[SAM] (μM)
V (n
mol
e/m
in. m
g pr
otei
n)

89
the reaction medium caused a very high reduction in scopoletin formation rate (v). As a
result of the experimental data analyzed by GraphPad program, Km and Vmax kinetic
constants were calculated as 6.83±0.77 µM and 1.07±0.02 nmol/min. mg protein,
respectively. Inhibition constant (αKi) given in rate equation (Equation 2.6) derived for
uncompetitive inhibition was found 9.17±0.46 ng/ml (in other words; 45.60±2.29 nM)
for 3,5-DNC. Also, the 50% inhibitory concentration (IC50) of 3,5-DNC was found
44.18±0.78 nM which was in good accordance with the value reported as 35 nM in the
literature (Kurkela et al., 2004).
Figure 5.24. A: Michaelis and B: Lineweaver-Burk graphs of formation rate of scopoletin against various SAM concentrations in presence of different I2 (harmol standard) concentrations ([E] and [ES] were fixed at 11.0 µg protein/ml and 4 µM, respectively)
Figure 5.25. A: Michaelis and B: Lineweaver-Burk graphs of formation rate of
scopoletin against various SAM concentrations in presence of different I3 (harmalol standard) concentrations ([E] and [ES] were fixed at 11.0 µg protein/ml and 4 µM, respectively)
Graphical demonstrations of the experimental data obtained with standards of
harmol and harmalol alkaloids which were the minor alkaloids present in harmal seed
-0.05 0.00 0.05 0.10 0.15
2
4control[I]=5 μg/ml[I]=2 μg/ml[I]=0.5 μg/ml
B
1/[SAM] (μM)-1
1/V
(nm
ole/
min
. mg
prot
ein)
-1
0 20 40 60 80 100 1200.0
0.4
0.8
1.2 A
[SAM] (μM)
V (n
mol
e/m
in. m
g pr
otei
n)
-0.05 0.00 0.05 0.10 0.15
2
4control[I]=5 μg/ml[I]=2 μg/ml[I]=0.5 μg/ml
B
1/[SAM] (μM)-1
1/V
(nm
ole/
min
. mg
prot
ein)
-1
0 20 40 60 80 100 1200.0
0.4
0.8
1.2 A
[SAM] (μM)
V (n
mol
e/m
in. m
g pr
otei
n)
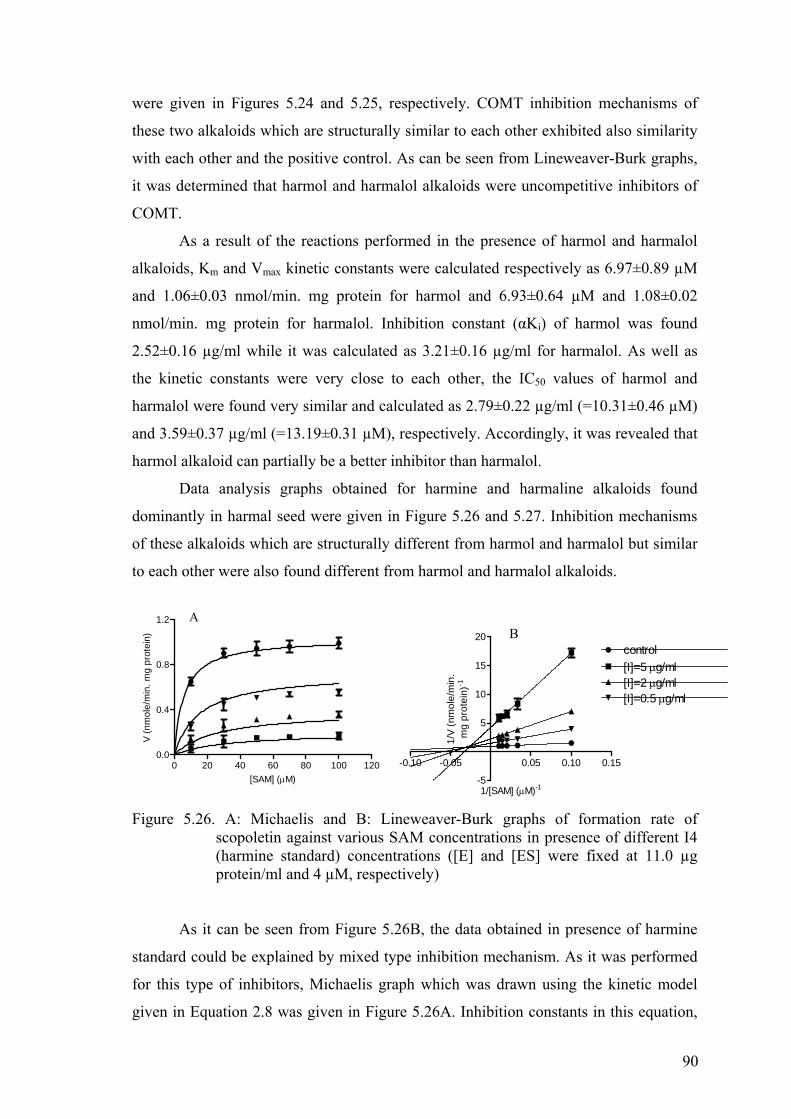
90
were given in Figures 5.24 and 5.25, respectively. COMT inhibition mechanisms of
these two alkaloids which are structurally similar to each other exhibited also similarity
with each other and the positive control. As can be seen from Lineweaver-Burk graphs,
it was determined that harmol and harmalol alkaloids were uncompetitive inhibitors of
COMT.
As a result of the reactions performed in the presence of harmol and harmalol
alkaloids, Km and Vmax kinetic constants were calculated respectively as 6.97±0.89 µM
and 1.06±0.03 nmol/min. mg protein for harmol and 6.93±0.64 µM and 1.08±0.02
nmol/min. mg protein for harmalol. Inhibition constant (αKi) of harmol was found
2.52±0.16 µg/ml while it was calculated as 3.21±0.16 µg/ml for harmalol. As well as
the kinetic constants were very close to each other, the IC50 values of harmol and
harmalol were found very similar and calculated as 2.79±0.22 µg/ml (=10.31±0.46 µM)
and 3.59±0.37 µg/ml (=13.19±0.31 µM), respectively. Accordingly, it was revealed that
harmol alkaloid can partially be a better inhibitor than harmalol.
Data analysis graphs obtained for harmine and harmaline alkaloids found
dominantly in harmal seed were given in Figure 5.26 and 5.27. Inhibition mechanisms
of these alkaloids which are structurally different from harmol and harmalol but similar
to each other were also found different from harmol and harmalol alkaloids.
Figure 5.26. A: Michaelis and B: Lineweaver-Burk graphs of formation rate of scopoletin against various SAM concentrations in presence of different I4 (harmine standard) concentrations ([E] and [ES] were fixed at 11.0 µg protein/ml and 4 µM, respectively)
As it can be seen from Figure 5.26B, the data obtained in presence of harmine
standard could be explained by mixed type inhibition mechanism. As it was performed
for this type of inhibitors, Michaelis graph which was drawn using the kinetic model
given in Equation 2.8 was given in Figure 5.26A. Inhibition constants in this equation,
0 20 40 60 80 100 1200.0
0.4
0.8
1.2 A
[SAM] (μM)
V (n
mol
e/m
in. m
g pr
otei
n)
-0.10 -0.05 0.05 0.10 0.15
-5
5
10
15
20control[I]=5 μg/ml[I]=2 μg/ml[I]=0.5 μg/ml
B
1/[SAM] (μM)-1
1/V
(nm
ole/
min
.m
g pr
otei
n)-1

91
Ki and αKi values which indicate the competitiveness and noncompetitiveness were
found as 0.18±0.07 µg/ml and 1.18±0.08 µg/ml, respectively. Value of α constant was
calculated as 6.56±0.81 in the presence of harmine alkaloid. Km ve Vmax kinetic
constants were also calculated as 5.75±1.21 µM and 1.03±0.04 nmol/min. mg protein,
respectively. Besides, IC50 value of harmine alkaloid was found 0.75±0.09 µg/ml, or in
other words 3.55±0.16 µM.
Figure 5.27. A: Michaelis and B: Lineweaver-Burk graphs of formation rate of scopoletin against various SAM concentrations in presence of different I5 (harmaline standard) concentrations ([E] and [ES] were fixed at 11.0 µg protein/ml and 4 µM, respectively)
Also in the inhibition kinetics data analysis performed for harmaline standard
given in Figure 5.27B, mixed type inhibition model was determined as the most
appropriate model as it was found for harmine. Inhibition constants of harmaline
standard, Ki and αKi values were calculated respectively as 0.19±0.04 µg/ml and
1.36±0.11 µg/ml. α constant was found somewhat higher than that of found for harmine,
as 7.16±0.78. Accordingly, it was revealed that the noncompetitive feature of harmine
was higher due to having lower α value. However, harmine and harmaline alkaloids did
not demonstrate too different behaviors from each other. Moreover, IC50 value was
found as 0.98±0.12 µg/ml, in other words, 4.57±0.14 µM for harmaline alkaloids. Km
and Vmax kinetic constants in presence of harmaline were calculated respectively as
5.92±0.87 µM and 1.05±0.02 nmol/min. mg protein.
As a result of the studies performed with alkaloid standards, the COMT
inhibition performances of harmine and harmaline alkaloids was found higher than
those of harmol and harmalol. Despite the fact that harmine and harmaline were the
inhibitors behaving in very similar mixed type manner, according to results obtained for
-0.05 0.05 0.10 0.15-5
5
10
15
20
25control[I]=5μg/ml[I]=2μg/ml[I]=0.5μg/ml
B
1/[SAM] (μM)-1
1/V
(nm
ole/
min
. mg
prot
ein)
-1
0 20 40 60 80 100 1200.0
0.4
0.8
1.2 A
[SAM] (μM)
V (n
mol
e/m
in. m
g pr
otei
n)

92
standards, COMT inhibitory effect of harmine alkaloid was found the highest. In the
light of these results, inhibition performances of harmal seed crude extract and its
fractions were analyzed and compared with their corresponding standards. The data
obtained in presence of harmal seed crude extract in reaction medium were
demonstrated graphically in Figure 5.28.
Figure 5.28. A: Michaelis and B: Lineweaver-Burk graphs of formation rate of
scopoletin against various SAM concentrations in presence of different I6 (harmal seed crude extract) concentrations ([E] and [ES] were fixed at 11.0 µg protein/ml and 4 µM, respectively)
According to the results, the COMT inhibition performance of the crude alkaloid
extract was found as effective as harmine and harmaline which were the major alkaloids
exist in the extract, and its mechanism could be explained in a similar manner with that
of the standards. As it can be seen from Figure 5.28B, crude extract behaved as mixed
type inhibitor and the inhibition constants, Ki and αKi were calculated respectively as
0.12±0.02 µg/ml and 2.24±0.75 µg/ml having α value of 18.72±2.28. The higher α
value of crude extract compared to that of harmine and harmaline alkaloids caused to
shift the mechanism to competitive inhibition as it can be seen from the Lineweaver-
Burk graph (Figure 5.28B). IC50 concentration of crude extract was found 1.09±0.33
µg/ml while Km and Vmax were calculated as 6.05±0.69 µM and 1.06±0.02 nmol/min.
mg protein, respectively. According to the results obtained in the presence of crude
extract, a partial increase in Km value was observed and it was thought this increase
arises from the increase in competitiveness.
-0.05 0.05 0.10 0.15
-10-5
5101520253035
control[I]=5μg/ml[I]=2μg/ml[I]=0.5μg/ml
B
1/[SAM] (μM)-1
1/V
(nm
ole/
min
. mg
prot
ein)
-1
0 20 40 60 80 100 1200.0
0.4
0.8
1.2 A
[SAM] (μM)
V (n
mol
e/m
in. m
g pr
otei
n)

93
Figure 5.29. A: Michaelis and B: Lineweaver-Burk graphs of formation rate of scopoletin against various SAM concentrations in presence of different I7 (harmal seed fraction no FP1) concentrations ([E] and [ES] were fixed at 11.0 µg protein/ml and 4 µM, respectively)
Results of the inhibition studies performed with fractions of harmal seed
alkaloids was found compatible with that of their corresponding standards. Data
analysis results obtained for the harmal seed fraction which was characterized as rich in
harmol and harmalol alkaloids were given graphically in Figure 5.29. Similar to the
results obtained for harmol and harmalol standards given in Figures 5.24 and 5.25, it
was observed that harmal fraction coded as FP1 inhibited COMT uncompetitively. The
αKi and IC50 values for FP1 fraction were calculated as 1.66±0.09 µg/ml and 1.74±0.13
µg/ml, respectively.
Accordingly, it was thought that the alkaloids being together might have a
synergistic effect on the COMT inhibition performance of FP1 fraction which was
observed to be more effective compared to harmol and harmalol standards. Km and Vmax
values in the presence of FP1 fraction was calculated as 6.44±0.82 µM ve 1.05±0.02
nmol/min. mg protein, respectively.
-0.10 -0.05 0.00 0.05 0.10 0.15
1
2
3
4
5control[I]=5 μg/ml[I]=2 μg/ml[I]=0.5 μg/ml
B
1/[SAM] (μM)-1
1/V
(nm
ole/
min
. mg
prot
ein)
-1
0 20 40 60 80 100 1200.0
0.4
0.8
1.2 A
[SAM] (μM)
V (n
mol
e/m
in. m
g pr
otei
n)

94
Figure 5.30. A: Michaelis and B: Lineweaver-Burk graphs of formation rate of scopoletin against various SAM concentrations in presence of different I8 (harmal seed fraction no FP2) concentrations ([E] and [ES] were fixed at 11.0 µg protein/ml and 4 µM, respectively)
Figure 5.31. A: Michaelis and B: Lineweaver-Burk graphs of formation rate of
scopoletin against various SAM concentrations in presence of different I9 (harmal seed fraction no FP3) concentrations ([E] and [ES] were fixed at 11.0 µg protein/ml and 4 µM, respectively)
As a result of the HPLC analyses, it was found that harmal fraction coded as FP2
consisted of 77% of harmine and 23% of harmaline. Therefore, as a result of inhibition
experiments performed with the FP2 fraction, it was observed that presence of harmine
and harmaline together has no effect on inhibition mechanism and it was defined as
mixed type inhibitor (Figure 5.30) like its corresponding standards. However, as it was
observed for fraction FP1, presence of harmine and harmaline together provided a
partially increasing effect on inhibition performance. Ki and αKi values, found
respectively as 0.18±0.07 µg/ml and 1.18±0.08 µg/ml for harmine standard, were
calculated as 0.15±0.07 µg/ml and 1.28±0.06 µg/ml for FP2 fraction which was rich in
harmine. The IC50 value of FP2 fraction was found lower than the harmine standard, as
-0.06 -0.03 0.03 0.06 0.09 0.12
-5
5
10
15control[I]=5 μg/ml[I]=2 μg/ml[I]=0.5 μg/ml
B
1/[SAM] (μM)-1
1/V
(nm
ole/
min
.m
g pr
otei
n)-1
0 20 40 60 80 100 1200.0
0.4
0.8
1.2 A
[SAM] (μM)
V (n
mol
e/m
in. m
g pr
otei
n)
-0.06 -0.03 0.03 0.06 0.09 0.12
-5
5
10
15
20control[I]=5μg/ml[I]=2μg/ml[I]=0.5μg/ml
B
1/[SAM] (μM)-1
1/V
(nm
ole/
min
. mg
prot
ein)
-1
0 20 40 60 80 100 1200.0
0.4
0.8
1.2 A
[SAM] (μM)
V (n
mol
e/m
in. m
g pr
otei
n)

95
0.69±0.03 µg/ml. Also, Km and Vmax constants were calculated as 5.61±1.68 µM ve
1.03±0.05 nmol/min. mg protein, respectively.
Data analysis obtained for FP3 fraction having 93.3% harmaline content was
graphically demonstrated in Figure 5.31. In accordance with the results obtained for
harmine and harmaline standards, inhibition performance of FP3 fraction rich in
harmaline was found lower than that of FP2 fraction. However, inhibition mechanism
for this fraction was also determined as mixed type, as seen from Figure 5.31B. For the
FP3 fraction, Ki and αKi values were calculated as 0.23±0.05 µg/ml and 1.47±0.08
µg/ml, respectively. The α and IC50 values were found to be very close to those of
harmaline standard and calculated respectively as 6.39±1.08 and 1.10±0.07 µg/ml.
In inhibition study, it was previously mentioned that the other plant species
examined with its fractions and comparing with its corresponding standards was olive
leaf rich in polyphenolics. It was observed that the olive leaf polyphenolics of which
inhibition performances were found lower than alkaloids when they were compared to
that of 3,5-DNC. However, in order to illuminate the inhibition mechanisms of
polyphenolics, the experimental data of them were also been attempted to be explained
by Michaelis approach.
Oleuropein, as given in the characterization results of this study, was a
polyphenol found dominantly in olive leaf. In this respect, COMT inhibition mechanism
of oleuropein standard was examined firstly. Results obtained for oleuropein standard
were given graphically in Figure 5.32.
Figure 5.32. A: Michaelis and B: Lineweaver-Burk graphs of formation rate of scopoletin against various SAM concentrations in presence of different I10 (oleuropein standard) concentrations ([E] and [ES] were fixed at 11.0 µg protein/ml and 4 µM, respectively)
-0.05 0.00 0.05 0.10 0.15
0.5
1.0
1.5
2.0control[I]=10 μg/ml[I]=5 μg/ml[I]=2 μg/ml
B
1/[SAM] (μM)-1
1/V
(nm
ole/
min
. mg
prot
ein)
-1
0 20 40 60 80 100 1200.0
0.4
0.8
1.2 A
[SAM] (μM)
V (n
mol
e/m
in. m
g pr
otei
n)

96
The uncompetitive nature of oleuropein can be seen from Figure 5.32B and
inhibition constant (αKi) was found 22.96±1.39 µg/ml. However as it can be seen from
Figure 5.32A, for the used concentration range of oleuropein, 50% inhibition of COMT
activity could not achieved. Therefore IC50 value could not be calculated for oleuropein
standard. Km and Vmax kinetic constants in the presence of oleuropein were calculated as
5.74±0.39 µM and 1.03±0.01 nmol/min. mg protein, respectively. Results of the
inhibition experiments performed with the standard of rutin which was the secondary
dominant polyphenol in olive leaf extract were given in Figure 5.33.
Figure 5.33. A: Michaelis and B: Lineweaver-Burk graphs of formation rate of scopoletin against various SAM concentrations in presence of different I11 (rutin standard) concentrations ([E] and [ES] were fixed at 11.0 µg protein/ml and 4 µM, respectively)
Oleuropein and rutin which are structurally similar polyphenolics was found as
uncompetitive inhibitors of COMT (Figures 5.32B and 5.33B). However rutin standard
demonstrated higher inhibitory effect than oleuropein in the same concentration range.
Inhibition constant, αKi was found as 6.58±0.39 µg/ml for rutin standard; in other
words, it was 10.78±0.52 µM. In Gugler et al., 1973’s study, similar to this study, 19
flavonoids were scanned in order to reveal their COMT enzyme inhibition
performances. Among these, quercetin and rutin were reported as the flavonoids with
highest inhibitory effect.
Moreover, in the same study inhibition constants for quercetin and rutin were
found respectively as 5.3 and 10.8 µM. This value was almost exactly compatible with
that of rutin calculated in this study. However, in Gugler et al., 1973’s study, it was
argued that rutin and quercetin inhibit COMT in competitive manner. It was thought
-0.15 -0.10 -0.05 -0.00 0.05 0.10 0.15
1
2
3control[I]=10 μg/ml[I]=5 μg/ml[I]=2 μg/ml
B
1/[SAM] (μM)-1
1/V
(nm
ole/
min
. mg
prot
ein)
-1
0 20 40 60 80 100 1200.0
0.4
0.8
1.2 A
[SAM] (μM)
V (n
mol
e/m
in. m
g pr
otei
n)

97
that the difference in the obtained results arises from the differences in the used methyl
acceptor substrates and also in analysis methods.
Furthermore, IC50 value for rutin standard was found close to the values
calculated for harmol and harmalol alkaloids, as 7.17±0.81 µg/ml (=11.75±0.93 µM).
Km and Vmax kinetic constants in the presence of rutin were respectively found as
6.05±0.79 µM ve 1.03±0.02 nmol/min. mg protein.
Based on the results of the characterization of olive leaf extract, it was estimated
that the results of the inhibition study performed with olive leaf crude extract would be
rather similar to that of oleuropein standard. As it can be seen in the graphical
demonstration of results obtained for olive leaf crude extract given in Figure 5.34,
inhibition mechanism and performance were found much closer to those of oleuropein
standard as expected.
Figure 5.34. A: Michaelis and B: Lineweaver-Burk graphs of formation rate of
scopoletin against various SAM concentrations in presence of different I12 (olive leaf crude extract) concentrations ([E] and [ES] were fixed at 11.0 µg protein/ml and 4 µM, respectively)
Inhibition constant (αKi) of the olive leaf crude extract, which was observed to
inhibit COMT uncompetitively like oleuropein and rutin standards, was found as
18.51±2.05 µg/ml. For the crude extract which demonstrated a more effective inhibition
character than oleuropein but lower rutin, IC50 value could not be calculated as for
oleuropein standard. In the presence of crude extract, Km and Vmax kinetic constants
were found 5.83±0.83 µM and 1.01±0.03 nmol/min. mg protein, respectively.
-0.15 -0.10 -0.05 -0.00 0.05 0.10 0.15
0.5
1.0
1.5
2.0
2.5control[I]=10 μg/ml[I]=5 μg/ml[I]=2 μg/ml
B
1/[SAM] (μM)-1
1/V
(nm
ole/
min
. mg
prot
ein)
-1
0 20 40 60 80 100 1200.0
0.4
0.8
1.2 A
[SAM] (μM)
V (n
mol
e/m
in. m
g pr
otei
n)

98
Figure 5.35. A: Michaelis and B: Lineweaver-Burk graphs of formation rate of
scopoletin against various SAM concentrations in presence of different I13 (olive leaf fraction no FO1) concentrations ([E] and [ES] were fixed at 11.0 µg protein/ml and 4 µM, respectively)
As a result of the HPLC analyses of the fraction numbered FO1 obtained from
olive leaf extract, it was found that FO1 fraction was consisted of 91% of oleuropein
and a little amount of an unidentified polyphenol which was less polar than oleuropein.
As it can be seen from Figure 5.35B, oleuropein rich FO1 fraction exhibited
uncompetitive inhibition behavior similar to oleuropein and rutin standards and also
olive leaf raw extract. However, contrary to expected, FO1 fraction demonstrated much
higher inhibitory effect than oleuropein and crude extract. This result was thought to be
arising from the possibility that the presence of unidentified polyphenol present and
oleuropein together in the fraction FO1 can create positive outcomes regarding their
inhibitory activities. Inhibition constant (αKi) and IC50 value of FO1 fraction was
calculated as 4.14±0.28 µg/ml and 4.09±0.16 µg/ml, respectively. Also, in presence
FO1 fraction, Km and Vmax kinetic constants were found as 6.29±1.07 µM and
1.04±0.03 nmol/min. mg protein, respectively.
Furthermore, inhibition kinetic data obtained for the rutin and other glycosides
especially verbascoside rich fraction of olive leaf extract coded as fraction FO5 were
given in Figure 5.36.
-0.05 0.00 0.05 0.10 0.15
0.6
1.2
1.8
2.4
3.0
3.6control[I]=10 μg/ml[I]=5 μg/ml[I]=2 μg/ml
B
1/[SAM] (μM)-1
1/V
(nm
ole/
min
. mg
prot
ein)
-1
0 20 40 60 80 100 1200.0
0.4
0.8
1.2 A
[SAM] (μM)
V (n
mol
e/m
in. m
g pr
otei
n)

99
Figure 5.36. A: Michaelis and B: Lineweaver-Burk graphs of formation rate of
scopoletin against various SAM concentrations in presence of different I14 (olive leaf fraction no FO5) concentrations ([E] and [ES] were fixed at 11.0 µg protein/ml and 4 µM, respectively)
Inhibition mechanism of polyphenolic FO5 fraction could be explained with
uncompetitive behavior as in other polyphenolic standard, extract and fractions of olive
leaf (Figure 5.36B). This fraction which dominantly included rutin and verbascoside
showed higher inhibition effect than the rutin standard. Inhibition constant for this
fraction (αKi) and IC50 values were calculated as 5.08±0.43 µg/ml and 5.21±0.26 µg/ml,
respectively. Km and Vmax kinetic constants were found respectively as 5.98±1.21 µM
and 1.03±0.04 nmol/min. mg protein in the presence of FO5 fraction.
Despite the COMT inhibitory potentials of crude extracts obtained from olive
leaf and harmal seeds were increased via fractioning, it was revealed that some
compounds present in the fractions may create synergistic effect on each other and
thereby on their inhibitory activities. The crude extracts of other plant species were also
used in inhibition study without fractioning. Inhibition kinetics data obtained for crude
extract of vitex leaf among these plants were graphically given in Figure 5.37.
-0.10 -0.05 0.00 0.05 0.10 0.15
1
2
3control[I]=10 μg/ml[I]=5 μg/ml[I]=2 μg/ml
B
1/[SAM] (μM)-1
1/V
(nm
ole/
min
. mg
prot
ein)
-1
0 20 40 60 80 100 1200.0
0.4
0.8
1.2 A
[SAM] (μM)
V (n
mol
e/m
in. m
g pr
otei
n)

100
Figure 5.37. A: Michaelis and B: Lineweaver-Burk graphs of formation rate of
scopoletin against various SAM concentrations in presence of different I15 (vitex leaf crude extract) concentrations ([E] and [ES] were fixed at 11.0 µg protein/ml and 4 µM, respectively)
As it can be seen from Figure 5.37B, vitex leaf crude extract demonstrated a
mixed type inhibition behavior like harmal seed crude extract and its harmine and
harmaline fractions. Ki and αKi values obtained for vitex leaf crude extract were
calculated as 4.43±0.89 µg/ml and 9.48±0.58 µg/ml, respectively. For this extract, a
lower α value was found than those of harmine and harmaline fractions and their
corresponding standards. Vitex leaf crude extract was found an inhibitor of which the
noncompetitiveness was higher than that of alkaloids due to having α value of
2.14±0.23. However, IC50 value was calculated higher than those of alkaloids, as
12.96±0.29 µg/ml. Therefore, despite noncompetitiveness of vitex leaf crude extract
was higher, it was revealed that inhibition performance of it were lower than those of
harmal seed crude extract and its fractions.
It is known that the vitex leaf crude extract includes some first generation
COMT inhibitors such as gallic acid, hydroxybenzoic acid, rutin and ferulic acid and
also some estrogenic compounds like linoleic acid and halimane, labdane type
diterpenes (Ono et al., 2008; Proestos et al., 2006). In this respect, it was thought that it
is very critical to inhibit the COMT activity of which an adverse effect on estrogenic
metabolism is known by plant extracts which consists of estrogenic compounds such as
vitex leaf extract.
-0.15 -0.10 -0.05 -0.00 0.05 0.10 0.15-1
1
2
3
4control[I]=10 μg/ml[I]=5 μg/ml[I]=2 μg/ml
B
1/[SAM] (μM)-1
1/V
(nm
ole/
min
. mg
prot
ein)
-1
0 20 40 60 80 100 1200.0
0.4
0.8
1.2 A
[SAM] (μM)
V (n
mol
e/m
in. m
g pr
otei
n)

101
Figure 5.38. A: Michaelis and B: Lineweaver-Burk graphs of formation rate of scopoletin against various SAM concentrations in presence of different I16 (cistus leaf crude extract) concentrations ([E] and [ES] were fixed at 11.0 µg protein/ml and 4 µM, respectively)
COMT inhibition by the cistus leaf crude extract, which is known to have high
terpenoids and flavonoids content as it is vitex leaves, could be observed in the
concentration range used in this study (Somoza et al., 1996). As it can be seen from the
graphical results obtained for cistus leaf crude extract and given in Figure 5.38, COMT
enzyme activity inhibited by mixed type inhibition mechanism in the presence of cistus
leaf crude extract. Inhibition constants indicating competitiveness and
noncompetitiveness, (Ki and αKi) of cistus leaf crude extract were calculated as
2.51±0.54 µg/ml and 1.99±0.35 µg/ml, respectively. As it was found for this extract
vitex leaf crude extract, a lower α value was also found for this extract than those of
alkaloids. It was revealed that the noncompetitiveness of cistus leaf crude extract was
the highest due to having α value of 0.79±0.32 which is the closest value to 1.
Moreover, IC50 value for cistus leaf crude extract was found 2.44±0.09 µg/ml and was
very close to those of alkaloids. In presence of cistus leaf crude extract, Km and Vmax
constants were calculated as 6.02±1.29 µM and 1.06±0.04 nmol/min. mg protein,
respectively.
It is also known that the cistus leaf crude extract, which demonstrated a
comparable COMT inhibition performance with those of alkaloids, has vasodilator and
relaxant effects due to its high terpenoids and flavonoids contents like vitex leaves
(Somoza et al., 1996). Additionally, it is known that the cistus leaf includes some
terpenoid volatile oils such as carvacrol, thymol, manoil oxides and esters such as
benzyl benzoate (Angelopoulou et al., 2001).
-0.2 -0.1 0.1
-5
5
10
15
20control[I]=10μg/ml[I]=5μg/ml[I]=2μg/ml
B
1/[SAM] (μM)-1
1/V
(nm
ole/
min
. mg
prot
ein)
-1
0 20 40 60 80 100 1200.0
0.4
0.8
1.2 A
[SAM] (μM)
V (n
mol
e/m
in. m
g pr
otei
n)

102
In this study, COMT enzyme inhibition studies were also performed with crude
extracts of two Pistacia species known as terebinth and mastic, and the obtained results
were respectively given in Figures 5.39 and 5.40.
Figure 5.39. A: Michaelis and B: Lineweaver-Burk graphs of formation rate of
scopoletin against various SAM concentrations in presence of different I17 (terebinth leaf crude extract) concentrations ([E] and [ES] were fixed at 11.0 µg protein/ml and 4 µM, respectively)
Figure 5.40. A: Michaelis and B: Lineweaver-Burk graphs of formation rate of
scopoletin against various SAM concentrations in presence of different I18 (mastic leaf crude extract) concentrations ([E] and [ES] were fixed at 11.0 µg protein/ml and 4 µM, respectively)
As it can be seen from Figures 5.39B and 5.40B, extracts obtained from
terebinth and mastic leaves demonstrated mixed type inhibition character as in other
polyphenolic plant leaves and harmal seed extracts except olive leaf. The αKi values
were calculated respectively as 3.95±0.37 µg/ml and 3.52±0.61 µg/ml for terebinth and
mastic crude extracts having respectively α values of 1.37±0.49 and 1.35±0.54 which
were found to be very close to one and each other. IC50 values for these two Pistacia
species, of which indicate lower inhibition character than cistus leaf crude extract, were
-0.2 -0.1 0.0 0.1 0.2
2
4
6
8
10control[I]=10 μg/ml[I]=5 μg/ml[I]=2 μg/ml
B
1/SAM (μM)-1
1/V
(nm
ole/
min
. mg
prot
ein)
-1
0 100 200 300 4000.0
0.4
0.8
1.2 A
[SAM] (μM)
V (n
mol
e/m
in. m
g pr
otei
n)
-0.2 -0.1 0.0 0.1 0.2
3
6
9control[I]=10 μg/ml[I]=5 μg/ml[I]=2 μg/ml
B
1/SAM (μM)-1
1/V
(nm
ole/
min
. mg
prot
ein)
-1
0 100 200 300 4000.0
0.4
0.8
1.2 A
[SAM] (μM)
V (n
mol
e/m
in. m
g pr
otei
n)

103
also found very effective and close to each other. These were calculated as 4.40±0.28
µg/ml and 3.69±0.32 µg/ml for terebinth and mastic leaf crude extracts, respectively. In
presence of terebinth leaf crude extract, while Km and Vmax kinetic constants were
respectively found as 6.79±0.86 µM and 1.10±0.04 nmol/min. mg protein, kinetic
constants in the presence of mastic leaf crude extract were calculated as 6.76±0.93 µM
and 1.08±0.02 nmol/min. mg protein, respectively.
As for cistus leaf crude extract, COMT inhibitory effects of terebinth and mastic
leaf crude extracts were observed as comparable as with those of alkaloids. It has been
reported in the literature that in the leaves of these two Pistacia species, apigenin,
luteolin, quercetin, gallic acid and and some anthocyanidins are present (Topcu et al.,
2007; Benhammou et al., 2008). Therefore, it was thought that the high COMT
inhibitory potentials of Pistacia species can be arise from the fact that they include
these compounds which are also known as the first generation COMT inhibitors.

104
CHAPTER 6
CONCLUSIONS
As a result of this study, it was first observed that harmal seed and olive leaf
demonstrated to have inhibition potencies against COMT enzyme activity with the help
of their alkaloids and polyphenolics content. In this study, it was mainly focused on
COMT inhibition performances of harmol, harmalol, harmine and harmaline alkaloids
found in harmal seed, and oleuropein and rutin polyphenols present in olive leaf. By
means of extraction and fractionation, it was tried to obtain high yield extracts from
plant sources and their purities were attempted to be increased in order to determine the
compounds that were responsible for COMT inhibition. Additionally, COMT enzyme
inhibition performances of extracts obtained from vitex, cistus, terebinth and mastic
leaves were examined.
Firstly, harmal seed was subjected to different extraction methods. By means of
HPLC analyses, effects of parameters such as temperature, pH, extraction time and
solvent type on alkaloid extraction efficiency were investigated. Accordingly, extraction
process performed with Soxhlet apparatus was determined as the method resulted with
the highest efficiency. In this method, powdered seeds were extracted with Soxhlet
apparatus for 7.5 hours in 70°C in which methanol was used as extraction solvent. The
extract obtained in methanol was dissolved in 2 % of hydrochloric acid solution after
removal of methanol. Acidic part of the extract, which was subjected twice to liquid-
liquid extraction with petroleum ether, was collected. pH value of the collected solution
was adjusted to 10 by adding ammonium hydroxide. The extract solution at elevated pH
values was subjected to liquid-liquid extraction with chloroform for four times. Finally,
crude alkaloid extract was obtained by collecting the chloroform parts. As a result of the
HPLC analytical column analysis, trace amount of harmol and harmalol alkaloids were
found in the crude alkaloid extract while harmine and harmaline contents of the extract
were calculated as 41% and 58%, respectively. Alkaloid extraction efficiency was found
also compatible with the literature, as 6.63 %.
Solvent extraction method was used in order to obtain olive leaf extract.
Extraction process, in which 70 % of aqueous ethanol solution was used as solvent, was

105
performed in 25°C and 250 rpm for 2 hours using solid/liquid ratio of 1/20. According
to the HPLC analytical column analysis results of the obtained extract, it was observed
that one gram of olive leaf dominantly includes 92.50 mg of oleuropein and 9.12 mg of
rutin. Moreover, it was also observed that minor amounts of polyphenolics such as
verbascoside, luteolin 7-glycoside are present in olive leaf extract. Besides, leaves of
plants such as vitex, cistus, terebinth and mastic used as inhibitors in this study were
also extracted by applying the process optimized for olive leaf.
Crude alkaloid extract obtained from harmal seed was collected into 3 fractions
by using semipreparative column in HPLC system and with the help of fractionation
unit compatible to this system. The purities of 2 major fractions of these, harmine and
harmaline fractions were determined by HPLC analytical column. Accordingly, 77% of
the part collected as harmine fraction was found as harmine and nearly 23% of it was
characterized as harmaline. It was also found that the harmaline fraction includes 93%
of harmaline and nearly 7% of harmine.
Fractionation of the olive leaf extract was performed by using silk fibroin
packed column. Among the parts collected as a total of six fractions, only 2 fractions of
them, one of which eluted with water was rich in oleuropein and other eluted with
ethanol was found rich in rutin and other glycosides, were used in inhibition studies.
Oleuropein content of the water fraction was determined as 91% according to the HPLC
analyses. In the ethanol fraction, it was revealed that rutin and verbascoside content has
great majority.
Before the inhibition studies, the active protein amount of COMT enzyme was
determined. In this study, which was performed according to the Bradford protein
determination method, active protein amount of COMT enzyme was found as 27.7 %
with respect to BSA that was reference protein. COMT enzyme activity was examined
both spectrophotometrically and fluorometrically and it was revealed that the
fluorometric activity determination method was more accurate and economical
compared to absorbance. In the fluorometric activity determination study, formation
kinetics of scopoletin was followed and firstly, linear operation concentration ranges for
COMT enzyme and for both substrates SAM and aesculetin was tried to be determined.
According to the results of this study, enzyme and aesculetin concentrations were fixed
at 11 µg protein/ml and 4 µM, respectively in the inhibition experiments. It was
revealed that SAM which is the rate limiting substrate demonstrated inhibitory feature

106
at its concentrations of higher than 100 µM. Km values for SAM and aesculetin were
calculated as 3.5 ± 0.3 µM and 6.4 ± 0.4 µM, respectively.
In the study, where basically inhibition performances of extracts and fractions
obtained from harmal seed and olive leaf on COMT enzyme were examined, 3,5-DNC
was used as reference inhibitor. Apart from that, performances of 17 inhibitors
including alkaloid and polyphenolic standards, extracts and fractions were tested. While
it was found that inhibition performance of 3,5-DNC, which is the best known
uncompetitive inhibitor of COMT, was 100 times higher than especially harmine and
harmaline alkaloid standards and fractions, it demonstrated 200 and 300 times
inhibitory effect than polyphenolics.
Taking into consideration the concentration ranges of inhibitors, despite it was
observed that their performances were not as effective as positive control, the inhibition
percentages of extracts obtained from harmal seed and from vitex, terebinth and mastic
leaves were found quite high. While the inhibition mechanisms for major alkaloids
present in harmal seed were explained with the mixed type model, it was determined
that in the presence of standards, extracts and fractions of olive leaf polyphenolics,
uncompetitive inhibition occurred. On contrary to that, polyphenolic extracts of the
other four plants behaved as mixed type inhibitors similar to major alkaloids.
In this study, crude extract of the harmal seed, which was one the plant source of
which the inhibition performances of both extract and their fractions were examined
together, and its harmine and harmaline rich fractions demonstrated the highest
inhibition among the other plant species and were found very close to each other. This
result obtained was found in good accordance with HPLC analysis results and it was
revealed that the high inhibitory effect of harmal seed extract arises from its harmine
and harmaline content. Concentration values (IC50) of the alkaloids where 50 %
inhibition occurs were found between 0.69 and 1.10 µg/ml. Among these, harmine
fraction showed the highest inhibition percentage compared to those of other alkaloid
fractions, crude alkaloid extract and its own standard. Competitiveness and
noncompetitiveness inhibition constants (Ki and αKi) of the harmine fraction which was
found to be a mixed type inhibitor were calculated as 0.15±0.07 µg/ml and 1.28±0.06
µg/ml, respectively.
According to the results of the inhibition experiments performed with standards,
crude extract and fractions of olive leaf polyphenolics, water fraction rich in oleuropein
was found to have the highest inhibitory effect. Inhibition constant (αKi) of this fraction,

107
which was determined as an uncompetitive inhibitor of COMT, and its IC50 value were
calculated as 4.14±0.28 µg/ml and 4.09±0.16 µg/ml, respectively. This result, contrary
to expected, was found very different from those of oleuropein standard and olive leaf
crude extract. It was thought that the presence of compounds together may have both
positive and sometimes negative effects on their specific biological activities. Thus, the
importance of fractioning had been understood.
As a more general conclusion, it is known that today synthetic COMT inhibitors
are still used in the treatment of Parkinson disease. It was determined that plant derived
compounds have great potential to replace with their synthetic derivatives. Especially, it
was revealed that harmal seed alkaloids and olive leaf fractions are promising natural
COMT inhibitors. Moreover, it is known that these alkaloid and polyphenolics based
natural compounds have the possibility to be functionally used in food and cosmetics
industries because of their antioxidant and antimicrobial features.

108
REFERENCES
Akalın S. H., ‘Elemtere Fis, Anadolu’da Buyu ve Inanclar’, İstanbul, “Uzerlik”, 2003. http://turkoloji.cu.edu.tr/CUKUROVA/sempozyum/semp_2/ akalin.pdf
Akyol O., ‘Şizofrenide Oksidatif Stres’, Kocatepe Tıp Dergisi, 2004, 5, 15-25. Al-Azzawie H. F., Saeed A. M. S., ‘Hypoglycemic and Antioxidant Effect of
Oleuropein in Alloxan-Diabetic Rabbits’, Life Sciences, 2006, 78, 1371-1377. Altıok E., Baycin D., Bayraktar O., Ülkü S., ‘Isolation of Polyphenols from the Extracts
of Olive Leaves (Olea europaea L.) by Adsorption on Silk Fibroin’, Separation and Purification Technology, 2008, 62, 342-348.
Angelopoulou D., Demetzos C., Perdetzoglou D., ‘An interpopulation study of the
essential oils of Cistus parviflorus L. growing in Crete (Greece)’, Biochemical Systematics and Ecology, 2001, 29, 405-415.
Aoyama N., Tsunoda M., Imai K., ‘Improved Assay for Catechol-O-Methyltransferase
Activity Utilizing Norepinephrine as an Enzymatic Substrate and Reversed-Phase High-Performance Liquid Chromatography with Fluorescence Detection’, Journal of Chromatography A, 2005, 1074, 47-51.
Bäckstrom R., Honkanen E., Pippuri A., Kairisalo P., Pystynen J., Heinola K., Nissinen
E., Linden I. B., Mlinnisto P. T., Kaakkola S., Pohto P., ‘Synthesis of Some Novel Potent and Selective Catechol-O-Methyltransferase Inhibitors’, Journal of Medicinal Chemistry, 1989, 32, 841-846.
Bai H. W., Shim J. Y., Yu J., Zhu B. T., ‘Biochemical and Molecular Modeling Studies
of the O-Methylation of Various Endogenous and Exogenous Catechol Substrates Catalyzed by Recombinant Human Soluble and Membrane-Bound Catechol-O-Methyltransferases’, Chemical Research in Toxicology, 2007, 20, 1409-1425.
Bailey K., Cowling R., Tan E. W., Webb D., ‘A Colormetric Assay for Catechol-O-
Methyltransferase’, Bioorganic & Medicinal Chemistry, 2004, 12, 595-601. Bailey K., Tan E. W., ‘Synthesis and Evaluation of Bifunctional Nitrocatechol
Inhibitors of Pig Liver Catechol-O-Methyltransferase’, Bioorganic & Medicinal Chemistry, 2005, 13, 5740-5749.
Baycin D., Altıok E., Ülkü S., Bayraktar O., ‘Adsorption of Olive Leaf (Olea europaea
L.) Antioxidants on Silk Fibroin’, Journal of Agriculture and Food Chemistry, 2007, 55, 1227-1236.
Benhammou N., Atik B. F., Kadifkova P. T., ‘Antioxidant and antimicrobial activities
of the Pistacia lentiscus and Pistacia atlantica extracts’, African Journal of Pharmacy and Pharmacology, 2008, 2, 22-28.

109
Bertolini F., Novaroli L, Carrupt P. A., Reist M., ‘Novel Screening Assay for Antioxidant Protection against Peroxyl Radical-Induced Loss of Protein Function’, Journal of Pharmaceutical Sciences, 2007, 96, 2931-2944.
Bonifacio M. J., Palma P. N., Almeida L., Soares-da-Silva P., ‘Catechol-O-
Methyltransferase and Its Inhibitors in Parkinson’s Disease’, CNS Drug Reviews, 2007, 13, 352-379.
Bonifati V., Meco G., ‘New, Selective Catechol-O-Methyltransferase Inhibitors as
Therapeutic Agents in Parkinson’s Disease’, Pharmacology & Therapeutics, 1999, 81, 1-36.
Bonilla M., Salido S., Beekb T., Linares-Palomino P. J., Altarejos J., Nogueras M.,
S´anchez A., ‘Isolation and Identification of Radical Scavengers in Olive Tree (Olea europaea) Wood’, Journal of Chromatography A, 2006, 1112, 311-318.
Cavalli A., Bolognesi M. L., Minarini A., Rosini M., Tumiatti V., Recanatini M.,
Melchiorre C., ‘Multi-Target-Directed Ligands to Combat Neurodegenerative Diseases’, Journal of Medicinal Chemistry, 2008, 51, 347-372.
Chatterjee S. S., Noldner M., Koch M., Erdelmeier C., ‘Antidepressant Activity of
Hypericum Perforatum and Hyperforin, the Neglected Possibility’, Pharmacopsychiatry, 1998, 31, 7-15.
Chen D., Wang C. Y., Lambert J. D., Ai N., Welsh W. J., Yang C. S., ‘Inhibition of
Human Liver Catechol-O-Methyltransferase by Tea Catechins and Their Metabolites: Structure-Activity Relationship and Molecular-Modeling Studies’, Biochemical Pharmacology, 2005, 69, 1523-1531.
Chen S., Le W., ‘Neuroprotective Therapy for Parkinson's Disease’, American Journal
of Therapeutics, 2006, 13, 445-457. Cheng D. H., Ren H, Tang X. C., ‘Huperzine A, a Novel Promising
Acetylcholinesterase Inhibitor’, Neuroreport, 1996, 8, 97-101. Cheng D. H., Tang X. C., ‘Comparative Studies of Huperzine A, E2020, and Tacrine on
Behavior and Cholinesterase Activities’, Pharmacology Biochemistry & Behavior, 1998, 60, 377-386.
Chiueh C. C., Andoh T., Lai A. R., Lai E., Krishna G., ‘Neuroprotective Strategies in
Parkinson's Disease: Protection Against Progressive Nigral Damage Induced by Free Radicals’, Neurotoxicity Research, 2000, 2, 293-310.
Chung Y. K., Heo H. J., Kim E. K., ‘Inhibitory Effect of Ursolic Acid Purified from
Origanum Majorana L. on the Acetylcholinesterase’, Molecules and Cells, 2001, 11, 137-143.
Copeland R. A., ‘Enzymes: A Practical Introduction to Structure, Mechanism and Data
Analysis’, 2nd ed., Wiley, New York, 2000.

110
De Boer A. G., Gaillard P. J., ‘Drug Targeting to the Brain’, Annual Review of Pharmacology and Toxicology, 2007, 47, 323–55.
De Santi C., Giulianotti P. C., Pietrabissa A., Mosca F., Pacifici G. M., ‘Catechol-O-
Methyltransferase: Variation in Enzyme Activity and Inhibition by Entacapone and Tolcapone’, European Journal of Clinical Pharmacology, 1998, 54, 215-219.
Dhar K., Rosazza J. P. N., ‘Purification and Characterization of Streptomyces Griseus
Catechol-O-Methyltransferase’, Applied and Environmental Microbiology, 2000, 66, 4877-4882.
Dingemanse J., ‘Catechol-O-Methyltransferase Inhibitors: Clinical Potential in the
Treatment of Parkinson’s Disease’, Drug Development Research, 1997, 42, 1-25. Erdal N., Erdal M. E., Çamdeviren H., Gökdoğan T., Herken H., ‘Bir Grup Sağlıklı
Gönüllüde Kateşol-O-Metiltransferaz (KOMT) Gen Polimorfizmi’, Bulletin of Clinical Psychopharmacology, 2002, 12, 174-178.
Esposito E., Rotilio D., Di Matteo V., Di Giulio C., Cacchio M., Algeri S., ‘A Review
of Specific Dietary Antioxidants and the Effects on Biochemical Mechanisms Related to Neurodegenerative Processes’, Neurobiology of Aging, 2002, 23, 719-735.
Garcia O. B., Castillo J., Lorente J., Ortuno A., Del-Rio J. A., ‘Antioxidant Activity of
Phenolics Extracted From Olea Europaea L. Leaves’, Food Chemistry, 2000, 68, 457-462.
Ghica M. E., Brett A. M. O., ‘Electrochemical Oxidation of Rutin’, Electroanalysis,
2005, 17, 313-318. Gogos J. A., Morgan M., Luine V., Santha M., Ogawa S., Pfaff D., Karayiorgou M.,
‘Catechol-O-Methyltransferase Deficient Mice Exhibit Sexually Dimorphic Changes in Catecholamine Levels and Behavior’, Proceedings of the National Academy of Sciences, 1998, 95, 9991-9996.
Grella B., Dukat M., Young R., Teitler M., Herrick-Davis K., Gauthier C.B.,Glennon R.
A., ‘Investigation of Hallucinogenic and Related Beta-Carbolines’, Drug and Alcohol Dependence, 1998, 50, 99-107.
Gugler R., Dengler H. J., ‘Inhibition of Human Liver Catechol-O-methyltransferase by
Flavonoids’, Naunyn-Schmiedeberg's Archives of Pharmacology, 1973, 276, 223 – 233.
Guldberg H. C., Marsden C. A., ‘Catechol-O-Methyl Transferase: Pharmacological
Aspects and Physiological Role’, Pharmacological Reviews, 1975, 27, 135-206. Halpern J. H., ‘Hallucinogens and Dissociative Agents Naturally Growing in the United
States’, Pharmacology & Therapeutics, 2004, 102, 131-138.

111
Hirano Y., Tsunoda M., Shimosawa T., Fujita T., Funatsu T., ‘Measurement of Catechol-O-Methyltransferase Activity in the Brain of Dahl Salt-Sensitive Rats’, Biological and Pharmaceutical Bulletin, 2007, 30, 2178-2180.
Hou W. C., Lin R. D., Chen C. T., Lee M. H., ‘Monoamine Oxidase B (MAO-B)
Inhibition by Active Principles from Uncaria Rhynchophylla’, Journal of Ethnopharmacology, 2005, 100, 216-220.
Houghton P. J., Houghton Howes M. J., ‘Natural Products and Derivatives Affecting
Neurotransmission Relevant to Alzheimer’s and Parkinson’s Disease’, Neurosignals, 2005, 14, 6-22.
Howes M. J. R., Perry N. S. L., Houghton P. J., ‘Plants with Traditional Uses and
Activities, Relevant to the Management of Alzheimer’s Disease and Other Cognitive Disorders’, Phytotherapy Research, 2003, 17, 1-18.
Institute of Neurodegenerative Diseases, University of California, http://ind.university-
ofcalifornia.edu/diseases, 2009. Joy J. E., Watson J. H. J., Benson J. A., ‘Marijuana and Medicine; Assessing the
Science Base’, National Academy Press, Washington, DC, 1999. Juma G. M., ‘Peganum Harmala Production’, European Journal of Scientific Research,
2005, 11, 6-12. Kadowaki M., Ootani E., Sugihara N., Furuno K., ‘Inhibitory Effects of Catechin
Gallates on O-Methyltranslation of Protocatechuic Acid in Rat Liver Cytosolic Preparations and Cultured Hepatocytes’, Biological and Pharmaceutical Bulletin, 2005, 28, 1509-1513.
Kartal M., Altun M. L., Kurucu S., ‘HPLC Method for the Analysis of Harmol,
Harmalol, Harmine and Harmaline in the Seeds of Peganum Harmala L.’, Journal of Pharmaceutical and Biomedical Analysis, 2003, 31, 263-269.
Khan O. Y., ‘Studies in the Chemical Constituents of Peganum Harmala’, Ph. D.
Dissertation, University of Karachi, Pakistan, 1990. Kong L. D., Christopher H. K., Cheng H. K., Tan R. X., ‘Inhibition of MAO-A and B
by Some Plant-Derived Alkaloids, Phenols and Anthraquinones’, Journal of Ethnopharmacology, 2004, 91, 351-355.
Köse E., Sarsılmaz M., Ögetürk M., Kub İ., Kavaklı A., Zararsız İ., ‘Öğrenme
Davranışlarında Gül Esans Yağ Aromasının Rolü: Deneysel Bir Çalışma’, Fırat Tıp Dergisi, 2007, 12, 159-162.
Kurisawa M., Chung, J. E., Uyama, H., Kobayashi, S., ‘Enzymatic Synthesis and
Antioxidant Properties of Poly(rutin)’, Biomacromolecules, 2003, 4, 1394- 1399.

112
Kurkela M., Siiskonen A., Finel M., Tammela P., Taskinen J., Vuorela P., ‘Microplate Screening Assay to Identify Inhibitors of Human Catechol-O-Methyltransferase’, Analytical Biochemistry, 2004, 331, 198-200.
Lautala P., Ulmanen I., Taskinen J., ‘Molecular Mechanisms Controlling the Rate and
Specificity of Catechol-O-Methylation by Human Soluble Catechol-O-Methyltransferase’, Molecular Pharmacology, 2001, 59, 393-402.
Lautala P., ‘Catechol O-Methyltransferase: Glucuronidation of Inhibitors and
Methylation of Substrates’, Academic Dissertation, University of Helsinki, Finland, 2000.
Lautala P., Ulmanen I., Taskinen J., ‘Radiochemical High-Performance Liquid
Chromatographic Assay for the Determination of Catechol-O-Methyltransferase Activity Towards Various Substrates’, Journal of Chromatography B, 1999, 736, 143-151.
Learmonth D. A., Bonifacio, M. J. Soares-da-Silva P., ‘Synthesis and Biological
Evaluation of a Novel Series of “Ortho-Nitrated” Inhibitors of Catechol-O-Methyltransferase,’ Medicinal Chemistry, 2005, 48, 8070-8078.
Learmonth D. A., Freitas A. P., ‘Chemical Synthesis and Characterization of
Conjugates of a Novel Catechol-O-Methyltransferase Inhibitor’, Bioconjugate Chemistry, 2002, 13, 1112-1118.
Lee-Huang S., Zhang L., Huang P., Chang Y., Huang P. L., ‘Anti-HIV Activity of
Olive Leaf Extract (OLE) and Modulation of Host Cell Gene Expression by HIV-1 Infection and OLE Treatment’, Biochemical and Biophysical Research Communications, 2003, 307, 1029-1037.
Lerner C., Masjost B., Ruf A., Gramlich V., Jakob-Roetne R., Zürcher G., Borroni E.,
Diederich F., ‘Bisubstrate Inhibitors for the Enzyme Catechol-O-Methyltransferase (COMT): Influence of Inhibitor Preorganisation and Linker Length Between The Two Substrate Moieties on Binding Affinity’, Organic and Biomoecular Chemistry, 2003, 1, 42-49.
Lerner C., Siegrist R., Schweizer E., Diederich F., ‘Bisubstrate Inhibitors for the
Enzyme Catechol O-Methyltransferase (COMT): Dramatic Effects of Ribose Modifications on Binding Affinity and Binding Mode’, Helvetica Chimica Acta, 2003, 86, 1045-1062.
Leskovac V., ‘Comprehensive Enzyme Kinetics’, Kluwer Academic Publisher, New
York, 2003. Lin R. D., Hou W. C., Yen K. Y., Lee M. H., ‘Inhibition of Monoamine Oxidase B
(MAO-B) by Chinese Herbal Medicines’, Phytomedicine, 2003, 10, 650–656.

113
Lotta T., Vidgren J., Tilgmann C., Ulmanen I., Melen K., Julkunen I., Taskinentn J., ‘Kinetics of Human Soluble and Membrane-Bound Catechol-O-Methyltransferase: A Revised Mechanism and Description of the Thermolabile Variant of the Enzyme’, Biochemistry, 1995, 34, 4202-4210.
Loureiro A. I., Bonifácio M. J., Fernandes-Lopes C., Almeida L., Wright L. C., Soares-
da-Silva P., ‘Human Metabolism of Nebicapone (BIA 3-202), A Novel COMT Inhibitor: Characterization of in Vitro Glucuronidation’, Drug Metabolism and Disposition, 2006, 34, 1856-1862.
Lozano A. M., Lang A. E., Hutchison W. D., Dostrovsky J. O., ‘New Developments in
Understanding the Etiology of Parkinson's Disease and in its Treatment’, Current Opinion in Neurobiology, 1998, 8, 783-790.
Mamedov N., ‘Adaptogenic, Geriatric, Stimulant and Antidepressant Plants of Russian
Far East’, Journal of Cell and Molecular Biology, 2005, 4, 71-75. Mannistö P. T., Kaakkola S., ‘Catechol-O-methyltransferase (COMT): Biochemistry,
Molecular Biology, Pharmacology, and Clinical Efficacy of the New Selective COMT Inhibitors’, Pharmacological Reviews, 1999, 51, 593-628.
Mannistö P. T., Tuomainen P., Tuominen R. K., ‘Different in Vivo Properties of Three
New Inhibitors of Catechol-O-Methyltransferase in the Rat’, British Journal of Pharmacology, 1992, 105, 569-574.
Manyam B. V., Dhanasekaran M., Hare T. A., ‘Effect of Antiparkinson Drug HP-200
(Mucuna pruriens) on the Central Monoaminergic Neuro-Transmitters’, Phytotherapy Research, 2004, 18, 97-101.
Molchanov L. V., Plugar V. N., D'yakonov A. L., Aripov K. N., ‘Isolation of Peganine
and Deoxypeganine from the Total Alkaloids of Peganum Harmala Through Their Complex Salts’, Chemistry of Natural Compounds, 1996, 32, 56-58.
Nadeau S. E., ‘Parkinson's Disease’, Journal of American Geriatrics Society, 1997, 45,
233-240. Nagai M., Conney A. H., Zhu B. T., ‘Strong Inhibitory Effects of Common Tea
Catechins and Bioflavonoids on the O-Methylation of Catechol Estrogens Catalyzed by Human Liver Cytosolic Catechol-O-Methyltransferase’, Drug Metabolism and Disposition, 2004, 32, 497-504.
National Institute of Neurological Disorders and Stroke, http://www.ninds.nih.gov/
disorders/parkinsons_disease/parkinsons_disease.htm, 2009. National Parkinson Foundation, http://www.parkinson.org, 2009. Nissinen E., Lindén I. B., Schultz E., Pohto P., ‘Biochemical and Pharmacological
Properties of a Peripherally Acting Catechol-O-Methyltransferase Inhibitor Entacapone’, Naunyn-Schmiedeberg's Archives of Pharmacology, 1992, 346, 262-266.

114
Nissinen E., Linden I. B., Schultz E., Kaakkola S., Mannisto P. T., Pohto P., ‘Inhibition of Catechol-O-Methyltransferase Activity by Two Novel Disubstituted Catechols in the Rat’, European Journal of Pharmacology, 1988, 153, 263-269.
Olin J., Schneider L., ‘Galantamine of Alzheimer's disease’, Cochrane Database of
Systematic Reviews, 2001a, 1. Olin J., Schneider L., ‘Galantamine for Alzheimer's disease: Adult and Geriatric
Treatment and Preventative Interventions Branch’, Cochrane Database of Systematic Reviews, 2001b, 4.
Ono M., Yamasaki T., Konoshita M., Ikeda T., Okawa M., Kinjo J., Yoshimitsu H.,
Nohara T., ‘Five New Diterpenoids, Viteagnusins A - E, from the Fruit of Vitex agnus-castus’, Chemical and Pharmaceutical Bulletin, 2008, 56, 1621-1624.
Ott, J., ‘Entheogenic Drugs, Their Plant Sources and History’, Pharmacotheon, 1996,
205. Page L., ‘Olive Leaf Extract’, in Healthy Healing’, edited by Page L. G. (Traditional
Wisdom, USA), 2002, 107. Palma P. N., Rodrigues M. L., Archer M., Bonifacio M. J., Loureiro A. I., Learmonth
D. A., Carrondo M. A., Soares-da-Silva P., ‘Comparative Study of ortho- and meta-Nitrated Inhibitors of Catechol-O-methyltransferase: Interactions with the Active Site and Regioselectivity of O-Methylation’, Molecular Pharmacology, 2006, 70, 143-153.
Parkinson’s Disease Society, www.parkinsons.org.uk, 2009. Paulini R., Lerner C., Diederich F., Jakob-Roetne R., Zürcherb G., Borroni E.,
‘Synthesis and Biological Evaluation of Potent Bisubstrate Inhibitors of the Enzyme Catechol O-Methyltransferase (COMT) Lacking a Nitro Group’, Helvetica Chimica Acta, 2006, 89, 1856-1887.
Pekin B., ‘Bazı Kompleks Enzim Reaksiyonları ile İnhibisyon Mekanizmalarının
Matemetiksel Analizi’, Ege Üniversitesi Fen Fakültesi İlmi Raporlar Serisi, 1970, 85.
Perry E. K., Pickering A. T., Wang W. W., Houghton P. J., Perry N. S., ‘Medicinal
Plants and Alzheimer's Disease: From Ethnobotany to Phytotherapy’, Journal of Pharmacy and Pharmacology, 1999, 51, 527-34.
Perry N. S. L., Houghton P. J., Jenner P., ‘Salvia Lavandulaefolia Essential Oil Inhibits
Cholinesterase in Vivo’, Phytomedicine, 2002, 9, 48-51. Pierce Biotechnology, Inc., Coomassie Plus – The Better Bradford™ Assay Kit,
http://www.piercenet.com, 2009.
115
Polymeropoulos M. H., Higgins J. J., Golbe L. I., Nussbaum R. L., ‘Mapping of a Gene for Parkinson's Disease to Chromosome 4q21-q23’, Science, 1996, 274, 1197-1198.
Proestos C., Komaitis M., ‘Ultrasonically Assisted Extraction of Phenolic Compounds
from Aromatic Plants Comparison with Conventional Extraction Techniques’, Journal of Food Quality, 2006, 29, 567-582.
Ranalli A., Contento, S., Lucera, L., Febo, M., Archegiani, D., Fonzo V., ‘Factors
Affecting the Contents of Iridoid Oleuropein in Olive Leaves (Olea europaea L.)’, Journal of Agricultural Food Chemistry, 2006, 54, 434-440.
Reenilä I., ‘Catechol-O-Methyltransferase Activity: Assay, Distribution and
Pharmacological Modification’, Academic Dissertation, University of Helsinki, Finland, 1999.
Rosenberg I.M., Protein Analysis and Purification: Benchtop Techniques, Birkhäuser,
Boston, 1996, 110-117. Ruottinen H. M., Rinne U. K., ‘COMT Inhibition in the Treatment of Parkinson’s
Disease’, Journal of Neurology, 1998, 245, 25-34. Salyan M. E. K., Pedicord D. L., Bergeron L., Mintier G. A., Hunihan L., Kuit K.,
Balanda L. A., Robertson B. J., Feder J. N., Westphal R., Shipkova P. A., Blat Y., ‘A General Liquid Chromatography/Mass Spectroscopy-Based Assay for Detection and Quantitation of Methyltransferase Activity’, Analytical Biochemistry, 2006, 349, 112-117.
Savournin C., Baghdikian B., Elias R., Dargouth-Kesraoui F., Boukef K., Balansard G.,
‘Rapid High-Performance Liquid Chromatography Analysis for the Quantitative Determination of Oleuropein in Olea europaea Leaves’, Journal of Agricultural Food Chemistry, 2001, 49, 618-621.
Schliebs R., Liebmann A., Bhattacharya S. K., Kumar A., Ghosal S., Bigl V. R.,
‘Systemic Administration of Defined Extracts from Withania Somnifera (Indian Ginseng) and Shilajit Differentially Affects Cholinergic but not Glutamatergic and Gabaergic Markers in Rat Brain’, Neurochemistry International, 1997, 30, 181-190.
Schwarz M. J., Houghton P. J., Rose S., Jenner P., Lees A. D., ‘Activities of Extract and
Constituents of Banisteriopsis Caapi Relevant Parkinsonism’, Pharmacology Biochemistry and Behavior, 2003, 75, 627-633.
Sharaf M., El-Ansari M. A., Matlın S. A., Sale N. A. M., ‘Four Flavonoid Glycosides
from Peganum Harmala’, Phytochemisty, 1997, 44, 533-536. Shen X., Puthran N., Weissman A., ‘A Refined HPLC Method to Measure
Catecholamine-O-Methyltransferase Activity in Selected Brain Regions, Journal of Neuroscience Methods, 2005, 144, 137-142.

116
Sheu J. R., Hsiao G., Chou P. H., Shen M. Y., Chou D. S., ‘Mechanisms Involved in the Antiplatelet Activity of Rutin, Glycoside of the Flavonol Quercetin, in Human Platelets’, Journal of Agricultural and Food Chemistry, 2004, 52, 4414-4418.
Shuler M. L., Kargı F., ‘Bioprocess Engineering: Basic Concepts’, 2nd ed., Prentice Hall
PTR, 2001. Singh N., Pillay V, Choonara Y. E., ‘Advances in the Treatment of Parkinson’s
Disease’, Progress in Neurobiology, 2007, 81, 29-44. Sirnonian N. A., Coyle J. T., ‘Oxidative Stress in Neurodegenerative Diseases’, Annual
Review of Pharmacology and Toxicology, 1996, 36, 83-106. Sloley B. D., Urichuk L. J., Morley P., Durkin J., Shan J. J., Pang P. K., Coutts R. T.,
‘Identification of Kaempferol as a Monoamine Oxidase Inhibitor and Potential Neuroprotectant in Extracts of Ginkgo Biloba Leaves’, Journal of Pharmacy and Pharmacology, 2000, 52, 451-459.
Somoza B., Sanchez de Rojas V. R., Ortega T., Villar A. M., ‘Vasodilator effects of the
extract of the leaves of Cistus populifolius on rat thoracic aorta’, Phytotherapy Research, 1996, 10, 304-308.
Srivastava S., Verma R. K., Gupta M. M., Singh S. C., Kumar S., ‘HPLC Determination
of Vasicine and Vasicinone in Adhatoda Vasica with Photo Diode Array Detection’, Journal of Liquid Chromatography & Related Technologies, 2001, 24, 153-159.
Sudha K., Rao A. V., Rao S., Rao A., ‘Free Radical Toxicity and Antioxidants in
Parkinson’s Disease’, Neurology India, 2003, 51, 60-62. SukYin A., Catechol-O-Methyltransferase (COMT) Gene and Breast Cancer, Technical
Report, National Office of Public Health Genomics, 2002. Sumio O., ‘The Physiological Function of the Blood-Brain Barrier Transporters as the
CNS Supporting and Protecting System’, Journal of the Pharmaceutical Society of Japan, 2004, 124, 791-802.
Theodore L. S., ‘“Rational Hope” in the Early Treatment of Parkinson’s Disease’,
Canadian Journal of Physiology and Pharmacology, 1999, 77, 375-382. Topcu G., Ay M., Bilici A., Sarıkürkçü C., Öztürk M., Ulubelen A., ‘A new flavone
from antioxidant extracts of Pistacia terebinthus’, Food Chemistry, 2007, 103, 816–822.
Tsunoda T., Takezawa K., Masuda M., Imai K., ‘Rat Liver and Kidney Catechol-O-
Methyltransferase Activity Measured by High-Performance Liquid Chromatography with Fluorescence Detection’, Biomedical Chromatography, 2002, 16, 536-541.

117
Van Duursen M. B. M., Sanderson J. T., de Jong P. C., Marlies K., Van den Berg M., ‘Phytochemicals Inhibit Catechol-O-Methyltransferase Activity in Cytosolic Fractions from Healthy Human Mammary Tissues: Implications for Catechol Estrogen-Induced DNA Damage’, Toxicological Sciences, 2004, 81, 316-324.
Veser J., ‘Kinetics and Inhibition Studies of Catechol O-Methyltransferase from the
Yeast Candida tropicalis’, Journal of Bacteriology, 1987, 169, 3696-3700. Vieria-Coelho M. A., Soares-da-Silva P., ‘Ontogenic Aspects of Liver and Kidney
Catechol-O-Methyltransferase Sensitivity to Tolcapone’, British Journal of Pharmacology, 1996, 117, 516-520.
Yassin M. S., Cheng H., Ekblom J., Oreland L., ‘Inhibitors of catecholamine
metabolizing enzymes cause changes S-adenosylmethionine and S-adenosylhomocysteine in the rat brain’, Neurochemistry International, 1998, 32, 53-59.
Waidmeier P. C., Baumann P. A., Feldtrauer J. J., Hauser K., Bittiger H., Bischoff S.,
Sprecher G., ‘CGP 28014 a New Inhibitor of Cerebral Catechol-O-Methylation with a Non-Catechol Structure’, Naunyn-Schmiedeberg's Archives of Pharmacology, 1990, 342, 305-311.
Wake G., Court J., Pickering A., ‘CNS Acetylcholine Receptor Actvity’,
Ethnopharmacology, 2000, 69, 105-14. Weinreb O., Mandel S., Amit T., Youdim M. B. H., ‘Neurological Mechanisms of
Green Tea Polyphenols in Alzheimer’s and Parkinson’s Diseases’, Journal of Nutritional Biochemistry, 2004, 15, 506-516.
Zhang R. W., Tang X. C., Han Y. Y., ‘Drug Evaluation of Huperzine A in the
Treatment of Senile Memory Disorders’, Chung Kuo Yao Li Hsueh Pao, 1991, 12, 250-252.
Zheng W., Chodobski A., ‘The Blood-Cerebrospinal Fluid Barrier’, CRC Press, Florida,
2004. Zhu B. T., Shim J. Y., Nagai M., Bai H. W., ‘Molecular Modelling Study of the
Mechanism of High-Potency Inhibition of Human Catechol-O-Methyltransferase by (-)-Epigallocatechin-3-O-Gallate’, Xenobiotica, 2008, 38, 130-146.
Zhu B. T., ‘CNS Dopamine Oxidation and Catechol-O-Methyltransferase: Importance
in the Etiology, Pharmacotherapy, and Dietary Prevention of Parkinson's Disease’, International Journal of Molecular Medicine, 2004, 13, 343-353.
Zhu B. T., Patel U. K., Cai M. X., Lee A. J., Conney A. H., ‘Rapid Conversion of Tea
Catechins to Monomethylated Products by Rat Liver Cytosolic Catechol-O-Methyltransferase’, Xenobiotica, 2001, 31, 879-890.

118
APPENDIX A
CALIBRATION CURVES OF ALKALOIDS AND SAMPLE CALCULATION
It has been determined with High Performance Liquid Chromatography (HPLC)
analyses that harmol, harmalol, harmine and harmaline are the major alkaloids present
in the extract obtained from harmal seed. Calibration curves have been obtained with
their standards in order to determine the quantifications of these alkaloids. For
calibration of each standard alkaloid, concentrations given in section 5.1.1.-Table 5-3
have been used. Peak areas in the chromatograms obtained with HPLC analyses
performed in these concentrations have been modeled as a linear function of the
concentration.
y = 38,59xR2 = 0,9839
0
5000
10000
15000
20000
25000
30000
35000
40000
45000
0 200 400 600 800 1000 1200
Harmol concentration (µg/ml)
Peak
Are
a
Figure A1. Harmol calibration curve

119
y = 55,51xR2 = 0,9717
0
10000
20000
30000
40000
50000
60000
70000
80000
0 200 400 600 800 1000 1200 1400
Harmalol concentration (µg/ml)
Peak
Are
a
Figure A2. Harmalol calibration curve
y = 42,476xR2 = 0,9999
0
5000
10000
15000
20000
25000
30000
35000
40000
45000
0 200 400 600 800 1000 1200
Harmin concentration (µg/ml)
Peak
Are
a
Figure A3. Harmine calibration curve
y = 81,658xR2 = 0,992
0
20000
40000
60000
80000
100000
120000
0 200 400 600 800 1000 1200 1400
Harmaline concentration (µg/ml)
Peak
Are
a
Figure A4. Harmaline calibration curve

120
Chromatogram obtained with HPLC analysis performed for the extract diluted 7
times is given in Section 5.1.1., in Figure 5-1. Accordingly, quantification calculation
for alkaloids was performed and parameters such as extraction efficiency, alkaloid
amount in the extract and fractions have been determined as a result of these
calculations.
Sample Calculation: A total of 165.76 mg extract was solved in 20 ml mobile
phase and diluted 7 times. After the diluted sample was filtered, it was injected to HPLC
system with 20 µl of injection volume. As a result of the analysis performed;
The harmine peak intensity on the chromatogram is integrated and the peak area
is found as 20829. By using calibration curve equation y=42.476x given in A3, value x
(concentration, µg/ml) has been calculated.
4.490476.42
20829==x µg/ml. This value is multiplied by total volume*dilution
factor and harmine alkaloid amount in the crude extract has been calculated in terms of
µg.
Harmine content (mg harmine/165.76 mg extract) =1000
7*20*4.490 =68.7 mg
harmine. As a result of this calculation it has been calculated that the extract includes
nearly 41% of harmine. Amounts of harmaline, harmol and harmalol alkaloids in the
extract were determined with the same calculation method. Accordingly, the peak area
of harmol and harmalol alkaloids in the extract could not be calculated since they were
below the detection limits. Harmaline content was found as 97.1 mg. Harmaline content
of crude alkaloid extract was found as 58% in percentage. It is thought that the
remaining part consists of harmol, harmalol and other unidentified alkaloid derivatives.
In this extraction method, initially 2500 mg of powdered harmal seed was used.
At the end of the extraction process, 165.76 mg crude alkaloid extract was obtained.
Therefore;
Extraction efficiency was calculated as, mg alkaloid/mg seed (%) = 2500
100*76.165 = %
6.63.

121
APPENDIX B
CALIBRATION CURVES OF OLEUROPEIN AND RUTIN AND SAMPLE CALCULATION
As in defining alkaloid amounts in the alkaloid extract, amounts of oleuropein
and rutin in the olive leaf extract were calculated using peak area values obtained from
HPLC analysis results.
y = 4,9444x - 27,108R2 = 0,9988
0
5000
10000
15000
20000
25000
30000
35000
0 1000 2000 3000 4000 5000 6000 7000
Oleuropein concentration (µg/ml)
Peak
Are
a
Figure B1. Oleuropein calibration curve
y = 6,213x - 632,86R2 = 0,9984
0
5000
10000
15000
20000
25000
30000
35000
40000
0 1000 2000 3000 4000 5000 6000 7000
Rutin concentration (µg/ml)
Peak
Are
a
Figure B2. Rutin calibration curve

122
Sample Calculation:
One gram of olive leaf powder is extracted at a solid/liquid ratio of 1/20.
According to the result of the HPLC analysis of the crude extract obtained with the
extraction process, oleuropein peak area was calculated as 22815. Using the calibration
curve equation y=4.9444x-27.108 given in Figure B1, x value (concentration, µg/ml)
was calculated.
46249444.4
108,2722815=
+=x µg/ml. This value was multiplied by total
extraction volume (20 ml) and the amount of oleuropein in one gram of olive leaf has
been calculated. Accordingly, it was calculated that one gram of olive leaf includes 92.5
mg oleuropein and according to the similar calculations for rutin, 9.12 mg of rutin.

123
APPENDIX C
CALIBRATION CURVE OF SCOPOLETIN AND SAMPLE CALCULATION
According to fluorometric enzyme activity determination method, aesculetin is
transformed to scopoletin as a result of COMT catalyzed O-methylation reaction.
Production rate of scopoletin which has fluorescence feature also by itself, as a result of
the reaction was measured at 355 nm excitation and 460 nm emission wavelengths. By
adding different amounts of scopoletin into the reaction medium, an increase in
fluorescence was achieved and therefore calibration curve was obtained (Figure C1).
y = 309,91xR2 = 0,9871
0
1000
2000
3000
4000
5000
6000
7000
8000
9000
0 5 10 15 20 25 30scopoletin amount (nmol)
Rel
ativ
e Fl
uore
senc
e U
nit (
RFU
)
Figure C1: Scopoletin calibration curve
Slope of the calibration curve given in Figure C1 is calculated as 309.91. This
value indicated that a nanomole scopoletin is identical to 309.91 units of fluorescence
and it was used in activity calculations.
Sample Calculation:
For instance, in inhibition experiments performed with fluorometric method,
blank solution fluorescence change (ΔRFB) was found 20.282 for 30 minutes reaction

124
time interval. In a reaction medium of total 250 µl volume performed in a 96-well plate,
there is 2.2 µg of protein. Therefore, reaction rate is calculated as;
9916.0)0022.0)(30)(91.309(
282.20)0022.0)(30)(91.309(
==Δ
= RFBv nmole scopoletin /min. mg
protein