inhibition mechanisms of hemoglobin, immunoglobulin g, and … · paper in forefront inhibition...
TRANSCRIPT

PAPER IN FOREFRONT
Inhibition mechanisms of hemoglobin, immunoglobulin G, and wholeblood in digital and real-time PCR
Maja Sidstedt1,2 & Johannes Hedman1,2& Erica L. Romsos3 & Leticia Waitara1,4 & Lars Wadsö5
& Carolyn R. Steffen3&
Peter M. Vallone3 & Peter Rådström1
Received: 15 December 2017 /Revised: 18 January 2018 /Accepted: 30 January 2018 /Published online: 5 March 2018# The Author(s) 2018. This article is an open access publication
AbstractBlood samples are widely used for PCR-based DNA analysis in fields such as diagnosis of infectious diseases, cancer diagnos-tics, and forensic genetics. In this study, the mechanisms behind blood-induced PCR inhibition were evaluated by use of wholeblood as well as known PCR-inhibitory molecules in both digital PCR and real-time PCR. Also, electrophoretic mobility shiftassay was applied to investigate interactions between inhibitory proteins and DNA, and isothermal titration calorimetry was usedto directly measure effects on DNA polymerase activity. Whole blood caused a decrease in the number of positive digital PCRreactions, lowered amplification efficiency, and caused severe quenching of the fluorescence of the passive reference dye 6-carboxy-X-rhodamine as well as the double-stranded DNA binding dye EvaGreen. Immunoglobulin G was found to bind tosingle-stranded genomic DNA, leading to increased quantification cycle values. Hemoglobin affected the DNA polymeraseactivity and thus lowered the amplification efficiency. Hemoglobin and hematin were shown to be the molecules in bloodresponsible for the fluorescence quenching. In conclusion, hemoglobin and immunoglobulin G are the two major PCR inhibitorsin blood, where the first affects amplification through a direct effect on the DNA polymerase activity and quenches the fluores-cence of free dye molecules, and the latter binds to single-stranded genomic DNA, hindering DNA polymerization in the first fewPCR cycles.
Keywords Blood . DNApolymerase . Digital PCR . PCR inhibition . PCR inhibitors . Real-time PCR
Introduction
Blood samples are widely used for polymerase chain reaction(PCR) analysis in fields such as diagnosis of infectious and
genetic diseases in clinical medicine and forensic genetics.Direct PCR analysis with blood, without prior DNA extrac-tion and purification, has been attempted to save time andreduce costs in routine analysis [1–6]. This approach is prom-ising but is still limited by PCR inhibition induced by bloodcompounds [7, 8]. In 1988, it was noted that Taq DNA poly-merase was affected by a substance co-purified with DNA inextracts prepared from human blood [9]. Early on, a hemecompound was implicated as an inhibitor in blood [10]. Tobypass inhibition by blood, researchers have screened for ro-bust DNA polymerases or engineered enzymes to im-prove compatibility with the inhibitors encountered in blood,and have identified facilitators that may allow amplification inthe presence of blood components [11–14].
PCR inhibitors may affect amplification by lowering or evenblocking the DNA polymerase activity or by interacting withthe nucleic acids (i.e., DNA template or primers) [15]. Werecently identified another mode of inhibition: quenching offluorescence, leading to failed detection of amplicons [16].The main amplification inhibitors in human whole blood arehemoglobin and immunoglobulin G (IgG) [8, 17]. Hemoglobin
Electronic supplementary material The online version of this article(https://doi.org/10.1007/s00216-018-0931-z) contains supplementarymaterial, which is available to authorized users.
* Johannes [email protected]
1 Applied Microbiology, Department of Chemistry, Lund University,P.O. Box 124, 221 00 Lund, Sweden
2 Swedish National Forensic Centre, 581 94 Linköping, Sweden3 Materials Measurement Laboratory, National Institute of Standards
and Technology, Gaithersburg, MD 20899-8314, USA4 Present address: Government Chemist Laboratory Authority,
P.O. Box 164, Dar es Salaam, Tanzania5 Division of Building Materials, Lund University, 221
00 Lund, Sweden
Analytical and Bioanalytical Chemistry (2018) 410:2569–2583https://doi.org/10.1007/s00216-018-0931-z

disturbs DNA polymerase activity, as shown by great differ-ences in hemoglobin tolerance between different DNA poly-merases [8]. Each hemoglobin molecule contains four hemegroups, which contain iron, and hence the ability to release ironhas been suggested to be the reasonwhy hemoglobin and bloodinhibit PCR [8]. IgG has been implicated as the cause of am-plification inhibition by blood plasma [17]. This is likely ageneral immunoglobulin effect, and not connected with specif-ic clones. IgG was suggested to act on single-stranded DNA(ssDNA), as the effect was partly counteracted by addition ofnontarget lambdaDNA and as inhibition was severer when IgGand target DNAwere heated together before PCR [17].
Previous work on elucidating PCR inhibition mechanismsof blood components was mainly performed by use of conven-tional PCR with gel electrophoresis [8, 10, 17]. Other PCR-based technologies, such as real-time PCR (qPCR) and digitalPCR (dPCR), may be affected in different ways, for example,because of different detection principles. Also, more informa-tion related to mechanisms may be acquired through the quan-titative real-time measurements of qPCR and dPCR. The con-tinuous development of inhibitor-tolerant DNA polymeraseshas improved the ability to analyze impure samples, possiblyleading to new bottlenecks in the analysis, adding to the need tostudy PCR inhibition mechanisms in a modern context.
The objective of this study was to investigate the mech-anisms behind PCR inhibition by blood and gain a greaterunderstanding of how blood disturbs the reaction. To thatend, qPCR and dPCR were combined with electrophoreticmobility shift assay (EMSA) and isothermal titration calo-rimetry (ITC) experiments. Apart from amplification inhi-bition, fluorescence quenching effects of blood and bloodcomponents were studied in qPCR and dPCR. In PCR ex-periments, it is difficult to separate inhibitor effects relatedto DNA polymerase activity from those connected withDNA interactions as the analysis success is determined bya combination of several subreactions. Therefore, possiblebinding between DNA and proteins was studied by EMSA,and ITC was applied to directly measure the impact ofblood compounds on DNA polymerase activity. Notably,by examination of whole blood as well as some of the majormolecular inhibitors (IgG, hemoglobin, hematin, and irontrichloride) it was possible to obtain enhanced understand-ing of the complexity of inhibition in the analysis of bloodsamples. The increased knowledge regarding PCR inhibi-tion mechanisms may be applied in the development ofmore robust PCR systems for direct PCR analysis of bloodsamples.
Materials and methods
Throughout the study, two assays were applied: one was ahuman-specific assay targeting the retinoblastoma 1 gene
(RB1) with an amplicon size of 156 bp [18] and the otherwas an assay targeting the Salmonella enterica serovarTyphimurium (Salmonella Typhimurium) invA gene withan amplicon size of 88 bp [19]. The DNA polymeraseused, ExTaq HS (TaKaRa Bio, Shiga, Japan), has beenshown to be robust to inhibitors in saliva traces and humicacid [16, 20]. The amount of DNA was kept constant inthe experiments to evaluate only the effects of theinhibitors.
Materials
DNA
The human genomic DNA for the RB1 assay in dPCR was amaterial derived from an in-house standard that was describedin previous reports [21, 22]. The genomic DNA for the RB1assay in qPCR was extracted from blood from one male byChelex-based extraction [23]. The DNA concentration wasmeasured with the Qubit dsDNA BR assay (Thermo FisherScientific) with use of a Qubit 3.0 fluorometer (Thermo FisherScientific). The genomic DNA for the invA assay was pre-pared in the following way: Salmonella Typhimurium strainCCUG 31969 was regenerated from a -80 °C glycerol stockby our streaking it on a brain–heart infusion agar plate (DifcoLaboratories, BD Diagnostic Systems, NJ, USA) and incu-bated overnight at 37 °C. Thereafter, a single colony wastransferred to liquid Luria–Bertani medium and incubatedat 37 °C until an optical density at 600 nm of approximate-ly 1 was reached. Thereafter a GeneJET genomic DNApurification kit (Thermo Fisher Scientific, Waltham, MA,USA) was used for isolation of the genomic DNA. Theconcentration was measured with the Qubit dsDNA BRassay as described above. All extracts were stored at -20°C. For preparation of ssDNA template, SalmonellaTyphimurium genomic DNA was heated for 5 min at 95 °Cand human genomic DNAwas heated for 15min at 95 °Cwithuse of an Applied Biosystems GeneAmp PCR system 9700thermal cycler (Thermo Fisher Scientific) and then flash-cooled and used immediately. Amplicons for use in theEMSA analysis were prepared by our purifying PCR productsfrom the invA assay performed in 50-μL reaction mixtureswith an Applied Biosystems GeneAmp PCR system 9700thermal cycler. The PCR products were purified with use ofa QIAquick gel extraction kit (Qiagen, Hilden, Germany), andthe concentration was measured with the Qubit dsDNA BRassay as described above.
Inhibitors
IgG (product number I4506) was purchased from Sigma-Aldrich (Taufkirchen, Germany) and dissolved in water toa stock concentration of 80 μg/μL. Human hemoglobin
2570 Sidstedt M. et al.

was purchased from Sigma-Aldrich (product numberH7379) and dissolved in water to a stock concentrationof 100 μg/μL. Porcine hematin was purchased fromSigma-Aldrich (product number H3281) and dissolved in0.1 M NaOH to form a 6 mM stock solution. FeCl3 waspurchased from Spectrum Chemical Manufacturing (NewBrunswick, NJ, USA) and dissolved in water to 0.1 M.Subsequent dilutions of the inhibitors were made withwater. For comparison purposes, the final concentrationsof inhibitors in the reactions were calculated on the basisof the molecular mass or molar mass of IgG (150 kDa),hemoglobin (64.5 kDa), hematin (633.49 g/mol), andFeCl3 (162.2 g/mol).
In dPCR, the following concentrations of the inhibitorswere tested in triplicate: (1) 2.5%, 5.0%, 7.5%, 10%, and15% (v/v) blood; (2) 27, 40, 53, 67, 110, 130, 160, and190 μM IgG; (3) 39, 78, 160, 310, 470, and 620 μM hemo-globin; (4) 1000, 2000, 3000, 4000, and 6000 μM hematin;(5) 1000, 2000, 3000, 4000, and 6000 μM FeCl3.
In qPCR, the following concentrations of the inhibitorswere tested in triplicate: (1) 0.00005%, 0.0005%, 0.005%,0.05%, 1%, 5%, 10%, and 20% (v/v) blood; (2) 1.7, 3.3,6.7, 13, 27, 33, and 53 μM IgG: (3) 0.1, 0.4, 0.8, 1.6, 16,62, 120, 160, 310, 470, and 620 μM hemoglobin; (4) 1, 5,10, 15, 25, 50, 60, and 80 μM hematin; (5) 1, 2, 5, 10, 20, 30,and 40 μM FeCl3.
Blood
Whole blood used in this work came from an anonymousdonor and was collected in a Vacuette K3EDTA tube(product number 454021, Greiner Bio-One International,Kremsmünster, Austria). The tubes were spray-dried with1.2–2.0 mg EDTA per milliliter of blood, correspondingto approximately 4 mM EDTA in the blood. For 15%whole blood in the PCR, there will be approximately0.6 mM EDTA in the reactions. We assessed the inhibito-ry effect of EDTA and found that 2 mM did not disturbthe reaction, whereas 4 mM EDTA resulted in completeamplification inhibition in dPCR with the invA assay (datanot shown), meaning that the EDTA in the blood is notexpected to impact amplification.
Digital PCR
All dPCR experiments were performed with a BioMark48.770 Digital Array real time/end point limiting dilutionassay system (Fluidigm, San Francisco, CA, USA). TheFluidigm Digital PCR Analysis tool provided by the man-ufacturer was used for all primary data reduction withassay-specific global intensity thresholds and a qualityscore threshold of 0.1. Cycles 1–60 were analyzed withthe user global analysis method for determination of the
positive chambers. Detailed results were exported as .csvfiles for further data handling.
The primers and hydrolysis probes (purchased fromThermo Fisher Scientific) used in this study target either theinvA gene of Salmonella Typhimurium DNA or the RB1 geneof human DNA. The probes used in this study were labeledwith 6-carboxyfluorescein. The passive reference dye 6-carboxy-X-rhodamine (ROX) (Thermo Fisher Scientific)was used for normalization.
For the invA assay, the amplification conditions were 95°C for 2 min, followed by 60 cycles of 10 s at 95 °C, 20 s at60 °C, and 30 s at 72 °C. The ramp speed between temper-ature set points was 2 °C/s. Unless otherwise stated, thefollowing reagents were included in all master mixes forthe invA assay: 1× ExTaq buffer (TaKaRa Bio), 0.2 mMdeoxynucleoside triphosphate (dNTP; Roche Diagnostics,Basel, Switzerland), 2.0 mM MgCl2 in total (RocheDiagnostics), each primer at 0.3 μM (InvA forward primer,InvA reverse primer [19]), 0.2 μM hydrolysis probe (InvA-minor groove binder [19]), 1.0 μL of 20× GE loading re-agent (Fluidigm), 1 U ExTaq HS DNA polymerase(TaKaRa Bio), 1× ROX, and 2 μL DNA (approximately30 pg/μL).
For the RB1 assay, the amplification conditions were 95 °Cfor 2 min, followed by 60 cycles of 15 s at 95 °C and 1 min at60 °C. The ramp speed between temperature set points was 2°C/s. Unless otherwise stated, the following reagents wereincluded in all master mixes for the RB1 assay: 1× ExTaqbuffer, 0.2 mM dNTP, 4.0 mM MgCl2 in total, each primerat 0.3 μM (RB1_80F and RB1_235R [18]), 0.2 μM hydroly-sis probe (RB1_212_MGB [18]), 1.0 μL of 20× GE loadingreagent, 1 U ExTaqHS DNA polymerase, 1× ROX, and 2 μLDNA (approximately 25 ng/μL).
For the inhibitor experiments, the inhibitory compoundwas added to a master mix containing all the reagents de-scribed above, including DNA. If needed, amplification-grade water (Promega, Madison, WI, USA) was added toobtain a total volume of 20 μL. This volume was then usedfor triplicate dPCR analyses by adding 4-µL aliquots of theprepared master mixes to the appropriate sample inlet foreach panel of a 48.770 array. The arrays were filled with useof a BioMark IFC controller MX and placed into theBioMark system for amplification and detection.
Data analysis of dPCR results
Data were analyzed with the Fluidigm Digital PCR Analysissoftware program (version 3.1.3, build 20120816.1505) todetermine the number of positive chambers. The calculationof DNA concentrations, determination of quantification cycle(Cq) values and amplification efficiency, and analysis of ROXfluorescence intensity were performed as described in a pre-vious study [22]. Briefly, we used the equation suggested by
Inhibition mechanisms of hemoglobin, immunoglobulin G, and whole blood in digital and real-time PCR 2571

Dorazio and Hunter [24] to calculate the concentration ofDNA (copies per microliter):
DNA½ � ¼ −ln 1− y=770ð Þ½ �0:75� 10−3
;
where y is the number of positive chambers, 0.75 × 10⁻³ isthe nominal chamber volume (in microliters) reported bythe manufacturer, and 770 is the total number of chambersin each panel. Determination of original sample concen-tration for the human-specific RB1 assay (ng/μL) wasperformed by our multiplying the number of copies permicroliter by 10 (dilution factor) and dividing by 311(approximate number of copies per nanogram, assuming6.436 pg DNA per diploid human male cell [25]).
Determination of original sample concentration (pg/μL) forSalmonella Typhimurium was performed by multiplying thenumber of copies per microliter by 10 (dilution factor) anddividing by 200 (approximate number of copies per picogram,assuming a weight of 5 fg for one copy of SalmonellaTyphimurium DNA [26]).
For determination of Cq values, data from amplifica-tion curves were exported as .csv files and analyzed withthe software environment R [27] with use of the qpcRpackage [28]. The function pcrbatch was used to fit thedata for all curves with a five-parameter log-logistic func-tion. Cq values were determined by the second derivatemaximum method (called BcpD2^ in the qpcR package).The amplification efficiency was calculated from individ-ual amplification curves by application of the functiondescribed in [29]. For graphical visualization, GraphPadPrism version 6.0 was used. To determine the fluores-cence intensity of ROX, ImageJ [30] was used, and inten-sity was measured within ten chambers per panel.
To determine when there was a significant effect on thenumber of positive reactions, a statistical tool developed bySidstedt et al. [22] was used. The tool was applied to find anysystematic differences in the probability of positive reactionsbetween samples with or without inhibitor. The output is givenas posterior mean of difference and posterior mass greater thanzero, where 100% indicates that the means are different.
Real-time PCR and gel electrophoresis
The qPCR experiments were all performed with a LightCyclerNano instrument (Roche Diagnostics) with a reaction volumeof 20 μL. LightCycler Nano Software version 1.1 was usedfor determination of Cq values.
For the invA assay, the amplification conditions were 95 °Cfor 2 min, followed by 50 cycles of 10 s at 95 °C, 20 s at 60 °C,and 30 s at 72 °C. Unless otherwise stated, the following re-agents were included in all master mixes for the invA assay: 1×ExTaq buffer, 0.2 mM dNTP, 2.0 mM MgCl2 in total, eachprimer at 0.3 μM (InvA forward primer, InvA reverse primer
[19]), 0.2 μM hydrolysis probe (InvA-minor groove binder[19]) or 1× EvaGreen (Biotium, Hayward, CA, USA), 1 UExTaq HS DNA polymerase, and 4 μL DNA (0.013 ng/μL).
For the RB1 assay, the amplification conditions were 95 °Cfor 2 min, followed by 50 cycles of 10 s at 95 °C, 20 s at 60 °C,and 30 s at 72 °C. Unless otherwise stated, the followingreagents were included in all master mixes for the RB1 assay:1× ExTaq buffer, 0.2 mM dNTP, 4.0 mMMgCl2 in total, eachprimer at 0.3 μM (RB1_80F and RB1_235R [18]), 0.2 μMhydrolysis probe (RB1_212_MGB [18]) or 1× EvaGreen, 1 UExTaq HS DNA polymerase, and 2 μL DNA (1 ng/μL).
For the inhibitor experiments, the inhibitory compoundwas added to a master mix containing all the reagents de-scribed above, including DNA. If needed, Super-Q water(Merck, Darmstadt, Germany) was added to obtain a totalvolume of 20 μL per reaction.
PCR products were visualized by gel electrophoresis (1%agarose, stained with 1×GelRed fromBiotium, 100 V, 30-minrun time). Subsequently, images were aquired with BioOneQuantity (Bio-Rad, Hercules, CA, USA).
Electrophoretic mobility shift assay
Binding reactionmixtures consisting of 1× PCR buffer [50mMKCl, 10 mM tris(hydroxymethyl)aminomethane hydrochloride(Tris-HCl) pH 8, with 4 mM MgCl2 in total], 105 ng of geno-mic Salmonella Typhimurium DNA, and different amounts ofIgG from 10 to 80 μg were prepared and incubated at roomtemperature for 1 h. Thereafter, 10 μL of the product was sub-jected to gel electrophoresis (1% agarose, stained with 1×GelRed, 100 V, 30-min run time). Subsequently, images wereaquired with BioOne Quantity. For IgG and amplicons, thesameworkflowwas applied, with 40 ng of invA assay ampliconDNA in the binding reactions. For hemoglobin, the sameworkflow was used, with different amounts of hemoglobinfrom 10 to 80 μg (genomic DNA only).
Isothermal titration calorimetry
ITC is a powerful tool for both thermodynamic and kineticstudies in chemistry, and is applied, for example, in enzymaticstudies. The principle of ITC is to measure the heat released orabsorbed during a chemical reaction, and it has a significantadvantage compared with other techniques in that it does notrely on any labeling or fluorescence detection as it is the heatfrom the enzymatic process itself that is measured. In this workwe used amodel systemwith Klenow fragment, which is activeat 37 °C, since the ITC measurements are less stable at 72 °C.
The titration experiments were performed with a PEAQ-ITCinstrument (MicroCal, Northampton, MA, USA) with a cell vol-ume of 200μL and a 40-μL syringe. Lyophilized deoxyadenosinetriphosphate, deoxycytidine trisphosphate, deoxyguanosine tri-phosphate, and deoxythymidine triphosphate (Jena Bioscience,
2572 Sidstedt M. et al.

Germany) were dissolved in 1× PCR buffer (50mMKCl, 10mMTris-HCl pH 8, and 4 mM MgCl2) to a stock concentration of10 mM for each dNTP and then used at a concentration of0.1 mM in the syringe. Protein concentration of Klenow fragment(product number EP0054, Thermo Scientific) was determinedfrom the UV absorbance at 280 nm with a BioDrop μLITE in-strument (BioDrop, Cambridge, UK) with a path length of 0.5mm, a molar extinction coefficient of 55,450, and a molecularmass of 68 kDa. Oligonucleotides used as a primer–template pairwere adapted from Datta and LiCata [31, 32]. The followingoligonucleotides were purchased from Integrated DNATechnologies (Coralville, IA, USA) as high-performance liquidchromatography purified: 70mer, AAACCCTTGGACGGCTGCGAAAGTCGGCAAACGGCACGGTTATCCCAGTCACGAGCATGTACGCTGCGTA; 45mer, TACGCAGCGTACATGCTCGTGACTGGGATAACCGTGC CGTTTGCC.
Aliquots of 10 μL of dNTPs (0.1 mM) were injected intothe cell (10 s per injection). The cell was stirred throughout theexperiment (500 rpm) and the cell temperature was set to 37°C. The cell contained 300 nM Klenow fragment and 1 μM70mer and 45mer oligonucleotides as a template for theKlenow fragment in 1× PCR buffer (50 mM KCl, 10 mMTris-HCl pH 8, and 4 mM MgCl2), with a total volume 500μL. Control experiments where dNTPs were injected into thecell containing all of the reagents mentioned above except forthe Klenow fragment were performed. For the inhibitor exper-iments, 0.50 μM hematin or 0.53 μM IgG was used in thereactions. Data analysis for enzyme kinetics was performedwith PEAQ-ITC analysis software (MicroCal) for determina-tion of ΔH (enthalpy), Km (Michaelis–Menten constant) andKcat (catalytic rate constant).
Results
Amplification in the presence of whole bloodand specific blood components
The first objective was to evaluate inhibition effects of wholeblood in a standardized dPCR setup using the DNA
polymerase ExTaqHS (Table 1). A general inhibitory effectwas the lowering of the number of positive reactions, seenfor 10% (v/v) whole blood (143 ± 130 positive reactions,compared with 417 ± 17 without blood). With 15% (v/v)blood, complete inhibition occurred. Evident with 10%(v/v) blood was also a decrease in amplification efficiencyas measured from individual amplification curves (amplifi-cation efficiency 1.24 ± 0.13 compared with 1.91 ± 0.24without inhibitor). There was no systematic increase in theCq values. Notably, apart from the added purified DNA,some DNA is released from the white blood cells.Analysis of 2.5% (v/v) blood, without additional templateDNA, resulted in 76 ± 13 positive reactions. However, withincreased amounts of blood, the inhibitory effect surpassedthe slight increase in DNA.
Another effect of blood was quenching of the passivereference dye ROX, which was used to normalize the fluo-rescence from the probe applied to detect the target DNA(Fig. 1). The quenching effect was discovered since theamplification curves for reactions with blood had highernormalized fluorescence intensities than those withoutblood (see Fig. S1). With 2.5% (v/v) blood in the reactions,
Table 1 Digital polymerase chainreaction results with differentamounts of whole blood added tothe standardized reactions. TheRB1 assay was applied with 50 nghuman DNA added. A controlreaction was set up with 2.5%blood (control 2.5) to determinehow much amplifiable material iscoming from the blood itself
Blood (%, v/v) Positive reactions DNA (ng/μL) Cq value Amplification efficiency
Control 2.5 76 ± 13 4.4 ± 0.8 23.03 ± 1.64 1.75 ± 0.19
0 417 ± 17 34.0 ± 2.1 25.10 ± 2.80 1.91 ± 0.24
2.5 438 ± 8 36.1 ± 1.0 24.57 ± 2.23 1.98 ± 0.23
5.0 478 ± 15 41.6 ± 2.2 22.56 ± 2.25 1.78 ± 0.12
7.5 489 ± 8 43.2 ± 1.1 23.92 ± 1.43 1.51 ± 0.17
10 143 ± 130 9.5 ± 9.3 28.04 ± 3.89 1.24 ± 0.13
15 5 ± 4 0.3 ± 0.2 NA NA
The mean and standard deviation are shown for triplicate analyses
Cq quantification cycle, NA not applicable
Blood (% v/v)
Rel
ativ
e flu
ores
cenc
e in
tens
ity(R
OX)
0 2.5 5.0 10 150
10000
20000
30000
Fig. 1 Quenching of the passive reference dye 6-carboxy-X-rhodamine(ROX) by whole blood. Relative fluorescence intensity means for 0–15%blood in the reactions are shown. The error bars represent standard devi-ation, and n = 10
Inhibition mechanisms of hemoglobin, immunoglobulin G, and whole blood in digital and real-time PCR 2573

the ROX fluorescence was quenched to about 45% of theintensity without blood.
In qPCR, with use of the same standardized setup as indPCR but with application of the double-stranded DNA(dsDNA)-binding dye EvaGreen for detection, strongfluorescence quenching of EvaGreen was observed:0.5% (v/v) blood gave flat amplification curves (Fig. 2),although gel electrophoresis showed that high amounts ofamplicons were generated for up to 10% (v/v) blood (datanot shown). These results collectively indicate that bloodaffects both amplification and fluorescence detectionwhen applied in dPCR and qPCR.
In whole blood, many components can act as PCR inhibi-tors. To study the effect of potential inhibitors in blood sepa-rately, several proposed inhibitors were analyzed (i.e., EDTA,hematin, hemoglobin, heparin, IgG, FeCl3, and lactoferrin).Hemoglobin and IgG were found to be the most prominentinhibitors in both dPCR and qPCR (data not shown), as pre-viously observed [8, 17].
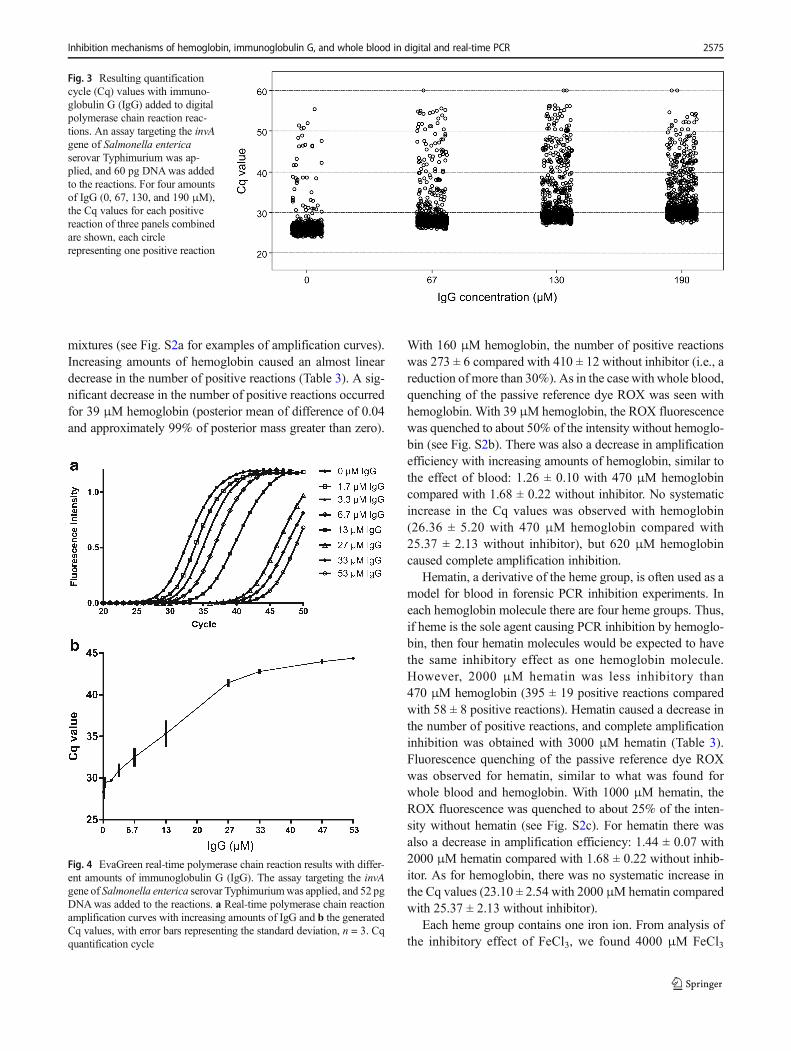
Inhibition effects caused by IgG were first studied in dPCR(Table 2). IgGmainly resulted in increased Cq values: 32.57 ±
5.60 with 190 μM IgG compared with 26.56 ± 3.19 withoutinhibitor. In addition, the Cq values were higher and showedgreater variation with IgG added (Fig. 3), and the number ofpositive reactions was lowered: 352 ± 10 positive reactionswith 27 μM IgG compared with 381 ± 11 without inhibitor(posterior mean of difference 0.04 and approximately 99.8%of posterior mass greater than zero, i.e., a result different fromthat with samples without inhibitor). Notably, with IgG in thereaction there was no apparent quenching of ROX and noimpact on the amplification efficiency of individual amplifi-cation curves (1.29 ± 0.15 with 190 μM IgG compared with1.42 ± 0.11 without inhibitor).
In qPCR, IgG caused a gradual increase in Cq values:for 53 μM IgG the Cq value was 44.4 ± 0.1 comparedwith 29.1 ± 0.2 without inhibitor (Fig. 4). As IgG causeddelayed amplification but had no effect on measured am-plification efficiency (slope), the amplification curves forincreasing amounts of IgG resembled those from serialdilutions of DNA.
To investigate how hemoglobin affects dPCR reactions,hemoglobin, hematin, or FeCl3 was added to the reaction
Fig. 2 EvaGreen real-time polymerase chain reaction results with differ-ent amounts of whole blood in the reactions. Two different assays wereapplied, targeting either a the invA gene of Salmonella enterica serovar
Typhimurium DNA with 0.052 ng DNA added or b the RB1 gene ofhuman DNAwith 2 ng DNA added
Table 2 Summary of results forimmunoglobulin G (IgG) in digi-tal polymerase chain reactionanalysis. An assay targeting theinvA gene of Salmonella entericaserovar Typhimurium was ap-plied, and 60 pg DNAwas addedto the reactions
IgG (μM) Positive reactions DNA (pg/μL) Cq value Amplification efficiency
0 381 ± 11 45.47 ± 1.92 26.56 ± 3.19 1.42 ± 0.11
27a 352 ± 10 40.74 ± 1.55 27.47 ± 3.18 1.38 ± 0.11
40 320 ± 6 35.86 ± 0.82 28.68 ± 4.68 1.35 ± 0.13
53 310 ± 15 34.42 ± 2.23 29.54 ± 4.72 1.31 ± 0.11
67 336 ± 21 38.34 ± 3.18 28.88 ± 4.71 1.34 ± 0.12
110 311 ± 8 34.55 ± 1.15 31.61 ± 6.32 1.33 ± 0.14
130 310 ± 24 34.36 ± 3.48 32.15 ± 6.53 1.33 ± 0.12
160 310 ± 6 34.35 ± 0.90 33.16 ± 7.09 1.31 ± 0.12
190 308 ± 10 34.06 ± 1.38 32.57 ± 5.60 1.29 ± 0.15
The mean and standard deviation are shown for triplicate analyses
Cq quantification cyclea The amount of IgG that led to a significant lowering of the number of positive reactions
2574 Sidstedt M. et al.
mixtures (see Fig. S2a for examples of amplification curves).Increasing amounts of hemoglobin caused an almost lineardecrease in the number of positive reactions (Table 3). A sig-nificant decrease in the number of positive reactions occurredfor 39 μM hemoglobin (posterior mean of difference of 0.04and approximately 99% of posterior mass greater than zero).
With 160 μM hemoglobin, the number of positive reactionswas 273 ± 6 compared with 410 ± 12 without inhibitor (i.e., areduction of more than 30%). As in the case with whole blood,quenching of the passive reference dye ROX was seen withhemoglobin. With 39 μM hemoglobin, the ROX fluorescencewas quenched to about 50% of the intensity without hemoglo-bin (see Fig. S2b). There was also a decrease in amplificationefficiency with increasing amounts of hemoglobin, similar tothe effect of blood: 1.26 ± 0.10 with 470 μM hemoglobincompared with 1.68 ± 0.22 without inhibitor. No systematicincrease in the Cq values was observed with hemoglobin(26.36 ± 5.20 with 470 μM hemoglobin compared with25.37 ± 2.13 without inhibitor), but 620 μM hemoglobincaused complete amplification inhibition.
Hematin, a derivative of the heme group, is often used as amodel for blood in forensic PCR inhibition experiments. Ineach hemoglobin molecule there are four heme groups. Thus,if heme is the sole agent causing PCR inhibition by hemoglo-bin, then four hematin molecules would be expected to havethe same inhibitory effect as one hemoglobin molecule.However, 2000 μM hematin was less inhibitory than470 μM hemoglobin (395 ± 19 positive reactions comparedwith 58 ± 8 positive reactions). Hematin caused a decrease inthe number of positive reactions, and complete amplificationinhibition was obtained with 3000 μM hematin (Table 3).Fluorescence quenching of the passive reference dye ROXwas observed for hematin, similar to what was found forwhole blood and hemoglobin. With 1000 μM hematin, theROX fluorescence was quenched to about 25% of the inten-sity without hematin (see Fig. S2c). For hematin there wasalso a decrease in amplification efficiency: 1.44 ± 0.07 with2000 μM hematin compared with 1.68 ± 0.22 without inhib-itor. As for hemoglobin, there was no systematic increase inthe Cq values (23.10 ± 2.54 with 2000 μM hematin comparedwith 25.37 ± 2.13 without inhibitor).
Each heme group contains one iron ion. From analysis ofthe inhibitory effect of FeCl3, we found 4000 μM FeCl3
Fig. 4 EvaGreen real-time polymerase chain reaction results with differ-ent amounts of immunoglobulin G (IgG). The assay targeting the invAgene of Salmonella enterica serovar Typhimuriumwas applied, and 52 pgDNAwas added to the reactions. a Real-time polymerase chain reactionamplification curves with increasing amounts of IgG and b the generatedCq values, with error bars representing the standard deviation, n = 3. Cqquantification cycle
Fig. 3 Resulting quantificationcycle (Cq) values with immuno-globulin G (IgG) added to digitalpolymerase chain reaction reac-tions. An assay targeting the invAgene of Salmonella entericaserovar Typhimurium was ap-plied, and 60 pg DNAwas addedto the reactions. For four amountsof IgG (0, 67, 130, and 190 μM),the Cq values for each positivereaction of three panels combinedare shown, each circlerepresenting one positive reaction
Inhibition mechanisms of hemoglobin, immunoglobulin G, and whole blood in digital and real-time PCR 2575

resulted in a reduced number of positive reactions (357 ± 23compared with 410 ± 12 without inhibitor, posterior mean ofdifference of 0.07 and approximately 100% of posterior massgreater than zero). With 6000 μM FeCl3, complete inhibitionoccurred. No fluorescence quenching of ROX was observedwith FeCl3 (data not shown).
In qPCR, hemoglobin caused complete fluorescencequenching of EvaGreen at 1.6 μM although PCR productcould be detected with gel electrophoresis up to 620 μM(see Fig. S3a, b). With hematin, 80 μM caused completeamplification inhibition, and fluorescence quenching ofEvaGreen was observed with 50 μM (see Fig. S3c). WithFeCl3, about 30 μM resulted in complete amplificationinhibition, and no fluorescence quenching was observed(see Fig. S3d).
PCR inhibition mechanisms of IgG and hemoglobin
IgG and hemoglobin were further studied to determine if theycause amplification inhibition through a direct effect on theDNA polymerase activity, by binding to DNA, or by a com-bination of the two. EMSAwas used to investigate if IgG orhemoglobin binds to DNA (Fig. 5). The principle of EMSA is
that if a protein binds to DNA, the mobility of the DNA in agel will be altered.Without IgG, as well as with 7 μM IgG, theexpected high molecular weight band was clearly visible onthe gel (Fig. 5, panel A). However, for 13–27 μM IgG theband was fainter, indicating that IgG binds to the genomicDNA, thus hindering its migration in the gel. With 40–53 μM IgG, all the genomic DNA was retained in the well.When genomic DNA and IgG were heated together beforeEMSA analysis, to simulate the conditions in PCR, 7 μMIgG led to the DNA being retained in the well (Fig. 5, panelB). The same setup was repeated but with PCR amplicons (88bp) and there, whether heated or not, the mobility of theamplicon DNA was only slightly affected (Fig. 5, panels Cand D). This indicates that IgG has higher binding affinity forthe large genomic DNA molecules than for the smalleramplicons. When we performed EMSA analysis with hemo-globin, no binding between the protein and genomic DNAwasnoted (Fig. 5, panels E and F).
Next, the effect of IgG and hemoglobin when ssDNA ordsDNA was used as the starting template in dPCR was in-vestigated to further investigate the nature of the inhibition.The results for IgG experiments are presented in Fig. 6 andTable S1. Amplification with ssDNA resulted in 26 ± 5
Table 3 Digital polymerase chain reaction results when hemoglobin, hematin, or FeCl3 was added to the reactions. The assay targeting the RB1 gene ofhuman DNAwas applied with 50 ng DNA added
Hemoglobin (μM) Positive reactions DNA (ng/μL) Cq value Amplification efficiency Molecules per chamber
0 410 ± 12 32.7 ± 1.5 25.37 ± 2.13 1.68 ± 0.22 0
39a 383 ± 2 29.5 ± 0.2 24.29 ± 1.07 2.10 ± 0.22 1.75 × 10¹⁰
78 347 ± 6 25.7 ± 0.6 24.24 ± 1.98 2.21 ± 0.21 3.50 × 10¹⁰
160 273 ± 6 18.8 ± 0.5 24.14 ± 2.30 1.99 ± 0.20 7.00 × 10¹⁰
310 139 ± 3 8.5 ± 0.2 24.32 ± 4.33 1.61 ± 0.15 1.40 × 10¹¹
470 58 ± 8 3.3 ± 0.5 26.36 ± 5.20 1.26 ± 0.10 2.10 × 10¹¹
620 0 ± 0 NA NA NA –
Hematin (μM) Positive reactions DNA (ng/μL) Cq value Amplification efficiency Molecules per chamber
0 410 ± 12 32.7 ± 1.5 25.37 ± 2.13 1.68 ± 0.22 0
1000 405 ± 7 32.0 ± 0.9 24.09 ± 3.06 1.79 ± 0.12 4.52 × 10¹¹
2000 395 ± 19 30.9 ± 2.1 23.10 ± 2.54 1.44 ± 0.07 9.03 × 10¹¹
3000 0 ± 0 NA NA NA 1.35 × 10¹²
4000 0 ± 0 NA NA NA 1.81 × 10¹²
6000 0 ± 0 NA NA NA 2.71 × 10¹²
FeCl3 (μM) Positive reactions DNA (ng/μL) Cq value Amplification efficiency Molecules per chamber
0 410 ± 12 32.7 ± 1.5 25.37 ± 2.13 1.68 ± 0.22 0
1000 403 ± 24 31.9 ± 2.8 24.62 ± 2.08 1.89 ± 0.14 4.52 × 10¹¹
2000 395 ± 5 30.8 ± 0.6 23.70 ± 1.56 2.06 ± 0.20 9.03 × 10¹¹
3000 395 ± 24 30.9 ± 2.7 22.63 ± 1.97 1.82 ± 0.15 1.35 × 10¹²
4000a 357 ± 23 26.7 ± 2.3 26.28 ± 3.24 1.50 ± 0.11 1.81 × 10¹²
6000 0 ± 0 0.0 ± 0.0 NA NA 2.71 × 10¹²
The mean and standard deviations are shown for three replicates
Cq quantification cycle, NA not applicablea The amount of inhibitor that led to a significant lowering of the number of positive reactions
2576 Sidstedt M. et al.

positive reactions with 27 μM IgG compared with 456 ± 9without inhibitor. With dsDNA as the starting template,there were 269 ± 8 positive reactions with 27 μM dsDNAcompared with 333 ± 8 positive reactions without inhibitor.For the RB1 assay, 20 μM IgG resulted in 348 ± 13 positivereactions with dsDNA and 30 ± 5 with ssDNA (see Fig. S4and Table S2). For hemoglobin, there was no difference be-tween ssDNA and dsDNA (see Table S3). Amplificationwith 310 μM hemoglobin and dsDNA as the starting tem-plate gave 139 ± 3 positive reactions (posterior mean of dif-ference of 0.35 compared with no hemoglobin), and withssDNA 198 ± 8 positive reactions (posterior mean of differ-ence of 0.40) (note that ssDNA generally gives a highernumber of positive reactions as the number of template mol-ecules is doubled compared with dsDNA).
With ssDNA as the starting template, amplification wasalmost completely inhibited by 10% whole blood (9 ± 9 pos-itive reactions compared with 567 ± 8, posterior mean of dif-ference of 0.72); that is, ssDNA template is more sensitive toinhibition by whole blood than is dsDNA (see Fig. S1 andTable S4).
ITC was used to investigate how hematin and IgG affectthe DNA polymerase activity by measurements of the DNApolymerization process in the absence/presence of hematin/IgG (Fig. 7, Table 4). A model system was applied, and wemeasured the polymerization by Klenow DNA polymerase at37 °C with an oligonucleotide pair with a 70mer as the tem-plate and a 45mer as the primer. We found that 0.50 μM he-matin had a negative impact on the DNA polymerase activity,observed as a lower kcat (0.150 1/s compared with 0.345 1/s
Fig. 5 The binding between DNA and immunoglobulin G (IgG) or he-moglobin according to electrophoretic mobility shift assay analysis. PanelA 105 ng of genomic DNAwas loaded per sample together with variousamounts of IgG (no heating) and panel B the same experiment withheating at 95 °C for 30 s before analysis. Panel C 40 ng of amplicon
DNA was loaded per sample together with various amounts of IgG (noheating) and panel D the same experiment with heating at 95 °C for 30 sbefore analysis. Panel E 105 ng of genomic DNAwas loaded per sampletogether with various amounts of hemoglobin (no heating) and panel Fthe same experiment with heating at 95 °C for 30 s before analysis
Inhibition mechanisms of hemoglobin, immunoglobulin G, and whole blood in digital and real-time PCR 2577

without inhibitor) and a slightly lowered Km (3.13 μM com-pared with 6.07 μMwithout inhibitor). IgG seemingly did notaffect kcat or Km, and thus the activity of the Klenow DNApolymerase was not disturbed by IgG.
An increased amount of DNA polymerase (5 U insteadof 1 U) was applied in dPCR to further study the effects ofhemoglobin, hematin, and FeCl3 on the enzyme (seeTable S5). More polymerase gave a slight improvement forhemoglobin, increasing the number of positive reactions for470 μMhemoglobin to 160 ± 17 (posterior mean of differenceof 0.31) with 5 U DNA polymerase compared with 58 ± 8(posterior mean of difference of 0.46) with 1 U DNA poly-merase. For 3000 μM hematin, amplification was recovered,going from zero positive reactions with 1 U DNA polymeraseto 389 ± 8 (posterior mean of difference of 0.01 and approx-imately 82% of posterior mass greater than zero) with 5 UDNA polymerase. With 4000 μM FeCl3, the amplificationwas rather similar with 1 U or 5 U DNA polymerase: 347 ±18 (posterior mean of difference of 0.07) compared with 357 ±23 (posterior mean of difference of 0.07).
Discussion
In this study, we have shown that IgG binds to genomicssDNA, but has low affinity for binding to the much smalleramplicons. Likely, this is the cause of the delayed amplifica-tion seen as elevated Cq values in dPCR and qPCR whenwhole blood is analyzed. In 1979, the nature of anti-DNAactivity of IgG from human serum of healthy people wasstudied, and it was found that a small portion of IgG bindsto ssDNA [33]. In a study that focused on lupus monoclonalantibodies it was found that there are different binding mech-anisms, where some antibodies bind to dsDNA alone andsome preferably bind to dsDNA in a complex with a DNApolymerase [34]. The thermodynamics of antibody binding toDNA has been investigated with 20mer duplex DNA mole-cules. There it was observed that this fragment length allowsonly one arm of an IgG molecule to bind the DNA [35]. Thismeans that IgG could potentially bind to smaller DNA frag-ments such as amplicons as well as to larger genomic DNAmolecules. However, our results indicate that in the PCR, IgG
Fig. 6 Immunoglobulin G (IgG)-induced inhibition in digitalpolymerase chain reaction with adouble-strandedDNA or b single-stranded DNA as the startingtemplate. An assay targeting theinvA gene of Salmonella entericaserovar Typhimurium with 60 pgDNA added was applied. Thequantification cycle (Cq) valuesfor each positive reaction of threepanels are shown for each IgGconcentration, each circlerepresenting one positive reaction
2578 Sidstedt M. et al.

interacts significantly more strongly with genomic DNA. Inthe initial PCR cycles, there is a screening phase where theprimers localize and bind to the genomic target region. As thePCR continues, amplicons will be formed, serving as perfecttemplates for amplification. Amplification efficiency, mea-sured when amplicons are the dominating target, is not re-duced by the presence of IgG. Since it is mainly the Cq valuesthat are affected, we hypothesize that IgG interferes with thereaction in the early PCR cycles, where genomic DNA is thedominating template. The inhibitory effect of IgG seeminglydisappears when amplicons have become the dominating tem-plate, because of its lower affinity for binding to smaller DNAfragments.
Previously, it was found that PCR inhibition by differentclones of IgG was increased when target DNA was heatedtogether with IgG [17]. There it was speculated that inhibitionwas due to interaction with ssDNA. Our results prove this
interaction, since IgG and whole blood had a much strongernegative effect when ssDNA rather than dsDNAwas used asthe starting template in the dPCR. Also, the EMSA experi-ments showed that heating of IgG and DNA, leading tossDNA being formed, gave stronger interactions betweenIgG and DNA. When IgG denatures, it forms aggregates[36]. It is thus reasonable to assume that larger aggregatesare formed in the larger reaction volume of qPCR (20 μL)compared with the smaller volume of dPCR (0.75 nL). Thelower tolerance for IgG in qPCR could be explained by theinhibitory properties of large aggregates (53 μM in qPCRcaused almost complete amplification inhibition, whereas190 μM in dPCR did not completely hinder amplification).
Hemoglobin has been suggested to inhibit PCR by therelease of iron ions [8]. Hematin is often used as a model forinhibition by blood [37–41]. In this study, these three inhibi-tors were applied separately, and differences among them
0 5 10 15
-2.0
-1.5
-1.0
-0.5
0.0
0.5
Time (min)
DP
(J/s
) 0.53 µM IgG
No inhibitor
0.50 µM hematin
0.000 0.001 0.002 0.003 0.004
0.00
0.01
0.02
0.03
0.04
[S] (mM)
Rate
(µ
mol/L/s
)
0.53 µM IgG
0.50 µM hematin
No inhibitor
a
b
Fig. 7 Isothermal titrationcalorimetry results where a thetitration curves and b the dataanalyzed with PEAQ-ITCanalysis software are shown. DPdifferential power, IgGimmunoglobulin G
Table 4 Isothermal titrationcalorimetry results for theenergetics and enzyme kinetics ofKlenow fragment polymerizationin the presence of inhibitors
ΔH (kJ/mol) kcat (1/s) Km (M) Reduced χ2 [(μmol/L/s)2]
No inhibitor -274.9 0.312 6.07 × 10⁻⁶ 1.20 × 10⁻⁶
0.53 μM IgG -276.6 0.367 7.31 × 10⁻⁶ 1.10 × 10⁻⁶
0.50 μM hematin -257.7 0.150 3.13 × 10⁻⁶ 2.90 × 10⁻⁷
IgG immunoglobulin G
Inhibition mechanisms of hemoglobin, immunoglobulin G, and whole blood in digital and real-time PCR 2579

were found. Release of iron ions is not likely the reason forinhibition by hemoglobin since we observed different effectsfrom these two species when they were applied separately; forexample, FeCl3 does not disturb the fluorescence detection orimpact the amplification efficiency, and higher amounts areneeded in dPCR for amplification inhibition (6000 μM FeCl3versus 620 μM hemoglobin). The fact that FeCl3 does notaffect the amplification efficiency implies that it does not dis-turb the DNA polymerase activity in the same way as hemo-globin and hematin. Our results also indicate that it is not onlythe heme that is responsible for hemoglobin-induced inhibi-tion since we observed that there are differences between he-matin and hemoglobin. Hemoglobin was shown to be a morepotent inhibitor (i.e., lower amounts caused complete ampli-fication inhibition in dPCR). Further, the fluorescencequenching was severer for hemoglobin than for hematin. InqPCR, lower amounts of hematin (80 μM) than hemoglobin(620 μM) caused amplification inhibition.
In qPCR with EvaGreen, hemoglobin mainly disturbs thedetection by fluorescence quenching. Amplified product ofthe correct size could be observed up to 620 μM hemoglobineven though problems with detection occurred for 1.6 μMhemoglobin. This effect was also evident in dPCR since thedye ROX was severely quenched by hemoglobin. Previously,humic acid was also demonstrated to quench ROX fluores-cence in dPCR [22]. In that study as well as in the presentstudy, ROX quenching did not have an impact on the quanti-fication. However, ROX quenching could cause problems forunknown samples since it could lead to inaccurate setting ofthe threshold distinguishing negative reactions from positivereactions, possibly leading to overestimation of the DNA con-centration. Fluorescence quenching seemingly affects free dyemolecules such as ROX and EvaGreen rather than the onesattached to probes (fluorescein in this case). This effect on freedye molecules was also observed for humic acid in qPCR,
where static quenching was found to be a probablemechanism[16].
In structural biology, heme proteins were long excludedfrom protein fluorescence structural analysis because hemegroups quench the emission of tyrosine and tryptophan resi-dues [42]. A similar mechanism could be the reason for thefluorescence quenching by hemoglobin observed in this study,which is the first systematic investigation of fluorescencequenching by blood components in a PCR context.Previously, it was observed that blood causes quenching ofthe dye SYBR Green I [13, 43]. In a study where the toxicityof synthetic dyes was investigated, bovine hemoglobin wasapplied, and interactions were studied with spectroscopictechniques [44]. Among other dyes, fluorescein was studied,and the results indicated that the dyes bind within the centralcavity of hemoglobin. This could explain why hemoglobin isa more potent fluorescence inhibitor than hematin. However,we did not observe any systematic quenching of fluoresceinfluorescence in PCR, possibly because the fluorophore is at-tached to the probe, making it less accessible for thehemoglobin.
Previously, it was found that mutations leading to increasedDNA binding affinity resulted in a higher tolerance to blood[13, 45]. Our ITC results indicate that hematin disturbs theDNA polymerase activity (Klenow), whereas IgG does not.Further studies of enzyme kinetics could be a good way for-ward in achieving a more detailed understanding of PCR in-hibition mechanisms. In 1975 it was suggested that hemininterferes with the ability of DNA polymerase to bind DNAin erythroid cells by binding reversibly to the enzyme [46].This was confirmed by another study performed more than 30years later [13].
Direct PCR analysis of blood samples is very appealingsince it would reduce the cost and the time to results. Thework done to improve the blood tolerance in PCR to allow
Table 5. Summary of theproposed inhibition mechanismsfor the molecular inhibitors
Molecule Inhibitor effect Proposed mechanism/s
IgG Increased Cq values and eventuallycomplete amplification inhibition
Binds to genomic ssDNA, thereby hinderingprimer annealing or binding of DNApolymerase, thus disturbing the initiationof amplification in the first few cycles
Hemoglobin Decreased amplification efficiency,leading eventually to completeamplification inhibition
Quenching of fluorescence of freedye molecules (ROX, EvaGreen)
Lowers the activity of DNA polymerasethroughout the PCR
Binds to or interacts with fluorescent dyes,causing static fluorescence quenching
Hematin Same as hemoglobin, but a weaker effect Lowers the activity of DNA polymerasethroughout the PCR
Binds to or interacts with fluorescent dyes,causing static fluorescence quenching
Cq quantification cycle, IgG immunoglobulin G, PCR polymerase chain reaction, ROX 6-carboxy-X-rhodamine,ssDNA single-stranded DNA
2580 Sidstedt M. et al.

direct analysis has included finding alternative DNA polymer-ases, engineering DNA polymerases, and applying variousfacilitators [1, 2, 11–13, 43, 45, 47]. We have contributed tothis field by elucidating the inhibitor mechanisms of blood andblood components in dPCR and qPCR. We have shown thatwhole blood causes several negative effects, such asquenching of fluorescence, reduced amplification efficiency,and a loss of amplifiable target DNA. By using several stan-dardized inhibitors representing substances found in blood,we showed the inhibition in whole blood is mainly attributedto IgG and hemoglobin (Table 5). IgG has an effect on single-stranded genomic DNA template, disturbing amplification inthe first few PCR cycles. Hemoglobin hinders amplificationthroughout the PCR process by a direct effect on the DNApolymerase activity, and also causes fluorescence quenchingaffecting amplicon detection and the passive reference dyeROX.
Funding This study was financially supported by the Swedish ResearchCouncil (grant 621-2013-5999).
Compliance with ethical standards
All work presented was reviewed and approved by the National Instituteof Standards and Technology Human Subjects Protections Office EthicsCommittee. The blood sample was donated under informed consent.
Conflict of interest The authors declare that they have no competinginterests.
Open Access This article is distributed under the terms of the CreativeCommons At t r ibut ion 4 .0 In te rna t ional License (h t tp : / /creativecommons.org/licenses/by/4.0/), which permits unrestricted use,distribution, and reproduction in any medium, provided you giveappropriate credit to the original author(s) and the source, provide a linkto the Creative Commons license, and indicate if changes were made.
References
1. Connelly CM, Porter LR, TerMaat JR. PCR amplification of atriple-repeat genetic target directly from whole blood in 15 minutesas a proof-of-principle PCR study for direct sample analysis for aclinically relevant target. BMC Med Genet. 2014;15:130.
2. Gray K, Crowle D, Scott P. Direct amplification of casework blood-stains using the Promega PowerPlex® 21 PCR amplification sys-tem. Forensic Sci Int Genet. 2014;12:86–92.
3. Burckhardt J. Amplification of DNA from whole blood. PCRMethods Appl. 1994;3(4):239–43.
4. Nishimura N, Nakayama T, Tonoike H, Kojima K, Kato S. Directpolymerase chain reaction from whole blood without DNA isola-tion. Ann Clin Biochem. 2000;37:674–80.
5. Sharma R,Virdi AS, Singh P. A novel method for whole blood PCRwithout pretreatment. Gene. 2012;501(1):85–8.
6. Singh I, Swarup V, Shakya S, Goyal V, Faruq M, Srivastava AK.Single-step blood direct PCR: A robust and rapid method to diag-nose triplet repeat disorders. J Neurol Sci. 2017;379:49–54.
7. Schrader C, Schielke A, Ellerbroek L, Johne R. PCR inhibitors -occurrence, properties and removal. J Appl Microbiol.2012;113(5):1014–26.
8. Al-Soud WA, Rådström P. Purification and characterization ofPCR-inhibitory components in blood cells. J Clin Microbiol.2001;39(2):485–93.
9. de Franchis R, Cross NC, Foulkes NS, Cox TM. A potent inhibitorof Taq polymerase copurifies with human genomic DNA. NucleicAcids Res. 1988;16(21):10355.
10. Akane A, Matsubara K, Nakamura H, Takahashi S, Kimura K.Identification of the heme compound copurified with deoxyribonu-cleic acid (DNA) from bloodstains, a major inhibitor of polymerasechain reaction (PCR) amplification. J Forensic Sci. 1994;39(2):362–72.
11. AbuAl-SoudW, Rådström P. Effects of amplification facilitators ondiagnostic PCR in the presence of blood, feces, and meat. J ClinMicrobiol. 2000;38(12):4463–70.
12. Abu Al-Soud W, Rådström P. Capacity of nine thermostable DNApolymerases to mediate DNA amplification in the presence of PCR-inhibiting samples. Appl Environ Microbiol. 1998;64(10):3748–53.
13. Kermekchiev MB, Kirilova LI, Vail EE, Barnes WM. Mutants ofTaq DNA polymerase resistant to PCR inhibitors allow DNA am-plification from whole blood and crude soil samples. Nucleic AcidsRes. 2009;37(5):e40.
14. Kreader CA. Relief of amplification inhibition in PCR with bovineserum albumin or T4 gene 32 protein. Appl Environ Microbiol.1996;62(3):1102–6.
15. Wilson IG. Inhibition and facilitation of nucleic acid amplification.Appl Environ Microbiol. 1997;63(10):3741–51.
16. Sidstedt M, Jansson L, Nilsson E, Noppa L, Forsman M,Rådström P, et al. Humic substances cause fluorescence in-hibition in real-time polymerase chain reaction. AnalBiochem. 2015;487:30–7.
17. Al-SoudWA, Jönsson LJ, Rådström P. Identification and character-ization of immunoglobulin G in blood as a major inhibitor of diag-nostic PCR. J Clin Microbiol. 2000;38(1):345–50.
18. Niederstätter H, Kochl S, Grubwieser P, Pavlic M, Steinlechner M,Parson W. A modular real-time PCR concept for determining thequantity and quality of human nuclear and mitochondrial DNA.Forensic Sci Int Genet. 2007;1(1):29–34.
19. Richmond G, Gorski L, Ryan D, McBride M. 5’-Nuclease PCRassays for foodborne pathogen detection using the Agilent-StratageneMx3000PQ-PCR system. Agilent application note, pub-lication part number 5990-3161EN. Agilent Technologies; 2008.
20. Hedman J, Nordgaard A, Rasmusson B, Ansell R, Rådström P.Improved forensic DNA analysis through the use of alternativeDNA polymerases and statistical modeling of DNA profiles.BioTechniques. 2009;47(5):951–8.
21. Duewer DL, Kline MC, Romsos EL. Real-time cdPCR opens awindow into events occurring in the first few PCR amplificationcycles. Anal Bioanal Chem. 2015;407(30):9061–9.
22. Sidstedt M, Romsos EL, Hedell R, Ansell R, Steffen CR, VallonePM, et al. Accurate digital polymerase chain reaction quantificationof challenging samples applying inhibitor-tolerant DNA polymer-ases. Anal Chem. 2017;89(3):1642–9.
23. Walsh PS, Metzger DA, Higuchi R. Chelex 100 as a medium forsimple extraction of DNA for PCR-based typing from forensic ma-terial. BioTechniques. 1991;10(4):506–13.
24. Dorazio RM, Hunter ME. Statistical models for the analysis anddesign of digital polymerase chain reaction (dPCR) experiments.Anal Chem. 2015;87(21):10886–93.
25. Dolezel J, Bartos J, Voglmayr H, Greilhuber J. Nuclear DNA con-tent and genome size of trout and human. Cytometry Part A.2003;51(2):127–8.
Inhibition mechanisms of hemoglobin, immunoglobulin G, and whole blood in digital and real-time PCR 2581

26. Malorny B, Bunge C,Helmuth R. A real-time PCR for the detectionof Salmonella Enteritidis in poultry meat and consumption eggs. JMicrobiol Methods. 2007;70(2):245–51.
27. R Core Team. R: a language and environment for statistical com-puting. Vienna: R Foundation for Statistical Computing; 2015.
28. Spiess AN. qpcR: modelling and analysis of real-time PCR data. Rpackage version 1.4-0. http://CRAN.R-project.org/package=qpcR(2014). Accessed 15 Jun 2016.
29. Spiess AN, Feig C, Ritz C. Highly accurate sigmoidal fitting of real-time PCR data by introducing a parameter for asymmetry. BMCBioinformatics. 2008;9:221.
30. Schneider CA, Rasband WS, Eliceiri KW. NIH Image to ImageJ:25 years of image analysis. Nat Methods. 2012;9(7):671–5.
31. Datta K, LiCata VJ. Thermodynamics of the binding of Thermusaquaticus DNA polymerase to primed-template DNA. NucleicAcids Res. 2003;31(19):5590–7.
32. Datta K, LiCata VJ. Salt dependence of DNA binding by Thermusaquaticus and Escherichia coli DNA polymerases. J Biol Chem.2003;278(8):5694–701.
33. Rubin RL, Carr RI. Anti-DNA activity of IgG F(ab')2 from normalhuman serum. J Immunol. 1979;122(4):1604–7.
34. Kumar S, Bunting KA, Kalsi J, Hinks JA, Latchman DS, Pearl LH,et al. Lupus autoantibodies to native DNA preferentially bind DNApresented on PolIV. Immunology. 2005;114(3):418–27.
35. Tanha J, Lee JS. Thermodynamic analysis of monoclonal antibodybinding to duplex DNA. Nucleic Acids Res. 1997;25(7):1442–9.
36. Vermeer AW, Norde W. The thermal stability of immunoglobulin:unfolding and aggregation of a multi-domain protein. Biophys J.2000;78(1):394–404.
37. Green RL, Lagace RE, Oldroyd NJ, Hennessy LK, Mulero JJ.Developmental validation of the AmpFlSTR® NGM SElect™PCR amplification kit: a next-generation STR multiplex with theSE33 locus. Forensic Sci Int Genet. 2013;7(1):41–51.
38. Thompson RE, Duncan G, McCord BR. An investigation of PCRinhibition using Plexor®-based quantitative PCR and short tandemrepeat amplification. J Forensic Sci. 2014;59(6):1517–29.
39. Kraemer M, Prochnow A, Bussmann M, Scherer M, Peist R,Steffen C. Developmental validation of QIAGEN Investigator®24plex QS kit and Investigator® 24plex GO! kit: two 6-dye multi-plex assays for the extended CODIS core loci. Forensic Sci IntGenet. 2017;29:9–20.
40. Thompson JM, Ewing MM, Frank WE, Pogemiller JJ, Nolde CA,Koehler DJ, et al. Developmental validation of the PowerPlex®Y23 system: a single multiplex Y-STR analysis system for case-work and database samples. Forensic Sci Int Genet. 2013;7(2):240–50.
41. McLaren RS, Bourdeau-Heller J, Patel J, Thompson JM, Pagram J,Loake T, et al. Developmental validation of the PowerPlex® ESI16/17 Fast and PowerPlex® ESX 16/17 Fast systems. Forensic SciInt Genet. 2014;13:195–205.
42. Hirsch RE. Heme-protein fluorescence. In: Lakowicz JR, editor.Topics in fluorescence spectroscopy. Vol 6. Boston: Springer;2002. p. 221–55.
43. Zhang Z, Kermekchiev MB, Barnes WM. Direct DNA amplifica-tion from crude clinical samples using a PCR enhancer cocktail andnovel mutants of Taq. J Mol Diagn. 2010;12(2):152–61.
44. Kamaljeet, Bansal S, SenGupta U. A study of the interaction ofbovine hemoglobin with synthetic dyes using spectroscopic tech-niques and molecular docking. Front Chem. 2016;4:50.
45. Arezi B, McKinney N, Hansen C, Cayouette M, Fox J, Chen K,et al. Compartmentalized self-replication under fast PCR cyclingconditions yields Taq DNA polymerase mutants with increased
DNA-binding affinity and blood resistance. Front Microbiol.2014;5:408.
46. Byrnes JJ, Downey KM, Esserman L, SoAG.Mechanism of hemininhibition of erythroid cytoplasmic DNA polymerase.Biochemistry. 1975;14(4):796–9.
47. Trombley Hall A, McKay Zovanyi A, Christensen DR, KoehlerJW, Devins Minogue T. Evaluation of inhibitor-resistant real-timePCR methods for diagnostics in clinical and environmental sam-ples. PLoS One. 2013;8(9):e73845.
Maja Sidstedt is a PhD student int h e D i v i s i o n o f App l i e dMicrobiology, Lund University,Sweden, and a molecular biologistat the Swedish National ForensicCentre in Linköping. She studiesPCR inhibition effects and mecha-nisms using techniques such as real-time PCR, digital PCR, and mas-sively parallel sequencing.
Johannes Hedman is a specialistat the Swedish National ForensicCentre and a researcher in theDivision of Applied Microbiology,Lund University, Sweden. His re-search focus is forensic DNA anal-ysis and diagnostic PCR analysis,and he has developed several labo-ratory methods that have been im-plemented in casework.
Erica Romsos is a research biolo-gist in the Applied Genetics Groupat the US National Institute ofStandards and Technology inGaithersburg, Maryland. Her re-search topics include rapid PCRprotocols, testing of integrated rap-id DNA platforms, optimization ofreal-time PCR assays, and the useof digital PCR for human and mi-tochondrial quantitation.
2582 Sidstedt M. et al.

Leticia Waitara obtained hermaster’s degree in science fromLund University, Sweden, in2016, and is currently workinga s a DNA ana l y s t a t t h eGovernment Chemist LaboratoryAuthority in Dar es Salaam,Tanzania.
Lars Wadsö is Professor ofBuilding Materials at LundUniversity, Sweden. His main re-search interests are calorimetryand vapor sorption science. Hehas designed several isothermalcalorimeters (e.g., commercial cal-orimeters for the cement field), andhas a major interest in the develop-ment of calorimetric methods
Carolyn Steffen is a research biol-ogist in theAppliedGeneticsGroupat the US National Institute ofStandards and Technology inGaithersburg, Maryland. Her re-search topics include concordanceevaluations of prototype commer-cial chemistries, producing DNA-based reference materials, and theuse of next-generation sequencingfor human identity applications.
Peter M. Vallone is Leader of theApplied Genetics Group at the USNational Institute of Standardsand Technology in Gaithersburg,Maryland. His research topics in-clude development of DNA-based assays, producing DNA-based reference materials, andthe use of next-generation se-quencing for human identity ap-plications.
Peter Rådström is a professora n d H e a d o f A p p l i e dMicrobiology at Lund University,Sweden. His area of expertise isfood microbiology, in particular,rapid detection methods (pre-PCRprocessing), carbohydrate metabo-lism, neurotoxin formation inClostridium botulinum andStaphylococcus aureus, andmicro-bial biofilms in drinking water.
Inhibition mechanisms of hemoglobin, immunoglobulin G, and whole blood in digital and real-time PCR 2583