inheritance of resistance in corn to the european corn
TRANSCRIPT

Retrospective Theses and Dissertations Iowa State University Capstones, Theses andDissertations
1954
Inheritance of resistance in corn to the Europeancorn borer and to Diplodia stalk rotDavid Daniel RubisIowa State College
Follow this and additional works at: https://lib.dr.iastate.edu/rtd
Part of the Agricultural Science Commons, Agriculture Commons, and the Agronomy and CropSciences Commons
This Dissertation is brought to you for free and open access by the Iowa State University Capstones, Theses and Dissertations at Iowa State UniversityDigital Repository. It has been accepted for inclusion in Retrospective Theses and Dissertations by an authorized administrator of Iowa State UniversityDigital Repository. For more information, please contact [email protected].
Recommended CitationRubis, David Daniel, "Inheritance of resistance in corn to the European corn borer and to Diplodia stalk rot" (1954). RetrospectiveTheses and Dissertations. 15231.https://lib.dr.iastate.edu/rtd/15231

NOTE TO USERS
This reproduction is the best copy available.
UMI


IIHERITAICE OF RESISTAICE IN COHN TO THE ED-ROPEAN
COHI BORER AND TO DIPIiODlA STALK ROT
David D. Rubia
A Dissertation Submitted to the
Graduate Faculty in Partial Fulfillment of
The Requirements for the Degree of
DOCTOR OP PHILOSOPHY
Major Subject I Crop Breeding
Approveds
Charge, Farm Crops
In i Charge 'p'r Ma Mr Work'
B:ead " 6'f'""Ma J or""" Department
Iowa State College
1954
Signature was redacted for privacy.
Signature was redacted for privacy.
Signature was redacted for privacy.
Signature was redacted for privacy.
UMI Number: DP13452
INFORMATION TO USERS
The quality of this reproduction is dependent upon the quality of the copy
submitted. Broken or indistinct print, colored or poor quality illustrations and
photographs, print bleed-through, substandard margins, and improper
alignment can adversely affect reproduction.
In the unlikely event that the author did not send a complete manuscript
and there are missing pages, these will be noted. Also, if unauthorized
copyright material had to be removed, a note will indicate the deletion.
UMI UMI Microform DP13452
Copyright 2005 by ProQuest Information and Learning Company.
All rights reserved. This microform edition is protected against
unauthorized copying under Title 17, United States Code.
ProQuest Information and Learning Company 300 North Zeeb Road
P.O. Box 1346 Ann Arbor, Ml 48106-1346

SZ.£? in
TABLE OP COHTEOTS
Page
IHTROIUCTION 1
RE¥I1W OB' PERTIllNT LITERATURE ' • 3
MATERIALS AID METHODS ....... . 7
Corn Borer Resistanc® Ratings 8
Leaf-feeding ratings 8 Damage-point counts 11
Dlplodia Stalk-Rot Reslstanc© Ratings • • • • . • • 13 E x p e r i n e n t s C o n d n c t e d » . . , 1 6
Bxperiment «•*•.••••• 17 Experiment II 18 Experiment III ••••••»•• ...IS Experiment I? ••••••...* 20 Experiment V.,,,21
STATISTICAL PHOCIUJRIS • . 23
Constant Parent Regression Method • ,,23 Heritable and Non-heritable Components of Variation 25
The genetic model and the statistics estimated • 26 A test for linkage ,28 Calculation of the components of variation ... 32 Mumber of effective factors and selection
l i m i t s • • • • • • • • • • • . . . . . • • • , 3 8
Scaling Teats and Transformations .,..•...,40
Leaf-feedi.ng ratings ..*.......•.••42 Damage-point counts ...• .,42 Diplodia stalk-rot ratings .....45
EXPIRIMEHTAL REStfLTS 47
Corn Borer Resistance 47
Leaf-feeding ratings • . . .,.47
7"/" 57

ill
TABLE OP CONTM'JS (contimed)
Page
Experiment I and XI ...#••.....•47 E x p e r i m e n t I I I • • • . . • • • • . . • • • • 5 2
Damage-point counts 62
Experiment I.....62 B x p e r i r a e n t I I • • . • • . • • • • . . • • . 6 4 E x p e r i m e n t I I I • • • • • • • • • . . . . • • 6 6
Effect of migration on measuring realatanoe . . 73 Relation of leaf-feeding ratings to number and size of borers ••«•••..••....*•75
Relationship of leaf morphology and resistance • 79
Diplodia Stalk-Rot Resistance ......80
Experiment X I • • . « . . • » . • . . . . • • • 8 1 E x p e r i m e n t I I I . • • • • • • • • • • • . . . . • 8 1
DISCUSSIOl .#•••,•••• ...... 92
Breeding for Corn Borer Resistance .........93 Breeding for Diplodia Stalk-Rot Resistance ..... 96
SUMMARY 99
ACKHOILEDGMIHT . 102
LITERATURE CITED 103

1
IWROroCTIOI
fh© luropean corn borer (Fira'auata imbllalia Hbn.) and
Dlplodia stalk rot ar® perhaps th® moat Important of the corn
insects and corn diseases causing losses in the Corn Belt
today* Stalk rots always have been important and many corn
breeders have been selecting for reaiatance for some time#
The invasion in recent years of the European corn borer has
created new problems} now there is the direct damage of the
borer and increased damage from stalk rots which may invade
the stalk ttirough tunnels made by the borers* The most
economical way of reducing this damage is by the use of
hybrids which ar© resistant to corn borers and stalk rots.
The resistance of a corn plant to the corn borer is
measured by the degree it prevents larval establishment or
survival* Leaf-feeding ratings, damage-point counts, over
all injury ratings and actual number of surviving borers are
the attributes various workers have used to measure this
resistance* tolerance to the corn borer is the inherent
quality of the corn plant to yield and perform well in spite
of a corn borer Infestation* Resistance to stalk breakage
and stalk rots ar© some of th© main factors contributing to
tolerance* It was because of the apparent relationship
between corn borer tolerance and stalk-rot resistance that

2
corn borer resistance and Diplopia stalk-rot resistance were
both studied in tfa© same investigation^
Corn borer resistance and Diplodia stalk-rot resistance
are characteristics which show oontimious variation and must
b© studied by methods of qtaantitative iiAeritance# Continuous
variation Is usually due to the large number of genes in
volved, but also may be the result of a few genes whose
phenotypio expressions vary because of environmental Influ
ences# Genetioal analysis is carried out by the use of
means, variances, and covariances instead of class frequen
cies used in cases of slraple inheritance#
The purpose of this Investigation was to determine the
effectiveness of selection for corn borer resistance and
Diplodia stalk rot, especially when measured by several
attributes namely, leaf-feeding ratings, damage-point counts
and stalk-rot ratings# The principal method used was that
of partitioning the variances of segregating populations,
obtained from controlled crosses, into additive genetic,
non-addltiv© genetic and environmental portions. Such in
formation should be useful in planning breeding programs for
developing resistant lines or transmitting resistance to the
good Inbreds now in use.

3
REVIEW OF fEmimm LITEEATORB
Literature on ©orn borer resistance has been reviewed
recently by Rubis (19) and Painter (18)• Painter has pub
lished a comprehensive reiriew of the literature dealing with
many phases of corn borer resistance* Most of the early re
ports concern experiments on testing or rating the existing
varieties, hybrids, and inbred lines for resistance. Early
workers measured resistance on the basis of th© number of
surviving larvae found upon dissecting the corn stalks.
Huber (10) and ifeitoer and Stringfield (11) used, as a measure
of resistance, the number and size of leaf-feeding areas made
by young larvae feeding in the whorl of the corn plant. They
noted that on resistant plants the leaf feeding consisted of
fewer and smaller holes than on susceptible plants.
More recently many corn breeders and entomologists have
adopted a systeia of rating insect injury on a 1 to 5 scale
with 1 stoowing the least injury and 5 the most (17). Under
this system corn borer resistance was divided into two phases,
resistance to larval establishment and survival, and borer
tolerance. The 1 to 5 rating on borer establishment was
based on the amount of injury to leaves, leaf sheaths, and
number of burrows in th© stalk. The 1 to 5 tolerance rat
ings were based on the number of broken stalks, broken tas
sels, broken shanks, and broken leaves.

4
In the preaent oorn breedijrig programs (4) (5) corn borer
reaistano® work ia ©valuat-ed under two phases: (1) resistance
to establishment of larva© of the first brood aa determined
toy leaf-feeding ratlnga and (2) toleranee to both broods of
corn borer ustlng resistance to stalk breakage, ear droppage,
and stalk rot aa the criteria of measurement#
At the time this study began reports in the literature
on the inheritance of corn borer resistance were lacking#
Since then investigators from Minnesota have reported in
heritance studies which were conducted during the same time
as this study* Singh (20) using Powers method of analysis
reported the inheritance of leaf feeding and over-all injury
in the erosa 219 x 4291 as due to two factors• Loeffel (13)
studied the effectiveness of individual plant selection by
using regression of the Fg means on Pg plants and means
on F3 plants. Ha reported regression values on three crosses
of #26, #40|, and #18 on leaf-feeding injury and #21, #42, and
»51 on damage-point Injury# From his studies he concluded
that individual plant selection for leaf-feeding resistance
was more effective in the Pg than Fg generation, but that
equal gains were made by selecting in the Pg and P3 genera
tions for daanago-point injury#
I'he llteratiar® on Dlplodia stalk-rot resistance is ex
tremely limited, aaith ©J^ al» (21) developed a method for
artifically inoculating corn stalks with Diplodia# By

5
using a sjrlng© needle tb.©y inoculated one of the lower inter-
aofles with Diplopia Inoculum# They developed two methoda of
evaluating the roaulting stalk rot, namely, pith spread and
oortioal spread. In both instances the spread was expressed
as a peroentag© of the distance between the baae of the plant
and first ear# Holbert et_ al> (9) have reported that a re
duction in leaf area by diseases, insects or any other means
fgh.ich reduced the carbohydrate reserve of the plant increasocl
the a^aceptibility to Diplodia atalk rot. They reported that
infeatationa by second-brood chinch buga, which feed on the
lower parts of the plant, increased the susceptibility to
Diplodia stalk rot# The prevention of ear formation in
creased the carbohydrate reserve and likewise increased the
apparent realstance•
Christenaen and Schneider (3) investigated the associa
tion between stalk rot and corn borer injury and reported
that the Incidence of stalk rot increased with corn borer
Injury and tJiat the stalk rot possibly caused more damage
than the acfaial borer injury. They plated out discolored
tissue from 290 internodes in #iich stalk rot was associated
with borer tunnels# Microorganisms were Isolated from 92%
of the cases and l\iaarlua and bacteria were the most preva
lent organisms isolated, #3,ereas Diplodia zeae was found in
only 3^ of then.
faylor (23) studied stalk rots associated with borer

6
injury during the same two years as thia study was conducted.
H© found that I*\iaarium monilifora© and Cephaloaporium acre*
aonlua were the two principal organisms causing rots asso
ciated \fitb. 'borer injury and were present respectively in
86 and 45 percent of th© samples plated out. In these same
samples Glbberella aeae and Di.plodia aeae were found respee-
ti¥@ly in 25 and 14 percent of the samples. Taylor observed
t!mt Diplodia was associated with stalk rots following borer
injury at a very low frequency, although it is a very aggres
sive pathogen when stalks are inoculated with it. He sug
gested that the reaction of hybrids and inbreds to inoculation
of Diplodia resembled their reaction to rot following corn
borer very closely and could be used to test corn plants for
resistance to borer-induced rots#
Taylor (23) used a stalk-rot severity scale of 1 to 5
to study resistance to Mplodia aeae in four inbred lines,
B6, M14, W22j and Ii289» He used the 6 possible their
Pg^a and backcrossea to both parents in these studies* B6
showed moderate resistance and the other inbreds were sus
ceptible. He reported B6 as showing partial dominance for
resistance*

7
lilTERIAIS AIB H.'PHOBS
In,¥©atigationa on th.e Inheritance of corn borer reaist-
anc© and Diplodia atalk-rot reaistance were conducted during
1950 and- 1951» Preliminary crosses to produce the necessary
seed were mad© in 1948 and 1949i. Facilities to carry on the
Investigation were l^iraiahed by the corn breeding jjroject
of the Iowa Agricultural Ixperiraent Station# Corn borer egg
maasea for artificial infeatationa were furnished by the Corn
Borer Research Laboratory, Entomology Research Branch,
IJ.S.D.A#, Ankeny, Iowa* Di-plodia aeae inoculusi for stalk
inoculations was produced by the Botany Department of Iowa
State College* The experiments in both years were grown on
the Iowa State College Farm, Ankenj, Iowa.
The natural infestations of corn borer in 1950 and 1951
conaiated of only a lingle generation each year and were con
siderably lighter than, in 1949 when two generations occurred#
Cooler spring and early summer temperatures and the resultant
delayed seasons in 1950 and 1951 were considered as the main
factors causing this difference in numbers of generations.
Because this investigation was concerned primarily with corn
borer resistance to the single-generation strain or to the
first brood of the niultiple generation, it was not affected
by the failure of occurrence of the second brood in these
two years•

8
Corn Bor#r Eealatanc© Ratings
Corn borer reaiatanc© was evaliiated by two attributes,
namely, leaf-f-edding ratings and damage-point counts# In
order to obtain comparatl¥e ratings, all individual corn
plants studied w©r© artificially infested with corn borer
egg Miaasea during the whorl stage# The egg masses which
were approximately two days old and within approximately 24
hoiirs of hatching were dropped into the whorl of the plant#
In 1950 all plants were Infested with two egg masses per
plant and in 1951 all plants were infested with approximately
25 to 30 eggs per plant—the number of egg masses being ad
justed accordingly#
I.eaf*feeding ratings
fhe establishment of early instar larvae of the first
brood occurs in the raoist whorl of the corn plant i^ere the
larvae feed on tender corn leaves# There is a large differ
ential rate of growth and survival of the larvae between
resistant and susceptible plants at this stage# On very
resistant plants the expression is that of many pin holes
where young larvae fed before they died# The expression of
the leaf feeding on susceptible plants is that of larger
holes or feeding areas #iere the larvae fed well and devel
oped. fhis expression of the extent and type of leaf feeding,
which is actually a record of the plant reaction to larval

9
feeding and development, ia the basis of visual ratings of
l©af-feeding resistance* In 1950, after carefully examining
the rang© of variability in the expression of leaf feeding
in many inbred lines, hybrids, and segregating populations,
and ©specially noting the extreines, a visual leaf-feeding
rating aoale of 1 to 9 was eatahliahed,. On this scale 1 is
the moat resistant and 9 the most ausoeptiblei that is, the
size of holes or feeding areas are smallest in 1 and pro
gressively larger frora 1 to 9» ^he differentiation between
any particular rating is on the basis of size and shape of
the holes* These ratings are illustrated In fi^re 1 and
described briefly as follows«
1 « &aall pin holes*
2 - Small round holes larger than 1*
3 - Holes larger than 2, some longer than wide, width
restricted by secondary bundles*
4 • Holes larger than 3, longer than wide, restriction
as to width of holes by secondary bundles very
evident *
5 - Holes larger than 4 mainly due to more length.
6 • Holes larger than 5, restriction of width mostly by
primary bundles and very little by secondary bundles*
7 - Holes larger than 6 mainly du© to more length*
8 • Very extensive feeding*
9 - Very extensive feeding and leaves showing ragged

10
Pig. !• Scale of leaf-feeding ratings from 1, tiae most resistant, to 9, the most susceptible.

11
condition*
The time that ©lapsed between infestation with egg
maasea and. the taking of leaf-feeding ratings ia specified
in each experiment* Generally they were taken two to four
weeks after infesting with egg masses# Timeliness of the
procedure is of importance and will be discussed later in
this paper*
Damage»point oounta
In the sasie respect that leaf-feeding ratings are an
©xp"esalon of the aeti¥ity of early instar larvae, damage-
point counts are an expression of the activity of the later
instar or mature larvae that have survived* As the larvae
reach tiie third and fourth instar they began to migrate and
burrow into the leaf midribs and leaf sheaths especially in
the area of the ligule. 'rhey may also damage parts of the
tassel and burrow into the stalk* A ineasure of this damage
has been considered as a good estimate of the total number
of borers that have survived on the plant as a whole and
therefore a measure of the total resistance of each plant*
Each 3/4 to 1 inch of damage area on the leaf midribs and
leaf sheaths and each tunnel into the stalk, and each dam
age area of the tassel are considered as one damage point
(see illustrations figure 2)# The damage-point count of
each plant is then the total number of damage points on that

12
Fig. 2» Examples of damage-point counts (dpc). Damage to (A) leaf midrib—3 dpc, (B) leaf sheath and midrib at blade joint—4 dpc, (C) midrib at ligale area—2 dpc, (D) leaf sheath at node and 2 burrows into stalk— 3 dpc, (E) leaf sheath at node and m-idrib at ligule area—4 dpc, and (F) midrib at ligule area—3 dpc.

la
plant. These data.are taken at app'oximately the silking
stag® or a little later•
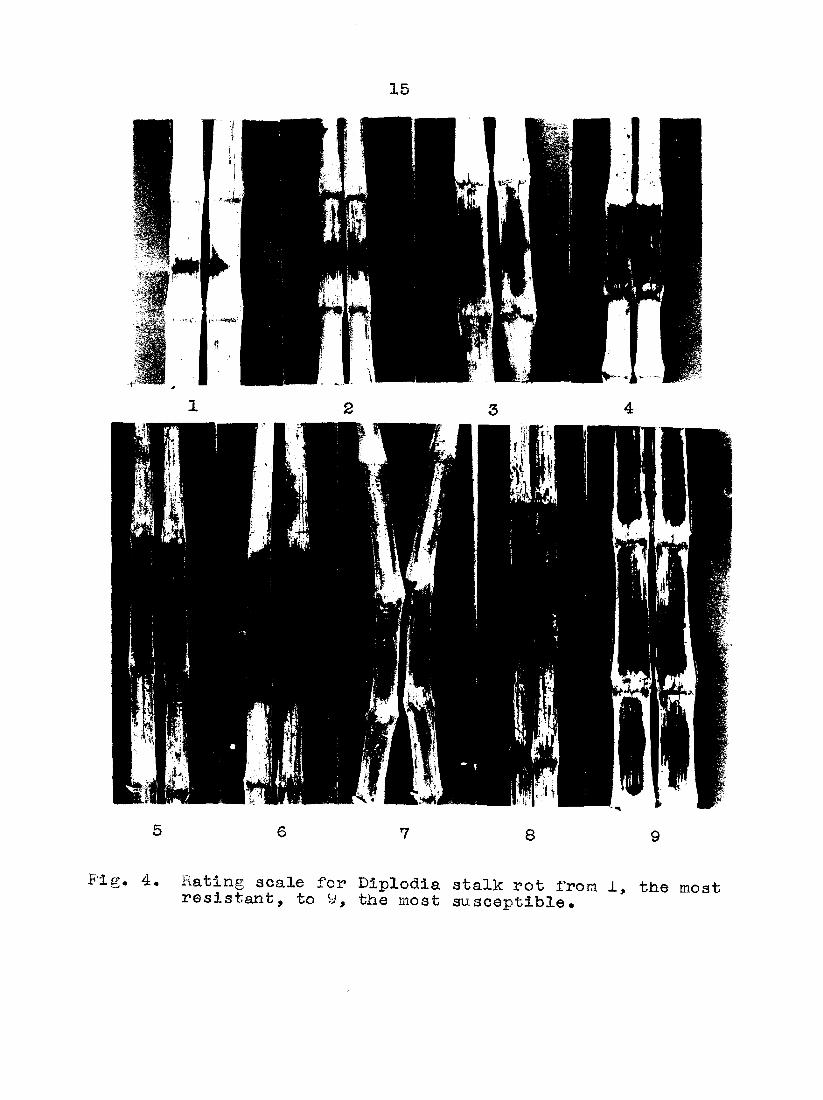
Diplodla Stalk-Rot Reaistanoe Ratings
All plants studied were artificially inoculated with
Diplodia seae inoculum during the middle of August. Each
plant was inoculated In the third internod© above the ground
as shown in figar© S# The resulting rot was examined by
splitting the stalks lengthwise with a knife about 5 to 8
weeks later# The spread of rot was recorded for each indi
vidual plant according to a stalk-rot rating scale of 1 to 9,
that is 1, the most resistant, with no spread, to 9, the most
susceptible, with rnxoh spread# The rating scale is illus
trated in figure 4 and the criteria by which the various
ratings are identified are listed briefly as followst
1 - Ho rot#
2 - Up to of the Inoculated internode rotted.
5 - 25 to 75^ of the inoculated internode rotted.
4 - 75 to 100^ Of the Inoculated internode rotted, no
rotting of nodal tissue*
5 * 100^ of the inoculated internode rotted and nodal
tissue rotted.
6 - 100/^ of the inoculated Internode rotted and up to
25^ of either or both adjacent internodes rotted.
7 • 100^1 of the inoculated internode rotted, and up to

14
C • D
Pig. 3. (A) Stalk rot following inoculation (above) and corn borer (below)• (B) Needle method of inoculating with Diplodia Inoculum. (C) and (D) Discolored vascular bundles extending into adjacent internodes.
15
6 7 8 9
Pig. 4. Rating scale for Biplodia atalk rot from 1, tiie most resistant, to y, the most susceptible.

X6
50?« of either or both adjaoeat internodoa rotted#
8 • 100% of th@ Inoculated interned© rotted and up to
Ibfs of either or t>oth adjacent internodos rotted#
9 w 100^ of th® inoettlated internode rotted and 100^
of either or both adjaeent internodea rotted#
Several aborteoainga to th© above scale were encountered#
Plants #iich died prematurelf ©ould not "b© rated by the above
scale toeoause th® pith msually disintegrated very rapidly and
th® spread of rot oouM not be evaluated# Because the cause
of th® premator© dying was not known, it was considered more
appropriate to assume that plants exhibiting premature dying
were random and omit them from the analysis# There were a
number of plants in certain populations which had only a
inod^3?at© amount of rot spread (or pith spread) but had dis*
colored vascular bundles extending the entire length of the
adjacent internodes (fi@ire 3)# These were rated one class
more auaeeptlble than th© pith spread indicated# The various
shortcomings of the rating scale and their effect on the
results will be discussed later#
Experiments Conducted
The iiaheritanc© of corn borer resistance and Diplodia
stalk-rot resistance was studied in three major experiments,
namely, experiment I in 1950 and- experiment II and III in
1961# Two special studies, experiments I¥ and. ¥, were

1?
conductsd in 1951 on various factors which might have a
bearing 'on th© r©2ai.lts obtaiaed in the major experiments#
In addition soni© ohservationa were made and minor exploratory
atudiea 'eoncimoted on the possible relationship of the mor
phology of some plant.struetures to corn borer resistance.
Experimeht I
Thia experiment conducted in 1950 included the I'2,
and Pg popilations of all diallel crosses of 9 inbred
lines..., .namely, LSI?.., 187-.2, Hy, WPS, B2', 38-11, B14, B7., and
B10-.» Baciccrossea to both parenta , and B2', (B'j x P]i «
etc*) were also gpown for four crosses'* The experiment was
laid out in a split—plot design in three replications^. The
main plots were th© 36 diallel crosses and the sub-plots were
the inbred lines,, Fg, ©tc^» of each cross-. All plots were
of equal size (13 plants per plot) and the size of each popu
lation was determined by the number of plots assigned to
each, which In this case were as follows? 1 1 P2, 1
5 Pg-, 5 and 5 Bg-# The plots were bordered on both
sides and the two parental inbreds were grown in adjacent
plots and were bordered on the outside but not from each
other-.*
Because of the limited number of egg masses available
only two replications were artificially infested with egg
m.as3.es-» Igg raasaes were applied during the first four days

18
in Julj# Leaf-feediag ratings were taken between July 17 and
26 and dawage-point•oounts August 13 to 19• All three repli
cations were ino-culated with Diplodia during the third week
of August and Biplodia ratings were made during t^ie last week
in September and first part of Ootober* As a matter of re-
eord, the silking dates ranged from July 27 to August 9»
Th® data were analyzed toy two methods, namely, the con
stant parent regression and partitioning of the variances.
Experii^nt II
This experiment was conducted In 1951 and Included 7
inbred linea and all their diallel crosaes making a total of
28 entries# The intoreds Included were L317, 187-2, Hy, WF9,
B2, BIO, and. B14# All entries were grown in a 3-row plot in
a randomized block design in three replications. Data were
collected on the 7 plants of the center row of each plot#
The plants were infested with corn borer egg masses on July 4
and leaf-feeding ratings were taken July 19 and damage-point
counts on Au^ist 6# Stalks were inoculated with Diplodia
during the third week in August and stalk-rot rating made
from September 23 to 29* The data were analyzed by the
constant parent regresaion method#
Experiflient III
This experiment growa in 1951 was the moat important

19
and ©xtenaiv© experiment of the entire investigation# Pour
crosses (L317 3E W9, B2 X BIO, L317 x B14, and Hy x B2) were
studied each with three rep-lieationa# Bach cross consisted
of the following populationst F'3^, ?2>
B2« The cross L317 x WP9 also consisted of BiS and BgS
popalations #ilch are aelfs of and B2 plants respectively*
All the popilations of each cross were grown together in
a complete randomiaed block. Each replicate consisted of a
number of equal»-si:aed plots (? plants per plot) in random
arrangement* fhe desired size of any specific population
was achieved by aJLlocating to it the appropriate nximber of
plots# !Phe following numbers of plots were apportioned to
each populations 3P3,» ^^1# ^^2# ®®1» 5B2# ^^^5* ISB^S,
and 15 BgS. All the plots of Inbreds were bordered on both
sides*
In the infestation and inoculation procedures and in
collecting the data each block was treated as uniformly as
possible* All Individhial plants in the experiH©nt were in-
fested with egg masses between July 1 to 7 and leaf-feeding
ratings were made between July 16 and 24 in such a way that
all ratings were taken within approximately two weeks after
infestation* I>a»age-point counts were taken August 7 to 11*
Stalks were inoculated during the third week in August and
the stalk rot was rated between September 20 and October 10#
fh© silking date of the corn was between July 25 to August 5*

20
Til©' data were analjzed by Mather's method of. partition
ing tile variances J this procedure is explained in a later
section#
.Experiaient .IV
fhia experiment was conduoted to evaluate the extent of
ffllgration of corn borer larvae and to estimate the magnitude
of th© migration ©ffeot iipon leaf-feeding ratings and damage-
point counts* Th® experiment consisted of growing a resist
ant hybrid, LS17 x E4, and a susceptible hybrid, fiF9 x BIO,
in three different associations, namely, no asaociationa,
grown in adjacent rowa, and grown together (alternate plants)
in the same row. The experiment was set up as a split-plot
d©si@a and grown in aix replicationaj the levels of associa
tion were the main plots and the hybrids the sub-plots* The
desired associations were attained by the following arrange
ment in each of the main plotsi no aaaoclation—a total of
aix rows, three rows (plots) of each hybrid and data collected
from the center row In each' case; association between rows—
a total of four rows with the two hybrids in alternate rows
and the data on each hybrid collected on the two inner rows;
association within the row—a total of four rows with alter
nate plants of each hybrid in every row and the data collected
on each hybrid on the t\fo inner rows# The plots were single
rows of IS plants spaced approximately IS inches apart, but

21
th© plaats on the ends of tti© rowa were not used in the analy
sis •
The plants were infeated with approxinmtely 30 eggs per
plant on June 27 and leaf-feeding ratings were taken 12 days
later on July 9 and 21 days later on July 18• Damage-point
counts were taken on itaguat 6.
Sxperiment V
The leaf-feedlng rating scale was established on cer
tain assumptions for whieh supporting data are lacking. The
first part of this eacperiaent (part A) was conducted to study
the relationship between the leaf-feeding ratings and the num
ber and size of borers present at the time the ratings are
taken* Four inbreds (L317, B2, B14, and WP9) and their six
single-cross combinations were grown in a randomized block in
three replications* Ml entries were grown in 3-row plots,
13 plants in length; and the center row was Infested with egg
laasaes and used for the study.. Approximately 30 eggs per
plant were applied on June 30 and leaf-feeding ratings were
taken on July 17# During the following four days the plants
were dissected and the size and number of borers were re
corded for each plant#
Part B of experiment V was conducted to determine what
effect infesting plants in the whorl stage with larvae of
the second to fifth instar would have on leaf-feeding ratings#

22
Two inbreda, I»517 and B2 w@r© planted lat© so aa to be in the
whorl stag® at the tiia® part A was dissected, such that borers
obtained in part A w@r® immediately uaed to infeat part B.
The larva© were grouped into two groups: 2nd and 3rd Inatars,
and 4th and 5th inatars# The experiment was laid out in a
split^plot design with inbred® as th@ main plot and larva
aiz® as the sub-plot and grown in 4 replicationa* Leaf-
feeding ratings were taken about two weeks later on August 6*

23
STAflSTICAL PROCERJRIS
Constant .Parent Kegresaion Method
Ixperlments.I and II were designed to b© analyzed by
the eonstant parent regression method. The mathematical
models, th® procedurea of analysis, and the genetical inter
pretations of the calcmlated atatisties of the constant
parent regression method ha^e been presented in detail by
Griffing (7) (8)« Briefly, the analysis is that of calculate
ing from parental inbred means (P*s) and their Pi means, the
following statiatiosi c»p»r» coefficients, second order re
gressions, "Variance componenta, and dominance (hp) values*
The steps in analyssing the data are outlined below. The
"n« parental Inbreds and the Pi»s are all grown in a
randomized block design in "r** replications. A constant
parent regression (c.p.r.) ia calculated for each of the "n"
constant parent groups by the method of covariance analysis.
For example, the dependent and independent variables for the
constant parent group are as followss
Dependent variablea (Fx^a) Independent vari able a (P's)
CPl Pg)
(Pi X P3)
to
P2
J's
to
(Pi X P„)

24
lh©n. tia© o*p#r« coefficients are compared to their re-
apectiv® constant parent valtiea^ the trend formed is indica-
ti¥e of the magnitude and dlreetion of dominance# With no
trend there is no dominance# with an increasing trend there
is negative dominance and with a decreasing trend there is
positive dominance# The regression of the o»p»r»*a on the
constant parent values is known as the second order regres
sion (designated bg) and ia the measure of the severity of
the trend or magnitude of dominance,
fhe total variance among the is separated into the
three components, naaielj, that attributable to regression,
that attributable to deviations from regressions and that
attributable to error# These components are obtained by a
regression analysis of variance as shown In table 1.
The component B is the additive genetic variance, D is
the non-additive genetic variance and E is environmental
Table 1# Regression analysis of variance
•ees of Varlanc^ Source freedom components'*
Hegression 1 E +• B
Deviations from regression n-5 E + B
Ir ror (r-1) (n*'2) E
"^'Grlfflng*s notation

25
mrlane©. The relative fflagaitmd® of each can be expressed
aa a percentage of the total of B -+• D E.
The average dominance or potence, hp, for each constant
parent is calculated from the parental and means according
to the following formlaj
- MP ® Pg - MP
where MF la the mldparent and Pg la the larger parent. An
hp is calculated from each within a constant parent group
and then the average of the group la the hp for the particu
lar constant parent•
Heritable and Mon-heritable Components of Variation
Experiment III and to some extent experiment I were
statistically designed to permit the partitioning of the
variation of the attributes studied into the heritable and
non-heritable components# In experiment III the heritable
coimponent was partitioned into th© additive and non-additive
portions.,
ISxperiment III was designed to permit analysis accord
ing to the methods presented by Mather (14) (15) (16). The
statistical models, their underlying assumptions and the
procedures of analysis were presented by Mather, but will

26
be outlined briefly below as they were applied to this in-
veatigation.
The genetic model and the statistlea estimated
The entire method as developed by Mather is baaed on
the g e n e m o d e l , o r i g i n a l l y p r o p o s e d b y E ' i s h e r e t a l » i 6 ) g
bj nfeich the effeeta of a segregating gen© can be measured
as to its contribution to the additive and non-additive com
ponents of variation# In the raodel, aa illustrated, the two
homozygotes AA and aa differ by a quantity 2d; the AA has
the greater' expresaion and aa the leaser expression of a
certain attribute under study* If the mean of the two homo-
zygotes is taken as the point of origin or midparent (MP),
then aa contributes an increment of -d and AA an increment
of +-d to the mean, and the heterozygote, Aa, obtained upon
crossing AA x aa differs from MP by an increment of h which
may be either positive or negative in sign.
aa MP AA
(-)«.
•d~
-> (+•)
The single-locus model can be extended to all loci of
one individual conditioning a certain attribute expression#
For example, the mean difference between two inbred lines
with respect to a certain•measured attribute will be

27
2js(d+) - , wh®r© SCd-^) and S(d-) indicate the sum of
d inci*©m©nta of the loci under eonaideration in the larger
parent in th® positi¥@ direction and negative direction re
spectively# An Fx obtained from croaaing these two individu
als will to© S(h}.
When the genetic model is extended to individuals of a
segregating population such as an Fg, the effects of segre
gation appear as heritable coniponenta of the variance# If
th© ia Aa, the derivation of the components of an P2 is
as follows!
F2 individuals iAA ^A& i&a.
Increments of each ©lass • ^d h -d
F g m e a n « • * • « • • • • i d i - h - i d « - J h
S« S* of deviations from MP i( d)^+ i(h)^-f- 4(-d)^
Variance of P2 • • • • • • ^d^ #1^ - (ih)®
* id +
Assuming that the genes under consideration are not linked
and ttiat they are on the average additive, then the genotypic
variance of the Pg hecomes is(d^) •+ or where
D • S(d^) and H 8 By assuming further that there is
no interaction between 1±ie genotype and the environment, the
non-heritable variance of the Pg Individuals can be repre
sented by %» and finally the phenotypic variance is as
follows I
Phenotypic variance of Fg » ¥pg « -l-D •

28
Tims -I'D is the addlttTO genetic component, -if! the non-addltlve
genetic component and the environmental component of the
Fg variance*
In procedtirea analogous to that above, the components
of variation equations (with D, H, and E) can he derived for
anj kind of controlled segregating population which origi
nated from two homozygcrus inbred lines• The notation and
components of variation fonaulas of the variance and covari
ance statistics used in this investigation are given in table
2.
In order to derive the various equations for the com
ponents of variation for the statistics in table 2, the
genetic model assumed (1) additivity of genie effects (no
epistasis), (2) no interaction between the genotype and the
environment, and (3) no linkage# Methods are available to
test how well these assumptions are fulfilled for any set of
data. The first two assumptions will be discussed in a later
section on scaling, and linkage will be discussed below#
A teat for linkaist®
The components of variation for the various segregating
populations were derived under the assumption that the genes
which condition the character expression recombine indepen
dently, that is, that the recombination value, p, equals 0*5«
Although linkage does not affect the mean measurement of

29
Table 2» Th« seoond-degre© statlatlos of populations studied, their notation and their equations for the components of variation#
Components of
variation Stafelati© Notation
Variance of Pi, ?£» and
individnala %
Summed eovarianees of and B-j_S
and B2 and BgS
SanHBed mean variance of B;^S
and B2S
WB2 /BxS-»-%2/B2S
f ijpm
BxS- gS
El
¥arian0e of f2» ^"'l
•plot means Eg Eg
Variance of Fg i-D+iHtEi
Variance of F5 aeana ^3 ^D+JLn+Eg
Covarlance of Pg and P3 "PsAs ^D+|H
Mean variance of F3
Sammed variances of and Bg Vbi^VBJ |D+iH+2Ex
Sumujed variances of and.
BpS means VBII+Vgp' |Dv|.H -2E2
iD+iH+2Ei
Til© D, M, and E here are not to be confused with the B, D, and 1 of the constant parent regreaaion analysis; they are completely different.

30
segregating families. It does affect the variances and co-
variances. Thia can be demonatrated in the derivation of
the variance of an B'g where genes A-a and B-h are linked in
the coupling phase (AB/ab)• Where q a 1 - p the gametes in
the Pi are formed with the following probabilities:
AB Ab aB ab
q/2 p/2 p/2 q/2
and #i©n aelfed and completely classified in the Pg produce
ten genotgrpic classes as shown in table 3, The phenotypes
Table 3« The frequencies^ of the 10 genotypes of two coupled genes in the Pg and their phenotypes in terms of d and h*
(R » repulsion, C • coupling of double heterozygous class)
AA Aa aa
BB q2
«la-^ %
2pq
^ a ^ b
«2 P
""d d-u a b
Bb 2pq
da+
C 2q^
i^a-^ ^b
R 2p®
2pq
"^a + b
bb <^a - b
2pq
^a *" ^b
2 q
-dg^ - d^
"^All frequencies divided by 4

51
of each class In terms of d and h are also shown in the table.
When th© phenotypea are added the Pg mean, is + h^^), the
same aa without linkage. The sum of squares of the d and h
d©¥iatioaa from th© midpareat minus the correction factor is
as follows«
id^ id| + {l-2p)d^d^ + ih| + + (p4q)h h -.(ihg f h )
In the case of repluaion th® linkage coefficient of d^dti is
«*2(l-2p) instead of 2(l-2p), but the sign of the value for
hg^h-b does not change* Summing over all genes in the P2 which
are linked, the components of variation in terms of D and H
take on the following values:
Similarly as above the variances and covarlances in the
presence of linkage for different kinds of segregating popu
lations can toe derived. The important value in each case is
the recombination value or linkage coefficient of the dg^dt,
and h^hij terms. These values for the VSJPIOUS segregating
populations used in this investigation are given in table 4»
Aa is evident from this table th© D and H components have
constant linkage terms within one generation but change in
and the heritable variance of the Pg is then
%2 • i df 4 2(l-2p)d^d|3 i h| + h§ + 2(l-2p)2 h^^h^ .

32
Table 4« The different I> and H components of variation in the various populations according to the linkage coefficients of the and h^hij variance terms#
Popilation statistics
D Coefficient comp* of d^db
H comp*
Coefficient of hahfe
Wpg/p^ Di t 2(l-2p) Hi 2(l-2p)2
%l/BiS+%2/BgS % ±2(l-2p) 2(l-2p)
% ±2(l-2p)^ % 2(l-2p)2(l-2p4-2p2)
B4 ±2(l-2p)(1-p) H4 2(l-]Ei{l-2p)^
the following generation* The test for linkage is the test
for homogeneity of D and H values from one generation to the
next or over several generations sioRaltaneously# This change
from generation to generation may also give information on
the nature of linkage—generally with coupling D and H de
creases in value from F2 to F5 and with repulsion they in
crease in value#
Calculation of the components of variation
A completely randomized block design permitted the
calculation of each particular population statistic by a
separate analysis of variance or covariance* The observed
joint value was calculated for each statistic over the three

53
replications taking out replication effect. Observed values
for ©ach replication aeparatelj were also calculated ao as to
permit an eatimate of error variation of the D, E, Ej and Eg
values# fhe method of calculating ©ach particular variance
or covariance for the crosa Ii317 x WF9 was as follows:
El • • • .variance of Individuals within plots of
Pg, and
E2 • • • •variance among plot means within Pi, P2# and
Fi.
Vpg • . « #variance of individuals within plots of F2«
¥fg , • • •variance among plot means of Fg progenies.
WP2/IP3 • • .covariance of F2 plant value^ and F5 progeny#
• .variance of individuals within plots over
all F5 progenies#
¥Bi+' B2 • • .summed variances of individuals within plots
of Bi and B2*
• •s^Buaed variances among plot means of B^S and
B2S.
*cova3?iance of Bi plant values and B^S progeny
mean plus covariance of B2 plant value and
BQB progeny mean.
• »suB)med variances of individuals within plots
over all BiS and B2S progenies.
h'be Pof Bi, and B2 plant values were obtained in experiment I in 1950.

54
The calculated second^degr-ee statistics are partitioned
into th© D, H, and Eg components of variation by a special
least squares technique. Two sets of components are calcu
lated, an inclusive set i8hich assumes no linkage and an
exclusive set which allows for differences which could be
due to linkage* The least squares equations for the inclu
sive analysis of th© ten statistics obtained from the cross
L317 X. WF9 are as follows s
1.812500D + 0.812500H i- B»750000Mi + I.50OOOOOE2 « S(Dy)
G,8125001) + 0,488E81H + 1.875000Ex + 0«312500E2 « S(Hy)
2.750000D + 1.S75000H + ll.OOOOOOli « S(Eiy)
1.500000D + 0.312500H -f 6.OOOOOOE2 « S(E2y)
The first equation is found by mltiplying the coefficients of
D, H, £3^, and Eg and the calculated variance or covariance
value in each of the eight equations containing D by the
coefficient of 15 and summing over all eight# The other three
equations are found similarly by using the coefficients of H,
and Eg as Biultipliera respectively# The left side of the
equations are inverted once to yield the c-matrix of table 5,
The va3ue of D, H, Ex# and E2 are then found by jaultiplying
their respective c-matrix values by the corresponding value
on th© right side of th® equation and summing as shown in the
following example for Ds
X) m odd S(Dy) + 0011 S(Hy) + Cj)x SCE^y) + 0^2 S{E2y).
The use of matrices simplified the calculation procedures

55
Table 5» Th@ o-matrlx table for the Inclusive analyala of the ten statiatios obtained from cross L317 x WI'9«
T> H El E2
3•483698 ®HI) •6.071618 ®1D 0.164010 ®2D -0.554694
®DH -6•071618 17.143392 ®1H -1.404265 °2H 0.625020
°D1 0.164010 ®H1 -1.404265 °11 0.289270 ®21 0.032136
®DS -0.554694 °H2 0.625020 ®12 0.032136 ®22 0.272787
tremendoualy beoaua© the same matrix table can be used for
each attribute of th© game cross or of other crosses of the
same structural design.
fh© least squares estiiaates obtained for the four com
ponents, B, H, Ix, and Eg are substituted back into the ten
original statistics (or component formulas) to yield the in
clusive expectations for th©m»
The exclusive armlysis is the estimation of 7 components
of variation, namely, Eg, Hg, the combination of
Dg and Hg which appear Jointly and only in Vpg, and the com
bination of D4 and H4 which appear jointly and only in
+ 'fh.e exclusive expectations of and BiS +
?BgS are therefore each their own best estimate# The other
five components are estimated by five simultaneous equations
analogous to the calculation of the inclusive set, but from

56
the other eight statisticsj excluding Vp^ and Vg^s ^828*
The ©xclusiv© ©xpectations of these eight statistics are then
obtained hj suhatituting into their componenta forrmilas the
least squares estimates of the Hi, H2# Ei, and Eg com
ponents.
The analysis of variance (table 6) for linkage and re
sidual interaction can be calculated bj comparing the exclu
sive and inclusive expectations of the ten statistics with
fable 6# Analysis of variance of linka^ and residual interaction of the ten statistics of cross L317 x WP9#
Source of variation Degrees of freedom Mean square
Linkage 3
Residual interaction 5
Error (replication) lO(r-l) V
Total lOr^ - 4
• r « mmftjer of replication
their observed values. The ten statistics observed in r rep
lications minus 4 degrees of freedom for calculation of D, H,
and Bg gives a total of lOr - 4 degrees of freedom for the
analysis. The degrees of freedom for linkage is the differ
ence between the number of components estimated in the
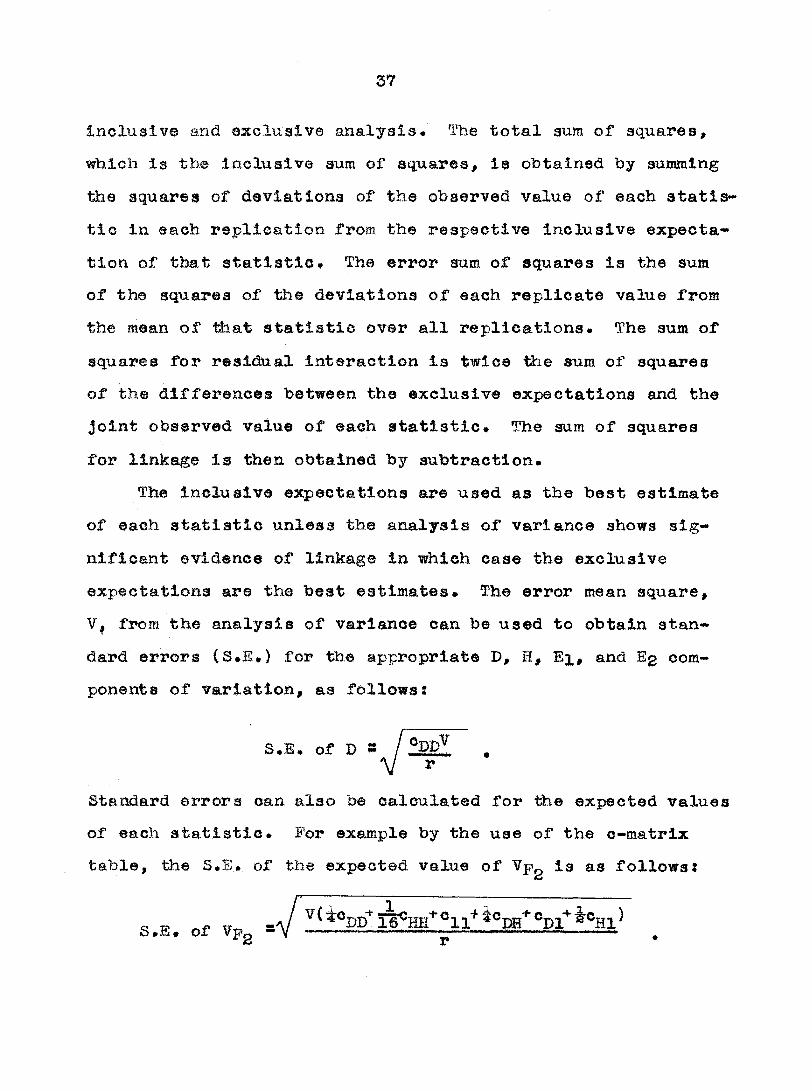
37
inclusive and excluaive analysis# The total sum of squares,
which la the Inclusive sum of aquares, la obtained by aummlng
the squares of devlationa of th© observed value of each statis
tic In each replication from the respective inclusive expecta
tion of that statistic. The error sum of squares la the sum
of the squares of the deviations of each replicate value from
the mean of tiiat statistic over all replications. The sum of
squares for residual Interaction is twice ttie sum of squares
of th© differences between the exclusive expectations and the
Joint observed value of each statistic. The sum of squares
for linkage la then obtained by subtraction.
The inclusive expectations are used as the best estimate
of each atatiatlc unless the analysis of variance shows sig
nificant evidence of linkage in which case the exclusive
expectations are the beat estimates. The error mean square,
¥, from the analysis of variance can be used to obtain stan
dard errors (S.E.) for the appropriate D, H, Ex# and Eg com
ponents of variation, as follows!
S.E. of D S / V r
Standard errors can also be calculated for tiie expected values
of each statistic. For example by the use of the c-matrix
table, the S.E. of the expected value of ¥pg is as follows!
S.E. of ¥pg -V

38
The tea population atatiatlcs from the croaa L317 x ?i)'P9
were used In tfc© examplea above. The analysis of variation
of the croasea L317 x B14, Bg x BIO, and Ej x B2 were carried
out in an analogous manner# fh©g@ three crosses were of the
same structural design in that the same seven atatiatica were
estimated from each (the first aeven listed in table 2)• The
inclusive analysis was the same as above, but the exclusive
analysis was the estimation of 6 components of variation,
namely, Eg, Hg and the combination of Dg and H3
in The exclusive expectation of ¥p^ and Vg^ •+• were
made equal to their own observed values aM the exclusive
estimates for th© other 4 components was carried out in the
regular manner*
Muaber of effective factors and aeleotion llmita
Mather (15) has suggested the term "effective factors"
to be used instead of "genes" for the estimated number of
segregating units of inheritance tifcieh are detected by bio-
metrical analysis# There are two estimates available for
the ntimber of effective factorsj one of these, Ki, is based
on ttie difference between the parents and the other. Kg, is
based on the segregation of the Ps's* In certain cases their
size and relationship can be used as a basis for an estimate
of k, the number of genes#
Th© estimate of Ki is very simple; it is the ratio of

39
the aquar© of half the parental difference to D and. is repre
sented by the following formula!
2 - pg)]
^1 • D
For to be an effective estimate of k all the "plua" genes
must be concentrated In one jmrent and all the "minus" genes
in the other parent. Inequalities in this criterion lead to
low estimates of k«
The estimate of IC2 is somewhat more complicated and can
be represented by the following formula:
— O (heritable portion of Vp^)
^•
The heritable portion of ¥pg la The variance of the
Fg variances, is obtained by direct calculation. Be
cause the is Inflated by a sampling error which is In
turn dependent upon the size of Pg families, a correction
term must be subtracted from it# Wier© n Is the size of the
P3 family, the' term (Vpg)2 la the bast estimate of this
sampling error. The precision of K2 as an estimate of k is
considered low when the non-heritable variation of the P3 is
over half of the variation. When the genie effects are un
equal in size both Kx and Kg will be an underestimate of k.
The Kg in a certain sense is a measure of the effective

40
unit which is segregating, su,c& that Kg along with D can he
used to ©atinmte theoretical selection limits. It is pos
sible to calculate the difference between two true breeding
strains which would respectively contain all the "plus" genes
and all tfee "minus" genes. The forimila for the selection
limits (St») would then be as follows s
SL » Mp± KgD .
Scaling fests and Transformations
The scales of measurement used to take data in the field
are those which are most convenient; however they are not
necessarily the most appropriate for purposes of biometrical
analysis or genetical interpretation. Pi sher ejfc al• (6)
have shown how metrical bias caused by inadequate scales
could falsify interpretations. Mather (15) (16) has devel
oped techniques for scaling and emphasizes the importance of
scaling T^en calculating the components of variation.
Two criteria or aaaumptions which a scale must satisfy
to be adequate for biometrical analysis are: (1) the genie
effects (locus effects) must on the average be simply addi
tive and (2) the magnitude of the environmental variance must
be independent of the aean measurement of the genotype.
Scaling ia the method of testing whether these assumptions
are fulfilled on the scale used, and of determining a proper

41
transformation when the scale is inadequate.
The additivenesia of genie effects was teated by com-
parisona of the means of Bg, and P2 with th© means of
Fl» P2» and Th© following equations were used for these
comparisons (Fx • mean of etc.)i
% m w 3Bi - Fi - Fi
Zg s 253
1 1
% m 4Fg 1 i
01 1
Z4 mm
2P2 - Si . E-g .
When the scale is adequate the values of Z^t Zg, Z3, and Z4
are expected to he zero within the limits of sampling error.
Their standard errors are estimated from the standard errors
of the various population means according to the following
example:
S.E. of Zi 4Vgj^ + •
These various statistics are expected to hold true ^en genie
effects are additive* As a general rule Fx# Pg* ^3
should deviate the same direction from MP and fall closer to
the MP in each generation.
The independence of the non-heritable variation and the
genotype were tested by the comparison of the means and vari
ances of a series of inbred lines and Px's. A significant
correlation between th® means and variances is an indication
that the environmental variance la not stabilized but varies

42
with the mean measurement of tib.® genotype.
Leaf-feeding ratinga
There was a significant negative correlation of -.4452
(43 d.f.) between the means and variances of the leaf-feeding
ratings of the inhreda and P^'a of experiment I In 1950» The
relationship of the means and variances did not suggest any
particular tranaformatlon# In experiment III in 1951 there
was a very low non-aignlflcant correlation between the means
and variances of the aame attribute (table 7). Data on leaf-
feeding ratings were not transformed in eitibier year.
In tests for genie addltlvity in table 8, all the signifi
cant deviations from additivlty were due to akewness toward
the susceptible parent. The cross L317 x WF9 and B2 x BIO
had the largest deviations from additiveness.
Damage-point counts
There were very significant positive correlations be
tween the Mans and variances of dajnage-point counts of the
inbreds and Fj^'s both in 1950 and 1951 (see table 7). The
variances were considerably greater than the means. The
tried but did not improv® the scale. A transformfition de
veloped by Beall(2) for contagious distributions of Insects
was found to moat adequately fulfill the scale. However
were transformations which were

fable 7# Means anfl variances of three attributes, leaf-feeding ratings, dsBiage-point counts, and Diplodia stalk-rot ratings for iribreds and in experiaient III, 1951. Correlations of aeans and Tariances given at bottom of each column*
Damage-point counts Diplodia stalk-rot ratings Inbred I eaf-feeding * Beall'a Square root lines ratings Original data transfornation Original data transformation and Fi Means Variance Means Variance Means Variance Means Variance Means Variance
L317 2.39 1.3471 2.23 6.3745 1.26 .2710 3.61 .5523 20.20 2.2338 WP9 7.36 1.2088 5.73 15.8836 1.82 .2120 2.42 .6195 17.08 4.7076
L317XWP9 5.51 .9257 5. 11.2276 1.85 .2220 3.28 .9542 19.28 5.2460 L517 2.65 1.2868 2.16 5.3996 1.26 .1652 3.94 .4226 20.86 1.8571 B14 5.20 1.2976 2.90 9.0675 1.40 .3201 2.00 .1878 15.90 2.3200
L317XB14 3.98 .7585 6.08 10.7530 1.89 .1896 2.65 .5355 17.75 4.3548 B2 3.92 1.6722 1.21 2.8622 1.05 .1826 1.38 .2380 13.52 3.8096 BIO 5.64 2.2463 3.07 9,3160 1.41 .2997 3.13 .3584 19.15 2.0365
B2XB10 5.38 1.94 65 2.95 7.4400 1.41 .3243 2.20 .4249 16.46 4.4613 Hy 3.70 1.3226 1.05 1.5446 1.03 .1436 3.65 .7513 20.27 3.2276 B2 3.45 1.6510 1.05 1.6842 1.03 .1753 1.38 .2350 13.51 3.7627
RyxB2 3.87 1.1391 2.03 4.8363 1.20 .2145 2.35 .3571 16.98 3.0794
II O
.1233 r s . 9151 r s . 2074 r « . 6260 r 5 -. ,3329

Table 8. Sealing tests for genie additivity of leaf-feeding ratings, daffiage-point counts and Diplodia stalk-rot ratings in ftmr crosses, experiment III, 1951.
Leaf-feeding PaBiage-point oounta ' Stalk-rot ratlnga Cross ratings B©all*s Square root and Original data Original data transformation Original data transformation
eqmation De¥« and S.E« Dev. and S«E, Dev» and S*E» De¥» and S«E» Dev« and S«E«
L517xlF9 Zl Zg Zg H
-0.62 i 0.11± 1.87 ± 1.19 i
.44
.49
.87
.45
-1.23*1.06 2.61*1.56 7.56*2,14 3.09*1.21*
-0.11t 0.29 ± 0.94-0.38
.18
.17
.30*
.16*
-0.23 i" -0.82 ± -0.55 0.25 i
.40
.44
.76
.31
-0.68* .95 -2.26*1.17 -1.28 1.82 0.83 .77
L317xB14 Zl Z2 Z3 Z4
0.03 i 0.98 ± 0.6S -0.19 ±
.39
.47*
.85
.46
0.76*1.35 3.40*1.96 1.98*2.50 0.50*1.35
-0.37 0.41* 0.40± 0.18i
.23
.23 •35 .16
1.23* 0.35i 1.84 ± 0.13 ±
.43**
.28
.88*
.44
2.83* .98** 0.87± .82 3.90*2.01 0.10 .97
B2xB10 Zl Z2 Zs Z4
1.42 ± -0.62 ± 3.28 =t 1.24 ±
.56
.96*
.57
1.42* .89 1.04 .91 6.90-1.95 2.22* .99*
0.32* 0.26 i 0.90* 0.29i
.15*
.17
.30**
.14*
-0.28 ± -0.23 -0.55 -0.02
.15
.23
.36
.19
-0.78- .54 -0.57* .66 -1.39*1.17 -0.02* .59
HyxB2 Zl Z2 Zs Z4
0.31 ± 0.48-0.55 ± -0.12i
.34
.32
.67
.34
1.08* .87 0.30* .74 1.04 1.90 -0.17i .97
0.26 ± 0.08 ± 0.24* -0.05±
.20
.17
.36
.18
0.74* -0.07* 0.19± -0.24i
.22**
.16
.27
.14
1.89* .53 -0.17* .67 0.74*1.26 -0.49 .66
^t test significant at the \% level *t test significant at the 5^ level (d.f. are 60 or more in all cases)

45
Beall'straaaformation was modified slightly according to
Bartlett (1) and x +• was used instead of x hecause of the
manj araall numbers and zsroa* B'ollowing is the transforma
tion uaeds
where x is t±i© observed value, x* is the transformed value,
and k is estimated from the sunuaation of the means minus the
aumcaation of th© variances divided by the summation of the
squares of the means of th© original data* The value calcu
lated for k was *39 for all inbreds and F'l's in experiment
I and III. It is obvious from table 7 that this transfor
mation stabilized the variances very well*
The transformation did not Improve the genetic addi-
tivity, in fact the scaling tests for additivity did not
show material differences between the original data and the
transformed data (table 8)# It is of interest to note that
th© deviations from additivity concerned the same popula
tions of th© same crosses in both the leaf-feeding and
damage-point attributes*
Diplodia stalk-^rot ratinjgs
There was a significant positive correlation between
the means and variances* The log x transformation gave a
high significant negative correlation and >\J x+i gave a small
non-significant negative correlation (table 7)* The 10\fx
X* s log e k{x<-i [ l+-k(x-'-|

46
waa the tranaformat!on xised# Th© transformation was multi
plied by 10 in order to obtain whole numbera rather than
seros in the algnificant digits of the variances#
Th© transformation did not change the scale in regard
to genetic additivlty as can be seen in the comparison of
the significant deviations from additivlty between the
original and transformed scale (table 8}# In the crosses
L317 X B14 and Hy x B2 there la skewnesa toward the larger
or susceptible parent in the backcrosaes to the susceptible
pare nt •

47
EIPERIMElTAli RISULTS
Because data were obtained on the various attributes
from more than on© experiment, the analyses of the data
are presented under the general headings of the attriMtea
studied# The data on corn borer resistance, namely, leaf-
feeding ratings and daaage-point counts, are presented first;
and the data on Dlplodia stalk-rot resistance obtained from
th© same experiment ar© presented in a separate section later.
Corn Borer Resistance
Leaf-feeding ratioks
Experiment I and .11» The population means of
Pi and Pg and the percent heritable variation of the Pg for
leaf-feeding ratings of the 36 crosses of experiment I are
presented in table 9» The phenotypic variance of the Pg
(Vpg) partitioned into the heritable and environmental
(Ex) portions by using the parental inbreds and P^ of the
particular block (main plot of the design) of each cross for
estifflatlng
The percent heritable variation of ttie Pg^s ranged from
-20.S to 79#9# The negative value, of course, is impossible;
^Throughout this paper Pi always refers to the first parent listed in a cross and Pg to the second parent»

48
Table 9. Means and heritable variation of leaf-feeding ratings of tiie 36 diallel crosses of 9 Inbred lines, experiment I, 1950•
Cross Pi Pomlation means
% Fi P. Variation
% ^
Percent* heritable variation
1 17 L517 L317 L317 L517
X 187-2 X Hy X WF9 X B2 X 38-11
L317 X B14 L517 X B7 L317 X BIO 187-2 X Hy 187-2 X WF9
1,83 1.92 2.71 2.05 1.79
1.29 1.69 1.95 4.57 5.07
6.13 4.64 7.59 5.05 6.69
6.09 5.77 6.67 3.67 8 • IB
4.40 3.52 5.25 4.14 5.35
3.79 4.13 4,82 6.20 7.38
4.98 5.14 6.25 4.03 4.99
5.05 3.48 4.72 4.73 7.17
1.28 1.18 1.90 1.04 0.69
0.97 1.45 0.61 1.62 0.60
2.62 3.46 2.78 2.63 3.01
2.54 2.18 3.04 3.57 2.03
51.1 65.9 31.7 60.5 77.1
61.8 33.5 79.9 54.6 70.4
187-2 X B2 187-2 X 38-11 187-2 X B7 187-2 X B14 187-2 X BIO
Hy Hy Hy Hy Hy
WF9 B2 38-11 B7 B14
6.25 6.06 4.83 5,69 5.88
4.63 4.44 4.72 4.60 4.00
5.00 6.40 5.00 6.79 6*60
7.90 5.78 6.89 5.07 5.50
5.89 6.14 4.93 6.26 7.18
7.50 5.68 5.59 4.37 6.55
5.11 6.16 5.11 6.68 6.64
6.58 5.82 6.31 5.37 5.93
0.80 1.49 1.26 1.00 0.97
1.73 1.08 1.22 1.61 1.11
2.81 1.87 2.23 1.41 2.09
2.16 1.94 1.52 1.93 2.06
71.5 20.3 43.5 29.1 53.6
19.9 44.3 19.7 16.6 46.1
Hy X BIO 5.20 6.60 6.33 6.33 1.63 2.08 21.6 WP9 X B2 8.00 5.10 7.36 7.11 1.57 1.96 19.9 WF9 X 38-11 7.07 6.07 7.65 7.22 0.73 2.18 66.5 WP9 X B7 7.72 5.17 6 .86 6.75 1.20 1.85 35.1 WP9 X B14 7.42 6.39 6.67 7.21 0.91 1.75 48.0
1P9 X BIO 7.75 7.40 8.18 8.06 0.67 1.21 44 . 6 B2 X 38-11 4.50 6.82 6.39 5.80 1.96 3.43 42.9 B2 X B7 4.43 4.75 4.68 5.29 2.26 2.36 4.2 B2 X B14 4.31 6.13 6.83 6.89 1.32 1.32 0.0 B2 X BIO 3,82 7.00 5.87 5.90 1.40 2.02 30.7
38-11 X B7 6.20 5.31 6.14 5.32 0.57 2.79 79.6 38-11 X B14 6.89 6.93 6.81 7.29 0.69 2.10 67.1 38-11 X BIO 6.80 7.18 6.68 7.25 0.51 1.61 68.3 B14 X B7 6.29 5.09 6,75 6.30 0.88 1,68 47,6 B7 X BIO 5.44 7.33 7,00 6,62 0.69 1,50 54,0 B14 X BIO 7.13 6,92 6.95 7,44 0.88 0.73 —20 . 5
heritable variation * ('V'P2-El)/?Pg times 100

49
however, these values obtained are subject to error variation
and metrical bias and considerable caution must be taken in
their interpretation. The design of the experiment did not
permit the calculation of standard errors of the P2 genetic
variancesJ therefore there is no measure of the reliability
of these estinGiatea* The scaling testa showed that the en
vironmental variance was not atabilized but was negatively
correlated with the magnitude of the mean meaaurementa# It
ia evident from the inspection of table 9 that the extremely
high values for heritable variation were obtained from
crosaea #iere the was low# lo suitable transformation
was found for the leaf-feeding ratings of this experiment#
Experiment I was most valuable for the information it pro
vided for setting up experiment III.
A constant parent regression analysis of the parental
and Fi means of the leaf feeding ratings of experiment I is
presented in table 10# In this analysis the parental means
were calculated for each inbred over the entire experiment#
The low hp value, the highly significant regression mean
squares, the hl^ percentage values for B, and the absences
of any trend in the comparisons of the c«p.r# coefficients
with the constant parent values (bg « 0.0) are all indica
tive of no dominance and additive gene action. The constant
parent regression analysis of experiment II (table 11), which
was grown the following year, showed essentially the same

Table 10. Sammarj of statistics estimating gene action and the components of vari ation of leaf-fesding resistance by the method of constant parent regression, experiment I, 1950*
Inbred Parental parents means c«p.r»
Components of regression analysis of variance - %
Regression M.S.
D
Deviation from
regression M.S.
Error M.S.
hp value
WP9 7.64 .5881 87.6 9.6 2.8 5.85 .80* .18 1.37 BIO 6.97 .4978 96*0 0.1 3.9 10.92" .44 .43 .39 B14 6.96 91.2 7.7 1.1 9.66 .92 ** .12 .17 38-11 6.54 .3605 95.7 1.0 3.3 6.02 .26 .20 .45 187-2 5.56 .4726 94.2 2.9 2.9 10.83 .65 .33 .36 B7 5.21 .5814 95.9 2.3 1.8 16.30 .68 .30 .16 B2 4.77 .5092 95.1 0*7 4.2 12.21 .60 . 52 1.31 Hy 4.48 .6148 95.5 3.0 1.5 17.34 .80 .27 1.29 L317 1.94 .3822 82.5 13.4 4.1 2.77** .56* .13 .26
bg = -0.0064
•^Significant at the 1% level
^Significant at the d% level

fable 11• Su^arj of statistics estimating gene action and the components of variation of leaf-feeding resistance hj the constant jmrent regression method, experiment II, 1951.
Componenta of regression Deviation
Inbred Parental analysis of Eegresslon from Error hp pirents means c.p.r. variance - % M.S. regression M.S. value
B D 1 M.S.
1F9 6.75 .5154 91.5 8.4 0.1 6.64** 0. •56 .68 187-2 5.90 .5889 88.7 8.6 2.7 11.60* 1.44 .35 2.12 B14 5.62 .5573 93.2 0.7 6.1 10,92t? 0.75 .67 .86 BIO 5.49 .8113 95.9 3.3 0.8 23.54 l.CX}" .19 2.62 B2 4.22 .7545 96.3 0.0 3.7 20.14" 0.06 .74 .65 By 3.62 .6277 91.4 0.0 8.6 12.33 0.10 1.06 .26 L317 2.68 .5711 94.8 2.4 2.8 6.44 0.34 .18 — .01
b2 = -0.0082
"^^Signifleant at the 1^ level
^Significant at the level
52
result a as ©xperlnfflfit I, that is, no dominance and additive
gene action#
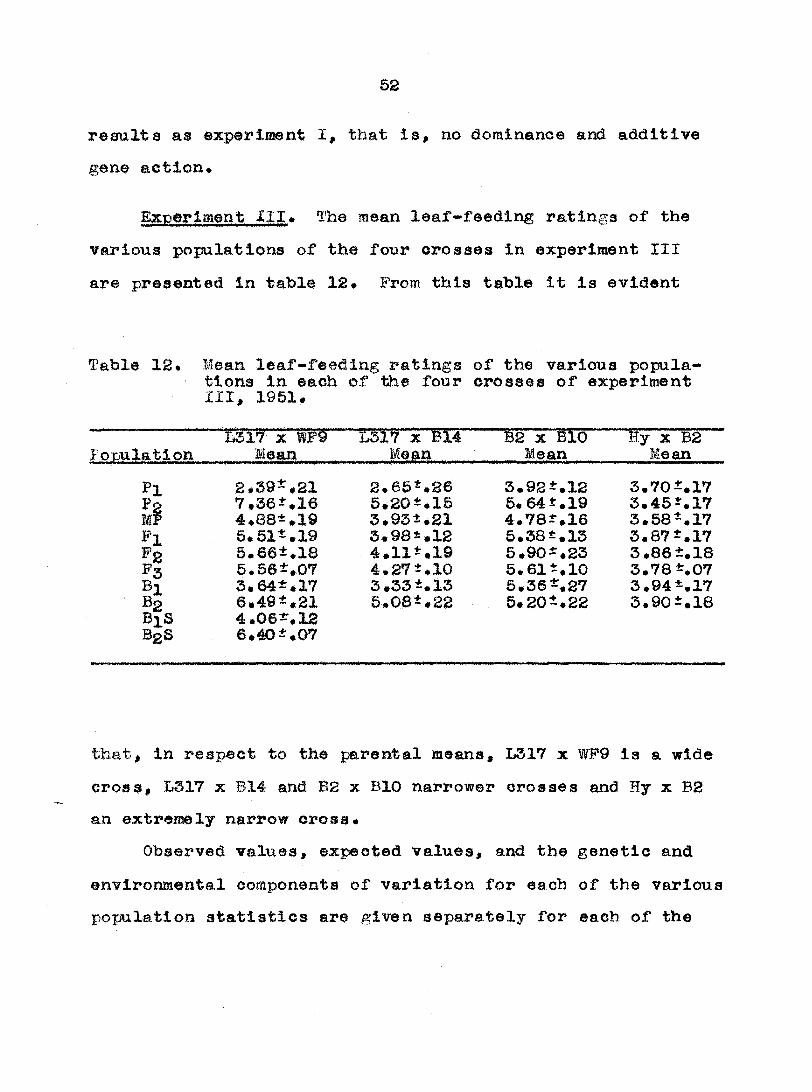
Experiment III* The mean leaf-feeding ratings of the
various populations of the four crosses in experiment III
are presented in table 12• jProm this table it Is evident
Table 12. Mean leaf-feeding ratings of the various populations in each of the four crosses of experiment III, 1951.
MII X 1F9 L317 X B14 B2 x BIO Hy x B2 Fomlation Mean Mean Mean Mean
Pi
MI Pi
FS Bl B2 BiS B2S
2»39i*21 7.36 *16 4*88i*l@ 5.61 .19 5.66i.l8 5»56t»07 3.64 .17 6,49i,21 4,06 .12 6 •40 .07
2.65 ,26 5»20-»18 3«93t.21 3# 98 *12 4.11**19 4*27ia0 3.33i.13 5.08 .22
3.92 .12 5.64 .19 4.782-.16 5.38 i.13 5.90 .23 5.61 .10 5.36 .27 5.20 .22
3,70 .17 3.45 .17 3.58".17 3. 87 i.17 3.86±.18 3.78 .07 3.94*.17 3.90i.l8
that, in respect to the parental means, L317 x WP9 is a wide
cross, L317 x B14 and B2 x BIO narrower crosses and Hy x B2
an extremely narrow cross.
Observed values, expected values, and the genetic and
environmental coinponenta of variation for each of the various
population statistics are given separately for each of the

55
four ci»03S@a In tables 15, 14, 15, and 16, Both an Inclu-
aiv© and ©xclusiv© set of components of variation were cal
culated and ©xpectatlon valuee for each of the population
atatlstica were obtained for all four crosses# The analysis
of linkage and residual interaction (table 14) showed no
significant variation attributable to linkage or interaction
in any of ttie four crosses. Thus the inclusive estimates
were considered the best estimates and were used as the ex
pected values# The inclusive estimates of the components of
variation, that is, D, H, and Eg, for each of the four
crosses are fsiven in table 18. The H component of L317 x WP9
is negative which is impossible, hat it is non-significant
because of its large standard error# In fact, the standard
errors of B in all four crosses are large, which means that
.the accuracy of estimating H is very low#
Th© values of most practical importance are those ob
tained for the percent additive genetic variation {% I>) and
percent total genetic variation (% D + H)# The additive
genetic variation (D) is the portion of the total mfriich is
the fixabl© heritable variation and is important because a
good estimate of D is the best measure of the effectiveness
that selection would have within a certain population.
When an unbiased estimate of D is not available then the
total genetic variation (D + H) may be used to estimate the
effectiveness of aelectlonj however this estimate is less

Table 15# Observed values, expected values, ana heritable non-heritable oom-ponents of variation of leaf-feeding resistanee of the various popila-tion statistics of the cross L317 x WP9, experiment III, 1951»
Coiaponents of variation Bnviromental
Observed v&laea Expected genetic Z Z Statistic Replicatioa Joint value D H 1 ^2
I II III value (Inol.) % % %
1.54 2.31 2.87 2.29 2.35-.11 42.lt 7.3 57.9 6.1
1.81 1.54 1.67 1.67 1.54i.21 79.3t15.8 20.7 9.0
.98 1.08 1.45 1.14 1.14 .16 100.0
1.96 1.81 1.94 1.90 1.86t.09 26.7 i 8.7 73.3 7.7
% + % 2.82 4.49 3.02 3.47 3.41t.24 20.1 11.3 79.9 8.4
'lis + *gis 1.79 2.00 1.37 1.72 1.78t»22 64.2 - 9.2 35.8 15.6
%x/BiS .72 1.05 .85 .87 .99±.17
o
8
HI
Bg/BgS
+ BgS 3.18 3.63 4.60 3.77 3.72t.l9 26.7 4.7 73.3-3.9
El 1.39 1.25 .84 1.16 1.36t.l4 100.0
Eg
CO
* .20
o
to . .33 .32t.l4 100.0

Table 14. Observed values, ©xpesteii values, and heritable and non-heritable components of variation of leaf-feeding raslstanet of th® various popila-tion statistics of cross L317 x B14, experiment III, 1951.
Components of variatlOK" Additiv® Total EnvirofaaQntal
Sta- Oba®rv®d values Expected genetic „ genetic « •fcistic Keplication Joint value D D "+• H «
I II III value (Incl.) i % i
Vpg ..76 1.59 1.26 1.21 1.76-.13 22.7 14.1 38.5 12.6 61.5-11.5
^3 .52 .85 1.36 .91 •84 25 47.1 29.2 55.3 29.0
%2A3 .36 .79 1.10 .76 • 54t.l8 74.2f46.0 100.0
VBx+'Bg 2.38 4.07 3.60 3.30 3.11 .23 12.B± 7.9 30.6 15.1 69.4tl3.2
^ 3 1.63 1.38 1.69 1.56 1.42 .13 14.0t 8.7 23.8i 7.8 76.2 14.2
El 1.14 1.33 .85 1.11 1.08 .20 100.0
Eg .31 .30 .33
to .
o
CM .
41
•
44.7±24.3
100.0

fabl© 15# Observed valaies, expected mimes, and heritable and non-heritable eon-ponents of variation of leaf-feeding resistance of the •s'arious population statistics of cross B2 x BIO experiment III, 1951#
— Compoaeata of variation Observed values Additive Total Invironiaental
Expected genetic genetic g Sta- Replioation Joint value D I) + H ^ 2 tistic I II III value (Incl.) ^ % % %
1.70 2.84 1.50 2.02 2.38-.16 17.8 12.5 23.3 11.2 76.7-10.2
% 1.55 1.68 .84 1.38 1.01-.30 42.1 29.6 45.4 29.4 54.6 24.5
Ipg/pg .70 .16 -.01 .36 •49±.22 86.54 60.8 O o .
o
5.24 4.90 3.38 4.58 4.35i.l6 9,8i 6.9 15.9 13.1 84.1 11.2
%5 1.72 2.21 1.71 1.89 2.11 .28 10.1i 7.1 13.2 6.4 86.8ni.5
El 1.82 2.03 2.01 1.95 1.83 .24 100.0
E2 .19 .14 .21 .18 •55 .25 100.0

Table 16. Observed ¥alues, ©xpeeted values, and heritable and non-heritable coai' ponents of variation of leaf-feeding realstanc® of the various popttla-tlon statistics of cross Hy x B2, experiment III, 1951,
Components of variationr
T 1 r T 1 Total Enviroimental . Observed values Expected genetic genetic ~~
Sta- Replication Joint value D D + H % % tistic I II m value (Incl.) % % % ^
43.8 30.3
VP2 2.10 2.37 1.72 2.06 1.83-.14 21.5 14.0 21.5 12.6 78.5 11.4
*P3 .92 .70 .77 .74 .70 .26 56.2 36.6 56.2 36.5
^PgAs • 21 .13 .25 .20 .39 .19 99.9i-65.1 100.0
4.13 3.62 1.99 3.20 3.27 .13 12,0t 7.8 i2an5.o 87.9 2.8
1.65 1.63 1.52 1.60 1.63-.24 12.0 + 7.8 12.1i 7.0
% 1.56 1.46 1.09 1.37 1.44 .21 100.0
^2 .27 .26 .27 .26 •31—^21
87.9 12.8
100.0

58
Table 17. Analysis ot linkage and residual interaction of leaf-feeding resistance of four crosses, experiment III, 1951#
Source of variation
L3lV x 'W9 L317 x Bi4 B2 x BIO Hy x B2 D,p. M.S. WTfI, ITsT. DTF; KST D.P. M,S,
Linkage Residual interaction
Error
3 .0530 2 .6069 2 .7067 2 .0702
3 .0511 1 .0986 1 .1993 1 .1934
20 .2127 14 • 1906 14 .2769 14 .2056
Table 18* Components of variation, number of effective factors, and selective limits of leaf-feeding resistance in four crosses, experiraent III, 1951.
L317 X WP9 L317 x B14 B2 X BIO Hy X B2
Comp# of variation
B 2 H -1 ll 1 Eg
No. of effective factors
K-I %
Selective limit
Parents means
Extreme P3 means
.497 .224 1.102 •362 .143 .319± .139
2
2
2 .30 2.49
• 66—7.10
.39-7.36
.90—7.62
.796 .494 1,109 1.215 1.080± .201 .377 .205
2.06 1.05
2.75—5.11
2.65—5.20
2.90 6•38
.849* .595
.529 1.465 1.828 .243 .551 .247
0.87 1.16
3.64—5.92
3.92 — 5.64
3.43 — 7.14
.787 .513
.001±1.262 1.436± .209 .306i .212
0.02 2.73
2.11 5.05
3.45—3.70
2.75 — 5.24
The value of D + IH was used Instead of D in calculating selective limits because of the high standard errors of D .and H.

59
efficient toeoataa© a portion of it is H #iich is not fixable.
I'h© % I) and % B + H and their standard errors were
calculated from the expected values of each of the various
population statistics for each croaa and are given in tables
13, 14, 15, and 16. In tb© cross L317 x WF9 -s^ere the value
obtained for H is negative only the total genetic variation
y P H) is available because the calculation of D would
reault in spurious values. This is because the least squares
estimates of D and H ar© negatively correlated and a negative
H results in a highly inflated value of D. Following the
same line of reasoning, non-aignlficant positive H values may
have re<fec©d the values of B in L317 x B14 and B2 x BIO, but
if this were true it would be less serious because this ten
dency would «ake ^ D a inore conservative estimate. The scal
ing testa for genlc addltivity (table 8) showed that there
were significant deviations from additiveness in L317 x WP9,
L317 X B14, and B2 x BIO meaning that the separation of the
D and H components in these crosses may have been subject
to some bias# When all the factors are taken into considera
tion it appears that for practical application, that is, for
making Inferences as to the possible effectiveness of selec
tion in the various populations of each of the crosses that
the total genetic variation {% D -t H) is the most appropriate
in the case of L317 x WB'9, L317 x B14, and B2 x BIO. In
Hy x B2 where H is zero D is equal to D + H.

60
When considering the genetic •variability i% D and % h
H) of th© various populations of the four crosses (tables
15, 14, 15, 16), it is evident that individual plant selec
tion for leaf»fe©ding resistance would be relatively inef
fective and that aelection would have to be carried to
progeny rows the following years# For example, consider
the $ D {or ^ D + H) In the relative to Vf or -v ^ o 1
¥Bg relative to If one considers the genetic
variation of the it la evident that individual plant
selection within Pg progeny rows would be very ineffective*
It la interesting to not© that In LSI? x WF9 the genetic
variation in Vg^ + is only about half of that in Vp^
but that in "^3^3+ ^'^2^ ©QT^al to that in It can
be inferred froai this that in a backcrossing program to
transfer resistance to a susceptible line that alternate
backcrossing and selflng would be more effective than stral^t
backcrossing because genetic variability wsuld be maintained
longer. There is considerably more genetic variation avail
able for selection in L317 x WP9 than in the other crosses,
and the genetic variation of fpg Is large enou^ SO that
effective selection might be carried Into another generation
by testing In F4 progeny rows. The cross Hy x B2 is inter
esting from th© standpoint that even though there was little
difference between their parental means, there is a fair
amount of genetic variationj apparently Hy and B2 have

61
different genea for resistance•
In tatol© 18 the estimates of and K2 Indicate that
at least 1 to 3 effective factors are segregating. It is
verj unlikely that this is an estimate of the number of
genes involved but probably chromosomal segments or even the
number of different chromosomea# Estimates of environmental
variance were high and this results in poor estimates of
both K2 and K2» It is Interesting to note the Kg value for
Hy X B2 where the difference between the parental means la
small. Apparently the number of "plus*' genes are balanced
between ttae two iribreds.
In the calculation of the selective limits (table 18)
D + was used instead of D because of the high errors In
volved in the separation of D and E» The selective limits
are not too Informative in regard to leaf-feeding resistance
because D and H were estimated with very large errors and the
estimate of K2 is poor when the environmental variations are
over 50^ of the total variation. However ij^en the selective
limits, parental means, and the extreme P5 means obtained
are compared, it is interesting to note that the extreme P3
means do not usually approach the selective limits in re
sistance, but usually exceed the limits in susceptibility.
It la difficult to estimate accurately "ttie type of gene
action l^'^Oj^Yed in leaf-feeding resistance. The analysis
of tfae parental and Fi means by the method of constant parent

62
regression indicated additive gene action and no dominance.
Prom the analysis of aegregation above, D was larger than H
but the relative importance of H to D was not clear# With
the hlgji. standard errors of H, the estimates of average
genie additivitj showed some significant deviations from
additiveneas. ^Mhen all these facta are taken into considera
tion, it ia evident that the greater part of the genetic
variability ia due to additive genetic effecta and a araall
part to either dominance deviations or ©piatatic interac
tions# The failure of the analysis to detect linkage doea
not preclude the abaence of linkage. The teat for linkage
ia a very insensitive one and will not detect tight link
ages. In fact the large mean squares for linkage for L317 x
B14 and B2 x BIO (table 17), althouf^ not aignificant at the
•usual levels of probability, should be considered with
auspicion.
Damage-point counts^
Ebcperiment I# The Px, P2# and P2 population meana
and the percent heritable variation of the P2 for the attri
bute damage-point counts ia presented for each of the 36
crosaes of experiment I in table 19. The percent heritable
^Data on damage-point counta were tranaformed according to Beall's transformation for purposes of analyaia and all data presented are tranaformed valuea.
dominance The scaling teats for

63
Table 19« Population maans and heritable variation of P2'a and damag©»point counts of the 36 dlallel crosses of 9 inbred lines, experiment I, 1950,
Pomlation meana Variation
L517 X 187-2 1.06 1*21 1*62 1.64 .272 .351 22.6 L317 X Hy 1 *42 1*68 1.26 1.34 .262 *305 14.1 L317 X WF9 1,21 1.64 1.43 1.79 .372 *353 -5.4 L317 X Bg 1.19 1.26 1.26 1.19 .243 .226 -7.5 L517 X 58-11, 1»19 1.18 1*62 1.48 .236 .332 28.8
L317 X B14 0,89 1.34 1.55 1.63 .237 .351 32.5 L317 X B7 0,94 1.60 1.47 1 * 46 *332 .375 11.6 L517 X BIO 1.29 1.85 1.46 1*47 *266 .390 31*9 187-2 X H j 0,95 1,04 1.79 1*54 *201 .296 32.1 187-2 X WF9 0.68 1.42 1.53 1.59 .232 .338 31.5
187-2 X B2 1.15 1.08 1*40 1.19 .279 .260 -7.3 187-2 X 38-11 0*94 1.19 1.17 1.20 .253 .267 5.4 187-2 X B7 0*87 1.79 1.27 1.28 .189 .341 44 . 6 187-2 X B14 0.97 1.48 1.85 1.84 .262 .294 10.9 187-S X BIO 0.83 1*70 2.10 1.32 .284 *419 32.2
Hj X W9 1.39 1.96 1.89 1.73 .279 *207 -34.8 Bj X B2 0.97 0.98 1.30 1.52 .157 .290 45.9 Hy X 38-11 1.28 1*68 1.16 1.65 .204 .167 -22.2 Hy X B7 1,12 1.53 1.57 1.53 .358 .250 -43.2 Hy X B14 0.9S 1.11 1.56 1.37 .253 .179 —41.3
Hy X BIO 1.16 2.11 1.90 1.57 .185 .285 35.0 WP9 X BE 1,71 0.95 1.93 1.65 .211 .301 29.9 1F9 X 38-U 1.46 1.36 1.94 1.88 .461 .560 17 .3 WF'9 X B7 1.79 1.49 1*63 1.81 .175 .231 24.2 WF9 X B14 1.64 1.26 2.03 1.93 .294 .372 21.0
WF9 X BIO 1.78 1.99 2.11 2.17 .253 .340 25.8 B2 X 38-11 0.91 1.49 1.38 1.43 .226 .313 27.7 B2 X B7 1.21 1.31 0.97 1.45 .203 .345 41.1 B2 X B14 1.05 1.16 1.51 1.65 .244 .268 8.9 B2 X BIO 1.03 1.90 1.35 1.52 .259 .285 9.1
38-11 X B7 1.34 1.61 1.62 1.56 .283 .320 11.5 38-11 X B14 1.30 .1.56 1*37 1.73 .427 .394 -8.4 38-11 X BIO 1.21 1*90 1.72 1.78 *252 .345 25.1 B14 X B7 1.09 1.39 1*17 1.71 .275 .304 9.4 B7 X BIO 1.36 1.99 1.85 1.53 .281 .379 25.7 B14 X BIO 1.64 2*11 2.21 1.99 .165 .251 34.5

64
vai»latlon of the ¥pg was calculated by using the within plot
varianoea of the Px# Pg# and aa an estimate of the of
Vpg# The transformation used (Beall*s transformation) on
damage-point counts had atahiliaed the environmental variance
30 that the combined within plot variance of the parents and
was applicable in ©atlmating the component. The per
cent heritable variation ranged from -45.2 to 45.9. The
negative values are, of course, impossible and at the most
are onlj a poor ©atimate of ssero. However with the same line
of reasoning positive values of the same size may not be
significant either* The design of the experiment did not
permit the calculation of standard errors but apparently the
error variation is very high. The most that can be said
about damage-point counts in this experiment is that the
environmental variances probably account for most of the
variation obtained#
Experiment II* The analysis of constant parent regres
sion of the parental and means of damage point counts of
experiment II is presented in table 20. The comparison of
V the parental means and their c.p.r.^s Indicates a decreasing
trend (bg a -1.1404) and thus positive dominance. According
to Griffing (8), where the second-order regression coef
ficient (bg) is large, at least one c.p.r. is negative, and
the hp values are very large there is an Indication of over-
dominance. Four out of seven of the deviations from
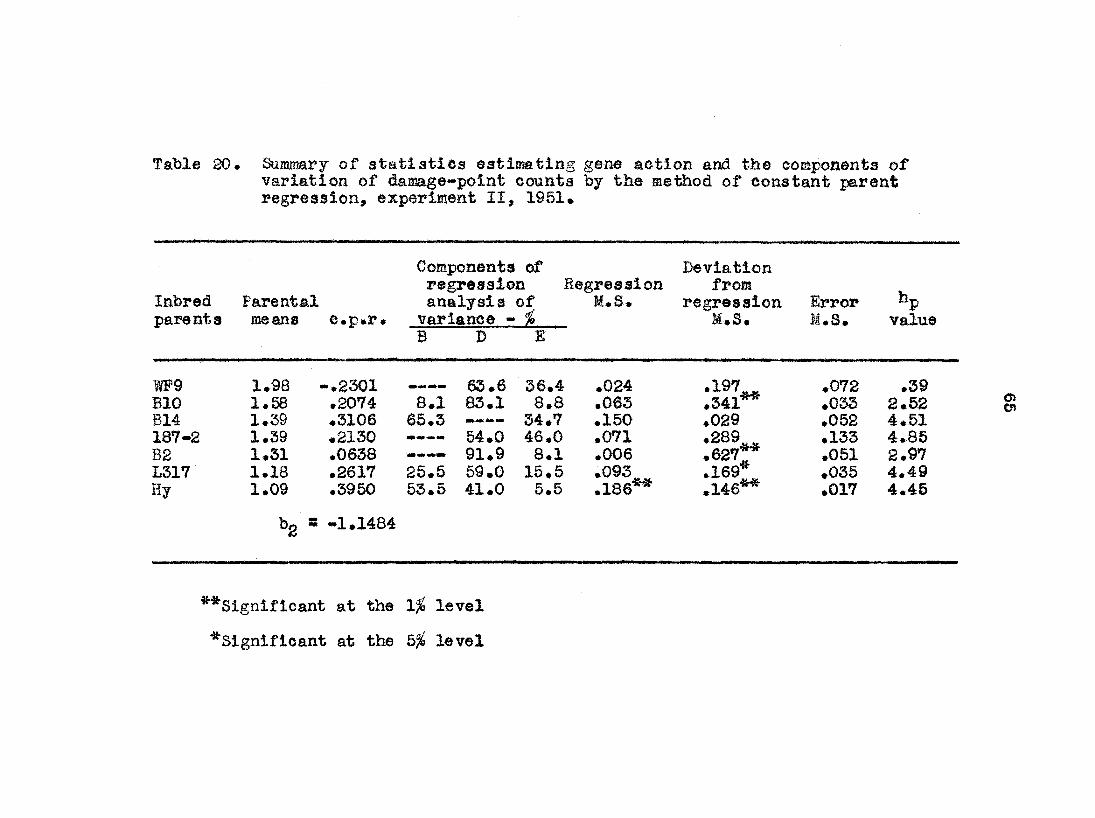
Table 20, &imimry of statistics eatiisating gene action anfl the components of variation of damge-point counts by the method of constant rent regression, experiment II, 1951,
Components of Deviation regression legresaioa from
Inbred Parental analysis of M.S» regression Irror parents means e.p.r# variance « % M»S# M«S# value
B D 1
1P9 1 98 -.2301 63.6 36.4 .024 .341
.072 .39 BIO 1 58 .2074 8.1 83.1 8.8 .063 .341 .033 2.52 B14 1 39 •3106 65.3 rn-mf-mmmm 34.7 .150 .029 .052 4.51 187-2 1 39 .2130 54.0 46.0 .071
,627 .133 4.85
B2 1 31 .0638 91.9 8.1 .006 ,627 .051 2.97 m? 1 18 .2617 26.5 59.0 15.5
.186 .169 .035 4.49
Hy 1 09 .3950 53.5 41.0 5.5 .186 .146 .017 4.45
bg » -1.1484
•^"^Significant at the 1^ level
^Significant at the 5% level

66
regression mean squares are significant and the components
of D are all fairly large, both, facts Indicating dominance#
Experiment 1IX» Th© mean damage-point counts of the
various populations of each of the four crosses of e^sperlment
III are presented in table 21• It is interesting to note
Table 21* Mean damage-point counts of the various populations in each of the four crosses of experiment III, 1951.«'
Population L317 X WF9
Mean L317 X B14
Mean B2 X BIO Mean
Hy X B2 Mean
I'l 1 #26^^.09 1#26^#13 l#05i#06 l#03-.06 ^2 1#82^ #09 1#40±.05 l#41t#10 1#03 .05 MP l*54t»09 l#33i»10 l,23-t.08 1#03±#06 Pi l#85t#04 1#894#11 1.41 #07 1.23±#09 Pg 1.93i#06 i#7it#oe 1.61±#06 1.19ir.07 P3 l#72i#10 l#47i»05 l#65i.03 1#19±.02 Bl 1.50±.08 1#39±.08 1.39*.06 1#26±.08 Bg 1.98±#07 1#85^#10 1#54 .06 1.17±.07 BIS 1#45±*05 B2S l*86i»05
%eans of transformed values (Beall's transformation)
that th© F^'s and the succeeding generations all have larger
means tfcan either parent# fh© number of damage points is
closely related to the number of surviving borers per plantj
apparently ttie means of the parental lrA>r©ds are smaller
because Inbreds ar© smaller plants#
The observed values, expected values, and heritable and

67
non-lierltable components of variation of damage-point counts
of the various population atatistlca of the four croaaes in
experiment III ar® presented in tables 22, 23, 24 and 25»
An inclusive and ©xclusiv© set of coaponenta of variation
were calculated by th© ua© of the same matrix tables as
were used for leaf-feeding ratings, and both an inclusive and
excluaiv© a®t of expected values were obtained for each of
the various population atatlatlcs in each cross. The analy
sis of linkage (table 26) showed no significant linkage In
any of the four crosses! therefore the inclusive set of ex
pected values was used as the best estimate of each of the
various population statistics. The inclusive estimates of
ttia components of variation, that is, D, H, Ex, and E2 are
presented for each of the four crosses in table 27.
The values for percent total genetic variation (% D +
H), Including their standard errors, were calculated for the
various population statistics in each of the crosses* It
is evident from tables 22, 2S, 24, and 25 that the environ
mental variation accounts for most of the variation and
there la very little genetic variation. Negative values
were obtained in several cases but were non-significant
becsuse of their large standard errors.
On the basis of the genetic variation available selec
tion for corn borer resistance on the criterion of the num
ber of damage points would be useless on an individual plant

Table 22# Observed values, expected values, and heritable and non-heritable components of variation of damage-point counts of tiie various popilation statistics of cross LSI*? x WP9, experifnent III, 1951,
Statistic Observed values
Joint Replication II Til value
Expected value
(Incl.)
CoMponeats of variation fot^ Environmental genetic r r— D -*• H ®1 %
%5 .191 262 •514 .260 •848-.013 10«6i 7.7 89,4-t6.5
^3 ,145 .178 •117 .146 .149i»024 so.ens.e 49.4 0
"PgAs • .007 •025 .050 .027 .059 .018 100,0
to |t
>
.247 .251 .247 .241 •255 .010 5.6± 4.5 94.4t6.8
¥BI + Vgg •464 .313 .,402 .392 .404 .027 -9.9 10.9 109.7 7.9
+ B2S .225 .276 .149 .217 .207±.0g5 28.6i 8.7 71.4tl5
%3 /BIS + .026i.019
%3 /BIS + -.041 .069 .145 .051 .026i.019 100.0
%2/BgS
%lS + %2S .454 .449 .507 .467 .470 .021 5.6 4.0 94.4t6.8
El .190 .252 .279 .255 .222±.016 100.0
^2 .072 .067 .051 .057 .074i.016 100*0

fable 23» Otoser^ed values, expected values, heritable and non-heritable OOM' ponents of variation of damage-point counts of the various popilation atatisties of oross L317 x B14, experii nt III, 1951#
Coatjonenta of variation
Observed values Expeeted Total Environmental
Statistic ReDllcation I II III
Joint value
vaMe (Incl.)
D + 1 %
^1 %
*F3 •317 •318 .134 •255 .244-.019 8.7 3.1 91.1*11.9
TFj .081 .131 .112 .108 .107±.035 7.1 32.7
"PsAs -•002 .010 .015 .006 •012i.025 100.0
.392 .485 .574 .484 .485 .033 8.1-13.8 91.9±12.0
% .219 .206 .238 .221 .233±.018 4.6- 6.9 95.4±12.4
El .165 .223 .282 .224 .223i.029 100.0
Eg .043 .107 .145 .098 •099t.029
92*9 =27.1
100,0

Table 24# Observed values, ejected values, and heritable and non-heritabl© COBI* ponents of variation of dafflage-point oouQts of the various population statistics of cross B2 x BlO, ©xperiment III, 1951*
Comt)onents of variation io'tai EnviroiMental
Ob served valuQS Ixpected genetic r -r Statistic Replication Joint value D + M ^
I XI III va3n® Clncl«) ^^^
?pg .554 ,426 .259 .340 .288-.016 10.8 9.7 89.2 8.7
.164 .144 .093 .134 .123 .031 48.8±25.2 51.2 20.3
.093 -.027.-.021 .018 .050 .023 100.0
¥Bi+ Bg .438 .560 .489 .494 .506 .029 -1.6 11.7 101.4 10.1
Vp^ .250 .211 .231 .232 .272^.016 5.7± 5.1 94.3^9.2
El .293 .235 .274 .268 .257±.025 100.0
E2 .058 .022 .062 .051 .063±.026 100.0

Table 25» Observed values, expected values, and heritable and non-heritable oom-ponents of variation of damage polnt-cownts of the various popilation statistics of eross Hy x B2, experiaient III, 1951«
Statistic Observed values
ReDlication Joint I II III value
Expected value
(Incl.)
.208 .170 .172 •184 .185~.009
.054 .043 .076 .058 .052 .017
"FgAs -.036 .003 .011 -.007 .003 .012
'B2 .430 .378 .294 .364 .364-.016
.191 .193 .206 .197 .1B6± 009
El .184 .154 .197 .178 .1861.014
Eg .045 .038 .040 .042 .048t.014
Component3 of variation Total InviroEfflttental
D + H % % % % ^
100.0
91.5 28.8
100.0

72
Table 26# Analysis of linkage and residual interaction of damage-point counts of four crosses, experiment III, 1951.
Source of LS17 x 1P9 L317 x B14 B2 x BIO Hy x B2
variation D*P, MtS# M.S. D.F. M.S. D.P. M.S.
Linkage 3 .0016 2 .0002 2 .0057 2 .0001
'InTollctlon = -OOie ^ ^ ^
Error 20 .0027 14 .0038 14 .0029 14 .0009
Table 27. Components of variation of damage-point cmnta in four crosaes, experiment III, 1951.
Components of L317 X WP9 L317 x B14 B2 X BIO Hy x B2
variation
D .184-.056 .006 .070 .139 .061 .012*.035
H -.263 .125 .072t.l72 -.153 .150 -.027 .085
El .222 .016 .223i.029 .257 .025 .186 .015
Eg .0741.016 .099±.029 .063 .025 .048t.015

75
basis# There are Indications that some selection may be
possible in partieular croaaea L517 x WF9) on a plot
basis? of course, effectiveness of selection would be very
low#
Effect of miRratlon oa meaaurinis resiatanoe
Experiment I¥ was set up to measure the effect of migra
tion on leaf-feeding ratings and damage-point counts# The
suppoaition of the experiment was that borers whidb. survived
on susceptible plants would migrate to resistant plants and
thereby increase the mean of the resistant line# Because
migration is irregular the variance of the resistant line
would also be expected to increase#
Th© means and variances of leaf-feeding ratings taken
at two different times and the means and varisnces of damage-
point counts of the resistant and susceptible hybrids, when
grown in different aaaociations with respect to each other,
are presented in table 28# The means and variances of the
resistant aiad aisceptible hybrids of the bordered plots (no
association) serve as checks to which the other means and
variances can b© compared# The analysis of variance of the
means and analysis of variance of the variances of leaf-
feeding ratings showed no significant differences which
mi^t be accounted for by migration# The analysis of vari
ances of the means of damage-point counts showed a

74
Table 28• The meana and variances of leaf-feeding ratings and damage-point counts of a resistant and susceptible hybrid when grown in different associations in relation to each other, experiment IV, 1951 •
Leaf-feeding; ratings Damage-point Treatment lat rating"^ 2nd rating counts''^
Means ¥ar* Means ¥ar# Means Var»
Resistant hybrid Bordered plots Adjacent plots Within aam© plots
Susceptible hybrid Bordered plot® Adjacent plots Within sam© plots
3*07 1*23 3«18 5.31 1.47 3.85
3.04 1.39 3.60
6.89 .76 6.87 7.31 1.08 7.35
7.25 .99 7.04
1.16 1.21 .1832 1.03 1.28 .2264
1.65 1.44 .3016
1.00 2.05 .2058 .70 1.93 .1508
.68 1.72 .3404
' • Means and variances of the transformed values {Beall*s tranaforiaation)
" Ist rating taken 2 weeks after, and the 2nd rating taken 3 weeks after artificial infestation with eggs
significant hybrid x association interaction. The means of
the resistant hybrid increased in relation to closeness of
aaaociation while the means of the susceptible hybrid de
creased (see table 28). This change can be attributable to
the migration of the borers from the susceptible hybrid to
the resistant hybrid. Accordingly, there is some effect of
migration between plots md considerably more between plants

75
within a plot* This will tend to average out differences
between planta and Increase the environmental variance of
damage-point counts* The variances of damage^point counta
appeared to be stabilized apparently because of the conta
gious distribution transformation (Beall'a transformation)
that waa used*
At the time of the second leaf-feeding rating the mean
and variance (3.60 and 1»65, respectively) of the resistant
hybrid in the within-plot treatment were very high. The
effects of migration were apparently taking place within
three weeks after infestation, but ttese effects were too
small to be significantly measured. However, if these ef
fects are real, about two to three weeks after Infestation
would be the preferred time for taking leaf-feeding ratings.
Relation of leaf-feeding ratings to number and size of borers
The plants of experiment ¥ were dissected and 645 borers
were obtained from 303 plants. The distribution of ttxe
plants according to the leaf-feeding rating and number of
borers per plant is presented in table 29. It is evident
from this table that as the leaf-feeding ratings increase
the probability of more borers per plant also increases. The
test for independence gave the probability of less than
.001 that this relationship was not significant.
The distribution of the borers according to the leaf-

76
Table 29# Th© distribution of plants according to their leaf-feeding ratings and imrabor of borers per plant of four inbr©ds and their F'x hybrids, experiment V, 1951.
Ij@af-feeding ratings 0 1
Mumber of
2 3
borers 4 5
per 6 plant 7 8 9 10 Totals
1 6 5 9 2 8 6 1 4 19 5 11 17 10 2 1 41 4 12 16 17 4 Z 1 52 5 3 9 10 12 10 5 1 50 6 2 13 22 10 6 4 1 1 59 7 5 5 16 14 13 1 2 56 8 4 2 2 2 5 1 16 9 1 1
Totals 47 69 81 46 54 13 6 5 1 1 303
X (30 d,f.) " 243»70 Probability = <.001
feeding rating of th® plant from which they were obtained and
accordiiig to the size or stag© of development of the borer
is given in table 30* As the leaf-feeding rating increases
the probability of larger or more mature borers increases#
This relationship was significant; the X® test gave a pro
bability of non-lndependenc® of less ttian .OgS#
The mean leaf-feeding rating and the average nuntoer of
borers per plant of the fotir inbreds and Fi*s are presented
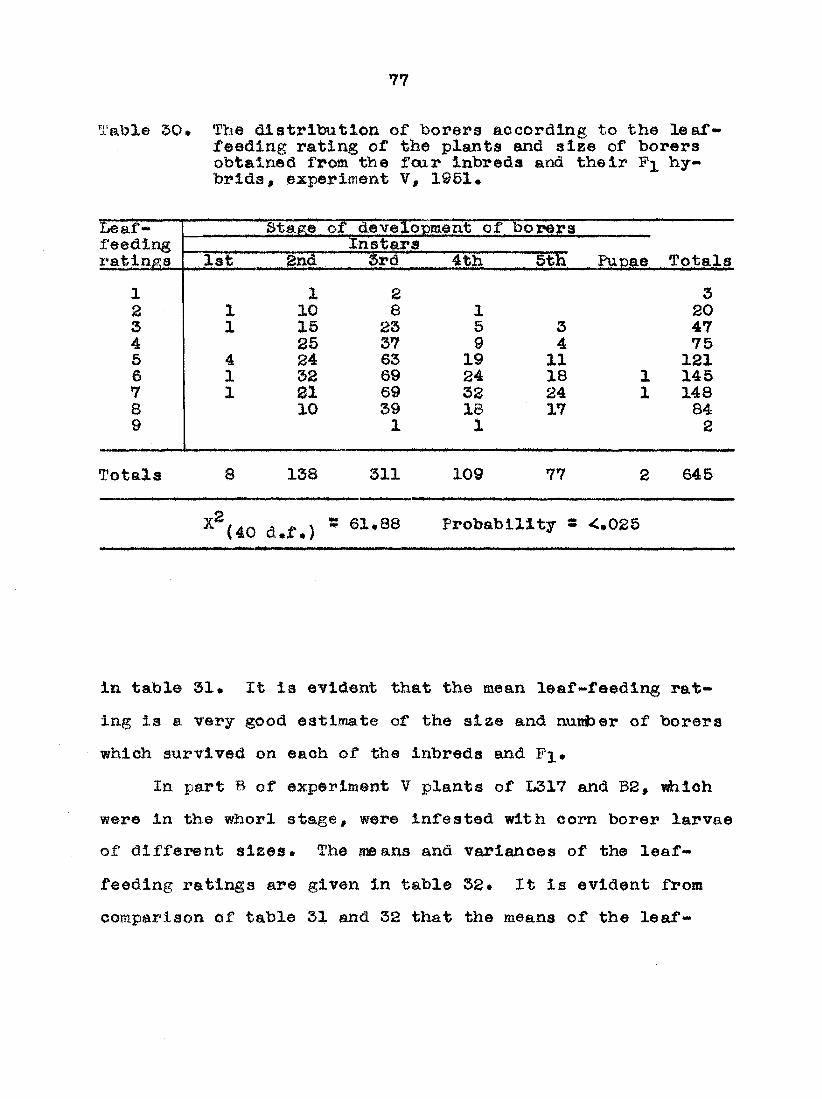
77
Talkie 50* Th® distribution of borers according to the leaf-feeding rating of th© plants and size of borers obtained from the four inbreds and their hybrids, experiment 1951.
Leaf— feeding ratin^^s
Stage of deveioment of bo rera
Totals
Leaf— feeding ratin^^s
Instars Pupae Totals
Leaf— feeding ratin^^s 1st 2nd 3rd 4th tli Pupae Totals
1 1 2 3 2 1 10 8 1 20 3 1 15 23 5 3 47 4 25 37 9 4 75 5 4 24 63 19 11 121 6 1 32 69 24 18 1 145 7 1 21 69 32 24 1 148 8 10 39 18 17 84 9 1 1 2
Totals 8 138 311 109 77 2 645
^ (40 d.f,) ~ Probability = <,025
in table 51• It is evident that the mean leaf-feeding rat
ing is a very good estimate of the size and nuniaer of borers
which survived on each of the inbreds and Px«
In part B of experiment ¥ plants of Ii317 and B8, #iloh
were in the whorl stage, were infested with corn borer larvae
of different sizes# Th© means and variances of the leaf-
feeding ratings are given in table 3S» It la evident from
comparison of table 31 and 32 that the means of the leaf-

78
Table 31 • Mean leaf-feeding rating, nasiber of borera per plant and the alz© of the borers of the four in-breds and their Pj. hybrids, experiment V, 1951*
Inbreds and Fi»a
feeding rating Mean
' io. borers per plant
Size of borers Inbreds and Fi»a
feeding rating Mean
' io. borers per plant ist
Instars 2nd 3rd 4 th 5th Pupae
L317 2*30 1.00 2 11 11 4 2 B2 3.90 1.30 14 22 2 1 B14 5.S7 1.65 5 20 14 9 1 WP9 6.93 3.43 7 55 17 23 1 L317 X B2 3.40 1.03 13 16 2 L317 X B14 4»50 2.27 2 20 29 10 7 L317 X WF9 5.30 3.10 23 43 17 10 B2 X B14 5.40 1.83 3 19 24 7 2 B2 X WP9 6*20 2.50 19 39 11 6 B14 X WF9 6*50 3.67 1 20 50 22 17
Table 32. The means and irarlancea of the leaf-feeding ratings on two inbreds infested with corn borer larvae while in the whorl stage, part B, experiment ¥, 1951*
Leaf-feeding Infestation ratings treatment Means Variance
L317 2nd and 3rd instar larvae 4.29 .512 4th and 5th inatar larvae 4#93 .762
B2 2nd and 3rd instar larvae 6.32 .679 4th and 5th Instar larvae 5»96 .726

79
feeding ratings of L517 and B2 wer© considerably increased
when infested Mth large larvae in comparison to infestation
with ©ggs» It can ba inferred from this experiment that
leaf-feeding resistance is concerned mainly with the sur
vival and development of early Instar larvae. Vtoen borers
that survive on susceptible plants migrate to resistant
plants, as is possible for example in P2 populations, the
measure of resistance may be confounded#
Relationship of leaf inorphology and resistance
Iftien corn plants are in the whorl stage, the survival
of newly hatched larvae la completely dependent upon their
first feeding in the moist section of the leaf whorl* It
was observed with hand lenses in the field and verified
under a microscope that the first feeding, with practically
no exception, was always from the upper (ventral) aide of
the leaf regardless if the plant were resistant or suscep
tible# On the basis of this observation further studies
were carried on with leaves of resistant L317 and. suscep
tible WF9.
There were three main differences observed between the
morphology of the leaves of L317 and ?^P9« First was in the
number and kind of leaf hairs# The hairs on L317 were more
dense and the basal cells from which the hairs arose in L317
were much sturdier# Secondly, the two inbreds differed
80
considerably in th® type of bulliform cells. The band of
bulllform cells in L317 Is very narrow compared to a rather
wide band in ttP9« The third difference was In the number
of secondary bundles per area. On iiie same width of leaf
that ¥(fF9 had 10 secondary bundles, L317 had about 13 to 14
secondary bundles#
Whether or not any of the differences noted are actually
related to corn borer resistance whould have to be investi
gated in a special experiment# Such an experiment should in
clude tJie evaluation of a whole series of lines and the
simultaneous study of leaf morphology and resistance in
segregating populations. It is highly probable that at
least part of the leaf-feeding resistance could be accounted
for by the morphology of the leaf*
Diplodia Stalk-Rot Resistanc©^
Dlplodia stalk-rot resistance was studied in both years
of this investigation Ixit data are presented only for experi
ments II end XII in 1951. Approximately 50^ of the plants
died prematurely in ©xperlment I in 1950} and because of
the poaslblllties of biases the data were not analyzed.
^Data on Dlplodia stalk rot were transformed according to the 10i transformation for purposes of analysis and all data presented are transformed values•

81
Premature dying in 1951 was of the order of 10 to 15^ and
was assumed to b© of little cona©q\i©nce to th© final results
obtained
Experiment II
A constant parent r©gr©saion analysis of the parental
and meana of Diplodia stalk rot ratings of experiment II
is presented in table 33# Th© hi^ly signlficsmt regression
mean squares, the high percentage values of B, and the ab
sences of any trend in the comparisons of the c.p.r. coef
ficients with th© constant parent values (bg - -0.06)are
all indicative of additive gene action* However with most
of th© hp values large, 5 deviations from regression mean
squares significant, and a negative b2 it is probable that
some positive dominance exists#
Experiment III
The mean stalk-rot rating of the various populations
of the four crosses of experlB^nt III are presented in
table 34# In respect to the parental means, Hy x B2 is tiie
wide cross, LSI? x WP9 a narrow cross, and the other two are
Intermediate #
Observed values, expected values, and the genetic and
environmental components of variation for each of the various
population statistics of th© four crosses are presented in

fable 33» &iimary of atatistles ©atimatlng gene action and tiae components of variation of Diplopia stalk-rot resistance by the constant parent regression method, experiment II, 1951»
Inbrefi parents
Parental means © ((P.r #
Comp# of regression analysis of variance - %
B D 1 Recession
M.S.
Deviations from
regression M.S.
Error M.S.
hp value
B2 13.4 .9002 94.9 5,1 29.18 •94 1.49 —0 .33
B14 15^6 .8019 85.4 11.3 3.3 49.56 8.16* 1.87 .99
fm 16.9 •7933 96*5 3.3 0*2 53.87 1.98 .11 2.53
BIO 17 *4 .8236 92*6 4.9 2.5 58.18* 4.53 1.55 1.62
Hy 18.0 .6245 88.5 8.5 3.2 32.78" 4.21 1.15 1,57
187-2 19.5 .3600 68.3 24.8 6.9 8,82 3.72*
03 CO . 1.63
L317 19.7 .7223 90.5 6.9 2.6 33.79 3.45* .94 1.06
b2 » -0»0591
^Significant at the 1% level
^Significant at the b% level

83
Table 34. Mean Dlplodia stalk-rot rating of the various populations in each of the four crosses of experiment III, 1951
Population L317 X WF9 L317 X B14 B2 X BIO Hy X B2
Pi 20*20±.24 20.86 .29 13.52 .25 20.27±.23 ^2 17.08±.31 15.90 .28 19.15±.20 13.51£.25 MP 18.64*.28 18.38±.28 16.34±.22 16.89i.24 n 19.28*.69 17.75i.52 16.46±.29 16.98±.25 P2 18.64 .28 19.041.42 16.05—.24 17.12±.28 F3 19«02^#1& 18.31 ,14 17.02±.15 19.76i.10 Bl 19.40±.30 20.72±.39 14.60±.20 19.57 ±.20 B2 17.05±,44 17.26t.29 17.52t.28 15,16t,28 BiS 19.29±.20 BgS 17.92= .23
"Cleans of transformed values (10 Vx + i- transformation uaed)
table 35, 36, 37, and 38# An inclusive and exclusive set
of components of variation were calcialated by the use of the
same matrix tables as wepe uaed for each cross in the case
of leaf-feeding ratings and damage-point counts* Inclusive
and exclusive seta of expected values were obtained and an
analysis of linkage and r©3id?j.al interaction (table 39) in
dicated that the inclusive set of expected values were the
best estimates. Tha inclusive estimates of the components
of variation, D, H, each of the four crosses
are presented in table 40. The standard errors of H, and

fable 5-5t Observed values, expected valtiea, and heritable and non-heritable components of variation of Diplodia stalk-rot resistance of the trarioms population statistics of cross L517 x fP9, experiment III, 19S1#
Obaerved valuea Total
Components of variation"
Statistic Replication Joint value D H ^1 I II III value (Incl.) % % 8.59 3.77 7.96 7.05 6.67-.45 31.6*10.4 68.4t 8.6
4.00 4.43 4.52 4.32 4.03-.85 55.5±24.3
"PgAs 2.09 1,99 3.63 3.17 2.35 .66 100.0
6.69 6.44 7.97 6,95 5.62 .38 18.7- 6.2 81.3 10.2
%1+ %2 11.19 13.09
.
•
CO
10.97 10.75t.95 15.1 4.6 84.9±10.7
5.07 9.64 5.04 6.58 6.32 .88 37.2t10.41
%l/BiS + -1.36 .13 4.42 1.01 2.1li.69
%lS + 11.25 9.45 10.43 10.40 ll.24t.76 18.7± 6.2 81.3 10.2
ll 3.64 3.52 5.33 4.07 4.57±.57 100.0
Eg 1.58 3.59 .47 1.88 1.98 .56
Environmental
44.5-IS*8
62 .8 17.5
100.0

fable 56. Observed mlues, expected valties, and heritable and non-heritable components of Tariation of Dlplodia stalk-rot resistance of th© -srarloua popalation statistica of cross IJ317 X B14, ©xperisient III, 1951*
CoflipoGents of variation" Qbaer¥®d yalues Expected Additive Total
Sta- Replication Joint valu© ^©n©tie genetic gnviroDBieQtal tiatic "T m value (Incl.) D D + H % %
% % % %
¥pg 3»01 7»36 7,8§ 5^95 6,57.59 19,8^16.7 52.8^15.1 47.8^13*6
fpg 2.70 4»47 4*42 3.91 5.56^1.10 36.5^30.8 51.5^30.7 48.5^25*6
.79 3.26 .93 2.09 2.37 .80 55.0 46.2 100.0
¥Bi-t B2 10.79 16.61 10.01 12.19 11.83±1.03 11.0 + 9.3 47.0 17.7 53.0 15.1
Vpg 3.98 6.24 5.22 5.22 4.85^ .57 13.4^^11.3 35.3^10.2 64.7il8.5
El 1.53 2.68 4.06 2.66 3.14 ±.90 100.0
E2 1.54 . 65 1.95 1.38 1.73 i .91 100.0
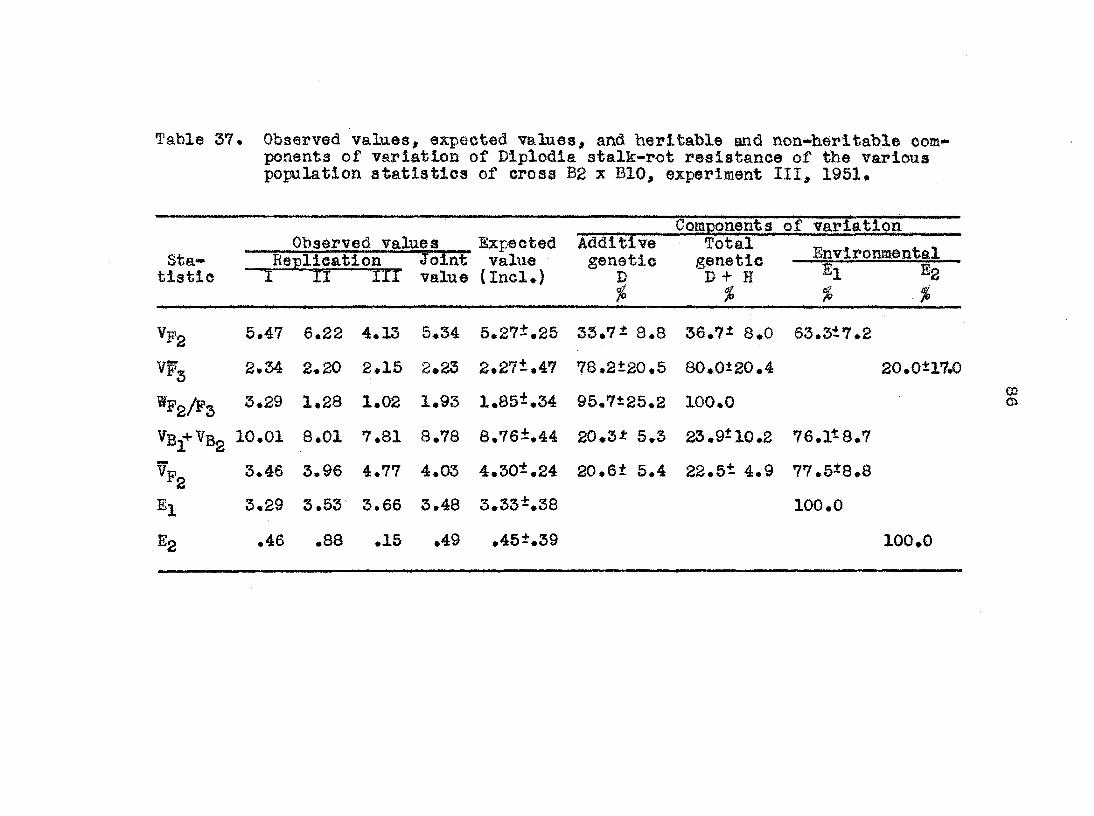
Table 37• Observed values, expected vaMes, and heritable and non-heritable com' ponents of variation of Mplodia stalk-rot resistance of the various popilation statistics of cross B2 x BIO, experiment III, 1951•
Components of variation Observed values Expected Additive Total p 4 i. t
Sta- Replication Joint value genetic genetic —environmental tlstlc "I ii IIT value (Inol.) D D + H ®2
% % % %
5,47 6.22 4.13 5.34 5.27±.25 33.7i 8.8 36.7i 8.0 63.3t7.2
VPg 2.34 2.20 2*15 2.23 2.27±,47 78.2±20.5 80.0 20.4
3.29 1,28 1.02 1.93 1.85 .34 95.7±25.2 100.0
10.01 8.01 7.81 8.78 8.76±.44 20.St 5.3 23.9 10.2 76.1 8.7
CO 3.46 3.96 4.77 4.03 4.30 .24 20.61 5.4 22.5t 4.9 77.5 8.8
El 3.29 3.53 3.66 3.48 3.33 .38 100.0
Eg .46 . CD CD .15 .49 .45±.39
20.0tl7<0
100,0

Table 38. Observed values, expected values, and heritable and noa-heritabl© eom' ponents of variation of Dlplodla stalk-rot resistance of the various population statistics of cross Hy x B2, experiment III, 1951.
Components of variation Observed value a Ib:pected Additive Total ari
sta- Replication Joint value genetic genetl© ^— tiatlc I II III value (Incl.) D D + B ®1 %
• % i i
'Pa 4.09 6.25 4»97 5*10 5.37 .37 26.9il2.8 31.9 11.5 68 .It 10 .4
% 2.14 2.25 2.66 2.35 2.17±.69 66.6 31.6 69.6±31.4 30.4±26.2
Wpg/pg 1.73 .81 1.81 1.38 1.58 .30 91.6*43.4 100.0
VBi-VBg 10.51 6.30 11.21 9.35 9.29±.64 15.6i 7.4 21.3-14.1 78.7i12.1
3.91 6.03 4.91 4.95 4.51i.36 16.0 ±7.6 19.0i 6.9 81.0tl2.4
El 3.42 2.59 4.06 3.35 3.66i.56 100.0
Ig .54 .33 .58 .48 .66t.57 100.0

88
Table 39* Analysis of linkage and residual interaction of Dlplodia stalk-rot resistance in four crosses, experiment III, 1951#
Source of
variation
L317 X WP9 L317 X B14 B2 X BIO Hy X B2 Source of
variation
Linkage Residual interaction
Error
3 3
20
2.523 1.686
3.418
2 1
14
1*685 1.416
3.770
2 1
14
.1778 •3362
• 6805
2 1
14
• 4781 • 3366
1^4719
Table 40# Components of variation, rmmber of effective fac» tors, and selective limits of Dlplodia stalk-rot resistance in foar crosses, experiment III, 1951•
L317 X WP9 L317 x B14 B2 X BIO Hy X B2
Coiap# of variation
D 5#182il»992 H -1,941 4•419 El 4.565±0,574 Eg 1*984 0.557
lo. of effective factors
Ki ,470 .167
Selective limits
Parental means
22.71-16.09 means
19#48-17•80
20 •20-17 •08
2•60312.195 a.510t5.405 3.138t0,895 1.729±0.911
2.363 • 432
19.44-17.32
20.86-15.90
21.53-15,22
3.549 0,933 2 889±1.372 .637 2,296 1.063 3.377 3.332 0.380 3.656*0.569 .455±0.387 .659±0.569
2.233 • 442
3.955 .855
15.09-17.59 16.12-17.66
13•52-19•15 13•51-20.27
15•65-19.65 17.70-23•20

89
alao D in aom© lnstane©s, are very large indicating a low
accuracy in their estimation#
The additive genetic variailon ifo D) and the total
genetic variation {% D H) were calculated for each of the
popilatlon atatistics in each of the four croaaea (tablea
35, 36, 37, and 38). In the cross L317 x WP9 viiere the H
component waa negative only the D •+• H could to© calculated
becaua© a negative H Inflatea the value of D aa explained
in a previous aeotlon# The scaling teata for genie additi-
vity (table 8) ahowed that there were aignifleant devlationa
from additlvenesa in L317 x B14 and fly x B2; therefore the
separation of B and H in theae croaaea may have been aubject
to some bias# The calculated valuea for % D for theae two
croaaea were preaented (table 36 and 38) alUaough the valuea
for the total genetic variation (^ D -t- H) are probably the
more appropriate to uae for practical application. However,
in the caae of LZV7 x B14 a large part of the total genetic
variation (^ D -*• H) is non-additive becauae of the high value
obtained for the H components (table 40). If the effective-
neaa of aeleetion is to be inferred from the total genetic
variation, a large allowance nmat be made for non-addltlve
©ffecta, in fact, the calculated % D may be the better eati-
mate to use in thla caae#
Ihen the genetic variation of the varioua populationa
is conaidered it is evident that individual plant aeleetion

90
would be very ineffective# It would be necessary to select
on a progeny row basis. This is evident when Vpg is con
sidered relative to As in the case with leaf-feeding
resistance the ¥3^^ + Vgg I3 small and straight backcrossing
would soon lose the genetic variation, apparently a system
of alternate aelfing and backcroaslrig would be preferred.
In table 40 th© estimates of and Kg give considerably
different eatimates of the number of effective factors# Ac
cording to Mather (15) ?iien the values for Ki and K2 differ
considerably, it is an iKdication that the factors invol
ved vary in size. There are at least 1 to 4 effective fac
tors involved in Diplodla stalk-rot resistance. However,
when the enrIroniaental variances are large Kg is estimated
poorly# Of course with K2 a poor estimate and the large
standard errors on D, the calculated selective limits are
not very reliable.
It is difficult to eatiamte accurately the type of gene
action involved in Diplodla stalk-rot resistance, but it is
apparently complex. The analysis of parental and means
by the constant parent regression method Indicated that is
was mostly additive gene action and some positive dominance#
In the analysis of th© components of variation the obtained
value for H was larger than D (not significantly so) in
L317 X B14 and th© obtained value of D was larger than H In
the other three crosses# The standard errors were so large.

©1
however, that the calculation of the average degree of domi
nance hj /H/d was not applicable# The scaling tests for
additivity showed some significant deviations from additive-
ness In L317 x B14 and Hy x B2. When all the facta are
taken into account it appears that several complex aystems
may be operating involving additive gene action, dominance,
and in some cases ©piatasis#

92
DISCUSSIO.N
The problem of genetic analjaia of quantitative inherit
ance is concerned with estimating gen© action from a theoret
ical standpoint and heritable variability from a practical
standpoint. Several different methods were uaed in analyzing
quantitative inheritance in this investigation. The com
parative merits of each from a practical standpoint were
rather obvious from the results obtained, however a brief
evaluation ia in order#
•The constant parent regression method proved to be of
little value, especially from a practical standpoint. The
components of variance, B, D, and E did not provide a good
index of the results obtained from a segregating population.
Thia was eapecially evident in the analysis of dsmage-point
counts where the constant parent regression method showed
very small environmental components and significant domi
nance deviations whereas in segregating popilations the
environmental variance accounted for practically all of the
variability.
The estimation of heritable variability of the Fg by
using the parents and P^'s as estimates of the environmental
variance (Ex) not suoceaaful in thia study. A better
designed experiment with more replications to reduce the
error variation would have resulted in better estimates.
95
Mather*a method of calculating the D, H, E^, and Eg
components of variation based on many segregating and non-
segregating populations of a cross proved to be an extremely
useful method from a practical standpoint# By calculating
the genetic variance of the various segregating populations
the effectiveness of selection could be Inferred smd breed
ing methods established. Mather*s method permits the calcu
lation of standard errors for the estimates of genetic vari
ance, and therefore provides a measure of reliability of the
estimates.
Breeding for Corn Borer Resistance
The results have shown that the best criterion for
measuring resistance to the first brood of corn borers is
leaf-feeding ratings# The differential survival rate be
tween resistant and susceptible plants is determined during
leaf feeding of the very early instar larvae. Whether leaf
midribs, leaf sheaths, and stalks had any resistance effects
could not be measured in these ©xperiiMnta because leaf-
feeding resistance caused a wide variation in borer numbers
between plants. The resistance effects of these plant
parts could be evaluated by artificially infesting with egg
masses durir^ th© early tassel stage in order to establish
uniform populations. However there is good reason to believe

94
that even If genetic differences did exist, the variability
caused by ©nvironjaental factors including migration would be
ao large that selection wofiild be very Ineffective.
Leaf-feeding resistane© is probably conditioned largely
by additive gene actioni however in certain crosses dominance
and epiataais may also toe important. One to three effective
factors were estimated; apparently the number of genes io
large. Estimates of the heritable variability Indicated ttiat
effectiveness of Individual plant selection wouM be lew? and
that a selected group of plants would have to be tested on
a progeny-row basis.
Spragu© and Brimhall (22) have shown that recurrent
selection was imich more effective in contrast to selection
diirlng inbreeding in increasii^g the oil percentage of the
corn kernel. They suggested the use of recurrent selection
for modifying gen© frequency fer com borer resistance.
They proposed a one-year cycl® whereby plants could be evalu
ated before pollination and selected plants would be inter-
pollinated by using a bulk collection of pollen. Data ob
tained in this investigation indicate that a two-year cycle
would be necessary. The first year a group of plants would
be selected and aelfed. The second year these would be
evaluated In progeny rows and the best progenies inter~
crossed.
One of the primary problems In the breeding program is

95
transferring r©sistano© to a susceptible inbred lin© • It
was shown that straight backcroasing would b© very ineffec
tive because of the very small amount of genetic variability
in the backcross populations. It was further shown that
alternate aelfing and backcroasing would be a big improvement
over straight backcroasing because it would maintain the
variability longer. However this method would also lose
moat of the variability after two or three backcrossea. Jen
kins 8t al» (12) in transferring resistance to leaf blight
in corn used a modified TO'ttiodof recurrent selection in
their backcroasing program* The susceptible inbred was back-
crossed to the Fx and tti© following year, on the basis of
selection before pollination, the best ten plants were inter
crossed* They used from two to three one-year cycles in this
method*
In the case of leaf-feeding resistance to corn borers
an alternate backcrossing and recurrent selection method
is suggested. This method would require two years per cycle*
The first year the selected P2 plants would be backcrossed
to the susceptible inbred* In the second year the selected
plants would be evaluated in progeny rows and the best pro
genies inter-crossed* This could be carried on for as many
cycles as are necessary to recover the major portion of -ftie
genotype of the recurrent parent* Except for the length of
tin® it requires, the method should have considerable merit

96
because the variability could be kept at a raaxlraum and a
large number of genea could be transferred to the aa aceptible
inbred with a miniimm of other germ plaam#
Breeding for Diplodla Stalk-Rot Resistance
Holbert al. (9) reported that chinch bug injury to
the stalks and damage to the leaves, Miettier artificially or
by insects or diseases, increased tiie rate at which Diplodia
stalk rot invaded stalk tissue# They attributed the increase
in susceptibility to stalk rot to a reduction in the carbo
hydrate reserve of the plant* Taylor (23) showed that there
was a direct positive relationship between the amount of
sugars in the Juiee of th© internode tissue and resistance
to Diplodia stalk rot in four inbred lines. Apparently the
results obtained in this investigation were influenced con
siderably by corn borer injury to the plants* There was
more corn borer injury in 1950 than in 1951, which may
account for the difference in the amount of premature dying
in the two years# Christensen and Schneider (5) and Taylor
(23) have shown that several other stalk rots are much more
prevalent following corn borer injury than Diplodia zeae«
The premature dying which occurred in this investigation may
have been caused by stalk rots other than Diplodia or ex
treme susceptibility to Diplodia#

97
The results on resistanc© to Diplodia stalk rot obtained
under corn borer infestation may not necessarily agree with
results obtained in absences of the borer« If com borer
Injury increases the relative susceptibility of different
lines to Diplodia stalk rot, a breeding program should be
carried out under eorn borer infestation or under aitificial
conditions of siiflulated corn borer injury# It appears tiiat
experiments are needed to test the effect of corn borer in
jury on the relative susceptibility of lines previously
rated under absence of borers#
The inadequacies of the rating seal© for Diplodia stalk
rot may have affected the results considerably. Exaixples
were shown where discolored vascular bundles extended into
adjacent internodea, while rot, as measured by pith spread,
was very limited# Some lines like LSI? had a very suscep
tible pith which actually consisted of "soft rot" but had
a resistant nod© #iloh usually confined the spread to one
internode, whereas other lines had a very tough pith whidi
was only discolored but the discoloration extended into
adjacent internodea# A line which has a very resistant
pith may have a susceptible node but would be classed as
very resistant because there is no measure of the node re
action in this case# If such a line were crossed with L317,
a combination of a susceptible pith and susceptible node
would result in non-additivity in the rating scale# In

98
thia case the non-additivlty would be due to an inadequate
scale and not gene interaction* In inheritance studies it
may b© desirable to measure pith resistance and node re~
si stance aeparatelj# This eouM probably be done if the
Inocti lationg were mad© at tJie extreme end of "Itie intemode
ao that the node resistance would be measured by spread in
one direction and pith resistance by spread in the other
direction. In thia inveatigation the atalk ratings were
made during the 5th, 6th, and 7th week after lnocu,lations5
it ia believed better results could be obtained if taken
dnrXng the 4th and 5th week.
The breeding methods diacuaaed for leaf feeding would
also apply here# A recurrent selection method xvould take
three years, one i'or making individual plant selections,
aecond for testing, progeny rowa and the third for inter
crossing the best progenies# Alternate backcroasing and
recurrent aelection would be most effective in transferring
resistance to a ausceptibl© inbred line.

99
SUMARY
!• Resistance to the first brood of corn borera was
measured by two attributes, leaf-feeding ratings and damage-
point counts. Leaf-feeding resistance was measured on a
rating scale of nine classes and damage points were counted.
Resistance to Diplodia stalk rot was measured on a ratirjg
scale of nine classes#
2. Data were collected on leaf-feeding resistance,
damage-point counts, and Diplodia stalk-rot resistance on
an individual plant basis on 9 inbreds and their 36 Pi's
and F2'3 in experiment I in 1950| oa 7 inbreds and iiieir 21
Pi's in experiment II in 1951, and on four crosses in experi
ment III in 1951 which consisted of Pi, Pg, Pi, Pg, Pg, Bi,
®2» BiS, and BgS populations# The method of constant parent
regression and the method of partitioning the variance of
the Pg into heritable and non-heritable portions were used to
analyze the data of experiment I and II. Mather's method
of simultaneously estimating D, H, and E components of
variation over all the segregating populations obtained
from a cross was used to analyze experiment III, which was
the principal experin»nt of the investigation.
3f The additive genetic variance and the total genetic
variance and the environmental variance and their standard
errors were calculated for th© various population statistics

100
of each croas of experiment III* Scaling tests were used
to maaaur© non-addltlve genlc effects and genotjrpe-environ
mental interactions and tranaformatlons were made to take
out the genotype-environmental Interactions•
4» The percent additive genetic variance or percent
total genetic variance of the various popilation statistics
for leaf-feeding resistance indicate that effectiveness of
individual plant selection would "be low and that selection
would liave to he carried to progeny rows# The gene action
involved in leaf-feeding resistance appears to he mostly
additive gene action with dominance and eplstasls important
in certain crosses*
5. The environmental varimce accounted for practically
all of the variatoillty of damage-point counts in the crosses
studied. Selection for resistance to the first brood of
corn borers on the basis of damage-point counts would be
completely ineffective*
6» The percent additive genetic variance or percent
total genetic variance for Dlplodla stalk-rot resistance
indicates that selection on an Individual plant basis would
not be very effective and that selection would have to be
made on a progeny-row basis* Dlplodla stalk-rot resistance
involves additive gene action, dominance and eplstasls. The
Inadequacies of the rating scale for Dlplodla stalk rot was
discussed*

101
7» Breeding for leaf-feeding resistance to corn borers
and resiatane© to Diplodia stalk rot was discussed. Because
of the gene action involved and the relatively low genetic
variances, recurrent selection was suggested as the most
effective way of Increasing gene frequency for resistance
to corn borers and Diplodia stalk rot • An alternate back-
crosaing and recurrent selection method was suggested for
transferring leaf-feeding resistance and Diplodia atalk-rot
resistance from resistant inforeda to susceptible inbreds#

102
ACKKOIfLEDGMlOT
The author wiahea to express his appreciation to
Dr# G» P, Spragae for hia many helpful sruggeationa, to
Professor 0# Kempthorne for his atatiatical advice,
and to the Ankeny Corn Borer Laboratory, eapeolally
Mr* F, P* Die3® , for their kind assistance during the
investigation.

103
LITERATURE CITED
Bartl@tt, M* S# Th© use of tranafomatlons. Biometrics. Ss 39-52* 1947.
Beall, Geoffrey* Th© tranaformatlon of data from ento-mologieal field experiments so tbat the analysis of variance becomes applicable• Biometrika. 32: 243-262. 1942•
Chriatensen, J. J., and Schneider, C, L» European corn borer (Pyrayata imbilalia Hbn.) in relation to -shank, atalk'aad ear rots of corn# Phytopath. 40s 284-291. 1950.
Dlcke, F» P. Breeding for corn borer resistance. 6th Ann. Meeting Horth Central States Branch Amer. Aas'n Econ. Ent# PTOC* Toledo, Ohio. 6: 89-90, 1951.
« and Penny, L. H« Built-in resistance helps corn fi^t borers. What*s New in Crops and Soils* 4J 9-11. 1952.
Pisher, R. A., Iramer, P. R., and Tedin, Olaf. The genetical Interpretation of statistics of the third degree in the study of quantitative inheritance. Genetics. 17s 107-124. 1932.
Griffing, J. B# Statistical analysis of gene action in components of toaato yield. Unpublished Ph. D. Thesis* Ames, Iowa, Iowa Stat© College Library# 1948.
Analysis of quantitative gene action by constant parent regression and related techniques. Genetics. 35: 303-321. 1950.
Holbert, J. R., Hoppe, P. E., and Smith, A. L. Some factors affecting infection with and spread of Diplodia zeae in the host tissue. Fhytopath. 25 s ' lliS-IIIi". 1935.
Huber, L. L. European corn borer resistance. Ohio Agr. Exp. Sta. Bui. 579s 45-46. 1937.

104
* and Stringfleld, G, H» Aphid Infestation of strains of eom as an index of their auaceptlbil-itj to corn borer attack* Jo ir. Agr. Reg« 64: 283-291• 1942.
12. Jenkins, Merle Robert, Alice L«, and Findley, lllliam H. Eeemrrent selection as a method for concentrating genea for resistance to Helmlntho* sporium turicmn leaf blight of com. Agron. Jour. 46s' 89-'§4. 1954.
13. Loeffel, Frank A. Effectivenega of individual plant selection in Zea mays L for resistance to the luropean corn borer (Pyrausta mbilalis Hbn.) Unpiblished Ph. D. Thesis. tJnlversi'fcy of Minnesota. 1953.
14. Mather, K, The genetlcal theory of continuous variation. Proc. Ei^th Int. Cong. Genetics. 1948. Heredl-tas Suppl. Vol. P. S76-401. 1949,
15. Biometrical genetics. New York, Dover Publications • 1949.
. and Vines, A, The inheritance of height and ITowering time in a cross of Micotlania TOstica. Quantitative inheritance. Papers read at a col-loqulum at the Institute of Animal Genetics, Edinbur^ University. 1950. London, Her Majesty's Stationery Office. 1952.
17. lelswander, C. R., Snelling, R. 0., and Dicke, Fm F, Report of the committee on uniform methods of recording differential insect injury in plantings of corn strains. Tenth Corn Improvement Conference of the North Central Region. Chicago, Illinois# February 11, 12, 1949, (Mimeo. rept.)
18. Painter, R. E. Insect resistance in crop plants. New York, Macmillan Company. 1951.
19. Rubls, David D. Influence of date of planting and Baropean cern borer populations on yield of corn. Unpublished M. S. Thesis. Ames, Iowa, Iowa State College Library. 1950.
20. Singh, Rameshwar. Inheritance in maize of reaction to the European corn borer (Piyrausta mbilalis) . Unpublished Ph. D. Thesis. University of Minnesota. 1951.
105
21. Smith, A. L., Hoppe, P. E,, and Holtoert, J. R« Development of a differential inoculation technique for Dlplodla stalk rot of com• Phytopath. 28: 497-504. 1938•
22* Spragie, G'. P,, and Brimhall, B, • Relative effectlve-neaa of two systems of selection for oil content of the corn kernel# Agron» Jour. 42: 83-88, I960,
25. Taylor, Gordon S# Stalk rot developinent in corn following the :&iropean corn borer# UnpublishBd Ph. D» Thesis# Amea, Iowa, Iowa State College Library# 1952.