infrastructure working council (iwc) presentations two...open vehicle grid integration platform...
TRANSCRIPT

© 2015 Electric Power Research Institute, Inc. All rights reserved.
SRP’s PERA Club, Tempe, AZMarch 26, 2015
Infrastructure Working Council (IWC)
PresentationsDay Two

Open Vehicle Grid Integration Platform (OVGIP)
OEM/EPRI Collaboration
George BellinoSr. Project EngineerGeneral Motors GCCEPRI IWC Tempe, AZ
Mar 26, 2015

Purpose• Open Vehicle Grid Integration Platform is to provide a unified
common interface between the Utilities, the Service Providers, and the PEVs.
Objective
• Utility Perspective: Provides Common/Single interface to OEM PEVs utilizing standards based protocols
• OEM Perspective: Provides flexibility to use diverse on-vehicle communications technologies - compatibility and Interoperability with Utility standard interface protocols
OEM/EPRI Collaboration

Roadmap to an Open Platform
Functionality
Interfaces/Protocols TelematicsOpenADR 2b, SEP2 IEC/ISO 15118DR EVENT Execution Multiple OEMs
Scale
SecurityReliabilityScalabilityM&V - AssociationGeo-Location specific DRAggregation AlgorithmsInterfaces EMS/BMS/EVSPs
Value-added Grid Services
Ancillary ServicesRenewable BalancingVolt/VAR control
Extensibility to other end use devices
Phase 1 Phase 2 Phase 3
2014 2015-16 2016-17

Phase 1: “The Big Demo” Proof of Concept
Plugged In
Charge Status DisplayCompleted 10/16/2014 at SMUD
Single signal sent to stop/start charging of seven different OEM PEVs simultaneously
Success!
The Line Up: 7 OEM PEVs 30 plus Persons Attend

Big Demo: Goal Demonstrate unified interface and communications
Utility OpenADR 2b VTN DR Event signal to multiple OEM PEVs through the Central Server
PEVs simultaneously execute DR Event
Three OEM communications pathways demonstrated
OEM Telematics Server to PEV
Gateway through EVSE PLC to PEV (SEP2)
eMobility Operator to EVSE to PEV (ISO/IEC 15118)
Sumitomo developed Central Server Interfaces, OpenADR2b VEN, and Common/proprietary APIs
EPRI developed Utility OpenADR2b VTN
G2H (Kitu Systems) & AeroVironment provided EVSEs and Display

Phase 2: Enhanced Interfaces/Applications

Phase 2: Use Cases
1 Automated Utility Electricity Rate Tariff Processing
2 Aggregated Utility Distribution Level Locational Demand Response
3 Interface with Home Energy Management System or ESI
4 Interface with Building Energy Management System
5 Real Time Price (RTP)/ Critical Peak Pricing (CPP) Signal Event Processing
6 Interface with EVSE Network Provider
7 Optimized Load Management (ISO/IEC 15118)
8 Vehicle Roaming
9 Association

Initiated Candidate IT Developer/Supplier review/selection process 8 Candidates engaged
Action/Timing for review/selection process
Request for Information and Cost Proposal released Jan 15, 2015 Preliminary written information response Feb 13, 2015 Candidate face to face meetings Mar 23/24, 2015 Follow ups with specific Candidates Mar 24-Apr 22, 2015 Selection Announcement Apr 30, 2015
Phase 2: Process for Determination of Platform Developer

4 Phase Development and Commercialization Approach
Phase 1Proof of Concept
Phase 2Prototype
Priority 1 Use Case Field Trial
Market Entity Simulation
Phase 3Production
Priority 1 Use Case Commercialization
Priority 2 Use Case Field Trial
Customer /Business Systems
Phase 4
Priority 2 Use Case Commercialization
Priority 3 Use Cases
Business Case Analysis
MARKET ENTITY
Commercial Enterprise
Market/Customer Engagement

Deploying Integrated End Device Applications and Services Enabled by a the Platform
Open Foundational PlatformSecurity, Scalability, Extensibility, M&V, Open Interface
Unidirectional Power Flow Applications
Dyn
amic
Pri
cing
Dem
and
Resp
onse
Rene
wab
le B
alan
cing
Dow
n Re
gula
tion
Bidirectional Power Flow Applications
Volt
/ V
AR S
uppo
rt
Freq
uenc
y Re
gula
tion
V2B
/ V2
H B
MS
/ EM
S In
tegr
atio
n
Systems Coordination
Wor
kpla
ce /
Pub
lic /
Re
side
ntia
l Use
Cas
es
Aggr
egat
ion
ISO
Inte
grat
ion
Mar
ket
Part
icip
atio
n
Ope
n D
ata
Acce
ss

How to synchronize multiple customer interfaces?
OVGIPOEM Servers
ESI/HANBMS
IEC 15118
CustomerPEV Driver
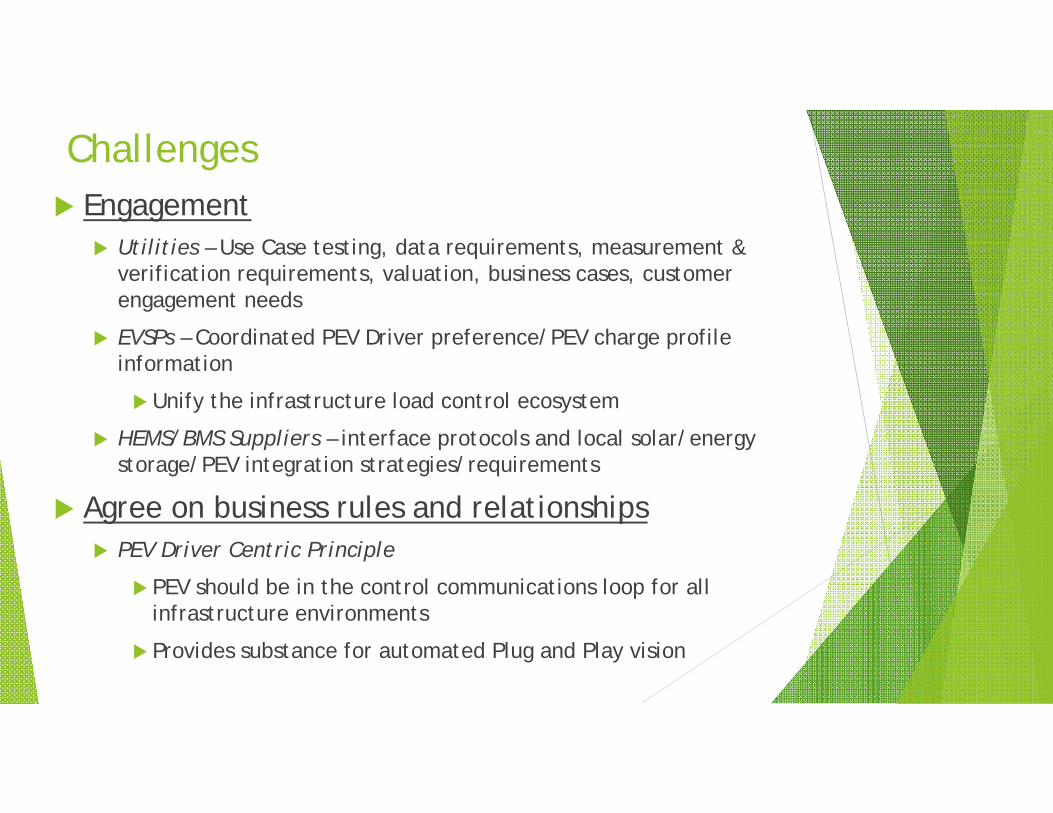
Challenges Engagement
Utilities – Use Case testing, data requirements, measurement & verification requirements, valuation, business cases, customer engagement needs
EVSPs – Coordinated PEV Driver preference/PEV charge profile information
Unify the infrastructure load control ecosystem
HEMS/BMS Suppliers – interface protocols and local solar/energy storage/PEV integration strategies/requirements
Agree on business rules and relationships PEV Driver Centric Principle
PEV should be in the control communications loop for all infrastructure environments
Provides substance for automated Plug and Play vision

Vision for Unified Platform
Mike Bourton

OVGIP High Level Diagram
3 April 2015 Kitu Systems Proprietary 2
OVGIP Server
$$ $$
Telematics Portals
Home/Premise
Utility 3rd pty

3 April 2015 Kitu Systems Proprietary 3
White GoodsOEM Server’s
$$ $$
Portals
Home/Premise
Utility 3rd pty
White Goods Manufacturers
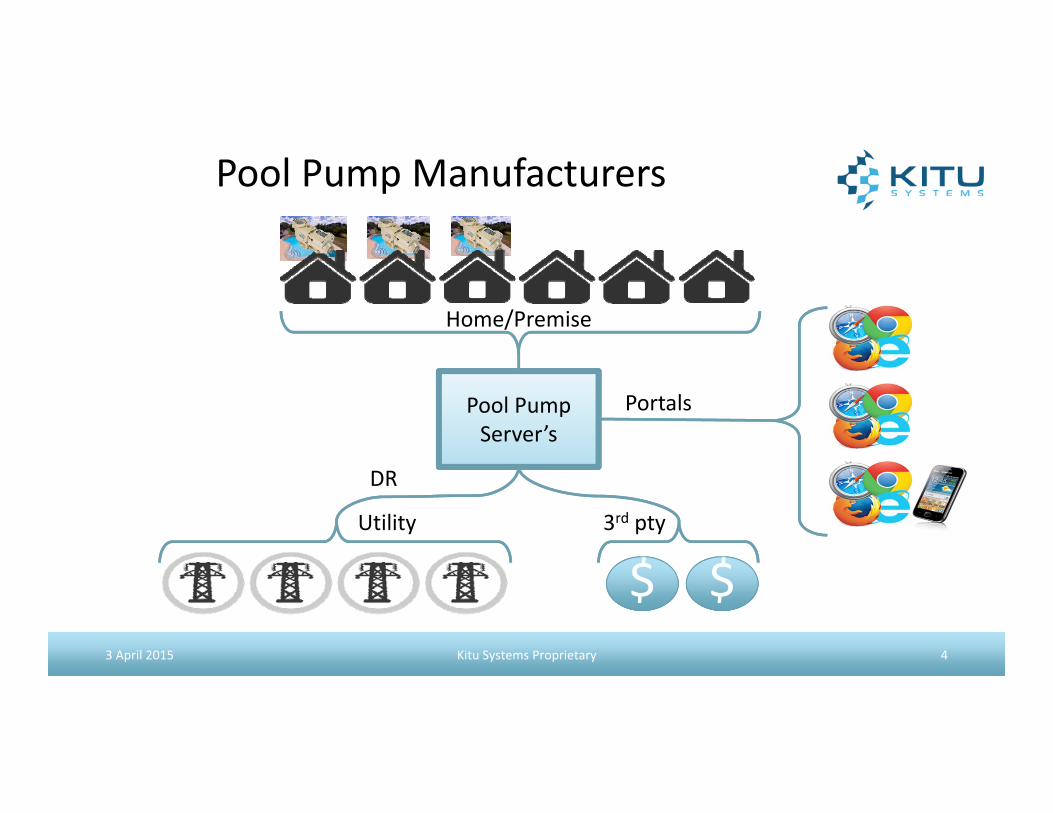
3 April 2015 Kitu Systems Proprietary 4
Pool PumpServer’s
$$ $$
Portals
Home/Premise
Utility 3rd pty
Pool Pump Manufacturers
DR

3 April 2015 Kitu Systems Proprietary 5
Solar Management
Server’s
$$ $$
Portals
Home/Premise
Utility 3rd pty
Solar Management
DER

3 April 2015 Kitu Systems Proprietary 6
Service Providers
$$ $$
Portals
Home/Premise
Utility 3rd pty
Home Energy Management
EMS EMS EMS
DR/DER

3 April 2015 Kitu Systems Proprietary 7
EMSService Providers
$$ $$
Portals
Home/Premise
Utility 3rd pty
Cloud Energy Management
DR/DER

Intel Home Lake Architecture
3 April 2015 Kitu Systems Proprietary 8

Southern California EdisonSmart Charging Pilots Update
IWC Tempe 2015
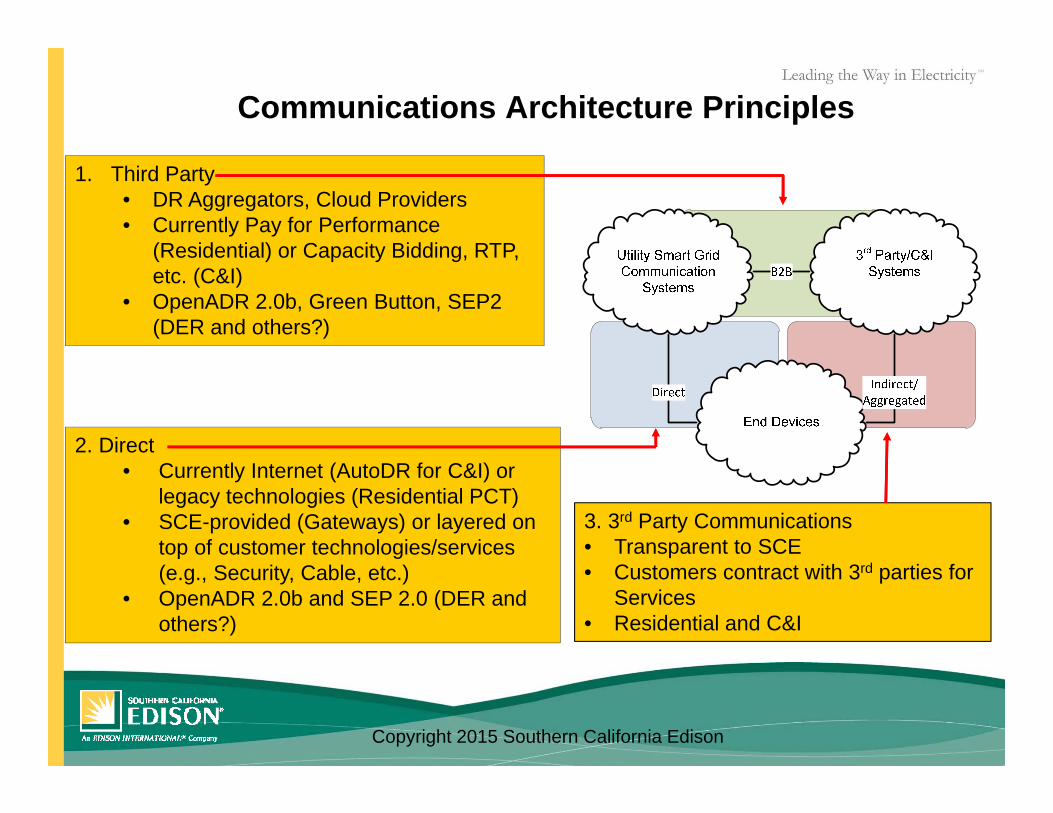
Communications Architecture Principles
2. Direct• Currently Internet (AutoDR for C&I) or
legacy technologies (Residential PCT)• SCE-provided (Gateways) or layered on
top of customer technologies/services (e.g., Security, Cable, etc.)
• OpenADR 2.0b and SEP 2.0 (DER and others?)
1. Third Party• DR Aggregators, Cloud Providers • Currently Pay for Performance
(Residential) or Capacity Bidding, RTP, etc. (C&I)
• OpenADR 2.0b, Green Button, SEP2 (DER and others?)
3. 3rd Party Communications• Transparent to SCE• Customers contract with 3rd parties for
Services• Residential and C&I
Copyright 2015 Southern California Edison

SCE Residential Smart Charging Pilot

Pilot Overview SCE “Demand Response” pilot through end of 2014 Purpose: Technology Evaluation & Demonstration
Gateway-Based Communications (Customer broadband & Wi-Fi) SEP2 (DR, Metering, Discovery, Security)
Use Case Summer Discount Plan- Pay for Performance & Opt in/out No Customer Billing
10 Gateways, EVSEs, & Sub-meters deployed in employee homes
Copyright 2015 Southern California Edison

Results
5
• 13 DR Events• 6 Hour/Day ahead• 30 minute duration
• Participation• Requesting participation vs
asking users to plug in• Opt in/out
• Technology Validation• Gateway-based
communications• SEP2 Functionality
• Where to from here?• Services/Standards
integrated into existing technologies?
• SCE provides technologies?
Copyright 2015 Southern California Edison

SCE Workplace Charging Pilot

Objectives• Gain a better understanding of consumer behavior related
fee-based charging (for space usage) and DR events.• Evaluate DR technologies that support non-proprietary
charging options and an open communications standard (OpenADR 2.0b).
• Measure system and building load impacts related to plug-in electric vehicle charging.
• Better quantify DR potential of EV charging in the workplace.
• Help determine the balance between DR and customers’ needs for EV charging at the workplace.
• Advise business customers regarding the costs, benefits, and impacts of workplace charging to inform future installation plans at customer properties.
7
Copyright 2015 Southern California Edison
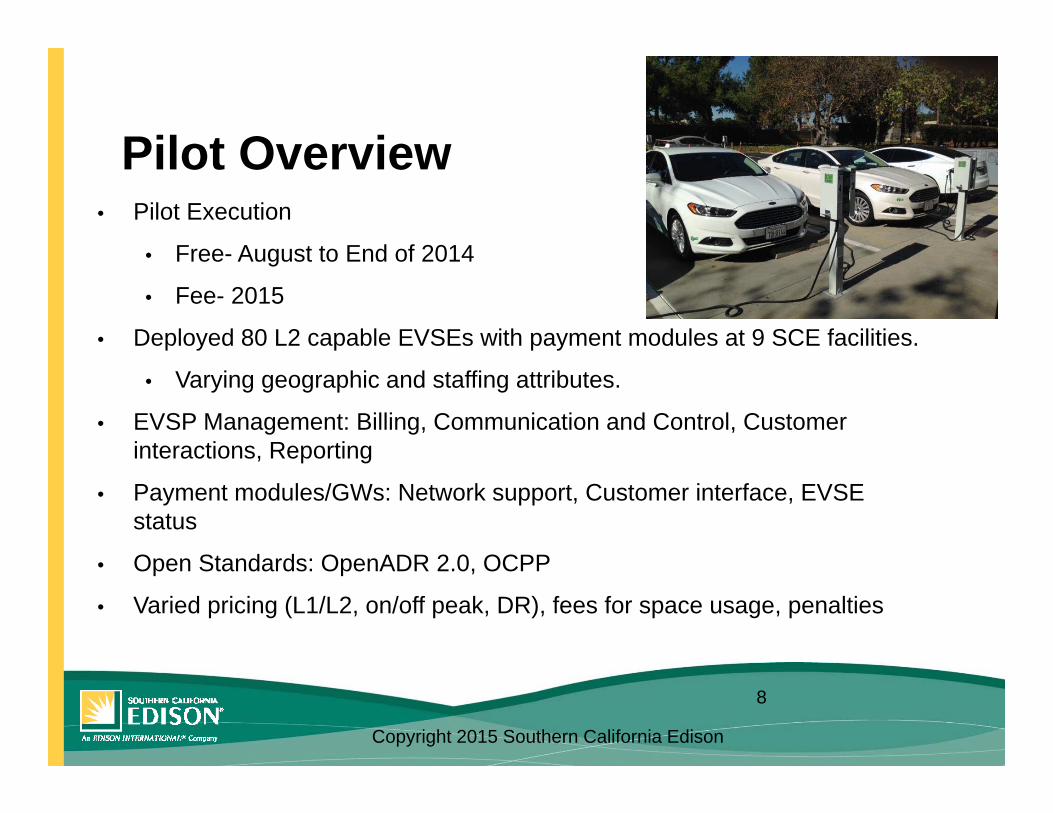
Pilot Overview
8
• Pilot Execution
• Free- August to End of 2014
• Fee- 2015
• Deployed 80 L2 capable EVSEs with payment modules at 9 SCE facilities.
• Varying geographic and staffing attributes.
• EVSP Management: Billing, Communication and Control, Customer interactions, Reporting
• Payment modules/GWs: Network support, Customer interface, EVSE status
• Open Standards: OpenADR 2.0, OCPP
• Varied pricing (L1/L2, on/off peak, DR), fees for space usage, penalties
Copyright 2015 Southern California Edison

PILOT PRICING & DR MODEL
Copyright 2015 Southern California Edison

A Sample of (Very) Early Findings• Customer Communications
– E.g., Informing customers of pilot details• Pre/post fee usage
– Vocal Minority• Pilot Design & Implementation
– E.g., Session Requirements• Lab testing to field deployments
– Sample of Unexpected Technology Issues• SMS notifications• Certain cards not able to be used• Breakers
10Copyright 2015 Southern California Edison

Other SCE PEV Related Pilots (Planning Stages)
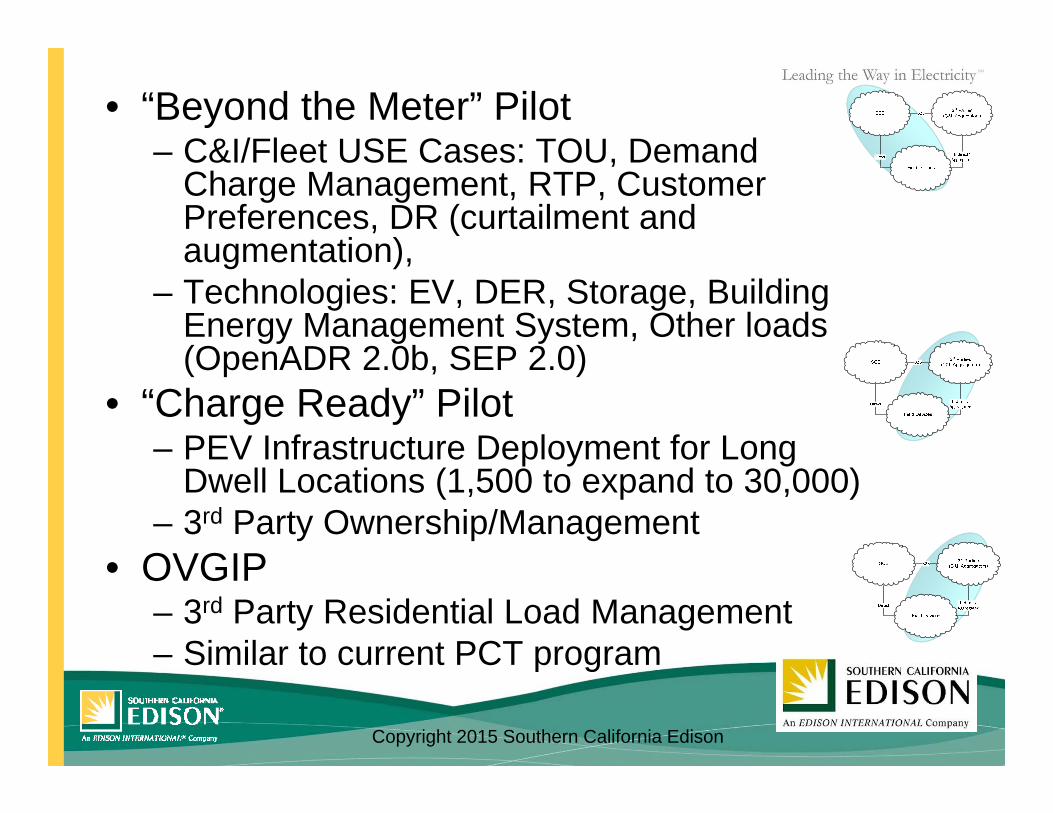
• “Beyond the Meter” Pilot – C&I/Fleet USE Cases: TOU, Demand
Charge Management, RTP, Customer Preferences, DR (curtailment and augmentation),
– Technologies: EV, DER, Storage, Building Energy Management System, Other loads (OpenADR 2.0b, SEP 2.0)
• “Charge Ready” Pilot– PEV Infrastructure Deployment for Long
Dwell Locations (1,500 to expand to 30,000)– 3rd Party Ownership/Management
• OVGIP– 3rd Party Residential Load Management – Similar to current PCT program
Copyright 2015 Southern California Edison

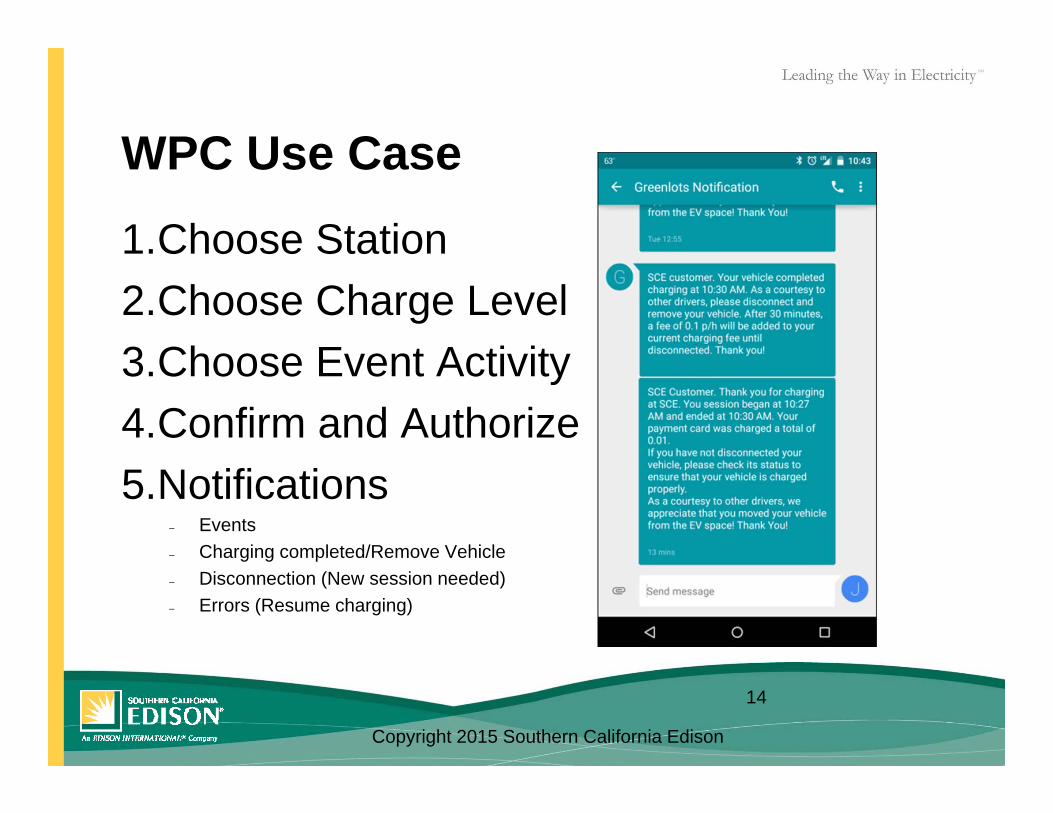
WPC Use Case
1.Choose Station2.Choose Charge Level3.Choose Event Activity4.Confirm and Authorize5.Notifications
– Events– Charging completed/Remove Vehicle – Disconnection (New session needed) – Errors (Resume charging)
14
Copyright 2015 Southern California Edison
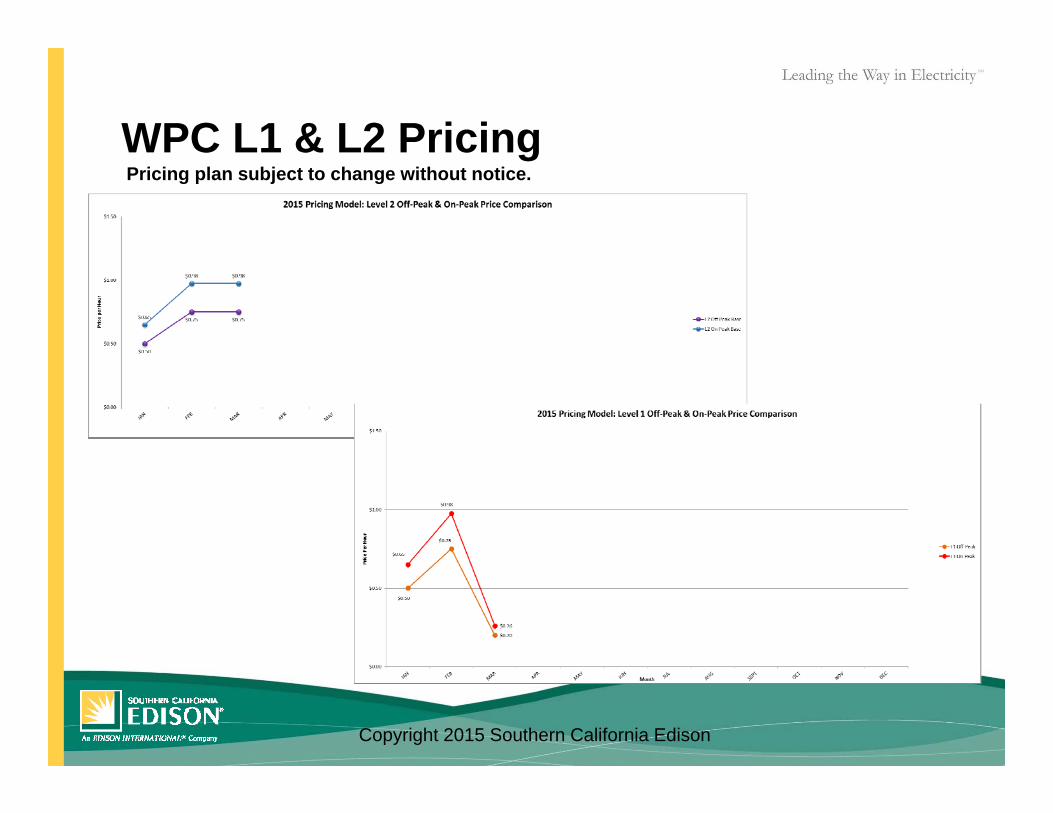
WPC L1 & L2 PricingPricing plan subject to change without notice.
Copyright 2015 Southern California Edison

Emerging Technology Team
bySteve Hinkel
IWC Connectivity Architectureaka EV Charging et al.

Agenda
• Summary Strategy• Summary Vision• Services Model• Illustrative Implementation• Data Sharing• Questions / Comments

Summary Strategy
• Assumption: Velocity of market outpaces Utility cycle time.• Result: Technology evaluation treadmill.• Good Enough strategy to monetize now, so we can shift from
Technology discussions to Customer discussions.• Allow us focus on customers’ needs.

Summary VisionCustomer‐Centric:• Focus Groups for needs. No longer claim, “I, too, am a customer”.• Self enrollment ‐ decouple wiring from connectivity.Network aka Connectivity Plumbing:• Connectivity premise:
– No ‘silver bullet’– Pros and Cons to any solution
• Diversity is key:– Support multiple transceivers (modular SGD’s begin to make sense).– 80/20 rule, majority of customers at minimal expense, ie:
• 40% WiFi• 40% Cellular• 20% cannot serve (…yet OR with additional customer funding)
– Universal program socializes high cost of the 20%

Services Model• Decouple transceiver from functionality
– Conventional Wisdom is to deploy a solution (ie DR device).– Future IoT provides connectivity, with optionality to use in multiple ways.
• Example, a water heater (because we all have one):
• Offer carrots over financial incentives…? Will customers demand?• Utilities facing significant Intellectual Property opportunity.
App Description
1 DR Shed is economic over next best alternative
2 DSM Also buy an EV? Push Choreograph Load app
3 EE Put your house to sleep when vacant
4 Safety Legionnaires disease (ie 140 for 1 hr/day)
5 Health Equipment health, reminders ie drain
6 Alerts Burst pipe, freezing temp
7 Key… Innovative ways

Illustrative Implementation
Broadband
Duke AP
Cannot serve w/o customer financial participation.
Ie Diverse technologies even in a single home.
OFMB

Data Sharing• Duke actively quantifying Broadband
– Ethernet network logging, as a baseline.– WiFi logging by appliance (3 mos WH, HVAC, Pool, garage)– Key = creating a Duke analytical engine to interpret data
• EPRI expressed similar interest for Cellular• Early learnings:
– Always on or mostly on?– Support call router swap– AP’s require rebooting (interval?)– Customer perception (slow?)– Predictable on/off‐peak times
• Please share your findings

Questions, comments?

Power Tagging UpdateMarch 2015

Power Tagging History 2009 to 2011

PHEV Forecast2015 IRP
3
0
50,000
100,000
150,000
200,000
250,000
300,000
350,000
0%
1%
2%
3%
4%
5%
6%
7%
20
12
20
13
20
14
20
15
20
16
20
17
20
18
20
19
20
20
20
21
20
22
20
23
20
24
20
25
20
26
20
27
20
28
20
29
20
30
Ve
hic
les
% o
f R
egi
ste
red
Ve
hic
les
Projected PHEV PenetrationVA DVP Service Territory
• 7M Registered vehicles in VA• 4.5M Registered vehicles in DVP service territory• 2,827 PHEV’s in DVP service Territory• 1 out of every 1,600 Registered Vehicles is an PHEV• 1 out of every 850 DVP customers has an PHEV
2014 Summary
EPRI Projection
DVP Projection

Public Charging Station Comparison
4
Source: US Dept of Transportation, USDE Alternative Fuels Data Center
VA CA
Vehicles 7,000,000 27,103,000
PHEV's 3,531 148,000
PHEV : Vehicles 1 : 1,982 1 : 181
Charging
Stations198 2,011
Station : PHEV's 1 : 18 1 : 75
Outlets 540 6,294
Outlets : PHEV's 1 : 7 1 : 24
Virginia has a greater availability of Charging stations per Vehicle than California

VirtuGrid enables data (voltage, power, energy readings, GPS location, phase and circuit connectivity) to be sent from the remote location to the substation over the same path as the power, enabling remote awareness of the grid and enhancing its value. VirtuGrid facilitates control and timing of remote communications with multiple types of standard down line communication networks with very low bandwidth usage.
The result is an integrated physical and electrical mapping of the primary and secondary circuits of your distribution network.
Become Grid Location Aware (GLA)VirtuGrid HistGory 2013 to 2015

Basic Application ArchitectureVoltage MagnitudeVoltage AnglePowerEquipment StatusGPS LocationCircuit LocationPhase Location
Substation LTC
M
M
Primary Feeder
GG
M
M
M
M
M
M
GG
AMI AMI
AMI
AMI
AMI
AMI
AMIAMI
Basic Sensing Principles and Equipment
FIMVirtuGrid Server & User Interface
Data Historian
DMS
M
M
DistStorage
AMI
AMI
Rm
Cube
Clip on CT
Portable Remote
Portable RemoteCubeFIM

Start with the Objects in GIS and/or the Circuit Model
M
PRIMARY FEEDER
AMI
M
AMI
M
M
M
AMI
AMI
AMI
M
M
M
GG
AMI
AMI
AMI
M
M
M
GG
AMI
AMI
AMI
M
AMI
M
AMI
M
M
M
GG
AMI
AMI
AMI
M AMI
M M
AMI AMI
M M
G
Dist
Storage
AMI AMI
M M
G
Dist
Storage
AMI AMI
AMIAMI
AMIAMI
AMIM
Typical Two
Circuit Substation
Green Court
Green Lane
Gre
en
Stre
et
Ha
rbo
r Co
urt
GIS brings significant benefit to the distribution grid but it is limited to mapping visual assets to geographic coordinates.
The distribution grid connectivity related to substation to customer power connection is poorly represented and inaccurate in most distribution systems.

Add Remote Sensor Measurement
M
PRIMARY FEEDER
AMI
M
AMI
M
M
M
AMI
AMI
AMI
M
M
M
GG
AMI
AMI
AMI
M
AMI
M
AMI
M AMI
M M
AMI AMI
M M
G
Dist
Storage
AMI AMI
M M
G
Dist
Storage
AMI AMI
AMIAMI
AMIAMI
AMIM
Rm
Rm
LTC
M
M
M
GG
AMI
AMI
AMI
M
M
M
GG
AMI
AMI
AMI
Typical Two
Circuit Substation
1
2
3
4
5
6
7
8
9
10
11
12
13
14
15
16
Slot RM
Rm
Rm
Rm
Rm
Rm
Rm
Rm
Rm
Rm
Rm
Rm
Rm
Rm
Rm
Rm
Rm
Green Lane
Green Court
Ha
rbo
r Co
urt
Gre
en
Stre
et
Slot/RM Volt Mag Volt Ang GPS Status Kw Circuit Phase
1 120 0.2 x,y 10 1 A
2 119 0.5 x,y 0 1 A
FIM
VirtuGrid Server
& User Interface
Cube
VirtuGrid maps GPS coordinates, Voltage magnitude and Angle, and status information from the remote as well as marking the phase and circuit location.
Phase and Circuit information and GPS are used to map connections to the Right of Way which is a container for the distribution conductors and equipement

Add Remote Sensor Right of Way Sampling
M
PRIMARY FEEDER
AMI
M
AMI
M
M
M
AMI
AMI
AMI
M
M
M
GG
AMI
AMI
AMI
M
AMI
M
AMI
M AMI
M M
AMI AMI
M M
G
Dist
Storage
AMI AMI
M M
G
Dist
Storage
AMI AMI
AMIAMI
AMIAMI
AMI
M
Rm
Rm
LTC
M
M
M
GG
AMI
AMI
AMI
M
M
M
GG
AMI
AMI
AMI
Rm
Rm
1
2
3
4
5
6
7
8
9
10
11
12
13
14
15
16
Slot RM
Rm
Rm
Rm
Rm
Rm
Rm
Rm
Rm
Rm
Rm
Rm
Rm
Rm
Rm
Rm
Rm
Typical Two
Circuit Substation
Green Lane
Green Court
Ha
rbo
r Co
urt
Gre
en
Stre
et
Slot/RM Volt Mag Volt Ang GPS Status Kw Circuit Phase
1 120 0.2 x,y 10 1 A
2 119 0.5 x,y 0 1 A
3 116 3.2 x,y 3 1 A
4 123 3.3 x,y 4 1 A
5 122 2.1 x,y 7 2 B
FIM
VirtuGrid Server
& User Interface
CubeVirtuGrid produces samples from the connected customers for each phase and allows equipment such as step down transformers and riser poles to be connected.
The VirtuGrid algorithm then electrically maps the three phase circuit connectivity to be used by outside application in a virtual connectivity map.

Add Remote Sensor Circuit and Phase Right of Way Sampling
M
PRIMARY FEEDER
AMI
M
AMI
M
M
M
AMI
AMI
AMI
M
M
M
GG
AMI
AMI
AMI
M
AMI
M
M AMI
M M
AMI AMI
M M
G
Dist
Storage
AMI AMI
M M
G
Dist
Storage
AMI AMI
AMIAMI
AMIAMI
AMI
M
Rm
Rm
LTC
M
M
M
GG
AMI
AMI
AMI
M
M
M
GG
AMI
AMI
AMI
Rm
Rm
1
2
3
4
5
6
7
8
9
10
11
12
13
14
15
16
Slot RM
Rm
Rm
Rm
Rm
Rm
Rm
Rm
Rm
Rm
Rm
Rm
Rm
Rm
Rm
Rm
Rm
M AMI
REG
M
AMI
M
M
M
AMI
AMI
AMI
M
M
M
GG
AMI
AMI
AMI
AMI
M
M AMIM M
G
Dist
Storage
AMI AMI
M M
G
Dist
Storage
AMI AMI
AMIAMI
Rm
Rm
Rm
Rm
Rm
Rm Rm
RmTypical Two
Circuit
Substation
Circuit 1 A Phase
Circuit 2 B Phase
Cube
Cube
FIM
VirtuGrid Server
& User Interface
AMI
Green Lane
Green Court
Ha
rbo
r Co
urt
Gre
en
Stre
et
Slot/RM Volt Mag Volt Ang GPS Status Kw Circuit Phase
1 120 0.2 x,y 10 1 A
2 119 0.5 x,y 0 1 A
3 116 3.2 x,y 3 1 A
4 123 3.3 x,y 4 1 A
5 122 2.1 x,y 7 2 B
6 120 5.2 x,y 0 2 B
7 120 3.5 x,y 2 2 B
8 115 3.2 x,y 5 2 B
9 116 3.5 x,y 9 2 B
10 118 4 x,y 15 2 B
11 120 0.2 x,y 10 2 B
12 119 0.5 x,y 0 2 B
13 116 3.2 x,y 3 1 B
14 123 3.3 x,y 4 1 B
15 122 2.1 x,y 7 1 B
16 120 5.2 x,y 0 1 B
VirtuGrid can record full three phase “normal state” customer to substation maps and compare with abnormal state to determine connectivity.
Customer and equipment can be tracked as they move from one circuit and phase to another circuit and phase and the operators notified by the alarm system.
This information then is serviced to the ADMS Model, OMS information and other key applications.

Volt Mag Volt Ang GPS Status Kw Circuit Phase
120 0.2 x,y 10 1 A
119 0.5 x,y 0 1 A
116 3.2 x,y 3 1 A
123 3.3 x,y 4 1 A
122 2.1 x,y 7 2 B
120 5.2 x,y 0 2 B
120 3.5 x,y 2 2 B
115 3.2 x,y 5 2 B
116 3.5 x,y 9 2 B
118 4 x,y 15 2 B
120 0.2 x,y 10 2 B
119 0.5 x,y 0 2 B
116 3.2 x,y 3 1 B
123 3.3 x,y 4 1 B
122 2.1 x,y 7 1 B
120 5.2 x,y 0 1 B
120 3.5 x,y 2 1 C
115 3.2 x,y 5 1 C
116 3.5 x,y 9 2 C
118 4 x,y 15 2 C
120 0.2 x,y 10 2 C
119 0.5 x,y 0 2 C
116 3.2 x,y 3 2 C
123 3.3 x,y 4 2 AR
122 2.1 x,y 7 2 A
Load/Gen Customer Transformer Slot/RM Rt of Way/kV Transformer Rt of Way/kV Ckt Phase Substation
Solar 1 1 1 1 13.2/34.5 1 1 A 1
Residential 1 1 1 1 13.2/34.5 1 1 A 1
Residential 2 2 2 1 13.2/34.5 1 1 A 1
Solar 2 2 2 1 13.2/34.5 1 1 A 1
Wind 2 2 2 1 13.2/34.5 1 1 A 1
DG 3 1 3 2 none 2 1 B 1
Commercial 3 1 3 2 none 2 1 B 1
Residential 4 3 4 1 13.2/34.5 1 1 C 1
Residential 5 3 4 1 13.2/34.5 1 1 C 1
Residential 6 3 4 1 13.2/34.5 1 1 C 1
Residential 7 3 4 1 13.2/34.5 1 1 C 1
Residential 8 3 4 1 13.2/34.5 1 1 C 1
Residential 9 3 4 1 13.2/34.5 1 1 C 1
Residential 10 4 5 1 13.2/34.5 2 1 A 1
Residential 11 4 5 1 13.2/34.5 2 1 A 1
Residential 12 4 5 1 13.2/34.5 2 1 A 1
Residential 13 4 5 1 13.2/34.5 2 1 A 1
Residential 14 4 5 1 13.2/34.5 2 1 A 1
Residential 15 4 5 1 13.2/34.5 2 1 A 1
Residential 16 4 5 1 13.2/34.5 2 1 A 1
Commercial 17 5 6 2 none 2 2 A 1
Commercial 18 5 6 2 none 2 2 A 1
Commercial 19 6 7 2 none 2 2 B 1
Commercial 20 6 7 2 none 2 2 B 1
Commercial 21 7 8 2 none 2 2 C 1
Residential 22 8 9 2 3 1 2 C 1
Residential 23 8 9 2 3 1 2 C 1
Residential 24 8 9 2 3 1 2 C 1
Residential 25 8 9 2 3 1 2 C 1
Transform Sensor Data to Object ConnectivitySensor Data Object Connectivity
VirtuGridRemote Sensor Data

The Complexity of the Distribution Asset
Management and Mapping of a Distribution Assets
• Change volume of assets on distribution is significant
• Common to re-configure distribution connectivity
• Significant change in assets for large storm restoration
• GIS tracking of assets does not address electrical connectivity information
• Distribution GIS systems have significant data problems because of volume, age, size, and location

Grid location and power backhaul:
VCU Application for Chiller Plant
Available for both Network and Radial Grids.
Backhaul of power and other data fromspecific remote points within the distributiongrids where other communication backhaulmethods may not have coverage or may notbe reliable.
Non AMI existing meters can be used withremote collection and monitoring of powerdata.
27 Chiller sites on two campuses in 28Buildings supplied by two substations 6transformers and 13 underground circuits

Basic VCU Project ArchitectureVoltage MagnitudeVoltage AnglePowerEquipment StatusGPS LocationCircuit LocationPhase Location
Transformer #7 LTC
VCU Chiller VirtuGrid Project
Transformer #6 LTC
Transformer #1 LTC
Transformer#2 LTC
Transformer #3 LTC
Transformer #4 LTC
Ckt
398
Ckt
399
Ckt
400
Trani Life Eng West Harris Hall Cary St Gym Johnson Hall Performing Arts
Student Housing
Pollak
Hibbs Ander
Academic Learning Center
Control Circuit
Ckt
608
Ckt
630School of Art
Temple Student Commons
Ckt
619
Ckt
620
Ckt
621
Ckt
622
Ckt
616
Ckt
378
Ckt
457
Ckt
459
Carver
Shockoe
Sanger 513/543 Massey Surg
Sanger 513
VIRGINIA COMMONWEALTH UNIV (Biotec 1)
KONTOS
Pharmacy Sch
Sanger Animal
Library Chill
Lyons 532
School of Nursing
Control Circuit
Wood Dental
Cabell
StudentCommon
15 Buildings
16 Chillers being monitored
2 Substation Transformers
and 5 circuits
1 circuits being monitored
with no remotes
11 Buildings
13 Chillers being monitored
4 Substation Transformers
and 8 circuits
1 circuits being monitored
with no remotes
Cube
Cube
Cube
Cube
Cube
Cube
Cube
Cube
Cube
Cube
Cube
Cube
Cube
FIM
FIM
Rm Rm Rm Rm Rm Rm Rm
RmRm
Rm Rm
Rm
RmRmRm
Rm
Rm
Rm
Rm
Rm
Rm
Rm
RmRmRm
Rm
VirtuGrid Server &
User Interface

Portable VirtuGrid application for
efficiently eliminating MisGrids:
Provides portable remote devices that can be plugged
into low voltage secondary points at the customer
location and manually map the customer connection
to the substation.
Replaces field resources used to manually track
connectivity across the grid with a 5 minute test being
execute by a portable device at the customer location
being validated.
Correct connectivity information prevents false truck
roles during restoration and poor response to
customer outages that are not mapped to the correct
grid connectivity and location

Follow the Wire Processes do not Produce the Accuracy Required by Today’s Grid Apps
Typical Underground Topology Dense Network Topologies
“If it is such a smart grid why does it not know even where its customer are?” Utility Customer
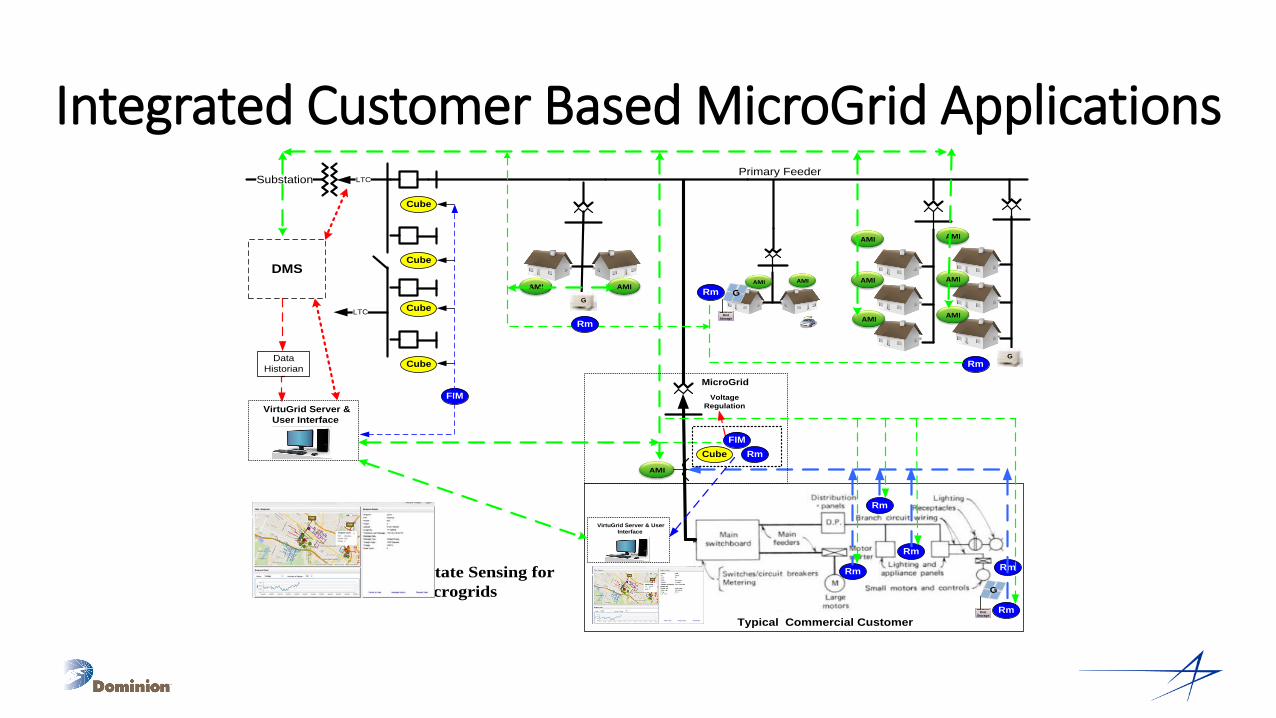
Integrated Customer Based MicroGrid ApplicationsSubstation LTC
M M
Primary Feeder
GG
M
M
M
M
M
M
GG
AMI AMI
AMI
AMI
AMI
AMI
AMI
AMIAMI
Rm
Rm
Rm
Rm
Typical Commercial Customer
Underground Circuit State Sensing for
Feeders and Microgrids
FIM
MicroGrid
VirtuGrid Server &
User Interface
Cube
Data
Historian
DMS
LTC
Cube
Cube
Cube
M M
G
Dist
Storage
AMI AMI
Rm
Rm
Rm
Voltage
Regulation
M
G
Dist
Storage
Rm
VirtuGrid Server & User
Interface
FIM
Cube Rm
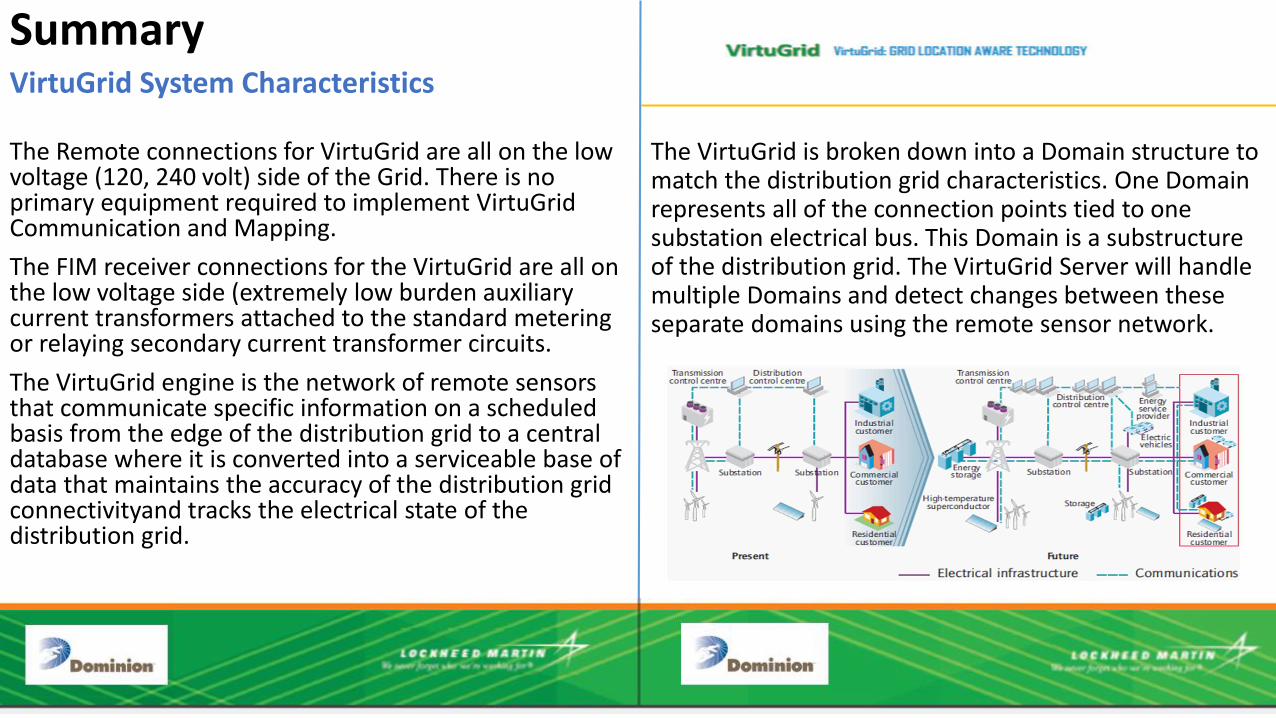
Summary VirtuGrid System Characteristics
The Remote connections for VirtuGrid are all on the low voltage (120, 240 volt) side of the Grid. There is no primary equipment required to implement VirtuGrid Communication and Mapping.
The FIM receiver connections for the VirtuGrid are all on the low voltage side (extremely low burden auxiliary current transformers attached to the standard metering or relaying secondary current transformer circuits.
The VirtuGrid engine is the network of remote sensors that communicate specific information on a scheduled basis from the edge of the distribution grid to a central database where it is converted into a serviceable base of data that maintains the accuracy of the distribution grid connectivityand tracks the electrical state of the distribution grid.
The VirtuGrid is broken down into a Domain structure to match the distribution grid characteristics. One Domain represents all of the connection points tied to one substation electrical bus. This Domain is a substructure of the distribution grid. The VirtuGrid Server will handle multiple Domains and detect changes between these separate domains using the remote sensor network.

19
Dominion Plug-In Electric Vehicle Update
March, 2015
APPENDIX

PHEV & EV SalesUS Totals
20http://electricdrive.org/ht/d/sp/i/20952/pid/20952

PHEV Growth / Charging InfrastructureUS Totals
21http://electricdrive.org/ht/d/sp/i/20952/pid/20952

PHEV Penetration
22
-
500
1,000
1,500
2,000
2,500
3,000
3,500
4,000 Registered Plug-in Electric Vehicles
Virginia
DVP Service Territory
PHEV Vehicles: DVP Service Territory
PHEV Vehicles: Virginia
Vehicle 2/16/2012 9/24/2012 4/15/2013 10/7/2013 5/29/2014 10/3/2014
BMW I3 32
Chevrolet Volt 112 217 315 561 664 776
Electric Bus 5 5
Electric Motorcycle 4 2
Fisker Karma 1 2 2 1 6
Ford Electric 3 13 31 45 64
Honda Electric 6 6 6 5 11
Miles Electric 5 5 5 7 14
Mitsubishi I Miev 3 7 18 19 14
Neighborhood Electric 218 217 203 228 284
Nissan Leaf 33 60 77 271 346 518
Other Electric 117 122 167 167 262
Tesla Electric 19 21 110 213 324 432
Toyota Prius Plug-In 67 165 223 252 384
Vantage Electric 9 9 11 11 23
Total Electric 164 727 1,048 1,711 2,078 2,827
Vehicle 2/16/2012 9/24/2012 4/15/2013 10/7/2013 5/29/2014 10/3/2014
BMW I3 34
Chevrolet Volt 194 438 664 838 1,006 1,086
Electric Bus 5 5
Electric Motorcycle 5 3
Fisker Karma 5 6 5 5 6
Ford Electric 10 27 43 62 71
Honda Electric 13 12 12 11 12
Miles Electric 8 8 8 13 14
Mitsubishi I Miev 5 22 27 25 24
Neighborhood Electric 330 330 307 336 360
Nissan Leaf 74 153 300 409 518 622
Other Electric 192 199 255 260 336
Smith EV Trucks 9 12 12 15 15
Tesla Electric 28 29 139 256 389 450
Toyota Prius Plug-In 102 263 320 399 465
Vantage Electric 28 28 29 29 28
Total Electric 296 1,322 2,010 2,521 3,078 3,531
Source: Virginia DMV

DVP Rate Participation
23
Participation
Description
Off Peak 20,873 5%
On Peak 49,195 12%
Super Off Peak 338,721 83%
Total 408,789
kWh
Charging Summary (Schedule EV)
15% of Registered PHEV’s are on a DVP EV Rate
Description Customers Available%
AvailableEV Control Group 35 35 0%
SCHEDULE 1EV - Whole House 351 750 53%
SCHEDULE EV - EV Only 107 750 86%

Charging SummaryPublic & Private
24
0.0
2.0
4.0
6.0
8.0
10.0
12.0
14.0
16.0
Oct
-13
No
v-1
3
Dec
-13
Jan
-14
Feb
-14
Mar
-14
Ap
r-1
4
May
-14
Jun
-14
Jul-
14
Au
g-1
4
Sep
-14
Oct
-14
No
v-1
4
Dec
-14
Jan
-15
Feb
-15
Mar
-15
PHEV Charging SummarySchedule EV & 3rd Party Stations
Avg kWh
Avg kW
11:10:00 PM7:50:00 PM4:30:00 PM1:10:00 PM9:50:00 AM6:30:00 AM3:10:00 AM11:50:00 PM
Commercial
Residential
Start_Time
Cu
sto
me
r_Ty
pe
Dotplot of Start_Time
Each symbol represents up to 358 observations.
0
10,000
20,000
30,000
40,000
50,000
60,000
70,000
80,000
90,000
kWh
Total PHEV Charging by HourSchedule EV
PHEV Charging By Customer Type

Public Charging StationsVirginia
25
EV-Network LocationsLevel 1
Outlets
Level 2
Outlets
DC Fast
Charing
Outlets
Other 86 89 134 3
Blink Network 6 10
ChargePoint Network 64 68 139
eVgo Network 9 3 5 7
Greenlots 5 10
SemaCharge Network 21 37
Shorepower 2 8
Tesla 5 2 25
Total 198 168 327 45

Recommendations
26
• Continue to monitor EV sales & penetration in VA
• Continue to monitor EV charging times and effects on grid